Embed Size (px)
Citation preview
ICT Sector Performance Review
for
INDIA§
Payal Malik†
Associate Professor of Economics, University of Delhi
§ This research was carried out with the aid of a grant from the International Development Research Center (Canada)and the Department for International Development (United Kingdom). The report is part of LIRNEasia’s SectorPerformance Review (SPR)/Telecom Regulatory Environment (TRE) research project. The 2008 and 2006 TREcountry reports are available at www.lirneasia.net.† Contact email: [email protected]. The author wishes to thank Ramrao Mundhe, for his untiring researchsupport and contribution in the collection and tabulation of data.
ICT Sector Performance Review for India – DRAFT VERSION NOT FOR CITATION
i
TABLE OF CONTENTS
1. Executive Summary .................................................................................................................1
2. Country overview and macro level perspectives on the telecom sector ..................................4
3. Market Structure and Market Dynamics..................................................................................6
4. Infrastructure: availability, usage and quality........................................................................16
5. Beyond telecom: E Applications, Services, Human Resources , Innovation ........................17
5.1 M-commerce ................................................................................................................. 175.2 M-Education ................................................................................................................. 205.3 M-Health ....................................................................................................................... 225.4 E-Governance/M-Governance ...................................................................................... 245.5 Human Resources and Innovation ................................................................................ 25
6. Institutions and the Policy & Regulatory Environment.........................................................26
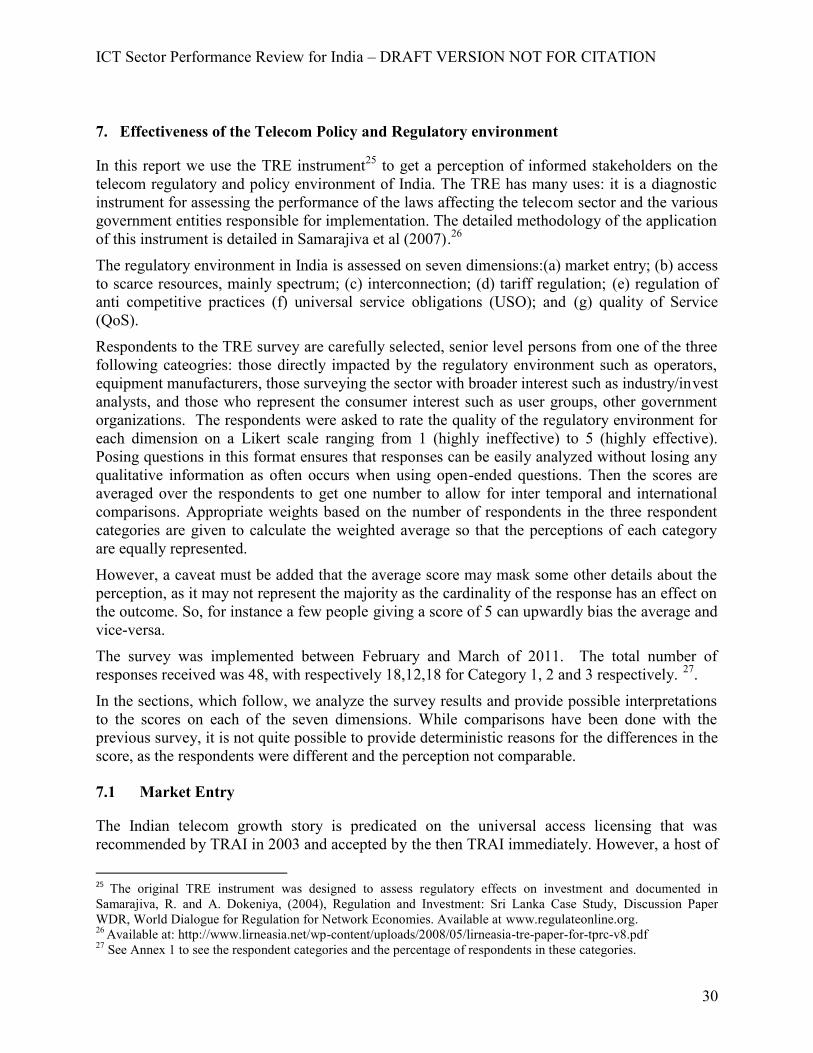
7. Effectiveness of the Telecom Policy and Regulatory environment .......................................30
7.1 Market Entry .................................................................................................................. 307.2 Access to Scarce Resources ........................................................................................... 327.3 Interconnection .............................................................................................................. 337.4 Tariff Regulation........................................................................................................... 347.5 Regulation of Anti-competitive practices ..................................................................... 357.6 Universal Service Obligations ...................................................................................... 367.7 Quality of Service (QoS) .............................................................................................. 40
8. Conclusions............................................................................................................................41
List of Tables
Table 1: India Country Profile ....................................................................................................... 4Table 2: EBITDA of three telecom operators in India ................................................................. 14Table 3: Financial Summary of the Indian Telecom Industry(in INR billion unless otherwisespecified)....................................................................................................................................... 15Table 4: State of Education in India ............................................................................................. 20Table 5: M-Education initiatives in India ..................................................................................... 21Table 6: M-health initiatives in India............................................................................................ 23Table 7: E-governance/M-governance some state wide initiatives .............................................. 24Table 8: Knowledge professionals directly employed in the Indian IT-BPO sector (in numbers)26Table 9: Regulatory structure of the Indian telecom sector .......................................................... 27Table 10: Important Policy and Regulatory milestones in Indian telecom sector ........................ 28Table 11: Status of USO funds in India ........................................................................................ 37
ICT Sector Performance Review for India – DRAFT VERSION NOT FOR CITATION
ii
List of Figures
Figure 1: Sector Assessment Results for the period January 2010- January 2011:Individual Score Chart - I............................................................................................................ 2Figure 2: Sector Assessment Results for the period January 2010- January 2011: IndividualScore Chart-II.................................................................................................................................. 2Figure 3: Sector Assessment Results for the period January 2010- January 2011: Total OutputScore Chart...................................................................................................................................... 3Figure 4: Fixed and mobile subscriber base (in million) ................................................................ 7Figure 5: Fixed and mobile teledensity........................................................................................... 7Figure 6: Top 10 operators' market shares - wireless service providers (GSM+CDMA) as of Sept30, 2010........................................................................................................................................... 8Figure 7: Market shares of fixed line operators as of Sept 2010 .................................................... 8Figure 8: Internet and broadband subscriber base .......................................................................... 9Figure 9: Broadband operator wise market shares as of Sept 2010 .............................................. 10Figure 10: Wireless Subscribers capable of accessing data services including Internet throughtheir mobile handsets .................................................................................................................... 11Figure 11: Access to internet ........................................................................................................ 11Figure 12: Trend in HHI in mobile sector across circles .............................................................. 12Figure 13: HHI for internet industry of India ............................................................................... 13Figure 14: AARPU/subscriber per month..................................................................................... 14Figure 15: Foreign direct investment in telecom in India ............................................................. 15Figure 16: Top five most popular mobile banking services, two months ending March 2009 .... 19Figure 17: TRE Score – Market Entry.......................................................................................... 31Figure 18: TRE Score – Access to Scarce Resources................................................................... 32Figure 19: TRE Score - Interconnection....................................................................................... 34Figure 20: TRE Score – Tariff Regulation ................................................................................... 35Figure 21: TRE Score – Anti-competitive Practices..................................................................... 36Figure 22: Operator wise percentage of rural subscribers in total subscriber base ...................... 38Figure 23: Growth of teledensity .................................................................................................. 39Figure 24: Analysis of TRE Score - USO..................................................................................... 39Figure 25: TRE scores – Quality of Service ................................................................................. 40
List of Abbreviations
ADC Access Deficit ChargeAGR Adjusted Gross RevenueARPU Average Revenue Per UserASSOCHAM The Associated Chambers of Commerce and Industry of IndiaBSOs Basic Service OperatorsBTS Base Transceivers StationsBSNL Bharat Sanchar Nigam LimitedBPO Business Process OutsourcingCBSE Central Boards of Secondary EducationCCI Competition Commission of India
ICT Sector Performance Review for India – DRAFT VERSION NOT FOR CITATION
iii
CMTS Cellular Mobile Telephone ServiceCPP Calling Party PaysDTS Department of Telecom ServicesDoT Department of TelecommunicationsDTEs Developing and Transitional EconomiesEBITDA Earning before Interest Tax and Depreciation allowanceEIL Ericsson India Ltd.FDI Foreign Direct InvestmentGDP Gross Domestic ProductGoT Group on TelecomHHI Herfindahl-Hirschman IndexICSE Indian Certificate for Secondary EducationICTs Information Communication TechnologiesIGNOU Indira Gandhi National Open UniversityIUC Interconnection Usage ChargesILD International Long DistanceIPLC International Private Leased CircuitsITIC Independent tower infrastructure companiesITU International Telecommunication UnionISPs Internet Service ProvidersIT Internet TelephonyITeS Information Technology enabled ServicesLLU Local Loop UnbundlingIVR interactive voice responseMILLEE Mobile and Immersive Learning for Literacy in Emerging EconomiesMTNL Mahanagar Telephone Nigam LimitedMHz Mega HertzNIXI National Internet Exchange of IndiaNLD National Long DistanceNSSO National Sample Survey OrganisationNTP National Telecom PolicyNLDOs National Long Distance OperatorsPSTN Public Switched Telephone NetworkQoS Quality of ServiceRBI Reserve Bank of IndiaRoCE Return on Capital EmployedTDSAT Telecom Dispute Settlement Appellate TribunalTRAI Telecom Regulatory Authority of IndiaTRE Telecom Regulatory EnvironmentUAS Unified Access ServiceUSL Universal Service LevyUSO Universal Service ObligationVSNL Videsh Sanchar Nigam LimitedWAS Wireless Application Protocol
ICT Sector Performance Review for India – DRAFT VERSION NOT FOR CITATION
1
1. Executive Summary
Telecommunication reforms in India saw very little privatisation and much more of marketliberalisation accompanied with the introduction of new laws and regulations. Regulatoryagencies and regulation have become integral components of the telecom reform process, inorder to protect consumers, reassure investors and, in theory, help advance competition. In acountry like India the role of the regulator is much beyond regulation of segments that arepotentially monopolistic but its performance should also be measured in terms of its ability tofoster competition. Studies have shown a close relationship between the nature of a regulatoryregime and the investment behavior of the firms subject to that regime. Changes in regulationhave often been followed by changes in investment behavior (Graeme Guthrie, 2006).1
The results of liberalisation have been impressive. Teledensity has increased from merely 2percent or so in 1999 to around 61 percent in 2010 and almost 8-10 million mobile subscribersare added every month. Wireless has been the principal engine for telecom growth in thecountry. The wireless subscriber base has grown from 0.88 million in1999 to 687.71 million in2010-11. Given that the mobile sector grew at the Compound Annual Growth Rate (CAGR) of84 .01 percent in the last decade, the telecom subscriber base has already outstripped what wasenvisaged for the 11th Plan ending in 2102.
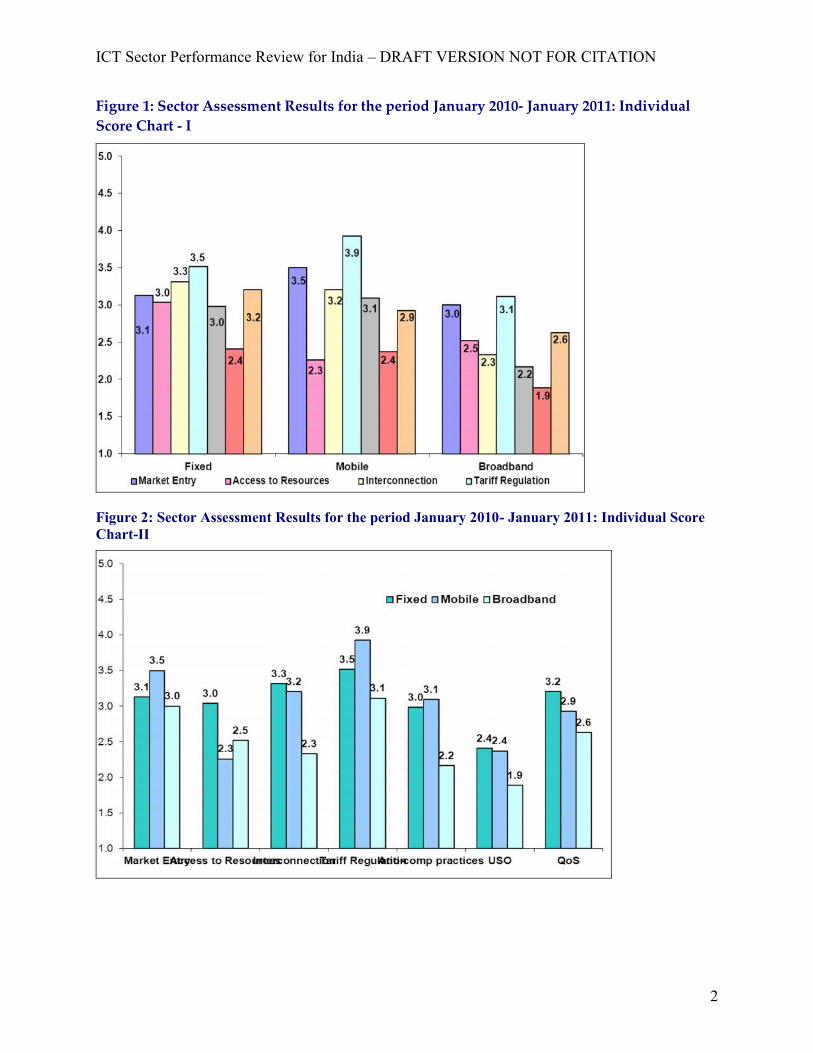
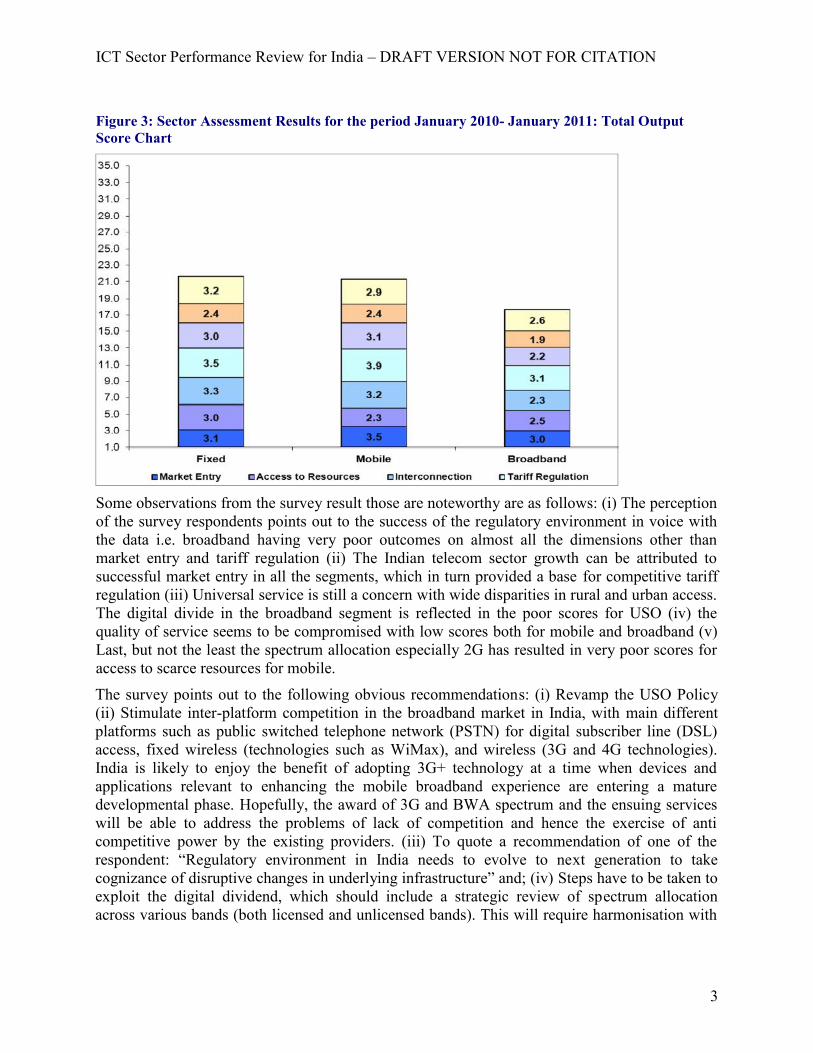
Given the importance of the Telecom Regulatory Environment (TRE) on the outcomes ofreforms, LIRNEasia has developed a TRE index, which summarizes stakeholders’ perception oncertain TRE dimensions. The index is created with the help of a survey of the key stakeholderswho are asked to evaluate the regulatory environment on a scale of 1 to 5, 1 being highlyineffective and 5 being highly effective. The first survey was conducted in July 2006 in fiveAsian countries, India, Sri Lanka, Pakistan, Thailand, and the Philippines on six dimensions: i)market entry; ii) access to scarce resources; iii) interconnection; iv) tariff regulation; v) anti-competitive practices; and vi) universal service obligation (USO), for the fixed and mobilesectors. In the last survey carried out in July 2008, a seventh dimension dealing with the “qualityof service” was added, and the survey was conducted for the broadband sector in addition tofixed and mobile sectors.
The following figures (fig.1, 2 and 3) summarize the sector assessment results for the mostrecent survey of 2010-2011 for India.
1 Graeme Guthrie (2006). Regulating Infrastructure: The Impact on Risk and Investment. Journal of EconomicLiterature, American Economic Association, Vol. 44(4), pages 925-972.
ICT Sector Performance Review for India – DRAFT VERSION NOT FOR CITATION
2
Figure 1: Sector Assessment Results for the period January 2010- January 2011: IndividualScore Chart - I
Figure 2: Sector Assessment Results for the period January 2010- January 2011: Individual ScoreChart-II
ICT Sector Performance Review for India – DRAFT VERSION NOT FOR CITATION
3
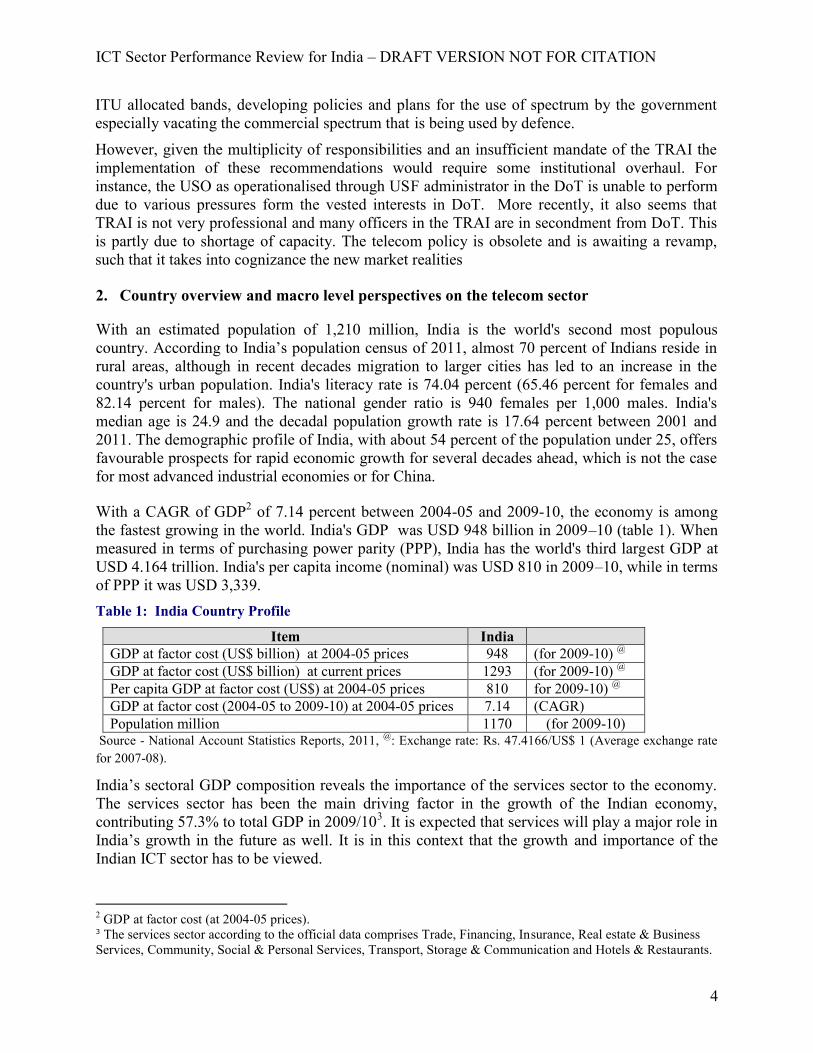
Figure 3: Sector Assessment Results for the period January 2010- January 2011: Total OutputScore Chart
Some observations from the survey result those are noteworthy are as follows: (i) The perceptionof the survey respondents points out to the success of the regulatory environment in voice withthe data i.e. broadband having very poor outcomes on almost all the dimensions other thanmarket entry and tariff regulation (ii) The Indian telecom sector growth can be attributed tosuccessful market entry in all the segments, which in turn provided a base for competitive tariffregulation (iii) Universal service is still a concern with wide disparities in rural and urban access.The digital divide in the broadband segment is reflected in the poor scores for USO (iv) thequality of service seems to be compromised with low scores both for mobile and broadband (v)Last, but not the least the spectrum allocation especially 2G has resulted in very poor scores foraccess to scarce resources for mobile.
The survey points out to the following obvious recommendations: (i) Revamp the USO Policy(ii) Stimulate inter-platform competition in the broadband market in India, with main differentplatforms such as public switched telephone network (PSTN) for digital subscriber line (DSL)access, fixed wireless (technologies such as WiMax), and wireless (3G and 4G technologies).India is likely to enjoy the benefit of adopting 3G+ technology at a time when devices andapplications relevant to enhancing the mobile broadband experience are entering a maturedevelopmental phase. Hopefully, the award of 3G and BWA spectrum and the ensuing serviceswill be able to address the problems of lack of competition and hence the exercise of anticompetitive power by the existing providers. (iii) To quote a recommendation of one of therespondent: “Regulatory environment in India needs to evolve to next generation to takecognizance of disruptive changes in underlying infrastructure” and; (iv) Steps have to be taken toexploit the digital dividend, which should include a strategic review of spectrum allocationacross various bands (both licensed and unlicensed bands). This will require harmonisation with
ICT Sector Performance Review for India – DRAFT VERSION NOT FOR CITATION
4
ITU allocated bands, developing policies and plans for the use of spectrum by the governmentespecially vacating the commercial spectrum that is being used by defence.
However, given the multiplicity of responsibilities and an insufficient mandate of the TRAI theimplementation of these recommendations would require some institutional overhaul. Forinstance, the USO as operationalised through USF administrator in the DoT is unable to performdue to various pressures form the vested interests in DoT. More recently, it also seems thatTRAI is not very professional and many officers in the TRAI are in secondment from DoT. Thisis partly due to shortage of capacity. The telecom policy is obsolete and is awaiting a revamp,such that it takes into cognizance the new market realities
2. Country overview and macro level perspectives on the telecom sector
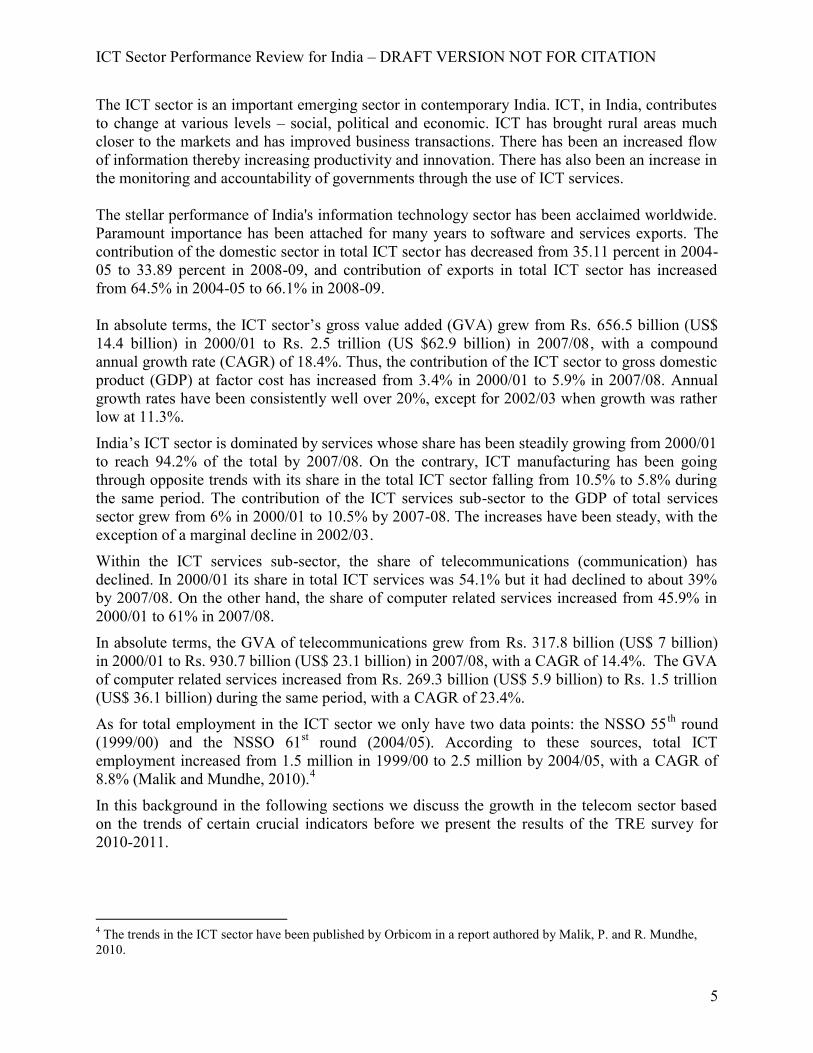
With an estimated population of 1,210 million, India is the world's second most populouscountry. According to India’s population census of 2011, almost 70 percent of Indians reside inrural areas, although in recent decades migration to larger cities has led to an increase in thecountry's urban population. India's literacy rate is 74.04 percent (65.46 percent for females and82.14 percent for males). The national gender ratio is 940 females per 1,000 males. India'smedian age is 24.9 and the decadal population growth rate is 17.64 percent between 2001 and2011. The demographic profile of India, with about 54 percent of the population under 25, offersfavourable prospects for rapid economic growth for several decades ahead, which is not the casefor most advanced industrial economies or for China.
With a CAGR of GDP2 of 7.14 percent between 2004-05 and 2009-10, the economy is amongthe fastest growing in the world. India's GDP was USD 948 billion in 2009–10 (table 1). Whenmeasured in terms of purchasing power parity (PPP), India has the world's third largest GDP atUSD 4.164 trillion. India's per capita income (nominal) was USD 810 in 2009–10, while in termsof PPP it was USD 3,339.Table 1: India Country Profile
Item IndiaGDP at factor cost (US$ billion) at 2004-05 prices 948 (for 2009-10) @
GDP at factor cost (US$ billion) at current prices 1293 (for 2009-10) @
Per capita GDP at factor cost (US$) at 2004-05 prices 810 for 2009-10) @
GDP at factor cost (2004-05 to 2009-10) at 2004-05 prices 7.14 (CAGR)Population million 1170 (for 2009-10)
Source - National Account Statistics Reports, 2011, @: Exchange rate: Rs. 47.4166/US$ 1 (Average exchange ratefor 2007-08).
India’s sectoral GDP composition reveals the importance of the services sector to the economy.The services sector has been the main driving factor in the growth of the Indian economy,contributing 57.3% to total GDP in 2009/103. It is expected that services will play a major role inIndia’s growth in the future as well. It is in this context that the growth and importance of theIndian ICT sector has to be viewed.
2 GDP at factor cost (at 2004-05 prices).3 The services sector according to the official data comprises Trade, Financing, Insurance, Real estate & BusinessServices, Community, Social & Personal Services, Transport, Storage & Communication and Hotels & Restaurants.
ICT Sector Performance Review for India – DRAFT VERSION NOT FOR CITATION
5
The ICT sector is an important emerging sector in contemporary India. ICT, in India, contributesto change at various levels – social, political and economic. ICT has brought rural areas muchcloser to the markets and has improved business transactions. There has been an increased flowof information thereby increasing productivity and innovation. There has also been an increase inthe monitoring and accountability of governments through the use of ICT services.
The stellar performance of India's information technology sector has been acclaimed worldwide.Paramount importance has been attached for many years to software and services exports. Thecontribution of the domestic sector in total ICT sector has decreased from 35.11 percent in 2004-05 to 33.89 percent in 2008-09, and contribution of exports in total ICT sector has increasedfrom 64.5% in 2004-05 to 66.1% in 2008-09.
In absolute terms, the ICT sector’s gross value added (GVA) grew from Rs. 656.5 billion (US$14.4 billion) in 2000/01 to Rs. 2.5 trillion (US $62.9 billion) in 2007/08, with a compoundannual growth rate (CAGR) of 18.4%. Thus, the contribution of the ICT sector to gross domesticproduct (GDP) at factor cost has increased from 3.4% in 2000/01 to 5.9% in 2007/08. Annualgrowth rates have been consistently well over 20%, except for 2002/03 when growth was ratherlow at 11.3%.
India’s ICT sector is dominated by services whose share has been steadily growing from 2000/01to reach 94.2% of the total by 2007/08. On the contrary, ICT manufacturing has been goingthrough opposite trends with its share in the total ICT sector falling from 10.5% to 5.8% duringthe same period. The contribution of the ICT services sub-sector to the GDP of total servicessector grew from 6% in 2000/01 to 10.5% by 2007-08. The increases have been steady, with theexception of a marginal decline in 2002/03.
Within the ICT services sub-sector, the share of telecommunications (communication) hasdeclined. In 2000/01 its share in total ICT services was 54.1% but it had declined to about 39%by 2007/08. On the other hand, the share of computer related services increased from 45.9% in2000/01 to 61% in 2007/08.
In absolute terms, the GVA of telecommunications grew from Rs. 317.8 billion (US$ 7 billion)in 2000/01 to Rs. 930.7 billion (US$ 23.1 billion) in 2007/08, with a CAGR of 14.4%. The GVAof computer related services increased from Rs. 269.3 billion (US$ 5.9 billion) to Rs. 1.5 trillion(US$ 36.1 billion) during the same period, with a CAGR of 23.4%.
As for total employment in the ICT sector we only have two data points: the NSSO 55 th round(1999/00) and the NSSO 61st round (2004/05). According to these sources, total ICTemployment increased from 1.5 million in 1999/00 to 2.5 million by 2004/05, with a CAGR of8.8% (Malik and Mundhe, 2010).4
In this background in the following sections we discuss the growth in the telecom sector basedon the trends of certain crucial indicators before we present the results of the TRE survey for2010-2011.
4 The trends in the ICT sector have been published by Orbicom in a report authored by Malik, P. and R. Mundhe,2010.
ICT Sector Performance Review for India – DRAFT VERSION NOT FOR CITATION
6
3. Market Structure and Market DynamicsMalik (2007, 2010)5 has documented the policy and regulatory developments that have shapedthe outcomes of the Indian telecommunications industry. The liberalization initiatives datingback to 1994 initiatives were successful in shifting the industry from a static, monopolisticindustry that provides a single product, telephone service to a dynamic, multi-product, multi-operator industry. It should be noted, however, that this change in market structure has takenplace without the privatisation of the domestic incumbent service provider BSNL and MTNL.The privatisation of the overseas carrier Videsh Sanchar Nigam Limited (VSNL) in April 2002,with the strategic sale of a stake of 45% to Tatas and the government and employees retaining astake of 26.13% and 1.97% respectively, represents the first and only instance of the governmenttransferring control of a telecom undertaking to the private sector.
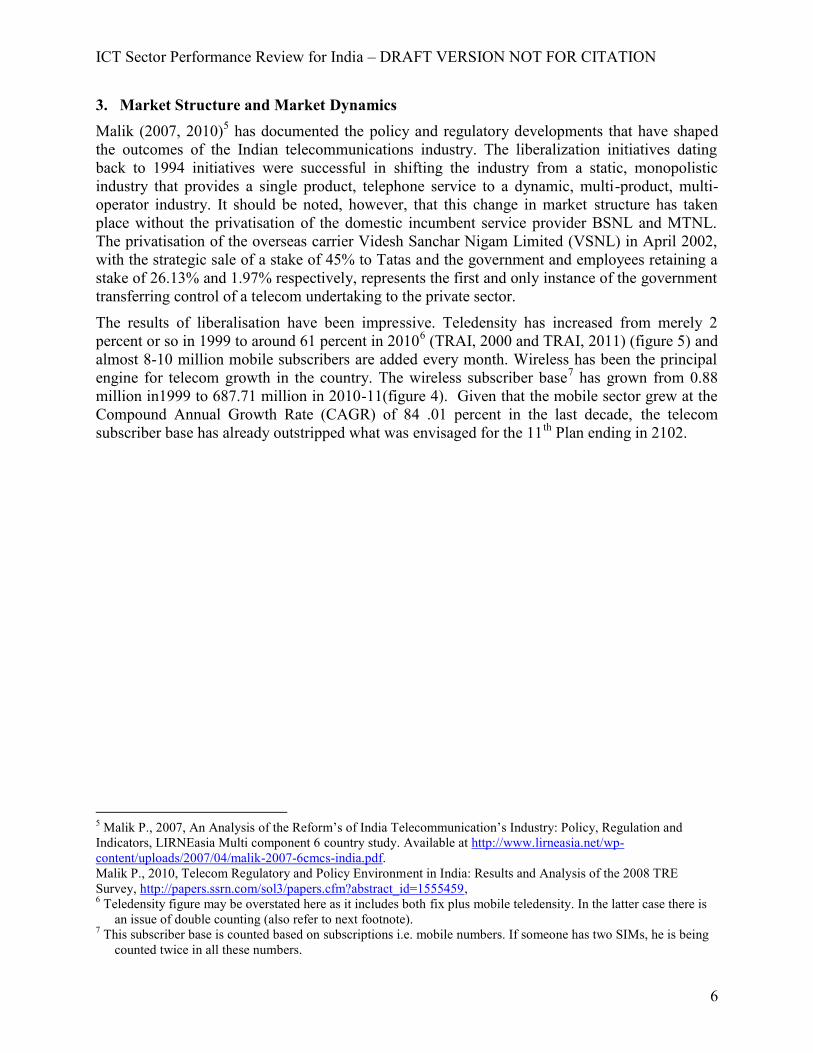
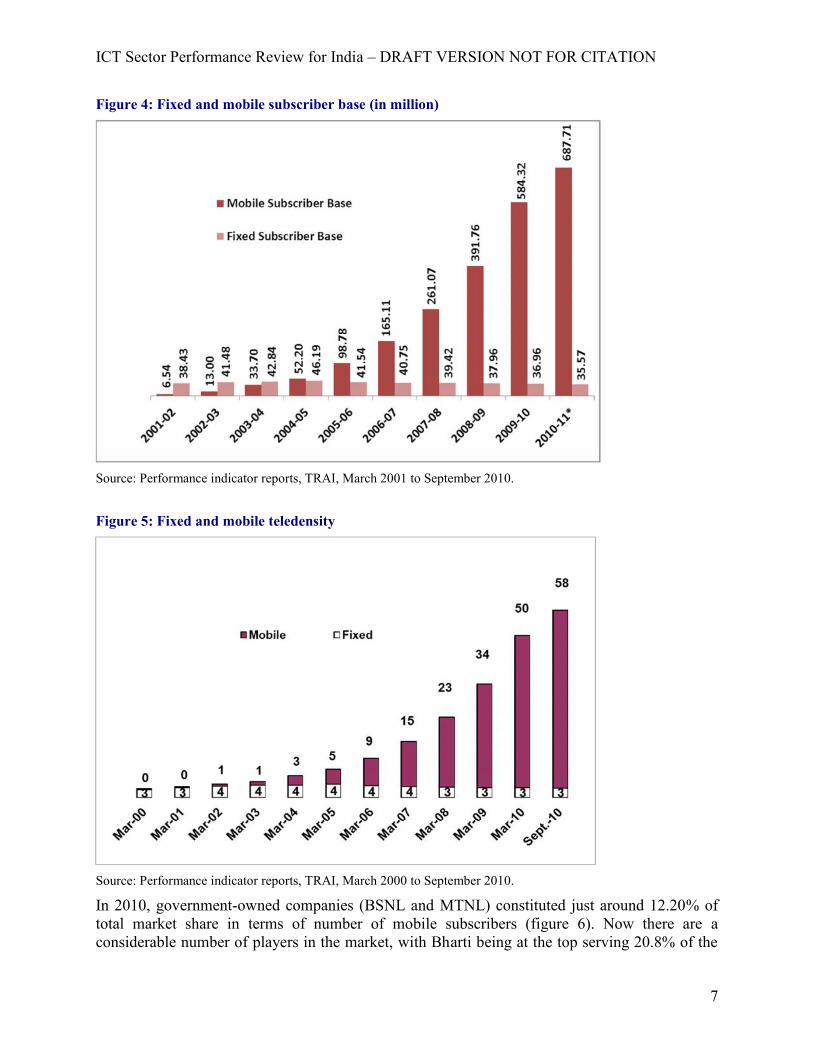
The results of liberalisation have been impressive. Teledensity has increased from merely 2percent or so in 1999 to around 61 percent in 20106 (TRAI, 2000 and TRAI, 2011) (figure 5) andalmost 8-10 million mobile subscribers are added every month. Wireless has been the principalengine for telecom growth in the country. The wireless subscriber base7 has grown from 0.88million in1999 to 687.71 million in 2010-11(figure 4). Given that the mobile sector grew at theCompound Annual Growth Rate (CAGR) of 84 .01 percent in the last decade, the telecomsubscriber base has already outstripped what was envisaged for the 11th Plan ending in 2102.
5 Malik P., 2007, An Analysis of the Reform’s of India Telecommunication’s Industry: Policy, Regulation andIndicators, LIRNEasia Multi component 6 country study. Available at http://www.lirneasia.net/wp-content/uploads/2007/04/malik-2007-6cmcs-india.pdf.Malik P., 2010, Telecom Regulatory and Policy Environment in India: Results and Analysis of the 2008 TRESurvey, http://papers.ssrn.com/sol3/papers.cfm?abstract_id=1555459,6 Teledensity figure may be overstated here as it includes both fix plus mobile teledensity. In the latter case there is
an issue of double counting (also refer to next footnote).7 This subscriber base is counted based on subscriptions i.e. mobile numbers. If someone has two SIMs, he is being
counted twice in all these numbers.
ICT Sector Performance Review for India – DRAFT VERSION NOT FOR CITATION
7
Figure 4: Fixed and mobile subscriber base (in million)
Source: Performance indicator reports, TRAI, March 2001 to September 2010.
Figure 5: Fixed and mobile teledensity
Source: Performance indicator reports, TRAI, March 2000 to September 2010.
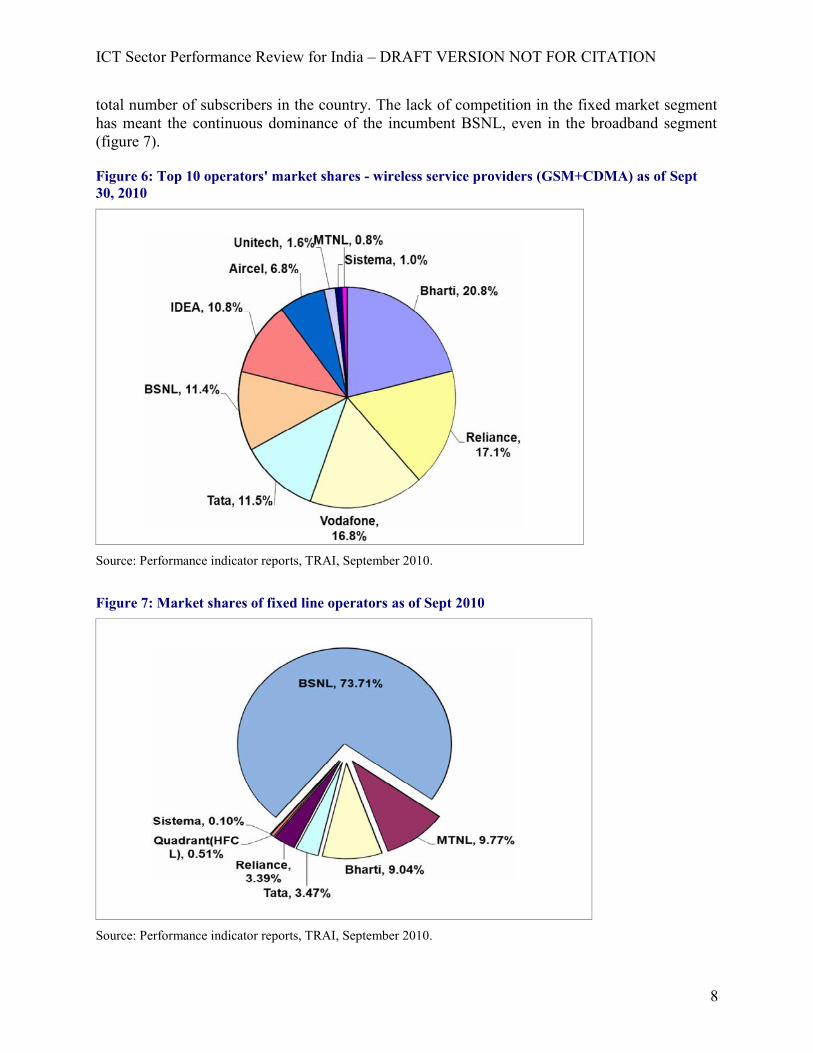
In 2010, government-owned companies (BSNL and MTNL) constituted just around 12.20% oftotal market share in terms of number of mobile subscribers (figure 6). Now there are aconsiderable number of players in the market, with Bharti being at the top serving 20.8% of the
ICT Sector Performance Review for India – DRAFT VERSION NOT FOR CITATION
8
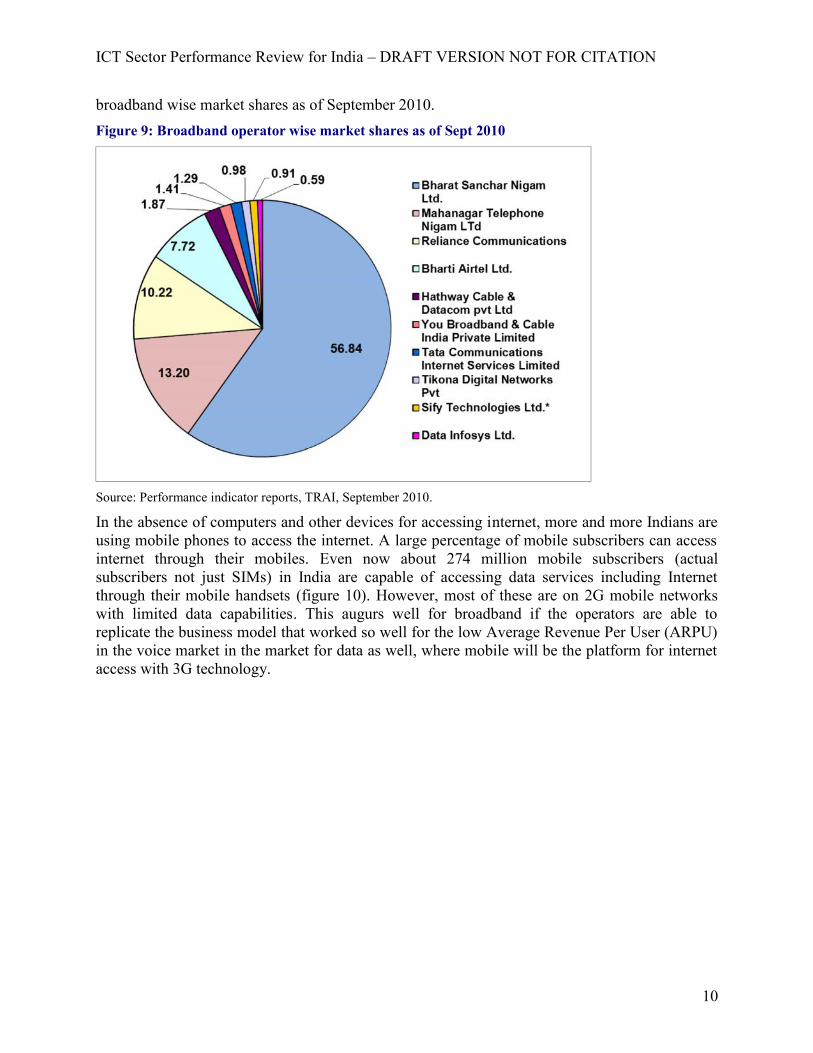
total number of subscribers in the country. The lack of competition in the fixed market segmenthas meant the continuous dominance of the incumbent BSNL, even in the broadband segment(figure 7).
Figure 6: Top 10 operators' market shares - wireless service providers (GSM+CDMA) as of Sept30, 2010
Source: Performance indicator reports, TRAI, September 2010.
Figure 7: Market shares of fixed line operators as of Sept 2010
Source: Performance indicator reports, TRAI, September 2010.
ICT Sector Performance Review for India – DRAFT VERSION NOT FOR CITATION
9
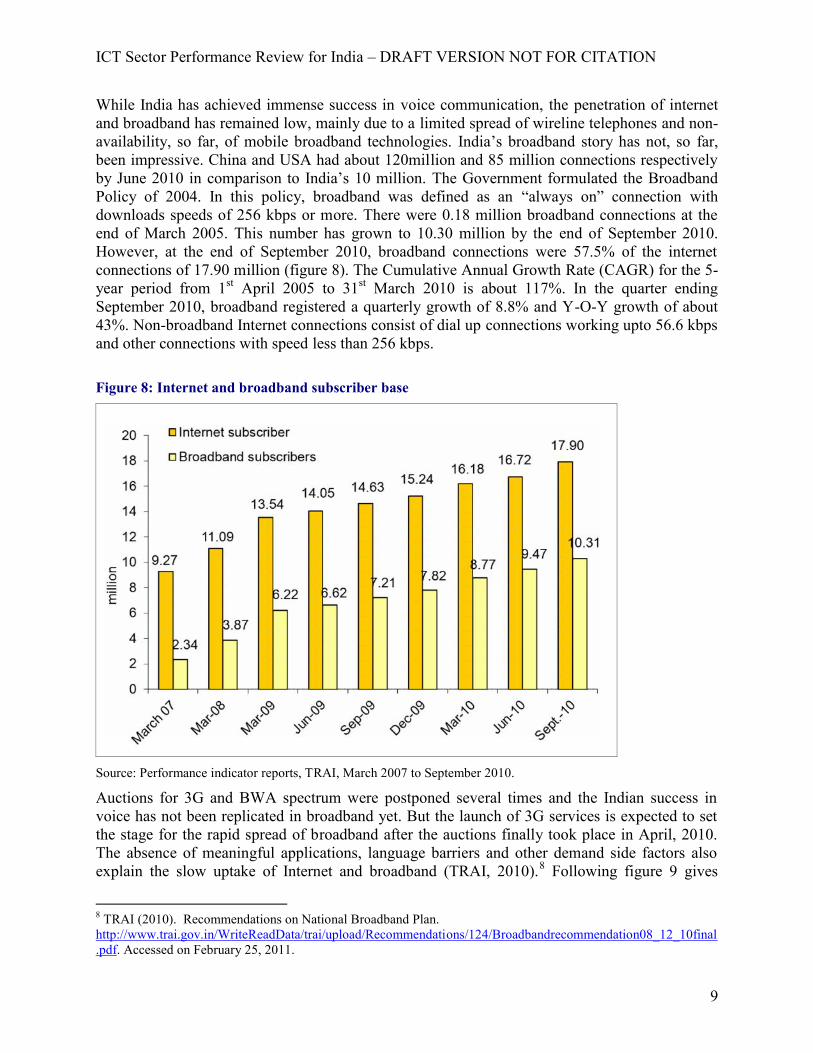
While India has achieved immense success in voice communication, the penetration of internetand broadband has remained low, mainly due to a limited spread of wireline telephones and non-availability, so far, of mobile broadband technologies. India’s broadband story has not, so far,been impressive. China and USA had about 120million and 85 million connections respectivelyby June 2010 in comparison to India’s 10 million. The Government formulated the BroadbandPolicy of 2004. In this policy, broadband was defined as an “always on” connection withdownloads speeds of 256 kbps or more. There were 0.18 million broadband connections at theend of March 2005. This number has grown to 10.30 million by the end of September 2010.However, at the end of September 2010, broadband connections were 57.5% of the internetconnections of 17.90 million (figure 8). The Cumulative Annual Growth Rate (CAGR) for the 5-year period from 1st April 2005 to 31st March 2010 is about 117%. In the quarter endingSeptember 2010, broadband registered a quarterly growth of 8.8% and Y-O-Y growth of about43%. Non-broadband Internet connections consist of dial up connections working upto 56.6 kbpsand other connections with speed less than 256 kbps.
Figure 8: Internet and broadband subscriber base
Source: Performance indicator reports, TRAI, March 2007 to September 2010.
Auctions for 3G and BWA spectrum were postponed several times and the Indian success invoice has not been replicated in broadband yet. But the launch of 3G services is expected to setthe stage for the rapid spread of broadband after the auctions finally took place in April, 2010.The absence of meaningful applications, language barriers and other demand side factors alsoexplain the slow uptake of Internet and broadband (TRAI, 2010).8 Following figure 9 gives
8 TRAI (2010). Recommendations on National Broadband Plan.http://www.trai.gov.in/WriteReadData/trai/upload/Recommendations/124/Broadbandrecommendation08_12_10final.pdf. Accessed on February 25, 2011.
ICT Sector Performance Review for India – DRAFT VERSION NOT FOR CITATION
10
broadband wise market shares as of September 2010.Figure 9: Broadband operator wise market shares as of Sept 2010
Source: Performance indicator reports, TRAI, September 2010.
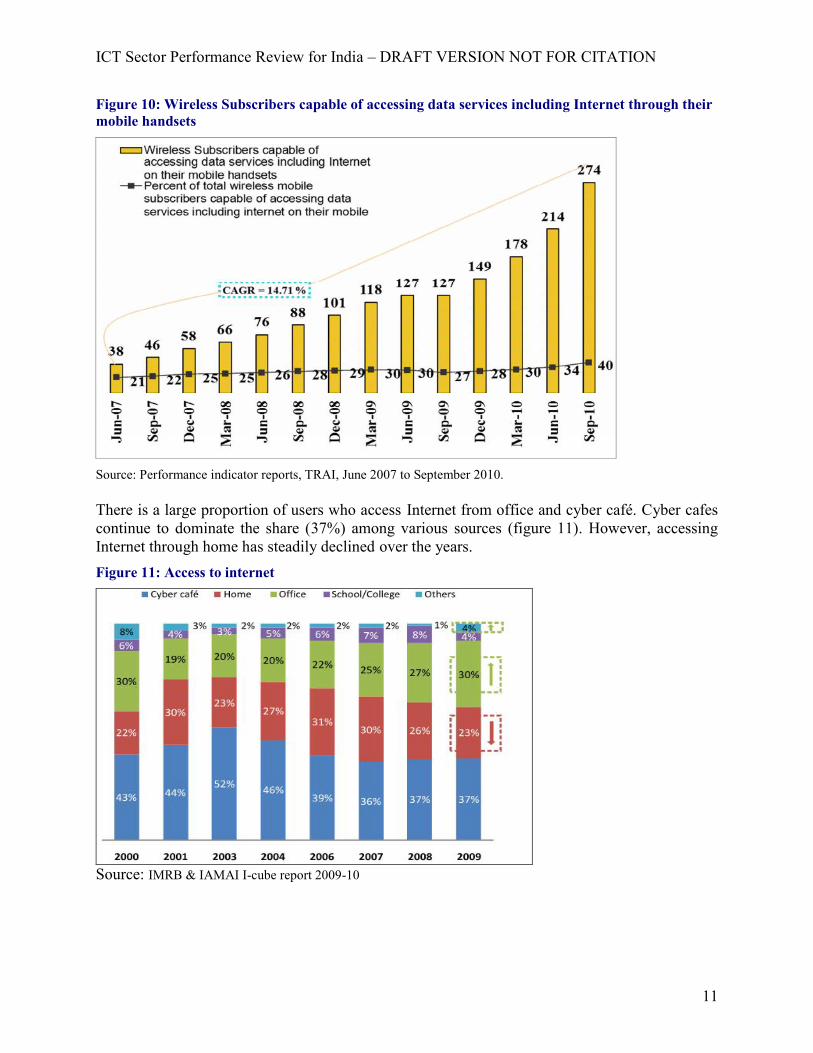
In the absence of computers and other devices for accessing internet, more and more Indians areusing mobile phones to access the internet. A large percentage of mobile subscribers can accessinternet through their mobiles. Even now about 274 million mobile subscribers (actualsubscribers not just SIMs) in India are capable of accessing data services including Internetthrough their mobile handsets (figure 10). However, most of these are on 2G mobile networkswith limited data capabilities. This augurs well for broadband if the operators are able toreplicate the business model that worked so well for the low Average Revenue Per User (ARPU)in the voice market in the market for data as well, where mobile will be the platform for internetaccess with 3G technology.
ICT Sector Performance Review for India – DRAFT VERSION NOT FOR CITATION
11
Figure 10: Wireless Subscribers capable of accessing data services including Internet through theirmobile handsets
Source: Performance indicator reports, TRAI, June 2007 to September 2010.
There is a large proportion of users who access Internet from office and cyber café. Cyber cafescontinue to dominate the share (37%) among various sources (figure 11). However, accessingInternet through home has steadily declined over the years.Figure 11: Access to internet
Source: IMRB & IAMAI I-cube report 2009-10
ICT Sector Performance Review for India – DRAFT VERSION NOT FOR CITATION
12
Level of Competition
Competition allows for a range of price and quality options, making service possible to regionsand income levels that a monopoly provider would never have considered. In fact one salientreason for opening up the sector for privatisation has been the realisation of scarcity of theincumbent's funds and the consequent pent-up or unmet demand that was met by the newentrants. Competition allowed for aggressive pricing, increase in access as documented earlier inthis report. In fact in the mobile sector with 8-9 operators in every circle it is argued that theremay be “too much” of competition.
This, as will be argued later was due to mindless market entry without making the entrants paythe true value for the spectrum. The industry is in fact ripe for some consolidation and arelaxation in the merger and acquisition norms as proposed in the NTP-2011 can achieve that.On the other hand, due to the low level of competition in the fixed sector and cable technologynot posing a serious challenge for internet access (as the cable industry in India is highlyunorganised and fragmented), the competition in the data segment has been not very promising.
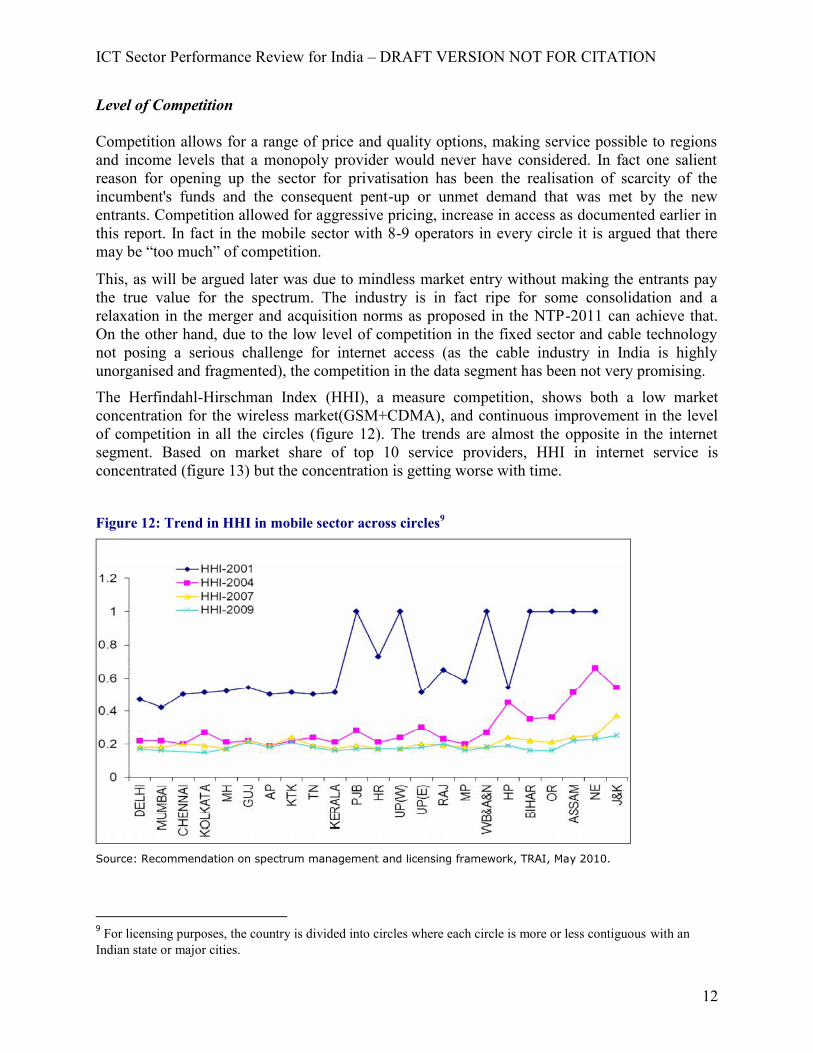
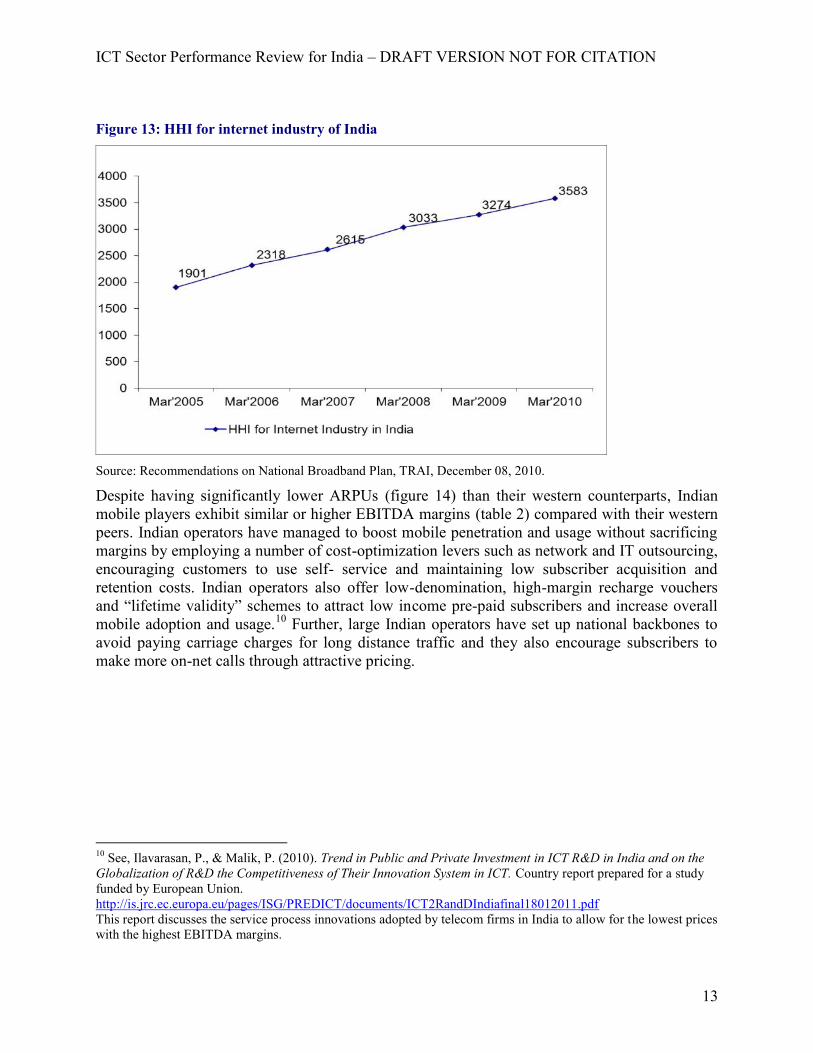
The Herfindahl-Hirschman Index (HHI), a measure competition, shows both a low marketconcentration for the wireless market(GSM+CDMA), and continuous improvement in the levelof competition in all the circles (figure 12). The trends are almost the opposite in the internetsegment. Based on market share of top 10 service providers, HHI in internet service isconcentrated (figure 13) but the concentration is getting worse with time.
Figure 12: Trend in HHI in mobile sector across circles9
Source: Recommendation on spectrum management and licensing framework, TRAI, May 2010.
9 For licensing purposes, the country is divided into circles where each circle is more or less contiguous with anIndian state or major cities.
ICT Sector Performance Review for India – DRAFT VERSION NOT FOR CITATION
13
Figure 13: HHI for internet industry of India
Source: Recommendations on National Broadband Plan, TRAI, December 08, 2010.
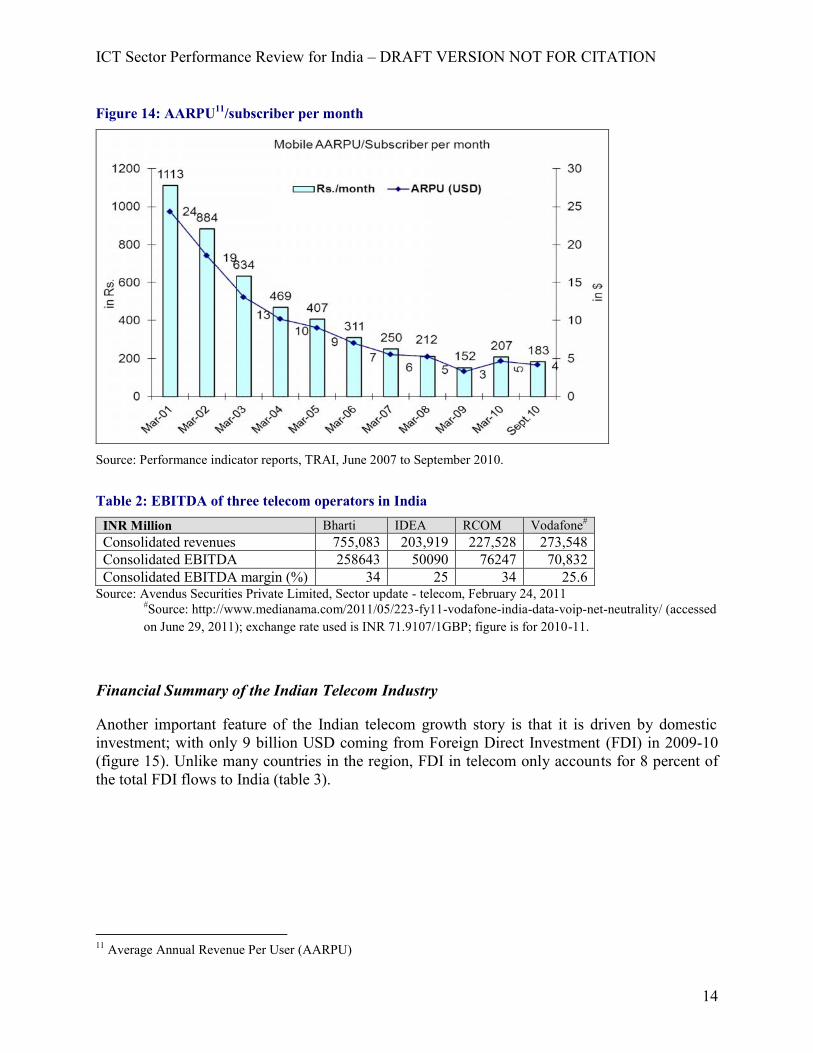
Despite having significantly lower ARPUs (figure 14) than their western counterparts, Indianmobile players exhibit similar or higher EBITDA margins (table 2) compared with their westernpeers. Indian operators have managed to boost mobile penetration and usage without sacrificingmargins by employing a number of cost-optimization levers such as network and IT outsourcing,encouraging customers to use self- service and maintaining low subscriber acquisition andretention costs. Indian operators also offer low-denomination, high-margin recharge vouchersand “lifetime validity” schemes to attract low income pre-paid subscribers and increase overallmobile adoption and usage.10 Further, large Indian operators have set up national backbones toavoid paying carriage charges for long distance traffic and they also encourage subscribers tomake more on-net calls through attractive pricing.
10 See, Ilavarasan, P., & Malik, P. (2010). Trend in Public and Private Investment in ICT R&D in India and on theGlobalization of R&D the Competitiveness of Their Innovation System in ICT. Country report prepared for a studyfunded by European Union.http://is.jrc.ec.europa.eu/pages/ISG/PREDICT/documents/ICT2RandDIndiafinal18012011.pdfThis report discusses the service process innovations adopted by telecom firms in India to allow for the lowest priceswith the highest EBITDA margins.
ICT Sector Performance Review for India – DRAFT VERSION NOT FOR CITATION
14
Figure 14: AARPU11/subscriber per month
Source: Performance indicator reports, TRAI, June 2007 to September 2010.
Table 2: EBITDA of three telecom operators in IndiaINR Million Bharti IDEA RCOM Vodafone#
Consolidated revenues 755,083 203,919 227,528 273,548Consolidated EBITDA 258643 50090 76247 70,832Consolidated EBITDA margin (%) 34 25 34 25.6
Source: Avendus Securities Private Limited, Sector update - telecom, February 24, 2011#Source: http://www.medianama.com/2011/05/223-fy11-vodafone-india-data-voip-net-neutrality/ (accessedon June 29, 2011); exchange rate used is INR 71.9107/1GBP; figure is for 2010-11.
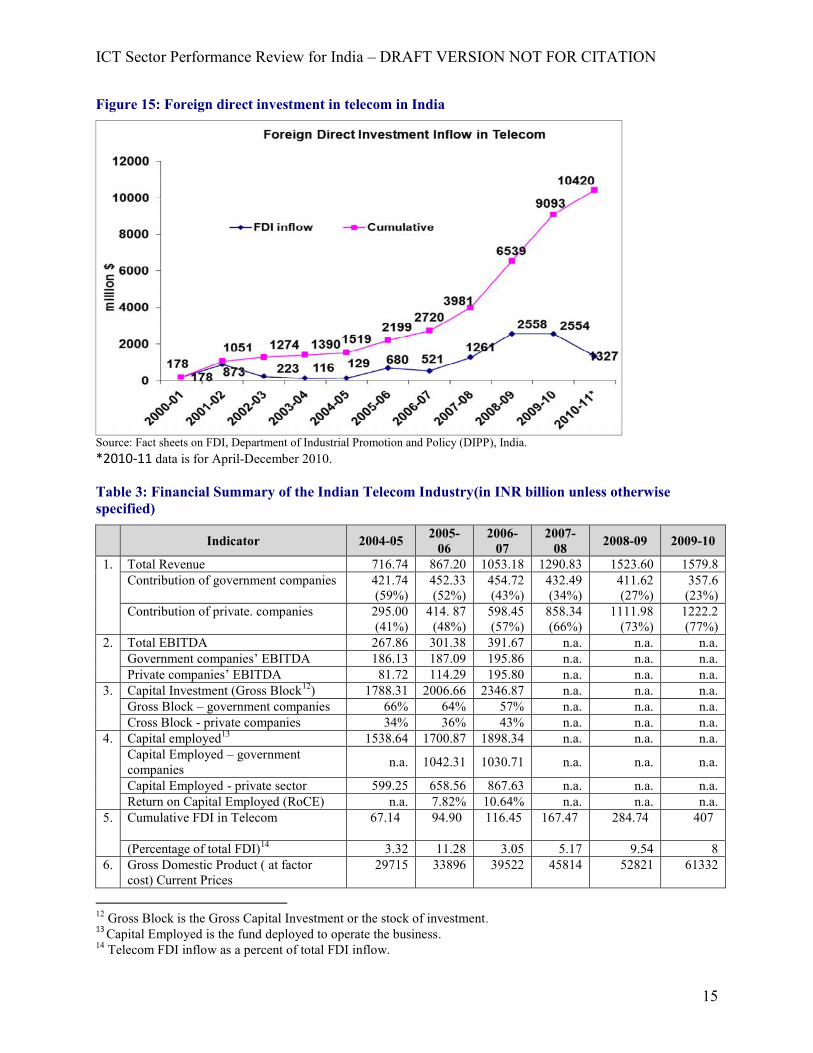
Financial Summary of the Indian Telecom Industry
Another important feature of the Indian telecom growth story is that it is driven by domesticinvestment; with only 9 billion USD coming from Foreign Direct Investment (FDI) in 2009-10(figure 15). Unlike many countries in the region, FDI in telecom only accounts for 8 percent ofthe total FDI flows to India (table 3).
11 Average Annual Revenue Per User (AARPU)
ICT Sector Performance Review for India – DRAFT VERSION NOT FOR CITATION
15
Figure 15: Foreign direct investment in telecom in India
Source: Fact sheets on FDI, Department of Industrial Promotion and Policy (DIPP), India.*2010-11 data is for April-December 2010.
Table 3: Financial Summary of the Indian Telecom Industry(in INR billion unless otherwisespecified)
Indicator 2004-05 2005-06
2006-07
2007-08 2008-09 2009-10
1. Total Revenue 716.74 867.20 1053.18 1290.83 1523.60 1579.8Contribution of government companies 421.74
(59%)452.33(52%)
454.72(43%)
432.49(34%)
411.62(27%)
357.6(23%)
Contribution of private. companies 295.00(41%)
414. 87(48%)
598.45(57%)
858.34(66%)
1111.98(73%)
1222.2(77%)
2. Total EBITDA 267.86 301.38 391.67 n.a. n.a. n.a.Government companies’ EBITDA 186.13 187.09 195.86 n.a. n.a. n.a.Private companies’ EBITDA 81.72 114.29 195.80 n.a. n.a. n.a.
3. Capital Investment (Gross Block12) 1788.31 2006.66 2346.87 n.a. n.a. n.a.Gross Block – government companies 66% 64% 57% n.a. n.a. n.a.Cross Block - private companies 34% 36% 43% n.a. n.a. n.a.
4. Capital employed13 1538.64 1700.87 1898.34 n.a. n.a. n.a.Capital Employed – governmentcompanies n.a. 1042.31 1030.71 n.a. n.a. n.a.
Capital Employed - private sector 599.25 658.56 867.63 n.a. n.a. n.a.Return on Capital Employed (RoCE) n.a. 7.82% 10.64% n.a. n.a. n.a.
5. Cumulative FDI in Telecom 67.14 94.90 116.45 167.47 284.74 407
(Percentage of total FDI)14 3.32 11.28 3.05 5.17 9.54 86. Gross Domestic Product ( at factor
cost) Current Prices29715 33896 39522 45814 52821 61332
12 Gross Block is the Gross Capital Investment or the stock of investment.13 Capital Employed is the fund deployed to operate the business.14 Telecom FDI inflow as a percent of total FDI inflow.
ICT Sector Performance Review for India – DRAFT VERSION NOT FOR CITATION
16
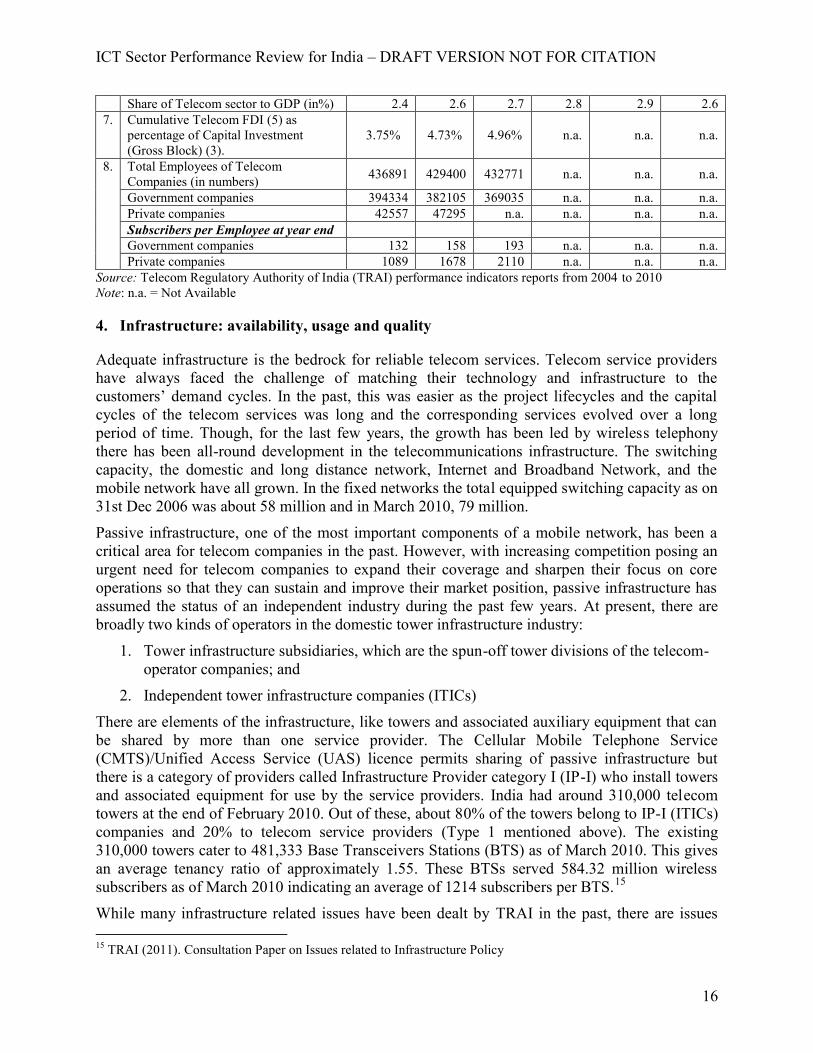
Share of Telecom sector to GDP (in%) 2.4 2.6 2.7 2.8 2.9 2.67. Cumulative Telecom FDI (5) as
percentage of Capital Investment(Gross Block) (3).
3.75% 4.73% 4.96% n.a. n.a. n.a.
8. Total Employees of TelecomCompanies (in numbers) 436891 429400 432771 n.a. n.a. n.a.
Government companies 394334 382105 369035 n.a. n.a. n.a.Private companies 42557 47295 n.a. n.a. n.a. n.a.Subscribers per Employee at year endGovernment companies 132 158 193 n.a. n.a. n.a.Private companies 1089 1678 2110 n.a. n.a. n.a.
Source: Telecom Regulatory Authority of India (TRAI) performance indicators reports from 2004 to 2010Note: n.a. = Not Available
4. Infrastructure: availability, usage and quality
Adequate infrastructure is the bedrock for reliable telecom services. Telecom service providershave always faced the challenge of matching their technology and infrastructure to thecustomers’ demand cycles. In the past, this was easier as the project lifecycles and the capitalcycles of the telecom services was long and the corresponding services evolved over a longperiod of time. Though, for the last few years, the growth has been led by wireless telephonythere has been all-round development in the telecommunications infrastructure. The switchingcapacity, the domestic and long distance network, Internet and Broadband Network, and themobile network have all grown. In the fixed networks the total equipped switching capacity as on31st Dec 2006 was about 58 million and in March 2010, 79 million.
Passive infrastructure, one of the most important components of a mobile network, has been acritical area for telecom companies in the past. However, with increasing competition posing anurgent need for telecom companies to expand their coverage and sharpen their focus on coreoperations so that they can sustain and improve their market position, passive infrastructure hasassumed the status of an independent industry during the past few years. At present, there arebroadly two kinds of operators in the domestic tower infrastructure industry:
1. Tower infrastructure subsidiaries, which are the spun-off tower divisions of the telecom-operator companies; and
2. Independent tower infrastructure companies (ITICs)
There are elements of the infrastructure, like towers and associated auxiliary equipment that canbe shared by more than one service provider. The Cellular Mobile Telephone Service(CMTS)/Unified Access Service (UAS) licence permits sharing of passive infrastructure butthere is a category of providers called Infrastructure Provider category I (IP-I) who install towersand associated equipment for use by the service providers. India had around 310,000 telecomtowers at the end of February 2010. Out of these, about 80% of the towers belong to IP-I (ITICs)companies and 20% to telecom service providers (Type 1 mentioned above). The existing310,000 towers cater to 481,333 Base Transceivers Stations (BTS) as of March 2010. This givesan average tenancy ratio of approximately 1.55. These BTSs served 584.32 million wirelesssubscribers as of March 2010 indicating an average of 1214 subscribers per BTS.15
While many infrastructure related issues have been dealt by TRAI in the past, there are issues
15 TRAI (2011). Consultation Paper on Issues related to Infrastructure Policy
ICT Sector Performance Review for India – DRAFT VERSION NOT FOR CITATION
17
related to design, standardisation, aesthetics, pollution, safety and sharing of telecom towerinfrastructure that remain to be addressed. A robust fibre based broadband infrastructure forproliferation of broadband related services in urban and rural areas is very important and iscurrently inadequate. The National Broadband Plan envisages provision of 75 million broadbandconnections (17 million DSL, 30 Million cable and 28 million wireless broadband) by the year2012 and 160 million broadband connections (22 million DSL, 78 million cable and 60 millionwireless broadband) by the year 2014. The plan involves setting up of an open access fibre opticnetwork connecting all Gram Panchayats by the year 2012 and all habitations with population of500 and above by the year 2013.
A Submarine Cable Landing Station has been a `bottleneck facility'. TRAI;s regulatoryphilosophy in this regard has been the recognition that competition in IPLC segment could beenhanced if ILD licensees entering the market have adequate access to necessary facilities atcable landing stations. To ensure this access, the interconnection regulations should provide fordominant suppliers who control or who are responsible for the operation of the cable landingstation to allow other licensees to (a) have access to the cable landing stations; (b) physically co-locate their own equipment necessary for connection in the cable landing stations; (c)interconnect at the cable landing station to any operator’s equipment in the cable landing stationat any technically feasible point; and (d) access backhaul circuits of all types in a timely fashion,under terms & conditions and rates that are cost oriented, transparent, and non-discriminatory.However, the implementation of the regulations has been weak.
The BTSs installed on the towers are required to be connected to the rest of the mobile networkthrough some kind of a telecom link called backhaul. Presently point to point microwave linksare used for this purpose. Considering the ever increasing voice traffic and also possibility ofhigher data traffic, optical fibre seems to be more suitable for backhaul. The procedure for grantof ROW for laying optical fibre cable is presently complicated, time consuming and expensive.Both connectivity through towers and through tower-less solutions require that these proceduresare simplified. National broadband plan recommendations given by TRAI in August 2010 haveproposed extensive fibre optic network in the access and backhaul networks. Once this fibre is inplace providing backhaul connectivity for the BTSs of multiple service providers would bepossible on this fibre. It is not very clear what will happen to the existing optical fibre of theincumbent ( most of it being dark and unlit)
5. Beyond telecom: E Applications, Services, Human Resources , Innovation
5.1 M-commerceSince mobile penetration is high in India, mobile commerce (m-commerce) is considered to be anext big thing. However, m-commerce is still at its nascent stage in India.
Mostly current m-commerce models adopted in India require linking of banking instrumentssuch as bank account, credit card and debit card to mobile through mobile enabled applications.Some of the players who have adopted this model in India are Eko, Paymate, M-check, Obopay,etc.
ICT Sector Performance Review for India – DRAFT VERSION NOT FOR CITATION
18
Security point of view, this model of linking banking instruments to mobile and paying through awireless application protocol (WAP) mobile phone is important step forward. SMS medium forvarious merchant services is available, though still such services have not reached a critical stagedue to lot of factors like non-tie up with all the banks or people still not comfortable sharingcredit/debit card account information etc. Moreover, Know Your Customer (KYC) RBIguidelines make it mandatory to identify customers, which are as stringent as required to open asaving account and get a debit card (Business India, 200916).
The fact is India has so far followed bank-led m-commerce model. However, Telecomcompanies with their access and reach are in the best position for forward integration intobecoming a bank then other way around. According to ASSOCHAM (ASSOCHAM, 201117),currently only 5% of the total mobile subscribers are registered users of mobile banking andmore significantly, only 0.5% of them are active mobile banking users. These are also primarilyrestricted to information based services.
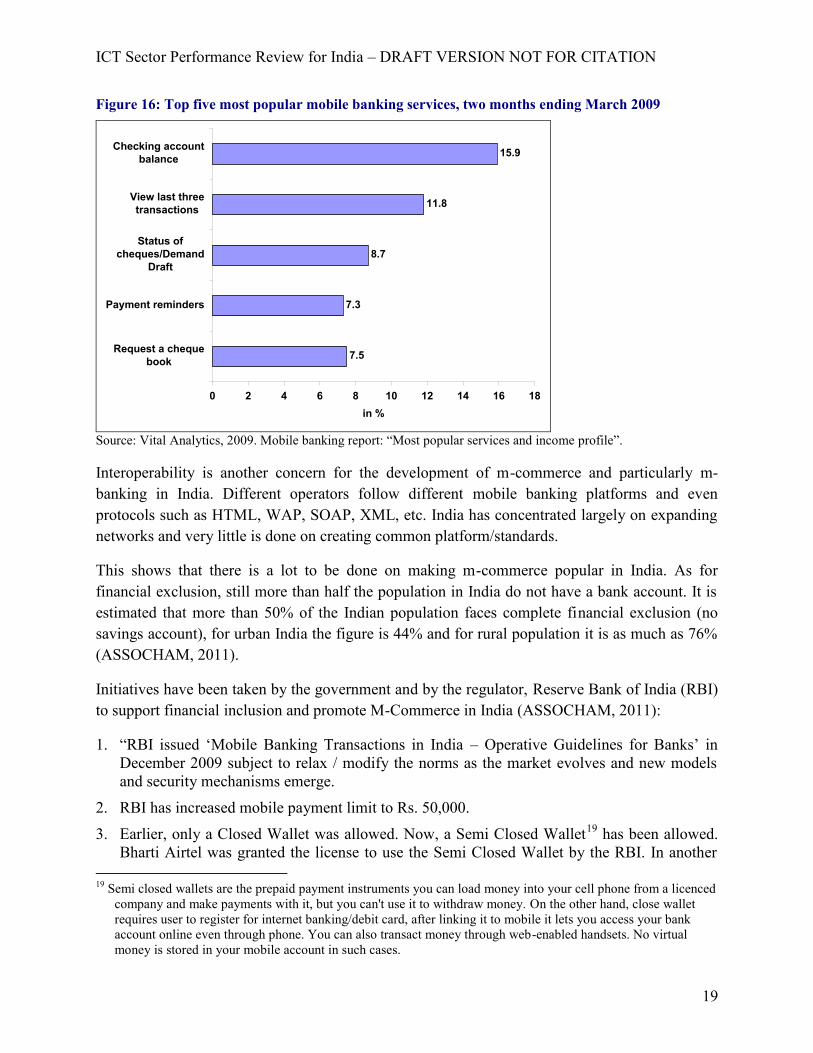
According to Vital Analytics18 (a Bangalore based market research firm), based on data gatheredby the firm in April 2009 for February and March 2009 mobile banking urban Indian customerschecking account balance is the most frequently cited reason for using mobile banking followedby viewing last three transactions (figure 16).
16 Business India, 2009. M-commerce in India Future and Challenges faced, Business India 2.0, Para 3, August 29,2009 Retrieved from: http://ijsid.wordpress.com/2009/08/29/m-commerce-india-the-future-challenges-faced/(Accessed April 05, 2009).
17 The Associated Chambers of Commerce and Industry of India (ASSOCHAM), 2011. Mobile Value AddedServices (MVAS) - A vehicle to usher in inclusive growth and bridge the digital divide, ASSOCHAM, January2011.18 Market Report: Mobile Banking in India used by 40 Million Urban Indians (2009), Pluggd.in. Retrieved from:http://www.pluggd.in/mobile-banking-in-india-market-report-297/
ICT Sector Performance Review for India – DRAFT VERSION NOT FOR CITATION
19
Figure 16: Top five most popular mobile banking services, two months ending March 2009
7.5
7.3
8.7
11.8
15.9
0 2 4 6 8 10 12 14 16 18
Request a chequebook
Payment reminders
Status ofcheques/Demand
Draft
View last threetransactions
Checking accountbalance
in %
Source: Vital Analytics, 2009. Mobile banking report: “Most popular services and income profile”.
Interoperability is another concern for the development of m-commerce and particularly m-banking in India. Different operators follow different mobile banking platforms and evenprotocols such as HTML, WAP, SOAP, XML, etc. India has concentrated largely on expandingnetworks and very little is done on creating common platform/standards.
This shows that there is a lot to be done on making m-commerce popular in India. As forfinancial exclusion, still more than half the population in India do not have a bank account. It isestimated that more than 50% of the Indian population faces complete financial exclusion (nosavings account), for urban India the figure is 44% and for rural population it is as much as 76%(ASSOCHAM, 2011).
Initiatives have been taken by the government and by the regulator, Reserve Bank of India (RBI)to support financial inclusion and promote M-Commerce in India (ASSOCHAM, 2011):
1. “RBI issued ‘Mobile Banking Transactions in India – Operative Guidelines for Banks’ inDecember 2009 subject to relax / modify the norms as the market evolves and new modelsand security mechanisms emerge.
2. RBI has increased mobile payment limit to Rs. 50,000.
3. Earlier, only a Closed Wallet was allowed. Now, a Semi Closed Wallet19 has been allowed.Bharti Airtel was granted the license to use the Semi Closed Wallet by the RBI. In another
19 Semi closed wallets are the prepaid payment instruments you can load money into your cell phone from a licencedcompany and make payments with it, but you can't use it to withdraw money. On the other hand, close walletrequires user to register for internet banking/debit card, after linking it to mobile it lets you access your bankaccount online even through phone. You can also transact money through web-enabled handsets. No virtualmoney is stored in your mobile account in such cases.
ICT Sector Performance Review for India – DRAFT VERSION NOT FOR CITATION
20
recent development, RBI issued Semi Closed Mobile Wallet license to Itz Cash as wellwhich is a non-bank semi closed pre-paid payment issuer in India.
4. An open wallet system, which may fuel rapid success of these services in India, is yet to beallowed in the country. However, the National and Payments Corporation of India (NPCI) -set up by RBI, as an umbrella institution for all the retail payments system in the country - iscurrently piloting a Person-to-Person (P2P) money transfer mechanism called the ‘InterbankMobile Payment Service (IMPS)’. Six of the leading banks in India are participating in thispilot, which can help in greater expansion of mobile banking services.”
Despite all these initiative m-commerce has not picked up as it should have. Banks are still cheapand secure way of transferring money. However large number of unbaked population andlimitations of banks which lead to inconveniences such as long travel and waiting time especiallyfor remote population call for some innovative models lead by mobile service providers (MSPs)
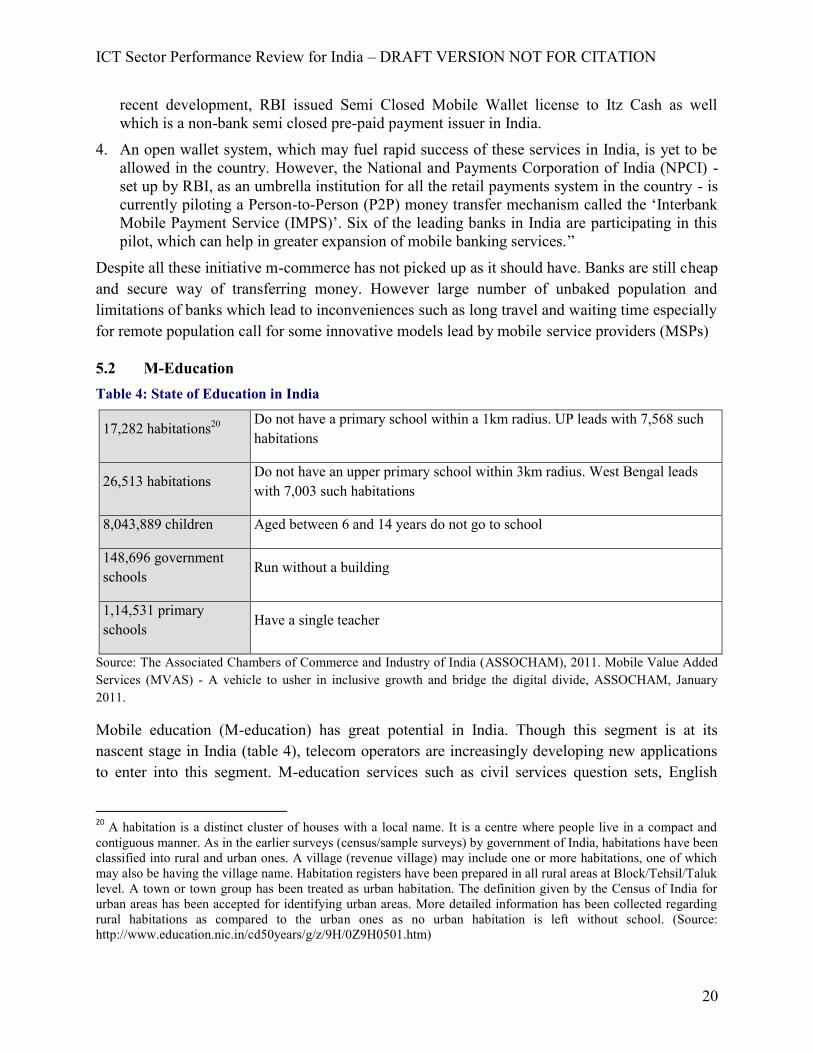
5.2 M-EducationTable 4: State of Education in India
17,282 habitations20 Do not have a primary school within a 1km radius. UP leads with 7,568 suchhabitations
26,513 habitationsDo not have an upper primary school within 3km radius. West Bengal leadswith 7,003 such habitations
8,043,889 children Aged between 6 and 14 years do not go to school
148,696 governmentschools Run without a building
1,14,531 primaryschools Have a single teacher
Source: The Associated Chambers of Commerce and Industry of India (ASSOCHAM), 2011. Mobile Value AddedServices (MVAS) - A vehicle to usher in inclusive growth and bridge the digital divide, ASSOCHAM, January2011.
Mobile education (M-education) has great potential in India. Though this segment is at itsnascent stage in India (table 4), telecom operators are increasingly developing new applicationsto enter into this segment. M-education services such as civil services question sets, English
20 A habitation is a distinct cluster of houses with a local name. It is a centre where people live in a compact andcontiguous manner. As in the earlier surveys (census/sample surveys) by government of India, habitations have beenclassified into rural and urban ones. A village (revenue village) may include one or more habitations, one of whichmay also be having the village name. Habitation registers have been prepared in all rural areas at Block/Tehsil/Taluklevel. A town or town group has been treated as urban habitation. The definition given by the Census of India forurban areas has been accepted for identifying urban areas. More detailed information has been collected regardingrural habitations as compared to the urban ones as no urban habitation is left without school. (Source:http://www.education.nic.in/cd50years/g/z/9H/0Z9H0501.htm)
ICT Sector Performance Review for India – DRAFT VERSION NOT FOR CITATION
21
learning, vocabulary and general knowledge tutorials, exam tips, exam result alerts and schoolsyllabi of Central Boards of Secondary Education (CBSE) and Indian Certificate for Secondary
Education (ICSE) boards as well as skill development are being developed by MSPs. Theseoperators usually partner with value added services (VAS) companies to develop theapplications.
Aircel offers various education services through application called mGurujee, which allows usersaccess to content in areas of engineering, management, civil services and medicine; schoolsyllabi of CBSE and ICSE boards as well as skill development, vocabulary and generalknowledge tutorials (see table below).
Education varsities like Indira Gandhi Nation Open University (IGNOU) in India have alsostarted taking advantage of telecom sector development. IGNOU has started m-educationservice. These services allow IGNOU to send its students enrolled with IGNOU containinginformation like courses available, subjects offered, etc. This service also allows students to sendSMSes to IGNOU to obtain information about the courses and subjects offered, examinations.IGNOU has also designed a software which allows students to update their personal details withIGNOU through mobile. Recently, IGNOU has also signed a deal with Ericsson India Pvt.Limited (EIL) to start the application of Third Generation (3G) Mobile in education delivery.
Tata DoCoMo, another MSP in India, has started English Seekho service application in 24 cities.It allows users to take conversational English language lessons on their mobiles through aninteractive voice response (IVR) application that guides the user through audio clips. It offersshort lessons followed by interactive lessons which enable users to practice what they have learntthrough the mobile's keys or through speech recognition (see table below). The operator chargesRs.20-30 per month and call charges are 1 paisa per second.
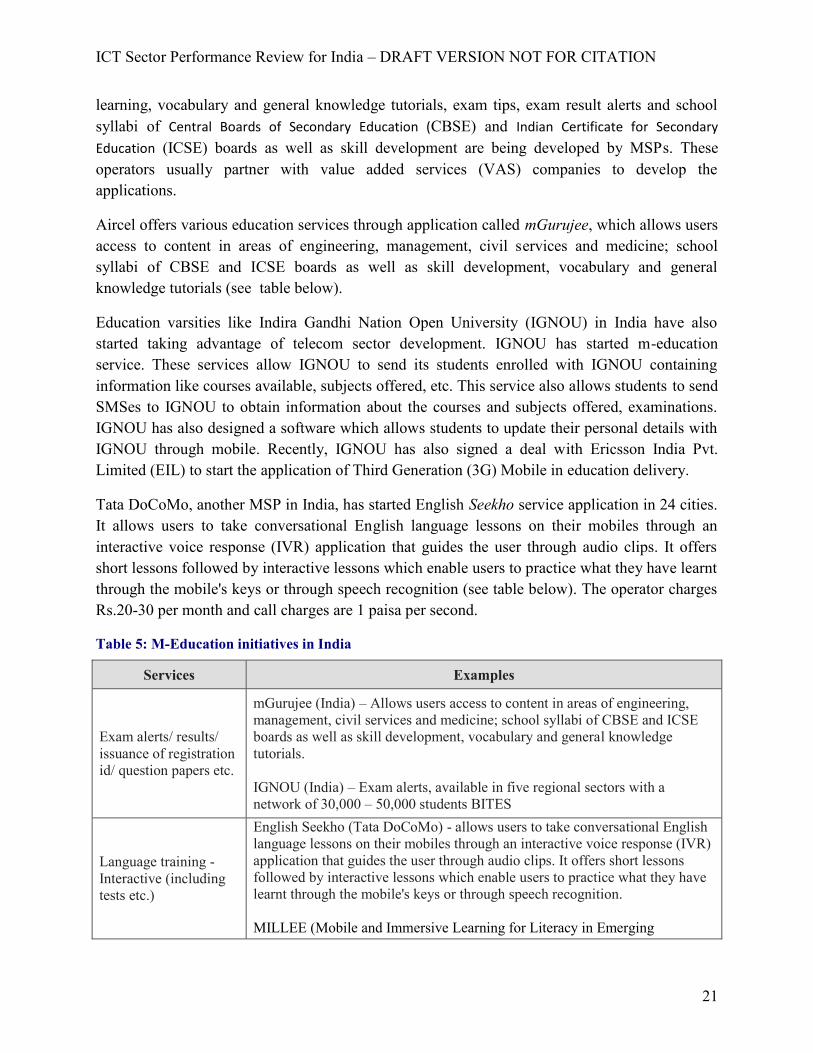
Table 5: M-Education initiatives in India
Services Examples
Exam alerts/ results/issuance of registrationid/ question papers etc.
mGurujee (India) – Allows users access to content in areas of engineering,management, civil services and medicine; school syllabi of CBSE and ICSEboards as well as skill development, vocabulary and general knowledgetutorials.
IGNOU (India) – Exam alerts, available in five regional sectors with anetwork of 30,000 – 50,000 students BITES
Language training -Interactive (includingtests etc.)
English Seekho (Tata DoCoMo) - allows users to take conversational Englishlanguage lessons on their mobiles through an interactive voice response (IVR)application that guides the user through audio clips. It offers short lessonsfollowed by interactive lessons which enable users to practice what they havelearnt through the mobile's keys or through speech recognition.
MILLEE (Mobile and Immersive Learning for Literacy in Emerging
ICT Sector Performance Review for India – DRAFT VERSION NOT FOR CITATION
22
Economies) - Cellphone applications that enable children in the developingworld to acquire language literacy in immersive, game like environments.Aims to make localized language learning resources more accessible tounderprivileged children, at times and places that are more convenient thanschools. The design methodology comprises best practices in commerciallanguage learning packages and the traditional village games that children inthe developing world play. After 10+ rounds of field studies in the past sixyears, a controlled experiment with 800 rural children in 40 villages in India isbeing carried out, with early replication underway in Kenya, China andelsewhere.
Mobile educationdissemination
Mobile education initiative to rural communities and physically challenged(India) - Strategic alliance between SNDT Women’s University, TataTeleservices, Atom Tech, Indian PCO Teleservices (India) to develop anddisseminate mobile education
Source: The Associated Chambers of Commerce and Industry of India (ASSOCHAM), 2011. Mobile Value AddedServices (MVAS) - A vehicle to usher in inclusive growth and bridge the digital divide, ASSOCHAM, January2011.
Even though it is only beginning for m-education in India, with new applications are coming in,m-education is a huge opportunity for telecom operators.
5.3 M-HealthMobile health (m-health) has potential to increase access to health services significantly.However, there is not much awareness about potential of m-health among doctors and patients inIndia. Therefore, demand for m-health is not there yet. There some initiatives like Apollohospital has started using telemedicine to make secondary and tertiary medical expertiseavailable to rural and peri-urban India through an audiovisual enabled delivery system.
ICT Sector Performance Review for India – DRAFT VERSION NOT FOR CITATION
23
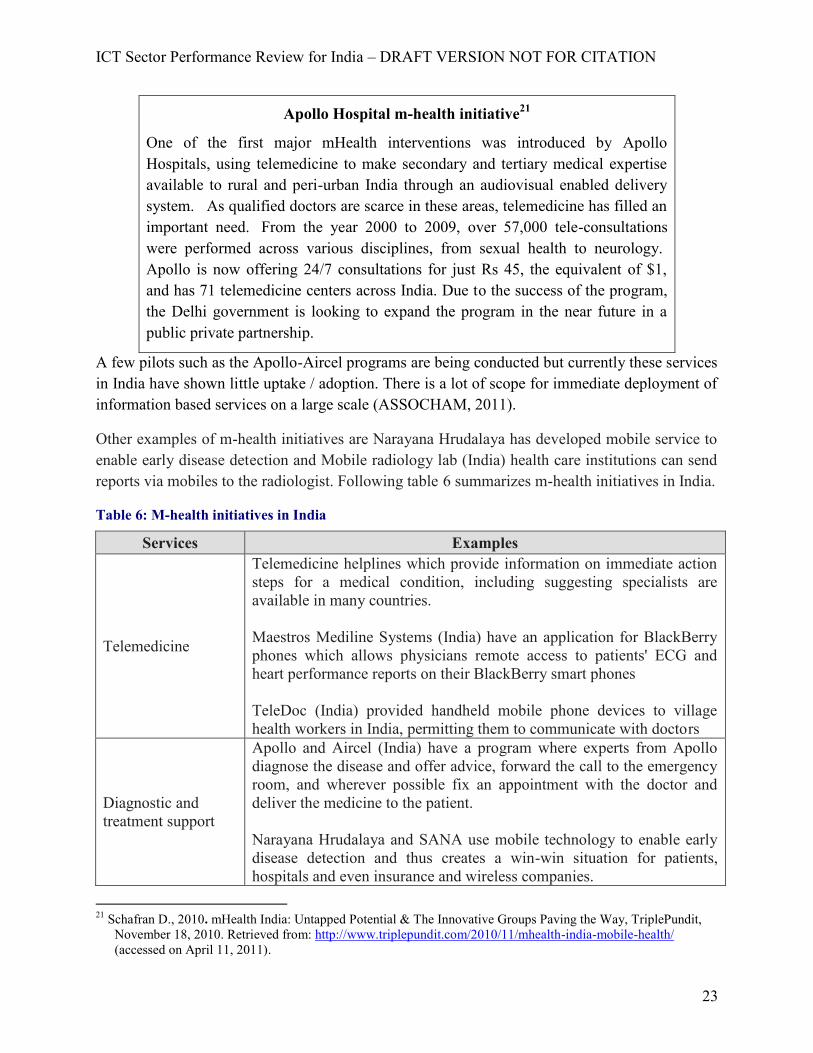
Apollo Hospital m-health initiative21
One of the first major mHealth interventions was introduced by ApolloHospitals, using telemedicine to make secondary and tertiary medical expertiseavailable to rural and peri-urban India through an audiovisual enabled deliverysystem. As qualified doctors are scarce in these areas, telemedicine has filled animportant need. From the year 2000 to 2009, over 57,000 tele-consultationswere performed across various disciplines, from sexual health to neurology.Apollo is now offering 24/7 consultations for just Rs 45, the equivalent of $1,and has 71 telemedicine centers across India. Due to the success of the program,the Delhi government is looking to expand the program in the near future in apublic private partnership.
A few pilots such as the Apollo-Aircel programs are being conducted but currently these servicesin India have shown little uptake / adoption. There is a lot of scope for immediate deployment ofinformation based services on a large scale (ASSOCHAM, 2011).
Other examples of m-health initiatives are Narayana Hrudalaya has developed mobile service toenable early disease detection and Mobile radiology lab (India) health care institutions can sendreports via mobiles to the radiologist. Following table 6 summarizes m-health initiatives in India.
Table 6: M-health initiatives in India
Services Examples
Telemedicine
Telemedicine helplines which provide information on immediate actionsteps for a medical condition, including suggesting specialists areavailable in many countries.
Maestros Mediline Systems (India) have an application for BlackBerryphones which allows physicians remote access to patients' ECG andheart performance reports on their BlackBerry smart phones
TeleDoc (India) provided handheld mobile phone devices to villagehealth workers in India, permitting them to communicate with doctors
Diagnostic andtreatment support
Apollo and Aircel (India) have a program where experts from Apollodiagnose the disease and offer advice, forward the call to the emergencyroom, and wherever possible fix an appointment with the doctor anddeliver the medicine to the patient.
Narayana Hrudalaya and SANA use mobile technology to enable earlydisease detection and thus creates a win-win situation for patients,hospitals and even insurance and wireless companies.
21 Schafran D., 2010. mHealth India: Untapped Potential & The Innovative Groups Paving the Way, TriplePundit,November 18, 2010. Retrieved from: http://www.triplepundit.com/2010/11/mhealth-india-mobile-health/(accessed on April 11, 2011).
ICT Sector Performance Review for India – DRAFT VERSION NOT FOR CITATION
24
Remote monitoringand Remote datacollection
Mobile radiology lab (India) health care institutions can send reports viamobiles to the radiologist.
Source: The Associated Chambers of Commerce and Industry of India (ASSOCHAM), 2011. Mobile Value AddedServices (MVAS) - A vehicle to usher in inclusive growth and bridge the digital divide, ASSOCHAM, January2011.
5.4 E-Governance/M-GovernanceMobile governance (m-governance) has potential to enhance delivery of government service,therefore significantly transforming traditional government service delivery model to a new levelof efficiency. M-governance is basically two way communication model between governmentand citizen, thereby removing need of middleman/agent services.
The Government of India has been promoting use of ICT in government service delivery (table7) by creating the National e-Governance Plan (NeGP). This NeGP proposes 27 mission projectsrelated to e-governance/m-governance. Out of these envisaged projects 14 have alreadycompleted and working and remaining are expected to takeoff by 2014. Some of the initiativesare mentioned below (ASSOCHAM, 2011)
1. Of the 1,100 citizens and business centric services targeted for delivery, over 600services are now available electronically. For instance, citizens can now obtain copies oftheir land records, job cards for employment under Mahatma Gandhi National RuralEmployment Guarantee Scheme (MGNREGS), and certificates (relating to birth, death,income, and caste) online.
2. So far over 80,000 Common Services Centres (ICT kiosks through which e-governanceservices will be delivered) have been set up across India; the number is expected to reachone lakh by the end of the fiscal. Estimated number of Common Services Centres is2,50,000 by 2012, covering all Panchayats.
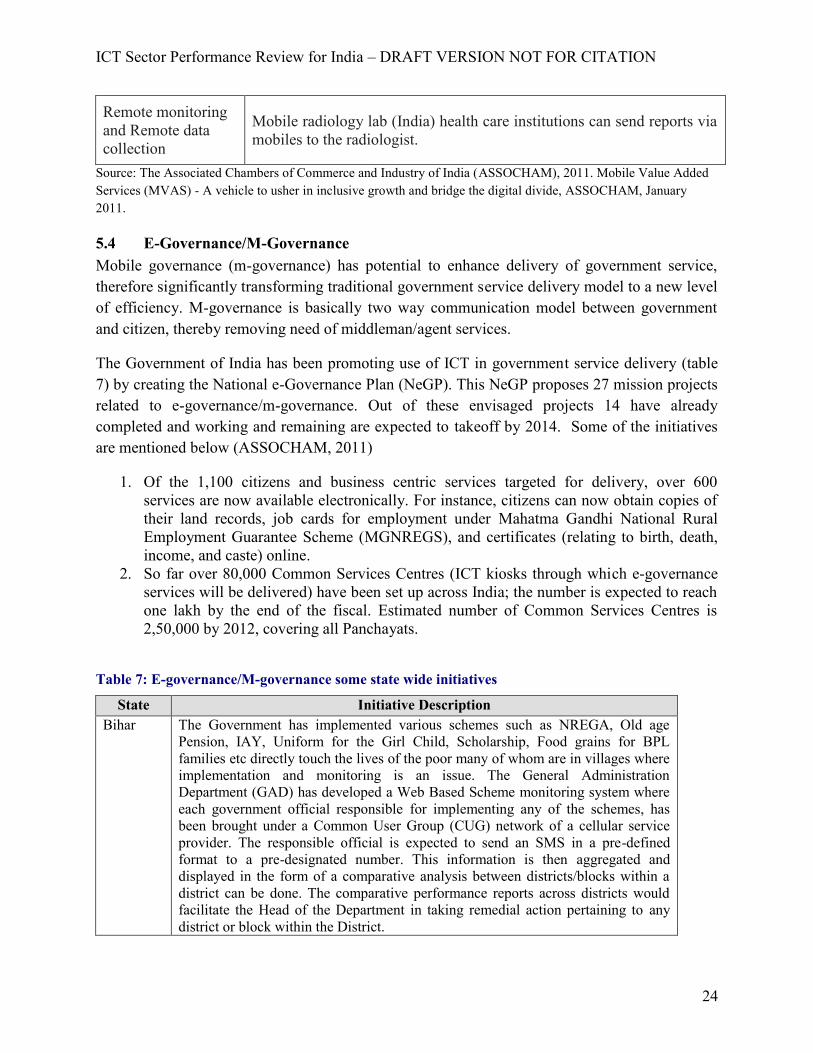
Table 7: E-governance/M-governance some state wide initiatives
State Initiative DescriptionBihar The Government has implemented various schemes such as NREGA, Old age
Pension, IAY, Uniform for the Girl Child, Scholarship, Food grains for BPLfamilies etc directly touch the lives of the poor many of whom are in villages whereimplementation and monitoring is an issue. The General AdministrationDepartment (GAD) has developed a Web Based Scheme monitoring system whereeach government official responsible for implementing any of the schemes, hasbeen brought under a Common User Group (CUG) network of a cellular serviceprovider. The responsible official is expected to send an SMS in a pre-definedformat to a pre-designated number. This information is then aggregated anddisplayed in the form of a comparative analysis between districts/blocks within adistrict can be done. The comparative performance reports across districts wouldfacilitate the Head of the Department in taking remedial action pertaining to anydistrict or block within the District.
ICT Sector Performance Review for India – DRAFT VERSION NOT FOR CITATION
25
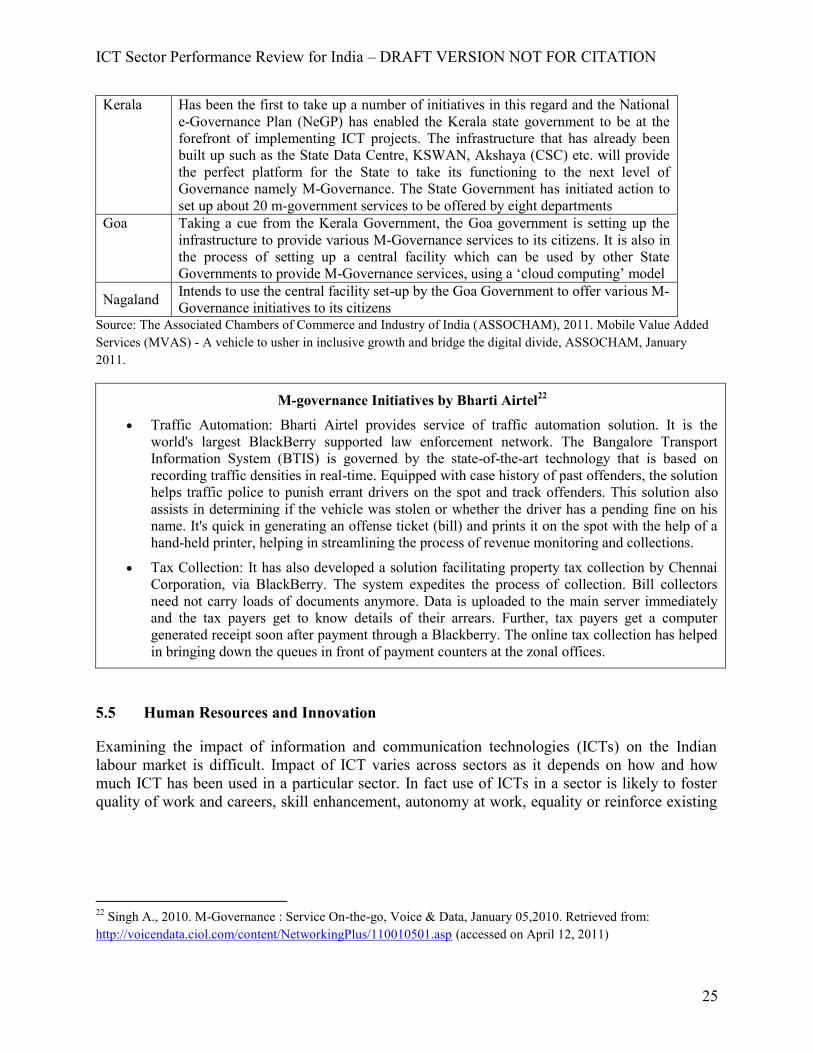
Kerala Has been the first to take up a number of initiatives in this regard and the Nationale-Governance Plan (NeGP) has enabled the Kerala state government to be at theforefront of implementing ICT projects. The infrastructure that has already beenbuilt up such as the State Data Centre, KSWAN, Akshaya (CSC) etc. will providethe perfect platform for the State to take its functioning to the next level ofGovernance namely M-Governance. The State Government has initiated action toset up about 20 m-government services to be offered by eight departments
Goa Taking a cue from the Kerala Government, the Goa government is setting up theinfrastructure to provide various M-Governance services to its citizens. It is also inthe process of setting up a central facility which can be used by other StateGovernments to provide M-Governance services, using a ‘cloud computing’ model
Nagaland Intends to use the central facility set-up by the Goa Government to offer various M-Governance initiatives to its citizens
Source: The Associated Chambers of Commerce and Industry of India (ASSOCHAM), 2011. Mobile Value AddedServices (MVAS) - A vehicle to usher in inclusive growth and bridge the digital divide, ASSOCHAM, January2011.
M-governance Initiatives by Bharti Airtel22
Traffic Automation: Bharti Airtel provides service of traffic automation solution. It is theworld's largest BlackBerry supported law enforcement network. The Bangalore TransportInformation System (BTIS) is governed by the state-of-the-art technology that is based onrecording traffic densities in real-time. Equipped with case history of past offenders, the solutionhelps traffic police to punish errant drivers on the spot and track offenders. This solution alsoassists in determining if the vehicle was stolen or whether the driver has a pending fine on hisname. It's quick in generating an offense ticket (bill) and prints it on the spot with the help of ahand-held printer, helping in streamlining the process of revenue monitoring and collections.
Tax Collection: It has also developed a solution facilitating property tax collection by ChennaiCorporation, via BlackBerry. The system expedites the process of collection. Bill collectorsneed not carry loads of documents anymore. Data is uploaded to the main server immediatelyand the tax payers get to know details of their arrears. Further, tax payers get a computergenerated receipt soon after payment through a Blackberry. The online tax collection has helpedin bringing down the queues in front of payment counters at the zonal offices.
5.5 Human Resources and Innovation
Examining the impact of information and communication technologies (ICTs) on the Indianlabour market is difficult. Impact of ICT varies across sectors as it depends on how and howmuch ICT has been used in a particular sector. In fact use of ICTs in a sector is likely to fosterquality of work and careers, skill enhancement, autonomy at work, equality or reinforce existing
22 Singh A., 2010. M-Governance : Service On-the-go, Voice & Data, January 05,2010. Retrieved from:http://voicendata.ciol.com/content/NetworkingPlus/110010501.asp (accessed on April 12, 2011)
ICT Sector Performance Review for India – DRAFT VERSION NOT FOR CITATION
26
labour market segmentation, such as those based on gender, observed in traditional sectors(Vijayabaskar and Parthasarathy, 2003).23
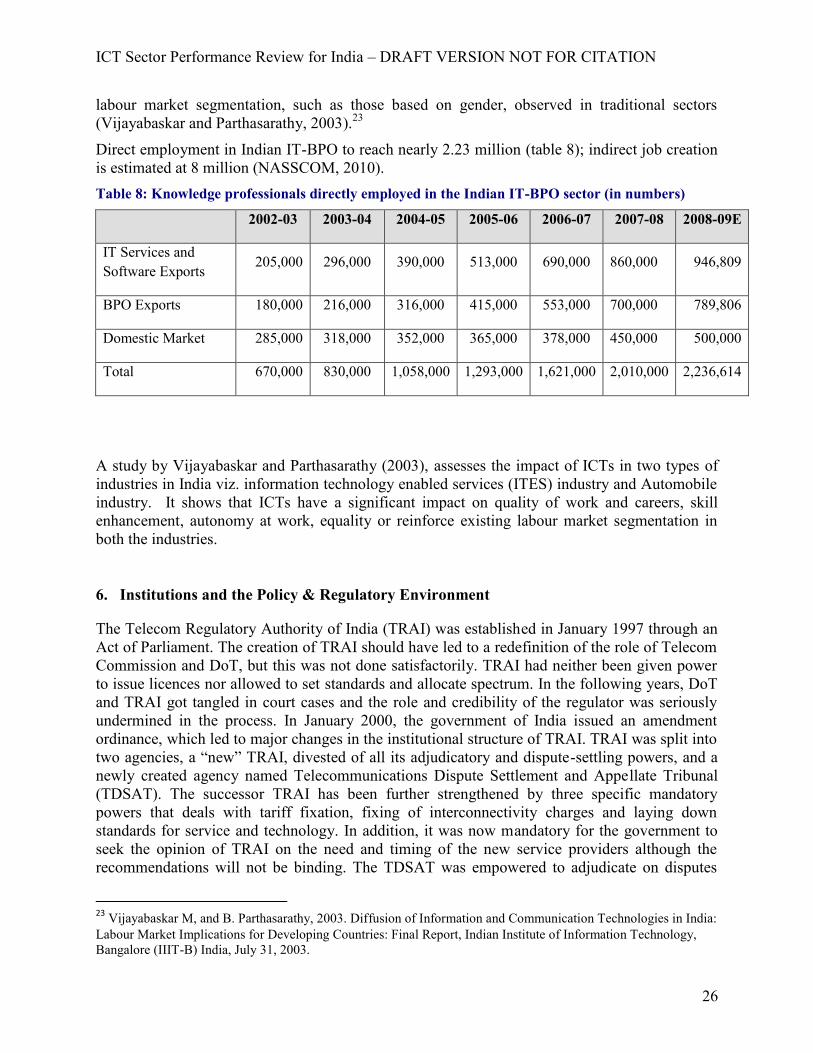
Direct employment in Indian IT-BPO to reach nearly 2.23 million (table 8); indirect job creationis estimated at 8 million (NASSCOM, 2010).Table 8: Knowledge professionals directly employed in the Indian IT-BPO sector (in numbers)
2002-03 2003-04 2004-05 2005-06 2006-07 2007-08 2008-09E
IT Services andSoftware Exports 205,000 296,000 390,000 513,000 690,000 860,000 946,809
BPO Exports 180,000 216,000 316,000 415,000 553,000 700,000 789,806
Domestic Market 285,000 318,000 352,000 365,000 378,000 450,000 500,000
Total 670,000 830,000 1,058,000 1,293,000 1,621,000 2,010,000 2,236,614
A study by Vijayabaskar and Parthasarathy (2003), assesses the impact of ICTs in two types ofindustries in India viz. information technology enabled services (ITES) industry and Automobileindustry. It shows that ICTs have a significant impact on quality of work and careers, skillenhancement, autonomy at work, equality or reinforce existing labour market segmentation inboth the industries.
6. Institutions and the Policy & Regulatory Environment
The Telecom Regulatory Authority of India (TRAI) was established in January 1997 through anAct of Parliament. The creation of TRAI should have led to a redefinition of the role of TelecomCommission and DoT, but this was not done satisfactorily. TRAI had neither been given powerto issue licences nor allowed to set standards and allocate spectrum. In the following years, DoTand TRAI got tangled in court cases and the role and credibility of the regulator was seriouslyundermined in the process. In January 2000, the government of India issued an amendmentordinance, which led to major changes in the institutional structure of TRAI. TRAI was split intotwo agencies, a “new” TRAI, divested of all its adjudicatory and dispute-settling powers, and anewly created agency named Telecommunications Dispute Settlement and Appellate Tribunal(TDSAT). The successor TRAI has been further strengthened by three specific mandatorypowers that deals with tariff fixation, fixing of interconnectivity charges and laying downstandards for service and technology. In addition, it was now mandatory for the government toseek the opinion of TRAI on the need and timing of the new service providers although therecommendations will not be binding. The TDSAT was empowered to adjudicate on disputes
23 Vijayabaskar M, and B. Parthasarathy, 2003. Diffusion of Information and Communication Technologies in India:Labour Market Implications for Developing Countries: Final Report, Indian Institute of Information Technology,Bangalore (IIIT-B) India, July 31, 2003.
ICT Sector Performance Review for India – DRAFT VERSION NOT FOR CITATION
27
between the licensor and licensee, between two or more service providers and between a serviceprovider and a group of consumers. It was also an appellate authority with respect to anydirection, decisions, and orders of TRAI. However, cases involving questions of monopoly andconsumer grievance redress by individual consumers are outside this body’s jurisdiction.Decisions of TDSAT can be appealed only to the Supreme Court of India.
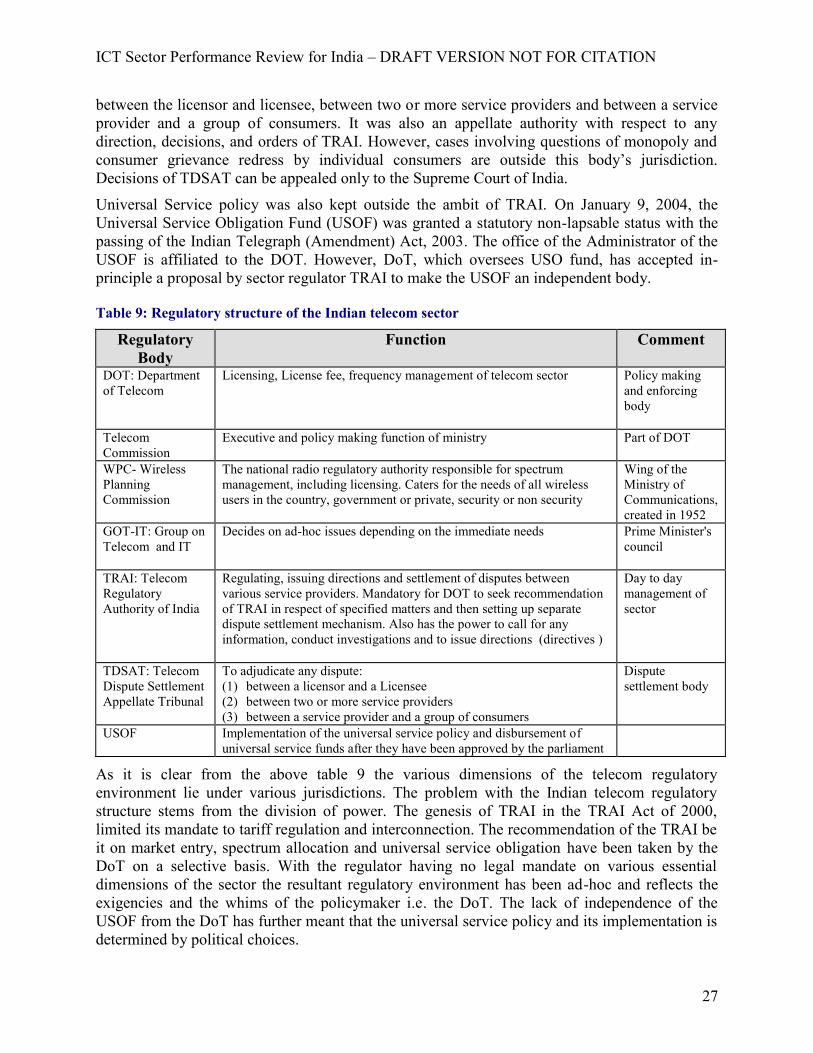
Universal Service policy was also kept outside the ambit of TRAI. On January 9, 2004, theUniversal Service Obligation Fund (USOF) was granted a statutory non-lapsable status with thepassing of the Indian Telegraph (Amendment) Act, 2003. The office of the Administrator of theUSOF is affiliated to the DOT. However, DoT, which oversees USO fund, has accepted in-principle a proposal by sector regulator TRAI to make the USOF an independent body.
Table 9: Regulatory structure of the Indian telecom sector
RegulatoryBody
Function Comment
DOT: Departmentof Telecom
Licensing, License fee, frequency management of telecom sector Policy makingand enforcingbody
TelecomCommission
Executive and policy making function of ministry Part of DOT
WPC- WirelessPlanningCommission
The national radio regulatory authority responsible for spectrummanagement, including licensing. Caters for the needs of all wirelessusers in the country, government or private, security or non security
Wing of theMinistry ofCommunications,created in 1952
GOT-IT: Group onTelecom and IT
Decides on ad-hoc issues depending on the immediate needs Prime Minister'scouncil
TRAI: TelecomRegulatoryAuthority of India
Regulating, issuing directions and settlement of disputes betweenvarious service providers. Mandatory for DOT to seek recommendationof TRAI in respect of specified matters and then setting up separatedispute settlement mechanism. Also has the power to call for anyinformation, conduct investigations and to issue directions (directives )
Day to daymanagement ofsector
TDSAT: TelecomDispute SettlementAppellate Tribunal
To adjudicate any dispute:(1) between a licensor and a Licensee(2) between two or more service providers(3) between a service provider and a group of consumers
Disputesettlement body
USOF Implementation of the universal service policy and disbursement ofuniversal service funds after they have been approved by the parliament
As it is clear from the above table 9 the various dimensions of the telecom regulatoryenvironment lie under various jurisdictions. The problem with the Indian telecom regulatorystructure stems from the division of power. The genesis of TRAI in the TRAI Act of 2000,limited its mandate to tariff regulation and interconnection. The recommendation of the TRAI beit on market entry, spectrum allocation and universal service obligation have been taken by theDoT on a selective basis. With the regulator having no legal mandate on various essentialdimensions of the sector the resultant regulatory environment has been ad-hoc and reflects theexigencies and the whims of the policymaker i.e. the DoT. The lack of independence of theUSOF from the DoT has further meant that the universal service policy and its implementation isdetermined by political choices.
ICT Sector Performance Review for India – DRAFT VERSION NOT FOR CITATION
28
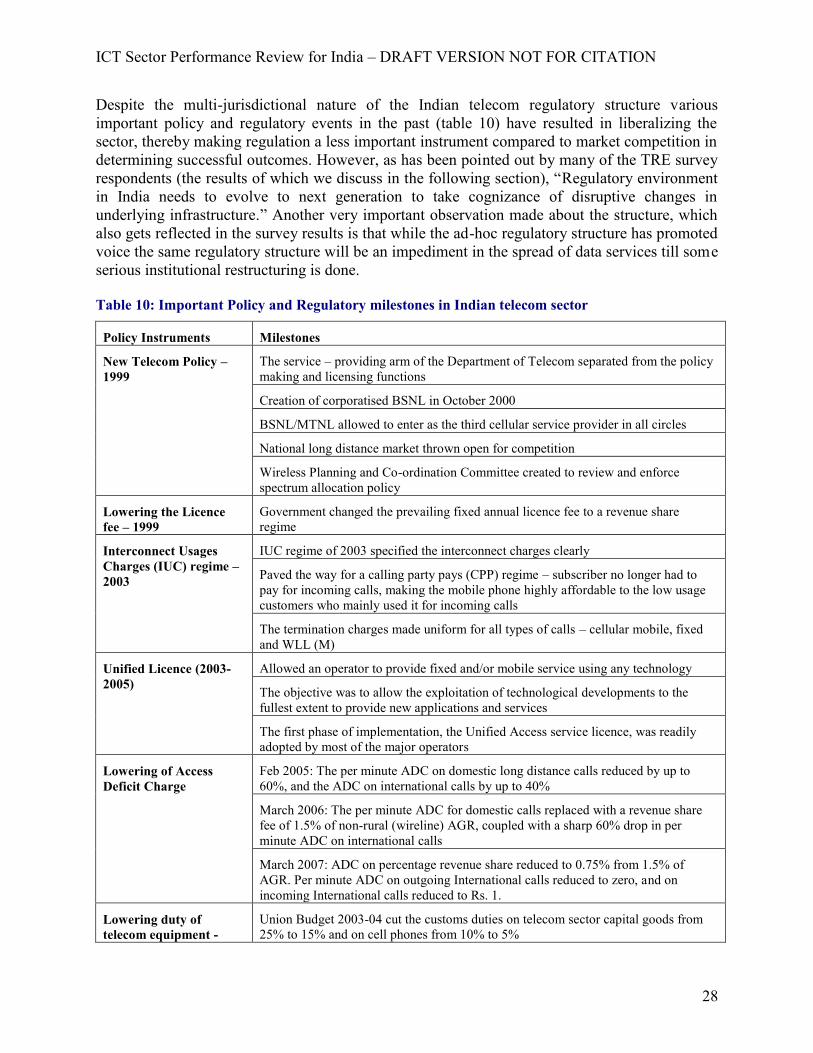
Despite the multi-jurisdictional nature of the Indian telecom regulatory structure variousimportant policy and regulatory events in the past (table 10) have resulted in liberalizing thesector, thereby making regulation a less important instrument compared to market competition indetermining successful outcomes. However, as has been pointed out by many of the TRE surveyrespondents (the results of which we discuss in the following section), “Regulatory environmentin India needs to evolve to next generation to take cognizance of disruptive changes inunderlying infrastructure.” Another very important observation made about the structure, whichalso gets reflected in the survey results is that while the ad-hoc regulatory structure has promotedvoice the same regulatory structure will be an impediment in the spread of data services till someserious institutional restructuring is done.
Table 10: Important Policy and Regulatory milestones in Indian telecom sector
Policy Instruments Milestones
New Telecom Policy –1999
The service – providing arm of the Department of Telecom separated from the policymaking and licensing functions
Creation of corporatised BSNL in October 2000
BSNL/MTNL allowed to enter as the third cellular service provider in all circles
National long distance market thrown open for competition
Wireless Planning and Co-ordination Committee created to review and enforcespectrum allocation policy
Lowering the Licencefee – 1999
Government changed the prevailing fixed annual licence fee to a revenue shareregime
Interconnect UsagesCharges (IUC) regime –2003
IUC regime of 2003 specified the interconnect charges clearly
Paved the way for a calling party pays (CPP) regime – subscriber no longer had topay for incoming calls, making the mobile phone highly affordable to the low usagecustomers who mainly used it for incoming calls
The termination charges made uniform for all types of calls – cellular mobile, fixedand WLL (M)
Unified Licence (2003-2005)
Allowed an operator to provide fixed and/or mobile service using any technology
The objective was to allow the exploitation of technological developments to thefullest extent to provide new applications and services
The first phase of implementation, the Unified Access service licence, was readilyadopted by most of the major operators
Lowering of AccessDeficit Charge
Feb 2005: The per minute ADC on domestic long distance calls reduced by up to60%, and the ADC on international calls by up to 40%
March 2006: The per minute ADC for domestic calls replaced with a revenue sharefee of 1.5% of non-rural (wireline) AGR, coupled with a sharp 60% drop in perminute ADC on international calls
March 2007: ADC on percentage revenue share reduced to 0.75% from 1.5% ofAGR. Per minute ADC on outgoing International calls reduced to zero, and onincoming International calls reduced to Rs. 1.
Lowering duty oftelecom equipment -
Union Budget 2003-04 cut the customs duties on telecom sector capital goods from25% to 15% and on cell phones from 10% to 5%
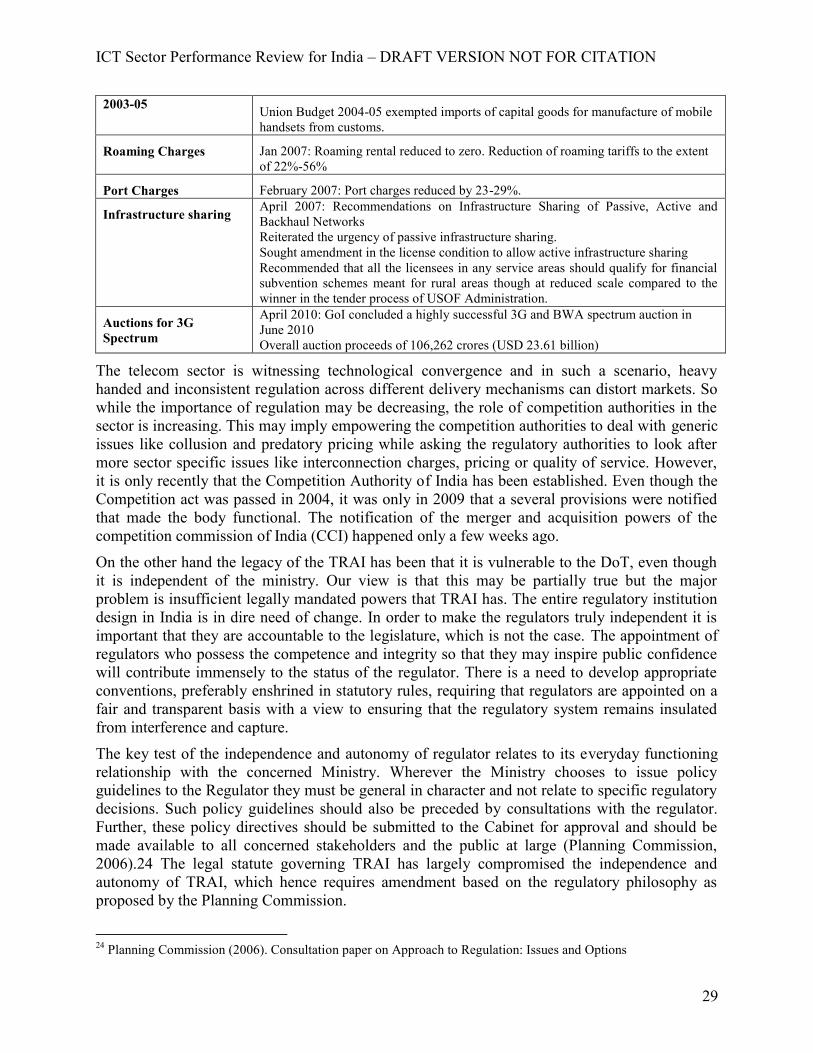
ICT Sector Performance Review for India – DRAFT VERSION NOT FOR CITATION
29
2003-05 Union Budget 2004-05 exempted imports of capital goods for manufacture of mobilehandsets from customs.
Roaming Charges Jan 2007: Roaming rental reduced to zero. Reduction of roaming tariffs to the extentof 22%-56%
Port Charges February 2007: Port charges reduced by 23-29%.
Infrastructure sharing April 2007: Recommendations on Infrastructure Sharing of Passive, Active andBackhaul NetworksReiterated the urgency of passive infrastructure sharing.Sought amendment in the license condition to allow active infrastructure sharingRecommended that all the licensees in any service areas should qualify for financialsubvention schemes meant for rural areas though at reduced scale compared to thewinner in the tender process of USOF Administration.
Auctions for 3GSpectrum
April 2010: GoI concluded a highly successful 3G and BWA spectrum auction inJune 2010Overall auction proceeds of 106,262 crores (USD 23.61 billion)
The telecom sector is witnessing technological convergence and in such a scenario, heavyhanded and inconsistent regulation across different delivery mechanisms can distort markets. Sowhile the importance of regulation may be decreasing, the role of competition authorities in thesector is increasing. This may imply empowering the competition authorities to deal with genericissues like collusion and predatory pricing while asking the regulatory authorities to look aftermore sector specific issues like interconnection charges, pricing or quality of service. However,it is only recently that the Competition Authority of India has been established. Even though theCompetition act was passed in 2004, it was only in 2009 that a several provisions were notifiedthat made the body functional. The notification of the merger and acquisition powers of thecompetition commission of India (CCI) happened only a few weeks ago.
On the other hand the legacy of the TRAI has been that it is vulnerable to the DoT, even thoughit is independent of the ministry. Our view is that this may be partially true but the majorproblem is insufficient legally mandated powers that TRAI has. The entire regulatory institutiondesign in India is in dire need of change. In order to make the regulators truly independent it isimportant that they are accountable to the legislature, which is not the case. The appointment ofregulators who possess the competence and integrity so that they may inspire public confidencewill contribute immensely to the status of the regulator. There is a need to develop appropriateconventions, preferably enshrined in statutory rules, requiring that regulators are appointed on afair and transparent basis with a view to ensuring that the regulatory system remains insulatedfrom interference and capture.
The key test of the independence and autonomy of regulator relates to its everyday functioningrelationship with the concerned Ministry. Wherever the Ministry chooses to issue policyguidelines to the Regulator they must be general in character and not relate to specific regulatorydecisions. Such policy guidelines should also be preceded by consultations with the regulator.Further, these policy directives should be submitted to the Cabinet for approval and should bemade available to all concerned stakeholders and the public at large (Planning Commission,2006).24 The legal statute governing TRAI has largely compromised the independence andautonomy of TRAI, which hence requires amendment based on the regulatory philosophy asproposed by the Planning Commission.
24 Planning Commission (2006). Consultation paper on Approach to Regulation: Issues and Options
ICT Sector Performance Review for India – DRAFT VERSION NOT FOR CITATION
30
7. Effectiveness of the Telecom Policy and Regulatory environment
In this report we use the TRE instrument25 to get a perception of informed stakeholders on thetelecom regulatory and policy environment of India. The TRE has many uses: it is a diagnosticinstrument for assessing the performance of the laws affecting the telecom sector and the variousgovernment entities responsible for implementation. The detailed methodology of the applicationof this instrument is detailed in Samarajiva et al (2007).26
The regulatory environment in India is assessed on seven dimensions:(a) market entry; (b) accessto scarce resources, mainly spectrum; (c) interconnection; (d) tariff regulation; (e) regulation ofanti competitive practices (f) universal service obligations (USO); and (g) quality of Service(QoS).
Respondents to the TRE survey are carefully selected, senior level persons from one of the threefollowing cateogries: those directly impacted by the regulatory environment such as operators,equipment manufacturers, those surveying the sector with broader interest such as industry/investanalysts, and those who represent the consumer interest such as user groups, other governmentorganizations. The respondents were asked to rate the quality of the regulatory environment foreach dimension on a Likert scale ranging from 1 (highly ineffective) to 5 (highly effective).Posing questions in this format ensures that responses can be easily analyzed without losing anyqualitative information as often occurs when using open-ended questions. Then the scores areaveraged over the respondents to get one number to allow for inter temporal and internationalcomparisons. Appropriate weights based on the number of respondents in the three respondentcategories are given to calculate the weighted average so that the perceptions of each categoryare equally represented.
However, a caveat must be added that the average score may mask some other details about theperception, as it may not represent the majority as the cardinality of the response has an effect onthe outcome. So, for instance a few people giving a score of 5 can upwardly bias the average andvice-versa.
The survey was implemented between February and March of 2011. The total number ofresponses received was 48, with respectively 18,12,18 for Category 1, 2 and 3 respectively. 27.
In the sections, which follow, we analyze the survey results and provide possible interpretationsto the scores on each of the seven dimensions. While comparisons have been done with theprevious survey, it is not quite possible to provide deterministic reasons for the differences in thescore, as the respondents were different and the perception not comparable.
7.1 Market Entry
The Indian telecom growth story is predicated on the universal access licensing that wasrecommended by TRAI in 2003 and accepted by the then TRAI immediately. However, a host of
25 The original TRE instrument was designed to assess regulatory effects on investment and documented inSamarajiva, R. and A. Dokeniya, (2004), Regulation and Investment: Sri Lanka Case Study, Discussion PaperWDR, World Dialogue for Regulation for Network Economies. Available at www.regulateonline.org.26 Available at: http://www.lirneasia.net/wp-content/uploads/2008/05/lirneasia-tre-paper-for-tprc-v8.pdf27 See Annex 1 to see the respondent categories and the percentage of respondents in these categories.
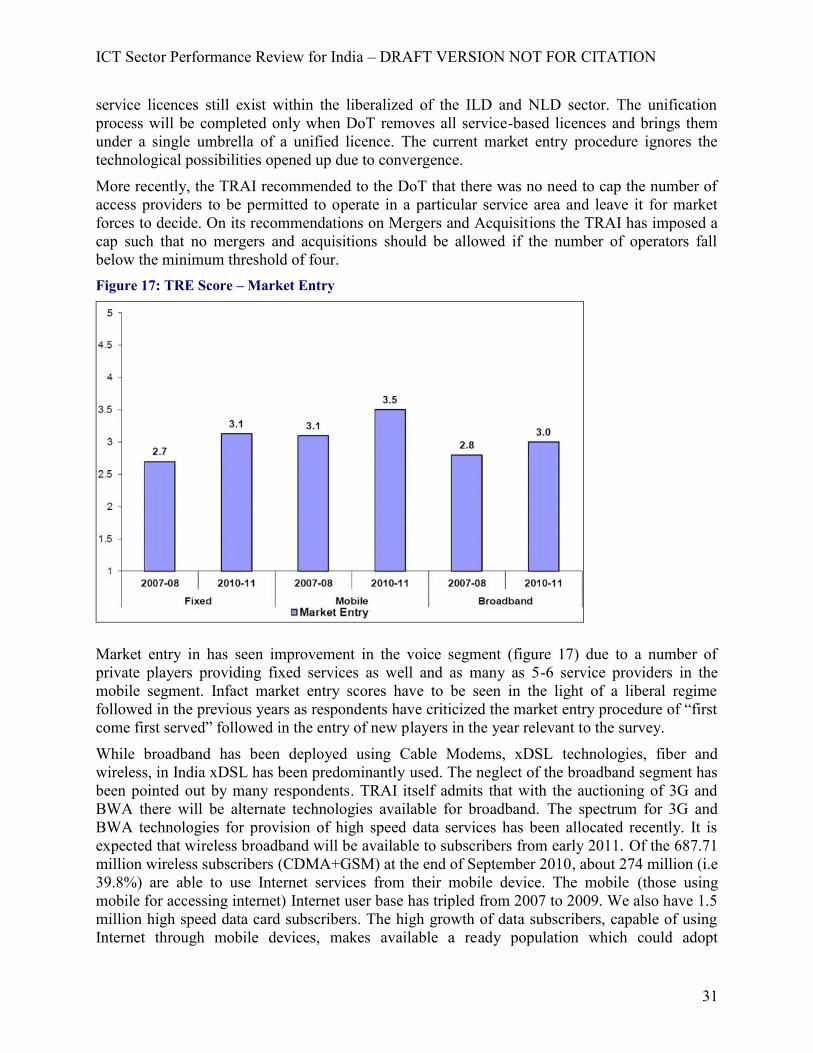
ICT Sector Performance Review for India – DRAFT VERSION NOT FOR CITATION
31
service licences still exist within the liberalized of the ILD and NLD sector. The unificationprocess will be completed only when DoT removes all service-based licences and brings themunder a single umbrella of a unified licence. The current market entry procedure ignores thetechnological possibilities opened up due to convergence.
More recently, the TRAI recommended to the DoT that there was no need to cap the number ofaccess providers to be permitted to operate in a particular service area and leave it for marketforces to decide. On its recommendations on Mergers and Acquisitions the TRAI has imposed acap such that no mergers and acquisitions should be allowed if the number of operators fallbelow the minimum threshold of four.Figure 17: TRE Score – Market Entry
Market entry in has seen improvement in the voice segment (figure 17) due to a number ofprivate players providing fixed services as well and as many as 5-6 service providers in themobile segment. Infact market entry scores have to be seen in the light of a liberal regimefollowed in the previous years as respondents have criticized the market entry procedure of “firstcome first served” followed in the entry of new players in the year relevant to the survey.
While broadband has been deployed using Cable Modems, xDSL technologies, fiber andwireless, in India xDSL has been predominantly used. The neglect of the broadband segment hasbeen pointed out by many respondents. TRAI itself admits that with the auctioning of 3G andBWA there will be alternate technologies available for broadband. The spectrum for 3G andBWA technologies for provision of high speed data services has been allocated recently. It isexpected that wireless broadband will be available to subscribers from early 2011. Of the 687.71million wireless subscribers (CDMA+GSM) at the end of September 2010, about 274 million (i.e39.8%) are able to use Internet services from their mobile device. The mobile (those usingmobile for accessing internet) Internet user base has tripled from 2007 to 2009. We also have 1.5million high speed data card subscribers. The high growth of data subscribers, capable of usingInternet through mobile devices, makes available a ready population which could adopt
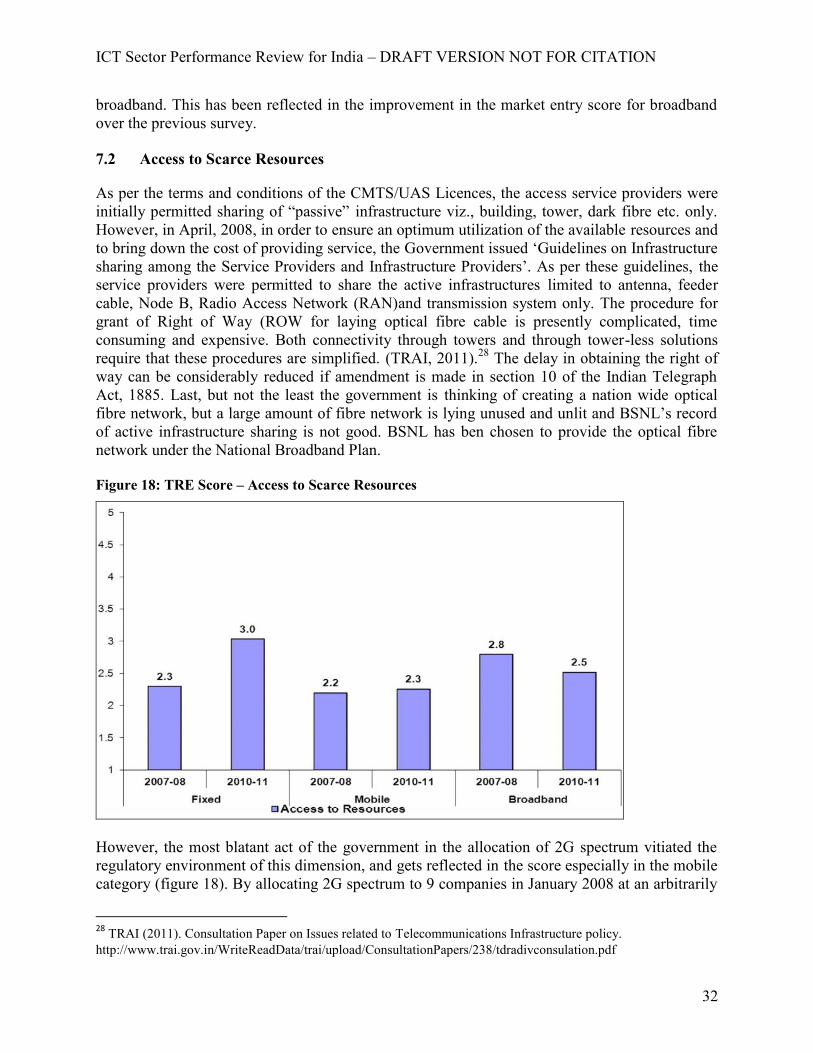
ICT Sector Performance Review for India – DRAFT VERSION NOT FOR CITATION
32
broadband. This has been reflected in the improvement in the market entry score for broadbandover the previous survey.
7.2 Access to Scarce Resources
As per the terms and conditions of the CMTS/UAS Licences, the access service providers wereinitially permitted sharing of “passive” infrastructure viz., building, tower, dark fibre etc. only.However, in April, 2008, in order to ensure an optimum utilization of the available resources andto bring down the cost of providing service, the Government issued ‘Guidelines on Infrastructuresharing among the Service Providers and Infrastructure Providers’. As per these guidelines, theservice providers were permitted to share the active infrastructures limited to antenna, feedercable, Node B, Radio Access Network (RAN)and transmission system only. The procedure forgrant of Right of Way (ROW for laying optical fibre cable is presently complicated, timeconsuming and expensive. Both connectivity through towers and through tower-less solutionsrequire that these procedures are simplified. (TRAI, 2011).28 The delay in obtaining the right ofway can be considerably reduced if amendment is made in section 10 of the Indian TelegraphAct, 1885. Last, but not the least the government is thinking of creating a nation wide opticalfibre network, but a large amount of fibre network is lying unused and unlit and BSNL’s recordof active infrastructure sharing is not good. BSNL has ben chosen to provide the optical fibrenetwork under the National Broadband Plan.
Figure 18: TRE Score – Access to Scarce Resources
However, the most blatant act of the government in the allocation of 2G spectrum vitiated theregulatory environment of this dimension, and gets reflected in the score especially in the mobilecategory (figure 18). By allocating 2G spectrum to 9 companies in January 2008 at an arbitrarily
28 TRAI (2011). Consultation Paper on Issues related to Telecommunications Infrastructure policy.http://www.trai.gov.in/WriteReadData/trai/upload/ConsultationPapers/238/tdradivconsulation.pdf
ICT Sector Performance Review for India – DRAFT VERSION NOT FOR CITATION
33
decided price of 1651 crores (the price paid by the fourth cellular operator way back in 2001),the then minister violated all the principles of efficient allocation of this scarce resource. Notonly was there an implication for the sector, the countries’ parliament came to a standstill and theminister is now being charged with economic and criminal offence. The scores, especially for themobile segment reflect the same disappointment with the procedure. The irrelevance of the fixedsector perhaps explains the ambiguous result for the fixed segment. A minor increse in the scorefor mobile could be due to the successful auction carried out by DoT for 3G.
7.3 Interconnection
The amendment ordinance of 2000 restored TRAI’s powers relating to tariffs andinterconnection, which had earlier been deemed by courts to be limited. Even the governmentwould have no right to overrule the TRAI in these two areas. With the TRAI powers clear andsingular on interconnection, the interconnection regime in India has been fairly stable from 2003,when the principal interconnection regulation was put in place by TRAI. In December 2008,TRAI undertook another review. The theoretical basis of reviewing the IUC was the following:
Competition in the telecom is effective when service providers recover their costs mostly fromtheir own end users, who can choose among competing service providers, rather than fromsubscribers of interconnecting networks for whom the terminating access provider is a de factomonopolist. The higher termination charge gives distinct cost advantage to large operators overcompeting new and smaller networks, which in turn helps them to consolidate the terminationmarket by acquiring more subscribers. Termination costs above the actual cost may lead tomarket distortions. On the other hand, lower termination charge may increase service uptake.
The final regulations that have emerged are as follows:
1) Continue with symmetric termination charge2) Raised the international termination charges 0.008 USD3) Retain the present ceiling on carriage charge to 0.014 USD4) Reduce the transit charge to 0.003 USD5) Reduced the termination charge further to 0.004 USD from 0.0066) Symmetric Charges for 2G and 3G voice termination
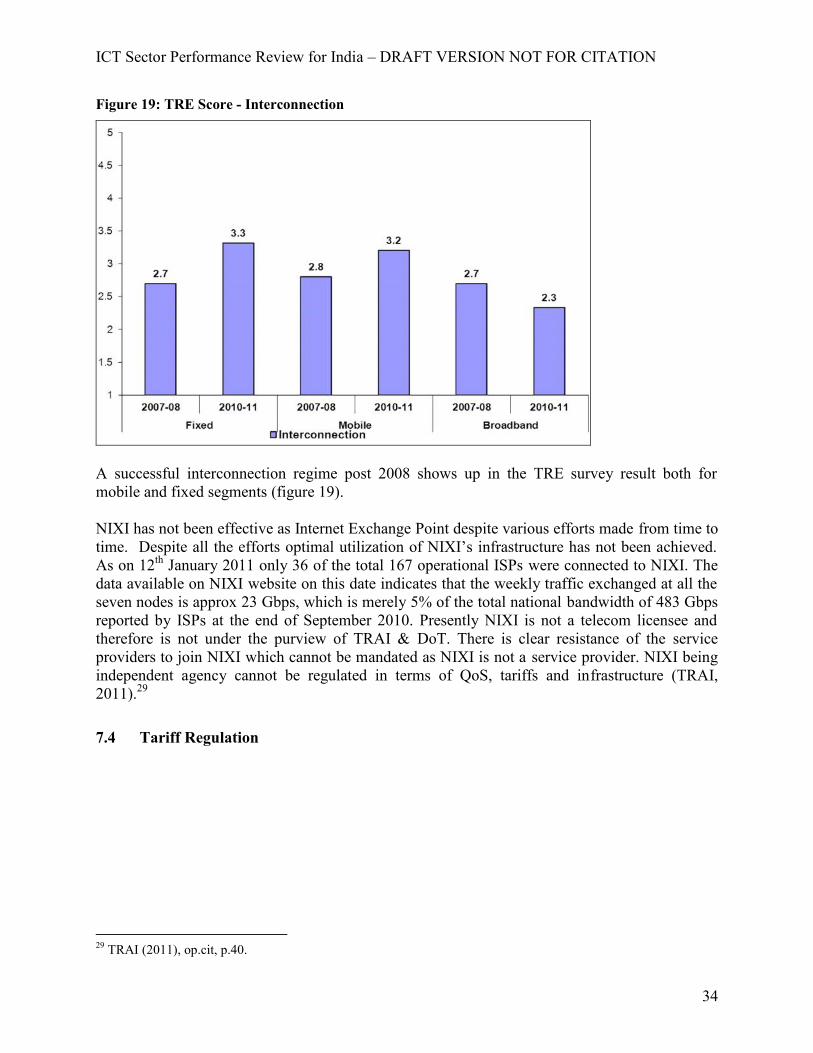
ICT Sector Performance Review for India – DRAFT VERSION NOT FOR CITATION
34
Figure 19: TRE Score - Interconnection
A successful interconnection regime post 2008 shows up in the TRE survey result both formobile and fixed segments (figure 19).
NIXI has not been effective as Internet Exchange Point despite various efforts made from time totime. Despite all the efforts optimal utilization of NIXI’s infrastructure has not been achieved.As on 12th January 2011 only 36 of the total 167 operational ISPs were connected to NIXI. Thedata available on NIXI website on this date indicates that the weekly traffic exchanged at all theseven nodes is approx 23 Gbps, which is merely 5% of the total national bandwidth of 483 Gbpsreported by ISPs at the end of September 2010. Presently NIXI is not a telecom licensee andtherefore is not under the purview of TRAI & DoT. There is clear resistance of the serviceproviders to join NIXI which cannot be mandated as NIXI is not a service provider. NIXI beingindependent agency cannot be regulated in terms of QoS, tariffs and infrastructure (TRAI,2011).29
7.4 Tariff Regulation
29 TRAI (2011), op.cit, p.40.
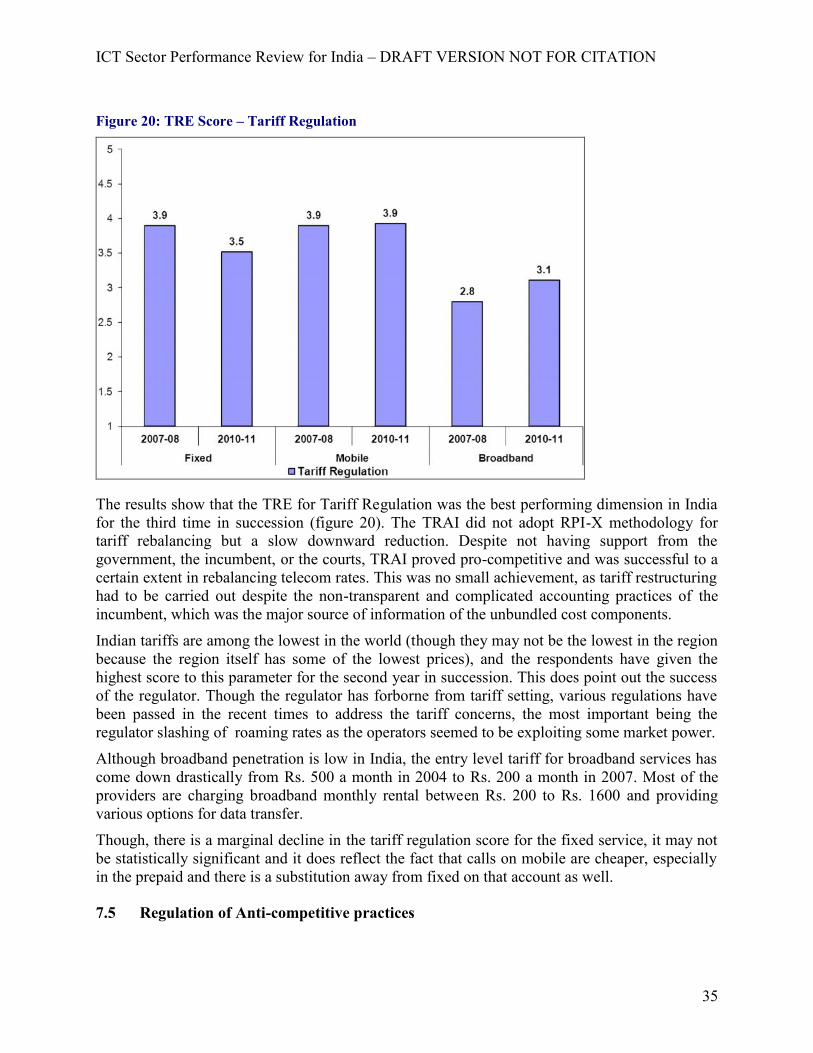
ICT Sector Performance Review for India – DRAFT VERSION NOT FOR CITATION
35
Figure 20: TRE Score – Tariff Regulation
The results show that the TRE for Tariff Regulation was the best performing dimension in Indiafor the third time in succession (figure 20). The TRAI did not adopt RPI-X methodology fortariff rebalancing but a slow downward reduction. Despite not having support from thegovernment, the incumbent, or the courts, TRAI proved pro-competitive and was successful to acertain extent in rebalancing telecom rates. This was no small achievement, as tariff restructuringhad to be carried out despite the non-transparent and complicated accounting practices of theincumbent, which was the major source of information of the unbundled cost components.
Indian tariffs are among the lowest in the world (though they may not be the lowest in the regionbecause the region itself has some of the lowest prices), and the respondents have given thehighest score to this parameter for the second year in succession. This does point out the successof the regulator. Though the regulator has forborne from tariff setting, various regulations havebeen passed in the recent times to address the tariff concerns, the most important being theregulator slashing of roaming rates as the operators seemed to be exploiting some market power.
Although broadband penetration is low in India, the entry level tariff for broadband services hascome down drastically from Rs. 500 a month in 2004 to Rs. 200 a month in 2007. Most of theproviders are charging broadband monthly rental between Rs. 200 to Rs. 1600 and providingvarious options for data transfer.
Though, there is a marginal decline in the tariff regulation score for the fixed service, it may notbe statistically significant and it does reflect the fact that calls on mobile are cheaper, especiallyin the prepaid and there is a substitution away from fixed on that account as well.
7.5 Regulation of Anti-competitive practices
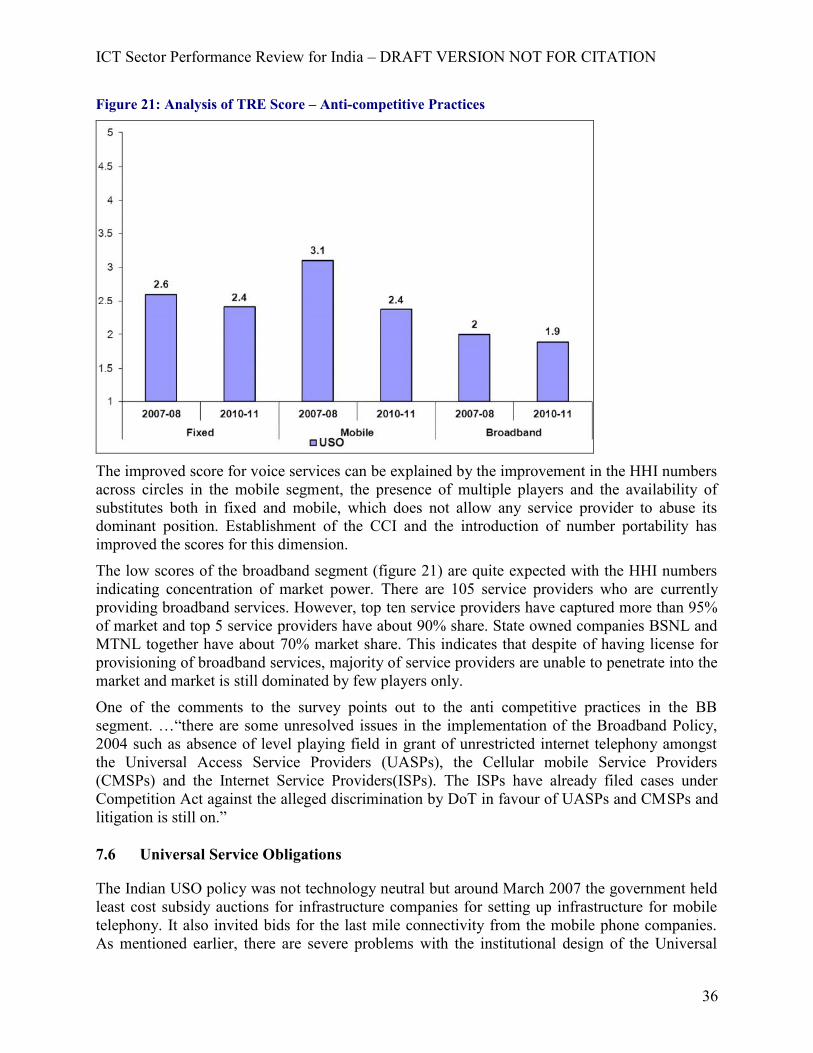
ICT Sector Performance Review for India – DRAFT VERSION NOT FOR CITATION
36
Figure 21: Analysis of TRE Score – Anti-competitive Practices
The improved score for voice services can be explained by the improvement in the HHI numbersacross circles in the mobile segment, the presence of multiple players and the availability ofsubstitutes both in fixed and mobile, which does not allow any service provider to abuse itsdominant position. Establishment of the CCI and the introduction of number portability hasimproved the scores for this dimension.
The low scores of the broadband segment (figure 21) are quite expected with the HHI numbersindicating concentration of market power. There are 105 service providers who are currentlyproviding broadband services. However, top ten service providers have captured more than 95%of market and top 5 service providers have about 90% share. State owned companies BSNL andMTNL together have about 70% market share. This indicates that despite of having license forprovisioning of broadband services, majority of service providers are unable to penetrate into themarket and market is still dominated by few players only.
One of the comments to the survey points out to the anti competitive practices in the BBsegment. …“there are some unresolved issues in the implementation of the Broadband Policy,2004 such as absence of level playing field in grant of unrestricted internet telephony amongstthe Universal Access Service Providers (UASPs), the Cellular mobile Service Providers(CMSPs) and the Internet Service Providers(ISPs). The ISPs have already filed cases underCompetition Act against the alleged discrimination by DoT in favour of UASPs and CMSPs andlitigation is still on.”
7.6 Universal Service Obligations
The Indian USO policy was not technology neutral but around March 2007 the government heldleast cost subsidy auctions for infrastructure companies for setting up infrastructure for mobiletelephony. It also invited bids for the last mile connectivity from the mobile phone companies.As mentioned earlier, there are severe problems with the institutional design of the Universal
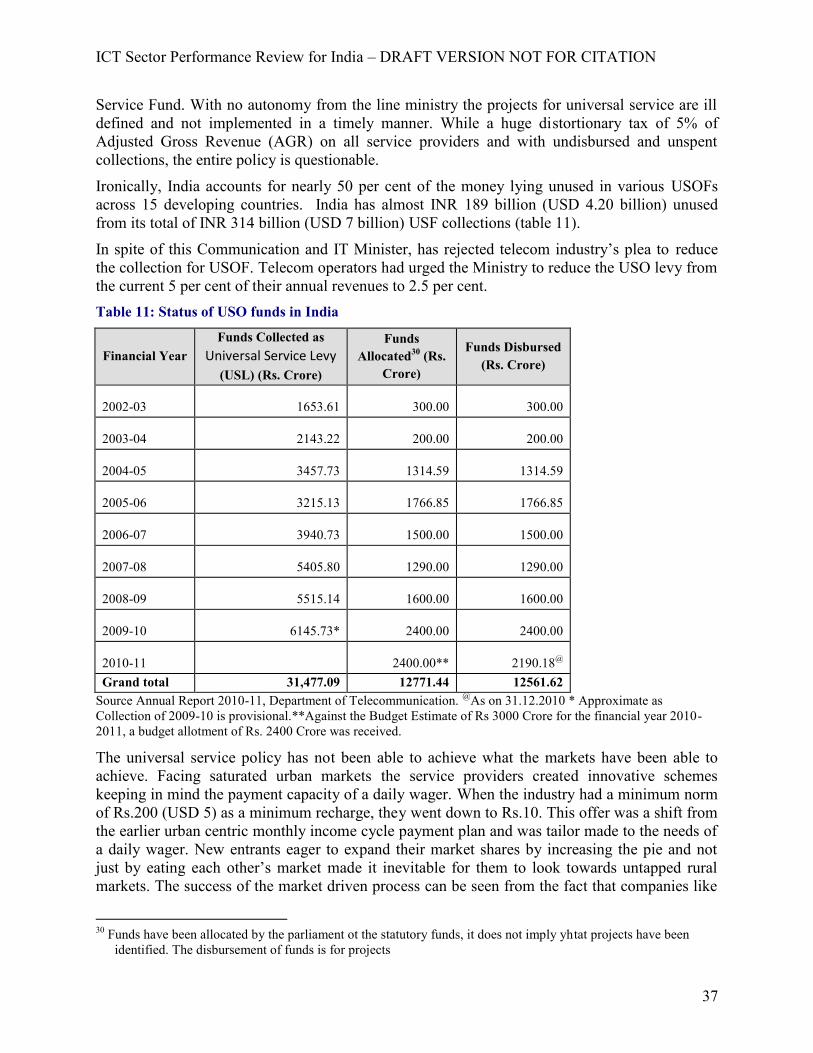
ICT Sector Performance Review for India – DRAFT VERSION NOT FOR CITATION
37
Service Fund. With no autonomy from the line ministry the projects for universal service are illdefined and not implemented in a timely manner. While a huge distortionary tax of 5% ofAdjusted Gross Revenue (AGR) on all service providers and with undisbursed and unspentcollections, the entire policy is questionable.
Ironically, India accounts for nearly 50 per cent of the money lying unused in various USOFsacross 15 developing countries. India has almost INR 189 billion (USD 4.20 billion) unusedfrom its total of INR 314 billion (USD 7 billion) USF collections (table 11).
In spite of this Communication and IT Minister, has rejected telecom industry’s plea to reducethe collection for USOF. Telecom operators had urged the Ministry to reduce the USO levy fromthe current 5 per cent of their annual revenues to 2.5 per cent.Table 11: Status of USO funds in India
Financial YearFunds Collected as
Universal Service Levy(USL) (Rs. Crore)
FundsAllocated30 (Rs.
Crore)
Funds Disbursed(Rs. Crore)
2002-03 1653.61 300.00 300.00
2003-04 2143.22 200.00 200.00
2004-05 3457.73 1314.59 1314.59
2005-06 3215.13 1766.85 1766.85
2006-07 3940.73 1500.00 1500.00
2007-08 5405.80 1290.00 1290.00
2008-09 5515.14 1600.00 1600.00
2009-10 6145.73* 2400.00 2400.00
2010-11 2400.00** 2190.18@
Grand total 31,477.09 12771.44 12561.62Source Annual Report 2010-11, Department of Telecommunication. @As on 31.12.2010 * Approximate asCollection of 2009-10 is provisional.**Against the Budget Estimate of Rs 3000 Crore for the financial year 2010-2011, a budget allotment of Rs. 2400 Crore was received.
The universal service policy has not been able to achieve what the markets have been able toachieve. Facing saturated urban markets the service providers created innovative schemeskeeping in mind the payment capacity of a daily wager. When the industry had a minimum normof Rs.200 (USD 5) as a minimum recharge, they went down to Rs.10. This offer was a shift fromthe earlier urban centric monthly income cycle payment plan and was tailor made to the needs ofa daily wager. New entrants eager to expand their market shares by increasing the pie and notjust by eating each other’s market made it inevitable for them to look towards untapped ruralmarkets. The success of the market driven process can be seen from the fact that companies like
30 Funds have been allocated by the parliament ot the statutory funds, it does not imply yhtat projects have beenidentified. The disbursement of funds is for projects
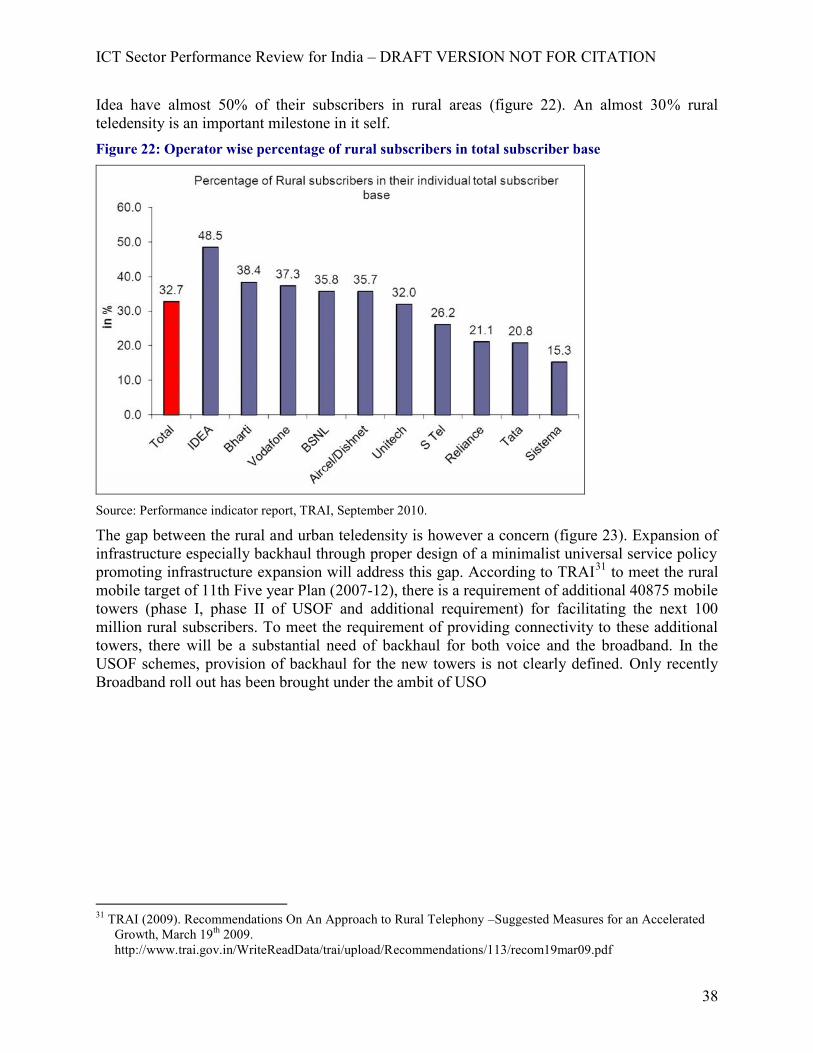
ICT Sector Performance Review for India – DRAFT VERSION NOT FOR CITATION
38
Idea have almost 50% of their subscribers in rural areas (figure 22). An almost 30% ruralteledensity is an important milestone in it self.Figure 22: Operator wise percentage of rural subscribers in total subscriber base
Source: Performance indicator report, TRAI, September 2010.
The gap between the rural and urban teledensity is however a concern (figure 23). Expansion ofinfrastructure especially backhaul through proper design of a minimalist universal service policypromoting infrastructure expansion will address this gap. According to TRAI31 to meet the ruralmobile target of 11th Five year Plan (2007-12), there is a requirement of additional 40875 mobiletowers (phase I, phase II of USOF and additional requirement) for facilitating the next 100million rural subscribers. To meet the requirement of providing connectivity to these additionaltowers, there will be a substantial need of backhaul for both voice and the broadband. In theUSOF schemes, provision of backhaul for the new towers is not clearly defined. Only recentlyBroadband roll out has been brought under the ambit of USO
31 TRAI (2009). Recommendations On An Approach to Rural Telephony –Suggested Measures for an AcceleratedGrowth, March 19th 2009.http://www.trai.gov.in/WriteReadData/trai/upload/Recommendations/113/recom19mar09.pdf
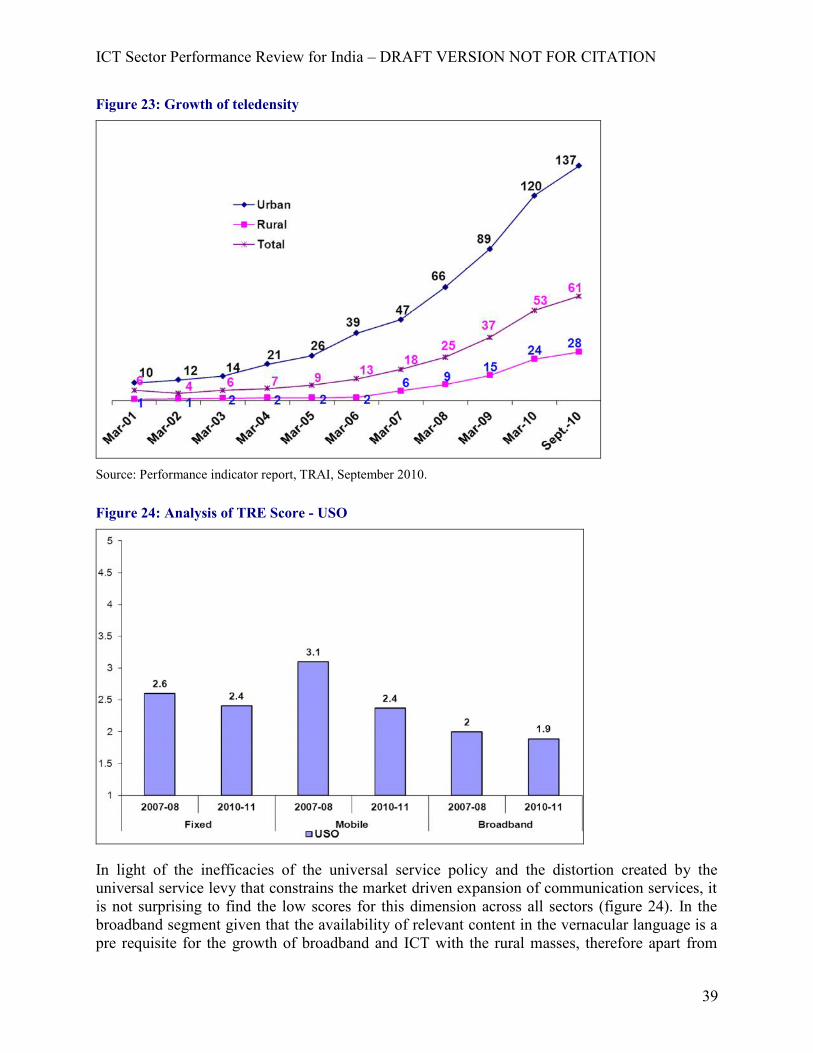
ICT Sector Performance Review for India – DRAFT VERSION NOT FOR CITATION
39
Figure 23: Growth of teledensity
Source: Performance indicator report, TRAI, September 2010.
Figure 24: Analysis of TRE Score - USO
In light of the inefficacies of the universal service policy and the distortion created by theuniversal service levy that constrains the market driven expansion of communication services, itis not surprising to find the low scores for this dimension across all sectors (figure 24). In thebroadband segment given that the availability of relevant content in the vernacular language is apre requisite for the growth of broadband and ICT with the rural masses, therefore apart from
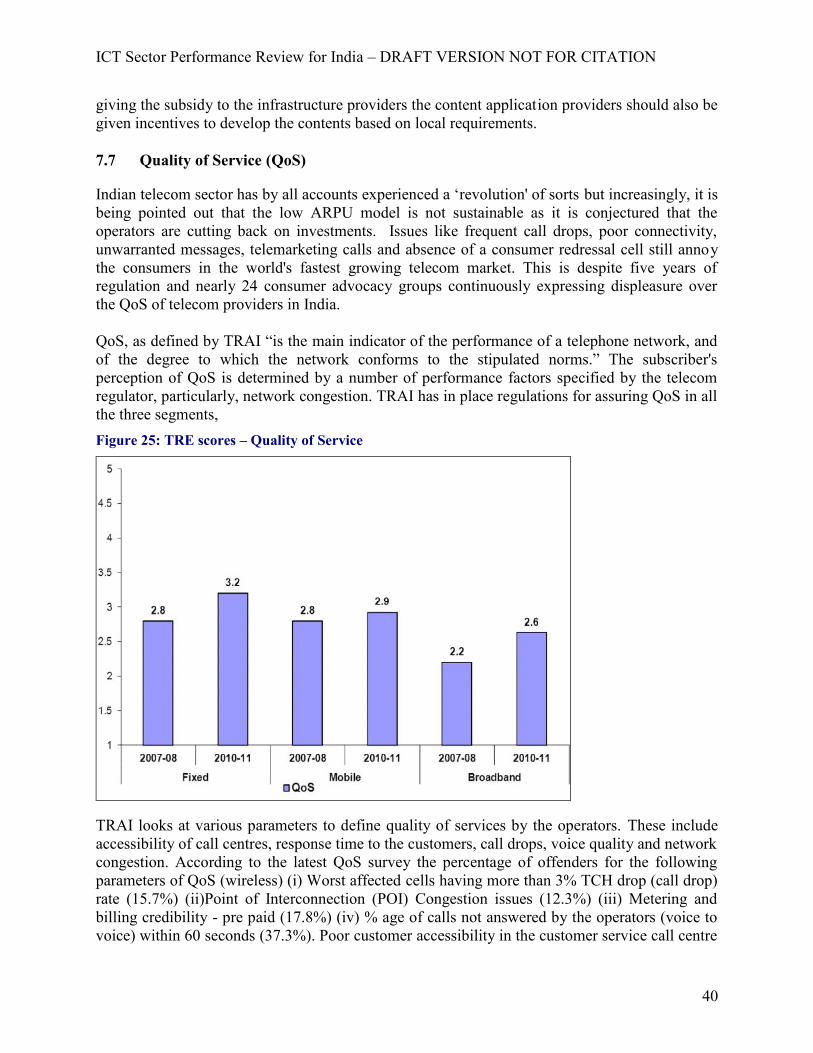
ICT Sector Performance Review for India – DRAFT VERSION NOT FOR CITATION
40
giving the subsidy to the infrastructure providers the content application providers should also begiven incentives to develop the contents based on local requirements.
7.7 Quality of Service (QoS)
Indian telecom sector has by all accounts experienced a ‘revolution' of sorts but increasingly, it isbeing pointed out that the low ARPU model is not sustainable as it is conjectured that theoperators are cutting back on investments. Issues like frequent call drops, poor connectivity,unwarranted messages, telemarketing calls and absence of a consumer redressal cell still annoythe consumers in the world's fastest growing telecom market. This is despite five years ofregulation and nearly 24 consumer advocacy groups continuously expressing displeasure overthe QoS of telecom providers in India.
QoS, as defined by TRAI “is the main indicator of the performance of a telephone network, andof the degree to which the network conforms to the stipulated norms.” The subscriber'sperception of QoS is determined by a number of performance factors specified by the telecomregulator, particularly, network congestion. TRAI has in place regulations for assuring QoS in allthe three segments,Figure 25: TRE scores – Quality of Service
TRAI looks at various parameters to define quality of services by the operators. These includeaccessibility of call centres, response time to the customers, call drops, voice quality and networkcongestion. According to the latest QoS survey the percentage of offenders for the followingparameters of QoS (wireless) (i) Worst affected cells having more than 3% TCH drop (call drop)rate (15.7%) (ii)Point of Interconnection (POI) Congestion issues (12.3%) (iii) Metering andbilling credibility - pre paid (17.8%) (iv) % age of calls not answered by the operators (voice tovoice) within 60 seconds (37.3%). Poor customer accessibility in the customer service call centre
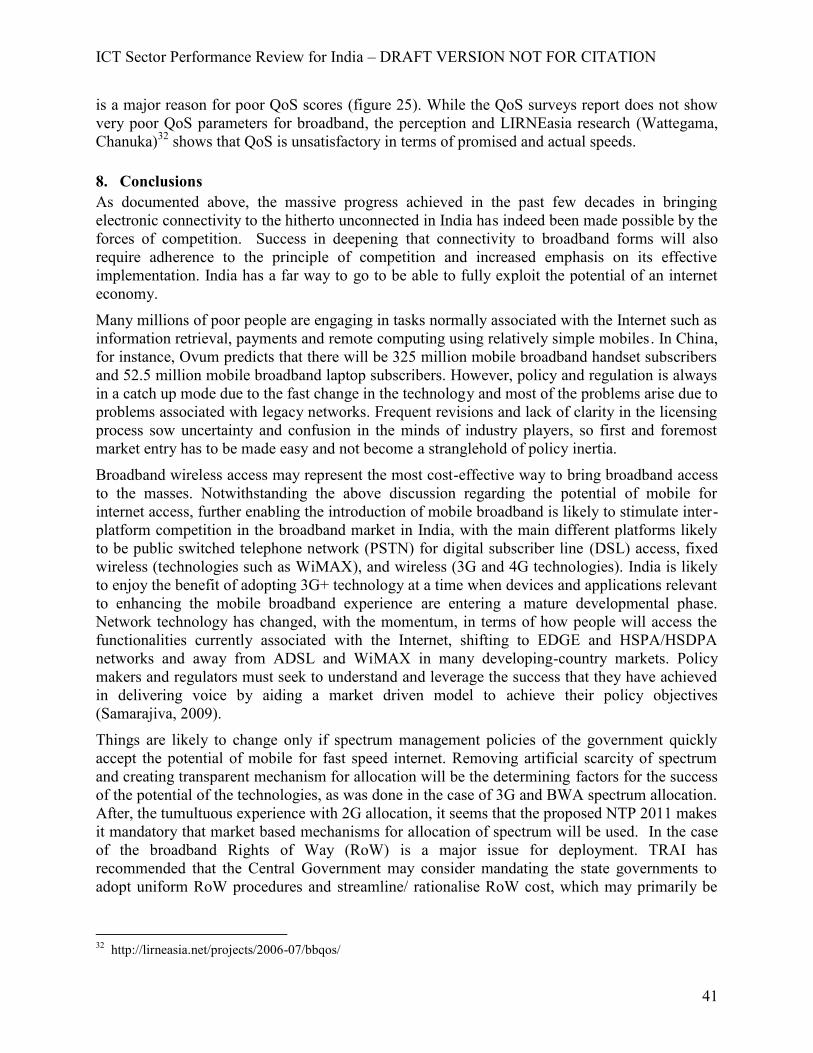
ICT Sector Performance Review for India – DRAFT VERSION NOT FOR CITATION
41
is a major reason for poor QoS scores (figure 25). While the QoS surveys report does not showvery poor QoS parameters for broadband, the perception and LIRNEasia research (Wattegama,Chanuka)32 shows that QoS is unsatisfactory in terms of promised and actual speeds.
8. ConclusionsAs documented above, the massive progress achieved in the past few decades in bringingelectronic connectivity to the hitherto unconnected in India has indeed been made possible by theforces of competition. Success in deepening that connectivity to broadband forms will alsorequire adherence to the principle of competition and increased emphasis on its effectiveimplementation. India has a far way to go to be able to fully exploit the potential of an interneteconomy.
Many millions of poor people are engaging in tasks normally associated with the Internet such asinformation retrieval, payments and remote computing using relatively simple mobiles. In China,for instance, Ovum predicts that there will be 325 million mobile broadband handset subscribersand 52.5 million mobile broadband laptop subscribers. However, policy and regulation is alwaysin a catch up mode due to the fast change in the technology and most of the problems arise due toproblems associated with legacy networks. Frequent revisions and lack of clarity in the licensingprocess sow uncertainty and confusion in the minds of industry players, so first and foremostmarket entry has to be made easy and not become a stranglehold of policy inertia.
Broadband wireless access may represent the most cost-effective way to bring broadband accessto the masses. Notwithstanding the above discussion regarding the potential of mobile forinternet access, further enabling the introduction of mobile broadband is likely to stimulate inter-platform competition in the broadband market in India, with the main different platforms likelyto be public switched telephone network (PSTN) for digital subscriber line (DSL) access, fixedwireless (technologies such as WiMAX), and wireless (3G and 4G technologies). India is likelyto enjoy the benefit of adopting 3G+ technology at a time when devices and applications relevantto enhancing the mobile broadband experience are entering a mature developmental phase.Network technology has changed, with the momentum, in terms of how people will access thefunctionalities currently associated with the Internet, shifting to EDGE and HSPA/HSDPAnetworks and away from ADSL and WiMAX in many developing-country markets. Policymakers and regulators must seek to understand and leverage the success that they have achievedin delivering voice by aiding a market driven model to achieve their policy objectives(Samarajiva, 2009).
Things are likely to change only if spectrum management policies of the government quicklyaccept the potential of mobile for fast speed internet. Removing artificial scarcity of spectrumand creating transparent mechanism for allocation will be the determining factors for the successof the potential of the technologies, as was done in the case of 3G and BWA spectrum allocation.After, the tumultuous experience with 2G allocation, it seems that the proposed NTP 2011 makesit mandatory that market based mechanisms for allocation of spectrum will be used. In the caseof the broadband Rights of Way (RoW) is a major issue for deployment. TRAI hasrecommended that the Central Government may consider mandating the state governments toadopt uniform RoW procedures and streamline/ rationalise RoW cost, which may primarily be
32 http://lirneasia.net/projects/2006-07/bbqos/
ICT Sector Performance Review for India – DRAFT VERSION NOT FOR CITATION
42
limited to cost of reinstatement only. RoW costs should be non-discriminatory, reasonable. RoWprocedures should be transparent and publicly available.
Technological options like combination of WiFi & WiMAX or 3G will be very useful forextending Broadband to the rural areas. However, the cost of creating backhaul infrastructure inrural areas is substantial, which acts as a deterrent for a new operator. There is need to encouragenew entrants in rural areas for installing their backhaul by providing incentives. TRAI in itsrecommendations on growth of Telecom services in Rural India dated 3rd October 2005recommended that backbone sharing in rural area be mandated. With the incumbent refusing toshare its existing backhaul infrastructure there may be a wasteful duplication of the same.
Some policy proposals that would contribute to the development of low-cost and high-qualitytelecom infrastructure for creating the next generation of Digital Capacity in India are as follows:
1. Providing Backhaul Connectivity:
Operators of backbone networks that constitute essential facilities should be required togive leased access at cost-oriented, non-discriminatory terms to other operatorsrequesting access;
2. Universal service should be extended to provide support for providing backhaul betweenthe BTSs and the BSC
3. Universal service subsidy should include subsidy for the backhaul from towers to theblock headquarters to the entity installing the tower
4. Defray charges for spectrum used for providing microwave backhaul for rural BTS.
5. Bandwidth should be upgraded to STM-1 by USOF and BSNL should be mandated toshare at least 2/3rd of the enhanced bandwidth with other service providers
6. Action should be taken to re-farm the 700 MHz band for use in wireless access networksexpeditiously and to assign the cleared frequencies in minimum blocks of 15 MHz(coupled) by transparent means.
7. Universal Service policy should be only a facilitator and hence minimalist.
8. Reduction in Universal service levy
Last but not the least, it should be recognised that investment in mobile telecommunicationnetworks requires complementary investment in education and other basic infrastructures. Inorder to drive productivity growth beyond the huge effects of simple access, how do thesecomplementary investments in assets and skills boost the “bang for the buck” that mobileinvestment might provide requires demand side studies at the micro level (Waverman andDasgupta 2009)
ICT Sector Performance Review for India – DRAFT VERSION NOT FOR CITATION
43
Annex 1: TRE Survey Methodology
Attempts were made to get 15 respondents each for each of the following categories:
1. Category 1: Stakeholders directly affected by telecom sector regulation, such asoperators, Industry associations, equipment suppliers and re-sellers
2. Category 2: Stakeholders who analyze the sector with broader interest, such as thoseworking for financial institutions, Telecom consultants, Law firms
3. Category 3: Stakeholders with an interest in improving the sector to help the public suchas academics, research organizations, journalists, telecom user groups, civil society,former members of regulatory and other government agencies, donors.
Unlike the previous surveys many respondents chose the online survey mode. There were manyrespondents who wanted total anonymity in responding and gave e-mail responses only ifanonymity and confidentiality is maintained. Eliciting responses was possible only on personalassurances from the principal author. Category 2 had very few responses on 2 accounts: First thecategory itself consists of far fewer stakeholders in comparison to category 1 and category 3.Second, there are not many law firms in India that have interests in the telecom sector. However,the responses are representative of the population of consultants and law firms. Financialinstitutions are not well represented.
Category 3 were the most enthusiastic respondents, especially the academics and the journalists.This group of stakeholders very keenly followed telecom as a sector as the last few years havebeen the most controversial with a huge political fallout.
Category 1 and Category 3 represent 37.5% of the respondents each and category 2 represent25% of the respondents
ICT Sector Performance Review for India – DRAFT VERSION NOT FOR CITATION
44
Annex 2: Summary of Regulatory and Policy Events for India
Date Key Regulatory Events – Jan. 2010 – Jan.2011201020 Jan TRAI releases consultation paper on “Efficient Utilization of Numbering Resources”.
The consultation paper takes up the following important issues:Long term suitability of numbering planEffective utilization of numbersAllocation and pricing of the numbers
23 Feb The government announced mobile number portability (MNP) will be delayed by twomonths to the end of May 2010 due to security reasons.
17 Mar TRAI releases consultation paper on “Collocation Charges”. The consultation papertakes up the following important issues:
Terms and conditions for collocationMeasures to ensure transparent and non-discriminatory treatment in pricing and
provisioning of collocation facilitiesSharing of cost of collocation by the seeker and provider
09 April Auctions started for India’s third generation (3G) high-speed mobile licences.11 May TRAI issues Consultation Paper on Review of Telecom Unsolicited Commercial
Communications Regulations. This consultation paper mainly reviews the regulatoryframework and explores all possible alternatives including establishment of “Do CallRegistry”, which will address issue of growing dissatisfaction among consumers dueto the problem of unsolicited commercial communications.
11 May TRAI releases recommendations on “Spectrum Management and LicensingFramework”.
10 June TRAI issues Consultation Paper on ‘National Broadband Plan’. The paper emphasesneed of urgent focus on creation of robust national BB infrastructure scalable to caterto future requirements not only in urban areas but also in villages.
11 June The government rang a triumphant end to the auctions for high-speed, third-generation (3G) mobile and broadband licences, raising in excess of Rs1 trillion, morethan three times the budgeted estimate.
02 Aug TRAI issues Consultation Paper on “Review of measures to protect the interest ofconsumers in telecom sector”
20 Aug TRAI releases recommendations on “Efficient Utilization of Numbering Resources inIndia”. Among many recommendations TRAI has recommended that India shouldmigrate to an integrated numbering scheme for fixed and mobile services by 31stDecember, 2011.
27 Sept Adding a new twist to the 2G spectrum scam, the Comptroller and Auditor General(CAG) told the department of telecom (DoT) that a vast majority of the 126 licencescontroversially issued by the government in 2008 are illegal.
07 Oct The telecom department (DoT), which oversees USO fund, has accepted in-principlea proposal by sector regulator TRAI to make the Universal Service Obligation Fund(USOF) an independent body.
13 Oct TRAI issues Consultation Paper on “Certain Issues relating to Telecom Tariffs”.In the context of representations from consumers and their representatives seekingfurther effective transparency measures, TRAI has formulated this ConsultationPaper.
28 Oct TRAI Issues Consultation Paper on “Quality of Service requirements for delivery ofbasic financial services using mobile phones”
ICT Sector Performance Review for India – DRAFT VERSION NOT FOR CITATION
45
02 Nov TRAI Releases Consultation Paper on Issues relating to blocking of IMEI forlost/stolen Mobile handsets
03 Nov TRAI Releases Consultation Paper on Revenue Sharing Arrangement for IntelligentNetwork ServicesThrough the consultation paper TRAI aims to seek views of the stakeholders on theissue of sharing of revenue from IN based services among the interconnecting serviceproviders to assist TRAI in arriving at a framework by which interconnecting serviceproviders can be fairly compensated.
18 Nov 2G scam: Trai recommends cancellation of 62 licencesThe action also coincides with the Supreme Court hearing into the allocation of 2Gspectrum in 2008 at 2001 prices
01 Dec TRAI issues “The Telecom Commercial Communications Customer PreferenceRegulations, 2010”Unlike the previous Regulations which provided only for a Do Not Call Registry,these Regulations provide a wide choice to the customer. He may choose to be underthe ‘fully blocked’ category which is akin to the Do Not Call Registry under theprevious Regulations or he may choose the ‘partially blocked’ category, in which casehe will receive SMSs in the category/categories chosen by him.
08 Dec TRAI issues Recommendations on ‘National Broadband Plan’. Highlights of thePlan:
Establishment of national broadband network, which will be an open accessoptical fibre network.
A National Optical Fibre Agency (NOFA) will be set up to establish thisbroadband network.
A State Optical Fiber Agency (SOFA) would be formed in every State.09 Dec. The government set up a one-man committee of a former Supreme Court judge to
examine the allocation of telecom licences and spectrum, some of which were grantedat rock bottom prices, in one of the biggest corruption scandals to hit India this year.
14 Dec TRAI issues “The Telecom Commercial Communications Customer Preference(Amendment) Regulations, 2010”The TRAI has found it necessary to re-determine the dates for implementation of theregulation “The Telecom Commercial Communications Customer PreferenceRegulations, 2010” issued on 1st December 2010. Accordingly, some of the relevantregulations have been amended so as to come into force, from dates as may bespecified by the Authority, from time to time.
28 Dec TRAI issues “The Telecom Commercial Communications Customer Preference(Second Amendment) Regulations, 2010”According to the provisions of these regulations, Telemarketers Registration shallcommence from 15th January, 2011 and other provisions shall come into force from1st February, 2011.
28 Dec TRAI releases consultation paper on “Encouraging Telecom EquipmentManufacturing in India”The consultation paper takes up the following important issues:
Promoting R&D and creation of intellectual propertyPromoting manufacture of telecom equipment in IndiaManufacture of electronic components in India
201114 Jan TRAI releases consultation paper on “Issues Related to Telecommunications
Infrastructure Policy”. The consultation paper takes up the following important issues:Telecom infrastructure classification and details with accent on policy issues that
ICT Sector Performance Review for India – DRAFT VERSION NOT FOR CITATION
46
need to be consulted upon.Framework relating to Mobile Virtual Network OperatorsSetting up of National Internet Exchange PointsIssues relating to telecom tower infrastructureIssues relating to Rural telephony
14 Jan Telemarketer registration starts from 15th January 2011.25 Jan TRAI Issues Consultation Paper on “Issues arising out of Provisioning and Pricing of
Services by Mobile Service Providers – in the context of Delivery of Basic FinancialServices using Mobile Phones”
31 Jan TRAI issued notice saying Consumer Preference Registration to stop UnsolicitedCommercial Communication to start from 10th Feb 2011.
31 Jan Former Supreme Court judge Shivraj V. Patil submitted his report on the proceduresfollowed in awarding airwaves for second generation (2G) telecom services between2001 and 2009, and identified some errant officials. The report came down heavily onthe controversial First-Come, First-Serve (FCFS) policy in entertaining applicationsand has sought complete transparency in spectrum allocation and assignment.
02 Feb Former Telecom Minister A Raja was arrested along with his two former associates inconnection with the 2G spectrum scam.
03 Feb TRAI releases consultation paper on “Green Telecommunications”. The consultationpaper takes up the following important issues:
Estimation of the carbon footprint of the telecom sector in India.Need and framework of carbon credit policy for the Indian telecom sectorMeasures to reduce the telecom sector carbon footprintPromoting use of energy efficient devices and renewable sources of energy.Standards, testing and certification products and services as green.e-waste management
08 Feb Review of Implementation of Mobile Number Portability by TRAITRAI is constantly monitoring the implementation of MNP in the country. Based onthe complaints and feedback received, TRAI has instructed the service providers tostrictly comply with the provisions of MNP Regulations.
09 Feb Four experts, appointed by TRAI have submitted their report on "The 2010 value ofspectrum in 1800 MHz band" dated 30thJanuary, 2011.
10 Feb The Telecom Regulatory Authority of India (Trai) submitted fresh recommendationson 2G spectrum pricing , steeply raising the estimated value of spectrum beyond6.2MHz held by incumbent operators.
ICT Sector Performance Review for India – DRAFT VERSION NOT FOR CITATION
47
References
ASSOCHAM (2011). Mobile Value Added Services (MVAS) - A vehicle to usher in inclusivegrowth and bridge the digital divide, The Associated Chambers of Commerce and Industry ofIndia (ASSOCHAM), January 2011.
Business India (2009). M-commerce in India Future and Challenges faced, Business India 2.0,Para 3, August 29, 2009. Retrieved from: http://ijsid.wordpress.com/2009/08/29/m-commerce-india-the-future-challenges-faced/
Goyal, A. (2006). The impact of ICT in making global markets more inclusive, Indira GandhiInstitute of Development Research, Mumbai, December 2006.
Graeme, G. (2006). Regulating Infrastructure: The Impact on Risk and Investment. Journal ofEconomic Literature, American Economic Association, Vol. 44(4), pages 925-972.
Ilavarasan, P., & P. Malik (2010). Trend in Public and Private Investment in ICT R&D in Indiaand on the Globalization of R&D the Competitiveness of Their Innovation System in ICT.Country report prepared for a study funded by European Union.http://is.jrc.ec.europa.eu/pages/ISG/PREDICT/documents/ICT2RandDIndiafinal18012011.pdfMalik, P. (2007). An Analysis of the Reform’s of India Telecommunication’s Industry: Policy, Regulation andIndicators, LIRNEasia Multi component 6 country study. Available at http://www.lirneasia.net/wp-content/uploads/2007/04/malik-2007-6cmcs-india.pdf.
Malik, P. (2010). Telecom Regulatory and Policy Environment in India: Results and Analysis ofthe 2008 TRE Survey, http://papers.ssrn.com/sol3/papers.cfm?abstract_id=1555459,
Malik, P. & R. Mundhe (2010). Statistical Compilation of the ICT Sector and Policy Analysis-India Country Report.http://www.orbicom.ca/index.php?option=com_content&task=view&id=1191&Itemid=1191ORBICOM, UNESCO.
Planning Commission (2006). Consultation paper on Approach to Regulation: Issues andOptions, Planning Commission of India, New Delhi.
Samarajiva, et al. (2007). Telecom Regulatory Environment (TRE) assessment: Methodologyand implementation results from five emerging economies, LIRNEasia. Retrieved from:http://www.lirneasia.net/wp-content/uploads/2008/05/lirneasia-tre-paper-for-tprc-v8.pdf
Samarajiva, R. & A. Dokeniya (2004). Regulation and Investment: Sri Lanka Case Study,Discussion Paper WDR, World Dialogue for Regulation for Network Economies. Retrievedfrom: www.regulateonline.org.
Samarajiva, R. (2009). How the developing world may participate in the global InternetEconomy: Innovation driven by competition? Report for Joint Workshop on “Policy coherencein the application of information and communication technologies for development,” organizedby the Organization for Economic Co-operation and Development (OECD) and the Informationfor Development Program (infoDev), World Bank, 10-11 September 2009, Paris, France
ICT Sector Performance Review for India – DRAFT VERSION NOT FOR CITATION
48
Schafran, D. (2010). mHealth India: Untapped Potential & The Innovative Groups Paving theWay, TriplePundit, November 18, 2010. Retrieved from:http://www.triplepundit.com/2010/11/mhealth-india-mobile-health/
Singh, A. (2010). M-Governance : Service On-the-go, Voice & Data, January 05,2010. Retrievedfrom: http://voicendata.ciol.com/content/NetworkingPlus/110010501.asp (accessed on April 12,2011)
TRAI (2009). Recommendations On An Approach to Rural Telephony –Suggested Measures foran Accelerated Growth, March 19th 2009. Retrieved from:http://www.trai.gov.in/WriteReadData/trai/upload/Recommendations/113/recom19mar09.pdf
TRAI (2010). Recommendations on National Broadband Plan, Telecom Regulatory Authority ofIndia (TRAI). Retrieved from:http://www.trai.gov.in/WriteReadData/trai/upload/Recommendations/124/Broadbandrecommendation08_12_10final.pdf.
TRAI (2011). Consultation Paper on Issues related to Infrastructure Policy, Telecom RegulatoryAuthority of India (TRAI).
Vijayabaskar, M. & B. Parthasarathy (2003). Diffusion of Information and CommunicationTechnologies in India: Labour Market Implications for Developing Countries: Final Report,Indian Institute of Information Technology, Bangalore (IIIT-B) India, July 31, 2003.
Vital Analytics (2009). Market Report: Mobile Banking in India used by 40 Million UrbanIndians (2009), Pluggd.in. Retrieved from: http://www.pluggd.in/mobile-banking-in-india-market-report-297/
Waverman, L. and K. Dasgupta (2009). How to Maximize the Economic Impact of MobileCommunications: The Four Waves, Global Information Technology Report 2008-09, Mobility ina networked world, Geneva: World Economic Forum and INSEAD.