Embed Size (px)
Citation preview

1
Draft Report for LIRNEasia Comments
ICT Sector Performance Review for
Sri Lanka
April, 2011
Written by Buddhika Brahmanage & Harini Weerasekera of the Institute of Policy Studies of Sri Lanka
under the guidance of Malathy Knight & Anushka Wijesinha of the Institute of Policy Studies of Sri Lanka
[email protected] 100/20 Independence Avenue, Colombo 7
Tel +94‐11‐2143100 Mobile +94‐777788056 Fax +94‐11‐2665065 URL http://www.ips.lk
http://ipslk.blogspot.com
This research was carried out with the aid of a grant from the International Development Research Center (Canada) and the Department for International Development (United Kingdom). The report is part of LIRNEasia’s Sector Performance Review (SPR)/Telecom Regulatory Environment (TRE) research project. The 2008 and 2006 TRE country reports are available at www.lirneasia.net
The authors gratefully acknowledge the co‐operation and participation by the key stakeholders in the TRE survey 2010.
2
Contents List of Tables ................................................................................................................................................. 4
List of Figures ................................................................................................................................................ 5
List of Acronyms ............................................................................................................................................ 6
1. Executive Summary ............................................................................................................................... 9
2. Sri Lanka’s Telecom Sector: a Macroeconomic Perspective ............................................................... 11
3. Market Structure and Market Dynamics ............................................................................................ 15
3.1 Overall Market Structure .................................................................................................................. 15
3.2 Trends in Market Shares ................................................................................................................... 18
3.2.1 Fixed Sector ................................................................................................................................ 18
3.2.2 Mobile Sector ...................................................................................................................... 20
3.2.3 Broadband Sector ...................................................................................................................... 22
3.3 Pricing and Profitability ..................................................................................................................... 23
4. ICT infrastructure: availability, affordability and quality ........................................................................ 25
4.1 Domestic Infrastructure .................................................................................................................... 25
4.2 International Connectivity ................................................................................................................ 28
4.3 Looking Forward ............................................................................................................................... 29
5. Beyond Telecom: E‐Applications, Services, Human Resources, Innovation ........................................... 30
5.1 E‐Applications and Services .............................................................................................................. 30
5.1.1 Introduction ............................................................................................................................... 30
5.1.2 Innovative Applications in Telecom: Financial and Agricultural Sectors ................................... 32
5.1.3 Agricultural/Informal Sector: Innovative applications as an effective tool to bridge the gap between the rich and poor ................................................................................................................. 33
5.1.4 Other Initiatives ......................................................................................................................... 34
5.2 Human Resources and Innovation .................................................................................................... 39
6. Sri Lanka’s Telecom Regulatory and Policy Environment ....................................................................... 41
6.1 Evolution of Telecom Regulatory Environment ................................................................................ 41
6.2 Regulatory and Policy Instruments ................................................................................................... 43
6.2.1 Policy .......................................................................................................................................... 43
6.2.2 Acts ............................................................................................................................................. 44
6.2.3 Rules ........................................................................................................................................... 44
6.2.4 Orders ........................................................................................................................................ 45
3
6.3 Structure of the Regulatory and Policy Environment and Responsibilities of Regulatory Institutions ................................................................................................................................................................ 46
6.4 Regulatory Commission and Regulatory Capture ............................................................................. 46
6.5 Funding the Telecom Regulatory Commission ................................................................................. 47
6.5.1 Taxes .......................................................................................................................................... 47
6.5.2 Other .......................................................................................................................................... 47
6.6 Accountability of the Telecom Regulatory Commission ................................................................... 48
6.7 Uncertainty, Risk and Investment ..................................................................................................... 48
7. Effectiveness of the Telecom Policy and Regulatory Environment ........................................................ 50
7.1 Overall scores .................................................................................................................................... 50
7.2 Market Entry ..................................................................................................................................... 52
7.3 Allocation of Scarce Resources ......................................................................................................... 54
7.4 Interconnection ................................................................................................................................. 55
7.5 Tariff Regulation ................................................................................................................................ 57
7.6 Regulation of Anti‐Competitive Practices ......................................................................................... 58
7.7 Universal Service Obligation (USO) ................................................................................................... 60
7.8 Quality of Service (QoS) .................................................................................................................... 61
8. TRE Stakeholder Perceptions: Concluding Remarks ............................................................................... 62
Annexure ..................................................................................................................................................... 64
Annex 1: What is a Telecom Regulatory Environment (TRE) Assessment? ............................................ 64
Annex 1A: TRE Cover Letter .................................................................................................................... 71
Annex 1B: TRE Questionnaire ................................................................................................................. 72
Annex 1C: TRE Summary of Regulatory Events ...................................................................................... 78
Annex 1C: TRE Summary of Regulatory Events ...................................................................................... 78
Annex: 2: Structure of Sri Lanka’s Telecom Regulatory Environment .................................................... 79
Annex 3: Dialog GSM Coverage .............................................................................................................. 80
Annex 4: Dialog 3G/3.5G Coverage ........................................................................................................ 81
Annex 5: Provincial Distribution of Fixed Phones in Sri Lanka as at December 2010 ............................. 82
Annex 6: Coverage by Mobitel ................................................................................................................ 83
Bibliography ................................................................................................................................................ 84

4
List of Tables
Table 1: GDP Per Capita and GDP Growth Rate .......................................................................................... 11 Table 2: Growth of Telecom Sector and its Contribution to GDP ............................................................... 11 Table 3: Growth in ICT Contribution Towards GDP .................................................................................... 12 Table 4: Contribution to Government Revenue by Government Entities (Rs. Millions) ............................ 13 Table 5: Telecom Operators in Each Sub‐sector ......................................................................................... 15 Table 6: Number of Fixed, Mobile, and Broadband Subscribers ................................................................ 16 Table 7: Annual Cost of a 256kbps Broadband Business Connection ......................................................... 17 Table 8: Changes in Market Shares of Fixed Operators (Subscriber Based) ............................................... 20 Table 9: Mobile Penetration ....................................................................................................................... 21 Table 10: Changes in Market Shares of Mobile Operators (Subscriber Based) .......................................... 21 Table 11: Revenue Indicators of Dialog and Mobitel .................................................................................. 24 Table 12: Snapshot of recent adoption of e‐commerce/e‐business and BPO strategies: .......................... 31 Table 13: Financial Sector‐ Innovative mobile enabled financial services .................................................. 32 Table 14: Innovative Mobile‐enabled Agricultural Services ....................................................................... 34 Table 15: List of key policy and regulatory events in Sri Lanka 1980 ‐ 2011 .............................................. 41 Table 16: Comparing the average TRE scores for 2006, 2008 and 2010 .................................................... 52
5
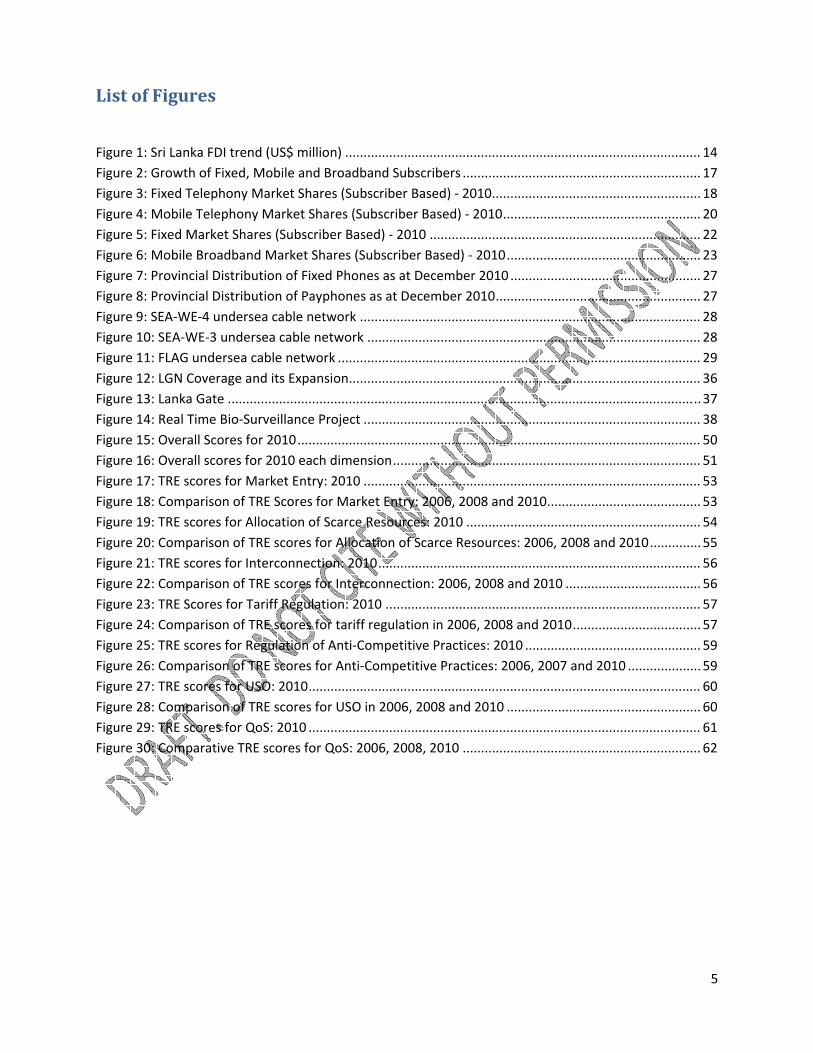
List of Figures
Figure 1: Sri Lanka FDI trend (US$ million) ................................................................................................. 14 Figure 2: Growth of Fixed, Mobile and Broadband Subscribers ................................................................. 17 Figure 3: Fixed Telephony Market Shares (Subscriber Based) ‐ 2010......................................................... 18 Figure 4: Mobile Telephony Market Shares (Subscriber Based) ‐ 2010 ...................................................... 20 Figure 5: Fixed Market Shares (Subscriber Based) ‐ 2010 .......................................................................... 22 Figure 6: Mobile Broadband Market Shares (Subscriber Based) ‐ 2010 ..................................................... 23 Figure 7: Provincial Distribution of Fixed Phones as at December 2010 .................................................... 27 Figure 8: Provincial Distribution of Payphones as at December 2010 ........................................................ 27 Figure 9: SEA‐WE‐4 undersea cable network ............................................................................................. 28 Figure 10: SEA‐WE‐3 undersea cable network ........................................................................................... 28 Figure 11: FLAG undersea cable network ................................................................................................... 29 Figure 12: LGN Coverage and its Expansion ................................................................................................ 36 Figure 13: Lanka Gate ................................................................................................................................. 37 Figure 14: Real Time Bio‐Surveillance Project ............................................................................................ 38 Figure 15: Overall Scores for 2010 .............................................................................................................. 50 Figure 16: Overall scores for 2010 each dimension .................................................................................... 51 Figure 17: TRE scores for Market Entry: 2010 ............................................................................................ 53 Figure 18: Comparison of TRE Scores for Market Entry: 2006, 2008 and 2010 .......................................... 53 Figure 19: TRE scores for Allocation of Scarce Resources: 2010 ................................................................ 54 Figure 20: Comparison of TRE scores for Allocation of Scarce Resources: 2006, 2008 and 2010 .............. 55 Figure 21: TRE scores for Interconnection: 2010 ........................................................................................ 56 Figure 22: Comparison of TRE scores for Interconnection: 2006, 2008 and 2010 ..................................... 56 Figure 23: TRE Scores for Tariff Regulation: 2010 ...................................................................................... 57 Figure 24: Comparison of TRE scores for tariff regulation in 2006, 2008 and 2010 ................................... 57 Figure 25: TRE scores for Regulation of Anti‐Competitive Practices: 2010 ................................................ 59 Figure 26: Comparison of TRE scores for Anti‐Competitive Practices: 2006, 2007 and 2010 .................... 59 Figure 27: TRE scores for USO: 2010 ........................................................................................................... 60 Figure 28: Comparison of TRE scores for USO in 2006, 2008 and 2010 ..................................................... 60 Figure 29: TRE scores for QoS: 2010 ........................................................................................................... 61 Figure 30: Comparative TRE scores for QoS: 2006, 2008, 2010 ................................................................. 62

6
List of Acronyms
2G Second Generation 3G Third Generation ADSL Asymmetric Digital Subscriber Line ARPU Average Revenue Per Unit BMD Birth Marriage and Death BOI Board of Investment BPO Business Process Outsourcing BSNL Bharat Sanchar Nigam Limited CAA Consumer Affairs Authority CDMA Code Division Multiple Access CPI Corruption Perception Index CPP Calling Party Pays CSE Colombo Stock Exchange DCS Department of Census and Statistics EBITDA Earnings Before Interest, Taxes, Depreciation and Amortization EGO External Gateway Operators FDI Foreign Direct Investment FLAG Fibre Optic Link Around the Globe GATS General Agreement on Trade in Services GDP Gross Domestic Product GoSL Government of Sri Lanka GPRS General Packet Radio Service GSM Global System for Mobile Communications ISP Internet Service Provider HSPA High Speed Packet Access ICT Information Communication Technology ICTA Information Communication Technology Agency IDA International Development Association IFC International Finance Corporation ITeS Information Technology‐enabled Services KAM Knowledge Assessment Methodology LBO Lanka Business Online LGN Lanka Government Network Project MNP Mobile Number Portability NDB National Development Bank NGN Next Generation Network PPP Public Private Partnership
7
PUCSL Public Utilities Commission of Sri Lanka QoS Quality of Service SE‐ME‐WE South‐East Asia‐ Middle East‐ Western Europe SIM Subscriber Identity Module SLT Sri Lanka Telecom SLICTA Sri Lanka Information and Communication Technology Association TRC Telecommunications Regulatory Commission TRE Telecom Regulatory Environment USF Universal Service Fund USO Universal Service Obligation UT Usaha Tegas VAT Value Added Tax VSAT Very Small Aperture Terminal WiMAX Worldwide Interoperability for Microwave Access WTO World Trade Organizations

8

9
1. Executive Summary
The telecom sector in Sri Lanka is one of the country's most dynamic sectors, contributing significantly both directly and indirectly to investment, employment, productivity, innovation, and overall economic growth. The expansion of information and communications technology (ICT) is a major objective under Sri Lanka’s development vision of becoming the ‘Emerging Wonder of Asia’ as outlined in the Mahinda Chintana – Vision for the Future: the development plan set forth by the government in 2010. As set out in the international literature and evidenced in the reform process in countries around the world, regulatory governance plays a significant role in policy outcomes and sector performance. The objective of this report is to evaluate regulatory efficacy as it pertains to Sri Lanka’s telecom sector; to understand the dynamics between regulatory governance and sector performance; and, to get to informed and relevant conclusions targeting policy makers, operators, and the regulator.
The 2010 Telecom Regulatory Environment survey (TRE) is a perception assessment where informed stakeholders assess telecom regulatory efficacy, with respect to seven dimensions in the fixed, mobile and broadband sectors: market entry, access to scarce resources, interconnection, tariff regulation, anti‐competitive practices, Universal Service Obligations (USOs) and Quality of Service (QoS). Key regulatory and policy events from the latter part of 2009 to the beginning of 2011 provide the contextual background for the survey questionnaire. This report also compares the TRE scores for 2010 with that of 2006 and 2008, capturing perception trends over three periods and providing a more comprehensive analysis of regulatory governance and sector performance over time.
The results of the 2010 TRE survey indicate a below average score across all seven dimensions, with two of the seven dimensions demonstrating significantly lower scores: allocation of scarce resources and regulation of anti‐competitive practices. When comparing the survey results with that of 2006 and 2008, allocation of scarce resources and market entry in the mobile sector show a declining trend.
Our analysis indicates that the TRE scores for interconnection in the mobile sub‐sector, and quality of service in the broadband sub‐sector, pose a contradiction to the events that took place in the regulatory and policy space: mobile sector scores for interconnection remain static over 2008 and 2010 and broadband scores for quality of service have declined over the same period despite regulations adopted to address these dimensions. Furthermore, we find that disparities between the definition of a particular parameter as outlined in the questionnaire, and the stakeholder perception of that particular parameter affects the outcome of survey results. For instance, stakeholders perceived the USO dimension as universal access in service and not as the governance of the Universal Service Fund (USF) as defined in the TRE questionnaire.
It is evident from the analysis set out in the report that the growth of the telecom sector has been largely driven by dynamism in the sector given inherent and rapid technological advances. In general, Sri Lanka’s telecom sector has been unable to realize its potential owing to various deficiencies in the regulatory environment.
10
The deficiencies mentioned above can be broadly categorized into three, namely, the lack of workable concurrent jurisdiction, absence of workable independence and lack of transparency in regulatory procedures.
Based on our analysis of the TRE survey, of events in the policy and regulatory space and of sector performance we set out a number of key policy and regulatory measures: liberalize the ownership of bottleneck resources such as backbone and landing stations, establish a formal access pricing system for the use of these resources, formulate sui generis anti‐competitive legislation and make the TRC accountable to Parliament rather than to a single ministry.

11
2. Sri Lanka’s Telecom Sector: a Macroeconomic Perspective
Sri Lanka is a middle‐income country with a per capita income of US$ 2,399 in 2010, which is an increase of 16.6 per cent from the 2009 per capita income of US $ 20531. According to the 2009 Annual Report published by the Central Bank of Sri Lanka, the country recorded a GDP growth rate of 4.8 per cent in 2009 (Table 1). This is considerably lower than the growth rates of both 2007 and 2008. The combined impact of the global recession and the heightened military drive at the final stages of the war in the North and East were the main reasons for this dip in 2009. However, the economy revived significantly by 2010 recording a GDP growth rate of 8 per cent,2 fuelled by post war economic expansion, combined with renewed optimism.
Table 1: GDP Per Capita and GDP Growth Rate
Year GDP Per Capita at Market Price(US$) GDP Growth Rate (%)
2007 1,634 6.8 2008 2,014 6.0 2009 2,053 3.5 2010 2,399 8.0
Source: (Central Bank of Sri Lanka, 2009)
The country’s population of 20,450,000 has a literacy rate of 90.8 per cent, the highest in the South Asian region as at 20113. A high literacy rate enables people to make use of new technological developments, a crucial factor in telecom sector development. However, a study done by the Sri Lanka Information and Communication Technology Association (SLICTA) showed that while the demand for IT graduates in 2007 was 5755 the supply in that same year was only 2216. Steps have been taken to reduce this gap (as extensively discussed in Section 5).
Table 2: Growth of Telecom Sector and its Contribution to GDP
2008 2009 2010
Growth of telecom sector (%) 22.30 11.7 15.1
Share of GDP (%) 1.6 1.7 1.8
Contribution to GDP (%) 5.1 5.2 2.8 Sources: The Telecom Regulatory Commission (TRC), the Department of Census and Statistics (DCS) and the Central Bank of Sri Lanka
The Sri Lankan telecom sector is one of the most dynamic sectors of the economy. It consists of 4 fixed line, 5 mobile, 14 data communications and 32 external gateway operators as shown in Table 5 of Section 3 of this report. Although faltering in its growth momentum in 2009 by dropping to a growth rate of 11.7 per cent from a healthy 22.3 per cent in 2008, the sector recorded a growth rate of 15.1 per cent in 2010 (Table 2). It is a key contributor to national income with a contribution of 5.2 per cent in
1 (Lanka Business Online, 2011) 2 (Official Government Website of Sri Lanka, 2011) 3 (Daily Financial Times, 2011)
12
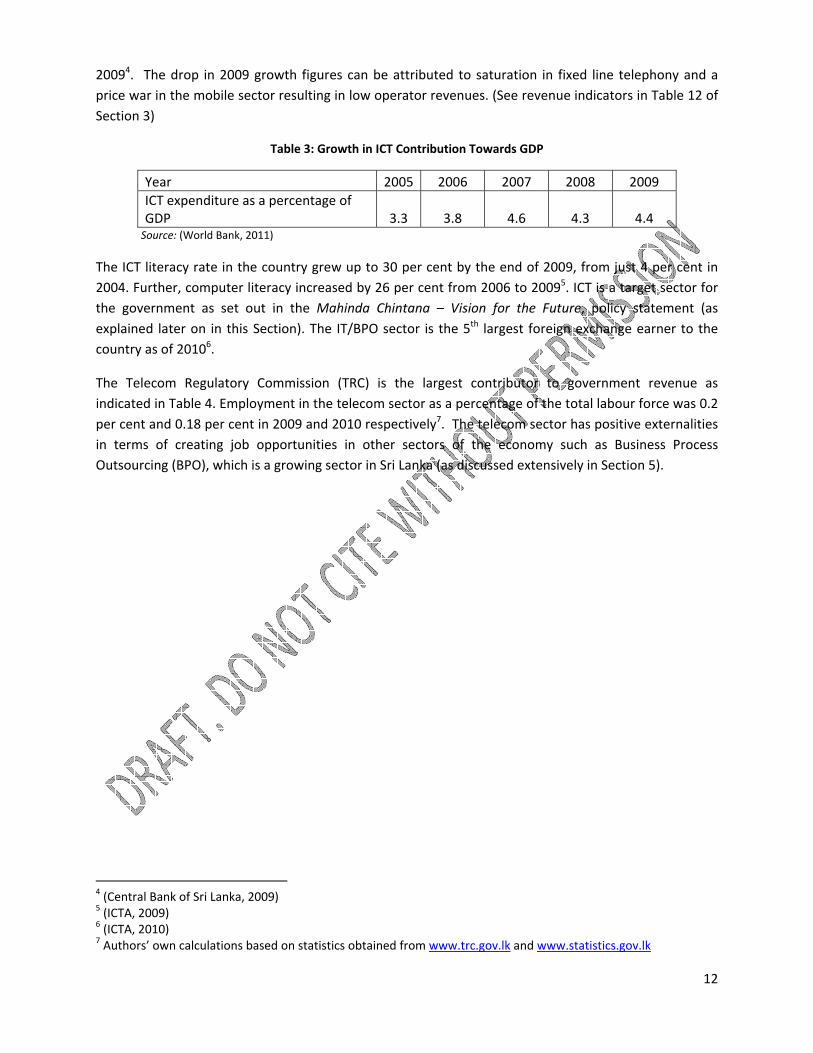
20094. The drop in 2009 growth figures can be attributed to saturation in fixed line telephony and a price war in the mobile sector resulting in low operator revenues. (See revenue indicators in Table 12 of Section 3)
Table 3: Growth in ICT Contribution Towards GDP
Year 2005 2006 2007 2008 2009 ICT expenditure as a percentage of GDP 3.3 3.8 4.6 4.3 4.4
Source: (World Bank, 2011)
The ICT literacy rate in the country grew up to 30 per cent by the end of 2009, from just 4 per cent in 2004. Further, computer literacy increased by 26 per cent from 2006 to 20095. ICT is a target sector for the government as set out in the Mahinda Chintana – Vision for the Future, policy statement (as explained later on in this Section). The IT/BPO sector is the 5th largest foreign exchange earner to the country as of 20106.
The Telecom Regulatory Commission (TRC) is the largest contributor to government revenue as indicated in Table 4. Employment in the telecom sector as a percentage of the total labour force was 0.2 per cent and 0.18 per cent in 2009 and 2010 respectively7. The telecom sector has positive externalities in terms of creating job opportunities in other sectors of the economy such as Business Process Outsourcing (BPO), which is a growing sector in Sri Lanka (as discussed extensively in Section 5).
4 (Central Bank of Sri Lanka, 2009) 5 (ICTA, 2009) 6 (ICTA, 2010) 7 Authors’ own calculations based on statistics obtained from www.trc.gov.lk and www.statistics.gov.lk

13
Table 4: Contribution to Government Revenue by Government Entities (Rs. Millions)
Entity 2008 2009 2010
(estimated)
TRC 3,500 (US$ 31.5 mn) 3321 (US$ 29.9 mn) 8000 (US$ 72.0mn)
Sri Lanka Telecom 2,000 (US$ 18.0 mn) 893 (US$ 8.0 mn) 240 (US$ 2.0 mn)
Bank of Ceylon 1,846 (US$ 16.7 mn) 1346 (US$ 12.1 mn) 2346 (US$ 21.1 mn)
(National Savings Bank 1,560 (US$ 14.0 mn) 1810 (US$ 16.3 mn) 1060 (US$ 9.5 mn) Source: (Ministry of Finance and Planning, Various Years)
Data on Foreign Direct Investment (FDI) in telecom is not published by the country’s key investment promotion agency, the Board of Investment (BOI). However, a prominent online business news site, Lanka Business Online (LBO) indicated that the telecom sector generated the highest FDI during the first half of 2010; a contribution of US$ 85 million to a total of US$ 208 million8. The year 2007 saw a peak in FDI in the telecom sector with Dialog signing an agreement with the BOI to invest US$300 million in the country followed by the new entrant Bharti Airtel Lanka investing a sum of US$ 100 million. These agreements accounted for well over half of approved FDI to the country in 2007.
However the telecom sector, which was the leading sub‐sector in FDI inflows in 2008 (62 per cent)9, now faces a declining trend (less than 40 per cent). However, this maybe owing to the FDI inflows to the tourism sector in the aftermath of the war, which is higher in relative terms compared to that of telecom.
The Corruption Perceptions Index (CPI) by Transparency International ranks Sri Lanka 91st among 178 countries in 2010. India (87) and China (78) rank higher than Sri Lanka in this index, posing an obstacle to the Sri Lankan investment climate in attracting FDI. Furthermore, the ongoing revamping and restructuring of the BOI has put FDI projects in 8 sectors on hold, which also impacts negatively on the investment climate10. The overall FDI inflows to the country, as shown below, correspond with the above trends.
8 (Lanka Business Online, 2010) 9 (The Bottom Line, 2009) 10 (The Sunday Times, 2010)

14
Figure 1: Sri Lanka FDI trend (US$ million)
Source: (Central Bank, Various Years)
The end of the conflict in the North and East in 2009 has brought about significant changes to the Sri Lankan economy. The government has launched large‐scale development scheme in several parts of the country with the aim of transforming Sri Lanka into the “Emerging Wonder of Asia”. According to the Mahinda Chintana – Vision for the Future, the development plan put forth by the government in 2010, Sri Lanka is to be developed into a five‐fold hub in the region – maritime, naval, aviation, commercial, energy and knowledge11. The telecom sector has a crucial role to play in this regard. Hence, the following strategies have been drawn out with regard to the ICT sector, in this policy document.
• A minimum of 10 'e‐life' centres to be set up per Divisional Secretariat with a view to draw school leavers towards employment in computer and allied fields.
• A faculty of Information and Communication Technology to be established in each university. • Target to achieve 75 per cent ICT literacy by 2016. • Formulating a National Information and Communication Technology Policy.
Apart from the Vision for the Future document, a Ten Year Development Plan was also put forth in 2006, which sets the following targets to be achieved by 2016 12
• Increase the fixed teledensity13 from 9 in 2006 to 30 by 2016. • Increase the cellular (mobile) subscribers from 5.4 million in 2006 to 16 million in 2016. • Increase the number of data communication connections from the current level of 0.13 million
to 5 million by 2016.
These development plans may help boost the Sri Lankan telecom sector. The 2007 World Bank report, Building Sri Lanka’s Knowledge Economy,14 indicates that despite the rapid growth in the telecom industry, the country has not improved in both telecom‐related indicators – telephones per 1,000 people and internet users per 1,000 people. According to the Knowledge Assessment Methodology
11 (Ministry of Finance and Planning, 2011) 12 (The Telecom Regulatory Commission, 2010) 13 The number of fixed access telephones for every 100 persons 14 (World Bank, 2007)
15
(KAM) outlined in this report, Sri Lanka is lagging behind its regional counterparts like Malaysia, Thailand, and Philippines in ICT sector development.
The Sections that follow will analyse to what extent Sri Lanka has overcome these issues, with detailed analysis of telecom sector performance; finally linking to how telecom regulatory governance affects the sector’s performance.
3. Market Structure and Market Dynamics
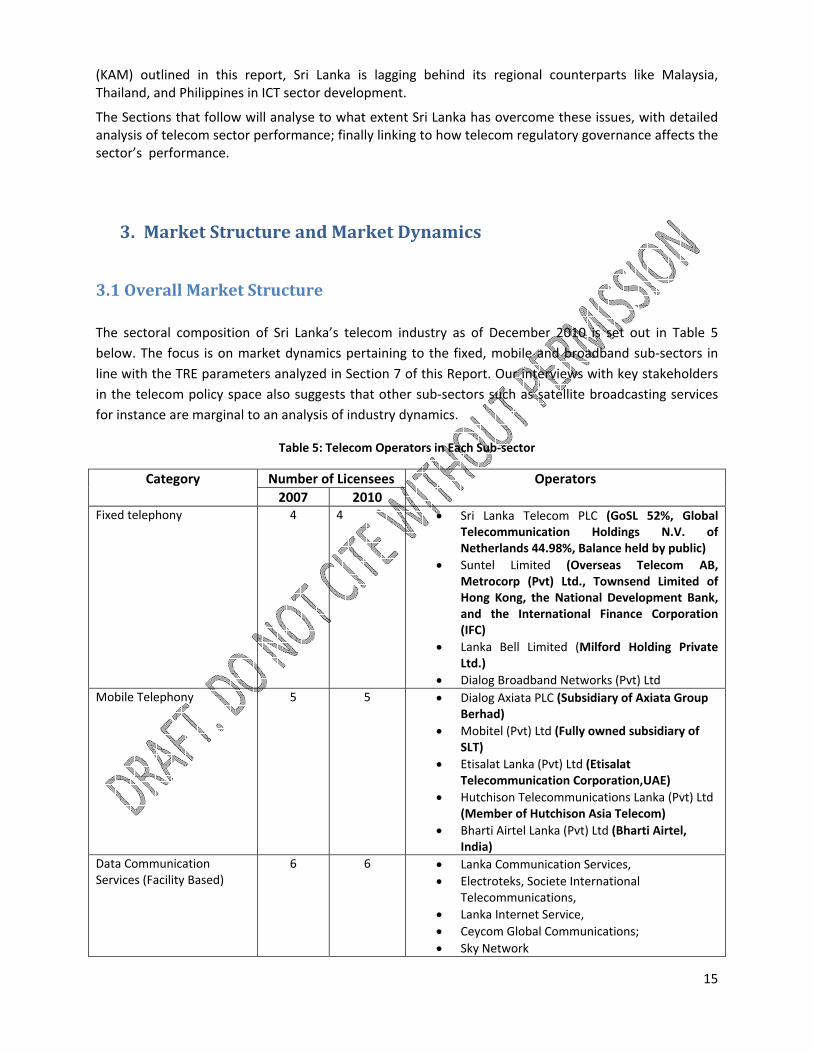
3.1 Overall Market Structure The sectoral composition of Sri Lanka’s telecom industry as of December 2010 is set out in Table 5 below. The focus is on market dynamics pertaining to the fixed, mobile and broadband sub‐sectors in line with the TRE parameters analyzed in Section 7 of this Report. Our interviews with key stakeholders in the telecom policy space also suggests that other sub‐sectors such as satellite broadcasting services for instance are marginal to an analysis of industry dynamics.
Table 5: Telecom Operators in Each Sub‐sector
Category Number of Licensees Operators 2007 2010
Fixed telephony 4 4 • Sri Lanka Telecom PLC (GoSL 52%, Global Telecommunication Holdings N.V. of Netherlands 44.98%, Balance held by public)
• Suntel Limited (Overseas Telecom AB, Metrocorp (Pvt) Ltd., Townsend Limited of Hong Kong, the National Development Bank, and the International Finance Corporation (IFC)
• Lanka Bell Limited (Milford Holding Private Ltd.)
• Dialog Broadband Networks (Pvt) Ltd Mobile Telephony 5 5 • Dialog Axiata PLC (Subsidiary of Axiata Group
Berhad) • Mobitel (Pvt) Ltd (Fully owned subsidiary of
SLT) • Etisalat Lanka (Pvt) Ltd (Etisalat
Telecommunication Corporation,UAE) • Hutchison Telecommunications Lanka (Pvt) Ltd
(Member of Hutchison Asia Telecom) • Bharti Airtel Lanka (Pvt) Ltd (Bharti Airtel,
India) Data Communication Services (Facility Based)
6 6 • Lanka Communication Services, • Electroteks, Societe International
Telecommunications, • Lanka Internet Service, • Ceycom Global Communications; • Sky Network
16
Data Communication Services (Non‐facility Based)
24* 7 • Eureka Technology partners, • Dialog Broadband Networks, • Etisalat Lanka, • Dialog Axiata PLC, • Sierra Information Technologies, • Mobitel (Pvt) Ltd, • Vectone Lanka
Public Payphone Services 2 2 • Tritel Services • SLT Pay Phones
Trunked Mobile Radio Network Services
2 1 • Dynacom (Trunk Net) Engineering (Pvt) Ltd
External Gateway Operators (EGOs)
33 33 • All 33 EGOS fall into fixed, mobile or broadband categories
Satellite Broadcasting Services
2 4 • Future Satcom Holdings, • Dialog Television (Pvt) Ltd, • Lanka Broadband Networks, • City Cable Links
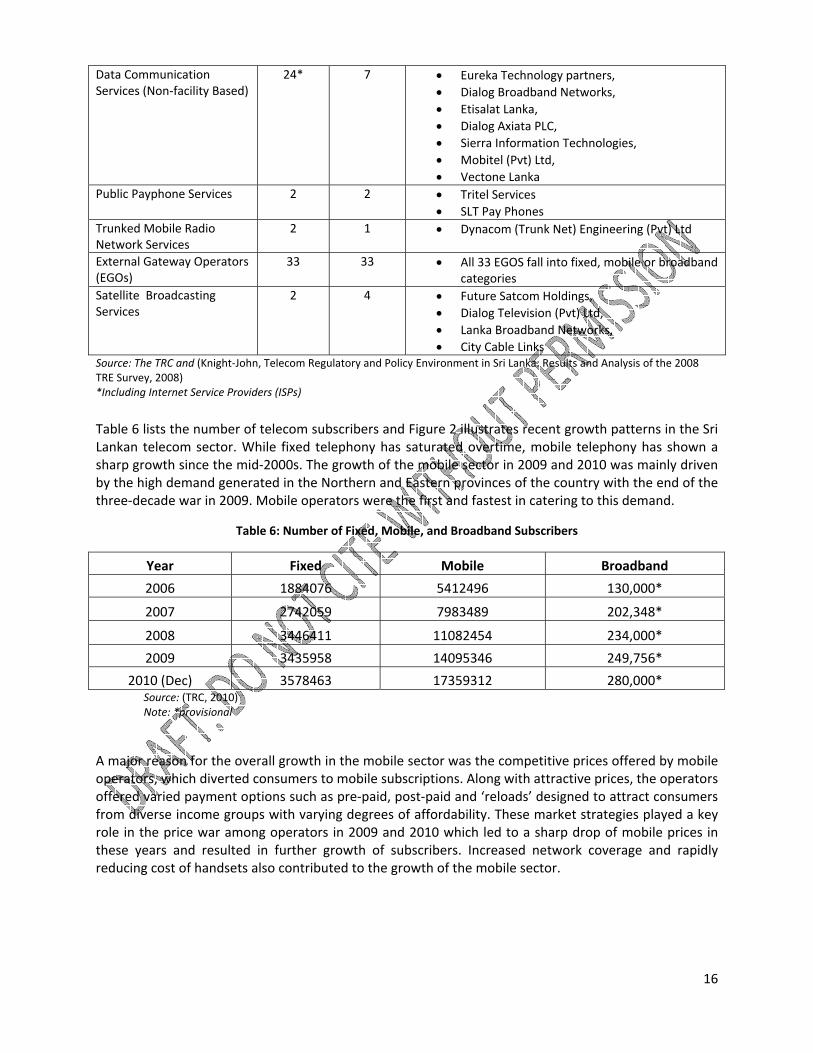
Source: The TRC and (Knight‐John, Telecom Regulatory and Policy Environment in Sri Lanka: Results and Analysis of the 2008 TRE Survey, 2008) *Including Internet Service Providers (ISPs) Table 6 lists the number of telecom subscribers and Figure 2 illustrates recent growth patterns in the Sri Lankan telecom sector. While fixed telephony has saturated overtime, mobile telephony has shown a sharp growth since the mid‐2000s. The growth of the mobile sector in 2009 and 2010 was mainly driven by the high demand generated in the Northern and Eastern provinces of the country with the end of the three‐decade war in 2009. Mobile operators were the first and fastest in catering to this demand.
Table 6: Number of Fixed, Mobile, and Broadband Subscribers
Year Fixed Mobile Broadband
2006 1884076 5412496 130,000*
2007 2742059 7983489 202,348*
2008 3446411 11082454 234,000*
2009 3435958 14095346 249,756*
2010 (Dec) 3578463 17359312 280,000* Source: (TRC, 2010) Note: *provisional
A major reason for the overall growth in the mobile sector was the competitive prices offered by mobile operators, which diverted consumers to mobile subscriptions. Along with attractive prices, the operators offered varied payment options such as pre‐paid, post‐paid and ‘reloads’ designed to attract consumers from diverse income groups with varying degrees of affordability. These market strategies played a key role in the price war among operators in 2009 and 2010 which led to a sharp drop of mobile prices in these years and resulted in further growth of subscribers. Increased network coverage and rapidly reducing cost of handsets also contributed to the growth of the mobile sector.

17
Figure 2: Growth of Fixed, Mobile and Broadband Subscribers
Source: (TRC, 2010)
Table 7: Annual Cost of a 256kbps Broadband Business Connection
Country Annual cost, 256kbps Broadband business connection (in US$)
Nepal 248 Bangladesh 618 Pakistan 114 India 143 Sri Lanka 168
Source: (Lirneasia, 2010) In contrast to mobile, the growth of broadband has not been rapid. High cost of broadband connections and monthly rentals, and the lack of access network expansion into rural areas continue to hamper broadband penetration in the country. As Table 7 indicates, Sri Lanka ranks the third highest among listed South Asian counterparts in terms of the annual cost of a 256kbps broadband business connection. The number of broadband subscribers as at December 2010 is 280,000 which is approximately 1.4 per cent of the total population. However it should be noted that the actual number of people with access to internet can be higher due to two reasons; firstly, there is significant proliferation of internet cafes
Year
Growth of S
ubscribe
rs
18
(dial‐up and broadband) in the country15. Although an internet café is counted as a single subscriber, the fact that multiple users access the internet using it is over looked. Secondly, there are a significant number of mobile users who access the internet through mobile phones. This too has not been taken into account.
3.2 Trends in Market Shares Trends in market shares of fixed, mobile, and broadband sub‐sectors, based on the pool of subscribers is described in the following subsections. The Herfindahl‐Hirschman Index (HHI)16 is included as a measure of the level of competition in the sector.
3.2.1 Fixed Sector
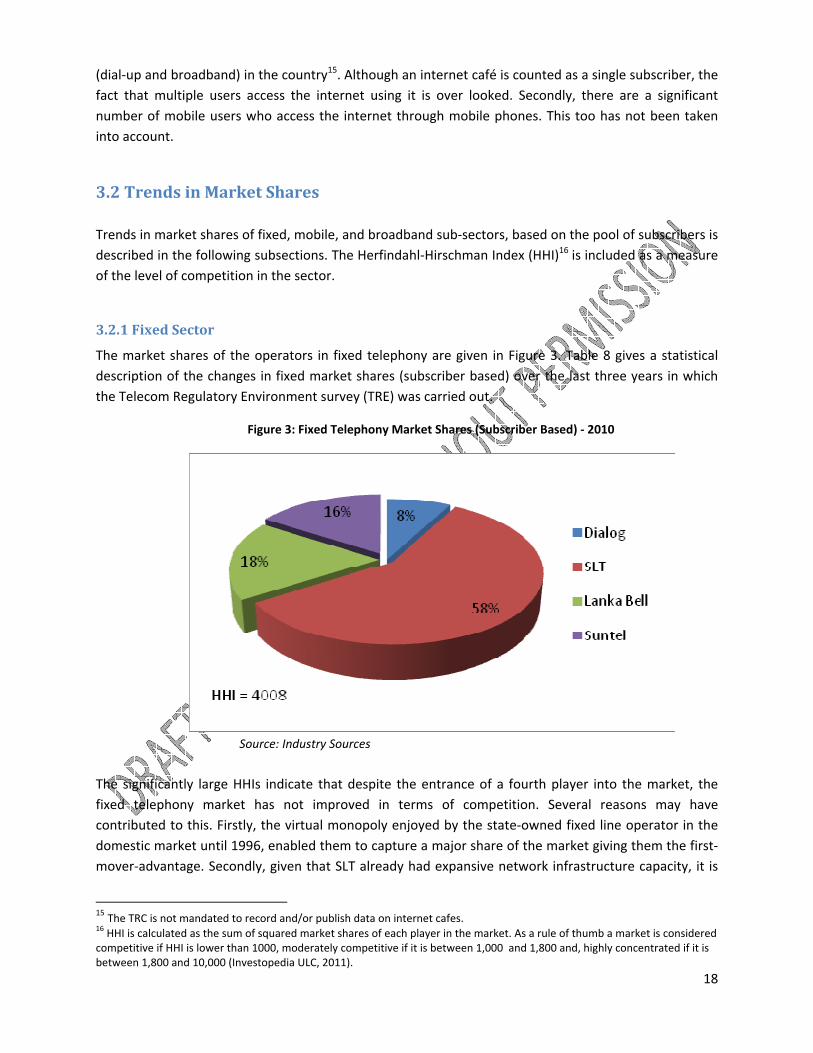
The market shares of the operators in fixed telephony are given in Figure 3. Table 8 gives a statistical description of the changes in fixed market shares (subscriber based) over the last three years in which the Telecom Regulatory Environment survey (TRE) was carried out.
Figure 3: Fixed Telephony Market Shares (Subscriber Based) ‐ 2010
Source: Industry Sources
The significantly large HHIs indicate that despite the entrance of a fourth player into the market, the fixed telephony market has not improved in terms of competition. Several reasons may have contributed to this. Firstly, the virtual monopoly enjoyed by the state‐owned fixed line operator in the domestic market until 1996, enabled them to capture a major share of the market giving them the first‐mover‐advantage. Secondly, given that SLT already had expansive network infrastructure capacity, it is
15 The TRC is not mandated to record and/or publish data on internet cafes. 16 HHI is calculated as the sum of squared market shares of each player in the market. As a rule of thumb a market is considered competitive if HHI is lower than 1000, moderately competitive if it is between 1,000 and 1,800 and, highly concentrated if it is between 1,800 and 10,000 (Investopedia ULC, 2011).

19
difficult for relatively new entrants to compete in terms of price and coverage. Thirdly, the market itself has reached a point of saturation as Figure 2 indicates.
20
Table 8: Changes in Market Shares of Fixed Operators (Subscriber Based)
Operator Market Share
2006 2007 2010
SLT 63% 53% 58%
Lanka Bell 19% 31% 18%
Suntel 18% 16% 16%
Dialog17 8%
HHI 4654 4026 4008 Source: Knight‐John (2008) and industry sources
Lanka Bell shows a significant increase in market share in 2007 following its expansion with the investment of Milford Holding Private Ltd. worth of US$ 150 million in 2005. However with the entrance of Dialog into the fixed market in 2007, redistribution of market shares with a significant drop (13 per cent) in Lanka Bell shares in 2010 can be observed.
3.2.2 Mobile Sector
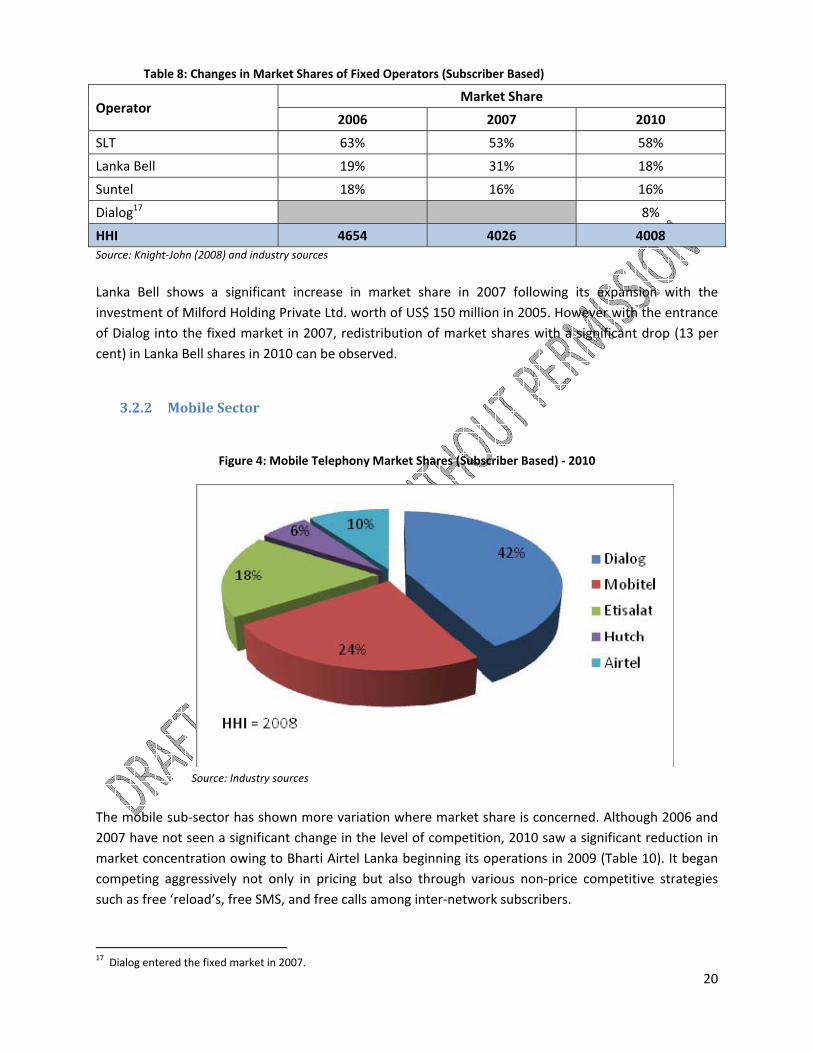
Figure 4: Mobile Telephony Market Shares (Subscriber Based) ‐ 2010
Source: Industry sources
The mobile sub‐sector has shown more variation where market share is concerned. Although 2006 and 2007 have not seen a significant change in the level of competition, 2010 saw a significant reduction in market concentration owing to Bharti Airtel Lanka beginning its operations in 2009 (Table 10). It began competing aggressively not only in pricing but also through various non‐price competitive strategies such as free ‘reload’s, free SMS, and free calls among inter‐network subscribers.
17 Dialog entered the fixed market in 2007.
21
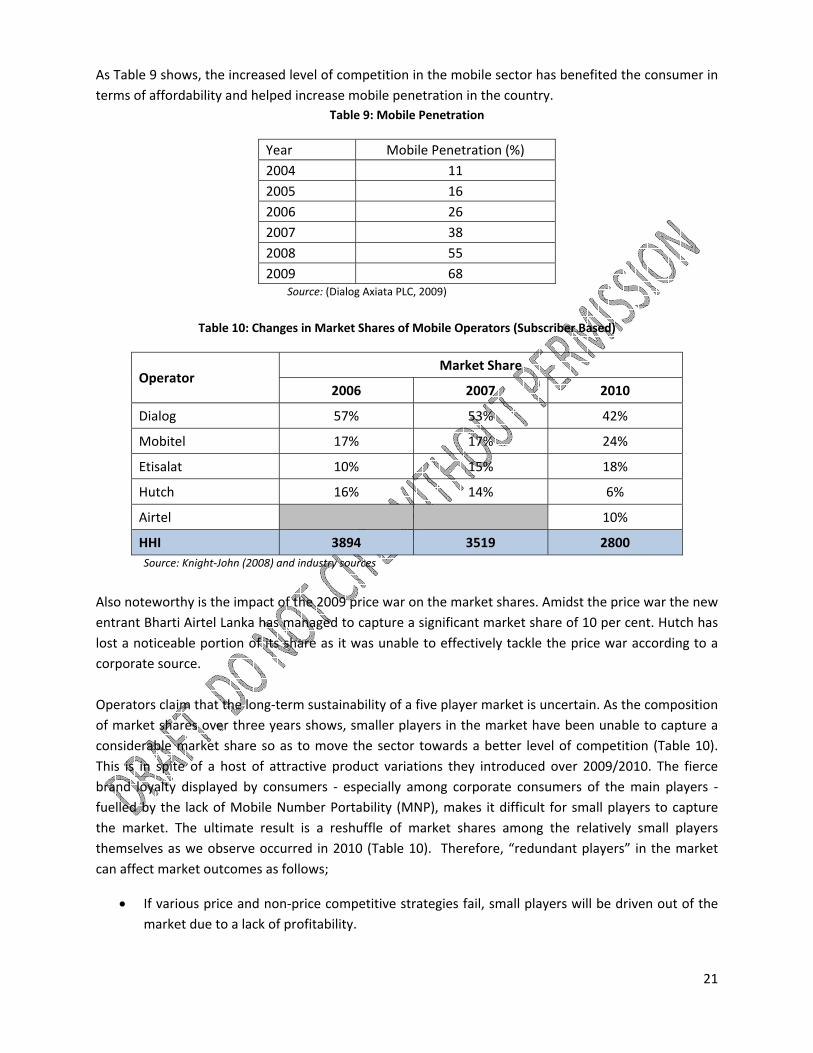
As Table 9 shows, the increased level of competition in the mobile sector has benefited the consumer in terms of affordability and helped increase mobile penetration in the country.
Table 9: Mobile Penetration
Year Mobile Penetration (%) 2004 11 2005 16 2006 26 2007 38 2008 55 2009 68
Source: (Dialog Axiata PLC, 2009)
Table 10: Changes in Market Shares of Mobile Operators (Subscriber Based)
Operator Market Share
2006 2007 2010
Dialog 57% 53% 42%
Mobitel 17% 17% 24%
Etisalat 10% 15% 18%
Hutch 16% 14% 6%
Airtel 10%
HHI 3894 3519 2800 Source: Knight‐John (2008) and industry sources
Also noteworthy is the impact of the 2009 price war on the market shares. Amidst the price war the new entrant Bharti Airtel Lanka has managed to capture a significant market share of 10 per cent. Hutch has lost a noticeable portion of its share as it was unable to effectively tackle the price war according to a corporate source. Operators claim that the long‐term sustainability of a five player market is uncertain. As the composition of market shares over three years shows, smaller players in the market have been unable to capture a considerable market share so as to move the sector towards a better level of competition (Table 10). This is in spite of a host of attractive product variations they introduced over 2009/2010. The fierce brand loyalty displayed by consumers ‐ especially among corporate consumers of the main players ‐ fuelled by the lack of Mobile Number Portability (MNP), makes it difficult for small players to capture the market. The ultimate result is a reshuffle of market shares among the relatively small players themselves as we observe occurred in 2010 (Table 10). Therefore, “redundant players” in the market can affect market outcomes as follows;
• If various price and non‐price competitive strategies fail, small players will be driven out of the market due to a lack of profitability.

22
• When profitability diminishes operators invest less in infrastructure, which affects the quality of service offered.
• Lack of investment in infrastructure prevents operators from adopting technological improvements and innovations which affects the growth of the sector as a whole.
Thus, though increased competition has benefited the consumer, overcrowding of the market has resulted in revenue shortfalls in the industry. Hence the challenge regulators and operators now face is striking a balance between these two elements.
3.2.3 Broadband Sector Although the TRC indicates the number of broadband subscribers to be only 280,000, industry stakeholders interviewed for this study point out that, according to their internal analyses, there are approximately 200,000 subscribers for fixed, and mobile broadband separately. Therefore, fixed and mobile broadband market shares have been analyzed separately in this Section. The fixed broadband market is highly concentrated with a HHI of 8200, the highest level of market concentration among all sub‐sectors in Sri Lanka. The market is dominated by SLT with a market share of 90 per cent. Again, this is owing to the substantial advantage in infrastructure network capacity over the other fixed players, especially the ownership of the international landing station which gives SLT a cost advantage.
Figure 5: Fixed Market Shares (Subscriber Based) ‐ 2010
Source: Industry Sources
On the other hand, the mobile broadband sector has seen more competition in 2010 with mobile service providers competing on General Packet Radio Services (GPRS). It is the least concentrated market in Sri Lanka after the mobile sub‐sector.

23
Figure 6: Mobile Broadband Market Shares (Subscriber Based) ‐ 2010
Source: Industry Sources
3.3 Pricing and Profitability Sri Lanka’s telecom sector managed to avoid unhealthy competition (in terms of operator revenues) until 2009. However, in the wake of a new player entering the market, Sri Lanka’s second largest mobile player (Mobitel) launched a “cut price tariff plan” – Upahara – exclusively for state sector workers18. Thus an intense price war ensued among the key players in the mobile market. This hurt the financial performance of all mobile operators as they started making losses. Table 11 shows the revenue indicators of both major mobile players falling towards 2009 when the price war was at its peak. The TRC had to introduce appropriate measures to end the price war in order to prevent the industry from incurring further losses. It imposed a floor tariff of Rs. 2.00 (US$ 0.018) on all local out‐going calls for connections sold after July 15, 2010. This measure managed to bring all mobile companies to profitability by 201119. Those firms which engaged in financial rationalization along with the floor rate saw profits as early as the fourth quarter of 201020. The timely application of price controls by the TRC thus brought the mobile telephony sub‐sector back to profitability. However, the TRC should eventually remove floor prices to ensure market competitiveness and consequently the growth of the telecom sector through competitive prices. So far, the end result of these market fluctuations have been reduced investments by telecom operators.
18 (Lanka Business Online, 2010) 19 Stakeholder interviews 20 (Lanka Business Online, 2011)

24
Table 11: Revenue Indicators of Dialog and Mobitel
Indicator Dialog Axiata PLC Mobitel (Pvt) Ltd
2007 2008 2009 2010 2007 2008 2009
EBITDA Margin 41% 22% 24% 55% N/A N/A N/A
Pre‐paid ARPU Rs. 412 Rs. 319 Rs. 223 Rs. 200 N/A N/A N/A
Post‐paid ARPU Rs. 1688 Rs. 1404 Rs. 1097 Rs. 1109 N/A N/A N/A
Growth of EBITDA N/A N/A N/A N/A 25% 71% ‐35.90%Source: Dialog Axiata PLC website, and Sri Lanka Telecom, Annual Reports. Various years.
Dialog and Mobitel (as a subsidiary of SLT) are listed in the Colombo Stock Exchange (CSE). Table 11 shows the average trends in their revenues. According to an industry stakeholder, as a general rule, operators do not re‐invest if their EBITDA margins are below 50 per cent (Lanka Business Online, 2009). Therefore, the declining trends in EBITDA margins observed in Table 11 would have led to less investment and subsequently to the depressed telecom sector growth as indicated in Table 1 of Section 2. The following quotation by a major industry operator sums up the current state of Sri Lanka’s telecom sector in terms of competition, pricing and investment;
"Before the price war each operator was spending about 150 to 200 million (US dollars) a year in capital expenditure …this year all operators put together may have invested about 150 million21."
21 (Lanka Business Online, 2009)
25
4. ICT infrastructure: availability, affordability and quality
4.1 Domestic Infrastructure Sri Lanka does not have a national telecom backbone in place as at the time of writing. The two main telecom operators Dialog and SLT maintain their own networks independently. A fibre optic network has not been sufficiently developed to carry traffic from base stations to international undersea cables.
In 2009, the TRC called for applications to build and operate a national telecom backbone under the e‐Sri Lanka Development Project with funding granted by the International Development Association (IDA). However, the government’s plans to make use of existing fibre optic network structures for the national backbone seem to have been the reason for calling off this project. On the 13th of February 2011, the official government news portal announced that there are plans to implement a national backbone network as a public private partnership (PPP) to cater to the country’s broadband needs; this too under the e‐Sri Lanka initiative. This is to be carried out in partnership with SLT, in which the government already has a 52 per cent stake, by converting their existing fibre optic transmission network into a national backbone to provide broadband connectivity to all at an affordable price.
At present Dialog and SLT are the leading owners of telecom infrastructure networks in Sri Lanka. Dialog leads mobile coverage in the country whilst SLT leads in fixed line coverage, owning the largest fibre optic cable network. Operators claim that microwave transmission which is mostly in use is insufficient to carry voice and data traffic due to inherent constrains in the technology, and that fibre optic cables have higher capacity for this purpose. Thus a national backbone network is essential to facilitate this.
Operators complain that quality of service is affected by the lack of sufficient infrastructure and that they are forced to over utilize the existing networks. For example, mobile connectivity is affected by the lack of base stations which forces operators to provide the service at half rate during peak hours; provision of multiple call connectivity using a single channel. This in turn affects call quality. Similarly internet access speed is significantly affected when multiple users attempt to log on simultaneously. Stakeholders in the industry stress the need to build more antenna towers and upgrade the backhaul as a solution. Comments by TRE respondents state that network sharing is long overdue, and would save considerable amounts of capital expenditure that is already being wasted. Thus network sharing remains an aspect which the TRC should look into in their regulatory capacity. However, partial government ownership of SLT, which is a network owner, may be a reason for this regulatory oversight as it profits from renting out network capacity to other operators.
The main fixed line operator, SLT, owns copper‐ and fibre‐based fixed lines mainly catering to metropolitan areas. This network is also used to provide Asymmetric Digital Subscriber Line (ADSL) services for data traffic. Code Division Multiple Access (CDMA) is used by all fixed line operators (classified as fixed in Sri Lanka although it is in effect a ‘mobile’ technology) to provide telecom solutions, especially to rural consumers.

26
The standard used for mobile communications in Sri Lanka is Global System for Mobile Communication (GSM). A major part of the network is Second Generation (2G) while nearly 40 per cent of mobile subscribers receive Third Generation (3G) according to an industry source. At present ADSL and Worldwide Interoperability for Microwave Access (WiMAX) are the main technologies used for fixed internet provision at retail level. WiMAX (deployed by SLT in 2005) offers broadband wireless internet connectivity over long distances, sometimes over 15 kilometers, unlike Wi‐Fi wireless devices that have very limited range. Mobile internet is provided through High Speed Packet Access (HSPA), 3G and 3.5G.
As of 2009 Dialog had the largest mobile coverage in the country, also having been the first to expand to the North and East. Their annual report for 200922 states that network expansion was commissioned 90 days after liberation of these areas. Mobitel also has fairly extensive coverage, having commissioned 2000 base stations by the end of 2009.23 Coverage is supported by the affordability of handsets (supplied duty free) which fuels demand driven mobile penetration. Fixed line penetration shows higher inequality than mobile penetration when considering the urban rural divide.24
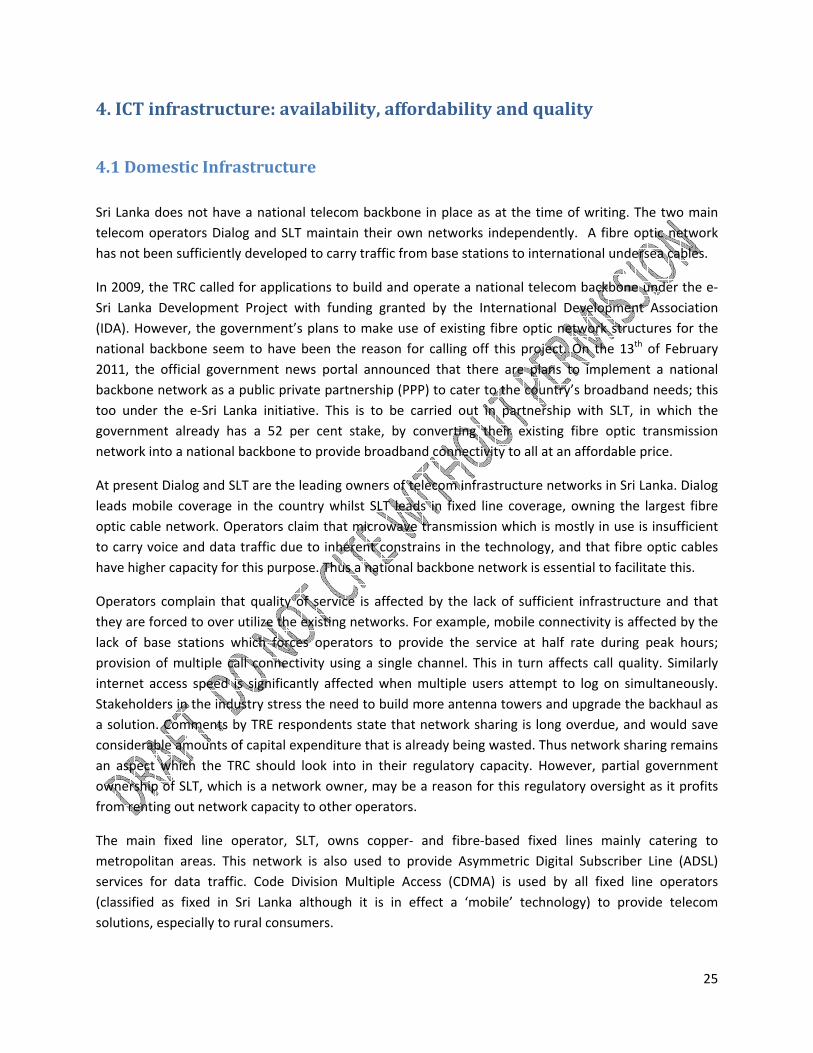
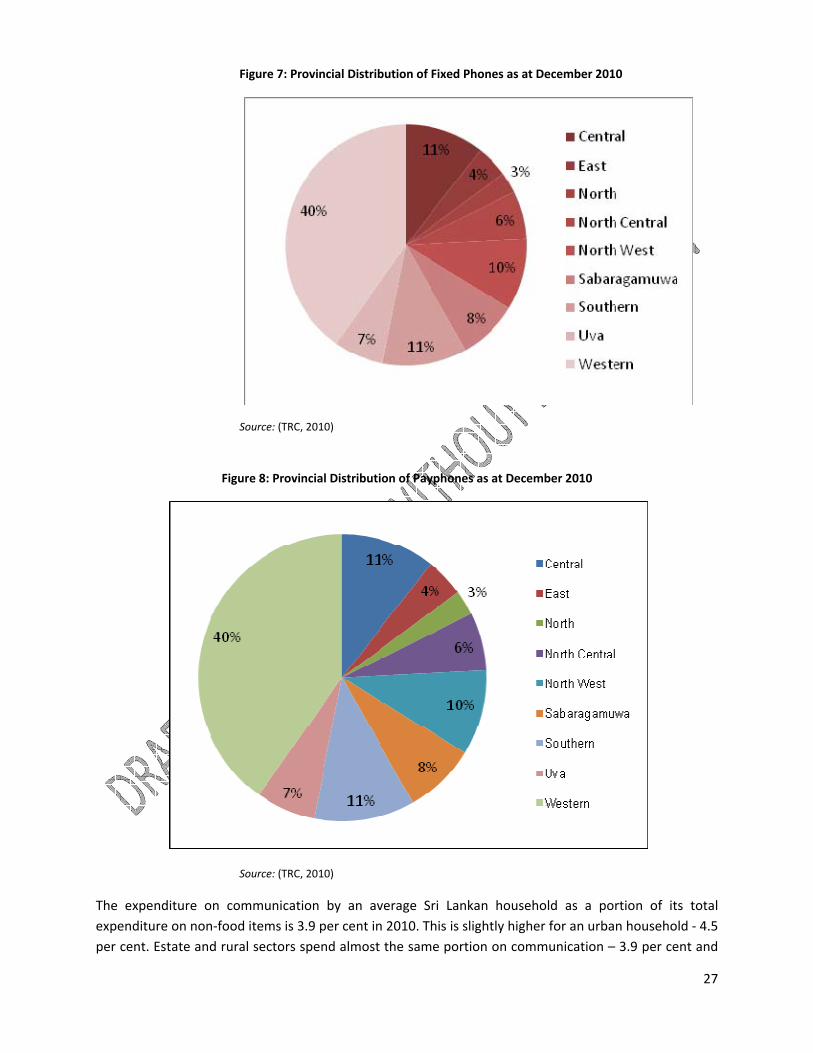
Fixed access telephone distribution in the island is dominated by the Western Province, while the North and North Western provinces recorded the lowest number of subscribers as at December 2010 (Figure 7). The distribution of fixed payphones exhibits a similar trend with the Western province leading, and the North, North Central and Uva provinces recording the lowest number. Distribution of mobile subscribers by province may display a slightly different pattern given the fact that communication in provinces with low fixed and payphone facilities is dominated by mobile phones, especially in areas like the North and East. However, given practical difficulties, data is not available regarding the provincial distribution of mobile telephone subscribers in Sri Lanka. These include the inability to clearly separate the subscriber and the user, and the difficulty in indentifying usage owing to multiple Subscriber Identity Module (SIM) cards by the same user.
22 (Dialog Axiata PLC, 2009) 23 Maps of network coverage by Dialog and Mobitel are included in annexes 3,4 and 6 24 Annex 5
27
Figure 7: Provincial Distribution of Fixed Phones as at December 2010
Source: (TRC, 2010)
Figure 8: Provincial Distribution of Payphones as at December 2010
Source: (TRC, 2010)
The expenditure on communication by an average Sri Lankan household as a portion of its total expenditure on non‐food items is 3.9 per cent in 2010. This is slightly higher for an urban household ‐ 4.5 per cent. Estate and rural sectors spend almost the same portion on communication – 3.9 per cent and

28
3.7 per cent respectively (Department of Census and Statistics, 2011). However, the rural sector is significantly larger than both the estate and urban sectors as nearly 70 per cent of the total population falls under this sector. Therefore the numbers above indicate insufficient participation by rural sector in the telecom industry compared to the estate and urban sectors.
4.2 International Connectivity
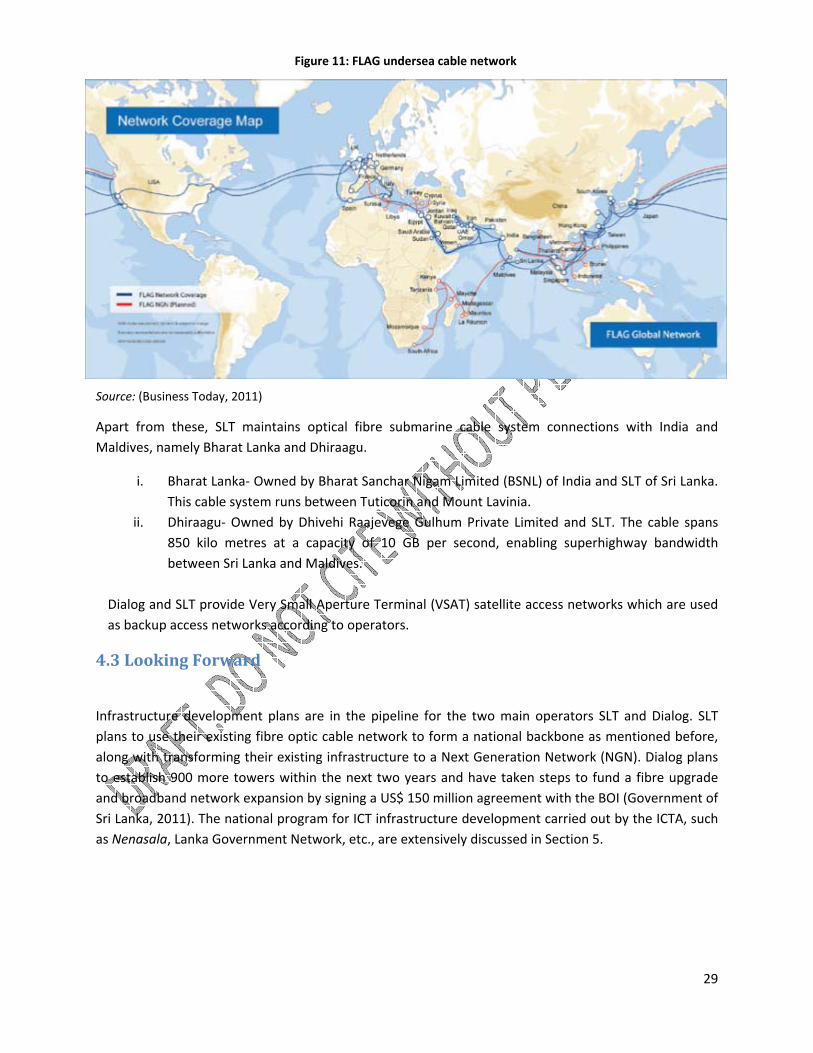
Sri Lanka is at present a part of three undersea cable networks namely, South‐East Asia‐Middle East‐Western Europe 3 (SEA‐ME‐WE 3) , SEA‐ME‐WE 4 and Fibre Optic Link Around the Globe (FLAG). SLT has invested in the SEA‐ME‐WE networks whilst Lanka Bell holds rights to FLAG in Sri Lanka holding exclusivity on these cables.
Figure 4‐SEA‐WE‐4 undersea cable network
Source: (Wikipedia, 2011) Source: (Wikipedia, 2011)
Figure 10: SEA‐WE‐3 undersea cable network Figure 9: SEA‐WE‐4 undersea cable network
29
Source: (Business Today, 2011)
Apart from these, SLT maintains optical fibre submarine cable system connections with India and Maldives, namely Bharat Lanka and Dhiraagu.
i. Bharat Lanka‐ Owned by Bharat Sanchar Nigam Limited (BSNL) of India and SLT of Sri Lanka. This cable system runs between Tuticorin and Mount Lavinia.
ii. Dhiraagu‐ Owned by Dhivehi Raajevege Gulhum Private Limited and SLT. The cable spans 850 kilo metres at a capacity of 10 GB per second, enabling superhighway bandwidth between Sri Lanka and Maldives.
Dialog and SLT provide Very Small Aperture Terminal (VSAT) satellite access networks which are used as backup access networks according to operators.
4.3 Looking Forward
Infrastructure development plans are in the pipeline for the two main operators SLT and Dialog. SLT plans to use their existing fibre optic cable network to form a national backbone as mentioned before, along with transforming their existing infrastructure to a Next Generation Network (NGN). Dialog plans to establish 900 more towers within the next two years and have taken steps to fund a fibre upgrade and broadband network expansion by signing a US$ 150 million agreement with the BOI (Government of Sri Lanka, 2011). The national program for ICT infrastructure development carried out by the ICTA, such as Nenasala, Lanka Government Network, etc., are extensively discussed in Section 5.
Figure 11: FLAG undersea cable network

30
Snapshot of challenges faced in telecom infrastructure development in Sri Lanka • High capital expenditure in installing infrastructure systems and networks, the high cost of
which has to be borne by the consumer. • Absence of a regulatory framework that facilitates infrastructure sharing. Owners rent out
telecom infrastructure to other operators at a high price which reduces commercial viability. • Unplanned local road networks and systems being a severe problem in fibre cable installation
and construction processes. • Confused roles of the TRC and ICTA (refer Section 6)
Looking at the regulatory framework for the proliferation of telecom infrastructure, The National Policy on Antenna Structures25 sets out guidelines for operators with specific reference to construction, installation, maintenance alteration and sharing of antenna structures also addressing general concerns such as height clearance, lightning protection, electromagnetic interference, and health and environmental concerns.
5. Beyond Telecom: EApplications, Services, Human Resources, Innovation
5.1 EApplications and Services
5.1.1 Introduction The ‘E‐Sri Lanka’ project which was developed collaboratively between the World Bank and the Information Communication Technology Agency (ICTA) of GoSL is one of the World Bank’s first projects designed to bring ICT to every citizen, village and business and to transform the Government’s approach in adapting the ‘e‐development ’model. The vision for the program as expressed at its launch in 2004 is to “aspire to the ideal of making Sri Lanka the most connected government to its people and raising the quality of life of all its citizens with better access to public services, learning opportunities and information”. 26
In keeping with the project’s goal of bringing the benefits of the global knowledge economy to both rural and urban Sri Lanka, ICTA has implemented a multi‐pronged program of activities that have ‘actioned’ strategic policy and regulatory reforms, expanded the broadband network, provided government services online, established ‘Nenasalas’ (rural telecenters) in remote areas, and increased the competitiveness of ICT’s private sector by providing windows for investments in outsourced IT‐enabled services(ITeS),etc.
25 (TRC, 2008) 26 (ICTA, 2009)

31
This being the broader ‘e‐model’ or framework for e‐initiatives (development of e‐applications and e‐services) in Sri Lanka, the following Section highlights how firms have adopted e‐commerce/e‐business and BPO strategies, introduced business models and innovations that make more effective use of telecoms (with special reference to innovative applications in telecom in the financial and agricultural/informal sectors), also covering key areas such as e‐Government, e‐Health and e‐Education27.
Table 12: Snapshot of recent adoption of e‐commerce/e‐business and BPO strategies:
December 2009 ‘Mphasis’, an Indian outsourcing firm, opens a centre in Colombo which offers legal, finance and accounting services. They have identified Sri Lanka as having a tertiary education system that provides an untapped talent pool which caters to outsourcing requirements.
February 2010 Introduction of ‘Proteus Financials’ a web based accounting control software that allows the Sri Lanka businesses to adopt the ‘Software as a service model’(pay as you need and go model), jointly developed by Kingslake Sri Lanka and UK based Proteus Software.
May 2010 Sri Lanka becomes the lead sponsor for the 2010 International Outsourcing Forum (IOF) London, hoping to draw attention as an emerging sourcing destination for IT/BPO work.
July 2010 Dialog Telekom gets a network upgrade (facility similar to that of Local Area Network, or LAN) that allows users to interconnect voice, data and video applications with overseas branch networks. A step towards ‘converged enterprise solutions’.
27Sector specific strategies i.e education, health etc. are dealt with later 28 (SundayTimes, 2011) 29ibid. 30 (Lanka Business Online, 2010)
Box 1: Snapshot of Sri Lanka’s IT/BPO Sector According to the ICTA, over 45,000 new jobs have been created in Sri Lanka’s IT/BPO sector since 2005. In terms of export revenue/foreign exchange earnings it has moved from a mere US$ 60 million to a staggering US$ 375 million industry, and is now the 5th largest foreign exchange earner in the country.28 The future target for the industry is to reach USD 1 billion by 2015 and USD 2 billion by 2020. Sri Lanka is also being recognized as an emerging centre of excellence for Financial and Accounting Outsourcing. AT Kearney, the global ICT consultancy, reported in a 2009 report that Sri Lanka moved 13 points on the off‐shoring index, the biggest improvement among 50 countries. Sri Lanka also ranks 16th in the BPO Location Attractive Index.29The BOI has identified Sri Lanka as being “…comparatively cost competitive than established outsourcing destinations. Given the declining communication costs, the environment is highly favourable for establishing high‐in‐demand niche competency centres.”30

32
July 2010 Two companies plan to set up e‐commerce ventures in Sri Lanka‐ • Senit Technologies‐ Offering e‐commerce services for the local hotel
industry. • Vingrows Business solutions‐ To provide web based services to Sri
Lankan expatriates that will allow users to request services on real estate, medical and travel sectors.
Source: (Lanka Business Online)
5.1.2 Innovative Applications in Telecom: Financial and Agricultural Sectors In the Sri Lankan context, mobile applications are seen as a tool to reduce income inequality. A growth of 10.8 per cent was recorded in mobile phone penetration in the first half of 201031 and currently stands at over 80 per cent32 (more than 16 million mobile connections among a population of 20 million). In comparison, there are nearly 2 million internet users in Sri Lanka, accounting for only 14 per cent of the entire population making m‐commerce/m‐banking more successful than e‐commerce/e‐banking.
The GSM Association, an industry association of nearly 800 wireless operators, estimates that one billion customers in the world have a mobile phone but no access to a bank account. Further, that nearly 4 million people worldwide use mobile money and that the industry is growing mainly in Africa and Asia where formal banking services are not as widely available as elsewhere. The mobile phone is increasingly becoming a ‘one‐stop‐shop’ and a ‘virtual wallet’ for consumers. Sri Lanka has a long way to go in this respect but has a good head start, which will be evident from the following.
Table 13: Financial Sector‐ Innovative mobile enabled financial services
2007‐2009 • Commercial Bank of Ceylon signs up with Sri Lanka Telecom to offer mobile customers a facility to instantly reload their phone balances simply by sending an SMS.
• Dialog offers fund transfers (a Dialog to Dialog ‐ D2D ‐service) from
one mobile to another. (Easy credit sharing)
March 2010 Etisalat in talks with banks to offer financial services on mobile phones, such as money transfers for migrant workers in the Middle East.
June 2010 Etisalat’s Sri Lanka unit has invited developers to create mobile applications and is offering to share 70 per cent of revenue from sales. Application developers were advised to start with SMS based apps which are bound to do better than those that need high bandwidth and high‐end phones (a question of affordability). Also those with educational content that for instance help people learn English or provide nutritional information to pregnant women are useful apps along with those for entertainment; meaning application developers must think of local content.
31 (Lanka Gazette, 2010) 32 (Lanka Business Report, 2011)
33
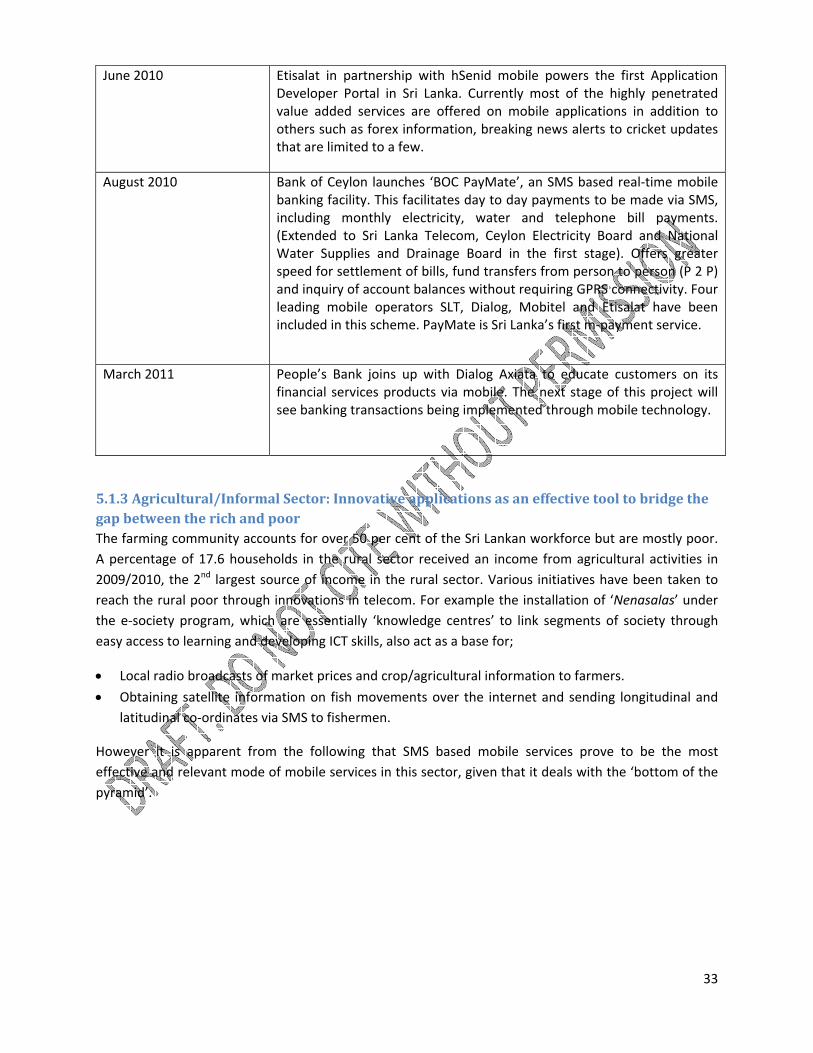
June 2010 Etisalat in partnership with hSenid mobile powers the first Application Developer Portal in Sri Lanka. Currently most of the highly penetrated value added services are offered on mobile applications in addition to others such as forex information, breaking news alerts to cricket updates that are limited to a few.
August 2010 Bank of Ceylon launches ‘BOC PayMate’, an SMS based real‐time mobile banking facility. This facilitates day to day payments to be made via SMS, including monthly electricity, water and telephone bill payments. (Extended to Sri Lanka Telecom, Ceylon Electricity Board and National Water Supplies and Drainage Board in the first stage). Offers greater speed for settlement of bills, fund transfers from person to person (P 2 P) and inquiry of account balances without requiring GPRS connectivity. Four leading mobile operators SLT, Dialog, Mobitel and Etisalat have been included in this scheme. PayMate is Sri Lanka’s first m‐payment service.
March 2011 People’s Bank joins up with Dialog Axiata to educate customers on its financial services products via mobile. The next stage of this project will see banking transactions being implemented through mobile technology.
5.1.3 Agricultural/Informal Sector: Innovative applications as an effective tool to bridge the gap between the rich and poor The farming community accounts for over 50 per cent of the Sri Lankan workforce but are mostly poor. A percentage of 17.6 households in the rural sector received an income from agricultural activities in 2009/2010, the 2nd largest source of income in the rural sector. Various initiatives have been taken to reach the rural poor through innovations in telecom. For example the installation of ‘Nenasalas’ under the e‐society program, which are essentially ‘knowledge centres’ to link segments of society through easy access to learning and developing ICT skills, also act as a base for;
• Local radio broadcasts of market prices and crop/agricultural information to farmers.
• Obtaining satellite information on fish movements over the internet and sending longitudinal and latitudinal co‐ordinates via SMS to fishermen.
However it is apparent from the following that SMS based mobile services prove to be the most effective and relevant mode of mobile services in this sector, given that it deals with the ‘bottom of the pyramid’.
34
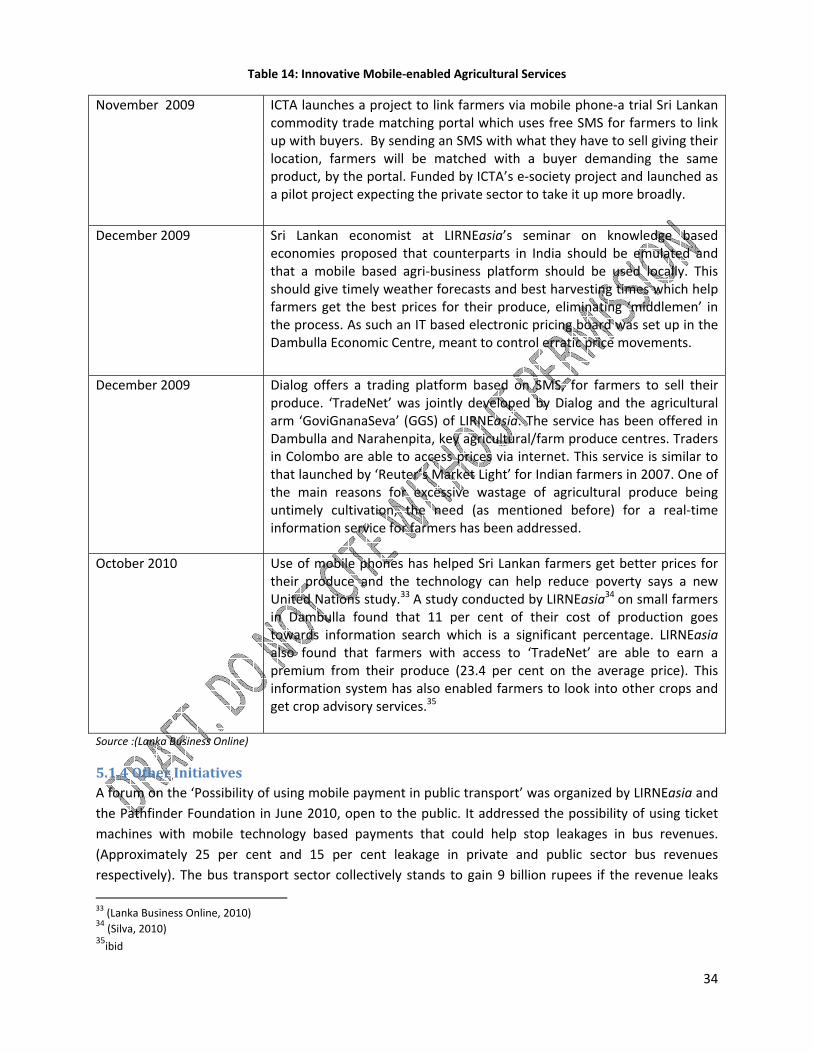
Table 14: Innovative Mobile‐enabled Agricultural Services
November 2009 ICTA launches a project to link farmers via mobile phone‐a trial Sri Lankan commodity trade matching portal which uses free SMS for farmers to link up with buyers. By sending an SMS with what they have to sell giving their location, farmers will be matched with a buyer demanding the same product, by the portal. Funded by ICTA’s e‐society project and launched as a pilot project expecting the private sector to take it up more broadly.
December 2009 Sri Lankan economist at LIRNEasia’s seminar on knowledge based economies proposed that counterparts in India should be emulated and that a mobile based agri‐business platform should be used locally. This should give timely weather forecasts and best harvesting times which help farmers get the best prices for their produce, eliminating ‘middlemen’ in the process. As such an IT based electronic pricing board was set up in the Dambulla Economic Centre, meant to control erratic price movements.
December 2009 Dialog offers a trading platform based on SMS, for farmers to sell their produce. ‘TradeNet’ was jointly developed by Dialog and the agricultural arm ‘GoviGnanaSeva’ (GGS) of LIRNEasia. The service has been offered in Dambulla and Narahenpita, key agricultural/farm produce centres. Traders in Colombo are able to access prices via internet. This service is similar to that launched by ‘Reuter’s Market Light’ for Indian farmers in 2007. One of the main reasons for excessive wastage of agricultural produce being untimely cultivation, the need (as mentioned before) for a real‐time information service for farmers has been addressed.
October 2010 Use of mobile phones has helped Sri Lankan farmers get better prices for their produce and the technology can help reduce poverty says a new United Nations study.33 A study conducted by LIRNEasia34 on small farmers in Dambulla found that 11 per cent of their cost of production goes towards information search which is a significant percentage. LIRNEasia also found that farmers with access to ‘TradeNet’ are able to earn a premium from their produce (23.4 per cent on the average price). This information system has also enabled farmers to look into other crops and get crop advisory services.35
Source :(Lanka Business Online)
5.1.4 Other Initiatives A forum on the ‘Possibility of using mobile payment in public transport’ was organized by LIRNEasia and the Pathfinder Foundation in June 2010, open to the public. It addressed the possibility of using ticket machines with mobile technology based payments that could help stop leakages in bus revenues. (Approximately 25 per cent and 15 per cent leakage in private and public sector bus revenues respectively). The bus transport sector collectively stands to gain 9 billion rupees if the revenue leaks
33 (Lanka Business Online, 2010) 34 (Silva, 2010) 35ibid

35
can be plugged. GPRS enabled ticketing machines are widely used in Hong Kong, Malaysia and China. The forum stated that while the solution is private led, the government should provide support by initially providing this machines at concessionary rates etc.36
E‐Government
In bringing the government closer to its people by creating a more citizen‐centric approach for providing public services, the ICTA which functions under the Presidential Secretariat has taken progressive steps to ensure that there is an improvement on G2G, G2C (citizen) and G2B (business). These efforts which are predominantly a part of the broader E‐Sri Lanka program include establishment of the Government Information Centre (GIC‐1919), inclusion of e‐government software such as the e‐population registry [including the Birth Marriage & Death certificate (BMD) project], e‐foreign employment bureau, e‐pensions, e‐national ID card project, e‐parliament, e‐transaction service for vehicle revenue license payments etc.
• Government Web Development and Government Internet Data Centre Projects The public sector of Sri Lanka is yet to harness the potential of internet based services due to low penetration of internet, lack of in‐house expertise on web related issues and lack of technical and financial assistance. The ICTA’s government re‐engineering program addresses the above issues. The ‘Lanka Government Network’ project aims to increase internet penetration in the public sector while the Government ICT Training project hopes to equip over 10,000 government officers with IT skills in the near future. In conjunction with these objectives two major steps that have been taken to increase government web presence are the ‘Government Web Development project’ (for construction and revamping of websites) and the ‘Government Internet Data Centre’ (for web hosting facilities).
• Government Information Centre (GIC‐ 1919) The GIC set up by ICTA is the first technologically advanced information seeking option in response to the need to provide the government with a more citizen‐centric interface and ensuring geographically non‐discriminate delivery of information. Its vision is “To become the ‘one‐stop‐shop’ for the citizen to obtain information relating to the services provided by the government organization, contact information of key government servants and other statistics”. GIC won awards at the ‘World Summit Awards’, a global initiative for selecting and promoting the world’s best e‐contents and applications.
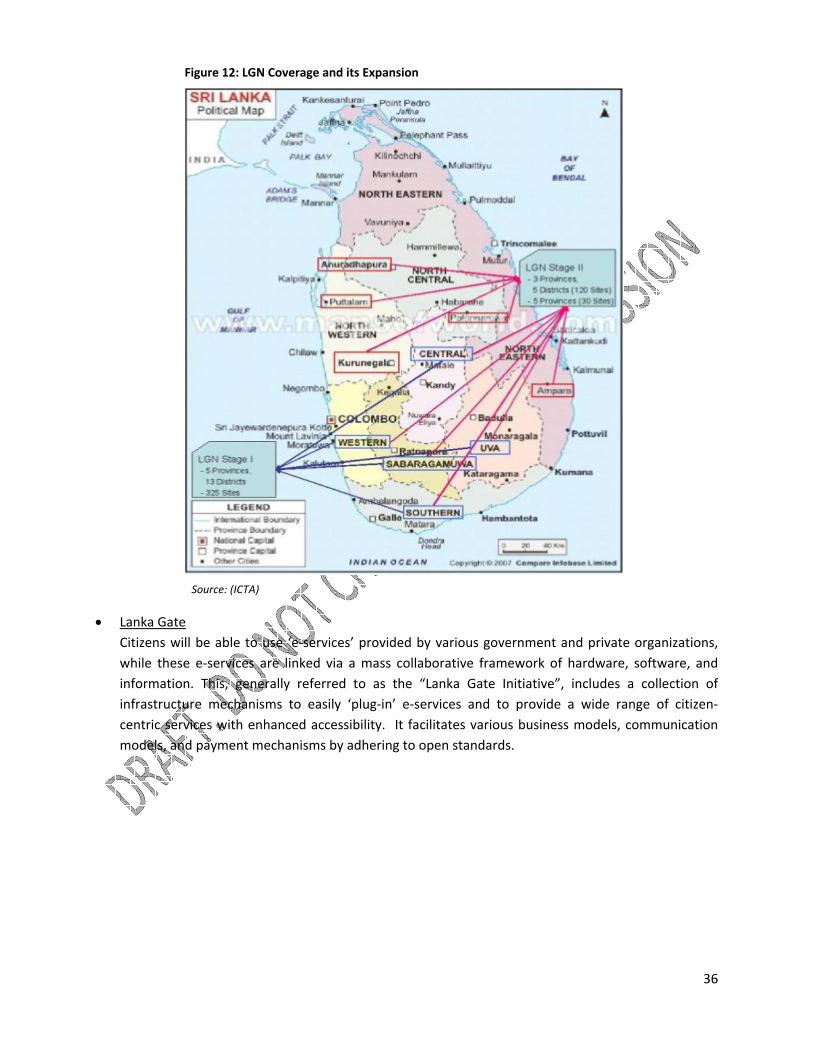
• Lanka Government Network Project (LGN) Acts as the underlying information infrastructure backbone that connects all organizations of the GoSL in a cost effective and secure manner to provide internet, E‐mail and internet protocol (IP) based voice services to government organizations.
36 (Lanka Business Online, 2010)
36
Source: (ICTA)
• Lanka Gate Citizens will be able to use ‘e‐services’ provided by various government and private organizations, while these e‐services are linked via a mass collaborative framework of hardware, software, and information. This, generally referred to as the “Lanka Gate Initiative”, includes a collection of infrastructure mechanisms to easily ‘plug‐in’ e‐services and to provide a wide range of citizen‐centric services with enhanced accessibility. It facilitates various business models, communication models, and payment mechanisms by adhering to open standards.
Figure 12: LGN Coverage and its Expansion
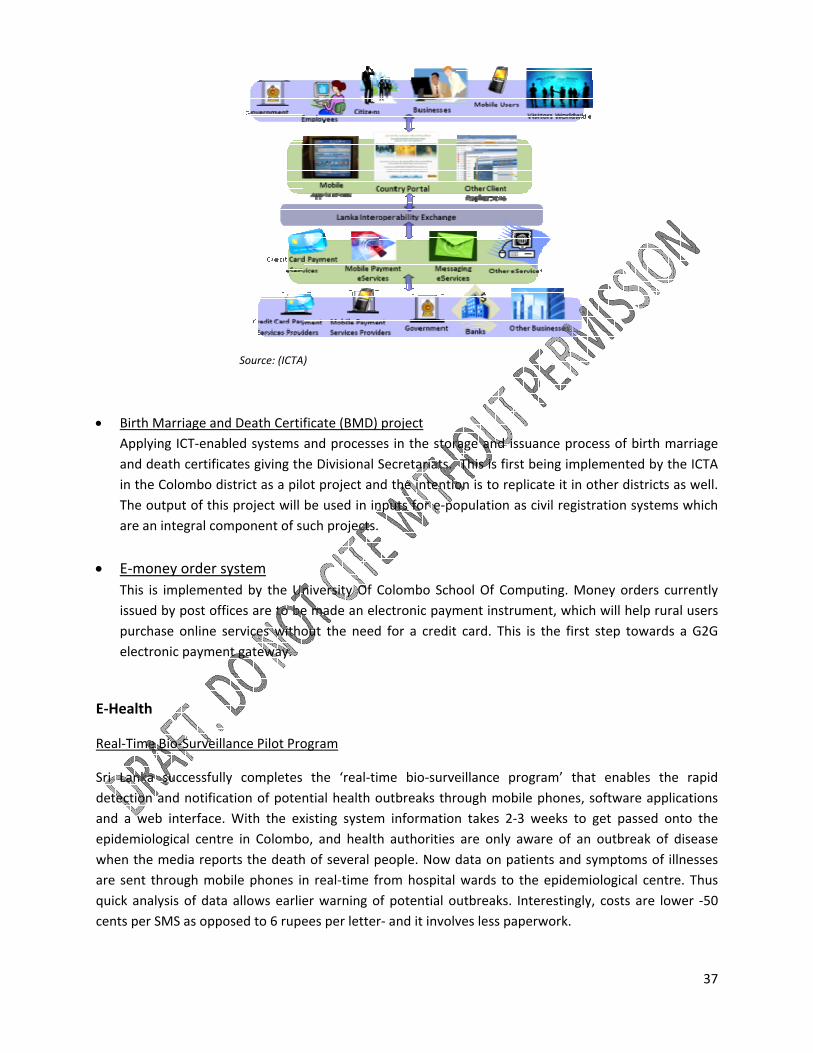
• Birth Applyand din theThe oare an
• E‐moThis iissuedpurchelectr
E‐Health
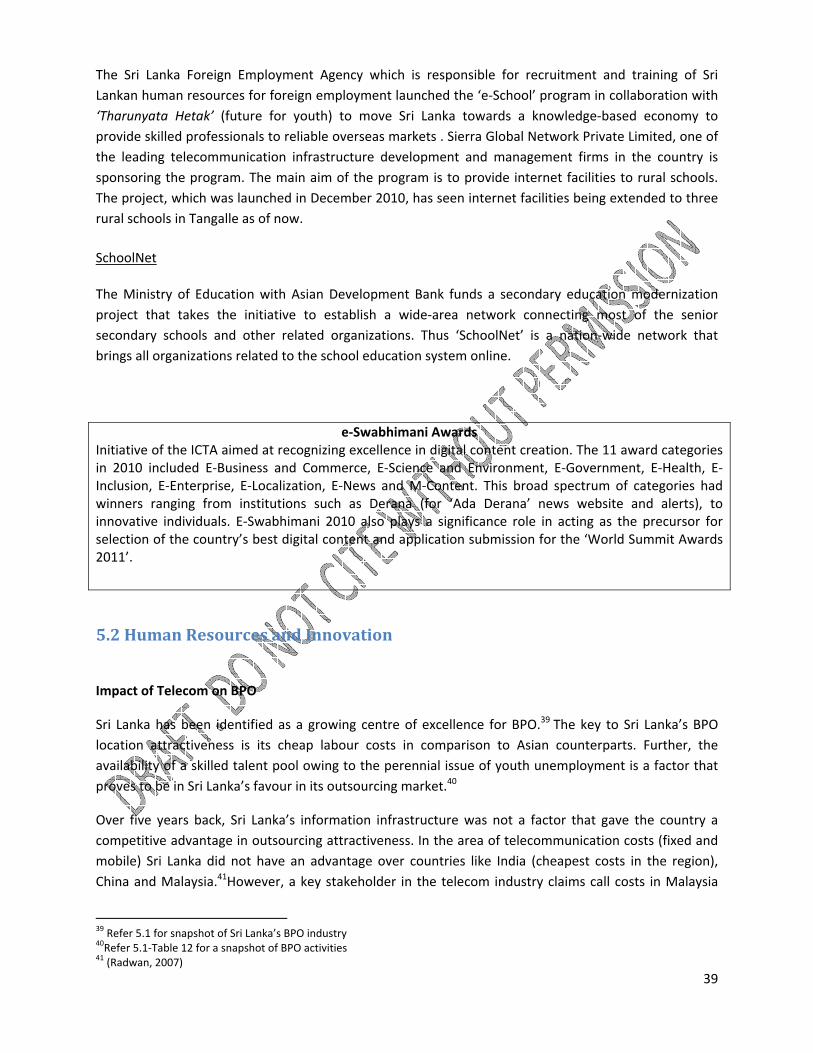
Real‐Time
Sri Lankadetectionand a weepidemiowhen theare sent tquick anacents per
Marriage andying ICT‐enabdeath certificae Colombo disoutput of thisn integral com
oney order sys implementd by post offihase online sronic paymen
e Bio‐Surveilla
a successfully and notificaeb interface. logical centree media reporthrough mobalysis of data SMS as oppo
Source: (ICTA)
d Death Certifled systems ates giving thstrict as a pilo project will mponent of su
ystem ed by the Unices are to beervices withont gateway.
ance Pilot Pro
y completes tion of potenWith the exe in Colomborts the deathbile phones inallows earlie
osed to 6 rupe
Figure 13: Lan
)
ficate (BMD) and processehe Divisional Sot project anbe used in inuch projects.
niversity Of Ce made an eleout the need
ogram
the ‘real‐timntial health oxisting systemo, and healthh of several pn real‐time frer warning oees per letter
ka Gate
project es in the storSecretariats. d the intentionputs for e‐po
Colombo Schectronic paymd for a credit
me bio‐surveoutbreaks thrm informationh authorities people. Now drom hospital f potential or‐ and it involv
rage and issuThis is first bon is to replicopulation as c
ool Of Compment instrum card. This is
eillance progrough mobilen takes 2‐3 ware only awdata on patiewards to theutbreaks. Intves less pape
ance processbeing implemcate it in othecivil registrat
puting. Moneent, which ws the first ste
gram’ that e phones, softweeks to getware of an ouents and syme epidemioloterestingly, corwork.
s of birth mamented by theer districts asion systems w
y orders currwill help rural ep towards a
enables the tware applicat passed ontutbreak of dimptoms of illnogical centre.osts are lowe
37
rriage e ICTA s well. which
rently users a G2G
rapid ations o the sease nesses Thus er ‐50

38
Figure 14: Real Time Bio‐Surveillance Project
Source: LIRNEasia
E‐Channeling
E‐Channeling PLC, established in 2001, is one of Sri Lanka’s first e‐commerce companies, the pioneer ICT service provider to the health industry and the first technology company with a listing on the CSE,. It envisions an enabling service to eliminate the hassle faced by the general public in channelling doctors. Its initial success has been the development of a centralized doctor’s appointment booking system for Sri Lanka’s private healthcare industry, which allows patients to book and pay for an appointment via internet from home, office, banks, pharmacies, mobile phone operators, and ICT centers (Nenasalas). It is interesting to note that before the advent of e‐channelling a leading diversified conglomerate and a 5 star hotel, both of which had staff in excess of 500 people, estimated that on any given day half days leave was taken by up to 8 per cent of their staff to make a doctor’s appointment.37 The ‘Dial 225’ service allows booking an appointment by dialling 225 and having the payment debited from the phone credit or bill. This is offered by the top 5 telecom operators in the country ‐ Dialog, Mobitel, Etisalat, Airtel and Hutch‐ making it accessible to all.
The country’s e‐Health system is backward when compared to its Asian counterparts. However the Health Ministry says that Sri Lanka has an already established e‐steering committee, e‐health sub‐ committee and a draft formulating group to empower the e‐health policy in Sri Lanka.38
E‐Education
E‐School Program
37 (E‐Chanelling, 2011) 38 (Tops.lk, 2010)
Figure 14: Real Time Bio‐Surveillance Project
39
The Sri Lanka Foreign Employment Agency which is responsible for recruitment and training of Sri Lankan human resources for foreign employment launched the ‘e‐School’ program in collaboration with ‘Tharunyata Hetak’ (future for youth) to move Sri Lanka towards a knowledge‐based economy to provide skilled professionals to reliable overseas markets . Sierra Global Network Private Limited, one of the leading telecommunication infrastructure development and management firms in the country is sponsoring the program. The main aim of the program is to provide internet facilities to rural schools. The project, which was launched in December 2010, has seen internet facilities being extended to three rural schools in Tangalle as of now.
SchoolNet
The Ministry of Education with Asian Development Bank funds a secondary education modernization project that takes the initiative to establish a wide‐area network connecting most of the senior secondary schools and other related organizations. Thus ‘SchoolNet’ is a nation‐wide network that brings all organizations related to the school education system online.
e‐Swabhimani Awards Initiative of the ICTA aimed at recognizing excellence in digital content creation. The 11 award categories in 2010 included E‐Business and Commerce, E‐Science and Environment, E‐Government, E‐Health, E‐Inclusion, E‐Enterprise, E‐Localization, E‐News and M‐Content. This broad spectrum of categories had winners ranging from institutions such as Derana (for ‘Ada Derana’ news website and alerts), to innovative individuals. E‐Swabhimani 2010 also plays a significance role in acting as the precursor for selection of the country’s best digital content and application submission for the ‘World Summit Awards 2011’.
5.2 Human Resources and Innovation
Impact of Telecom on BPO
Sri Lanka has been identified as a growing centre of excellence for BPO.39 The key to Sri Lanka’s BPO location attractiveness is its cheap labour costs in comparison to Asian counterparts. Further, the availability of a skilled talent pool owing to the perennial issue of youth unemployment is a factor that proves to be in Sri Lanka’s favour in its outsourcing market.40
Over five years back, Sri Lanka’s information infrastructure was not a factor that gave the country a competitive advantage in outsourcing attractiveness. In the area of telecommunication costs (fixed and mobile) Sri Lanka did not have an advantage over countries like India (cheapest costs in the region), China and Malaysia.41However, a key stakeholder in the telecom industry claims call costs in Malaysia
39 Refer 5.1 for snapshot of Sri Lanka’s BPO industry 40Refer 5.1‐Table 12 for a snapshot of BPO activities 41 (Radwan, 2007)
40
and Singapore are now significantly high in comparison and that India is on par with Sri Lanka. Over 45,000 new jobs have been created in Sri Lanka’s IT/BPO sector since 2005 of which the emergence of call centres play a significant role, but is more importantly attributed to Sri Lanka’s recognition in areas such as financial, legal and accounting services. India is slowly losing its market share in BPO to countries like Philippines and even smaller players like Sri Lanka and Mauritius which present higher quality and better communication skills in call centre related work.42 Thus prospects for Sri Lanka look good, with relatively cheap telecommunication costs and a gradually increasing ICT‐literate workforce.
E‐Knowledge and job creation under the E‐Sri Lanka initiative
This project focuses on e‐knowledge and ICT for private sector development and jobs. Specialized training modules on network administration, IT management etc are now incorporated in university curricular, certificate programs, distance learning and MBA programs, aimed at building the countries human capacity in ICT.
Nenasala Project
The Nenasala Project must be given special mention in being responsible for progressively reducing the digital divide in the country which is a key issue in the Sri Lankan context. This is reducing the gap in affordability and access to infrastructure between urban and rural areas. There are different models of Nenasalas offering different types of services‐
• Rural knowledge centres
• E‐Libraries
• Distance and e‐learning centres
• Tsunami camp computer kiosks
This initiative has been instrumental in increasing the ICT literacy in the country to 30 per cent by the end of 2009 from just 4 per cent in 200443. Further, computer literacy increased by 26 per cent from 2006 to 200944. While ICTA’s aim was to establish a 1,000 Nenasalas by 2010, they successfully completed 620 Nenasalas in 23 districts island‐wide by the beginning of the year45. The project has been the most successful countrywide initiative in providing access to ICT to all, by increasing rural connectivity through expansion of information infrastructure, and in creating awareness among these groups on the benefits of ICT knowledge. Human capacity building by improving ICT skills must start from the grass root level in Sri Lanka in order to facilitate job expansion and in this, the project has been successful. For example, “Topjobs”, a leading online job search system in Sri Lanka, extends its services through Nenasalas to reach rural youth who seek better jobs and provide awareness on the job market trend. As such, we must give the right tools to the kid in the village in order to compete in the next era of the knowledge economy.
42 (The Island, 2011)102 43 (Telecenter, 2009) 44DCS 3rd National Computer Literacy survey 45 See, http://www.telecentre.org/profiles/blogs/nenasala‐udanaya‐regionalfor detailed progress of Nenasaelasfromthe Regional Nenasaela Convention

41
6. Sri Lanka’s Telecom Regulatory and Policy Environment This Section outlines the evolution of the telecom regulatory and policy environment of Sri Lanka. It provides a description of the regulatory structure, the functions of the regulator, and brief outline of the regulatory performance.
6.1 Evolution of Telecom Regulatory Environment
Table 15 below sets out the evolution of Sri Lanka’s telecom regulatory and policy environment overtime by listing key regulatory events from 1980 to 2011.
Table 15: List of key policy and regulatory events in Sri Lanka 1980 ‐ 201146
Year Regulatory/ Policy Event
1980 • De‐linking of posts and telecom services provision
1989 • First private mobile operator enters the market (Celltel)
1991 • Legislation to set up a regulatory agency (one‐man‐authority) • Corporatization of the incumbent
1994 • National Telecom Policy issued by GoSL (covers USOs, cost‐based tariffs, QoS etc.)
1996 • Licensing of WLL operators (Suntel& Lanka Bell) • Amendment to 1991 legislation • (Yet another) National Telecom Policy
1997
• Incumbent (SLT) partially privatized. (NTT: 35%, GoSL: 61.5%, Employees: 3.5%) • GoSL commits to not issuing additional licenses for international telephony until August
2002 • Sri Lanka makes WTO commitments
1998 ‐ 1999
• Fixed telephony interconnection determination issued by TRC: SLTL appeals determination in courts, fails to stay it (1999)
• First stage of tariff rebalancing commences (five stage rebalancing exercise) • TRC issues and implements fixed and mobile interconnection determination; beginning
of lawsuits with regard to interconnection
2002
• SLT acquires balance 60% shares of Mobitel, making it the sole owner of the mobile operator
• SLT shares traded on the Colombo Stock Exchange (and subsequent re‐mix of shares as NTT: 35.2%, Public: 11.8%, Employees: 3.5%, GoSL: 49.5% )
2003
• Exclusivity on international telephony ends with issuance of External Gateway Operators (EGO) licenses for a fee of US$ 50,000
• Interconnection rules gazetted • First assignment of 1800 GSM frequencies by auction • Final tariff rebalancing implemented (a year late) • ADSL broadband service launched by SLT
2004 • VSNL (a subsidiary of India’s Tata Group) that obtained an EGO license in 2003,
commences operations in the international wholesale voice and data markets, • TRC decision on the implementation of CPP was reversed by the ex‐officio Chair of the
46Compiled using information from the TRC website, Lanka Business Online, and Knight‐John, 2008.

42
Commission just hours before a news conference to announce a shift from RPP to CPP (the alleged reason given by the Chair was the political ramifications of the decision just before an election): Public hearing was held on the decision , the public hearing committee counted the number of pro and con submissions and concluded that the public was against CPP (although evidence pointed to the fact that the con submissions were orchestrated by a union)
2005 • CDMA frequencies assigned; Court case between seven operators and ICTA with regard
to alleged exclusivity clauses in regional telecom network licenses • Consumer lobby takes TRC and SLT to court over 5th (final) tariff re‐balancing exercise
2006 • Sri Lanka’s first commercial 3G mobile license issued • SLT foreign currency debt outlook revised from stable to negative by Fitch Ratings • TRC issues call for 5th mobile operator
2007 • TRC issues license to a 5th mobile operator, BhartiAirtel • Mobile Subscriber Levy of 10% of every bill imposed on mobile users • WiMax broadband services launched by Dialog
2008
• Mobile subscriber levy extended to non‐mobile wireless phones (CDMA) • Malaysia’s Usaha Tegas (UT) group bought over NTT’s shares in SLT (35.2%), GoSL shares
in SLT reduced to 49.5% with the balance 15.3% shares being owned by SLT employees and the public
2009
• Telephone levy of 10 per cent applicable to mobile and CDMA phones extended to cover fixed line telephones.
• VAT threshold increased to Rs. 650,000 (approximately US$ 5,855) per taxable period or Rs. 2.5 million (approximately US$ 225,225) per annum.
• The TRC issues an official request to mobile operators to open up their interconnection facilities to BhartiAirtel.
• Ministry of defense issues a statement indicating its plan to rebuild the North and the East including allowing a fibre optic line to be laid along the A9 highway and making it mandatory for at least three operators to share the cost of installing and running network towers in the North and East.
2010
• TRC calls for consultancies to develop policy and regulatory framework for Next Generation Networks(NGN).
• TRC calls for consultancy services to assist it in the establishment of the necessary regulatory framework for implementing Mobile Number Portability (MNP).
• TRC imposed floor rate for local calls reduced from Rs. 2 (approximately US $ 0.018)per minute to Rs. 1.50 (approximately US $ 0.013) per minute from July 2010 in an attempt to curb the price war among operators.
• TRC issues a set of guidelines for broadband operators: includes publishing all details pertaining to broadband package pricing quality of service and facilitating consumers to lodge complaints to the internet service provider (ISP).
• Disbursement of Telecommunications Development Charges for 2007/2008 • Operators agree to a new mobile interconnection regime • 20% Telecommunications Levy imposed asper budget 2011 (In lieu of 12% VAT + 10%
MSL + 3% NBT + 2% ECL) • Cess of 2 per cent per annum imposed on the annual gross turnover of the operator • Import of high‐tech equipment and machinery for telecom industry exempted from VAT • TRC releases fixed broadband download speed test results: the results reveal download
speeds to be far below the advertised rates: corrective measures adopted by TRC leads to a 60 per cent improvement by operators.
2011
• SLT reduces international backbone and landing station charges by 50 per cent. • TRC releases 3G Mobile Broadband Speed Test Results: the results show an 80 per cent
increase in peak hour download speeds since the benchmarking process was started. • TRC announces the commencement of construction of Lotus Tower by the government in
Peliyagoda: operators could use the tower for their operations for a fee.

43
6.2 Regulatory and Policy Instruments The telecom regulatory environment is governed by policies, acts, rules and orders. These instruments and their key features are outlined below47.
6.2.1 Policy The Ten Year Development Plan for Telecommunication 2006 – 2016 (TRC, 2010): This policy document outlines the telecom sector‐specific targets set by the government. It addresses the following issues: Market Entry
I. Promote maximum market participation II. Establish a non‐discriminatory and transparent license regime
III. Scarce resources to be assigned restrictively, should the licensee require it
IV. Evolve Sri Lanka's market structure towards a technological and service neutral, open and
converged status subject to regulatory consideration V. Encourage private investment by creating a conducive level playing field
Allocation of Scarce Resources
I. Spectrum Management
• Stakeholders consulted before allocating frequencies • Fair and proportionate pricing ‐ to reflect the most economically efficient value of
spectrum • Monitor spectrum usage to ensure efficient usage
II. Rights‐of‐Way
• Local and international rights‐of‐way to be shared among operators • Operators to petition to regulator to settle disputes • Legislation to provide jurisdiction to regulator to ensure that operators have reasonable
and timely access to necessary public rights‐ of‐ way.
III. Shared Resources
• Use of shared resources and costs to be evenly distributed among operators • Regulator to settle disputes
IV. Numbering
47 Source: (TRC)

44
• Promote number portability • Operators who are assigned blocks of numbers to contribute to maintaining a universal
directory database
6.2.2 Acts The first statute for the telecom sector was passed by the parliament in 1991 and later amended in 1996. The salient feature of this Act was the establishment of clear trifurcation of policy formulation, regulation and operation.
I. Sri Lanka Telecommunications Act, No. 25 of 1991
• Trifurcation of the industry into policy formulation, regulation, and operation
• Establishment of the first regulatory body – Sri Lanka Telecommunications Authority (STA) – a single person authority headed by the Director General of Telecommunication
II. Sri Lanka Telecommunications (Amendment) Act, No. 27 of 1996
• Transforming of STA into the Telecom Regulatory Commission (TRC)
• Appointment of a five‐member committee (Chairman: ex‐officio secretary to the Ministry of Posts and Telecommunication: Director General and other three members appointed by the minister)
6.2.3 Rules These are passed by the TRC within the scope of the Sri Lanka Telecommunications Act, No.25 of 1991 (as amended)
I. Quality of Service Standards Rules No. 2 of 2001 Making it mandatory to submit information on the following indictors to both the TRC and the public
• Operator assistance answer
• Directory assistance answer
• Timely services to applicants
• Call completion ratio
• Out of service trouble reports cleared within standards
II. Interconnections Rules of 2003
• Mandatory interconnection among connectable operators
• Mandatory disclosure of operators’ interconnection regime
• Pay interconnection charges based on costs in case of a dispute
• Provisions for TRC to intervene in dispute settlement related to interconnection
III. Interconnection Rules of 2010
• Voice ‐ a fee of 50 cents payable to the terminating operator
• SMS – a fee of 15 cents payable to the terminating operator

45
6.2.4 Orders I. Billing Orders 1 through 9: Various billing orders issued to operators
Eg: An order was issued to fixed line operators to provide itemized bills to consumers for local and international calls.
II. Cess Order: a cess of 2 per cent on revenue payable to the government

46
6.3 Structure of the Regulatory and Policy Environment and Responsibilities of Regulatory Institutions
The TRC was established under the Sri Lanka (Amendment) Act No. 27 of 1996 – the amendment to the Telecommunications Act No. 25 of 1991. The provisions in the Act are in line with the WTO Agreement on Basic Telecommunications Services. It is the responsibility of the TRC to promote sustained development in the telecommunications industry by handling regulatory affairs pertaining to the industry and shaping the regulatory process, whilst maintaining consumer interest. Like most regulatory bodies in Sri Lanka, TRC reports to its relevant ministry‐Ministry of Post and Telecommunications. Reporting to a single Ministry makes the TRC susceptible to political capture; this is in contrast to the Public Utilities Commission of Sri Lanka (PUCSL), which reports to Parliament under the 17th Amendment to the Constitution which is the best practice in terms of accountability. Telecom regulatory governance lacks clear division of labour among the regulatory bodies. For instance, both the TRC and the Consumer Affairs Authority (CAA) have legislative provisions to protect the interests of consumers. The latter has been created to address the grievances of consumers, though not telecom specific. Balasooriya (2010) has cited instances where the regulatory power of the two authorities over lap. For example, consumers lodge telecom related complaints with the CAA, even though the TRC is better suited to resolve them. This can also be seen in the governance of the USF. Regulation of universal access ‐ which is a central component of both the Ten Year Development Plan and the TRC mandate‐ which is within the purview of the TRC. However, since 2010, the administration of the Universal Service Fund (USF) has been assigned to the ICTA (refer Annex 2). Thus the issue of workable concurrent jurisdiction hinders telecom regulatory efficacy.
6.4 Regulatory Commission and Regulatory Capture
Samarajiva (2002), states that ‘independence’ is the most desirable quality in a utility regulator. However absolute independence is hardly achieved as all regulators are dependent on government to a certain extent. Therefore, targeting the following ensures a fair degree of workable independence in a regulatory body.
• Providing insulation from political pressures through measures such as having special legislation in appointing officers (like that of judiciary officials) and financial independence of the regulatory agency.
• Independence from government and operators to conduct business in a non‐discriminatory manner.
• Supply of dominant bottleneck facilities to not be monopolized by the government.
• Establish a transparent decision making process through stake holder participation
• Ensure accountability by reporting to the parliament rather than a single ministry.

47
One may observe that Sri Lanka’s telecom regulatory governance lacks or has violated many of the above characteristics. As per the Act, the incumbent Secretary to the Ministry is also the ex officio chair of TRC, creating a conflict of interest between policy making and regulation. This is a violation of trifurcation of authority as illustrated in Annex 2. Similarly, the largest fixed line operator and the second largest mobile operator are partially government owned which has led to several instances of biased regulatory performance as indicated in Table 15. For example,
• Failure to bring about a successful fixed mobile interconnection regime over a prolonged period
• The fixed and international monopoly enjoyed by the market leader despite the commitments set out in the GATS reference paper
• Failure to investigate alleged cross subsidization within operators that carry out more than one service (e.g., fixed and mobile)
• SLT being allowed to take over ownership of a mobile service provider in 2002, though other fixed line operators have not been granted licenses to do the same.
• Failure to liberalize and establish a system of access pricing for SLT owned bottle neck resources such as fibre optic network and cable landing station.
6.5 Funding the Telecom Regulatory Commission
6.5.1 Taxes The Budget for 2011 saw a significant reduction in the taxes levied on the telecom industry from 31 per cent to 20 per cent. The previous tax structure was a complicated one consisting of several taxes, consisting of Value Added Tax (VAT) (12 per cent), Mobile Subscriber Levy (10 per cent), Nation Building Tax (3 per cent), Environmental Conservation Levy (2 per cent). The new tax regime has streamlined these by charging a Telecommunications Levy of 20 per cent. However this does not necessarily guarantee efficiency. Operators point out that under the earlier system they could set off the VAT incurred on their expenses by the VAT charged from consumers. The new tax regime has exempted operator revenue from VAT which leaves them with nothing to set off operator VAT against, which in turn increases their cost by 12 per cent.
6.5.2 Other The TRC receives license renewal charges, spectrum fees, and a CESS of 2 per cent on revenue from each operator. As indicated in Table 3 in Section 2, TRC is the largest contributor to government revenue among all profit making government entities. The estimated contribution of TRC to government revenue

48
in 2010 was Rs. 8 billion (approximately US$ 72,072,072)48. It is a sharp rise from previous year’s Rs. 3 billion (approximately US$27,027,027). Samarajiva49points out that TRC is not a profit making body but a regulatory body, and that these profits are generated at the cost of revenues from the industry which could have been employed for the development of the sector.
6.6 Accountability of the Telecom Regulatory Commission The Telecommunications Act No. 25 of 1991 includes provisions for public consultations which, in theory, guarantee transparency and accountability on the part of TRC. However as Knight‐John et al. (2003) point out, although stake holders are consulted extensively prior to formulating regulations, the outcomes of these consultations are not adequately communicated to the public in order to obtain their input throughout the process of forming regulatory measures. There is a lack of clear guidelines in the Telecommunications Act for outcomes of consultations to be made public. It should be pointed out however there have been improvements on this process in the recent past. The latest notification by the TRC uploaded on its website on the Public Consultation on Policy and Regulatory Framework for Next Generation Networks in Sri Lanka50and the many public notices issuing various regulatory measures available on the official TRC website (www.trc.gov.lk) are examples of this. Yet, the Commission is still lacking in consulting the stakeholders in the process of forming regulatory measures.
6.7 Uncertainty, Risk and Investment Samarajiva et al. (2004) states that, perceptions held by stake holders of the regulatory environment affect new and incremental investment decisions of the sector. Knight‐John (2005) makes the following assertions about the regulatory performance of Sri Lanka’s telecom sector in terms of risk;
• The TRC under performs due to structural and capacity issues as well as political and regulatory capture.
• It is viewed by stakeholders as an “entity lacking legitimacy and credibility and easily outstripped in expertise”51.
• Gaps in telecommunication sector performance are due to oscillations in policy which destabilizes the sector.
There have been instances in the TRC’s history which hurt the credibility of the entity, such as failing to implement the shift from Receiving Party Pays (RPP) to Calling Party Pays (CPP) regime in 2005, and the arbitrary manner in which it was carried out (Knight‐John, 2008). This point is now moot in the regulatory space as all mobile operators have moved to an incoming call fee regime. This stands out as
48 (Ministry of Finance and Planning, 2011) 49 (Samarajiva, 2010) 50 (The TRC, 2011) 51 (Knight‐John, Center on Regulation and Competition, 2005)

49
an example of market conduct overriding unsatisfactory regulation. Such instances create negative perceptions among stake holders about the regulatory environment. Sri Lanka is ranked the highest in the Asian region in terms of the risk in the regulatory sector, with a risk score of 6.552 as indicated by Fitch Ratings Lanka. The weaknesses in the regulatory structure and regulatory efficacy which have contributed to this risk assessment have been discussed previously in Section 6.3, reiterated below and further discussed in Section 7. There have been several instances of regulatory indecision by the TRC over the years. Some of these are;
• Failure to provide interconnection facilities to the majority of EGOs, despite granting licenses at a high cost.
• Failure to facilitate effective network sharing despite complaints by operators. • Failure to implement Mobile Number Portability (MNP) despite numerous consultations • Failure to implement the establishment of a national backbone network despite a call for
applications by stakeholders.
Such instances signal weak regulatory practice to both the domestic and international business community. However, it should be noted that the telecom sector continued to be the highest FDI contributor to the country till 2010 despite this poor regulatory performance. This can largely be attributed to healthy market dynamics as discussed in Section 3. Observing Figure 2 in Section 3, it is clear that after 2005 mobile telephony has shown a rapid and a continuous growth indicative by the growth of subscribers. Until 2009, mobile operators were aggressively expanding the market which brought in a continuous flow of investment. There were heavy investments with players like Tigo and Bharti Airtel entering the market, and existing operators such as Dialog and Mobitel undertaking expansive infrastructure projects. Therefore, it is clear that the inherent dynamism provided by rapid technological changes and competition in the industry drives the growth of the telecom sector, despite a less than optimal regulatory environment.
52 (The Island, 2011)
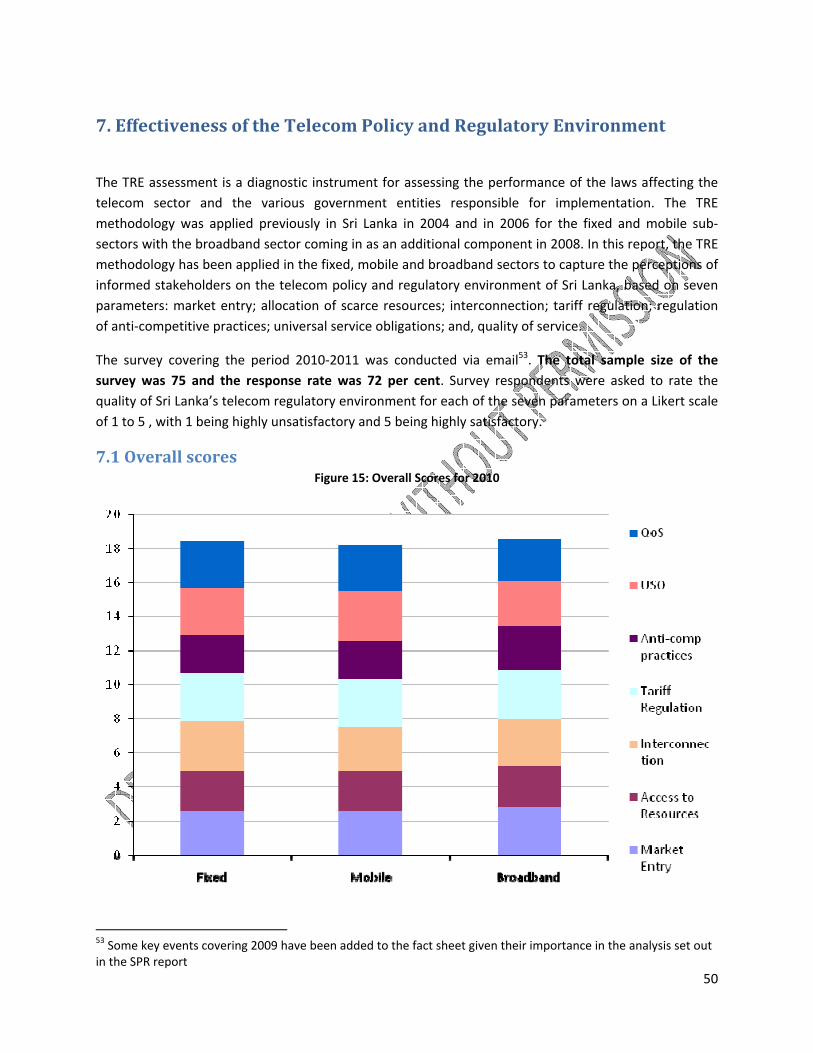
50
7. Effectiveness of the Telecom Policy and Regulatory Environment
The TRE assessment is a diagnostic instrument for assessing the performance of the laws affecting the telecom sector and the various government entities responsible for implementation. The TRE methodology was applied previously in Sri Lanka in 2004 and in 2006 for the fixed and mobile sub‐sectors with the broadband sector coming in as an additional component in 2008. In this report, the TRE methodology has been applied in the fixed, mobile and broadband sectors to capture the perceptions of informed stakeholders on the telecom policy and regulatory environment of Sri Lanka, based on seven parameters: market entry; allocation of scarce resources; interconnection; tariff regulation; regulation of anti‐competitive practices; universal service obligations; and, quality of service.
The survey covering the period 2010‐2011 was conducted via email53. The total sample size of the survey was 75 and the response rate was 72 per cent. Survey respondents were asked to rate the quality of Sri Lanka’s telecom regulatory environment for each of the seven parameters on a Likert scale of 1 to 5 , with 1 being highly unsatisfactory and 5 being highly satisfactory.
7.1 Overall scores Figure 15: Overall Scores for 2010
53 Some key events covering 2009 have been added to the fact sheet given their importance in the analysis set out in the SPR report
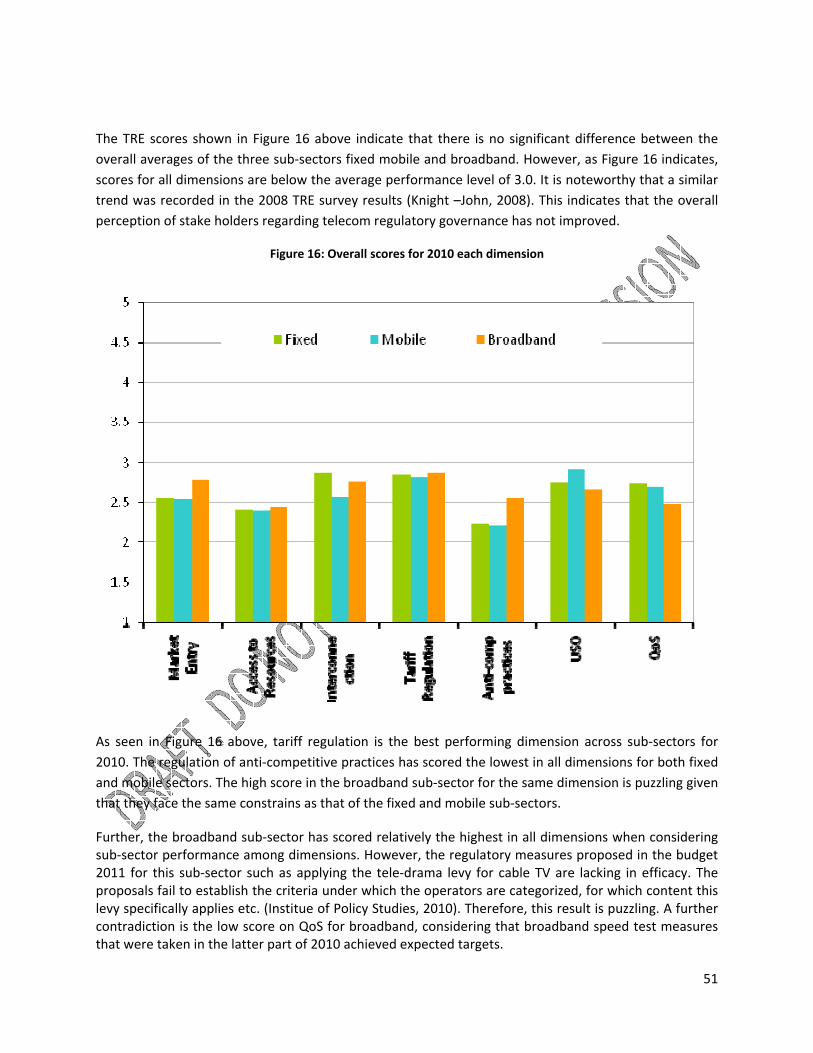
51
The TRE scores shown in Figure 16 above indicate that there is no significant difference between the overall averages of the three sub‐sectors fixed mobile and broadband. However, as Figure 16 indicates, scores for all dimensions are below the average performance level of 3.0. It is noteworthy that a similar trend was recorded in the 2008 TRE survey results (Knight –John, 2008). This indicates that the overall perception of stake holders regarding telecom regulatory governance has not improved.
Figure 16: Overall scores for 2010 each dimension
As seen in Figure 16 above, tariff regulation is the best performing dimension across sub‐sectors for 2010. The regulation of anti‐competitive practices has scored the lowest in all dimensions for both fixed and mobile sectors. The high score in the broadband sub‐sector for the same dimension is puzzling given that they face the same constrains as that of the fixed and mobile sub‐sectors.
Further, the broadband sub‐sector has scored relatively the highest in all dimensions when considering sub‐sector performance among dimensions. However, the regulatory measures proposed in the budget 2011 for this sub‐sector such as applying the tele‐drama levy for cable TV are lacking in efficacy. The proposals fail to establish the criteria under which the operators are categorized, for which content this levy specifically applies etc. (Institue of Policy Studies, 2010). Therefore, this result is puzzling. A further contradiction is the low score on QoS for broadband, considering that broadband speed test measures that were taken in the latter part of 2010 achieved expected targets.

52
Table 16: Comparing the average TRE scores for 2006, 2008 and 2010
Dimension
TRE Scores
Fixed Mobile Broadband
2006 2008 2010 2006 2008 2010 2006 2008 2010
Market Entry 2.7 2.7 2.6 3.1 2.8 2.5 2.4 2.8
Allocation of Resources 2.5 2.5 2.4 2.8 2.7 2.4 2.3 2.4
Interconnection 2.3 2.9 2.9 2.4 2.6 2.6 2.5 2.8
Tariff Regulation 2.7 2.7 2.9 2.9 2.7 2.8 2.5 2.9
Anti Comp Practices 2.4 2.7 2.2 2.6 2.7 2.2 2.7 2.6
USO 2.5 2.8 2.7 2.6 3 2.9 2.7 2.7
QoS 2.9 2.7 2.9 2.7 2.6 2.5
Overall 2.5 2.7 2.6 2.7 2.8 2.6 2.5 2.6
A comparison of TRE scores for 2006, 2008 and 2010 are presented in Table 16. Scores for the regulation of anti‐competitive practices have dropped for both fixed and mobile sectors. Regulation of interconnection in the fixed and mobile sectors has remained the same. This implies that stake holder grievances in this dimension such as the failure to implement the interconnection regime introduced in 2003 (as mentioned in Section 6), have not been addressed. These scores are further analyzed below under each dimension.
7.2 Market Entry
The TRE questionnaire for 2010 (contained in Annex 1A), defines the scope of market entry in terms of transparency of licensing and license conditions. There is marginal variation across sub‐sectors in this dimension.
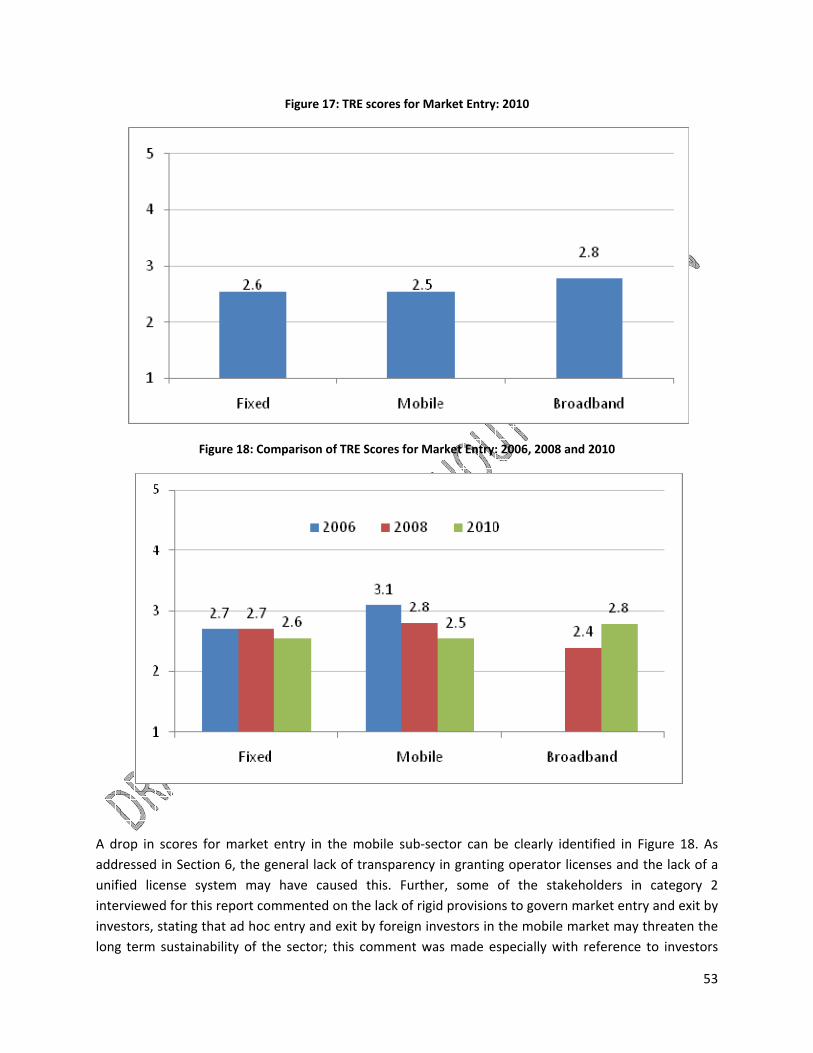
53
Figure 17: TRE scores for Market Entry: 2010
Figure 18: Comparison of TRE Scores for Market Entry: 2006, 2008 and 2010
A drop in scores for market entry in the mobile sub‐sector can be clearly identified in Figure 18. As addressed in Section 6, the general lack of transparency in granting operator licenses and the lack of a unified license system may have caused this. Further, some of the stakeholders in category 2 interviewed for this report commented on the lack of rigid provisions to govern market entry and exit by investors, stating that ad hoc entry and exit by foreign investors in the mobile market may threaten the long term sustainability of the sector; this comment was made especially with reference to investors
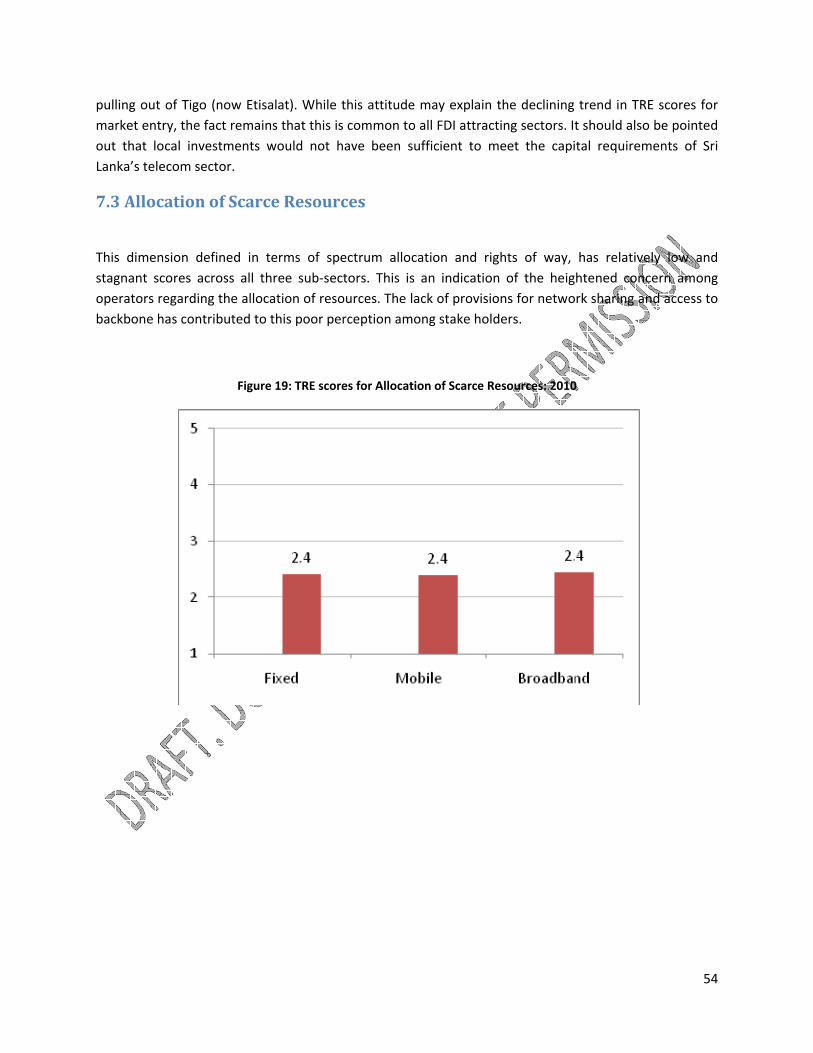
54
pulling out of Tigo (now Etisalat). While this attitude may explain the declining trend in TRE scores for market entry, the fact remains that this is common to all FDI attracting sectors. It should also be pointed out that local investments would not have been sufficient to meet the capital requirements of Sri Lanka’s telecom sector.
7.3 Allocation of Scarce Resources
This dimension defined in terms of spectrum allocation and rights of way, has relatively low and stagnant scores across all three sub‐sectors. This is an indication of the heightened concern among operators regarding the allocation of resources. The lack of provisions for network sharing and access to backbone has contributed to this poor perception among stake holders.
Figure 19: TRE scores for Allocation of Scarce Resources: 2010
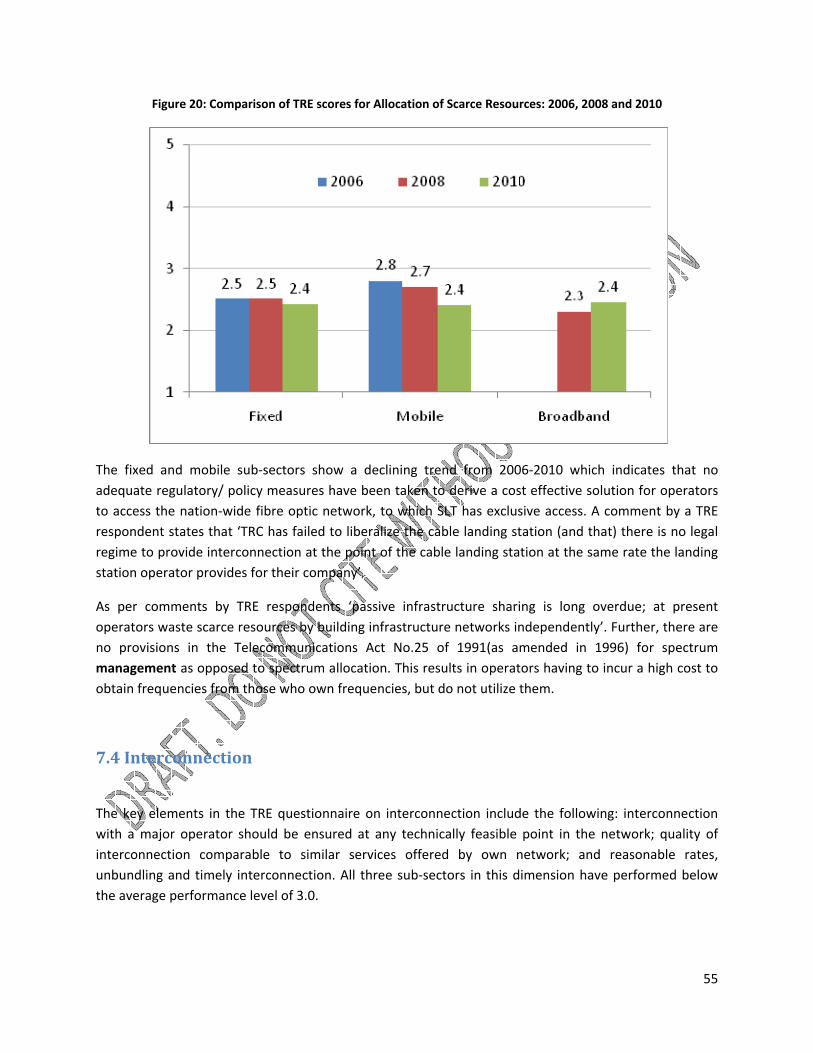
55
Figure 20: Comparison of TRE scores for Allocation of Scarce Resources: 2006, 2008 and 2010
The fixed and mobile sub‐sectors show a declining trend from 2006‐2010 which indicates that no adequate regulatory/ policy measures have been taken to derive a cost effective solution for operators to access the nation‐wide fibre optic network, to which SLT has exclusive access. A comment by a TRE respondent states that ‘TRC has failed to liberalize the cable landing station (and that) there is no legal regime to provide interconnection at the point of the cable landing station at the same rate the landing station operator provides for their company’.
As per comments by TRE respondents ‘passive infrastructure sharing is long overdue; at present operators waste scarce resources by building infrastructure networks independently’. Further, there are no provisions in the Telecommunications Act No.25 of 1991(as amended in 1996) for spectrum management as opposed to spectrum allocation. This results in operators having to incur a high cost to obtain frequencies from those who own frequencies, but do not utilize them.
7.4 Interconnection
The key elements in the TRE questionnaire on interconnection include the following: interconnection with a major operator should be ensured at any technically feasible point in the network; quality of interconnection comparable to similar services offered by own network; and reasonable rates, unbundling and timely interconnection. All three sub‐sectors in this dimension have performed below the average performance level of 3.0.

56
Figure 21: TRE scores for Interconnection: 2010
Figure 22: Comparison of TRE scores for Interconnection: 2006, 2008 and 2010
A comparison of scores for the years 2006, 2008 and 2010 for interconnection in Figure 22 above, indicates that scores for the fixed and mobile sectors remain relatively unchanged. However, considering that a new regime of interconnection charges has been implemented for the mobile sector in 2010, having had no such regulations in place in previous years, one would expect scores to reflect an improvement in the perception of stakeholders towards interconnection in the mobile sector.

57
7.5 Tariff Regulation
The TRE survey questionnaire defines this dimension as regulation of tariffs charged from consumers. As seen in Figure 23 below, scores across sub‐sectors for this dimension show no significant variation.
Figure 23: TRE Scores for Tariff Regulation: 2010
Figure 24: Comparison of TRE scores for tariff regulation in 2006, 2008 and 2010

58
Figure 24 above shows an improvement in the score for the fixed sub‐sector in 2010 as opposed to 2006 and 2008 in which the scores remained unchanged. There have been no regulatory developments in the sub‐sector. Therefore the increase in the score for 2010 is puzzling.
The score for 2010 in the mobile sub‐sector shows a marginal improvement from that of 2008. The TRC implemented a floor price of Rs 2 for local outgoing calls in July 2010, as a move to overcome losses in the sector following the price war in 2009 and the early stages of 2010. This should have been a reason for improvement in the sector in its regulatory capacity, supported by the fact that operators had a positive perception on this move (Lanka Monthly Digest, 2011).
However, it should be noted that it is the responsibility of the TRC to guarantee a competitive price to the consumer. At a time when consumers island‐wide were benefiting from low prices driven down by high competition, the implementation of a floor price with the intention of reviving the loss making telecom operators is questionable.
The improvement in broadband performance from 2008 to 2010 reflects the reduction in broadband prices by 95 per cent in 2011. Interviews conducted with the stakeholders indicate that although not strictly within the specified time limit of the survey, this had impacted stakeholder perception at the time of survey.
7.6 Regulation of AntiCompetitive Practices
The TRE questionnaire used for this survey include elements such as anti‐competitive cross subsidization, excessive prices, price discrimination and predatory pricing, refusal to deal with other operators and the sharing of towers and facilities by a parent company and subsidiaries in different segments of the market.
As seen in Figure 25 below the results for regulation of anti‐competitive practices are the low in the fixed and mobile sub‐sectors. This perception reflects the arguments set out in Section 6 such as the partially government‐owned fixed operator SLT and mobile operator Mobitel and the perceptions of cross subsidizations existing between them.

59
Figure 25: TRE scores for Regulation of Anti‐Competitive Practices: 2010
Figure 26: Comparison of TRE scores for Anti‐Competitive Practices: 2006, 2007 and 2010
Knight‐ John(2008) states that the improvements in comparative scores for 2006 and 2008 in the fixed and mobile sub‐sectors, are contrary to practices such as the sharing of facilities and cross subsidization within the SLT and Dialog groups, which are not captured in stakeholder perceptions. However, the comparative scores for 2008 and 2010 in these sectors which show sharp drops, reflect a more accurate result.
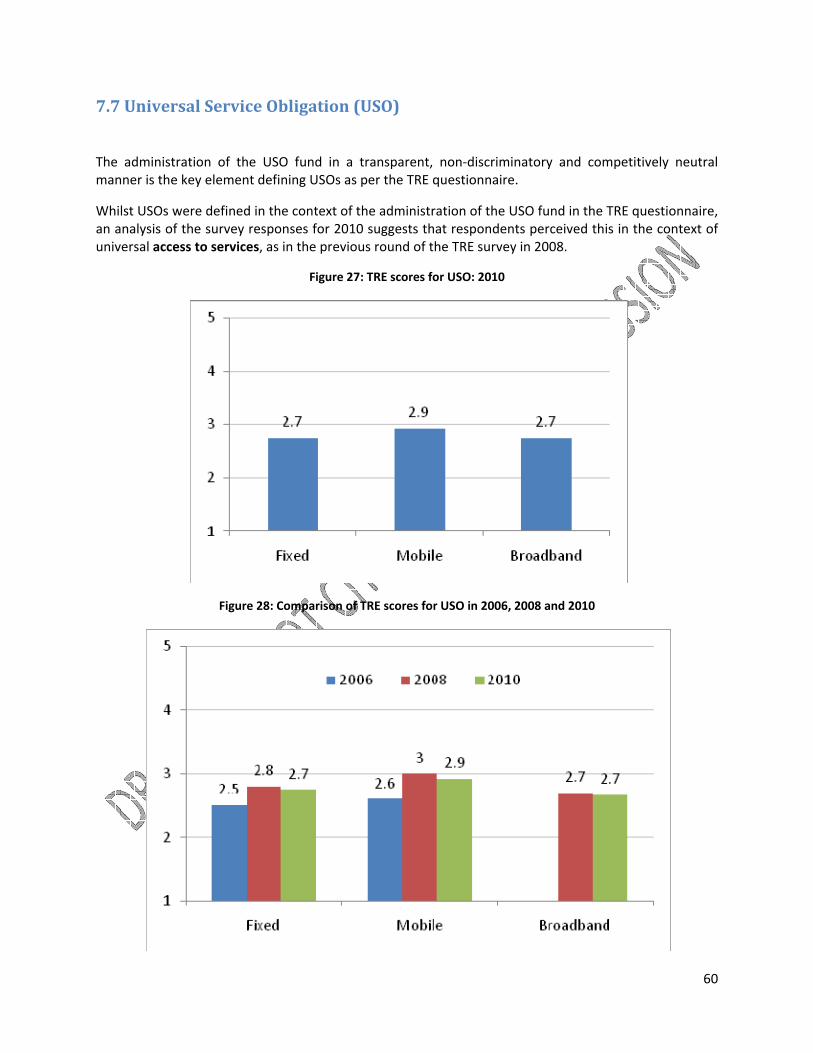
60
7.7 Universal Service Obligation (USO)
The administration of the USO fund in a transparent, non‐discriminatory and competitively neutral manner is the key element defining USOs as per the TRE questionnaire.
Whilst USOs were defined in the context of the administration of the USO fund in the TRE questionnaire, an analysis of the survey responses for 2010 suggests that respondents perceived this in the context of universal access to services, as in the previous round of the TRE survey in 2008.
Figure 27: TRE scores for USO: 2010
Figure 28: Comparison of TRE scores for USO in 2006, 2008 and 2010
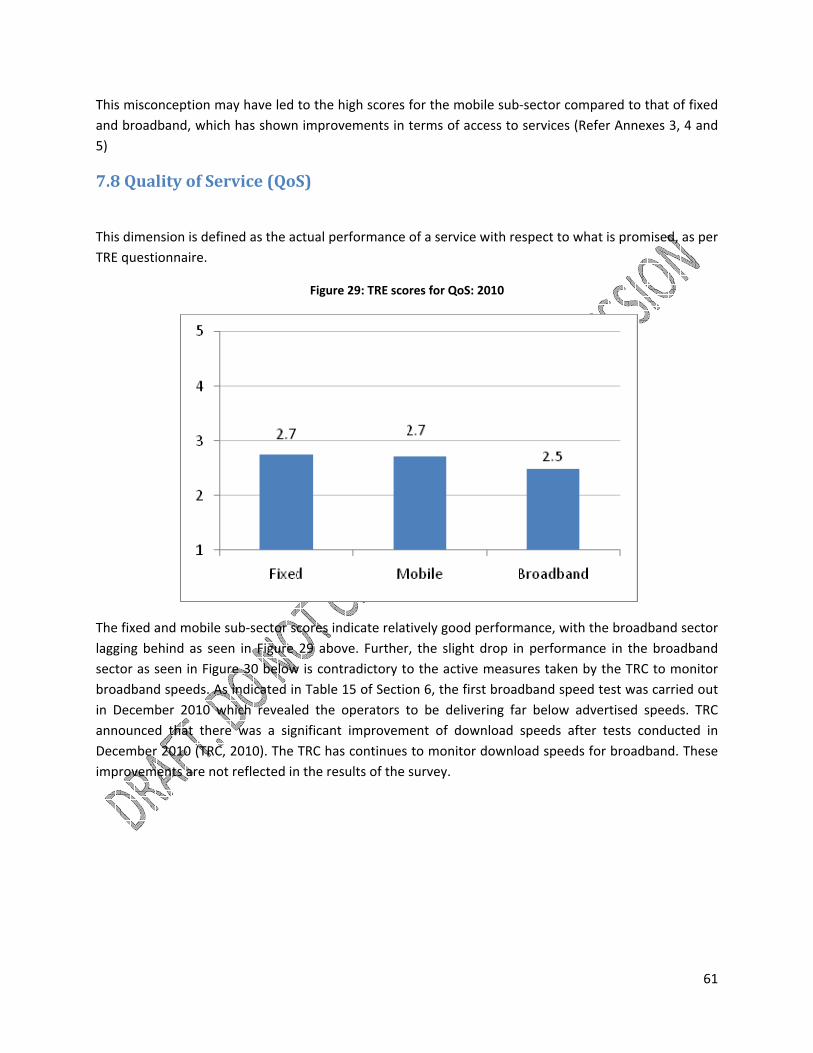
61
This misconception may have led to the high scores for the mobile sub‐sector compared to that of fixed and broadband, which has shown improvements in terms of access to services (Refer Annexes 3, 4 and 5)
7.8 Quality of Service (QoS)
This dimension is defined as the actual performance of a service with respect to what is promised, as per TRE questionnaire.
Figure 29: TRE scores for QoS: 2010
The fixed and mobile sub‐sector scores indicate relatively good performance, with the broadband sector lagging behind as seen in Figure 29 above. Further, the slight drop in performance in the broadband sector as seen in Figure 30 below is contradictory to the active measures taken by the TRC to monitor broadband speeds. As indicated in Table 15 of Section 6, the first broadband speed test was carried out in December 2010 which revealed the operators to be delivering far below advertised speeds. TRC announced that there was a significant improvement of download speeds after tests conducted in December 2010 (TRC, 2010). The TRC has continues to monitor download speeds for broadband. These improvements are not reflected in the results of the survey.

62
Figure 30: Comparative TRE scores for QoS: 2006, 2008, 2010
The decline in performance in the fixed and mobile sub‐sectors for the comparative years 2008 and 2010 can be seen in Figure 30 above. This reflects the increasing demand on network infrastructure and the resulting drop in quality of service provided, due to measures such as ‘half rate’ (as discussed in Section 4) that operators are compelled to resort to. Further comments by TRE survey respondents show that quality of service in the fixed sub‐sector is seldom monitored and that this ‘arises from the part‐state ownership and dominance of SLT’. Although the TRC website includes information on broadband speed monitoring, it does not include any information pertaining to monitoring fixed line services.
8. TRE Stakeholder Perceptions: Concluding Remarks
The general dissatisfaction among stake holders in the telecom sector is exhibited by the below average TRE scores for 2010. The overall average across sectors is the same for all three subsectors, fixed, mobile and broadband. Regulation of anti‐competitive practices and access to scarce resources have relatively lower scores than other dimensions. As such the following are the key conclusions which can be drawn from the analysis for 2010.
Three broad regulatory deficiencies arise out of our analysis of Sri Lanka’s telecom regulatory governance. Firstly, the efficacy of regulatory governance in Sri Lanka’s telecom sector is affected by the lack of workable concurrent jurisdiction. One example of this is the governance of the USF fund being assigned to the ICTA despite it being a legal responsibility of the TRC. Another is the complaints of

63
consumers being handled by both the TRC and the CAA although the Telecommunications Act provides the TRC with jurisdiction to resolve them.
Secondly, despite a clear trifurcation of policy, regulation and operation as specified in Sections 5, 17 and 66 of the Telecommunications Act No. 25 of 1991 (as amended), the independence of the TRC as a regulator is not observed in practice. The incumbent chairman of the TRC is also the Secretary to His Excellency the President. On the one hand, this is a violation of the provision of the Act as it states that the Secretary to the Ministry of Posts and Telecommunications is to be appointed the ex officio Chair of the TRC. On the other hand, the prevailing appointment as well as the provisions in the Act governing the appointment of the Chairman, makes the TRC susceptible to regulatory capture. Furthermore, bias towards operators such as SLT has influenced the TRC decisions from time to time as indicated by examples in Sections 3 and 6 such as failure to liberalize the network infrastructure and establish a system of access pricing. Thus influence of operators in regulatory decision making has also prevented the TRC from establishing a workable independence. Further, the very core of the Telecommunications Act is violated by the ownership of SLT by the government. This makes the government an operator at the same time acting as a regulator through the TRC, blurring the trifurcation established by the Act.
Thirdly, the TRC’s accountability is largely lacking in transparency. The process of granting of license to Bharti Airtel Lanka to establish operations and to SLT to own a mobile company have been less than transparent. The TRC deviated from the license process established in Section 17 of the Act as per Sri Lanka’s commitment to the GATS Reference Paper. Further, the information published by the TRC with regard to the regulatory process in itself is lacking in quality and validity. For example, as of the time of writing this report, details of the new mobile interconnection regime was not updated on the TRC website. A bench marking exercise carried out by Wattegama (2005) assigns a relatively lower ranking to the official website of the TRC (www.trc.gov.lk) in the categories of Consumer Information and Business Information.
Several key recommendations related to the regulatory environment emerge from the TRE 2010 survey. The first is the need to strengthen the regulatory governance applying to infrastructure. As indicated in Sections 3 and 4, infrastructural bottlenecks such as the lack of access to backbone and landing station hamper the growth of the telecom sector. Therefore the following reforms are imperative;
• Liberalize the exclusive hold of SLT on bottleneck resources such as fibre optic network and international cable landing station.
• Establish a formal access pricing system for these resources.
Further, we find in Section 6 that the sector is disposed to anti‐competitive practices as exhibited by the alleged cross subsidizations between Mobitel and SLT and network infrastructure dominance by SLT. Thus a sui generis anti‐competitive regime is crucial to guarantee regulatory justice in Sri Lanka. This conforms to the comments by respondents and the low TRE score of 2.2 assigned by respondents to Anti‐Competition in the fixed and mobile sectors.
Lastly, the issue of transparency and accountability needs to be addressed. We suggest that the TRC follow the PUCSL model in forming regulation, which we assert is the best practice in Sri Lanka. This
64
includes holding stake holder consultations prior to forming regulatory measures and making their outcome known to the public and introducing appropriate measures to hold the TRC accountable to parliament rather than a single ministry.
Annexure
Annex 1: What is a Telecom Regulatory Environment (TRE) Assessment?
This toolkit presents a methodology for measuring the telecom regulatory environment in a given country. The TRE assessment is a diagnostic instrument for assessing the performance of the laws affecting the telecom sector and the various government entities responsible for implementation. It is an important part of evaluating a country’s ICT sector’s performance.
The desired objective of telecom policy reform and regulation is improved sector performance, measured in four dimensions: connectivity, price, quality of service and choice. If the TRE scores are low (say, in comparing one dimension against another, in comparing scores for a particular year against another year, or in comparing scores for one country against the scores for another), it may be that the regulatory performance needs to be improved. However, the perception measure of the TRE needs to be assessed against actual sector performance indicators (of connections, price, quality and choice). In the case where sector performance indicators show performance that can be considered satisfactory but TRE scores are low, it may be possible that the problem is the communication of the regulatory actions. If the latter conclusion is reached, the appropriate action would be to improve the way the regulatory authority communicates its actions.
The TRE can also be used as a tool for investors to assess regulatory risk in a country, particularly by those considering investment opportunities in the telecom sectors of more than one country, with the TRE ranking of the countries indicating regulatory risk.
Investment and risk
Investment is necessary for improving sector performance and investment risk is the primary determinant in making investment decisions – the higher the risk, the higher the potential rate of return. At the point of investment, investors consider risks associated with three environments.
The macro‐level or country risk comprises factors that may affect the entire economy, such as inflation and foreign exchange fluctuations, as well as overall political stability. Market or commercial risk is comprised of factors such as demand, the effect of substitutable products and services, and performance of competitors. Regulatory risk refers to risks emanating from government action, including, but not limited to, the actions of the actual sector‐specific regulatory agency with authority over the industry in question.
Risk is partially a matter of objective analysis. An investor can calculate an expected rate of return on a new investment based on factors within his control and assumptions based on factors outside his

65
control. However, risk is, to a great extent, also a matter of perception. Macro‐level and regulatory risks are both difficult to measure objectively, but at a minimum, a subjective measure of both is necessary when making an investment.
The scope presented in this toolkit is the regulatory environment within which telecom operators and potential new entrants function; that is, a subset of the overall regulatory risk environment here described as the telecom regulatory environment, and which includes only telecom‐specific aspects.
The TRE methodology presented here is a measure of perception that is affected by a number of different factors. For example, the context of the investment (new versus incremental) and nature of the telecom sub‐sector (mobile versus fixed) will affect the perception of the TRE.
A Brief History
The original TRE instrument was designed to assess regulatory effects on investment (see Samarajiva & Dokeniya, 2005). It asked stakeholders to assess the telecom regulatory environment across five dimensions (market entry, allocation of scarce resources, interconnection, regulation of anti‐competitive practices and universal service obligation) for the fixed and mobile sectors.
The dimensions were adapted from the Reference Paper of the Fourth Protocol of the General Agreement on Trade in Services.54 A dimension for Tariff Regulation was added. The Reference Paper also refers to the Independence of the Regulator, but this was left out of the dimensions selected because it is seen as a process variable different from the other outcome variables.
The initial TRE surveys (the pilots as well as the 2006 implementation across six countries in Asia) therefore had a total number of 12 items (six for each sector) to be ranked. Learning from the 2006 survey, and in keeping with the changing nature of the telecom sector, new dimensions and new sectors were added and incorporated in the 2008 survey, as discussed below.
The process
The TRE asks senior level stakeholders to assess the Telecom Regulatory Environment in a country across a number of dimensions (listed below).
It makes considerable effort to keep to a small number of questions because the ideal respondents are senior managers, including CEOs of operators. A lengthy questionnaire runs the risk of being ignored or passed to more junior staff to complete.
The respondents are asked to rate the quality of the regulatory environment for each dimension on a scale ranging from 1 (highly ineffective) to 5 (highly effective). So the respondent has to select a score (1, 2, 3, 4 or 5) and simply circle it (or click, in the case of a web‐based survey). Posing questions in this format ensures that responses can be easily analysed without losing any qualitative information as often occurs when using open‐ended questions.
54 <http://www.wto.int/english/tratop_e/serv_e/telecom_e/tel23_e.htm>.

66
The TRE survey is administered at the same time in multiple countries (nine in the 2008 survey, six in the 2006 cycle) by a team of researchers. The survey questionnaire is sent out with a cover letter stating that participation is voluntary and that respondent’s confidentiality is guaranteed.
Each survey questionnaire is accompanied by a short narrative statement describing each of the dimensions, using language from the accompanying Reference Paper as much as possible. A brief summary of significant telecom policy and regulatory actions that were taken within the previous 12 months is also included.
Questionnaires are sent to large number respondents representing agreed‐upon sector categories. Follow‐up emails and phone calls are made to ensure a high response rate.
While the TRE Scores are the most direct output of a TRE study, more meaningful analysis is done by analysing the TRE scores in light of actual sector performance indicators for a particular country.
The three sectors
From 2008 onwards, TRE surveys are designed to address three sectors – fixed, mobile and broadband (prior to 2008, only the mobile and fixed sectors were surveyed).
It has been argued that with increased fixed‐mobile convergence, the separation between the fixed and mobile sectors is irrelevant. While this was apparent in the 2008 survey findings, regulation of fixed sectors still remains different to the regulation of the mobile sector in several countries. Therefore analyzing them separately may be quite important. Indeed, the convergence of fixed and mobile TRE scores will be one of the best pieces of evidence on actual (as opposed to wishful) fixed‐mobile convergence. On the other hand, India has now converged regulation of the two sectors; so, for this country, the two sectors are treated as one and it may be appropriate to send out a joint “fixed + mobile” questionnaire instead of two separate questionnaires.
As previously mentioned, in addition to the fixed and mobile sectors, the broadband sector was added to the 2008 survey. In the developing world, broadband access is emerging as a new ground for policy making and private sector service provision. Unlike the developed world, broadband may not mean the traditional fat pipe is reaching homes. Instead, most access may come from mobile broadband. Therefore, the term broadband refers to multiple modes of accessing the higher speed internet – be it through mobile phones, other mobile devices, internet kiosks or home PCs. Given that the survey is predominantly conducted in emerging economies, we take the lowest (slowest) commonly accepted definition of Broadband, which defines it as “an ‘always on’ internet connection with a minimum download/upload speed of 256kbps” (OECD 2007).
As noted above, all three sectors may not be applicable to all countries. Furthermore, other minor definitional changes may also need to be made. These country‐specific variations to the methodology should be discussed with LIRNEasia/RIA!/DIRSI or the relevant coordinator and agreed upon prior to conducting the survey.
The seven dimensions

67
For each of the three sectors mentioned above, the respondent will assess (i.e. provide a score on a scale of 1 – 5 for) each of the following seven dimensions:
1. Market entry
2. Allocation of scarce resources
3. Interconnection
4. Regulation of anti‐competitive practices
5. Universal service obligation
6. Tariff regulation
7. Quality of Service
Of these, the first five dimensions are based on the Reference Paper of the Fourth Protocol of the General Agreement on Trade in Services and reflect the broadest international consensus of the most important aspects of telecom regulation.55
Tariff Regulation was added following pilot studies and input from researchers.
Based on early 2008 discussions at LIRNEasia, it was agreed that Quality of Service (QoS) is increasingly important. While the traditional (incumbent‐led) fixed sector always had basic QoS measurements, increasingly QoS for mobile is becoming important – for example, completing a financial transaction via the various m‐payment methods is only feasible if the mobile signal does not drop half‐way through the transaction. Similarly, depending on the application being used, Broadband QoS becomes increasingly important (e.g. simply browsing can tolerate higher levels of latency that VoIP applications simply cannot). At the moment, objective measures for measuring Broadband and Mobile QoS are neither common nor standardised. However, meaningful perception measures about regulation relating to QoS can go a long way in putting QoS on the regulatory and policy agendas.
The Likert Scale
Using the Likert Scale, each of the seven dimensions is scored on a scale of 1 to 5, where 1 is Highly Ineffective and 5 is Highly Effective. The Likert Scale is a well‐known psychometric response scale often used in questionnaires.
The raw data collected for the survey using the Likert Scale is ordinal data and, therefore, the distinction between neighbouring points on the scale is not necessarily always the same. For instance, the difference in effectiveness expressed by giving a score of 4 rather than 3 might be much less than the difference in effectiveness expressed by giving a score of 5 rather than 4.
55 The WTO Reference Paper also contains a dimension for independence of the regulator. However because it is seen as a process variable different from the other outcome variables, it is not included in the TRE dimensions.

68
Since the data collected is summarised in the final TRE scores, it is possible to transform the 1 to 5 scale to a different scale like ‐2 to 2 which makes it easier to interpret. However, there is a possibility that a transformed scale portrays a different level of perception to the respondent. For example, giving a score of 3 in a 1 to 5 scale and giving a score of 0 in a ‐2 to 2 scale might not appear the same for some respondents. Therefore it is recommended that the 1 to 5 scale be kept constant in doing the TRE survey.
Clearly, the Likert Scale may be subject to distortion. Respondents may avoid extreme scores (central tendency bias); or may try to portray themselves or their organisation in a more favourable light (social desirability bias).
The Respondents: Categories, Weights, Minimum Numbers
Categories
The different stakeholders that are involved in the TRE have been grouped into three categories according to their common interests.
• Category 1: Stakeholders directly affected by telecom sector regulation
o E.g. Operators, Industry associations, Equipment suppliers, Investors
• Category 2: Stakeholders who analyse the sector with broader interest
o E.g. Financial institutions, Equity Research Analysts, Credit Rating Agencies, Telecom consultants, Law firms
• Category 3: Stakeholders with an interest in improving the sector to help the public
o E.g. Academics, Research organisations, Journalists, Telecom user groups, Civil society, Former members of regulatory and other government agencies, Donors, Current government employees from organizations related to the telecom sector EXCLUDING those in the telecom regulatory & policy hierarchy (i.e. excludes anyone from the regulatory agency, policy making body (often Ministry of Post and Telecom or similar), the Minister in charge of Telecommunications etc.)
Note that certain Financial Institutions (listed in category 2) may take an equity stake in an operator and, thereby, may also be an Investor (category 1). It could also be that within the same financial institution, respondents from one unit (say, the Equity Research division) falls into Category 2 (since they analyse the sector as a whole) while another unit (say, the Investment/Asset Management division that owns shares of the operator) falls into Category 1. In such instances the researcher must deal with the categorisation of respondents on a case‐by‐case basis.

69
Weights
Contributions from each category are of identical importance to the final TRE scores. Therefore, if there are an equal number of respondents for each category, the TRE Assessment will reflect the views of the respondents of each category in an equal manner.
However, if response rates differ and the sample selection procedure does not produce an equal numbers of respondents from each category, then an overrepresentation of some categories and underrepresentation of others will result. This will cause problems in comparison.
Ideally, each category should make the same contribution to the final result. In order to achieve this balanced representation, overrepresented categories are given a weight of less than one and underrepresented categories are given a weight of greater than one, in such a way that all three categories equally contribute to the final score.
Minimum number of respondents
Even though weighting deals with numerical imbalance, it is important to have a sufficient number of respondents for all three categories because the sample size determines the precision with which population values can be estimated; i.e. the larger the sample, the more precise the estimate. As a practical matter, sample size is often the dominant factor in determining the precision because very few respondents from a particular category will make the final TRE score highly sensitive to each respondent’s input in that category.
Having taken the above factors in to account, as well as the practical constraints associated with the survey, it is necessary to have a minimum of 15 respondents from each category in any country (for a minimum of 45 total respondents). Only in micro‐states (e.g. Bhutan, Maldives and countries with populations of under or around 1 million), a minimum of 5 respondents from each category is accepted (for a minimum of 15 total respondents).
Having a larger number of respondents per category also allows more sophisticated analysis without compromising the respondent’s anonymity. For example, category 1 represents players who are already in the market. Certain regulatory regimes may unduly favour those who have already passed (by whatever means) the barrier to entry. For these respondents, overly cumbersome market entry procedures may indeed serve as a positive and keep new entrants out. However to analyse at the level of respondent categories, a larger data set is required.
TRE Respondent Profile
Stakeholder Category Number of Respondents (this indicates the total number of questionnaires sent out under each stakeholder category) Response Rate (%)
70
Category 1 25 56
Category 2 25 84 Category 3
25 76 TOTAL
75 72

71
Annex 1A: TRE Cover Letter
February, 14th, 2011
Dear Respondent, LIRNEasia, is conducting a Perception Survey of the Telecom Regulatory Environment (TRE) in Sri Lanka as part of a multi‐country comparative research project of the regulatory and policy environment within Asian countries. Ms. Malathy Knight, Research Fellow, Institute of Policy Studies of Sri Lanka (IPS) will be conducting the survey in Sri Lanka on behalf of LIRNEasia. TRE surveys have already been implemented in a number of countries. An explanation of the TRE methodology, along with the 2008 results for Asia, is available at http://lirneasia.net/wp‐content/uploads/2009/10/GalpayaSamarajiva_TRE_ITS2009_v5.pdf. The TRE Assessment for Sri Lanka will be conducted at regular intervals, and will provide key stakeholders with an overview of the telecom regulatory and policy environment in the country. You have been chosen to complete this questionnaire because you have been identified as an expert or an important stakeholder in the telecom sector. We invite you to complete a short questionnaire that will take less than 7 minutes of your time. There are 21 short questions, and you need to indicate your score for each on a scale of 1 to 5. If you feel you do not have sufficient information about a particular question, you may choose to leave it blank. The questionnaire is accompanied by a summary of significant telecom policy and regulatory actions taken over the previous 12 months for your reference. All responses will be kept confidential and anonymity is guaranteed. No individual response will be disclosed under any circumstance. Only aggregated scores will be reported per country. A copy of the final Sri Lanka country study will be sent to you on completion. Participation in this survey is voluntary and you have the right to terminate the survey at any time. LIRNEasia and Ms. Malathy Knightwill ensure that your responses will remain confidential. If you have any questions or concerns about this project or about LIRNEasia please do not hesitate to contact me on [email protected] or 0094112671160. Additional information about our organisation and activities can be found on our website: www.lirneasia.net.
Sgd.
Helani Galpaya
TRE Study Coordinator/ Chief Operating Officer
LIRNEasia

72
Annex 1B: TRE Questionnaire
Questionnaire Number : ………………
Telecom Regulatory Environment for Sri Lanka
You are kindly requested to make your frank assessments of the telecom regulatory environment (TRE) for the period ending January 2011 for the fixed, mobile and broadband telecom sectors on a five-point scale.
The dimensions used in this questionnaire are broadly based on the Reference Paper of the Fourth Protocol of the General Agreement on Trade in Services and are briefly described below. A fact-sheet of key events in the Telecom Regulatory Environment is also attached for your reference for the period July 2009 – January 2011.
Completing the questionnaire should take 5-7 minutes of your time. Please email the completed questionnaire to [email protected] or fax it to 011-2665065 (ATTN: Buddhika). Please find below a table defining the dimensions covered in the survey for your reference while completing the survey to follow.
Dimension Aspects Covered
Market Entry Transparency of licensing. Applicants should know the terms, conditions, criteria and length of time needed to reach a decision on their application. License conditions. Exclusivity issues.
Scarce Resources Timely, transparent and non‐discriminatory access to spectrum allocation. Numbering and rights of way: frequency allocation, telephone number allocation, tower location rights.
Interconnection
Interconnection with a major operator should be ensured at any technically feasible point in the network. Quality of interconnection comparable to similar services offered by own network. Reasonable rates for interconnection. Unbundling of interconnection. Interconnection offered without delay. Sharing of incoming and outgoing IDD revenue. Payment for cost of interconnection links and switch interface. Payment for cost of technical disruption of interconnection.
Tariff Regulation Regulation of tariffs charged from consumers.
Regulation of Anti‐Competitive Practices
Anti‐competitive cross subsidisation. Using information obtained from competitors with anti‐competitive results. Not making technical information about essential facilities and commercially relevant information available to competitors on a timely basis. Excessive prices. Price discrimination and predatory low pricing. Refusal to deal with operators and other parties. Vertical restraints. Technical disruption of interconnection. Sharing of towers and facilities by parent company and subsidiaries in different segments of the market.
Universal Service Obligation (USO)
Administration of the universal service program/fund in a transparent, non‐discriminatory and competitively neutral manner and is not more burdensome than necessary for the kind of universal service defined by the policymakers.
Quality of Service (QoS)
The actual performance of a service with respect to what is promised, depending upon the network traffic control mechanisms. Specific criteria may be call quality (for mobile and fixed), connection speeds or throughput (for broadband)
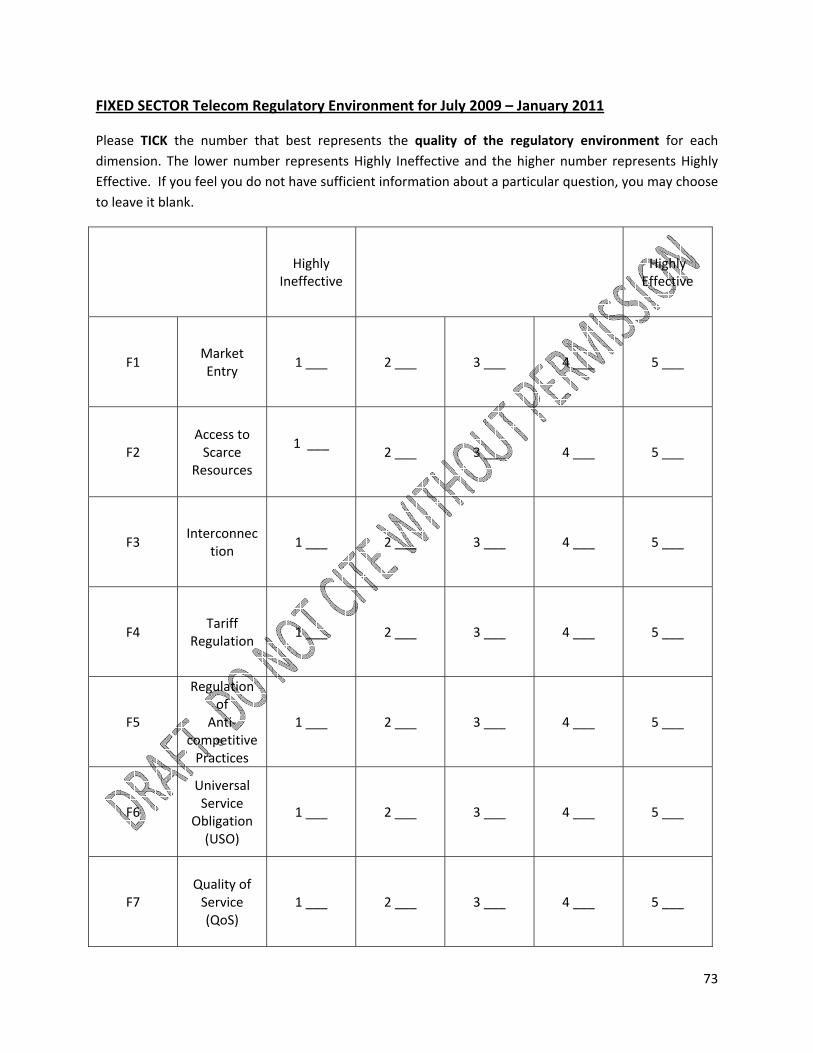
73
FIXED SECTOR Telecom Regulatory Environment for July 2009 – January 2011
Please TICK the number that best represents the quality of the regulatory environment for each dimension. The lower number represents Highly Ineffective and the higher number represents Highly Effective. If you feel you do not have sufficient information about a particular question, you may choose to leave it blank.
Highly
Ineffective
Highly Effective
F1 Market Entry
1 ___ 2 ___ 3 ___ 4 ___ 5 ___
F2 Access to Scarce
Resources
1 ___
2 ___ 3 ___ 4 ___ 5 ___
F3 Interconnec
tion 1 ___ 2 ___ 3 ___ 4 ___ 5 ___
F4 Tariff
Regulation 1 ___ 2 ___ 3 ___ 4 ___ 5 ___
F5
Regulation of
Anti‐competitive Practices
1 ___ 2 ___ 3 ___ 4 ___ 5 ___
F6
Universal Service
Obligation (USO)
1 ___ 2 ___ 3 ___ 4 ___ 5 ___
F7 Quality of Service (QoS)
1 ___ 2 ___ 3 ___ 4 ___ 5 ___

74
Comments:
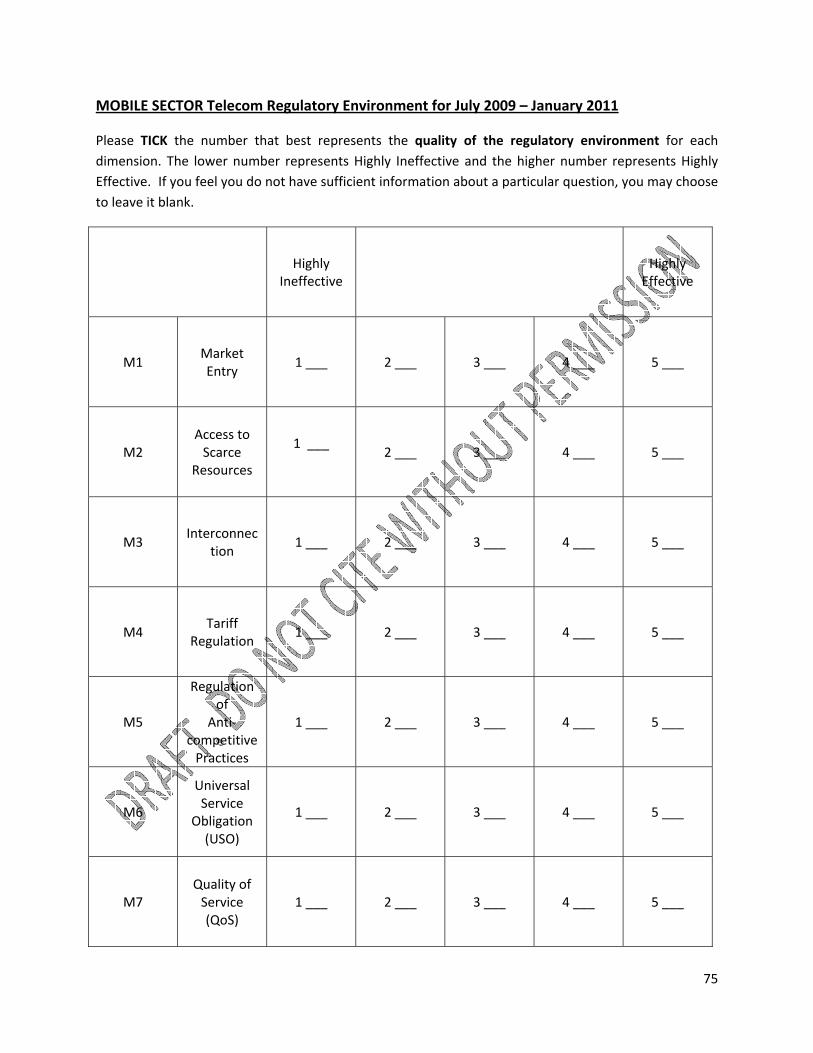
75
MOBILE SECTOR Telecom Regulatory Environment for July 2009 – January 2011
Please TICK the number that best represents the quality of the regulatory environment for each dimension. The lower number represents Highly Ineffective and the higher number represents Highly Effective. If you feel you do not have sufficient information about a particular question, you may choose to leave it blank.
Highly
Ineffective
Highly Effective
M1 Market Entry
1 ___ 2 ___ 3 ___ 4 ___ 5 ___
M2 Access to Scarce
Resources
1 ___
2 ___ 3 ___ 4 ___ 5 ___
M3 Interconnec
tion 1 ___ 2 ___ 3 ___ 4 ___ 5 ___
M4 Tariff
Regulation 1 ___ 2 ___ 3 ___ 4 ___ 5 ___
M5
Regulation of
Anti‐competitive Practices
1 ___ 2 ___ 3 ___ 4 ___ 5 ___
M6
Universal Service
Obligation (USO)
1 ___ 2 ___ 3 ___ 4 ___ 5 ___
M7 Quality of Service (QoS)
1 ___ 2 ___ 3 ___ 4 ___ 5 ___

76
BROADBAND SECTOR Telecom Regulatory Environment for July 2009 – January 2011
Please TICK the number that best represents the quality of the regulatory environment for each dimension. The lower number represents Highly Ineffective and the higher number represents Highly Effective. If you feel you do not have sufficient information about a particular question, you may choose to leave it blank.
Highly
Ineffective
Highly Effective
B1 Market Entry
1 ___ 2 ___ 3 ___ 4 ___ 5 ___
B2 Access to Scarce
Resources
1 ___
2 ___ 3 ___ 4 ___ 5 ___
B3 Interconnec
tion 1 ___ 2 ___ 3 ___ 4 ___ 5 ___
B4 Tariff
Regulation 1 ___ 2 ___ 3 ___ 4 ___ 5 ___
B5
Regulation of
Anti‐competitive Practices
1 ___ 2 ___ 3 ___ 4 ___ 5 ___
Comments:
77
B6
Universal Service
Obligation (USO)
1 ___ 2 ___ 3 ___ 4 ___ 5 ___
B7 Quality of Service (QoS)
1 ___ 2 ___ 3 ___ 4 ___ 5 ___
Comments:
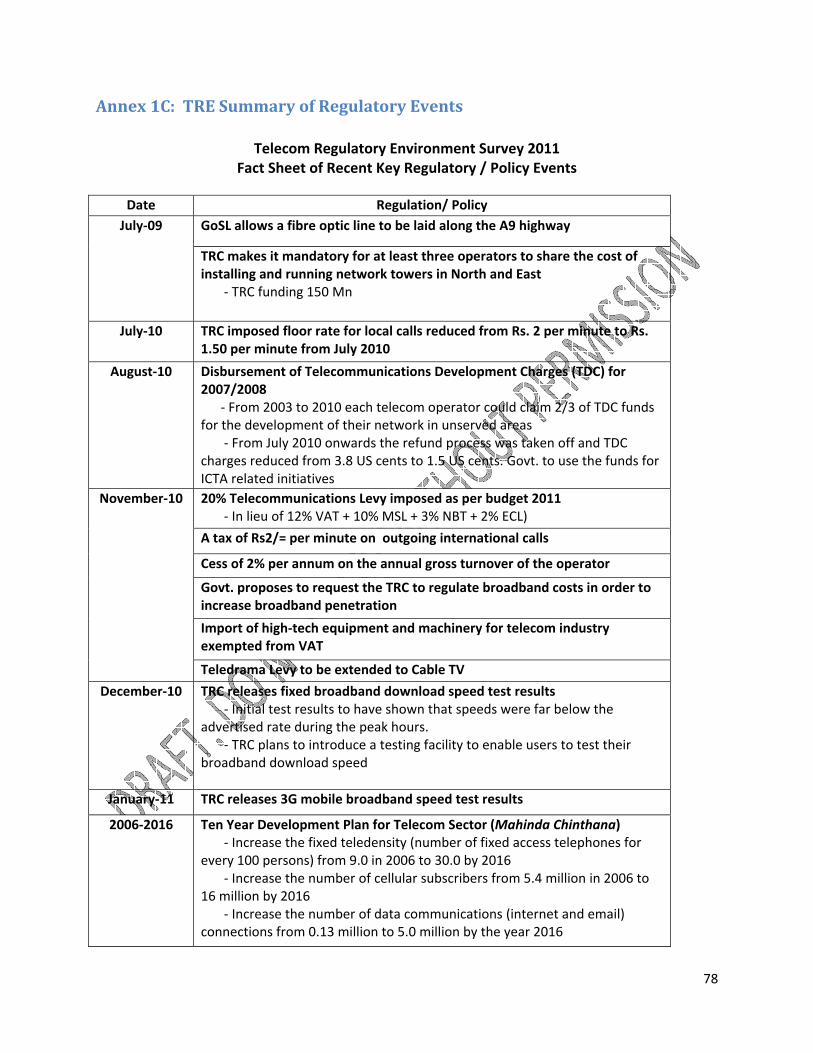
78
Annex 1C: TRE Summary of Regulatory Events
Telecom Regulatory Environment Survey 2011 Fact Sheet of Recent Key Regulatory / Policy Events
Date Regulation/ Policy July‐09 GoSL allows a fibre optic line to be laid along the A9 highway
TRC makes it mandatory for at least three operators to share the cost of installing and running network towers in North and East ‐ TRC funding 150 Mn
July‐10 TRC imposed floor rate for local calls reduced from Rs. 2 per minute to Rs. 1.50 per minute from July 2010
August‐10 Disbursement of Telecommunications Development Charges (TDC) for 2007/2008 ‐ From 2003 to 2010 each telecom operator could claim 2/3 of TDC funds for the development of their network in unserved areas ‐ From July 2010 onwards the refund process was taken off and TDC charges reduced from 3.8 US cents to 1.5 US cents. Govt. to use the funds for ICTA related initiatives
November‐10 20% Telecommunications Levy imposed as per budget 2011 ‐ In lieu of 12% VAT + 10% MSL + 3% NBT + 2% ECL)
A tax of Rs2/= per minute on outgoing international calls
Cess of 2% per annum on the annual gross turnover of the operator
Govt. proposes to request the TRC to regulate broadband costs in order to increase broadband penetration
Import of high‐tech equipment and machinery for telecom industry exempted from VAT
Teledrama Levy to be extended to Cable TV
December‐10 TRC releases fixed broadband download speed test results ‐ Initial test results to have shown that speeds were far below the advertised rate during the peak hours. ‐ TRC plans to introduce a testing facility to enable users to test their broadband download speed
January‐11 TRC releases 3G mobile broadband speed test results
2006‐2016 Ten Year Development Plan for Telecom Sector (Mahinda Chinthana) ‐ Increase the fixed teledensity (number of fixed access telephones for every 100 persons) from 9.0 in 2006 to 30.0 by 2016 ‐ Increase the number of cellular subscribers from 5.4 million in 2006 to 16 million by 2016 ‐ Increase the number of data communications (internet and email) connections from 0.13 million to 5.0 million by the year 2016

79
Ministry of Posts and Telecommunications Formulation of General Policy Guidelines
The Telecom Regulatory Commission of Sri Lanka (TRCSL) Responsibilities of TRCS*
• Enforcement of the provisions in the Act and conditions in the licenses by the licensed operators. • Fostering fair and sustainable competition among the licensed operators.
o Monitoring competition to ascertain whether operators are meeting public interests objectives. o To ensure seamless interconnection between networks and services. o Establishing a general framework of open entry, non‐burdensome and transparent licensing
• Pricing o Ensure that telecommunication services are reasonably priced, taking in to consideration affordability etc.
• Consumer Protection o To have consumer safeguards in place, and to encourage citizen participation and open dialogue by conducting inquiries in to
complaints made by consumers and members of the public. • Social Regulation
o Universal Access/Services: ensuring provision of universal access/services to the rural communities, elderly and people who are differently able
o Emergency preparedness o To make telecommunication services available for people with disabilities
• Regulation of bottleneck facilities and scarce resources o Spectrum Management o Numbering o Rights of Way o Space segment
• High quality telecommunication services o To ensure that telecommunication services are of a high quality which are just, reasonable and affordable and which will satisfy
the needs of the consumers. • Promote Good Governance.
o To ensure a transparent decision making process, encouraging public participation and giving timely decisions by following principles of natural justice
• To ensure that decisions taken by the TRC are fair and impartial. • To help to a civil society by making the society an "informed" society in this modern information age • In keeping with the vision of TRC, endeavour to be in the forefront of telecommunication regulation
Information and Communication Technology Agency (ICTA)
i. Administration of the Universal Service Fund (USF) through e‐Sri Lanka initiative ii. Facilitate ICT infrastructure islandwide through Nenasala, Lanka Gate, Lanka Government Network*
Consumer Affairs Authority (Consumer Affairs Authority Act No.9 of 2003)
Safeguard consumer rights and interests through consumer empowerment, regulation of trade and
promotion of healthy competition
Operators
Telecommunication Reference Paper under the WTO’s General Agreement on Trade in Services (GATS)
This reference paper includes directives for the provision of essential facilities, competitive safeguards, interconnection procedures, USO, licensing criteria, independent regulators and the allocation of scarce resources.
Annex: 2: Structure of Sri Lanka’s Telecom Regulatory Environment

80
Annex 3: Dialog GSM Coverage
Source: (Dialog Axiata PLC, 2009)
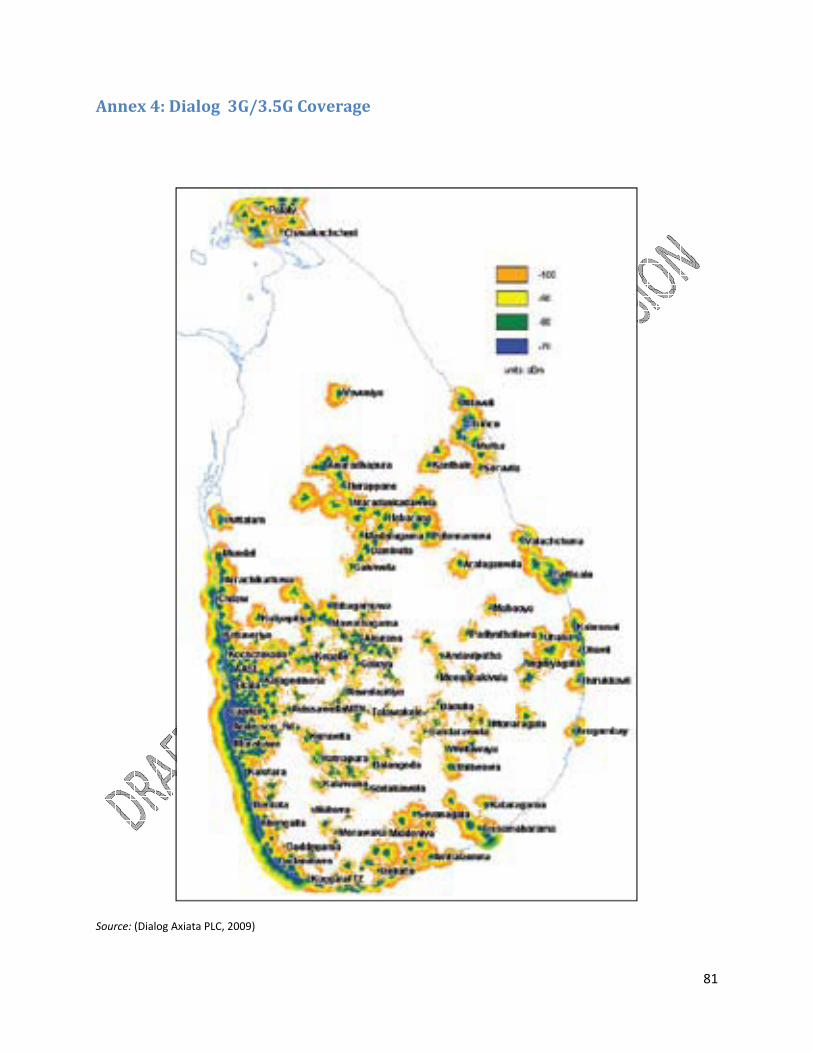
81
Annex 4: Dialog 3G/3.5G Coverage
Source: (Dialog Axiata PLC, 2009)

Annex 52010
S
5: Provinc
Source: the TRC
cial Distribbution of F Fixed Phonnes in Sri L Lanka as a at Decemb
82
ber
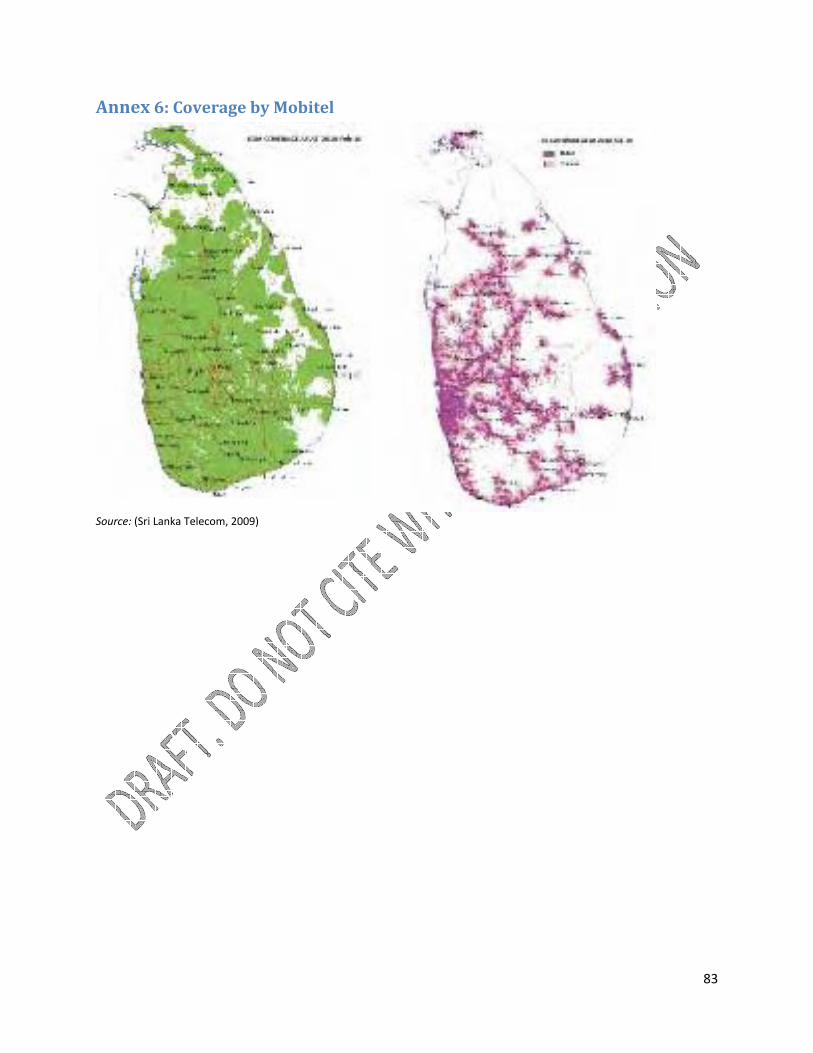
83
Annex 6: Coverage by Mobitel
Source: (Sri Lanka Telecom, 2009)
84
Bibliography
(2011, March 29). Retrieved April 04, 2011, from Lanka Business Online: http://www.lbo.lk/fullstory.php?nid=337556589
(2011, April). Retrieved April 2011, from Official Government Website of Sri Lanka: http://www.priu.gov.lk/news_update/Current_Affairs/ca201104/20110411we_stepping_into_period_great_prosperity.htm
(2011). Retrieved April 2011, from Investopedia ULC: http://www.investopedia.com/terms/h/hhi.asp
Balasooriya, A. Building Better Governance: The Case of Sri Lanka Telecommunications Industry Reforms. Fourth Comminication Policy Research South Conference. Negambo.
Business Today. (2011, April). Retrieved April 2011, from Business Today: http://www.businesstoday.lk/article.php?article=1671
Central Bank. (Various Years). Annual Report. Retrieved April 2011, from Central Bank.
Central Bank of Sri Lanka. (2009). Annual Report of 2009. Retrieved April 2011, from Central Bank of Sri Lanka: http://www.cbsl.gov.lk/pics_n_docs/10_pub/_docs/efr/annual_report/ar2009e/ar09_content_2009_e.htm
Daily Financial Times. (2011, January 21). Retrieved April 04, 2011, from Daily Financial Times: http://www.ft.lk/2011/01/21/sri‐lanka‐the‐next‐international‐hub/
Department of Census and Statistics. (2011, March 10). Retrieved April 2011, from Department of Census and Statistics: http://www.statistics.gov.lk/page.asp?page=Income%20and%20Expenditure
Dialog Axiata PLC. (2009). Annual Report 2009 .
Dialog Axiata PLC. (2009). Annual Report 2009. Colombo.
E‐Chanelling. (2011). Retrieved April 2011, from E‐Chanelling: www.eChannelling.com
Government of Sri Lanka. (2011, February 13). Sri Lanka to set up a National Backbone network . Retrieved April 2011, from The Official Govewrnment News Portal of Sri Lanka: http://www.news.lk/home/17361‐sri‐lanka‐to‐set‐up‐a‐national‐backbone‐network
ICTA. (2009, December 23). Retrieved March 2011, from ICTA: http://www.icta.lk/en/icta/90‐general/766‐dcs‐completed‐3rd‐national‐computer‐literacy‐survey.html
ICTA. (2009, October 26). Retrieved April 2011, from ICTA: http://www.icta.lk/index.php/en/icta/90‐general/739‐e‐sri‐lanka‐transforming‐a‐nation‐through‐ict

85
ICTA. (2010, March Monday). IT sector reaching billion US $ . Retrieved April 2011, from ICTA: http://www.icta.lk/en/icta/90‐general/835‐it‐sector‐reaching‐billion‐us‐.html
Institue of Policy Studies. (2010). Budget 2011: Preliminary Observations on Changes to Telecommunications Sector Taxes. Talking Economics Digest , 19.
Knight‐John. (2005). Retrieved April 2011, from Center on Regulation and Competition: http://www.competition‐regulation.org.uk/publications/working_papers/
Knight‐John. (2008). Telecom Regulatory and Policy Environment in Sri Lanka: Results and Analysis of the 2008 TRE Survey. Retrieved March 2011, from Lirneasia: www.lirneasia.net/wp‐content/.../TRE_SriLanka_Final_2008Nov28.pdf
Lanka Business Online. (2010, November 23). Retrieved April 2011, from Lanka Business Online: http://www.lbo.lk/fullstory.php?nid=403529985
Lanka Business Online. (2010, August 13). Retrieved April 2011, from Lanka Business Online: http://www.lbo.lk/fullstory.php?nid=1509249539
Lanka Business Online. (2011, Fabruary 11). Retrieved April 2011, from Lanka Business Online: http://www.lbo.lk/fullstory.php?nid=551759626
Lanka Business Online. (2009, December 15). Capital Question. Retrieved April 2011, from Lanka Business Online: http://www.lankabusinessonline.com/fullstory.php?nid=1948308066
Lanka Business Online. (2010, October 27). Connectivity Key. Retrieved April 2011, from Lanka Business Online: http://www.lbo.lk/fullstory.php?nid=1196316707
Lanka Business Online. (2010, July 5). Data Host. Retrieved April 2011, from Lanka Business Online: http://www.lbo.lk/fullstory.php?nid=1844703160
Lanka Business Online. (2010, June 26). Transport Blues. Retrieved April 2011, from Lanka Business Online: http://www.lbo.lk/fullstory.php?nid=1679427079
Lanka Business Report. (2011, March 4). Sri Lanka mobile internet usage poised for growth: Nielsen . Retrieved April 2011, from Lanka Business report: http://www.lbr.lk/fullstory.php?nid=201103041615077468
Lanka Gazette. (2010, September 6). Mobile Penetration Up. Retrieved April 2011, from Lanka Gazette: http://lankagazette.com/business/mobile‐penetration‐up/
Lanka Monthly Digest. (2011, April 1). Retrieved April 2011, from Lanka Monthly Digest: http://lmd.lk/2011/04/01/generation‐2/
Lirneasia. (2010). Retrieved April 2011, from Lirneasia: http://lirneasia.net/projects/ict‐indicators/
86
Ministry of Finance and Planning. (2011). Retrieved April 2011, from Official Website of the Minstry of Finance and Planning: http://www.treasury.gov.lk/EPPRM/npd/publication.htm
Ministry of Finance and Planning. (2011). Retrieved April 2011, from Official Website of the Ministry of Finance and Planning: http://www.treasury.gov.lk/FPPFM/fpd/annualreports.htm
Ministry of Finance and Planning. (Various Years). Fiscal Management Report. Ministry of Finance and Planning, Sri Lanka.
Ministy of Finance and Planning. (2011). Retrieved April 2011, from Official Website of Ministry of Finance and Planning: www.telecentre.org/profiles/blogs/icta‐gets‐ready‐for‐the‐2nd
Radwan, I. (2007). Finding Sri Lanka's Offshoring Niche.
Samarajiva, R. (2002). Utility Regulation and Competition Policy in Sri Lanka: Prospects for Change. In L. a. Trust, Competition Policy and Utility Regulation: the Sri Lankan Experience (pp. 1‐25). Colombo.
Samarajiva, R. a. (2004). Regulation and Investment: Sri Lanka Case Study, including a Pilot Assessment of the Telecom Regulatory Environment. WDR Dialogue Theme 2003.
Samarajiva, R. (2010, February 8). Prerequisites for making Sri Lanka a hub: Telecom. Retrieved April 2011, from Lanka Business Online: http://www.lbo.lk/fullstory.php?nid=795963279
Silva, H. d. (2010). The need for an efficient bus and train ticket sale‐and‐purchase.
Sri Lanka Telecom. (2009). Annual Report 2009.
SundayTimes. (2011, January 30). Retrieved Arpil 2011, from Sunday Times: sundaytimes.lk/110130/It/it01.html
Telecenter. (2009, December 21). Retrieved April 2011, from Telecenter.org: www.telecentre.org/profiles/blogs/icta‐gets‐ready‐for‐the‐2nd
The Bottom Line. (2009, March 11). Retrieved April 2011, from The Bottom Line: http://www.thebottomline.lk/2009/03/11/index%2032.htm
The Island. (2011, March 15). Telecom regulatory risk highest in Sri Lanka, says Fitch. Retrieved April 2011, from The Island: http://www.island.lk/index.php?page_cat=article‐details&page=article‐details&code_title=20772
The Island. (2011, April 3). BPO Challenges. Retrieved April 4, 2011, from The Island: http://www.island.lk/index.php?page_cat=article‐details&page=article‐details&code_title=22279
The Sunday Times. (2010, October 31). Retrieved April 2011, from The Sunday Times: http://sundaytimes.lk/101031/News/nws_01.html
The Telecom Regulatory Commission. (2010). Retrieved March 2011, from Official Website of The Telecom Regulatory Commission: http://www.trc.gov.lk/about‐us/policy.html
87
The TRC. (2011, February 18). Retrieved April 2011, from The Telecom Regulatory Commission of Sri Lanka: http://www.trc.gov.lk/press‐room/publications.html
Tops.lk. (2010, September 16). Retrieved April 2011, from Tops.lk: http://www.tops.lk/article27765‐mobile‐penetration‐will‐help‐e‐health‐sector‐boom.html
TRC. (2008). Retrieved April 2011, from Telecommunications Regulatory Commission: http://www.trc.gov.lk/images/pdf/towerpolicy_final_.pdf
TRC. (2010, December). Retrieved March 2011, from Telecom Regulatory Commission: http://www.trc.gov.lk/images/docs/statis_dec_2010.doc
TRC. (2010). TRCSL Releases Broadband Download Speed Test Results. Retrieved April 2011, from Telecommunications Regulatory Commission: http://www.trc.gov.lk/broadband/200‐broadband‐speed‐test‐results‐reflects‐the‐necessity‐of‐a‐standard.html
Wattegama, C. (2005). Benchmarking National Telecom Regulatory Authority Websites: A Survey of Websites of Telecommunications Regulators in the Asia Pacific Region. WDR Dialogue Theme 3rd Cycle.
Wikipedia. (2011, January 21). Retrieved Aril 2011, from Wikipedia: http://en.wikipedia.org/wiki/SEA‐ME‐WE_3
Wikipedia. (2011, February 16). Retrieved April 2011, from Wikipedia: http://en.wikipedia.org/wiki/SEA‐ME‐WE_4
World Bank. (2011). Retrieved April 2011, from World Bank: http://web.worldbank.org/WBSITE/EXTERNAL/WBI/WBIPROGRAMS/KFDLP/EXTUNIKAM/0,,menuPK:1414738~pagePK:64168427~piPK:64168435~theSitePK:1414721,00.html
World Bank. (2007). Building the Sri Lankan Knowledge Economy. Colombo: The World Bank Colombo Office.