Embed Size (px)
Citation preview

June 2016
INTERNATIONAL CIRCUMPOLAR SURVEILLANCE - TUBERCULOSIS
A SEVEN-YEAR EPIDEMIOLOGICAL REVIEW OF
TUBERCULOSIS IN THE CIRCUMPOLAR REGION 2006 - 2012

2 International Circumpolar Surveillance – Tuberculosis Working Group
INTERNATIONAL CIRCUMPOLAR SURVEILLANCE – TUBERCULOSIS WORKING GROUP - PARTICIPATING JURISDICTIONS1
Author Annie-Claude Bourgeois Centre for Communicable Diseases and Infection Control, Public Health Agency of
Canada
Contributors Michael Bruce Arctic Investigations Program, Centers for Disease Control and Prevention, USA Prabhu Gounder Arctic Investigations Program, Centers for Disease Control and Prevention, USA Thomas Hennessy Arctic Investigations Program, Centers for Disease Control and Prevention, USA Anders Koch Statens Serum Institut, Denmark Alan Parkinson Arctic Investigations Program, Centers for Disease Control and Prevention, USA Thomas Rendal National Board of Health, Greenland Flemming Stenz National Board of Health, Greenland Joyce Wolfe National Microbiology Laboratory, Public Health Agency of Canada, Canada Tammy Zulz Arctic Investigations Program, Centers for Disease Control and Prevention, USA Official representatives and data providers ALASKA Michael Cooper Infectious Disease Program Manager, State of Alaska CANADA Brendan Hanley Chief Medical Officer of Health, Yukon Health and Social Services Caroline Newberry Communicable Disease Specialist, Government of the Northwest Territories Jean-François Proulx Medical Advisor, Nunavik Regional Board of Health and Social Services Elaine Randell Communicable Disease Consultant II, Government of Nunavut FINLAND Hanna Soini Senior Expert, Mycobacterial Reference Laboratory, National Institute for Health
and Welfare (THL) GREENLAND Flemming Stenz Chief Medical Officer of Health (Representative) Thomas Rendal Nursing Consultant (Data provider) NORWAY Trude M. Arnesen Public Health Specialist, Norwegian Institute of Public Health
1 At the time this report was written, the ICS-TB Working Group was co-chaired by the Centre for Communicable Diseases and Infection Control of the Public Health Agency of Canada (PHAC) and the Arctic Investigations Program of the United States Centers for Disease Control and Prevention (CDC).

3 International Circumpolar Surveillance – Tuberculosis Working Group
RUSSIAN FEDERATION Andrei Mariandyshev Professor and Head of Phthisiopulmonology Faculty, Northern State Medical
University, Arkhangelsk Region Health (Representative) Grigory Balancev Northern (Arctic) Federal University (Data provider) SWEDEN Jerker Jonsson MD, Epidemiologist, Public Health Agency of Sweden Acknowledgements Stanley Ing Centre for Communicable Diseases and Infection Control, Public Health
Agency of Canada Susanna Ogunnaike-Cooke Centre for Communicable Diseases and Infection Control, Public Health
Agency of Canada

4 International Circumpolar Surveillance – Tuberculosis Working Group
Table of contents
EXECUTIVE SUMMARY .................................................................................................................... 6
INTRODUCTION ............................................................................................................................... 8
FUNCTIONS OF THE ICS-TB WORKING GROUP ............................................................................... 8
EPIDEMIOLOGICAL REVIEW OF TUBERCULOSIS IN THE CIRCUMPOLAR REGION ........................... 9
THE CIRCUMPOLAR REGION AND PARTICIPATING JURISDICTIONS – A BRIEF DESCRIPTION ....... 13
RESULTS......................................................................................................................................... 20
DISCUSSION ................................................................................................................................... 35
DATA LIMITATIONS ....................................................................................................................... 35
CONCLUSION ................................................................................................................................. 37
REFERENCES .................................................................................................................................. 38
APPENDIX 1 – LIST OF CORE DATA ELEMENTS ............................................................................. 40
APPENDIX 2 – LIST OF DRUGS TESTED BY THE ICS-TB JURISDICTIONS ......................................... 41
List of tables and figures Table 1: Reported new active and re-treatment TB cases and incidence rate per 100,000 population - ICS-TB jurisdictions, 2006-2012................................................................................ 22 Table 2: Reported new active and re-treatment TB cases and incidence rate per 100,000 by age groups and ICS-TB jurisdictions*, 2006-2012** ........................................................................... 23 Table 3: Median age of reported active TB cases (new and re-treatment cases) by ICS-TB jurisdictions*, 2006-2012**.......................................................................................................... 24 Table 4: Reported crude incidence rate (per 100,000 population) by sex and ICS-TB jurisdictions*, 2006-2012**.......................................................................................................... 25 Table 5: Reported percentages of TB cases by treatment history and ICS-TB jurisdiction*, 2006-2012** .......................................................................................................................................... 26 Table 6: Reported percentage of TB cases by confirmed diagnostic status and jurisdiction*, 2006-2012** ................................................................................................................................. 27 Table 7: Reported proportion of TB cases by diagnostic site and jurisdiction*, 2006-2012** .... 28 Table 8: Smear results in percentage* among all pulmonary TB cases (including individual infected diagnosed with both pulmonary and extrapulmonary) by jurisdiction**, 2006-2012***....................................................................................................................................................... 29 Table 9: Reported percentage* of drug resistance among TB cases by ICS-TB jurisdictions**, 2006-2012*** ............................................................................................................................... 31

5 International Circumpolar Surveillance – Tuberculosis Working Group
Table 10: Reported proportion of monoresistance among TB cases by ICS-TB jurisdictions*, 2006-2012** ................................................................................................................................. 31 Table 11: Reported proportion of TB cases on RIPE treatment regime by jurisdiction*, 2006 - 2012** .......................................................................................................................................... 32 Table 12: Reported treatment outcomes among TB cases by jurisdiction*, 2006-2012** ......... 33 Table 13: Distribution of cause of death among TB cases by jurisdiction*, 2006-2012** (n=1,029) ....................................................................................................................................... 34 Figure 1: International circumpolar surveillance tuberculosis jurisdictions ................................ 19 Figure 2: Trends in TB in the participating ICS-TB jurisdictions, 1940-2012* ............................... 20 Figure 3: Reported crude TB incidence rate (new and re-treatment cases) by ICS-TB jurisdiction, 2006-2012* ................................................................................................................................... 21 Figure 4: ICS-TB jurisdictions with an overall reported crude TB incidence rate (new and re-treatment cases) below 20 cases per 100,000 population, 2006-2012 ....................................... 21 Figure 5: Reported crude TB incidence rate (new and re-treatment cases) by age groups and ICS-TB jurisdictions*, 2006-2012** .............................................................................................. 23 Figure 6: Median age* of reported active TB cases (new and re-treatment cases) by ICS-TB jurisdictions**, 2006-2012***...................................................................................................... 24 Figure 7: Reported percentages of TB cases by treatment history and ICS-TB jurisdiction*, 2006-2012** .......................................................................................................................................... 26 Figure 8: Reported percentage of TB cases by confirmed diagnostic status and jurisdiction*, 2006-2012** ................................................................................................................................. 27 Figure 9: Reported proportion of TB cases by diagnostic site and jurisdiction*, 2006-2012** .. 28 Figure 10: Smear results in percentage among all pulmonary TB cases (including both pulmonary and extrapulmonary) by jurisdiction*, 2006-2012** ................................................. 29 Figure 11: Reported proportion of drug resistance among TB cases by ICS-TB jurisdictions*, 2006-2012** ................................................................................................................................. 30 Figure 12: Reported proportion of TB cases on RIPE treatment regime by ICS-TB jurisdictions*, 2006-2012** ................................................................................................................................. 32 Figure 13: Reported treatment outcomes among TB cases by jurisdiction, 2006-2012 .............. 33 Figure 14: Reported cause of death among TB cases by jurisdiction*, 2006-2012** .................. 34

6 International Circumpolar Surveillance – Tuberculosis Working Group
EXECUTIVE SUMMARY Created in 1998, the overall goal of the International Circumpolar Surveillance (ICS) project is to establish an integrated network of hospital and public health facilities throughout the Arctic countries to monitor infectious diseases of concern. Tuberculosis (TB) was set as a priority among the ICS network as it was apparent that certain circumpolar jurisdictions still carried a significant burden of TB and the emergence of multi-drug-resistant strains was becoming an issue in some of those jurisdictions. Consequently, the International Circumpolar Surveillance – Tuberculosis (ICS-TB) Working Group was created in November 2006. The ICS-TB Working Group initiated a review of TB notifications to improve understanding of the epidemiology of TB in the circumpolar region. The main objective of this project is to analyse demographic, clinical and laboratory characteristics of TB disease in northern populations to assess disease trends and incidence across circumpolar regions. The ultimate project goal is to establish baseline data on TB cases which will be updated through ongoing annual surveillance to inform TB prevention and control in circumpolar regions. It has been agreed among the participating jurisdictions that the Public Health Agency of Canada (PHAC) will be the custodian of the ICS-TB data as well as the technical lead for this project. Therefore a bilateral “ICS-TB Memorandum of Understanding (MoU) for the Sharing of Information in Relation to Tuberculosis in the North Circumpolar Populations” was developed and voluntarily signed between the PHAC and by nine of the ten participating jurisdictions [Canada (Northwest Territories, Nunavik, Nunavut, Yukon), Greenland, Norway, Sweden, Russian Federation (Arkhangelsk), United States (Alaska) and Finland], which provided aggregated data versus line listed data, did not require an MoU. This report uses a common case definition and presents core data elements which were established by the ICS-TB Working Group. All active TB cases reported from 2006 to 2012 that met the case definition were analysed. Distribution of TB incidence by jurisdiction, age and sex, TB diagnostic sites, indicators for TB drug resistance and treatment outcome were calculated. From 2006 to 2012, TB disease incidence rates ranged from 4.3 to 199.5 cases per 100,000 population across participating jurisdictions. The burden of TB is spread across all age groups in the ICS-TB jurisdictions, with the highest incidence rate being among individuals 15 to 24 years old for three jurisdictions. Median age of cases ranged from 20 to 46 years old. The incidence rate ranged from 4.7 to 236.0 cases per 100,000 in males and from 3.8 to 182.9 cases per 100,000 population in females. Yukon had the highest proportion of new cases (97% of all cases) and Arkhangelsk had the highest proportion of re-treatment cases (26% of all cases). Alaska reported the highest percentage of laboratory-confirmed cases (87%) and Archangelsk reported the highest percentage of clinically-confirmed cases (46%). The highest percentage of pulmonary disease was reported in Arkhangelsk (94%). However for Arkhangelsk, it is not possible to classify a case as “both pulmonary and extrapulmonary”; therefore, if a case is diagnosed in both diagnostic sites, it is reported as “pulmonary”. Northern Sweden and northern Norway both reported the highest proportion of extrapulmonary and “both pulmonary and extrapulmonary” cases. Nunavik had the smallest proportion of smear-positive (26%) cases among pulmonary TB cases.

7 International Circumpolar Surveillance – Tuberculosis Working Group
The proportion of cases with resistance to at least one drug (excluding MDR- or XDR-TB) ranged from zero to 21% across jurisdictions, with the highest proportion in northern Norway (21%). Four jurisdictions reported multidrug (MDR) or extensively drug-resistant (XDR-TB) strains, with the highest proportion of cases being in Arkhangelsk (48%). Arkhangelsk was the only jurisdiction which reported XDR-TB strains. Yukon had the highest proportion of cases that were cured or who completed treatment (97%). The current surveillance data provided by the participating ICS-TB jurisdictions highlights the large variation of TB disease rates as well as drug resistance patterns in participating circumpolar regions. It demonstrates that overall, TB remains a serious public health issue in circumpolar regions and the current project contributes towards a comprehensive understanding of TB in the north. As the epidemiology of TB in circumpolar regions evolves and changes, members of the International Circumpolar Surveillance – Tuberculosis Working Group will continue to share expertise to acquire a better understanding of the epidemiology of TB and work collaboratively to reduce the TB burden in circumpolar regions and across the world.

8 International Circumpolar Surveillance – Tuberculosis Working Group
INTRODUCTION
Created in 1998, the overall goal of the International Circumpolar Surveillance (ICS) project is to establish an integrated network of hospital and public health facilities throughout Arctic countries to monitor infectious diseases. The ICS project is managed within the Sustainable Development Working Group (SDWG) of the Arctic Human Health Experts Group (AHHEG) under the Arctic Council. The ICS project is a joint activity with the International Union for Circumpolar Health Infectious Disease Working Group (1). TB was set as a priority among the ICS network because it was apparent that certain circumpolar jurisdictions still carry a significant burden of TB and that the emergence of multi-drug-resistant strains was becoming an issue in some of those jurisdictions. A number of key factors in this region of the globe are particular drivers for TB transmission between individuals and within communities, including the physical environment (crowding and poor ventilation), poverty, poor access to health services and lifestyle behaviours (alcoholism, tobacco use, and malnutrition) (2,3,4). The elevated rates of TB, coupled with existing complex issues in circumpolar jurisdictions emphasize the need to continuously monitor and assess TB disease trends to improve population health outcomes. On February 1, 2006, representatives from several countries occupying territory in circumpolar regions (specifically, northern Canada, Greenland and US-Alaska) met in Yellowknife, Northwest Territories, Canada to establish a TB surveillance subgroup of the ICS network. As a result, a proposal was submitted to the ICS Steering Committee on March 19, 2006. The Steering Committee unanimously approved the creation of the International Circumpolar Surveillance – Tuberculosis (ICS-TB) Working Group in November 2006. As the Working Group expanded, two special meetings were held in Moscow (2008) and Khanty-Mansiysk (2011), Russian Federation to strengthen collaboration with the Russian Federation and to work towards the formalization of information exchange between the ICS-TB Working Group and the Russian Federation. The meetings resulted in Russian regions agreeing to participate in the ICS-TB Working Group. As of 2015, the ICS-TB Working Group includes official representatives from northern Canada, Finland, Greenland, Norway, Sweden, the Russian Federation and the United States of America (US - Alaska) (Figure 1).
FUNCTIONS OF THE ICS-TB WORKING GROUP The mission of the ICS-TB Working Group is to provide a forum to address issues of common concern, to share lessons learned and to discuss evidence-based practices related to TB in order to enhance TB surveillance, prevention and control activities in circumpolar jurisdictions. Its mandate is to increase international knowledge of TB epidemiology in circumpolar regions as well as to provide epidemiological evidence for priority setting and program planning, design, implementation and evaluation across circumpolar jurisdictions.

9 International Circumpolar Surveillance – Tuberculosis Working Group
EPIDEMIOLOGICAL REVIEW OF TUBERCULOSIS IN THE CIRCUMPOLAR REGION Background In 2007, a survey was conducted among the current ICS-TB country representatives (i.e. northern Canada, Alaska (US), Greenland, Russian Federation and Sweden) to gain input on the objectives of the ICS-TB Working Group. Two surveillance-specific components were identified: the assessment of 1) TB disease trends over time and 2) incidence across the circumpolar region (5). Participants agreed to produce an initial report based on a retrospective analysis of TB data from participating northern countries. To better inform and support the data analysis presented in the current report, the ICS-TB Working Group also reviewed the methods and systems used for TB surveillance across circumpolar jurisdictions. The main objective of this report is to analyse demographic, clinical and laboratory characteristics of TB disease in northern populations to assess disease trends and incidence rates across circumpolar regions. The ultimate goal is to establish baseline data on TB cases to be updated through ongoing surveillance, to better inform TB prevention and control projects in circumpolar regions. Tuberculosis TB is an infectious disease caused by Mycobacterium tuberculosis (M. tuberculosis) that primarily affects the lungs but can also affect any part of the body. TB is transmitted through the inhalation of airborne infectious droplet nuclei produced by an individual with infectious pulmonary and/or laryngeal TB when they cough, sneeze, talk or spit. The droplets may stay in the air for hours, depending on environmental factors such as air circulation and ventilation, proximity to the source case (such as overcrowding) and duration of exposure. The infectious dose is very low, varying from one to ten bacilli but usually, a susceptible individual requires prolonged exposure before becoming infected. Adolescents and adults are most likely to transmit TB infection, although young children can sometimes be infectious (6). Following exposure, 95% of individuals without treatment develop latent TB infection (LTBI) and 5% develop active TB (primary) within the first two years after infection. Of those persons with LTBI, approximately 5% will develop active TB disease over the course of their lifetime. The probability of progressing to active TB disease is greater in immunologically challenged individuals, children less than five years of age and people with risk factors such as substance abuse or poor nutritional status (6). The most frequent type of TB pathogenicity is respiratory TB (including pulmonary TB and primary TB). Systematic manifestations consist mainly of cough, hemoptysis (sputum with blood), fever, night sweats, weight loss, general fatigue and malaise (7). Depending on the disease progression, lung cavities or other abnormalities can be present. However, as symptoms are often nonspecific, diagnosis may be delayed (8). As TB can progress to active disease in any part of the body, any infected sites outside the lungs and respiratory tract are generally reported as extrapulmonary TB, although a medical classification list is available for reporting by the World Health Organization (WHO) (i.e. the International Statistical Classification of Diseases and Related Health Problems (ICD) – WHO, 2011).

10 International Circumpolar Surveillance – Tuberculosis Working Group
Recommended drugs for first-line TB therapy include isoniazid (INH), rifampin (RMP), ethambutol (EMB) and pyrazinamide (PZA) and treatment normally lasts six months. Some countries still use streptomycin as first-line drug therapy, but its higher rates of toxicity as well as the inconvenience and pain of daily injections have relegated streptomycin to second-line status in many jurisdictions (9). Treatment completion is a fundamental principal in TB control as well as the prevention of drug resistance. Multidrug-resistant TB is defined by resistance to at least INH and RMP, the two most important anti-TB drugs, while extensively drug-resistant (XDR-TB is defined as resistance to INH and RMP as well as any fluoroquinolone and any one of the second-line injectable agents, amikacin, kanamycin or capreomycin. Multidrug-resistant and XDR-TB cases take longer and are more difficult to treat than fully susceptible strains because second-line drugs are generally less effective, more expensive and more likely to cause greater side effects (10). Methods This report presents descriptive results from the ICS-TB Surveillance System (ICSTBSS), a case-based surveillance system that maintains voluntarily-reported non-nominal data on people diagnosed with active TB disease in ICS participating countries. Participation Submission of TB surveillance data was voluntary among the ICS-TB member jurisdictions. The following jurisdictions provided data for the current report: Alaska from the United States of America, Arkhangelsk from the Russian Federation, the Northwest Territories, Nunavik, Nunavut and Yukon from Canada, Finland, Greenland, Norway and Sweden. For the purpose of this review, all of these areas are referred to as “jurisdictions”. Case definition The following case definitions, aligned with those of the World Health Organization (11), were used:
Definite (Laboratory-confirmed) case • A patient with culture-confirmed disease due to Mycobacterium tuberculosis complex, or • A patient who is sputum smear-positive for acid-fast bacilli (AFB).
Probable (clinical) case If a region submits data on a probable clinically-identified case, the case should meet the following two conditions:
• A clinician’s judgment that the patient’s clinical and/or radiological signs and/or symptoms are compatible with TB; and
• A clinician’s decision to treat the patient with a full course of anti-TB treatment. Core data elements A list of core data elements was developed with the agreement and understanding that they would be provided to the greatest possible extent. Most of the selected elements were already collected by the jurisdictions and captured in a standardised way via forms (12). To further increase data comparability, a Data Dictionary was drafted based on definitions used by the Canadian TB Reporting System (13) and the WHO (14). For each variable, the proposed definition was discussed and consensus was reached by members.

11 International Circumpolar Surveillance – Tuberculosis Working Group
The results of the analysis are illustrated by tables, figures and maps which summarize the following TB disease-related data:
• Distribution of TB incidence by jurisdiction • Age and sex distribution • TB diagnostic sites • Indicators for TB drug resistance • Treatment outcome
The list of the core data elements can be found in Appendix 1. Laboratory testing When possible, laboratory test methods were provided by jurisdictions to complement test result information. Data sharing and submission It was agreed among the participating jurisdictions that the Public Health Agency of Canada (PHAC) would be the custodian of the ICS-TB data as well as the technical lead for this project. Therefore, a bilateral “ICS-TB Memorandum of Understanding (MoU) for the Sharing of Information in Relation to Tuberculosis in the North Circumpolar Populations” was developed and signed between the PHAC and each of the participating jurisdictions with the exception of Finland, which provided aggregated data. Data submission was handled in accordance with the “ICS-TB Epidemiological Review Data Dictionary”, the “ICS-TB Epidemiological Review Protocol and Data Elements” as well as the “ICS-TB Retrospective Data Project – Reporting Guidelines for the Core Data Elements”, documents that were developed to inform and standardise the process. Jurisdictions agreed to submit line listed data2 on cases of TB disease in a non-nominal format (i.e. without personal identifying information) to a central database maintained by the PHAC. Once the data elements were first extracted from each jurisdiction’s TB data warehouse, data were safely transferred to CCDIC using an Inter-Business Vault, a Secure File Transfer Protocol tool developed by the PHAC. Upon receipt, CCDIC uploaded each jurisdiction’s data into the secure database. Analysis of the data and reports All data were stored and analysed by the PHAC on behalf of the ICS-TB Working Group and so the PHAC was therefore responsible for producing the final report. However, the structure of the report was agreed upon by members of the Working Group, who also provided content review of the data and jurisdictional approval and clearance (if required) prior to dissemination. The report was initially approved by all participating jurisdictional representatives as per their own internal regulations and then by the Co-chairs’ organizations, according to their respective rules and policies. The final report was reviewed and approved by the ICS Steering Committee prior to dissemination. Analytic process Data for active TB cases (new and re-treatment) for the period 2006 to 2012 reported to each participating jurisdiction TB Program, according to their own individual policies for data reporting, were 2 Except for Finland, which submitted aggregated data that were already publically available.

12 International Circumpolar Surveillance – Tuberculosis Working Group
submitted to the PHAC following the MoU signing. Treatment outcome data are presented up to the year 2011. Final data were extracted from the ICSTBSS database on May 12, 2015. In this report the term “crude incidence rate” refers to individuals newly diagnosed with active TB disease (new and re-treatment) in each reporting year per 100,000 population. Descriptive analyses were performed using SAS EG Version 5.1 and Microsoft Excel 2010TM. Population estimates were obtained from the following web links:
Alaska: http://laborstats.alaska.gov/pop/popest.htm Arkhangelsk: http://arhangelskstat.gks.ru/wps/wcm/connect/rosstat_ts/arhangelskstat/ ru/statistics/population/ Canada: Statistics Canada, Demography Division, Demographic Estimates Section, July
Population Estimates, 2013. Preliminary postcensal estimates Greenland: http://www.stat.gl/dialog/topmain.asp?lang=en&subject=Population&sc=BE Norway: http://www.ssb.no/en/befolkning/statistikker/folkendrkv/kvartal Sweden: http://www.scb.se/en_/Finding-statistics/Statistics-by-subject-
area/Population/Population-composition/Population-statistics/ No statistical procedures were used for comparative analyses in this report, nor were any statistical techniques applied to account for missing data. Data in tables with small cell sizes (n= <5) were not suppressed, since disclosure was not deemed to pose any risk of identifying individual cases. These procedures are in line with the PHAC’s directive for the collection, use and dissemination of information relating to public health (15).

13 International Circumpolar Surveillance – Tuberculosis Working Group
THE CIRCUMPOLAR REGION AND PARTICIPATING JURISDICTIONS – A BRIEF DESCRIPTION Circumpolar region Overall, the circumpolar region covers 17 million square km and as of 2010 was inhabited by close to ten million people (16). According to the Arctic Council, the circumpolar region encompasses political administrative regions from eight Arctic States: the State of Alaska (USA), Greenland and Faroe Islands (represented on the Arctic Council by the Kingdom of Denmark), Iceland, the northernmost “counties” in Norway, Sweden and Finland, the 12 administrative divisions of the northern Russian Federation and the three northern territories (Yukon, the Northwest Territories and Nunavut) of northern Canada (16). However, due to similarities in climate, geography, population, living conditions and health issues, two other northern jurisdictions in Canada, namely Nunavik in the northern part of the province of Québec and Labrador (from the Newfoundland and Labrador province) have been included in ICS-TB. Although Arctic regions have several features in common, there are also considerable differences across circumpolar jurisdictions in terms of population characteristics (e.g. population density, age and sex structure, Indigenous peoples’ representation, etc.), climatic conditions, health status and health care systems and access to health care (16). A brief summary of each participating ICS-TB jurisdiction is provided below. TB surveillance across the circumpolar region TB surveillance is a well-established centralised and publically-funded activity of the public health system across all participating circumpolar jurisdictions. Reporting of active TB cases and their respective treatment outcome is mandatory in each ICS-TB jurisdiction with reporting completeness estimated to be close to 100% by most of the jurisdictions and aligned with the WHO recommendations (12). Although there are slight variations in the definitions of “active TB case” across jurisdictions, identical components were found in all definitions and aligned with the WHO definitions (12,17) which allowed for the development of the harmonised definitions used in this report. Monitoring of emerging trends and patterns in anti-TB drug resistance is a key activity in TB control. Testing of TB isolates for smear results, culture confirmation and drug sensitivity testing is done across all ICS-TB participating jurisdictions and laboratory results are all reported directly from the laboratory to the TB surveillance program (12). Canada – The Northwest Territories 3, 4, 5, 6
3 Statistics Canada. 2012. Canada (Code 01) and Northwest Territories / Territoires du Nord-Ouest, Northwest Territories (Code 6110) (table).Census Profile. 2011 Census. Statistics Canada Catalogue no. 98-316-XWE. Ottawa. Released October 24, 2012. http://www12.statcan.gc.ca/census-recensement/2011/dp-pd/prof/index.cfm?Lang=E (accessed May 25, 2016) 4 Statistics Canada. 2013. Northwest Territories and Nova Scotia (table). Health Profile. Statistics Canada Catalogue no. 82-228-XWE. Ottawa. Released December 12, 2013. http://www12.statcan.gc.ca/health-sante/82-228/index.cfm?Lang=E (accessed May 27, 2016).

14 International Circumpolar Surveillance – Tuberculosis Working Group
The Northwest Territories is the most populous of the three territories in Canada, with a population around 41,462 (2011) and a population density of 0.036 persons per km2. In 1999, the Northwest Territories was subdivided to create Nunavut. The Northwest Territories mainly contain boreal forest and have a warmer climate than the other two territories; however, the northern regions are a part of the Canadian Arctic Archipelago. Less than half of the population resides in rural communities (41%), with just over 50% identifying as Aboriginal and7.1% being foreign-born. The median age is 32.3 years with a life expectancy of 75.1 and 80.1 years for males and females respectively. TB prevention and control in the Northwest Territories falls under the territorial Public Health Act. Populations predominantly affected by TB in the Northwest Territories are Aboriginal populations (Dene, Inuit, and Métis), foreign-born individuals and homeless populations. Several factors may influence the transmission of TB and development of active TB in the Northwest Territories, including overcrowding, tobacco use, alcohol and substance abuse, diabetes and inadequate previous treatment of LTBI. Current challenges experienced by the Northwest Territories include a lack of funding for a focused strategy to eliminate LTBI, real time data capture and accurate historical information surveillance databases and a lack of targeted TB prevention workers in regional centres as well as dedicated TB physician specialists. Canada - Nunavik7,8 Nunavik is situated in the northern part of the province of Québec, Canada and comprises nearly a third of the total area of the province. Nunavik’s population of just over 12,000 (2011), representing a population density of 0.02 persons per km2 is sparsely distributed, with only one (out of 14) communities exceeding 2,000 individuals. Approximately 90% of the individuals residing in Nunavik are Inuit with a foreign-born population of less than 1%. In addition, the median age is 22.7 years old with a life expectancy of 70.7 years and 74.5 and for males and females respectively. Nunavik began collecting TB surveillance data in 1990. TB prevention and control in Nunavik falls under the province of Québec’s Public Health Act, which provides guidance on surveillance and monitoring as well as prevention and control of infectious diseases. Within Nunavik, young males are both at higher risk of acquiring and developing TB. Despite continuous efforts, several challenges are faced by this region with regards to TB prevention and control including, but not limited to, difficulty in early identification of source cases due to geographical distances between remote villages and diagnostic
5 Statistics Canada. 2013. Northwest Territories (Code 61) (table). National Household Survey (NHS) Profile. 2011 Census. Statistics Canada Catalogue no. 99-004-XWE. Ottawa. Released June 26, 2013. http://www12.statcan.gc.ca/nhs-enm/2011/dp-pd/prof/index.cfm?Lang=E (accessed May 27, 2016). 6 Statistics Canada. 2013. Northwest Territories (Code 61) (table). National Household Survey (NHS) Profile. 2011 National Household Survey. Statistics Canada Catalogue no. 99-004-XWE. Ottawa. Released September 11, 2013. http://www12.statcan.gc.ca/nhs-enm/2011/dp-pd/prof/index.cfm?Lang=E (accessed May 27, 2016). 7 Statistics Canada. 2013. Région du Nunavik (Health Region), Quebec and Quebec (table). Health Profile. 2011 Census. Statistics Canada Catalogue no. 82-228-XWE. Ottawa. Released December 12, 2013. http://www12.statcan.gc.ca/health-sante/82-228/index.cfm?Lang=E (accessed May 26, 2016). 8 Statistics Canada. 2013. Nunavik, Inuit region, Quebec (Code 640002) (table). National Household Survey (NHS) Aboriginal Population Profile. 2011 Census. Statistics Canada Catalogue no. 99-011-X2011007. Ottawa. Released November 13, 2013. http://www12.statcan.gc.ca/nhs-enm/2011/dp-pd/aprof/index.cfm?Lang=E (accessed May 26, 2016).

15 International Circumpolar Surveillance – Tuberculosis Working Group
technology/laboratory facilities (i.e., chest x-rays, smears), difficulties in facilitating compliance to LTBI prophylaxis and the rapid turnover of clinicians and front-line public health workers. Canada – Nunavut 9, 10 Created in 1999 from a subdivision of the Northwest Territories, Nunavut is the largest and newest territory of Canada, with a population close to 31 906 people, but a density of 0.02 persons per km2, which makes it the least populous province or territory in Canada. The population includes over 80% Inuit and less than 2% foreign-born and is distributed almost evenly between rural and urban settings. The median age in Nunavut is about 24 years old with a life expectancy of 68.8 years in males and 75.2 years in females. Inuit account for almost all TB cases in the Territory. Several risk factors in the Inuit population are associated with the transmission and development of TB in Nunavut such as smoking (in 57% of the population of 12 years or over), homelessness, overcrowded houses, poor nutrition and food insecurity as well as diabetes. An important gap in Nunavut is the lack of an effective electronic surveillance system due to the lack of sufficient information technology infrastructure and bandwidth in the Territory. Other challenges include high staff turnover rates, which results in a lack of experienced TB nurses and difficulties maintaining continuity of care and client trust, as well as several common mental health issues such as addiction, fetal alcohol spectrum disorder and abuse that make program adherence problematic. Canada – Yukon 11 Yukon is the smallest territory of Canada in terms of land area. The Territory was separated from the Northwest Territories in 1898. The Territory’s climate varies depending on its geography, which consists of Arctic regions in the north, subarctic in the central region and humid continental regions in the south. Yukon boasts a population size close to 34,000 (2013) with a population density of approximately 0.1 persons per km2. The estimated ratio for individuals residing in rural versus urban communities in Yukon is 1:1.5 and approximately a quarter of the population are Indigenous while 11.3% are foreign-born. The median age for individuals residing in Yukon is 39.1 with a life expectancy of 74.2 and 79.1 for males and females respectively. Yukon began collecting TB surveillance data in 1955 (case counts only), which became progressively more detailed over time. TB prevention and control in Yukon falls under the territorial Public Health and Safety Act. TB primarily affects First Nation populations and foreign-born individuals from high-endemic countries. Several risk factors perpetuate TB transmission within rural communities, which include persons who previously refused preventative therapy or who were not candidates for prevention therapy, alcohol use and housing density. Despite the efforts put into TB prevention and control, Yukon faces a number of barriers such as social factors (alcohol use and addictions) which reduce the eligibility and feasibility of initiating or following preventative therapy in contacts of infectious TB, “TB fatigue” 9 Statistics Canada. 2012. Nunavut (Code 62) and Canada (Code 01) (table). Census Profile. 2011 Census. Statistics Canada Catalogue no. 98-316-XWE. Ottawa. Released October 24, 2012. http://www12.statcan.gc.ca/census-recensement/2011/dp-pd/prof/index.cfm?Lang=E (accessed May 26, 2016). 10 Statistics Canada. 2013. Nunavut and Quebec (table). Health Profile. Statistics Canada Catalogue no. 82-228-XWE. Ottawa. Released December 12, 2013. http://www12.statcan.gc.ca/health-sante/82-228/index.cfm?Lang=E (accessed May 27, 2016). 11 Statistics Canada. 2013. Yukon and Quebec (table). Health Profile. Statistics Canada Catalogue no. 82-228-XWE. Ottawa. Released December 12, 2013. http://www12.statcan.gc.ca/health-sante/82-228/index.cfm?Lang=E (accessed May 27, 2016).

16 International Circumpolar Surveillance – Tuberculosis Working Group
within community members and health care providers resulting from the ongoing presence of TB within small communities, “smouldering” outbreaks and difficulty maintaining TB support workers with appropriate skill sets due to budgetary constraints. Finland Finland is a Scandinavian country in Northern Europe bordered by Sweden (west), Norway (north), Russia (east) and the Gulf of Finland (south). Only the three northernmost “counties”, Lappi, Oulu and Kainuu, are included in the circumpolar region as defined previously (16). In 2014, Finland’s population was close to 5.5 million12. The overall population density is 18 persons per km2, but it is much lower in the northern counties with two persons per km2 in Lappi, 11 persons per km2 in Oulu and four persons per km2 in Kainuu. Close to 70% of the population live in urban areas. It is estimated that in Finland, less than 1% of the population is Indigenous (i.e. the Sami population) and close to 6% is foreign-born. The life expectancy is 77.3 years for males and 83.8 for females. Finland began collecting TB surveillance data in 1995. In Finland, the most vulnerable population at risk of acquiring or developing active TB is foreign-born individuals from high-TB incidence countries, people who abuse alcohol as well as homeless people, mainly through transmission of TB among household contacts or alcoholics and homeless individuals. Since TB is a fairly rare disease in Finland, diagnostic delays sometimes cause transmission and outbreaks and it could be therefore beneficial to increase awareness among health care personnel. Greenland Greenland is an autonomous country within the Kingdom of Denmark and in terms of land area, is the world’s largest non-continental island with less than 20% of the country being ice-free. With a population of less than 56,000 (2016)13 and a population density of 0.14 persons per km2 (ice-free area), it is considered the least densely populated country in the world. Approximately 90% of Greenland’s population live in towns while the remaining 10% reside in more than 60 settlements. The settlements can vary in size from four to almost 600 persons per km2 and are mainly composed of hunters, fishermen and miners. About 12% of the population is born outside Greenland and life expectancy is 68.7 years for males and 73.5 years for females. Greenland began steadily collecting TB surveillance data in 1961. In Greenland, identifying as Inuit is a risk factor for the transmission of TB and for the development of active TB as well as living in a small settlement, being unemployed and the frequent intake of alcohol. Greenland experiences a number of challenges in terms of TB surveillance and control, including: a high staff turnover resulting in lack of in-depth knowledge about TB among health personnel and geographical and infrastructural barriers, since a considerable proportion of the population resides in remote areas with limited trained health personnel simple diagnostic procedures (i.e., biological samples, chest x-rays, etc.) require expensive transportation by helicopter or boat. Lastly, as with many jurisdictions, addressing the determinants of health such as unemployment, poverty, education and inadequate housing, is also a constant challenge.
12 Statistics Finland. 2016. Finland preliminary population figure 5,489, 821 at the end of April. Helsinki. Released May 19, 2016. http://www.stat.fi/til/vamuu/2016/04/vamuu_2016_04_2016-05-19_tie_001_en.html 13 Statistics Greenland. 2016. Greenland in Figures 2016. 13th edition. Nuuk. http://www.stat.gl/publ/en/GF/2016/pdf/Greenland in Figures 2016.pdf

17 International Circumpolar Surveillance – Tuberculosis Working Group
Norway Norway is a Scandinavian unitary constitutional monarchy which covers the western portion of the Scandinavian Peninsula, Jan Mayen, the Arctic Archipelago of Svalbard, the sub-Antarctic Bouvet Island and Queen Maud Land, a section of the Antarctica. However, only the northernmost “counties”, namely Finnmark, Troms and Nordland, are considered part of the circumpolar region. Norway has a population of 5.2 million (2015)14 with a population density of 17 persons per km2. Approximately 1.2% of the population is Indigenous and 12.9% is foreign-born. The median age is 39.4 with a life expectancy of 80 years for males and 84 for females. Norway began collecting TB surveillance data in 1962 and TB prevention and control falls under the Communicable Disease Control Act which outlines the roles and responsibilities of public health agencies such as the Norwegian Institute of Public Health, with respect to communicable disease control measures. In Norway, foreign-born individuals and particularly newly-arrived immigrants represent the population most at risk for the development of active TB. This may be influenced by several factors including challenges in reaching the foreign-born population, delays in accessing health services which leads to undiagnosed TB, existing gaps in TB screening programs for immigrants and general practitioners not being accustomed to TB. Russian Federation – Arkhangelsk Oblast The Arkhangelsk Oblast is located in the north-east region of the Russian Federation which includes the Arctic archipelagos of Franz Josef Land and Novaya Zemlya, as well as the Solovetsky Islands in the White Sea. The population is approximately 1.2 million15 with a global population density of 2.02 persons per km2, three-quarters of which reside in urban settings. The vast majority of the population is Russian-born with 1% identified as Indigenous and 4% as foreign-born. The median age of the population is around 37 years and life expectancy settles at 64 for males and 76 for females. TB prevention and control and active screening for TB are conducted according to Russian regulations16. The systematic collection of surveillance data for TB was initiated in 2006; however data from 2007 and onwards are presented in this report. In Arkhangelsk, incarcerated individuals are recognised as one of the most at-risk populations for the transmission and the development of active TB, as well as homeless people and human immunodeficiency virus (HIV) patients (18). The Arkhangelsk Oblast faces challenges linked with accessing drugs for appropriate treatment, as well as treating a high number of MDR- and XDR-TB cases. Sweden
14 Statistics Norway. Population and population change, Q 2015. Population and population changes. Oslo. http://www.ssb.no/en/befolkning/statistikker/folkendrkv/kvartal 15 Federal State Statistics Service. 2016. Оценка численности населения на 1 января текущего года по субъектам РФ. Население. Arkhangelsk. Released April 28, 2016. http://arhangelskstat.gks.ru/wps/wcm/connect/rosstat_ts/arhangelskstat/ru/statistics/population/ 16 Government regulation Russian Federation, No. 892 (‘‘Implementing Federal law: ‘preventing tuberculosis’’’) 2001. [in Russian] Resolution of the Chief Medical Officer of Russian Federation and Ministry of Health Care of Russian Federation, No. 62 (‘‘About implementing USPH rules and regulations: ‘preventing tuberculosis’’’ SP 3.1.1295-03). 2003. [in Russian]
18 International Circumpolar Surveillance – Tuberculosis Working Group
Sweden is a Scandinavian country located in Northern Europe and is the third-largest country in the European Union (in terms of land area). Sweden’s population of 9.9 million (2016)17, representing a population density of 23 persons per km2, is mainly concentrated in the south. Only the two northernmost “counties” Norrbotten and Västerbotten are included in the circumpolar region and represent about 5% of the total Swedish population. Foreign-born individuals account for 16% of the total population and Indigenous people make up less than 1% of the population18. The median age is 41.2 years and life expectancy is 80 and 84 for males and females respectively. Sweden began collecting TB surveillance data in the early 1900s with reliable TB data being available since 1940. TB prevention and control falls under the Swedish Communicable Disease Act. Within this legislative framework, TB control activities include contact tracing, surveillance as well as screening of foreign-born persons from high-burden countries, since they are the most at-risk population for the development of active TB. A number of key determinants also contribute to the development of active TB within other subpopulations in Sweden, including homelessness and drug and/or alcohol abuse. One of the main challenges Sweden faces, particularly with respect to the screening of new arrivals, is the lack of inclusiveness of the screening program, as screening has been mainly reserved for asylum seekers. United States of America - Alaska While Alaska is the largest state (in terms of land area), it is among the least populated in the United States of America, with a population of 735,62519 and population density of 3.4 persons per km2. Alaska is comprised of both rural and urban communities, with roughly a third of the population classified as rural. Approximately 15% of the population identifies as Alaska Native or American Indian and 7% are foreign-born. The median age of the population is 33.8 years with life expectancies of 75.7 years for men and 80.5 years for women, but 70.7 years for Alaska Natives overall. Alaska began collecting TB surveillance data in 1952. TB prevention and control falls under a number of statutes and regulations by the State of Alaska with respect to TB testing, reporting and screening. Populations most at risk for acquiring and developing active TB in Alaska are the Alaska Native population, homeless individuals, individuals from the rural Southwest and Northern regions of the State, as well as foreign-born populations. Key drivers of ongoing TB transmission in Alaska include the large historical impact of TB in the Alaskan Native population, challenges in medical and public health infrastructure, access barriers to health care services and care, geographical barriers, overcrowding in poorly ventilated housing in rural areas and high turnover of insufficient medical and nursing staff in rural jurisdictions. The main challenges Alaska is experiencing relate to limited economic resources, lack of adequate health care infrastructure, vast geography and challenges with access to care and early TB diagnosis.
17 Statistics Sweden. 2016. Preliminary Population Statistics. Population statistics. Stockholm. Released May 12, 2016 Statistics Sweden. 2016. Preliminary Population Statistics. Population statistics. Stockholm. Released May 12, 2016 http://www.scb.se/en_/Finding-statistics/Statistics-by-subject-area/Population/Population-composition/Population-statistics/#c_li_196358 18 “The Sami – an Indigenous People in Sweden” report. 19 State of Alaska. 2016. 2015 Population by Borough/Census Area and Economic Region. Population Estimates. Juneau. Released January 13, 2016. http://laborstats.alaska.gov/pop/popest.htm

19 International Circumpolar Surveillance – Tuberculosis Working Group
Figure 1: International circumpolar surveillance tuberculosis jurisdictions

20 International Circumpolar Surveillance – Tuberculosis Report
RESULTS Historical context Aggregated historical data (TB case count and crude incidence rate) were provided by each jurisdiction20 from the first year in which TB surveillance data began to be collected in their respective jurisdiction up to 2012. In all ICS-TB jurisdictions for which data are available, the number of reported TB cases and the corresponding incidence rates were higher prior to the mid-1960s and then, following the introduction of the five first TB medications between 1948 and 1963, this number declined considerably for most jurisdictions until the 1980s (Figure 2). However, some jurisdictions such as Nunavik and Greenland experienced an increase in their incidence rate over the past 10 to 15 years. Figure 2: Trends in TB in the participating ICS-TB jurisdictions, 1940-2012*
*Data received at CCDIC no later than May 2015. Data presented for Sweden, Norway and Finland include the entire country, not just the northernmost regions. Note that prior to its inception in 1999, Nunavut was embedded in the Northwest Territories; therefore Nunavut cases prior 1999 are included in the Northwest Territories case count. Case reporting for 2006-2012 Over the seven years presented in this report, a total of 7,213 cases of active TB were reported among the ICS-TB participating jurisdictions21. Three ICS-TB jurisdictions had a yearly crude TB incidence rate higher than 100 cases per 100,000 population: Nunavut, Nunavik and Greenland (Figures 3 and 4, Table 1) which are mainly Inuit territories. Arkhangelsk’s crude TB incidence rate varied between 50 and 100
20 Data for the entire country for Finland, Norway and Sweden. 21 Excluding 2006 data from Arkhangelsk.

21 International Circumpolar Surveillance – Tuberculosis Report
cases per 100,000 population. Finally Yukon, Finland22, Norway, Sweden and Alaska maintained an overall crude TB incidence rate below 20 cases per 100,000 population for the given time period. Figure 3: Reported crude TB incidence rate (new and re-treatment cases) by ICS-TB jurisdiction, 2006-2012*
*2006 data for Arkhangelsk not available. Figure 4: ICS-TB jurisdictions with an overall reported crude TB incidence rate (new and re-treatment cases) below 20 cases per 100,000 population, 2006-2012
22 Data directly provided by Finland (2015-06-18).
22 International Circumpolar Surveillance – Tuberculosis Report
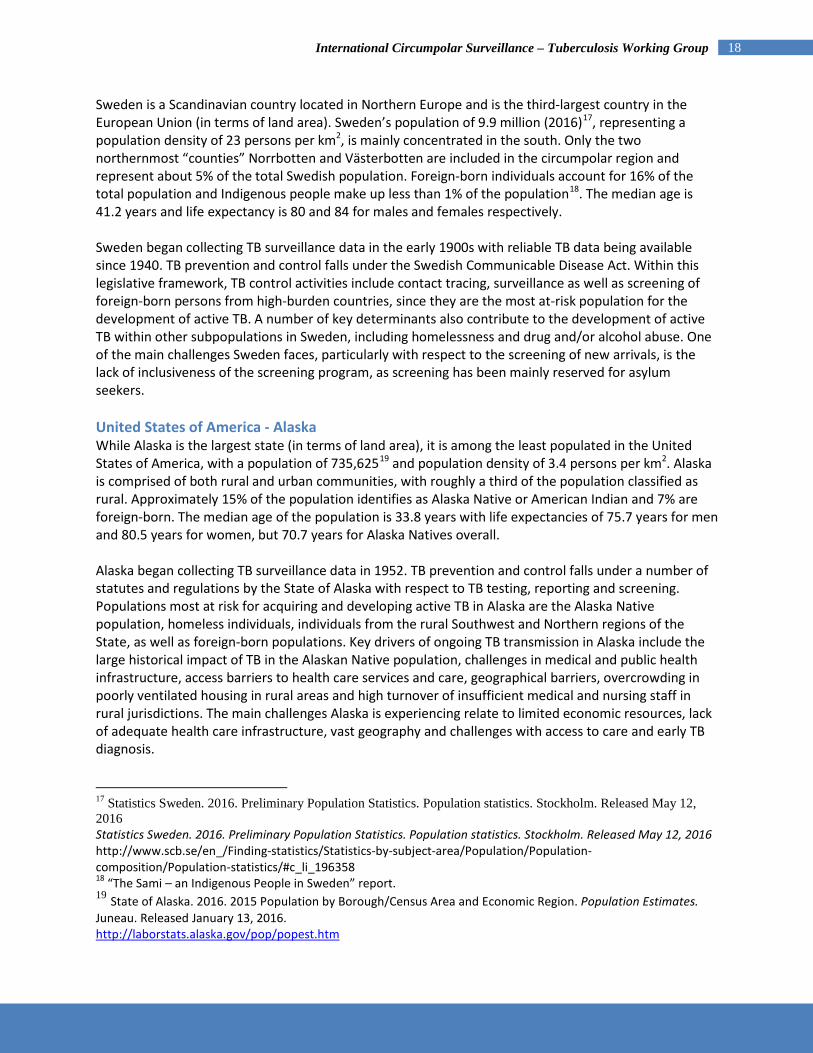
Table 1: Reported new active and re-treatment TB cases and incidence rate per 100,000 population - ICS-TB jurisdictions, 2006-2012
Jurisdiction Average population size (2006-2012)
Reporting year
2006 2007 2008 2009 2010 2011 2012 All years
Northwest Territories 43 303
Cases 6 15 14 12 11 13 6 77 Rate 13.9 34.7 32.3 28.0 25.4 29.9 13.8 25.4
Nunavik 11 675 Cases 6 12 21 14 12 27 71 163 Rate 54.8 107.2 184.0 119.9 100.1 221.1 577.4 199.5
Nunavut 32 861 Cases 48 31 59 56 100 74 79 447 Rate 155.7 98.2 184.6 170.7 297.9 215.9 225.7 194.3
Yukon 34 186 Cases 3 3 8 4 6 4 1 29 Rate 9.3 9.2 24.0 11.8 17.2 11.2 2.7 12.1
Northern Finland 664 199
Cases 42 38 30 59 31 53 35 288 Rate 5.0 5.5 5.2 5.5 3.8 6.5 4.2 5.1
Greenland 56 574 Cases 72 59 64 63 114 114 88 574 Rate 126.5 104.2 113.4 112.1 201.9 201.4 155.1 144.9
Northern Norway 465 013
Cases 24 16 23 35 30 36 42 206 Rate 5.2 3.5 5.0 7.6 6.4 7.7 8.9 6.9
Northern Sweden 510,249
Cases 16 18 17 25 27 20 29 152 Rate 3.14 3.54 3.35 4.93 5.32 3.94 5.70 4.3
Arkhangelsk 1 244 088 Cases N/A 874 847 826 777 843 713 4880 Rate N/A 70.6 68.9 67.7 64.1 71.3 60.9 65.4
Alaska 700 697 Cases 70 50 50 37 57 67 66 397 Rate 10.4 7.4 7.3 5.3 8.0 9.3 9.0 8.1
*Average population from 2007 to 2012. Age and sex The burden of TB is spread across all age groups in the ICS-TB jurisdictions. When reviewing all reporting years, the highest incidence rate was among those 15 to 24 years old for the jurisdictions of Nunavik, Nunavut and Greenland, 25 to 34 years old for Norway and Sweden, 45 to 54 years old in Yukon and Arkhangelsk and finally, 65 years and older for Alaska and the Northwest Territories (Figure 5, Table 2).

23 International Circumpolar Surveillance – Tuberculosis Report
Figure 5: Reported crude TB incidence rate (new and re-treatment cases) by age groups and ICS-TB jurisdictions*, 2006-2012**
*Data from Finland not available. **2006 data for Arkhangelsk not available. Table 2: Reported new active and re-treatment TB cases and incidence rate per 100,000 by age groups and ICS-TB jurisdictions*, 2006-2012**
Jurisdiction Age group
Total <1 1-4 5-14 15-24 25-34 35-44 45-54 55-64 65+
Northwest Territories
Cases 0 0 1 11 11 16 12 7 19 77 Rate 0.0 0.0 2.0 21.7 23.6 34.6 28.0 25.7 119.7 25.4
Nunavik Cases 4 25 24 43 29 17 12 5 4 163 Rate 204.6 316.2 147.9 332.4 279.6 240.6 66.5 107.7 154.6 199.5
Nunavut Cases 13 17 22 133 88 78 54 22 20 447 Rate 232.0 79.2 49.5 353.3 288.8 335.1 116.2 161.1 287.6 194.3
Yukon Cases 0 2 1 2 3 8 7 2 4 29 Rate 0.0 18.6 3.1 5.9 8.3 18.1 25.4 6.3 20.2 12.1
Greenland Cases 2 6 26 172 98 86 101 56 27 574 Rate 34.0 25.5 42.0 338.0 151.4 135.4 160.7 151.9 104.7 144.9
Norway Cases 1 1 6 51 71 28 13 8 27 206 Rate 2.7 0.7 1.4 11.9 19.0 6.0 2.9 1.9 5.3 6.3
Sweden Cases 0 3 9 18 40 24 11 10 37 152 Rate 0.0 2.0 2.4 3.6 9.8 5.4 2.4 2.1 5.3 4.3
Arkhangelsk Cases 4 38 75 389 1207 1230 1196 544 197 4880 Rate 4.1 10.1 5.7 28.5 105.5 88.8 145.7 56.3 18.9 57.4
Alaska Cases 3 16 16 44 41 63 95 61 58 397 Rate 3.9 5.4 2.1 6.4 6.1 8.1 13.4 10.7 15.7 8.1

24 International Circumpolar Surveillance – Tuberculosis Report
*Data from Finland not available. ** 2006 data for Arkhangelsk not available. The median age for reported active TB cases was lowest in Nunavik (20 years old) and highest in Alaska (46 years old). The large fluctuations observed in the yearly median age for individual jurisdictions are due mainly to the small number of reported cases in those jurisdictions (Figure 6, Table 3). Figure 6: Median age* of reported active TB cases (new and re-treatment cases) by ICS-TB jurisdictions**, 2006-2012***
*The range represents the minimum and maximum percentage for a given year. **Data from Finland not available. ***2006 data for Arkhangelsk not available. Table 3: Median age of reported active TB cases (new and re-treatment cases) by ICS-TB jurisdictions*, 2006-2012**
Jurisdiction Total
number of cases
Reporting year Overall
2006 2007 2008 2009 2010 2011 2012
Northwest Territories 77 69 43 41 44 35 41 61 43
Nunavik 163 13 16 18 27 33 20 21 20 Nunavut 447 22 34 23 30 30 27 34 28
Yukon 29 23 42 39 38 51 43 66 42 Greenland 574 31 39 27 32 31 23 39 31 Northern Norway 206 31 36 36 30 30 27 29 30
Northern Sweden 152 39 43 59 37 30 42 29 37
Arkhangelsk 4880 N/A 40 41 40 42 39 39 40 Alaska 397 43 50 46 50 48 47 42 46
*Data from Finland not available. **2006 data for Arkhangelsk not available.

25 International Circumpolar Surveillance – Tuberculosis Report
In all ICS-TB jurisdictions, the overall incidence rata was higher in males than females. The highest overall male-female difference in incidence rate was in Arkhangelsk with a rate almost 3.5 times higher in males than females (Table 4). The overall incidence was comparable in males and females for Norway, Sweden and Greenland. Table 4: Reported crude incidence rate (per 100,000 population) by sex and ICS-TB jurisdictions*, 2006-2012**
Jurisdictions Sex Reporting year (rate per 100,000 pop)
Total 2006 2007 2008 2009 2010 2011 2012
Northwest Territories Males 17.8 53.5 44.7 36.2 35.9 35.8 13.4 33.9
Females 9.6 14.4 19.1 19.2 14.3 23.6 14.1 16.4
Nunavik Males 35.6 156.6 205 134.1 81.9 273.1 588.5 215.3
Females 75.1 55 161.9 105.1 119.1 167 565.8 182.9
Nunavut Males 175.9 91.8 241.3 164.7 396.9 270.6 292.6 236 Females 134.1 105.2 123.5 177.1 191.5 157.3 153.9 149.6
Yukon Males 18.1 12 29.3 23 22.5 5.5 5.4 16.3
Females 0 6.3 18.5 0 11.8 17.2 0 7.7
Greenland Males 149.1 126.6 127.2 137.5 207.1 207.1 186.4 163
Females 101.1 78.8 97.8 83.4 196.1 195 119.8 124.6
Northern Sweden Males 1.9 4.7 1.6 7.0 5.8 4.7 7.4 4.7
Females 4.3 2.4 5.2 2.8 4.8 3.2 4.0 3.8
Arkhangelsk Males N/A 111.9 112.6 108.6 94.7 117.9 100.1 99.7
Females N/A 34.5 30.7 32.1 37.5 30.6 26.6 29.3
Alaska Males 10.9 9.7 9.3 6.6 9.5 11.2 9.2 9.5
Females 9.8 4.9 5.1 3.9 6.5 7.2 8.8 6.6 *Data from Finland and Norway not available. **2006 data for Arkhangelsk not available. TB disease history The highest proportion of new cases versus re-treatment cases was in Yukon (97%) followed by Nunavik (91%) and Greenland (90%). The highest proportion of re-treatment cases (defined as having had at least one previous diagnosis of TB disease in the past) was in Arkhangelsk (26% of all reported cases), followed closely by the Northwest Territories (25%). Previous history of TB disease was reported as unknown for 11% and 14% of the reported cases for Norway and Sweden respectively (Figure 7; Table 5).

26 International Circumpolar Surveillance – Tuberculosis Report
Figure 7: Reported percentages of TB cases by treatment history and ICS-TB jurisdiction*, 2006-2012**
*Data from Finland not available. **Excluding 2006 data for Arkhangelsk. Table 5: Reported percentages of TB cases by treatment history and ICS-TB jurisdiction*, 2006-2012**
Treatment history
Jurisdiction
Northwest Territories Nunavik Nunavut Yukon Greenland Northern
Norway Northern
Sweden Arkhangelsk** Alaska
New 75.3 91.4 88.1 96.6 90.1 78.6 77.0 74.1 90.4 Re-
treatment 24.7 7.4 11.0 3.4 9.9 10.7 9.2 25.9 9.6
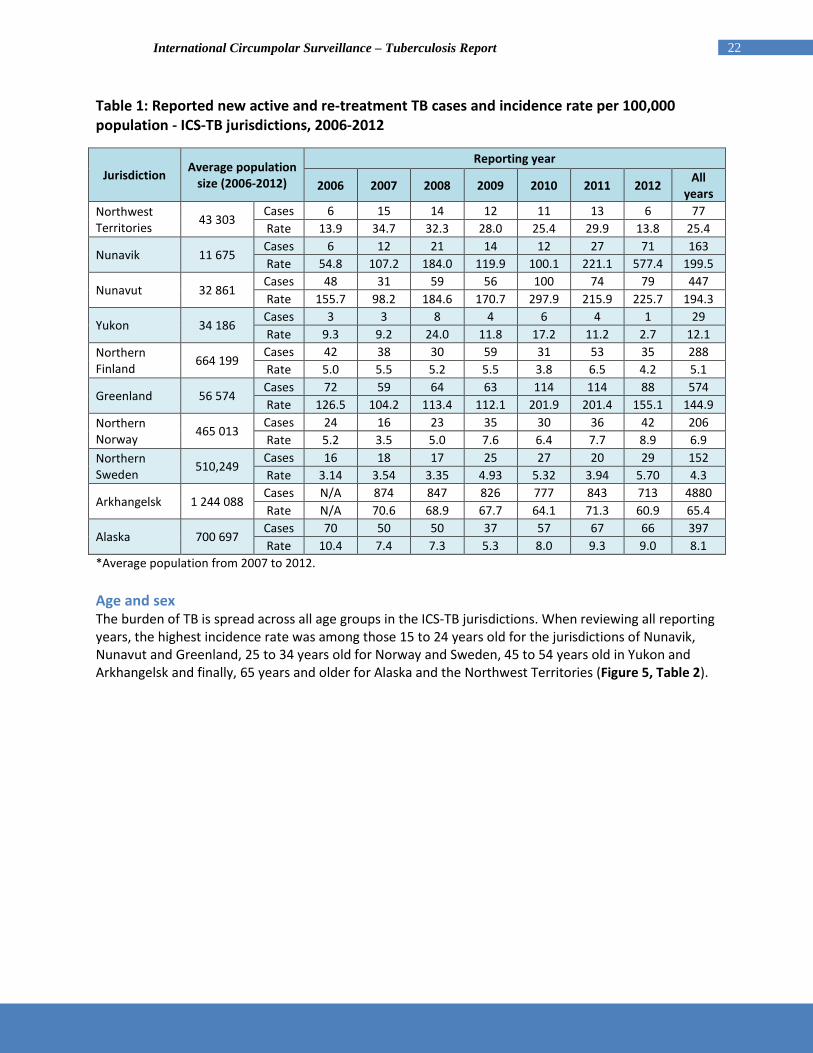
Unknown 0.0 1.2 0.9 0.0 0.0 10.7 13.8 0.0 0.0 *Data from Finland not available. ** Excluding 2006 data for Arkhangelsk. Disease type and diagnostic classification Over the seven-year reporting period, about 60% of reported cases were laboratory-confirmed, which includes all smear and/or culture-positive cases. Alaska reported the highest percentage of laboratory-confirmed cases (87%) and Archangelsk reported the highest percentage of clinically-confirmed cases (46%) (Table 6).
27 International Circumpolar Surveillance – Tuberculosis Report
Figure 8: Reported percentage of TB cases by confirmed diagnostic status and jurisdiction*, 2006-2012**
*Data from Finland not available. ** Excluding 2006 data for Arkhangelsk. Table 6: Reported percentage of TB cases by confirmed diagnostic status and jurisdiction*, 2006-2012**
Diagnostic status
Jurisdiction (%)
Northwest Territories Nunavik Nunavut Yukon Greenland Northern
Norway Northern Sweden Arkhangelsk Alaska
Laboratory-confirmed 76.6 71.2 81.2 82.8 70.4 71.4 73.4 54.2 87.4
Clinical diagnosis 23.4 28.8 18.8 17.2 29.6 28.6 26.3 45.8 12.6
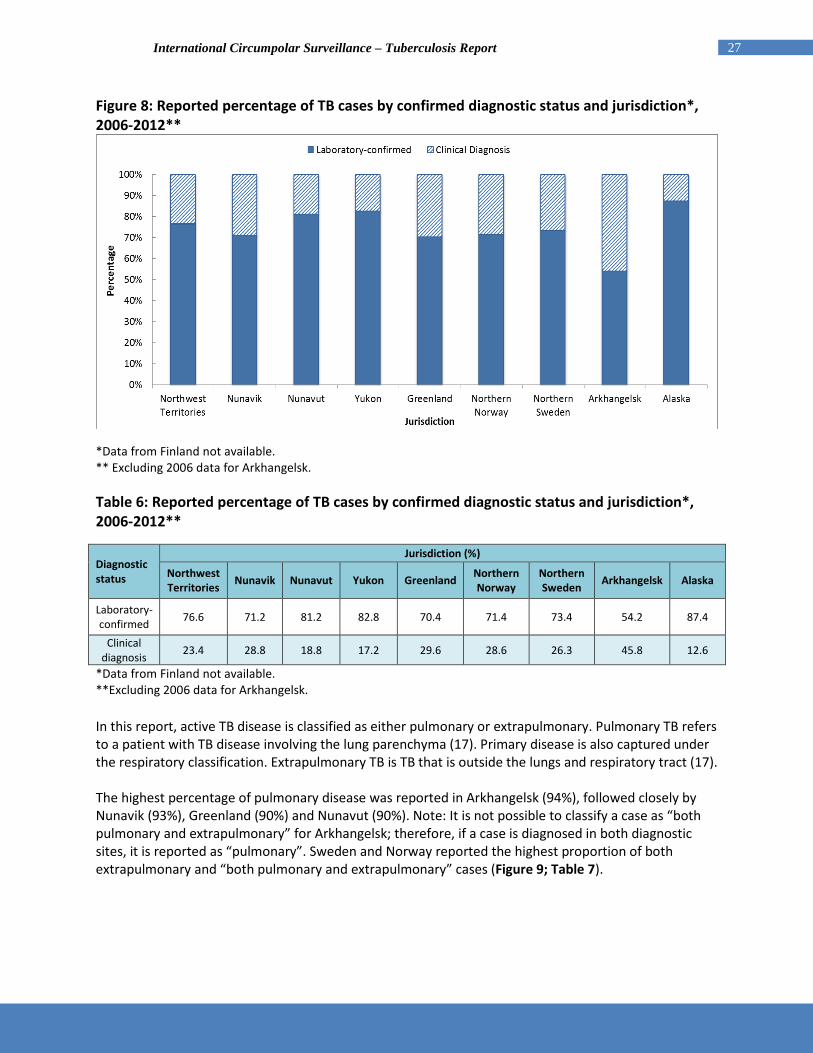
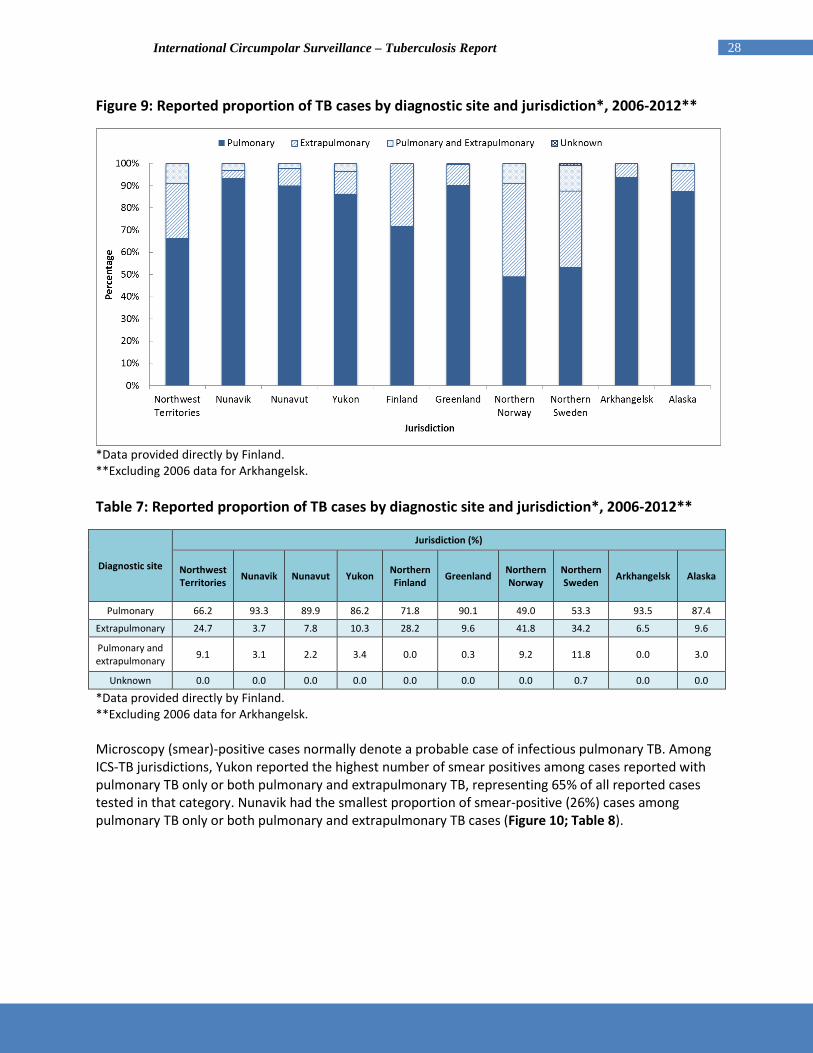
*Data from Finland not available. **Excluding 2006 data for Arkhangelsk. In this report, active TB disease is classified as either pulmonary or extrapulmonary. Pulmonary TB refers to a patient with TB disease involving the lung parenchyma (17). Primary disease is also captured under the respiratory classification. Extrapulmonary TB is TB that is outside the lungs and respiratory tract (17). The highest percentage of pulmonary disease was reported in Arkhangelsk (94%), followed closely by Nunavik (93%), Greenland (90%) and Nunavut (90%). Note: It is not possible to classify a case as “both pulmonary and extrapulmonary” for Arkhangelsk; therefore, if a case is diagnosed in both diagnostic sites, it is reported as “pulmonary”. Sweden and Norway reported the highest proportion of both extrapulmonary and “both pulmonary and extrapulmonary” cases (Figure 9; Table 7).
28 International Circumpolar Surveillance – Tuberculosis Report
Figure 9: Reported proportion of TB cases by diagnostic site and jurisdiction*, 2006-2012**
*Data provided directly by Finland. **Excluding 2006 data for Arkhangelsk. Table 7: Reported proportion of TB cases by diagnostic site and jurisdiction*, 2006-2012**
Diagnostic site
Jurisdiction (%)
Northwest Territories Nunavik Nunavut Yukon Northern
Finland Greenland Northern Norway
Northern Sweden Arkhangelsk Alaska
Pulmonary 66.2 93.3 89.9 86.2 71.8 90.1 49.0 53.3 93.5 87.4
Extrapulmonary 24.7 3.7 7.8 10.3 28.2 9.6 41.8 34.2 6.5 9.6
Pulmonary and extrapulmonary 9.1 3.1 2.2 3.4 0.0 0.3 9.2 11.8 0.0 3.0
Unknown 0.0 0.0 0.0 0.0 0.0 0.0 0.0 0.7 0.0 0.0
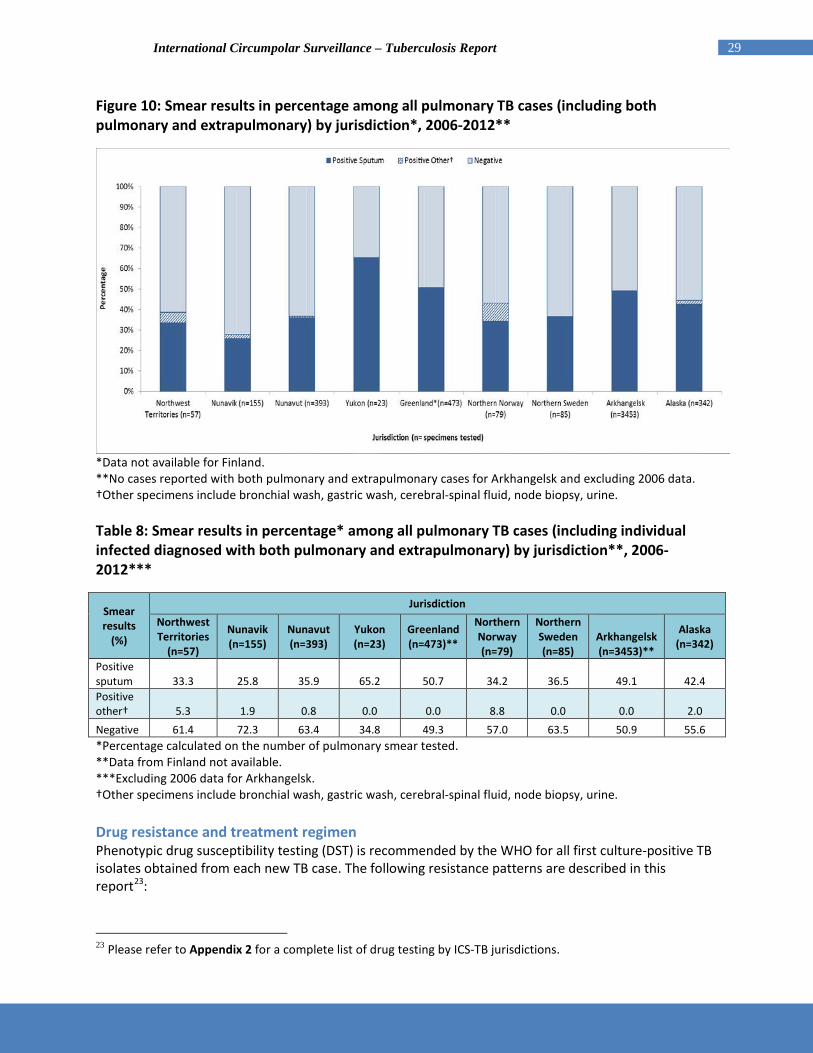
*Data provided directly by Finland. **Excluding 2006 data for Arkhangelsk. Microscopy (smear)-positive cases normally denote a probable case of infectious pulmonary TB. Among ICS-TB jurisdictions, Yukon reported the highest number of smear positives among cases reported with pulmonary TB only or both pulmonary and extrapulmonary TB, representing 65% of all reported cases tested in that category. Nunavik had the smallest proportion of smear-positive (26%) cases among pulmonary TB only or both pulmonary and extrapulmonary TB cases (Figure 10; Table 8).
29 International Circumpolar Surveillance – Tuberculosis Report
Figure 10: Smear results in percentage among all pulmonary TB cases (including both pulmonary and extrapulmonary) by jurisdiction*, 2006-2012**
*Data not available for Finland. **No cases reported with both pulmonary and extrapulmonary cases for Arkhangelsk and excluding 2006 data. †Other specimens include bronchial wash, gastric wash, cerebral-spinal fluid, node biopsy, urine. Table 8: Smear results in percentage* among all pulmonary TB cases (including individual infected diagnosed with both pulmonary and extrapulmonary) by jurisdiction**, 2006-2012***
Smear results
(%)
Jurisdiction Northwest Territories
(n=57)
Nunavik (n=155)
Nunavut (n=393)
Yukon (n=23)
Greenland (n=473)**
Northern Norway (n=79)
Northern Sweden (n=85)
Arkhangelsk (n=3453)**
Alaska (n=342)
Positive sputum 33.3 25.8 35.9 65.2 50.7 34.2 36.5 49.1 42.4 Positive other† 5.3 1.9 0.8 0.0 0.0 8.8 0.0 0.0 2.0 Negative 61.4 72.3 63.4 34.8 49.3 57.0 63.5 50.9 55.6 *Percentage calculated on the number of pulmonary smear tested. **Data from Finland not available. ***Excluding 2006 data for Arkhangelsk. †Other specimens include bronchial wash, gastric wash, cerebral-spinal fluid, node biopsy, urine. Drug resistance and treatment regimen Phenotypic drug susceptibility testing (DST) is recommended by the WHO for all first culture-positive TB isolates obtained from each new TB case. The following resistance patterns are described in this report23:
23 Please refer to Appendix 2 for a complete list of drug testing by ICS-TB jurisdictions.
30 International Circumpolar Surveillance – Tuberculosis Report
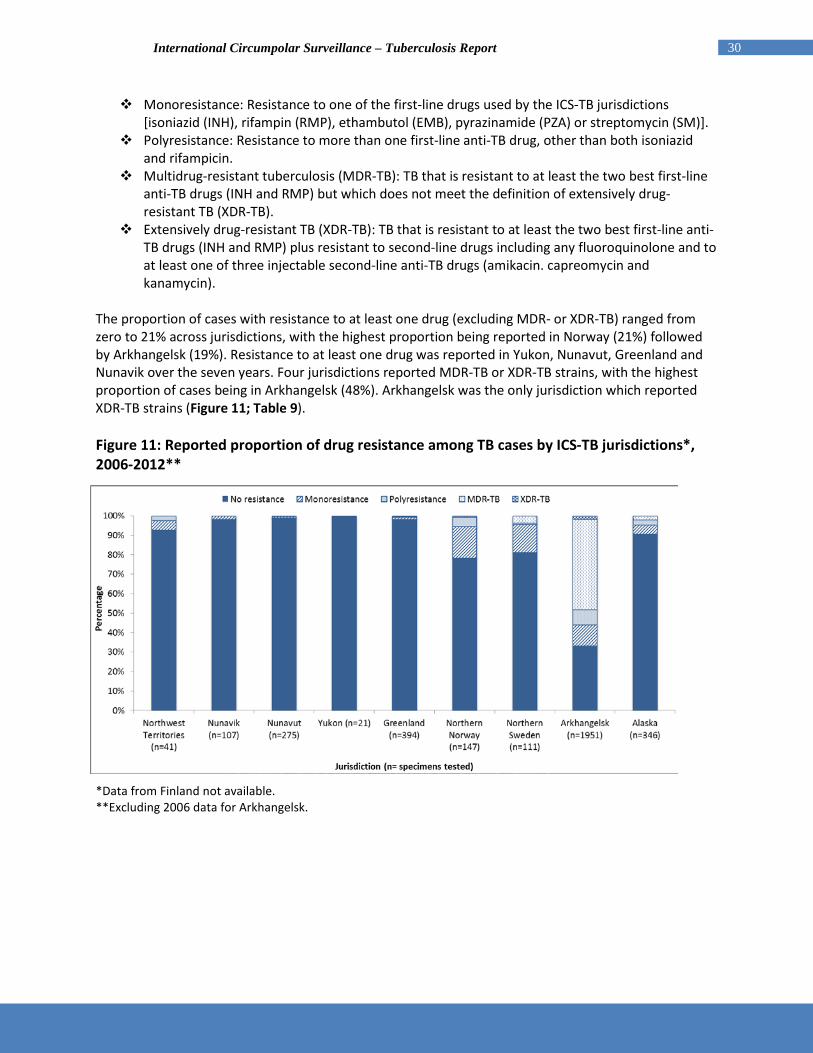
Monoresistance: Resistance to one of the first-line drugs used by the ICS-TB jurisdictions [isoniazid (INH), rifampin (RMP), ethambutol (EMB), pyrazinamide (PZA) or streptomycin (SM)].
Polyresistance: Resistance to more than one first-line anti-TB drug, other than both isoniazid and rifampicin.
Multidrug-resistant tuberculosis (MDR-TB): TB that is resistant to at least the two best first-line anti-TB drugs (INH and RMP) but which does not meet the definition of extensively drug-resistant TB (XDR-TB).
Extensively drug-resistant TB (XDR-TB): TB that is resistant to at least the two best first-line anti-TB drugs (INH and RMP) plus resistant to second-line drugs including any fluoroquinolone and to at least one of three injectable second-line anti-TB drugs (amikacin. capreomycin and kanamycin).
The proportion of cases with resistance to at least one drug (excluding MDR- or XDR-TB) ranged from zero to 21% across jurisdictions, with the highest proportion being reported in Norway (21%) followed by Arkhangelsk (19%). Resistance to at least one drug was reported in Yukon, Nunavut, Greenland and Nunavik over the seven years. Four jurisdictions reported MDR-TB or XDR-TB strains, with the highest proportion of cases being in Arkhangelsk (48%). Arkhangelsk was the only jurisdiction which reported XDR-TB strains (Figure 11; Table 9). Figure 11: Reported proportion of drug resistance among TB cases by ICS-TB jurisdictions*, 2006-2012**
*Data from Finland not available. **Excluding 2006 data for Arkhangelsk.

31 International Circumpolar Surveillance – Tuberculosis Report
Table 9: Reported percentage* of drug resistance among TB cases by ICS-TB jurisdictions**, 2006-2012***
Drug resistance
Jurisdiction (%) Northwest Territories
(n*=41)
Nunavik (n=107)
Nunavut (n=275)
Yukon (n=21)
Greenland (n=394)
Northern Norway (n=147)
Northern Sweden (n=111)
Arkhangelsk (n=1951)
Alaska (n=346)
No resistance 92.7 98.1 98.9 100.0 98.2 78.2 81.1 33.1 90.5 Monoresistance 4.9 1.9 0.7 0.0 1.3 16.3 14.4 10.8 4.9 Polyresistance 2.4 0.0 0.4 0.0 0.3 4.8 0.9 8.0 2.6 MDR-TB 0.0 0.0 0.0 0.0 0.3 0.7 3.6 46.3 2.0 XDR-TB 0.0 0.0 0.0 0.0 0.0 0.0 0.0 1.8 0.0 *Percentage calculated on the number of specimens tested (n=number of specimens tested). **Data from Finland not available. ***Excluding 2006 data for Arkhangelsk. TB strains resistant to isoniazid only were the most prevalent, and isoniazid monoresistance was the only resistance patterns reported by the Northwest Territories, Nunavik, Nunavut and Greenland. No resistance to isoniazid was reported by Yukon. The highest proportion of monoresistance was found in Northern Norway at 16.3% of all specimens tested for drug resistance; (Tables 9 and 10). Monoresistance to streptomycin was the second most commonly reported form of resistance, particularly in Norway and Arkhangelsk24. Note that Canadian territories do not test for resistance to streptomycin. Table 10: Reported proportion of monoresistance among TB cases by ICS-TB jurisdictions*, 2006-2012**
Drug resistance
Jurisdiction Northwest Territories
(n=2)
Nunavik (n=2)
Nunavut (n=2)
Greenland (n=5)
Northern Norway (n=24)
Northern Sweden (n=16)
Arkhangelsk (n=210)
Alaska (n=17)
Isoniazid 100.0 100.0 100.0 100.0 50.0 56.3 40.5 70.6 Rifampin 0.0 0.0 0.0 0.0 0.0 0.0 3.3 5.9
Ethambutol 0.0 0.0 0.0 0.0 0.0 0.0 4.3 0.0 Pyrazinamide 0.0 0.0 0.0 0.0 0.0 43.8 8.1 23.5 Streptomycin Not tested Not tested Not tested Not tested 50.0 Not tested 43.8 Not tested *No monoresistance reported for Yukon and Finland data not available. **Excluding 2006 data for Arkhangelsk. Among all reported cases25, the proportion of cases on a RMP-INH-PZA-EMB (RIPE) treatment regime across jurisdictions26 varied considerably. The largest proportion of cases on the RIPE regime was
24 Before 2010, drug sensitivity testing was performed on EMB, PZA and SM in the Arkhangelsk region. Since 2010, testing of those drugs have stopped in that jurisdiction as SM was no longer recommended by the WHO (WHO’s Guidelines for treatment of tuberculosis, fourth edition). In addition, EMB and PZA were also removed from the routine drug sensitivity testing if patients were susceptible for INH and RMP; therefore a standardised treatment of RIPE without testing for EMB and PZA. 25 As several cases with known resistance to any of those four drugs were still reported to have been placed on the fours drug regime, this analysis includes all reported cases. 26 Data not available for Sweden.

32 International Circumpolar Surveillance – Tuberculosis Report
observed in Greenland (99.8%), followed by Alaska (88%) and the Northwest Territories (77%). The jurisdictions with the smallest proportion of susceptible cases on a RIPE treatment regime are Yukon (14%) and Arkhangelsk (42%) (Figure 12; Table 11). Note that the low level of RIPE treatment regimen in Arkhangelsk is mainly due to the high proportion of MDR and XDR-TB. Figure 12: Reported proportion of TB cases on RIPE treatment regime by ICS-TB jurisdictions*, 2006-2012**
*No data available for Sweden and Finland. **Excluding 2006 data for Arkhangelsk. Table 11: Reported proportion of TB cases on RIPE treatment regime by jurisdiction*, 2006 - 2012**
Treatment Regimen
Jurisdiction (%)
Northwest Territories Nunavik Nunavut Yukon Greenland Northern
Norway Arkhangelsk Alaska
Yes 76.6 65.0 67.3 13.8 99.8 70.9 42.3 88.2 No 23.4 35.0 32.7 86.2 0.2 29.1 30.2 11.8 Unknown 0.0 0.0 0.0 0.0 0.0 0.0 27.5 0.0
*No data available for Sweden and Finland. **Excluding 2006 data for Arkhangelsk. Treatment outcome Jurisdictions with the highest proportion of cases that were classified as cured or who had completed treatment were Yukon (97%), the Northwest Territories (86%), Norway (85%) and Alaska (84%). The jurisdiction with the lowest proportion of cases reported as cured or who completed treatment was Sweden (68%); however, it is important to note that 28% of treatment outcome data was not available

33 International Circumpolar Surveillance – Tuberculosis Report
for Sweden. In addition, Arkhangelsk was excluded from this analysis as the only reported treatment outcome was “death”. It was therefore not possible to assess the proportion of the other treatment outcomes for that jurisdiction (Figure 13; Table 12). Figure 13: Reported treatment outcomes among TB cases by jurisdiction, 2006-2012
*No data available for Finland. **Arkhangelsk data excluded from the figure as death was the only treatment outcome available. ***The "Other" category includes treatment failure, defaulted, transferred out, absconded, treatment ongoing, treatment and dispended because of adverse effect. Table 12: Reported treatment outcomes among TB cases by jurisdiction*, 2006-2012**
Treatment Outcome
Jurisdiction (%)
Northwest Territories Nunavik Nunavut Yukon Greenland Northern
Norway Northern Sweden Arkhangelsk Alaska
Cured or Completed Treatment
85.7 77.9 77.9 96.6 78.4 84.6 67.8 N/A 83.6
Died 13.0 1.8 0.0 3.4 5.1 4.5 2.8 13.6 9.1 Other*** 0.0 1.8 0.6 0.0 12.2 5.4 3.2 N/A 3.0 Unknown/Not Available 1.3 18.6 21.5 0.0 4.4 5.4 26.2 86.4 4.3
*No data available for Finland. **Excluding 2006 data for Arkhangelsk. ***The "Other" category includes treatment failure, defaulted, transferred out, absconded, treatment ongoing, treatment and dispended because of adverse effect. Of the total number of TB cases who died of any cause during treatment, Arkhangelsk reported the highest proportion (73%) of any form of death among TB cases, followed by Norway (69%), the Northwest Territories (60%) and Nunavut (50%). Nunavik did not report any deaths for the time period 2006-2012 (Figure 14; Table 13).

34 International Circumpolar Surveillance – Tuberculosis Report
Figure 14: Reported cause of death among TB cases by jurisdiction*, 2006-2012**
*Nunavik did not report any death for the time period 2006-2012 and no data available for Finland. **Excluding 2006 data for Arkhangelsk. Table 13: Distribution of cause of death among TB cases by jurisdiction*, 2006-2012** (n=1,029)
Treatment history
Jurisdiction (%)
Northwest Territories
(n=10)
Nunavut (n=8)
Yukon (n=1)
Greenland (n=29)
Northern Norway
(n=7)
Northern Sweden
(n=6)
Arkhangelsk (n=659)
Alaska (n=36)
TB contributed to or was the cause
of death 60.0 50.0 0.0 0.0 69.2 25.9 72.7 47.2
Death not related to TB 40.0 50.0 100.0 0.0 30.8 57.8 27.3 52.8
Unknown 0.0 0.0 0.0 100.0 0.0 16.4 0.0 0.0 *Nunavik did not report any death for the time period 2006-2012 and no data available for Finland. **Excluding 2006 data for Arkhangelsk.

35 International Circumpolar Surveillance – Tuberculosis Report
DISCUSSION The current surveillance data provided by the participating ICS-TB jurisdictions highlights a large degree of variation in TB disease rates as well as drug resistance patterns in participating circumpolar regions. According to the WHO, low incidence is defined as less than 20 cases per 100,000 population (17). From 2006 to 2012, five of the ten ICS-TB regions met that definition. Despite slight variations in the actual number of cases for some jurisdictions, fluctuations observed in the incidence rates, particularly when divided by age groups and sex, are caused mainly by the small populations sizes in circumpolar regions. For all jurisdictions, the crude incidence rate for males was greater than for females. For half of the jurisdictions, the highest incidence rate was found among those 25-34 years or younger. A high incidence rate among a younger age group is usually considered to be an indicator of recent transmission of TB (19,20). Overall, less than 50% of reported cases were smear-positive pulmonary cases. Pulmonary smear-positive cases may be a sign of a more advanced stage of the disease and are more likely to be contagious and therefore more capable of transmission within the community (6). Considering global rates, the proportion of drug resistance cases across the ICS-TB participating jurisdictions remains low. Except in one jurisdiction, MDR and XDR cases were uncommon in the circumpolar region, with four jurisdictions reporting no MDR/XDR-TB cases during the specified time period and four other regions having very few cases.
DATA LIMITATIONS Small population sizes TB incidence rates are significantly affected by small population sizes (i.e., one TB case can increase the TB incidence rate by a magnitude of three). Population sizes vary by jurisdiction and thus, incidence rates should be interpreted with this in mind. Reporting year In order to conduct descriptive analyses with respect to time, the year in which the TB case was reported was required, however, for a portion of TB cases, data on reporting year were missing. To determine the reporting year for TB cases with missing data for reporting year, the year was extracted from the “Date of diagnosis” variable. When TB cases were missing data for both the reporting year and date of diagnosis variables, the year was extracted from the “CaseID” variable. The year extracted from the “Date of diagnosis” variable may not accurately reflect the reporting year (i.e., the TB case could have been diagnosed in December 2006 but case was reported in January 2007). Smear-positive cases In order to calculate the proportion of smear-positive pulmonary cases, the denominator used in the analysis consisted of all cases that had a sputum smear result, or other smear result (e.g., from a bronchial wash, gastric wash, cerebral-spinal fluid, node biopsy, urine or other). Data on smear results for a number of jurisdictions were not available at the time of data analyses, thus, the proportion of

36 International Circumpolar Surveillance – Tuberculosis Report
smear-positive cases could either be underestimated (missing case data could be smear-positive) or overestimated (missing case data could be smear negative). RIPE treatment regime among susceptible cases In order to calculate the proportion of susceptible cases that are on a RIPE (Isoniazid, Ethambutol, Rifampin, Pyrazinamide) treatment regime, data on treatment and drug resistance were required (total number of susceptible cases on RIPE/total number of susceptible cases). However, TB cases were placed on RIPE despite resistance and all cases were included in the calculations, which created an underestimation. In addition, for a number of jurisdictions, data on treatment regime was not available, thus, the proportion of cases on a RIPE treatment regime may have been under or overestimated. Furthermore, drug sensitivity data was not available for a portion of cases, thus, the total number of susceptible cases may have been under or overestimated. Drug resistance In order to calculate the proportion of cases in the ICS jurisdictions with drug-resistant strains of TB (mono-drug resistance, MDR-TB and XDR-TB), the denominator used in the analysis was the total number of cases with a drug sensitivity test with a known result (positive or negative). This analysis did not take into account cases that did not have a mycobacterial culture present for testing or cases with an unknown sensitivity test. In a number of jurisdictions, data was provided on the results of drug sensitivities; however, data on culture methods and results were missing. Furthermore, drug sensitivity data was not available for some cases, thus, the calculated proportion of cases with drug resistance may be underestimated. In addition, not all jurisdictions use or test for the same first-line drugs. For example, streptomycin is not tested in Canada, which may underestimate the actual resistance of streptomycin in the circumpolar jurisdictions. TB-related deaths In order to calculate the distribution of causes of death among the proportion of cases who had died (TB contributed to death or TB did not contribute to death), the total number of deaths for each jurisdiction was derived from the “treatment outcome” variable which indicates if cases had been cured/completed treatment, had died or had another treatment outcome. In one jurisdiction, data on treatment outcomes were not available at the time of data analysis and thus, the total number of deaths could not be determined based on this variable. However, jurisdictions did provide data on cause of death, despite data not being available for treatment outcomes. To approximate the total number of deaths (denominator), totals for “TB contributed to death”, “death not related to TB” and “unknown” were tallied. This may not be completely representative of the total number of deaths.

37 International Circumpolar Surveillance – Tuberculosis Report
CONCLUSION Overall, TB remains a serious public health issue in the circumpolar region. The International Circumpolar Surveillance (ICS) project contributes to a more comprehensive understanding of TB in the north. As the epidemiology of TB in circumpolar regions evolves and changes, members of the International Circumpolar Surveillance – Tuberculosis Working Group will continue to share expertise to improve upon existing knowledge of the epidemiology of TB and will work collaboratively to reduce the burden of TB in the circumpolar region and across the world.

38 International Circumpolar Surveillance – Tuberculosis Report
REFERENCES
1. Zulz T, Bruce MG, Parkinson AJ. International circumpolar surveillance: Prevention and control of infectious diseases: 1999-2008. Int J Circumpolar Health. 2009;S-4.
2. Lönnroth K, Jaramillo E, Williams BG, Dye C, Raviglione M. Drivers of tuberculosis epidemics: The
role of risk factors and social determinants. Soc Sci Med. Jun 2009;68(12):2240-6.
3. Hargreaves JR, Boccia D, Evans CA, Adato M, Petticrew M, Porter JD. The social determinants of tuberculosis: From evidence to action. Am J Public Health. Apr 2011;101(4):654-62.
4. Young K. Bjerregaard P. (Eds). Health transitions in Arctic populations. Toronto ON: University of
Toronto Press, Scholarly Publishing Division; 2008.
5. Zulz T. International Circumpolar Surveillance Tuberculosis Working Group: Formative evaluation. Unpublished master’s thesis. Anchorage Alaska: University of Alaska; 2007.
6. Long R, Schwartzman K. Pathogenesis and transmission of tuberculosis. In: Long R, Ellis E. Eds.
Canadian tuberculosis standards. 7th ed. Ottawa, ON: Canadian Thoracic Society, Canadian Lung Association, Public Health Agency of Canada; 2014. pp 25-42.
7. Heymann DL. Ed. Control of communicable diseases manual. 18th ed. Washington, DC:
American Public Health Association; 2004.
8. Pai M, Minion J, Jamieson F, Wolfe J, Behr M. Diagnosis of active tuberculosis and drug resistance. In: Long R, Ellis E. Eds. Canadian tuberculosis standards. 7th ed. Ottawa, ON: Canadian Thoracic Society, Canadian Lung Association, Public Health Agency of Canada; 2014. pp 43-61.
9. Menzies D, Elwood K. Treatment of tuberculosis disease. In: Long R, Ellis E. Eds. Canadian
tuberculosis standards. 7th ed. Ottawa, ON: Canadian Thoracic Society, Canadian Lung Association, Public Health Agency of Canada; 2014. pp 97-124.
10. World Health Organization (WHO). Multidrug and extensively drug-resistant TB (M/XDR-TB):
2010 Global report on surveillance and response. Geneva, Switzerland: WHO; 2010. http://whqlibdoc.who.int/publications/2010/9789241599191_eng.pdf.
11. World Health Organization. Treatment of tuberculosis guidelines (4th edition). Geneva,
Switzerland: WHO; 2009. WHO/HTM/TB/2009.420.
12. Bourgeois A, Zulz T, Soborg B, Koch A, International Circumpolar Surveillance—Tuberculosis Working Group. Descriptive review of tuberculosis surveillance systems across the circumpolar regions. Int J Circumpolar Health. Apr 2016;75:30322
13. Public Health Agency of Canada. Tuberculosis in Canada 2006. Ottawa, ON: Minister of Public
Works and Government Services Canada; 2008.
39 International Circumpolar Surveillance – Tuberculosis Report
14. World Health Organization. Revised TB recording and reporting forms and registers − version 2006. Geneva, Switzerland: WHO; 2006 (WHO/HTM/TB/2006.373. http://www.who.int/tb/dots/r_and_r_forms/.
15. Public Health Agency of Canada. Directive for the collection. use and dissemination of
information relating to public health. Internal unpublished document; 2013.
16. Young K, Marchildon G. Eds. A comparative review of circumpolar health systems. Int J Circumpolar Health. 2012;S-9.
17. World Health Organization. Global tuberculosis report 2013. France: WHO Press; 2013.
18. Kuznetsov VN, Grjibovsk AM, Mariandyshev AO, Johansson E, Bjune GA. A comparison between
passive and active case finding in TB control in the Arkhangelsk region. Int J Circumpolar Health. 2014;73:23515.
19. Nava-Aguilera E, Andersson N, Harris E, Mitchell S, Hamel C, Shea B, López-Vidal Y, Villegas-
Arrizón A, Morales-Pérez A. Risk factors associated with recent transmission of tuberculosis: systematic review and meta-analysis. Int J Tuberc Lung Dis. 2009;13(1):17–26.
20. Cruz A, Hwang KM, Birnbaum GD, Starke JR. Adolescents with tuberculosis: A review of 145
cases. Pediatr Infect Dis J. 2013;32(9):937-941.
Additional references consulted: Jaakola S, Lyytikäinen O, Rimhanen-Finne R et al. Infectious diseases in Finland 2012. National Institute of Health and Welfare, Helsinki, 2013. World Health Organization. International statistical classification of diseases and related health problems. - 10th revision. edition 2010. WHO. 2011. Available at: http://www.who.int/classifications/icd/en/

40 International Circumpolar Surveillance – Tuberculosis Report
APPENDIX 1 – LIST OF CORE DATA ELEMENTS Main category Data elements Sub-data elements Identification Unique case identifier (jurisdiction specific for
reference purposes only)
ICS-TB case identifier (assigned by ICS-TB) Demographics Country reporting the case
Region reporting the case (future prospective analysis may include uniform data element indicating region where diagnosed)
Geocode or sub-region identifier (e.g. province or state - specific to country)
Sex Month and year of birth and/or age at diagnosis (which ever is available)
Diagnosis Date of diagnosis (or other date used by the jurisdiction to define in the case in the context of time)
New or re-treatment case Diagnostic site: ‘pulmonary’, ‘extrapulmonary’ or ‘both’
Clinically-confirmed or culture-confirmed case Bacterial (microscopy) status or smear results Type and source of
specimen Method of microscopy
Culture results Type and source of specimen Method of culture
Final antibiotic resistance pattern (for culture-positive only)
Type of drug Concentration used Method of drug sensitivity testing
Treatment Initial date of treatment Final date of treatment Final treatment outcome Cause of death (if the case died)

41 International Circumpolar Surveillance – Tuberculosis Report
APPENDIX 2 – LIST OF DRUGS TESTED BY THE ICS-TB JURISDICTIONS
Country/jurisdiction Use* First-line drugs
Isoniazid (INH)
Rifampin (RMP)
Ethambutol (EMB)
Pyrazinamide (PZA)
Streptomycin (SM)
Canada (Northwest Territories, Nunavik, Nunavut, Yukon)
Standard regimen X X X X
Routine testing X X X X
Finland Standard regimen X X X X
Routine testing X X X X X
Greenland Standard regimen X X X X
Routine testing X X X X
Norway Standard regimen X X X X
Routine testing X X X X X
Sweden Standard regimen X X X X
Routine testing X X X X
Russian Federation (Arkhangelsk)**
Standard regimen X X
Routine testing X X
United States (Alaska)
Standard regimen X X X X
Routine testing X X X X * Standard therapy refers to a first-line drug that is normally used in the treatment of fully sensitive TB strains. Routine testing is a drug that is normally tested through routine drug susceptibility testing to determine the resistance to antituberculosis drugs. ** Before 2010 in Arkhangelsk, drug sensitivity testing was performed for EMB, SM and PZA. However, tests for those drugs have been discontinued as SM was no longer recommended by the WHO as a first-line drug in the standard regimen for new TB patients.