Embed Size (px)
Citation preview
Microgrid Innovation in the Circumpolar Arctic Lessons for Developing World Markets Published 3Q 2019 Commissioned by the University of Alaska Fairbanks Gwen Holdmann Director, Alaska Center for Energy and Power Peter Asmus Research Director
WHITE PAPER
Microgrid Innovation in the Circumpolar Arctic
©2019 Navigant Consulting, Inc. Notice: No material in this publication may be reproduced, stored in a retrieval system, or transmitted by any means, in whole or in part, without the express written permission of Navigant Consulting, Inc.
1
Section 1 INTRODUCTION
1.1 Setting the Stage: Microgrids in the Circumpolar Arctic
Remote regions of the world such as the circumpolar Arctic, once viewed as disadvantaged due to a lack of conventional grid infrastructure, have proven to be fertile ground for microgrid innovation. This innovation flows from both the challenges associated with providing reliable electricity without the benefit of traditional transmission and distribution systems and from the economic pressures associated with the high cost of delivered energy in markets with many areas of relatively low per capita income.
The Arctic is home to many paradoxes. It is a region of harsh climate and extreme cold, but it is also a global hotspot for microgrids. It is the region with the most visible effects of climate change, but it is also home to some of the highest rates of renewable energy uptake on Earth. This white paper argues that the global microgrid market can learn important lessons from the circumpolar Arctic’s history of energy innovation, especially from Alaska. The state’s vast geography, low population density, and high energy demand make it an interesting case study that can provide insights into this market.
This white paper provides updated market data on the scale, capacity, and resources deployed in microgrids throughout the circumpolar Arctic. It compares these microgrid characteristics to global market trends, emphasizing remote microgrids—the largest market opportunity for microgrids. It concludes with a series of lessons learned and recommendations to guide future microgrid development globally. This paper’s findings are especially relevant to developing nations exploring alternatives to traditional utility models focused on centralized grid infrastructure.
1.2 Where Is the Circumpolar Arctic?
The circumpolar Arctic is made up of the eight nations with territories above the Arctic Circle, including the US (Alaska), Canada, Russia, Greenland, Iceland, Norway, Sweden, and Finland, as shown in Figure 1-1. Within the circumpolar Arctic, there are two separate paradigms for how electric power services are delivered. Sweden, Norway, Finland, and parts of the Russian Arctic are connected to the larger European Union energy network or the Russian National Energy Grid and do not rely on microgrids. They incorporate high proportions of renewable resources but do so in a more traditional hub-and-spoke model. The model usually has larger projects where resources exist and then power is sent to distant locales via an extensive and robust transmission network. These nations reflect a traditional approach to renewable energy development revolving around large, centralized renewable energy systems that benefit from economies of scale.
In contrast, Alaska, Greenland, the Canadian Arctic, and large portions of the Russian Arctic are not interconnected with a traditional power grid. Over 1,500 communities with a total population exceeding 1.5 million inhabitants across this region rely on locally
Microgrid Innovation in the Circumpolar Arctic
©2019 Navigant Consulting, Inc. Notice: No material in this publication may be reproduced, stored in a retrieval system, or transmitted by any means, in whole or in part, without the express written permission of Navigant Consulting, Inc.
2
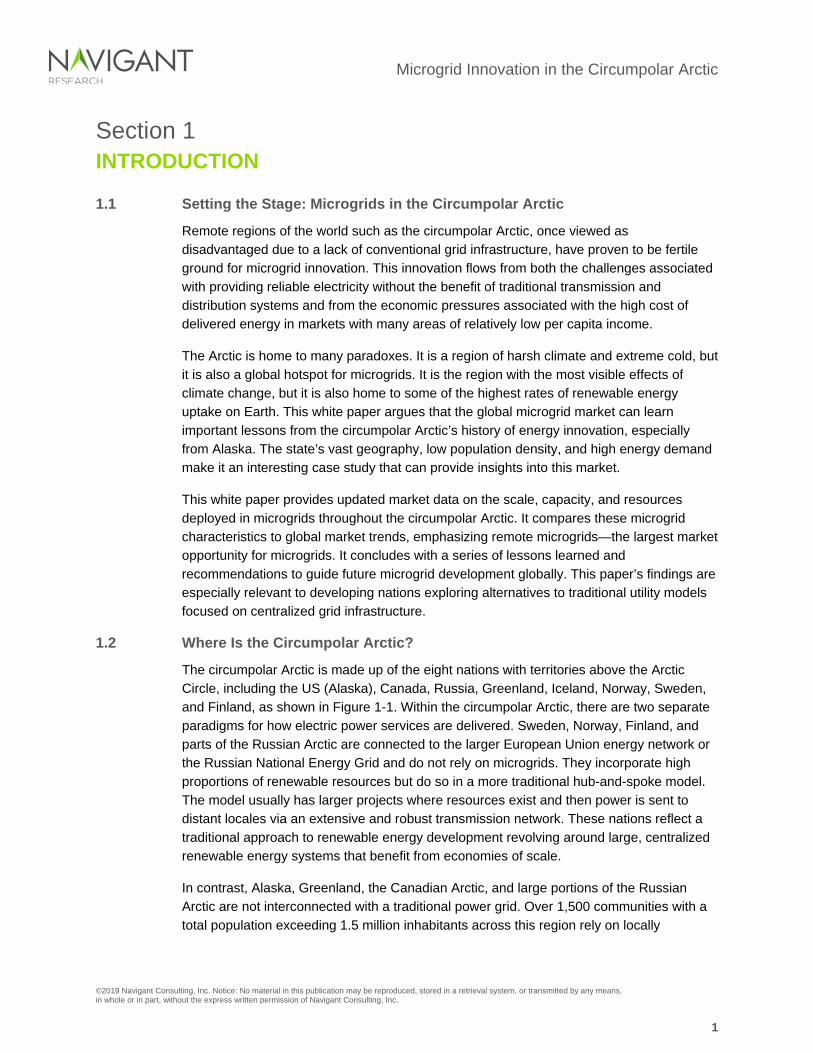
generated power. Most of these remote communities are served by some form of a microgrid or a regional grid.
Figure 1-1 depicts both remote grids and regional grids in the circumpolar Arctic region. The red dots show approximately 1,500 communities that are considered remote, or not connected to each other or other energy infrastructure via transmission lines or pipelines. The dark gray areas represent regional grids, which are described in more detail in Section 2.1. While each country in Figure 1-1 has fostered energy innovations, the US state of Alaska is in the lead when it comes to microgrids. Alaska has demonstrated the most success with the microgrid platform compared to other US states and could arguably be considered a global leader for remote microgrid deployments.
Figure 1-1. Circumpolar Arctic Remote Communities Microgrid Map
(Source: University of Alaska Fairbanks)
Microgrid Innovation in the Circumpolar Arctic
©2019 Navigant Consulting, Inc. Notice: No material in this publication may be reproduced, stored in a retrieval system, or transmitted by any means, in whole or in part, without the express written permission of Navigant Consulting, Inc.
3
1.2.1 Why Alaska Is a World Leader in Microgrids
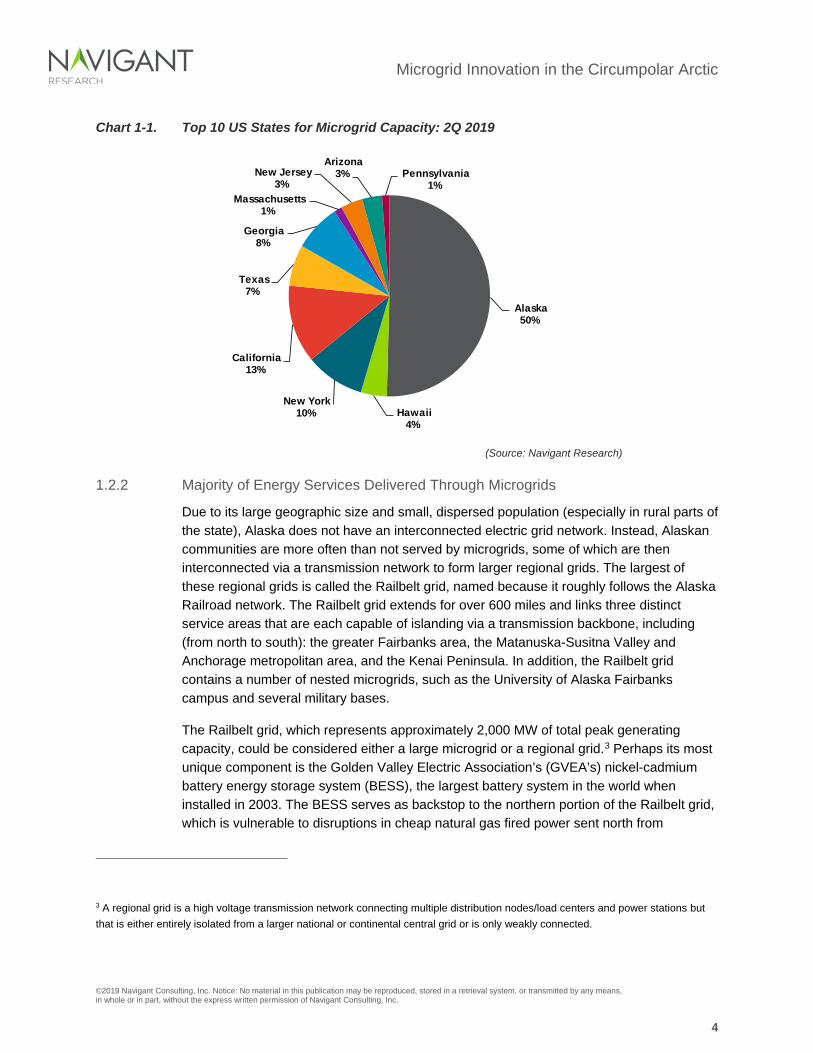
Alaska has long been a pioneer in deploying high penetration renewable energy microgrids.1 These microgrid systems—some in continual operation for close to two decades—built the business case for renewable energy integration well before the rest of the country, and the rest of the world, moved in this direction. When measured in terms of installed capacity, Alaska ranks No. 1 in the US as of 2Q 2019. Alaska also has one of the highest adoption rates of microgrids in the world. Development of this niche market was driven by high energy costs and relatively low subsidies compared to other similar remote microgrid markets. These twin factors create strong incentives to displace imported fuels that are both costly to deliver and tied to global energy markets that can significantly vary annually and interannually.2
A range of socioeconomic, institutional, public policy, and technical characteristics have encouraged experimentation and novel microgrid solutions, most notably a highly decentralized and deregulated energy market served largely by public utilities. This has resulted in many Alaskan communities taking a holistic approach to energy management frequently addressing thermal energy loads along with electricity. The know-how derived from Alaska’s experience is relevant to other markets, especially emerging economies where existing grid infrastructure is weak or nonexistent. Yet, the state also offers insight to industrialized nations where the focus has been on big grid solutions rather than more distributed, resilient energy solutions, such as microgrids.
1 A microgrid is a single controllable entity consisting of multiple DER and loads capable of operating in island mode whether connected to a traditional grid or operating as a standalone remote power system. 2 In 2008, imported diesel fuel prices for many Alaska utilities doubled within one calendar year. In addition to these potentially extreme annual fluctuations, much of the state has a narrow seasonal window where diesel fuel can be delivered via barge so it is vulnerable to short-term price changes. Exacerbating these issues, climate change is altering precipitation and glacial runoff patterns, which means that communities historically served by barged delivery of fuel now rely, at least occasionally, on fuel delivered by plane. As a result of these factors, the unpredictability of fuel prices is a major driver in the interest in renewables in rural Alaskan communities.
Understanding how Alaska and other parts of the circumpolar Arctic have incorporated microgrids to integrate distributed energy resources (DER), improve grid resiliency, and lower overall energy costs offers important lessons for global energy markets.
Microgrid Innovation in the Circumpolar Arctic
©2019 Navigant Consulting, Inc. Notice: No material in this publication may be reproduced, stored in a retrieval system, or transmitted by any means, in whole or in part, without the express written permission of Navigant Consulting, Inc.
4
Chart 1-1. Top 10 US States for Microgrid Capacity: 2Q 2019
(Source: Navigant Research)
1.2.2 Majority of Energy Services Delivered Through Microgrids
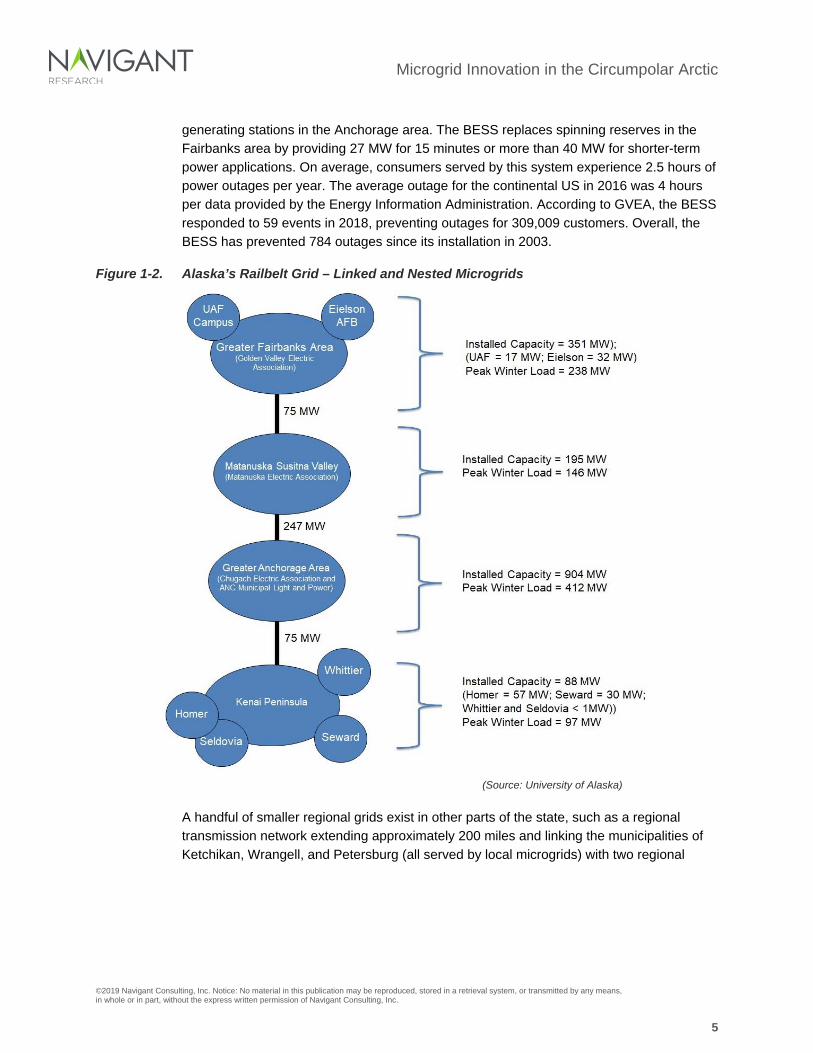
Due to its large geographic size and small, dispersed population (especially in rural parts of the state), Alaska does not have an interconnected electric grid network. Instead, Alaskan communities are more often than not served by microgrids, some of which are then interconnected via a transmission network to form larger regional grids. The largest of these regional grids is called the Railbelt grid, named because it roughly follows the Alaska Railroad network. The Railbelt grid extends for over 600 miles and links three distinct service areas that are each capable of islanding via a transmission backbone, including (from north to south): the greater Fairbanks area, the Matanuska-Susitna Valley and Anchorage metropolitan area, and the Kenai Peninsula. In addition, the Railbelt grid contains a number of nested microgrids, such as the University of Alaska Fairbanks campus and several military bases.
The Railbelt grid, which represents approximately 2,000 MW of total peak generating capacity, could be considered either a large microgrid or a regional grid.3 Perhaps its most unique component is the Golden Valley Electric Association’s (GVEA’s) nickel-cadmium battery energy storage system (BESS), the largest battery system in the world when installed in 2003. The BESS serves as backstop to the northern portion of the Railbelt grid, which is vulnerable to disruptions in cheap natural gas fired power sent north from
3 A regional grid is a high voltage transmission network connecting multiple distribution nodes/load centers and power stations but that is either entirely isolated from a larger national or continental central grid or is only weakly connected.
Alaska 50%
Hawaii 4%
New York 10%
California 13%
Texas 7%
Georgia 8%
Massachusetts 1%
New Jersey 3%
Arizona 3% Pennsylvania
1%
Microgrid Innovation in the Circumpolar Arctic
©2019 Navigant Consulting, Inc. Notice: No material in this publication may be reproduced, stored in a retrieval system, or transmitted by any means, in whole or in part, without the express written permission of Navigant Consulting, Inc.
5
generating stations in the Anchorage area. The BESS replaces spinning reserves in the Fairbanks area by providing 27 MW for 15 minutes or more than 40 MW for shorter-term power applications. On average, consumers served by this system experience 2.5 hours of power outages per year. The average outage for the continental US in 2016 was 4 hours per data provided by the Energy Information Administration. According to GVEA, the BESS responded to 59 events in 2018, preventing outages for 309,009 customers. Overall, the BESS has prevented 784 outages since its installation in 2003.
Figure 1-2. Alaska’s Railbelt Grid – Linked and Nested Microgrids
(Source: University of Alaska)
A handful of smaller regional grids exist in other parts of the state, such as a regional transmission network extending approximately 200 miles and linking the municipalities of Ketchikan, Wrangell, and Petersburg (all served by local microgrids) with two regional
Microgrid Innovation in the Circumpolar Arctic
©2019 Navigant Consulting, Inc. Notice: No material in this publication may be reproduced, stored in a retrieval system, or transmitted by any means, in whole or in part, without the express written permission of Navigant Consulting, Inc.
6
hydroelectric projects.4 This grid, operated by the Southeast Alaska Power Authority (SEAPA), is not connected to other transmission networks in Alaska or the North American Transmission Grid. The rest of Alaska, which includes communities ranging from as few as a dozen residents to towns with populations exceeding 10,000, is not connected to a traditional power grid.5 Instead, all power is generated locally with a predominant reliance on diesel generation, except in locales where hydropower is available. Microgrids are and have been the status quo in what continues to be in many ways a frontier economy revolving around commodities that include oil and natural gas development, commercial fishing, mining, and other extractive industries.
The degree to which Alaska has invested in renewable energy and the ubiquitous nature of market adoption particularly for these remote microgrids offers important lessons for the developing world. Given the reliance on diesel electric generation and high associated costs that can exceed $1/kWh in some communities, there are strong economic incentives to integrate renewable energy.6 Renewable energy is further incentivized by a highly deregulated utility market with dozens of utilities, state investment in infrastructure in the past, and modest subsidies that create niche markets where renewable energy projects are cost-competitive. Alaska’s small and relatively constant population also translates into a market focused on serving existing customers. Innovation has been incremental but steady, moving from basic isolated diesel systems to incorporating DER at increasing levels fueled by a continuous improvement ethos that leans toward a greater and greater uptake of renewable energy resources.
1.2.3 Microgrids Shifting Toward Renewable Energy to Reduce Costs
Alaska boasts an inventory of energy resources greater than any other US state, including both renewable and non-renewable resources.7 The challenge in developing these resources is the inability to create economies of scale through investments in large, centralized projects.8 Developed oil, gas, and coal resources are limited to specific geographic areas of the state. In more remote areas that do not have access to locally
4 The transmission network and hydropower assets are owned and operated by the Southeast Alaska Power Agency (SEAPA). Each community has its own local generation as well and can island from the SEAPA grid. 5 There are several US Department of Defense assets and remote industrial sites, mainly mines, scattered across the state that also rely on local microgrids for power. 6 Delivered costs for electricity, including fuel and non-fuel costs and retail prices for oil & gas, can be accessed for each community in Alaska at the Alaska Energy Data Gateway: akenergygateway.alaska.edu 7 This includes substantial undeveloped oil and gas resources, 50% of the US coal reserves, and 90% of the US tidal energy potential. Other resources include geothermal, wind, solar, and biomass. All of these have been developed to varying degrees in the state. 8 Where these opportunities exist, such as the Kenai Peninsula and Anchorage area, which relies primarily on hydropower and local natural gas for power generation, energy price structures are similar to other rural areas of the US. The Railbelt grid was largely developed to wheel this relatively inexpensive power north to markets in the Matanuska-Susitna Valley and Fairbanks.
Microgrid Innovation in the Circumpolar Arctic
©2019 Navigant Consulting, Inc. Notice: No material in this publication may be reproduced, stored in a retrieval system, or transmitted by any means, in whole or in part, without the express written permission of Navigant Consulting, Inc.
7
sourced fossil fuels, fuel for heating and electric power generation is most frequently transported via barges over long distances. This fuel is often sourced from outside the state, and barge transport is usually limited to a narrow window of ice-free operation. This results in high delivery and storage costs, exacerbated by the expense of installing and maintaining fuel storage tank farms for each community sized to store an entire year’s fuel supply. In addition, Alaska uses more primary energy on a per capita basis than any other state in the country. This high usage is due in part to the cold climate coupled with a high prevalence of energy intensive extractive industries that make up the backbone of its economy, particularly crude oil extraction and export. These factors make many locally available renewable resources cost-competitive in Alaska.
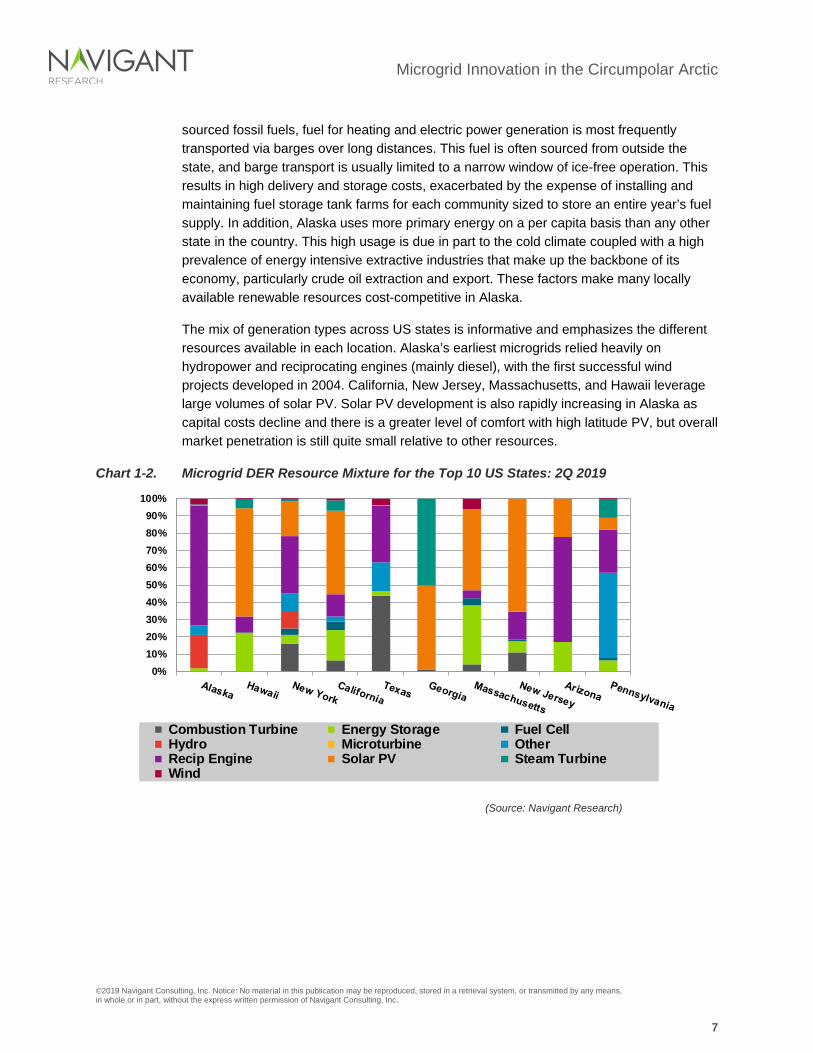
The mix of generation types across US states is informative and emphasizes the different resources available in each location. Alaska’s earliest microgrids relied heavily on hydropower and reciprocating engines (mainly diesel), with the first successful wind projects developed in 2004. California, New Jersey, Massachusetts, and Hawaii leverage large volumes of solar PV. Solar PV development is also rapidly increasing in Alaska as capital costs decline and there is a greater level of comfort with high latitude PV, but overall market penetration is still quite small relative to other resources.
Chart 1-2. Microgrid DER Resource Mixture for the Top 10 US States: 2Q 2019
(Source: Navigant Research)
0%10%20%30%40%50%60%70%80%90%
100%
Combustion Turbine Energy Storage Fuel Cell Hydro Microturbine Other Recip Engine Solar PV Steam Turbine Wind
Microgrid Innovation in the Circumpolar Arctic
©2019 Navigant Consulting, Inc. Notice: No material in this publication may be reproduced, stored in a retrieval system, or transmitted by any means, in whole or in part, without the express written permission of Navigant Consulting, Inc.
8
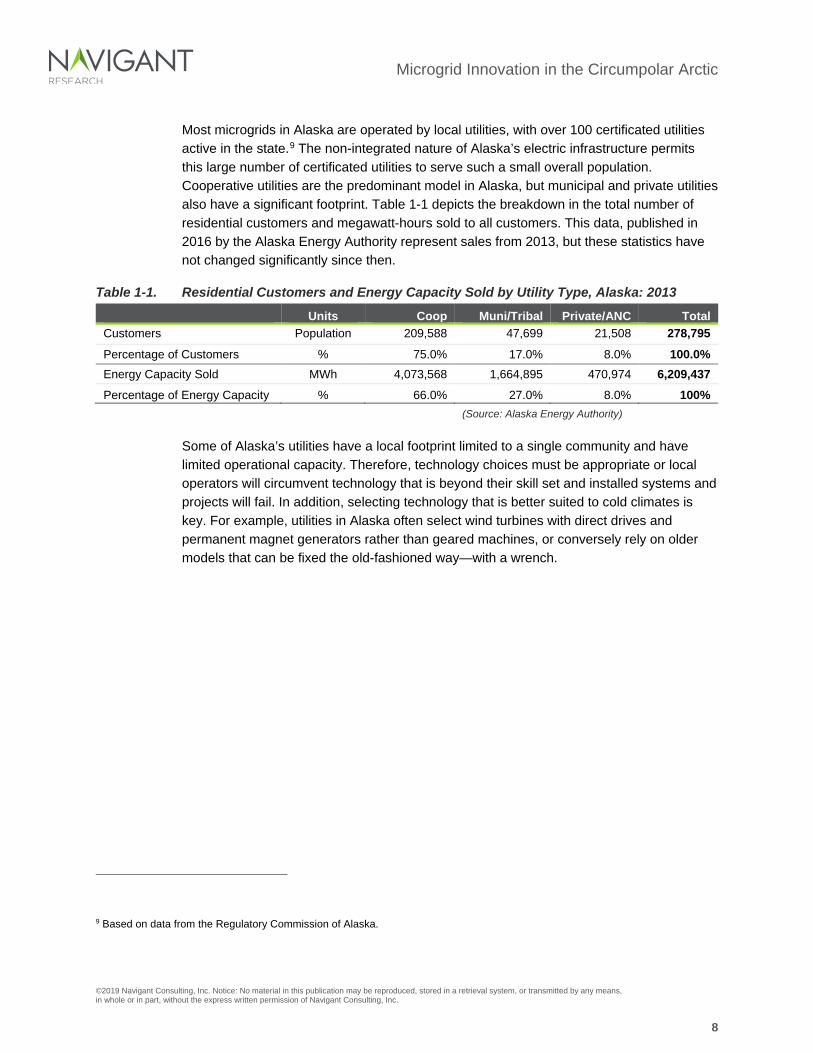
Most microgrids in Alaska are operated by local utilities, with over 100 certificated utilities active in the state.9 The non-integrated nature of Alaska’s electric infrastructure permits this large number of certificated utilities to serve such a small overall population. Cooperative utilities are the predominant model in Alaska, but municipal and private utilities also have a significant footprint. Table 1-1 depicts the breakdown in the total number of residential customers and megawatt-hours sold to all customers. This data, published in 2016 by the Alaska Energy Authority represent sales from 2013, but these statistics have not changed significantly since then.
Table 1-1. Residential Customers and Energy Capacity Sold by Utility Type, Alaska: 2013
Units Coop Muni/Tribal Private/ANC Total Customers Population 209,588 47,699 21,508 278,795 Percentage of Customers % 75.0% 17.0% 8.0% 100.0% Energy Capacity Sold MWh 4,073,568 1,664,895 470,974 6,209,437 Percentage of Energy Capacity % 66.0% 27.0% 8.0% 100%
(Source: Alaska Energy Authority)
Some of Alaska’s utilities have a local footprint limited to a single community and have limited operational capacity. Therefore, technology choices must be appropriate or local operators will circumvent technology that is beyond their skill set and installed systems and projects will fail. In addition, selecting technology that is better suited to cold climates is key. For example, utilities in Alaska often select wind turbines with direct drives and permanent magnet generators rather than geared machines, or conversely rely on older models that can be fixed the old-fashioned way—with a wrench.
9 Based on data from the Regulatory Commission of Alaska.
Microgrid Innovation in the Circumpolar Arctic
©2019 Navigant Consulting, Inc. Notice: No material in this publication may be reproduced, stored in a retrieval system, or transmitted by any means, in whole or in part, without the express written permission of Navigant Consulting, Inc.
9
Section 2 WHAT DOES THE CIRCUMPOLAR MICROGRID PORTFOLIO LOOK LIKE?
2.1 Factors Driving Renewable Energy Growth in the Circumpolar Arctic
Alaska is not alone when it comes to microgrid innovation in the Far North. Vast portions of the circumpolar Arctic have remote areas with low population density, minimal or no transmission infrastructure, and limited or seasonal accessibility. They also have high local energy demand driven by an environment where cold and darkness reign over a significant part of the year. Therefore, the need for creative solutions to provide reliable access to energy services and reduce operational costs has risen independently in many locations. Incorporating renewable energy in some of the harshest and most remote areas on Earth has tested the limitations of technology. Renewable energy has supported the fundamental infrastructure necessary for economic growth and the ability for towns to provide basic services such as public safety and health, lighting, and—most important of all—heat.
While the Nordic countries tend to rely on more centralized generation and almost complete interconnection with the greater European grid network, these four countries feature a high dependence on smaller, local microgrids. This is largely due to low population density across a large geographic expanse. An exception to this generalization about Europe is the Faroe Islands, which are part of Denmark and are positioned at the remote boundary of the Norwegian Sea and North Atlantic Ocean. The Faroe Islands’ remote microgrid development mirrors the development in the circumpolar Arctic. The 18 islands are inhabited by roughly 49,000 people and rely on the fishery industry for economic survival. The total peak capacity for the islands is 45 MW, of which over 25% is supplied by wind power, spiking to up to 80% of total demand during periods of high resource availability. Each island can be considered a remote microgrid.
In addition to remote microgrids, regional grids like Alaska’s Railbelt grid are common throughout the Arctic and often have a high proportion of renewable generation (usually hydropower) incorporated into their generation portfolio. The opportunity to exploit large-scale renewable energy resources often serves as the anchor for regional grid development, connecting these resources to urban centers or export-centered resource extraction (mining, oil & gas development) activities. Iceland is the prime example of a renewably powered regional grid. Iceland’s Landsnet Transmission grid incorporates
The US (Alaska), Canada, Greenland, and Russia share a heritage of decentralized innovation and investment in renewable energy under different political and market structures.
Microgrid Innovation in the Circumpolar Arctic
©2019 Navigant Consulting, Inc. Notice: No material in this publication may be reproduced, stored in a retrieval system, or transmitted by any means, in whole or in part, without the express written permission of Navigant Consulting, Inc.
10
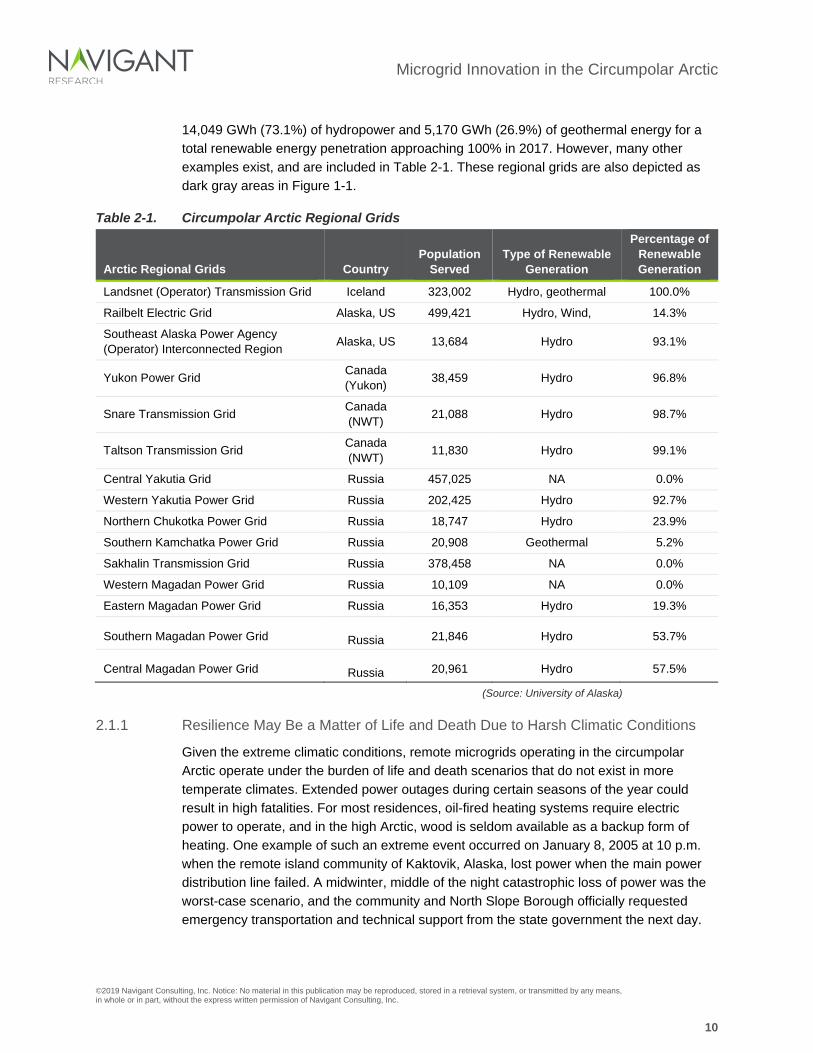
14,049 GWh (73.1%) of hydropower and 5,170 GWh (26.9%) of geothermal energy for a total renewable energy penetration approaching 100% in 2017. However, many other examples exist, and are included in Table 2-1. These regional grids are also depicted as dark gray areas in Figure 1-1.
Table 2-1. Circumpolar Arctic Regional Grids
Arctic Regional Grids Country Population
Served Type of Renewable
Generation
Percentage of Renewable Generation
Landsnet (Operator) Transmission Grid Iceland 323,002 Hydro, geothermal 100.0%
Railbelt Electric Grid Alaska, US 499,421 Hydro, Wind, 14.3%
Southeast Alaska Power Agency (Operator) Interconnected Region Alaska, US 13,684 Hydro 93.1%
Yukon Power Grid Canada (Yukon) 38,459 Hydro 96.8%
Snare Transmission Grid Canada (NWT) 21,088 Hydro 98.7%
Taltson Transmission Grid Canada (NWT) 11,830 Hydro 99.1%
Central Yakutia Grid Russia 457,025 NA 0.0%
Western Yakutia Power Grid Russia 202,425 Hydro 92.7%
Northern Chukotka Power Grid Russia 18,747 Hydro 23.9%
Southern Kamchatka Power Grid Russia 20,908 Geothermal 5.2%
Sakhalin Transmission Grid Russia 378,458 NA 0.0%
Western Magadan Power Grid Russia 10,109 NA 0.0%
Eastern Magadan Power Grid Russia 16,353 Hydro 19.3%
Southern Magadan Power Grid Russia 21,846 Hydro 53.7%
Central Magadan Power Grid Russia 20,961 Hydro 57.5%
(Source: University of Alaska)
2.1.1 Resilience May Be a Matter of Life and Death Due to Harsh Climatic Conditions
Given the extreme climatic conditions, remote microgrids operating in the circumpolar Arctic operate under the burden of life and death scenarios that do not exist in more temperate climates. Extended power outages during certain seasons of the year could result in high fatalities. For most residences, oil-fired heating systems require electric power to operate, and in the high Arctic, wood is seldom available as a backup form of heating. One example of such an extreme event occurred on January 8, 2005 at 10 p.m. when the remote island community of Kaktovik, Alaska, lost power when the main power distribution line failed. A midwinter, middle of the night catastrophic loss of power was the worst-case scenario, and the community and North Slope Borough officially requested emergency transportation and technical support from the state government the next day.
Microgrid Innovation in the Circumpolar Arctic
©2019 Navigant Consulting, Inc. Notice: No material in this publication may be reproduced, stored in a retrieval system, or transmitted by any means, in whole or in part, without the express written permission of Navigant Consulting, Inc.
11
An emergency shelter was established for 65 of the village’s 300 residents. During the outage, which lasted 5 days, airport runway lights, water, and sewer infrastructure went without electrical power while winds reached 80 mph and wind chill dropped to -70°F. As a result the town’s new $28 million sewer and water system froze solid, damaging pipes and other infrastructure. No one died due to the cold, as some emergency backup generators provided warmth at the emergency shelters. That these stories are relatively rare in Alaska is a testament to the value of microgrids in providing resilient (and usually reliable) power solutions.
To address vulnerabilities associated with distribution line failure similar to what happened in Kaktovik, Alaska, other communities that experience severe weather conditions chose to bury electric distribution lines entirely. In 2012, the town of Cordova in South Central Alaska made national news when it experienced 22 consecutive days of snowfall, with accumulations exceeding 18 feet; However, there were no disruptions to electric power services as a result of this extreme event since the local electric cooperative had invested in burying its entire distribution system.
2.1.2 Deregulated and Regulated Markets Both Support Microgrid Development
The diversity in the sociopolitical and economic structures of nations within the circumpolar Arctic showcases how different governments can support microgrid development. Each country supports renewable energy development, but in varying ways and to varying degrees based on local and regional politics and drivers. Whether governments lean toward decentralized and deregulated utilities such as those operating in Alaska or are governed by a more centralized and top-down ownership paradigm such as in Canada, Greenland, or Russia, microgrid markets can grow and flourish. It seems the structures of government are less important than more fundamental drivers such as the costs associated with the status quo (often diesel-based generation), the degree and format of available public funding, access to appropriate technology, and the overall evolution of global microgrid trends on controls, integrating thermal energy demand to increase potential renewable penetration and improve project economics, and system designs appropriate to cold climate operation.
2.1.2.1 Policies and Programs Supporting Distributed Energy Resources and Microgrid Development in Alaska
Policies and programs supporting renewable energy development in remote areas differs significantly across the Arctic. For remote communities, only Greenland has an established (and aggressive) target for renewable energy development. Canada has recently committed significant funding for developing clean energy infrastructure in its territories. Alaska, the most mature market for microgrid development has made much of this progress despite a lack of clear supporting policies, such as a renewable portfolio standard or other statewide target for renewable development. Instead, many communities and utilities have voluntarily established their own targets, some with ambitious goals. For example, Kodiak has established a goal of 95% renewable energy by 2020, which it has
Microgrid Innovation in the Circumpolar Arctic
©2019 Navigant Consulting, Inc. Notice: No material in this publication may be reproduced, stored in a retrieval system, or transmitted by any means, in whole or in part, without the express written permission of Navigant Consulting, Inc.
12
already managed to exceed. These targets are largely driven by economic factors (primarily the cost of imported diesel fuel), although environmental concerns including emissions and fuel spills in sensitive ecological environments also play a role.
For utilities and communities without access to a baseload renewable resource such as hydropower, achieving high contribution levels of renewables is more difficult, and more modest targets reflect this challenge. For example, the Alaska Village Electric Cooperative (AVEC), which serves 58 small isolated rural communities across Alaska, has a stated target of displacing 25% of diesel fuel through a combination of energy efficiency, heat recovery, and renewable energy development by 2025. They have exceeded this goal for individual communities through wind power integration, achieving 100% instantaneous penetration and above 30% annual displacement in some communities. AVEC manages 48 powerhouses with an average load of 250 kW. To date, wind turbines have saved these communities $9.7 million in fuel expenses since 2006.10
While policy has not played a major role in Alaska, state funding programs have. Many of the remote microgrids in Alaska have received grant funding through Alaska’s Renewable Energy Fund (REF). From 2008 to 2018, appropriations totaling $268 million were issued for REF projects, ranging from wind, solar, and hydropower to biomass heating and heat recovery projects. According to the Alaska Energy Authority, the fund manager, the present value of the capital expenditures used to build the 81 projects that were operational by the end of calendar year 2017 is $583 million and the present value of benefits from those projects is $1.475 billion.
While the REF fund was instrumental in kick-starting renewable energy development associated with microgrids in Alaska, as the costs of wind, solar, and batteries remain in a downward trajectory, projects continue to be developed despite a significant decrease in state investment in recent years. In 2016 and 2017, there were no state REF appropriations; nonetheless several new projects are under construction through other sources of public or private funding. As technology costs continue to decline over the long term, and if Alaska microgrids are upgraded in an intelligent way with a continued focus on appropriate technology, the market will continue to flourish.
Alaska also has invested in emerging technologies including low temperature geothermal, seawater, and ground-source heat pumps, biomass combined heat and power, river hydrokinetics, and landfill-derived natural gas. The state has even experimented with fish oil as a replacement for boiler fuel. Many of these emerging technology projects were funded through the Alaska Emerging Energy Technology Fund, established in 2010, to complement the REF program. The Alaska Center for Energy and Power, based at the University of Alaska Fairbanks, has also played a key role in vetting and testing new
10 Based on unpublished data and information provided by the Alaska Village Electric Cooperative to report authors.
Microgrid Innovation in the Circumpolar Arctic
©2019 Navigant Consulting, Inc. Notice: No material in this publication may be reproduced, stored in a retrieval system, or transmitted by any means, in whole or in part, without the express written permission of Navigant Consulting, Inc.
13
energy technologies, and hardening systems in its Energy Technology Laboratory prior to field deployment.11
Antarctica is the least populated area on the planet, but the circumpolar Arctic is leading the way in microgrid development out of necessity. While each of the approximately 1,500 remote communities in the circumpolar Arctic region is served by a local generation and distribution system, usually reliant on diesel generation for prime power, not all are microgrids tracked by Navigant Research. Navigant Research limits microgrids in its tracker to systems that incorporate at least one renewable resource, or include a combined heat and power (CHP) system or an energy storage device. Pure diesel systems are excluded. By this metric, the number of microgrids is a small subset of the total number of off-grid communities in the circumpolar Arctic. Nonetheless they are significant in terms of global development, continually growing in number, and resource and use case complexity. With few exceptions, such as Svalbard, Norway, Nordic countries do not have microgrids and are not included in this breakdown.
2.1.3 Regional Breakdown by Country
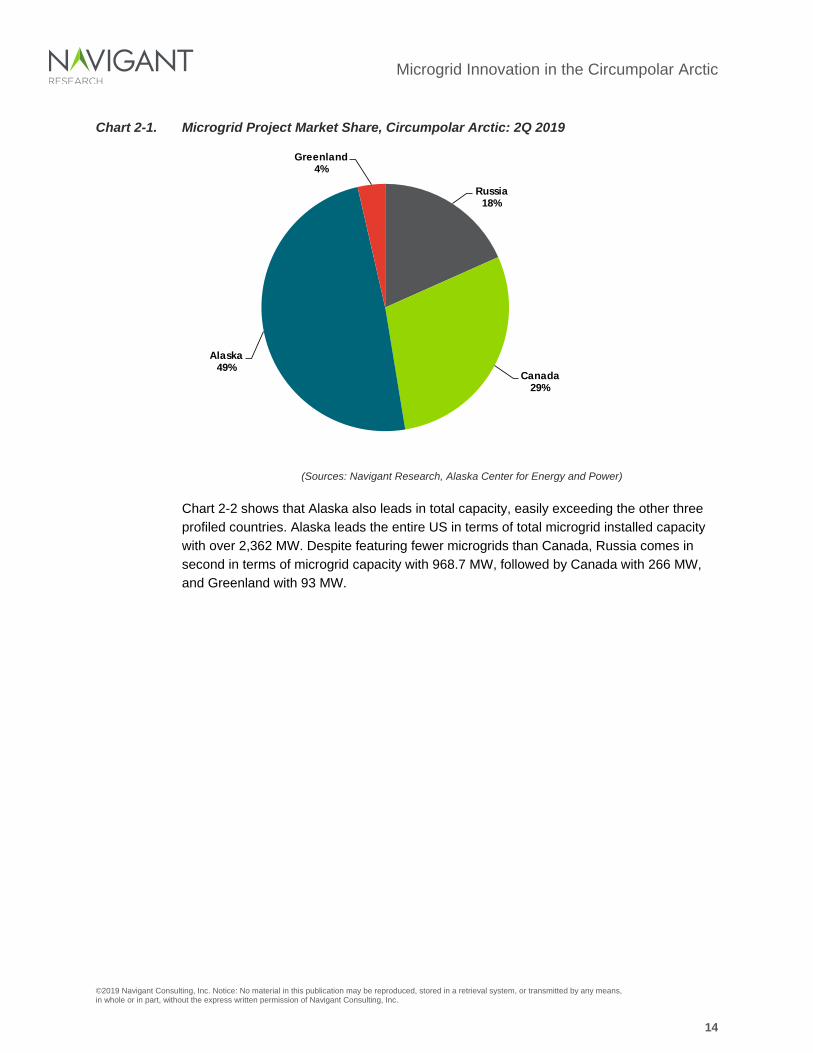
Navigant Research counted microgrids in terms of their absolute number as well as total installed capacity. This is because a small system achieving close to 100% penetration of variable resources is as innovative or even more so than some much larger systems with a large overall installed capacity but lower renewable energy penetration. So, the number of systems installed in a market does matter. As Chart 2-1 illustrates, Alaska boasts by far the largest number of qualifying microgrids, representing roughly half of microgrids deployed in the circumpolar Arctic with 122, followed by Canada with 73, Russia with 46, and Greenland with nine.
11 This lab can recreate a 500 kW microgrid at full power levels and includes a variety of capabilities such as fault testing.
Microgrid Innovation in the Circumpolar Arctic
©2019 Navigant Consulting, Inc. Notice: No material in this publication may be reproduced, stored in a retrieval system, or transmitted by any means, in whole or in part, without the express written permission of Navigant Consulting, Inc.
14
Chart 2-1. Microgrid Project Market Share, Circumpolar Arctic: 2Q 2019
(Sources: Navigant Research, Alaska Center for Energy and Power)
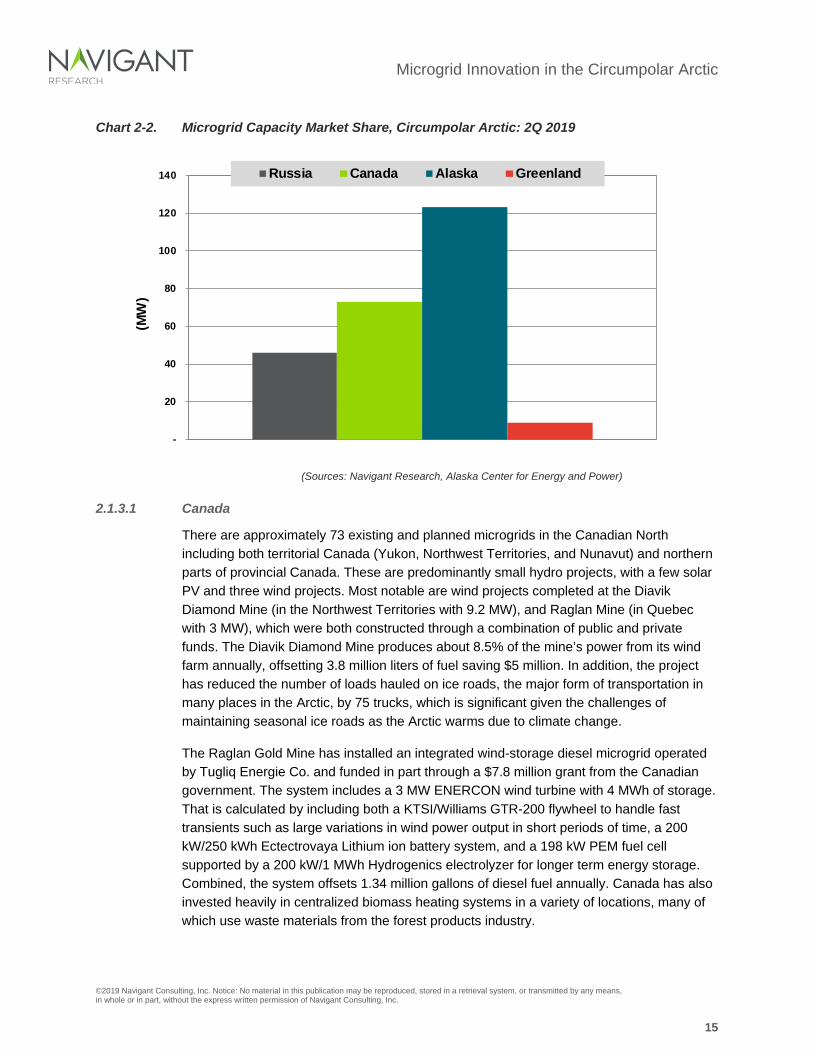
Chart 2-2 shows that Alaska also leads in total capacity, easily exceeding the other three profiled countries. Alaska leads the entire US in terms of total microgrid installed capacity with over 2,362 MW. Despite featuring fewer microgrids than Canada, Russia comes in second in terms of microgrid capacity with 968.7 MW, followed by Canada with 266 MW, and Greenland with 93 MW.
Russia18%
Canada29%
Alaska49%
Greenland 4%
Microgrid Innovation in the Circumpolar Arctic
©2019 Navigant Consulting, Inc. Notice: No material in this publication may be reproduced, stored in a retrieval system, or transmitted by any means, in whole or in part, without the express written permission of Navigant Consulting, Inc.
15
Chart 2-2. Microgrid Capacity Market Share, Circumpolar Arctic: 2Q 2019
(Sources: Navigant Research, Alaska Center for Energy and Power)
2.1.3.1 Canada
There are approximately 73 existing and planned microgrids in the Canadian North including both territorial Canada (Yukon, Northwest Territories, and Nunavut) and northern parts of provincial Canada. These are predominantly small hydro projects, with a few solar PV and three wind projects. Most notable are wind projects completed at the Diavik Diamond Mine (in the Northwest Territories with 9.2 MW), and Raglan Mine (in Quebec with 3 MW), which were both constructed through a combination of public and private funds. The Diavik Diamond Mine produces about 8.5% of the mine’s power from its wind farm annually, offsetting 3.8 million liters of fuel saving $5 million. In addition, the project has reduced the number of loads hauled on ice roads, the major form of transportation in many places in the Arctic, by 75 trucks, which is significant given the challenges of maintaining seasonal ice roads as the Arctic warms due to climate change.
The Raglan Gold Mine has installed an integrated wind-storage diesel microgrid operated by Tugliq Energie Co. and funded in part through a $7.8 million grant from the Canadian government. The system includes a 3 MW ENERCON wind turbine with 4 MWh of storage. That is calculated by including both a KTSI/Williams GTR-200 flywheel to handle fast transients such as large variations in wind power output in short periods of time, a 200 kW/250 kWh Ectectrovaya Lithium ion battery system, and a 198 kW PEM fuel cell supported by a 200 kW/1 MWh Hydrogenics electrolyzer for longer term energy storage. Combined, the system offsets 1.34 million gallons of diesel fuel annually. Canada has also invested heavily in centralized biomass heating systems in a variety of locations, many of which use waste materials from the forest products industry.
-
20
40
60
80
100
120
140
(MW
)
Russia Canada Alaska Greenland
Microgrid Innovation in the Circumpolar Arctic
©2019 Navigant Consulting, Inc. Notice: No material in this publication may be reproduced, stored in a retrieval system, or transmitted by any means, in whole or in part, without the express written permission of Navigant Consulting, Inc.
16
2.1.3.2 Russia
Approximately 46 microgrids have been developed or are planned in the Russian Arctic, including ambitious future plans to double the number of projects and increase installed capacity by as much as tenfold by 2029.12 The Russian Far East in particular has been leading this development. This region has some of the most extreme logistical challenges of anywhere on Earth and with a large number of small, isolated communities scattered across a vast territory. According to the utility serving the region, RAO Energy Systems of the East, it can take an entire year to deliver fuel to some locations. It is transported via a combination of summer barge transport along river systems, and then storing the fuel to wait for the ground to freeze in order to deliver the fuel to the community via ice road. With government-fixed upper limits on residential tariffs and pressure to deliver affordable power to anchor industrial clients to discourage self-generation, the utility had incentives to reduce the amount of fuel needed to deliver electric services, particularly in remote areas where delivery costs are the highest.
The Sakha Republic has seen a particularly high level of development since 2014, with a strong preference for solar energy. The Batagay solar project, with an installed capacity of 1 MW, was developed by the local utility company RAO Energy Systems of the East in 2017, in partnership with a French energy services company. This project may seem modest by international standards, but is the largest solar project located north of the Arctic Circle and represents an overall trend in increasing solar installations in the north.
Wind energy is also increasing in capacity in Russia despite early setbacks from pilot project failures. Successful projects are currently operating in Kamchatka, and in Murmanskaya Oblast. Many of these projects have been developed as a hedge against the expected phasing out of energy cross-subsidies for remote communities.13 Many larger communities benefit from CHP projects installed during the Soviet era. They usually use natural gas as a fuel source and are counted as microgrids by Navigant Research.
2.1.3.3 Greenland
Greenland, with about 56,000 residents, has over 60 remote settlements with 50-plus residents. The country produces 70% of its electric power from renewable energy, mainly from five large hydroelectric projects serving the largest metropolitan areas in the country. The areas served include Nuuk (with 45 MW from the Bukesfjord hydroelectric plant), Susimiut (with 15 MW), and Ilulissat (with 22.5 MW). The country has a goal of generating
12 Recent changes to Russia’s policy related to energy subsidies for the Far East could decrease the economic incentives to construct these planned projects. Note the Navigant Research Microgrid Deployment Tracker 2Q19 report generally includes all developed and planned projects, and the data presented here represents that protocol. 13 This trend may be ending as shifting energy policies for remote regions from Moscow is increasing subsidies to the Far East, reducing the economic incentive to invest in renewable energy.
Microgrid Innovation in the Circumpolar Arctic
©2019 Navigant Consulting, Inc. Notice: No material in this publication may be reproduced, stored in a retrieval system, or transmitted by any means, in whole or in part, without the express written permission of Navigant Consulting, Inc.
17
as close to 100% of electric power from renewable energy as possible by 2030.14 To achieve this ambitious goal, non-hydro sources of renewable energy. For this reason, the utility Nukissiorfiit launched a pilot project in Igaliku in 2017 that combines experimental horizontal axis wind turbines, a solar array, and a battery system with the existing diesel power plant. In 2018, Nukissiorfiit installed two wind turbines in Sisimiut (2 MW) and a smaller 25 kW system in Atammik. In addition, Greenland has experimented with several waste incineration projects that supply heat to supplement local district heating systems.
2.1.3.4 Alaska, US
Alaska has 122 total microgrids, including many remote systems as well as nested and interconnected microgrids. Microgrids are the underlying paradigm for how Alaska’s electric power infrastructure has been developed and built out. At the time of statehood in 1959, all power in Alaska was produced locally and hydropower was the predominant renewable resource used. Alaska has 45 operating hydroelectric projects scattered mainly across southeast and southcentral parts of the state. In the early 2000s, communities began to experiment with wind power. Kotzebue is one of the most notable locations because it installed the first utility-scale wind project in Alaska over two decades ago. The tiny community of Wales, which may have been home to the first diesel-off wind system operating anywhere in the world is also worth noting.15
Wind energy has been a major focus of investment over the past decade, and there are 27 independent wind projects in the state. Of these projects, 15 are operated by the AVEC, making this small utility one of the largest operators of individual wind farms in the US. These wind farms are spread across a geographic area roughly equivalent to the entire Midwest. Alaska also has been investing in biomass projects though mostly for heat and not power. 14 commercial scale wood heating systems are operational and reducing heating costs in Alaskan communities with 11 more systems planned or under construction. Solar is growing quickly, particularly in the high Arctic as well as on the Railbelt grid. Geothermal and hydrokinetic energy also have a modest footprint in the state. Overall, Alaska has chosen to develop whatever local resources exist. The high level of activity in the state is in part due to the high energy costs, just like the other countries profiled. But, Alaska’s market is somewhat different because of its highly decentralized energy market and modest subsidy structure. For these reasons, each utility is focused on a limited number of communities and thus development has occurred at a high rate in both big communities (where economies of scale are better), and small communities (where energy costs are highest).
14 Based on Greenland’s sector plan for energy and water supply: www.nukissiorfiit.gl/om-os/sektorplan-for-energi-og-vandforsyning 15 This project was designed by the National Renewable Energy Laboratory and ultimately was discontinued.
Microgrid Innovation in the Circumpolar Arctic
©2019 Navigant Consulting, Inc. Notice: No material in this publication may be reproduced, stored in a retrieval system, or transmitted by any means, in whole or in part, without the express written permission of Navigant Consulting, Inc.
18
2.1.4 DER Resource Mix for the Arctic Region
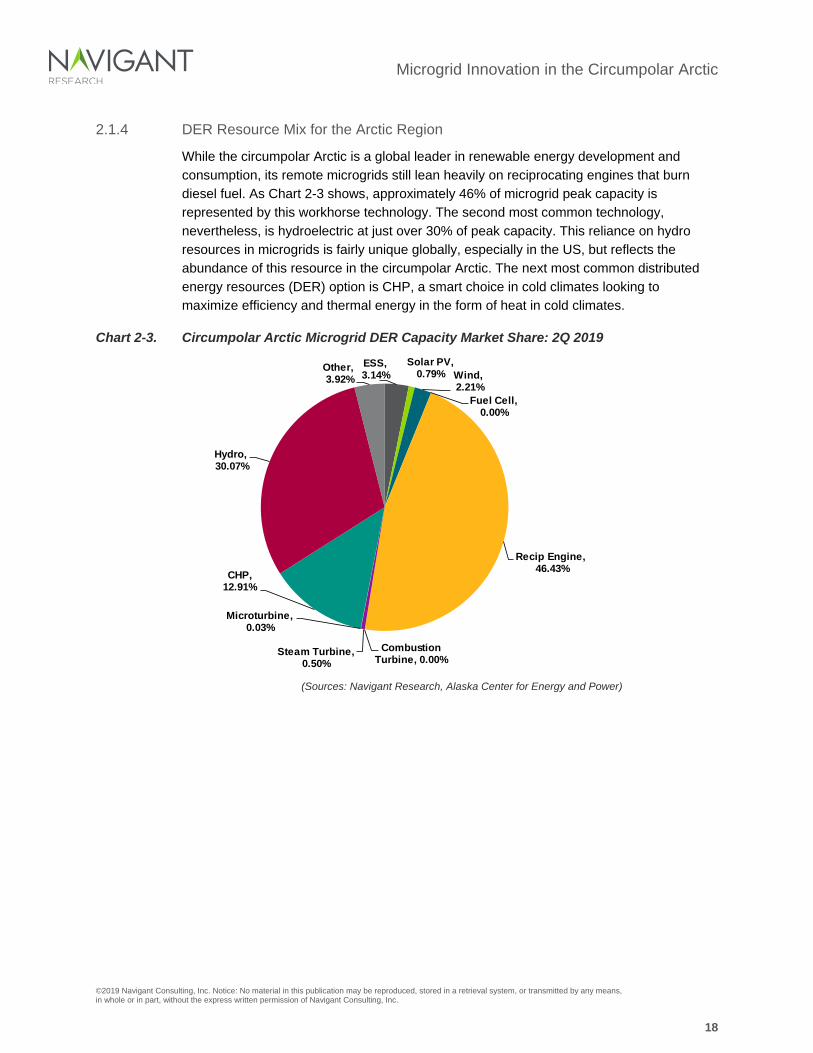
While the circumpolar Arctic is a global leader in renewable energy development and consumption, its remote microgrids still lean heavily on reciprocating engines that burn diesel fuel. As Chart 2-3 shows, approximately 46% of microgrid peak capacity is represented by this workhorse technology. The second most common technology, nevertheless, is hydroelectric at just over 30% of peak capacity. This reliance on hydro resources in microgrids is fairly unique globally, especially in the US, but reflects the abundance of this resource in the circumpolar Arctic. The next most common distributed energy resources (DER) option is CHP, a smart choice in cold climates looking to maximize efficiency and thermal energy in the form of heat in cold climates.
Chart 2-3. Circumpolar Arctic Microgrid DER Capacity Market Share: 2Q 2019
(Sources: Navigant Research, Alaska Center for Energy and Power)
ESS, 3.14%
Solar PV, 0.79% Wind,
2.21%Fuel Cell,
0.00%
Recip Engine,46.43%
Combustion Turbine, 0.00%
Steam Turbine, 0.50%
Microturbine, 0.03%
CHP,12.91%
Hydro,30.07%
Other,3.92%
Microgrid Innovation in the Circumpolar Arctic
©2019 Navigant Consulting, Inc. Notice: No material in this publication may be reproduced, stored in a retrieval system, or transmitted by any means, in whole or in part, without the express written permission of Navigant Consulting, Inc.
19
Section 3 THE CIRCUMPOLAR ARCTIC MICROGRID PORTFOLIO COMPARED TO THE REST OF THE WORLD
3.1 Global Microgrid Market Overview
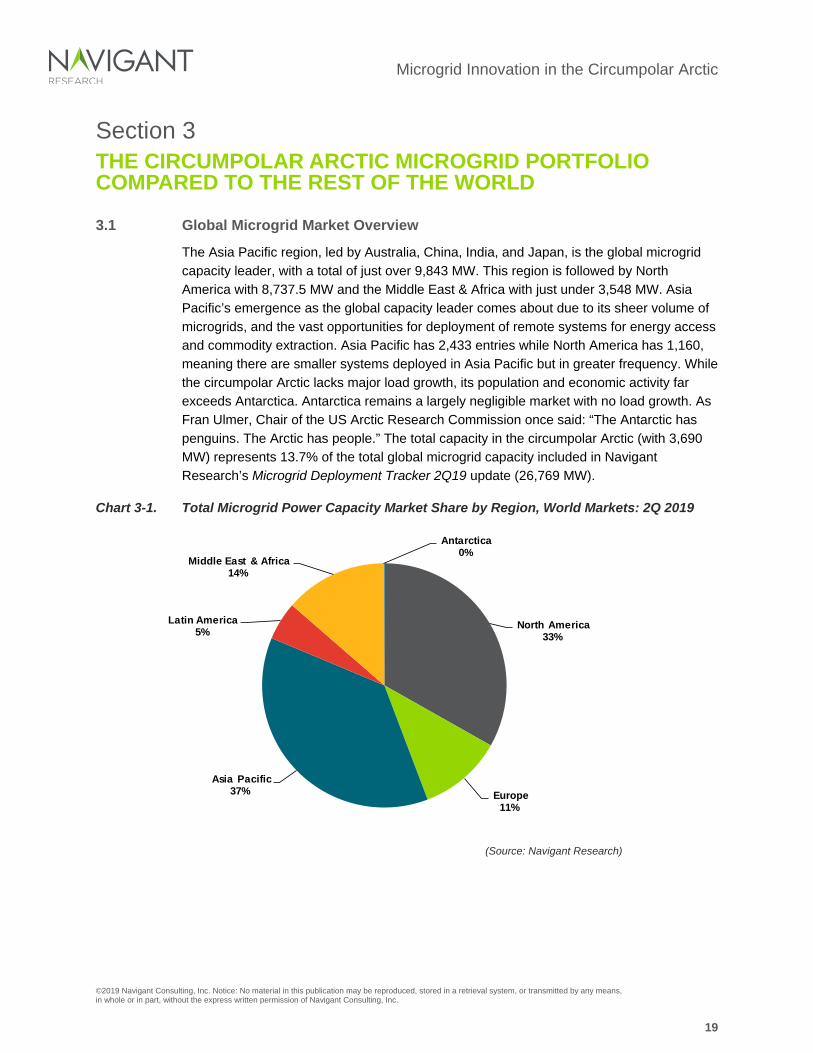
The Asia Pacific region, led by Australia, China, India, and Japan, is the global microgrid capacity leader, with a total of just over 9,843 MW. This region is followed by North America with 8,737.5 MW and the Middle East & Africa with just under 3,548 MW. Asia Pacific’s emergence as the global capacity leader comes about due to its sheer volume of microgrids, and the vast opportunities for deployment of remote systems for energy access and commodity extraction. Asia Pacific has 2,433 entries while North America has 1,160, meaning there are smaller systems deployed in Asia Pacific but in greater frequency. While the circumpolar Arctic lacks major load growth, its population and economic activity far exceeds Antarctica. Antarctica remains a largely negligible market with no load growth. As Fran Ulmer, Chair of the US Arctic Research Commission once said: “The Antarctic has penguins. The Arctic has people.” The total capacity in the circumpolar Arctic (with 3,690 MW) represents 13.7% of the total global microgrid capacity included in Navigant Research’s Microgrid Deployment Tracker 2Q19 update (26,769 MW).
Chart 3-1. Total Microgrid Power Capacity Market Share by Region, World Markets: 2Q 2019
(Source: Navigant Research)
North America 33%
Europe 11%
Asia Pacific 37%
Latin America 5%
Middle East & Africa 14%
Antarctica 0%
Microgrid Innovation in the Circumpolar Arctic
©2019 Navigant Consulting, Inc. Notice: No material in this publication may be reproduced, stored in a retrieval system, or transmitted by any means, in whole or in part, without the express written permission of Navigant Consulting, Inc.
20
3.1.1 Microgrid Market Segments
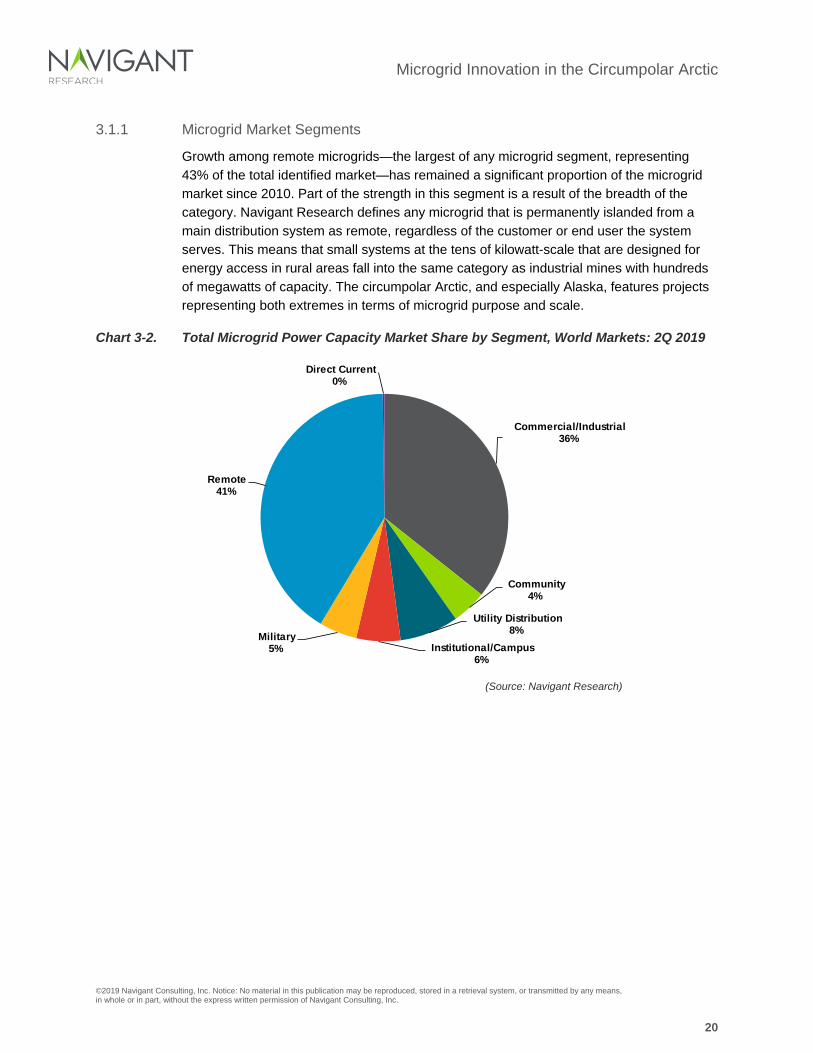
Growth among remote microgrids—the largest of any microgrid segment, representing 43% of the total identified market—has remained a significant proportion of the microgrid market since 2010. Part of the strength in this segment is a result of the breadth of the category. Navigant Research defines any microgrid that is permanently islanded from a main distribution system as remote, regardless of the customer or end user the system serves. This means that small systems at the tens of kilowatt-scale that are designed for energy access in rural areas fall into the same category as industrial mines with hundreds of megawatts of capacity. The circumpolar Arctic, and especially Alaska, features projects representing both extremes in terms of microgrid purpose and scale.
Chart 3-2. Total Microgrid Power Capacity Market Share by Segment, World Markets: 2Q 2019
(Source: Navigant Research)
Commercial/Industrial 36%
Community 4%
Utility Distribution 8%
Institutional/Campus 6%
Military 5%
Remote 41%
Direct Current 0%
Microgrid Innovation in the Circumpolar Arctic
©2019 Navigant Consulting, Inc. Notice: No material in this publication may be reproduced, stored in a retrieval system, or transmitted by any means, in whole or in part, without the express written permission of Navigant Consulting, Inc.
21
3.1.2 Remote Microgrid DER Characteristics
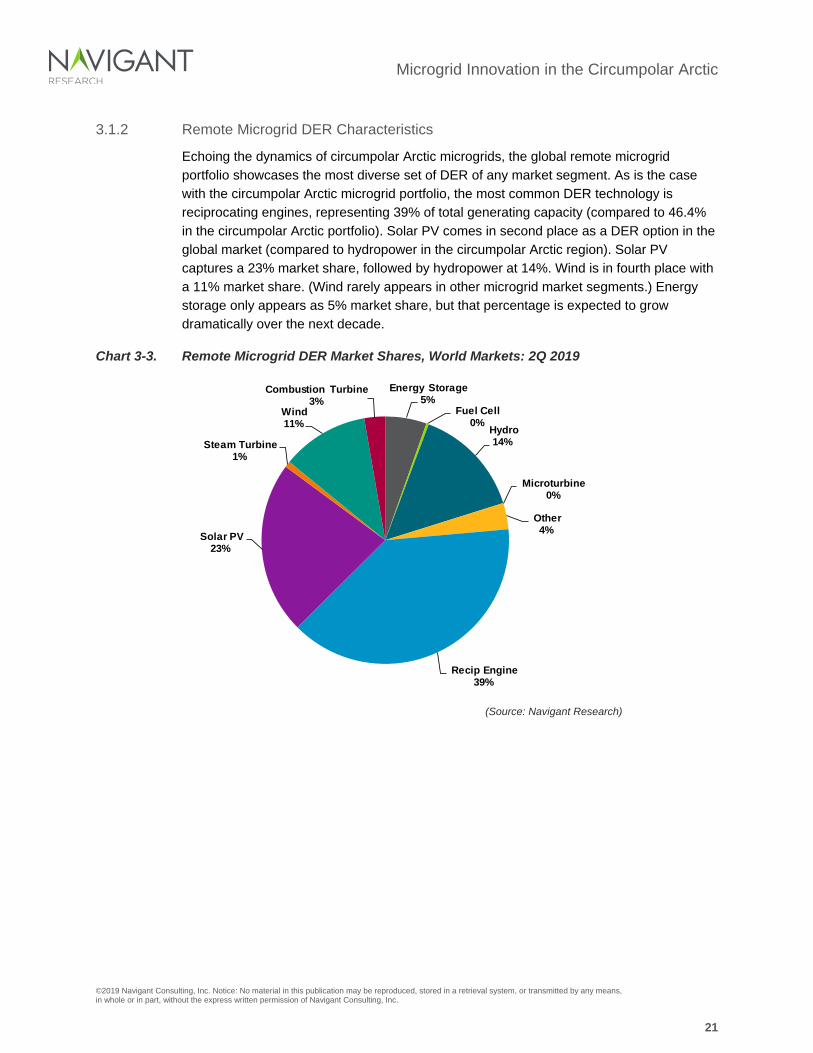
Echoing the dynamics of circumpolar Arctic microgrids, the global remote microgrid portfolio showcases the most diverse set of DER of any market segment. As is the case with the circumpolar Arctic microgrid portfolio, the most common DER technology is reciprocating engines, representing 39% of total generating capacity (compared to 46.4% in the circumpolar Arctic portfolio). Solar PV comes in second place as a DER option in the global market (compared to hydropower in the circumpolar Arctic region). Solar PV captures a 23% market share, followed by hydropower at 14%. Wind is in fourth place with a 11% market share. (Wind rarely appears in other microgrid market segments.) Energy storage only appears as 5% market share, but that percentage is expected to grow dramatically over the next decade.
Chart 3-3. Remote Microgrid DER Market Shares, World Markets: 2Q 2019
(Source: Navigant Research)
Energy Storage 5%
Fuel Cell 0% Hydro
14%
Microturbine 0%
Other 4%
Recip Engine 39%
Solar PV 23%
Steam Turbine 1%
Wind 11%
Combustion Turbine 3%
Microgrid Innovation in the Circumpolar Arctic
©2019 Navigant Consulting, Inc. Notice: No material in this publication may be reproduced, stored in a retrieval system, or transmitted by any means, in whole or in part, without the express written permission of Navigant Consulting, Inc.
22
Section 4 LESSONS LEARNED FROM ARCTIC REGION MICROGRIDS
4.1 Important Lessons Learned from Circumpolar Arctic Microgrids
What can other nations, utilities, project developers, and investors learn from microgrids that have been and are being deployed in some of the harshest environmental and economic conditions in the world? The following sections describe seven of the most important lessons learned culled primarily from Alaska, a global microgrid pioneer.
4.1.1 Robust and Simple Designs Work Best
Given the remoteness of sites, the lack of available onsite technical expertise, and the often harsh weather conditions, robust and simple microgrid designs have worked best. Ideally, routine maintenance can be managed by a trained local labor force, with external resources pulled in for more complex repairs. This means well thought out warranty plans and selecting established and well-capitalized vendors and products is important. An unproven technology from a startup company was often a major culprit in projects that have failed or underperformed.
Simple solutions do not necessarily discount cutting-edge solutions or advanced design concepts. In fact, many microgrid designs that have been successfully implemented in Alaska are elegant and represent holistic approaches to energy management. For example, Alaskans frequently employ thermal diversionary loads to increase load during times of peak availability. Microgrids offer many opportunities to reinvent the big grid paradigm. For example, rather than a centralized and hierarchal approach to resource management as has been used for big grids dependent on centralized baseload generation, some communities use a framework based on a distributed intelligence model to manage microgrids. There will still be a role for prime movers to set a reference for frequency or voltage, but the advances of grid-forming inverters and the ability to create virtual inertia within microgrids opens the door to future microgrids that embrace a 100% renewable energy supply.16
4.1.2 Modest Inclusion of Energy Storage Helps Keeps Costs Contained
Though the majority of microgrids coming online do include some form of energy storage, storage is not always needed if utilities take a holistic approach to energy management, or if cost containment is a priority. Alaska has generally taken a modest approach to chemical
16 A good example is the community of Kongiganak, which has five Windmatic turbines, an ABB PCS100 grid-forming inverter, 50 Steffes stoves managed through a distributed control paradigm, and a small Li-ion battery pack refurbished from an EV. They are regularly able to operate without diesel, including for seven consecutive days in January 2019. The system was designed by Alaska-based Intelligent Energy Systems.
Microgrid Innovation in the Circumpolar Arctic
©2019 Navigant Consulting, Inc. Notice: No material in this publication may be reproduced, stored in a retrieval system, or transmitted by any means, in whole or in part, without the express written permission of Navigant Consulting, Inc.
23
energy storage using batteries. When used, they are often incorporated as a bridging tool to reduce the need for spinning reserves and help provide grid stabilizing services.
4.1.3 Thermal Energy Innovation is Vital to Project Success
Perhaps the most lasting legacy attached to microgrid innovation in the circumpolar Arctic, most notably Alaska, are advances in addressing thermal energy loads along with electric loads. Instead of developing strategies for managed load shedding, which is a major strategy for achieving high penetration levels of renewable energy in some markets, Alaskans have often found ways to add load in a controlled manner to achieve high contribution levels of variable renewable energy such as wind. In this manner, excess wind generation is converted into useful thermal energy. This conversion of excess electric power to heat is sometimes accomplished via dispatchable electric heaters in individual residences, or centrally to heat a single large facility, such as the hospital in Kotzebue.17 By controlling thermal loads via central dispatch strategies and using modest amounts of energy storage via batteries or flywheels, Alaskans have been able to achieve impressive results in the incorporation of renewables on microgrids. They have frequently achieved 100% or greater instantaneous penetration of renewables and in some cases have turned off diesel generation entirely and rely 100% on renewable energy when the resource, usually wind power, is available. Dispatchable thermal loads (including cooling in certain instances) have been a key ingredient in Alaska’s microgrid success due to the relative simplicity of this strategy.
4.1.4 Key Role for Wind Technology
While the majority of new microgrids deployed around the world lean toward solar PV technologies as a preferred renewable resource, wind still plays a vital role especially in remote microgrid applications. This is especially so in high latitudes, including the circumpolar Arctic. However, wind also often makes sense within the context of remote island microgrids. In these applications, wind and solar energy are often complementary resources since wind often blows at night (or in the winter) while the sun shines during the day (or in the case of high latitudes, in the summer). Combining wind and solar PV may, therefore, be able to reduce the size of any necessary energy storage systems. Modern wind turbines are often designed to survive extreme wind events, which have been perceived as a barrier for areas closer to the equator that are vulnerable to hurricanes or typhoons. It should be noted that equatorial parts of the world also frequently experience extreme wind events and while appropriate precautions are necessary to avoid damage to systems, this has not hampered wind power development or resulted in an unacceptable failure rate.
17 This strategy has most notably been pioneered by the Alaska-based developer, Intelligent Energy Systems, in several communities in western and southwest Alaska.
Microgrid Innovation in the Circumpolar Arctic
©2019 Navigant Consulting, Inc. Notice: No material in this publication may be reproduced, stored in a retrieval system, or transmitted by any means, in whole or in part, without the express written permission of Navigant Consulting, Inc.
24
4.1.5 Myth Busting the Idea that Solar Cannot Work in the Circumpolar Arctic
The solar resource in the circumpolar Arctic swings widely in terms of availability, both seasonally and geographically. At times, the sun barely sets; at other times, the sun may not appear for months. Nevertheless, annual solar insolation in the high Arctic is approximately equivalent to that of Germany. Increasingly, solar PV is competing with or complementing wind in remote microgrids located in Alaska, Canada, and Russia.
There are several advantages to solar PV at high latitudes. For example, solar PV operates more efficiently at cold temperatures, albedo from snow during spring months allows for high production output, and there is the potential for 24 hours of production during the summer months—especially using bifacial or multidirectional arrays. One disadvantage is that solar energy is most available during times of the year when residential electric consumption is often at its minimum. However, this is not always the case. Many industries, most notably fishing and tourism-related activities, are more active during the summer months.
4.1.6 The All-of-the-Above Approach to Resource Development
The resource mix for remote microgrids is the most diverse of any market segment. Any local resource is fair game. Along with traditional large-scale hydro facilities, microgrid developers in the circumpolar Arctic are investigating new distributed hydrokinetic devices that are ideally suited to small rural villages. For example, the village of Igiugig in western Alaska will be installing a permanent river current device in 2019, the 25 kW ORPC RiverGen device. Even wave energy is being actively considered as an option, most aggressively by the community of Yakutat in southeast Alaska. Small-scale geothermal energy has been incorporated into a microgrid since 2006 at Chena Hot Springs in Interior Alaska.18 While there are often consistent strategies to integrate individual technologies, there is a wide range of DER used to support circumpolar Arctic microgrids depending on what resources are most appropriate for any single location.
4.1.7 Local Stakeholder Buy-In Key to Project Success
One of the main reasons that Alaska has been a leader in microgrid development in the circumpolar Arctic is that incentives are well aligned to promote during project development and to support operation and maintenance. In Alaska, most projects are developed by consumer-oriented organizations (often utilities) that are locally owned and operated. This means that strong local support for projects is usually instilled at the earliest stages of conceptual design. Once constructed, the community is often invested in keeping projects operational, given that benefits flow directly back to consumers. This is somewhat unique
18 Chena operates a 500 kW geothermal-diesel hybrid microgrid to provide heat and power to a small, 76-room resort with an on-site restaurant, geothermal pool, and year-round Ice Museum. The 400 kW geothermal power plant was installed in 2006 and is the lowest temperature operating geothermal power plant in the world at 165°F (72°C).
Microgrid Innovation in the Circumpolar Arctic
©2019 Navigant Consulting, Inc. Notice: No material in this publication may be reproduced, stored in a retrieval system, or transmitted by any means, in whole or in part, without the express written permission of Navigant Consulting, Inc.
25
in Alaska, where minimal subsidies create less market distortion than in other markets in the Arctic regions and is likely the primary reason Alaska has seen a greater level of development at an early stage of technology readiness. On average, two-thirds of the kilowatt-hours sold in Alaska’s remote communities are not eligible for any subsidy.
Microgrid projects incorporating wind or solar PV also help support local economies directly by providing jobs during installation and ongoing operations. These projects also indirectly support local economies by keeping dollars in the community that otherwise would have been sent elsewhere to purchase diesel fuel. That utilities are leaders in microgrid development in the circumpolar Arctic should inspire utilities throughout the world to embrace this platform and explore its diverse application opportunities.
Microgrid Innovation in the Circumpolar Arctic
©2019 Navigant Consulting, Inc. Notice: No material in this publication may be reproduced, stored in a retrieval system, or transmitted by any means, in whole or in part, without the express written permission of Navigant Consulting, Inc.
26
Section 5 TABLE OF CONTENTS
Section 1 ...................................................................................................................................................... 1
Introduction ................................................................................................................................................. 1
1.1 Setting the Stage: Microgrids in the Circumpolar Arctic ............................................................... 1
1.2 Where Is the Circumpolar Arctic? ................................................................................................. 1
1.2.1 Why Alaska Is a World Leader in Microgrids .......................................................................... 3
1.2.2 Majority of Energy Services Delivered Through Microgrids .................................................... 4
1.2.3 Microgrids Shifting Toward Renewable Energy to Reduce Costs .......................................... 6
Section 2 ...................................................................................................................................................... 9
What Does the Circumpolar Microgrid Portfolio Look Like? ................................................................. 9
2.1 Factors Driving Renewable Energy Growth in the Circumpolar Arctic ......................................... 9
2.1.1 Resilience May Be a Matter of Life and Death Due to Harsh Climatic Conditions ............... 10
2.1.2 Deregulated and Regulated Markets Both Support Microgrid Development ........................ 11
2.1.2.1 Policies and Programs Supporting Distributed Energy Resources and Microgrid
Development in Alaska ................................................................................................................... 11
2.1.3 Regional Breakdown by Country ........................................................................................... 13
2.1.3.1 Canada ......................................................................................................................... 15
2.1.3.2 Russia ........................................................................................................................... 16
2.1.3.3 Greenland ..................................................................................................................... 16
2.1.3.4 Alaska, US .................................................................................................................... 17
2.1.4 DER Resource Mix for the Arctic Region .............................................................................. 18
Section 3 .................................................................................................................................................... 19
The Circumpolar Arctic Microgrid Portfolio Compared to the Rest of the World .............................. 19
3.1 Global Microgrid Market Overview .............................................................................................. 19
Microgrid Innovation in the Circumpolar Arctic
©2019 Navigant Consulting, Inc. Notice: No material in this publication may be reproduced, stored in a retrieval system, or transmitted by any means, in whole or in part, without the express written permission of Navigant Consulting, Inc.
27
3.1.1 Microgrid Market Segments .................................................................................................. 20
3.1.2 Remote Microgrid DER Characteristics ................................................................................ 21
Section 4 .................................................................................................................................................... 22
Lessons Learned from Arctic Region Microgrids ................................................................................. 22
4.1 Important Lessons Learned from Circumpolar Arctic Microgrids ................................................ 22
4.1.1 Robust and Simple Designs Work Best ................................................................................ 22
4.1.2 Modest Inclusion of Energy Storage Helps Keeps Costs Contained .................................... 22
4.1.3 Thermal Energy Innovation is Vital to Project Success......................................................... 23
4.1.4 Key Role for Wind Technology .............................................................................................. 23
4.1.5 Myth Busting the Idea that Solar Cannot Work in the Circumpolar Arctic............................. 24
4.1.6 The All-of-the-Above Approach to Resource Development .................................................. 24
4.1.7 Local Stakeholder Buy-In Key to Project Success ................................................................ 24
Section 5 .................................................................................................................................................... 26
Table of Contents ...................................................................................................................................... 26
Section 6 .................................................................................................................................................... 28
Table of Charts and Figures..................................................................................................................... 28
Section 7 .................................................................................................................................................... 29
Scope of Study .......................................................................................................................................... 29
Sources and Methodology ....................................................................................................................... 30
Microgrid Innovation in the Circumpolar Arctic
©2019 Navigant Consulting, Inc. Notice: No material in this publication may be reproduced, stored in a retrieval system, or transmitted by any means, in whole or in part, without the express written permission of Navigant Consulting, Inc.
28
Section 6 TABLE OF CHARTS AND FIGURES
Chart 1-1. Top 10 US States for Microgrid Capacity: 2Q 2019 ................................................................ 4
Chart 1-2. Microgrid DER Resource Mixture for the Top 10 US States: 2Q 2019 ................................... 7
Chart 2-1. Microgrid Project Market Share, Circumpolar Arctic: 2Q 2019 ............................................. 14
Chart 2-2. Microgrid Capacity Market Share, Circumpolar Arctic: 2Q 2019 .......................................... 15
Chart 2-3. Circumpolar Arctic Microgrid DER Capacity Market Share: 2Q 2019 ................................... 18
Chart 3-1. Total Microgrid Power Capacity Market Share by Region, World Markets: 2Q 2019 ........... 19
Chart 3-2. Total Microgrid Power Capacity Market Share by Segment, World Markets: 2Q 2019 ........ 20
Chart 3-3. Remote Microgrid DER Market Shares, World Markets: 2Q 2019 ........................................ 21
Figure 1-1. Circumpolar Arctic Remote Communities Microgrid Map ....................................................... 2
Figure 1-2. Alaska’s Railbelt Grid – Linked and Nested Microgrids .......................................................... 5
Table 1-1. Residential Customers and Energy Capacity Sold by Utility Type, Alaska: 2013 ................... 8
Table 2-1. Circumpolar Arctic Regional Grids ........................................................................................ 10
Microgrid Innovation in the Circumpolar Arctic
©2019 Navigant Consulting, Inc. Notice: No material in this publication may be reproduced, stored in a retrieval system, or transmitted by any means, in whole or in part, without the express written permission of Navigant Consulting, Inc.
29
Section 7 SCOPE OF STUDY
This white paper was developed in conjunction with the University of Alaska to accomplish the following three key goals:
• Update and refine data from Alaska and the circumpolar Arctic for the 2Q 2019 update of Navigant Research’s Microgrid Deployment Tracker 2Q19
• Compare deployment patterns, including DER deployed, from the circumpolar Arctic to global microgrid markets, with a focus on remote systems
• Offer lessons learned from these deployments to the developing world to help guide future developments to offer the widest possible benefits for bottom of the pyramid applications
The white paper leveraged resources developed by both the University of Alaska and Navigant Research. It also distinguishes between microgrids and regional grids, notes the role utilities play in microgrid development, and compares and contrasts the different cultural and regulatory structures that exist in the US, Canada, Russia, and Greenland, noting that Alaska not only leads microgrid development in the circumpolar Arctic, but all US states in microgrid deployment capacity as well.
Microgrid Innovation in the Circumpolar Arctic
©2019 Navigant Consulting, Inc. Notice: No material in this publication may be reproduced, stored in a retrieval system, or transmitted by any means, in whole or in part, without the express written permission of Navigant Consulting, Inc.
30
SOURCES AND METHODOLOGY
Navigant Research’s industry analysts utilize a variety of research sources in preparing Research Reports. The key component of Navigant Research’s analysis is primary research gained from phone and in-person interviews with industry leaders including executives, engineers, and marketing professionals. Analysts are diligent in ensuring that they speak with representatives from every part of the value chain, including but not limited to technology companies, utilities and other service providers, industry associations, government agencies, and the investment community.
Additional analysis includes secondary research conducted by Navigant Research’s analysts and its staff of research assistants. Where applicable, all secondary research sources are appropriately cited within this report.
These primary and secondary research sources, combined with the analyst’s industry expertise, are synthesized into the qualitative and quantitative analysis presented in Navigant Research’s reports. Great care is taken in making sure that all analysis is well-supported by facts, but where the facts are unknown and assumptions must be made, analysts document their assumptions and are prepared to explain their methodology, both within the body of a report and in direct conversations with clients.
Navigant Research is a market research group whose goal is to present an objective, unbiased view of market opportunities within its coverage areas. Navigant Research is not beholden to any special interests and is thus able to offer clear, actionable advice to help clients succeed in the industry, unfettered by technology hype, political agendas, or emotional factors that are inherent in cleantech markets.
Microgrid Innovation in the Circumpolar Arctic
©2019 Navigant Consulting, Inc. Notice: No material in this publication may be reproduced, stored in a retrieval system, or transmitted by any means, in whole or in part, without the express written permission of Navigant Consulting, Inc.
31
Published 3Q 2019
©2019 Navigant Consulting, Inc. 1375 Walnut Street, Suite 100 Boulder, CO 80302 USA Tel: +1.303.997.7609 http://www.navigantresearch.com
Navigant Consulting, Inc. (Navigant) has provided the information in this publication for informational purposes only. The information has been obtained from sources believed to be reliable; however, Navigant does not make any express or implied warranty or representation concerning such information. Any market forecasts or predictions contained in the publication reflect Navigant’s current expectations based on market data and trend analysis. Market predictions and expectations are inherently uncertain and actual results may differ materially from those contained in the publication. Navigant and its subsidiaries and affiliates hereby disclaim liability for any loss or damage caused by errors or omissions in this publication.
Any reference to a specific commercial product, process, or service by trade name, trademark, manufacturer, or otherwise, does not constitute or imply an endorsement, recommendation, or favoring by Navigant.
This publication is intended for the sole and exclusive use of the original purchaser. No part of this publication may be reproduced, stored in a retrieval system, distributed or transmitted in any form or by any means, electronic or otherwise, including use in any public or private offering, without the prior written permission of Navigant Consulting, Inc., Chicago, Illinois, USA.
Government data and other data obtained from public sources found in this report are not protected by copyright or intellectual property claims.
Note: Editing of this report was closed on June 28, 2019.