Embed Size (px)
Citation preview

1
ICEX-2011 XCTD Test
March-April 2011
Timothy Boyd
Internal Report No 275
Scottish Marine Institute
Oban, Argyll, PA37 1QA, Scotland
Tel: [+44] (0)1631 559000 Fax: [+44] (0)1631 559001
www.sams.ac.uk
2
SUMMARY:
This report describes results of a test deployment of under-ice submarine-launched eXpendable
Conductivity Temperature Depth (U/ISSXCTD) probes conducted by the U.S. Navy Arctic
Submarine Laboratory (ASL) during the 2011 U.S. Navy ICe EXercise (ICEX-11) in the Arctic
Ocean. This test was conducted in order to evaluate the accuracy and reliability of XCTD probes
when launched from submarines while operating under sea ice, and thus their suitability for further
use in the SCICEX program of Science Accommodation Missions (SAMs) in the Arctic Ocean.
16 U/ISSXCTD probes were acquired for testing during 2010-11. Four of these were tested in open
water in December 2010. The remaining 12 U/ISSXCTD probes were deployed under ice during
ICEX-11. During the open water test of December 2010, 2 XCTDs failed pre-launch tests and were
not launched; the remaining 2 probes were deployed and returned data: 1 of these exceeded the
design depth and 1 returned data over a significantly shorter depth range. During the ICEX-11
tests, 4 failed pre-launch tests and were not launched, 1 was deployed but failed to return data, and
the remaining 7 returned acceptable data: 5 of these returned data over the full design depth, and 2
returned data over significantly shorter depth ranges.
The conclusions from these tests are: (1) there is an unacceptably high rate of failure (37.5%) of
pre-launch tests, (2) the overall rate of data return from launched probes (90%) is acceptable, and
(3) the rate of achievement of design sample depth has improved (71%) but still falls short of
acceptable levels. In short: if you prepare to launch an XCTD, you have a 62.5% chance of
launching the probe, and if you do launch you have a 90% chance of getting data returned. Those
data will be of acceptable quality, but only 71% of the probes returning data will return data to the
full design depth.
Funding for the 2010-11 XCTD probes was provided by an Office of Naval Research grant to the
Scottish Association for Marine Science (SAMS). Testing was accomplished by the Arctic
Submarine Laboratory with the assistance of the officers and crew of the USS Connecticut (SSN
22) during ICEX-11.
AUTHOR
Timothy Boyd (1959-2013)
Principal Investigator in Polar Physical Oceanography
Scottish Association for Marine Science
Scottish Marine Institute
Note from the Office of Naval Research (ONR)
This report was prepared in February 2012 by Dr. Tim Boyd for ONR. Sadly, Tim died in February 2013. For more
information about the submarine-launched XCTD measurement project, contact Dr. Scott Harper or Dr. Martin Jeffries,
Arctic & Global Prediction Program, ONR Code 32/322.

3
Table of Contents
1. INTRODUCTION
2. ICEX 2011 XCTD TEST
a. Overview of ICEX-11 XCTD Deployments
b. XCTD Data
3. ANALYSIS OF XCTD PERFORMANCE
a. Accuracy: ICEX XCTD/APLIS CTD comparison
b. Accuracy: ICEX XCTD/NPEO CTD comparison
c. Sensor Resolution
d. Reliability: Depth Range Profiled
4. CONCLUSIONS
5. REFERENCES

4
1. INTRODUCTION
Submarine-based observations of large-scale upper-ocean temperature and salinity variability
during the SCICEX program of the late-1990's and early 2000's contributed significantly to early
understanding of basin-wide changes that have continued throughout the first decade of the 21st
century. With increased awareness and interest in sustained observations of the changing
conditions that are likely leading towards a seasonally ice-free central Arctic Ocean, there has been
a renewed appreciation of and interest in submarine-based sampling. Awareness of the high
likelihood of a seasonally ice-free Arctic Ocean has led to development of an US Navy Arctic Road
Map (Task Force Climate Change/Oceanographer of the Navy, 2009) which identifies
understanding of the current and evolving Arctic physical environment as a key Navy objective, and
calls for continuation of SCICEX Science Accommodation Missions (SAMs) as a specific action
item. The renewed interest in submarine-based sampling has also resulted in the publication of a
new science plan (SCICEX SAC, 2010), which was developed by the SCICEX Science Advisory
Committee (SAC) with an eye towards becoming an integral part of the Arctic Observing Network
(AON; IARPC, 2007) and to meeting the goals of US and international Arctic change programs
(SEARCH, International Study of Arctic Change). Successful implementation of the new SCICEX
science plan relies on the research community to obtain the resources necessary for the collection
and processing of data, and relies on the US Navy Arctic Submarine Laboratory (ASL) to deploy
instrumentation and collect water samples for later analysis.
Under-ice submarine-launched eXpendable Conductivity, Temperature and Depth (U/ISSXCTD)
probes deployed on long, basin-spanning transects provided near-synoptic slices of temperature and
salinity in the upper Arctic Ocean during the dedicated-science SCICEX cruises of the 1990's.
Since then, the analog probes that were used with a high success rate during the dedicated-science
SCICEX cruises have been replaced by digital probes, which have been used from submarines with
only limited and intermittent success. The U/ISSXCTD system consists of a standard digital XCTD
probe, developed and manufactured by Tsurumi Seiki (TSK) Company of Japan, configured and
packaged for submarine deployment by Lockheed Martin Sippican, which also provides the
submarine-based system for data acquisition and processing. Previous ONR-funded test
deployments of the digital U/ISSXCTDs were conducted in the Beaufort Sea by ASL in
conjunction with ICEX-09, as preparation for use during future SCICEX SAMs. While the ICEX-
09 test revealed that the new, digital probes yielded higher quality salinity measurements than the
earlier analog probes, the test also revealed that the probes uniformly failed to return data to their
design depth of 1000 m (Boyd, 2010).
Following the mixed results of the ICEX-09 XCTD test deployments, the SCICEX SAC decided:
(1) that further use of the UISSXCTDs in SCICEX could only be recommended after the probes
could be shown to reliably achieve sample profiles to their designed maximum depth, and (2) that
further testing would be considered only after Sippican had made new progress on resolving the
maximum sample depth shortcoming. In summer 2010, Sippican informed the SAC that: (1) a
specific cause of foreshortened profile data had been identified, and (2) a software solution had
been identified and tested. At that time Sippican had identified the irretrievable loss of
synchronization of the real-time digital data stream as the source of data acquisition failure, and
their solution involved recording the full signal such that loss of synchronization in real time would
be recoverable through later playback of the raw data. In response to an identified ASL test
opportunity and the high probability of success, ONR funded the acquisition of 16 U/ISSXCTDs for
testing in December 2010.
The remainder of this report consists of a brief description of the parameters surrounding the XCTD
test, a description of the XCTD data in the context of major Arctic Ocean hydrographic features,

5
and evaluation of the accuracy of the XCTD data by means of comparison to contemporary CTD
casts.
2. ICEX 2011 XCTD TEST
In fall 2010, ONR approved a request for funding to enable an open-water test of submarine-
launched XCTDs using the new Sippican data acquisition software on Navy submarines in late
2010. The timing of this test was viewed as critical because:
1. a successful test of the depth capability of XCTDs was a pre-requisite to the conduct of
future SCICEX SAM sampling;
2. a potential opportunity for SCICEX SAM sampling would occur during the planned ICEX
of March-April 2011; and
3. the next opportunity for sampling by submarine along the ICEX ice camp approach tracks
(as defined in the SCICEX Science Plan, 2010) was likely to be the subsequent ICEX,
which is expected to be conducted in 2014.
The specific objectives of the project were to:
1. test the capability of U/ISSXCTD probes to achieve full design depth profiles;
2. demonstrate capability to launch U/ISSXCTD probes and recover data with high success
rate; and
3. confirm the accuracy of the XCTDs through repeatability of measured temperature and
salinity vertical profiles.
Under ONR funding, the Scottish Association for Marine Science (SAMS) contracted with
Lockheed Martin Sippican to provide the Arctic Submarine Laboratory with the necessary
U/ISSXCTD probes, test probes, data recording hardware, software, and instructions/guidance in
order for ASL to conduct a test that would provide unambiguous results. For this test, Sippican
provided 16 probes, as well as the loan of one USB Mk21 data acquisition (DAQ) board.
All of the necessary components were available for the open water test in December 2011;
however, operational constraints restricted XCTD deployment to only 4 probes. These probes were
launched with mixed results (Table 1). Subsequent enquiries revealed that the correct version of the
Sippican data acquisition software had not been used during the test. The small number of probes
launched severely limits the conclusions that can be drawn from the test, particularly with respect to
the accuracy and repeatability of the returned data; however, the high failure rate of pre-launch
probe tests is notable. Unfortunately, the probes that failed the pre-launch tests were not retained
for return and subsequent analysis by Sippican.
1a. Overview of ICEX-11 XCTD Deployments
Because only 4 XCTDs were deployed during the open-water test of December 2010, 12 of the 16
probes procured by SAMS were available for future testing. At ONR’s request, ASL agreed to
launch the remaining probes during the ICEX-11 submarine exercise in the Arctic Ocean, splitting
the probe deployments between the vicinity of the APLIS ice camp (where they could be deployed
as a cluster and compared to ice camp-based CTD profiles) and along one of the defined SCICEX
sampling corridors, if possible (SCICEX SAC, 2010). During ICEX-11, XCTDs were deployed
under sea ice from the Seawolf-class USS Connecticut in four areas: near the APLIS ice camp in
the Beaufort Sea (BS), over the Chukchi Plateau (CP), near the juncture of the Alpha Rise and
Mendeleyev Ridge (AMR) in the northern Canadian Basin, and near the North Pole (NP, figure 1).

6
Figure 1. IBCAO bathymetric map of the Arctic Ocean showing location of the XCTDs deployed
by the USS Connecticut (SSN 22) during ICEX 11 (Jakobsson et al., 2008).
Dates, locations, and results of each attempted probe deployment are shown in Table 1. XCTDs 6,
7, and 10 were deployed in the vicinity of the APLIS (APL Ice Station) ice camp, in the Beaufort
Sea (APLIS is named after the University of Washington’s Applied Physics Laboratory, which has
provided sea ice-based support for the Navy’s ICEX submarine program for many years). XCTD 5
was deployed in shallow water over the CP, and XCTD 12 was deployed in the deep water of the
Mendeleyev Plain of the northern Canada Basin, near the AMR. XCTDs 14 and 15 were deployed
close to the North Pole in deep water in the northern Amundsen Basin.

7
Date Month Year Time
1 CU_00005 04 Dec 2010 0511 10058892 Y Y 628.9
2 CU_00006 05 Dec 2010 0106 10058893 Y Y 1087.9
3 05 Dec 2010 10058875 N
4 05 Dec 2011 10058874 N
5 XCTD 05 14 Mar 2011 0640 410 76 - 38.6 N 168 - 00.6 W 10058869 Y Y 1112.3
6 XCTD 06 16 Mar 2011 0503 410 72 - 58.2 N 147 - 05.3 W 10058867 Y Y 1112.3 03151130 36.5
7 XCTD 07 24 Mar 2011 2022 350 73 - 05.4 N 146 - 17.1 W 10058866 Y Y 545.7 03241122 37.9
8 27 Mar 2011 0430 350 10058864 N
9 27 Mar 2011 0519 350 10058868 Y N
10 XCTD 10 27 Mar 2011 0538 350 72 - 58.0 N 146 - 41.0 W 10058863 Y Y 1112.303262015
03262100544.2 542.2
11 31 Mar 2011 1618 305 10058872 N
12 XCTD 12 31 Mar 2011 1645 305 82 - 49.9 N 163 - 00.5 W 10058862 Y Y 1112.3
13 01 Apr 2011 2240 350 10058873 N
14 XCTD 14 01 Apr 2011 2312 350 89 - 59.2 N 024 - 30.1 W 10058865 Y Y 1112.3
15 XCTD 15 03 Apr 2011 0607 305 89 - 45.0 N 156 - 32.0 W 10058870 Y Y 216.8
16 06 Apr 2011 0445 305 10058871 N
XCTD
Termination
Depth
(m)
Ship's
Depth
(ft)
Probe
S/N
Closest
APLIS/NPEO
CTD cast
name
XCTD
File Name
Time of Launch (Z) Probe
Test
OK
Post
Launch
Data
Received
West Coast
Event
No.
CTD cast
maximum
depth (m)
Latitude Longitude
West Coast
West Coast
West Coast
Table 1. Results of XCTD test deployments in open water off the US west coast in December
2010 (Events 1-4) and under sea ice in the Arctic Ocean in March-April 2011 (Events 5-16) from
the USS Connecticut (SSN 22).
1b. XCTD data
ASL personnel have reported that the Sippican DAQ software provided to them prior to ICEX-11
did not include an option for the U/ISSXCTD probe type, as expected from their previous
experience. The version of the software they were provided by Sippican in fact did not include that
option. As a consequence of this, the resulting data files show vertical profiles beginning at the
surface (0 m), as per SSXCTD probes, rather than 12.19 m (40 ft), as per U/ISSXCTD probes. This
is illustrated by the example XCTD Export Data File (EDF) header and data excerpt shown in
Appendix 1.
The XCTD profiler, containing the temperature and conductivity sensors and as widely used within
the oceanographic research community, is obtained from TSK by Sippican and then repackaged for
deployment from submarines in open water as the SSXCTD probe and under ice as the
U/ISSXCTD probe. Packaged as the SSXCTD, the probe rises from the submerged vessel to the
surface from which it profiles downward 1100m. Packaged as the U/ISSXCTD, the probe is
designed to rise from the submerged vessel to the depth of 12.19 m (40 ft), and then profile
downward 1100 m to a total depth of 1112.19 m. The probes are delivered to Sippican with probe-
specific temperature and conductivity coefficients stored in memory, as they are individually
calibrated, but with common fall-rate coefficients appropriate for surface-launching, the first of
which is a depth offset, i.e., the depth of the first sample. Ordinarily, the Sippican DAQ software
replaces the depth offset coefficient of 0 ft (0 m) with 40 ft (12.192 m) for U/I probes; however, this
did not occur in the ICEX-11 case due to the absence of the U/I probe option. In this case, the DAQ
software derived and recorded depth data appropriate for surface (SSXCTD) probes although U/I
probes were actually launched (see Appendix 1). Except where explicitly described otherwise, the
data shown in this report have been reprocessed using the depth coefficients appropriate for
U/ISSXCTD probes – effectively all depths have been offset by 12.192 m relative to the depths
recorded in the EDF files: with the first depth at 12.19 m and the nominal last depth of 1112.19 m

8
Complete profiles of potential temperature (relative to the surface) and salinity are shown in figures
2 and 3 for each of the successfully launched probes. The figure legends indicate the area of
deployment for the probes which will be compared to lowered CTD data in section 2.
Collectively, these profiles embody many of the characteristics of the central Arctic Ocean
hydrographic structure. In particular, the downstream cooling of the warm core of the Atlantic
water (AW) is illustrated by the differences between the magnitudes of the subsurface temperature
maxima from nearly 1.5°C at the NP (XCTDs 14 and 15), to about 0.8°C after flowing along the
Mendeleyev Ridge (XCTD 12), to about 0.7°C over the CP and in the BS (XCTDs 5, 6, 7, 10). In
addition, the depths of the AW temperature maxima increase for that sequence from the NP to the
BS/CP, due to the influx of fresher (less dense) and relatively warm (-0.5°C) water of Pacific origin
above the Atlantic layer in the CP and BS profiles. Shimada et al. (2001) identify similar
subsurface temperature maxima at 40-60 m depth (figure 2) and salinities (S) in the range of 31 < S
< 32 (figures 3, 4) with Eastern Chukchi Summer Water.
The water column in the BS is characterized by continuous salinity stratification to the surface or a
shallow mixed layer, while the profiles from the CP, AMR and NP regions (XCTDs 5, 12, 14, and
15) are characterized by deeper surface mixed layers (to 50 m at the NP) across the base of which is
a large salinity/density step above a generally less stratified halocline (smaller dS/dz, figure 3).
Plots of potential temperature versus salinity (θ-S, figures 4, 7, 10) for the XCTD casts illustrate
that despite differences in surface temperature and salinity, the near-surface water is at the freezing
point at all locations. Divergence of the APLIS CTD cast from the freezing point is discussed while
evaluating the accuracy of the BS XCTD deployments in section 2a (see figure 7).
Profiles from the AMR and NP regions (XCTDs 12, 14, and 16) include double-diffusive
temperature-salinity (T-S) steps in the thermocline above the depth of the temperature maximum
(figures 2 and 8). These steps are explored in greater detail while evaluating the accuracy of the NP
XCTD deployments in section 2b (see figures 11-13). The subsurface maximum at 50-100 m depth
in the AMR temperature profile (XCTD 12, figure 2) corresponds to summer Pacific halocline
water with 32 < S < 33 (figure 4 and Steele et al., 2004), whereas the subsurface maxima at 65 m
depth in the NP temperature profiles (primarily XCTD 14, figures 2, 8) fall in a higher salinity
range, 33 < S < 33.5 (figure 10)
Figure 2. Complete (left) and upper water column (right) profiles of potential temperature (θ) in °C
for the 7 XCTDs successfully deployed during ICEX-11.

9
Figure 3. Complete (left) and upper water column (right) profiles of salinity in psu for the 7
XCTDs successfully deployed during ICEX-11.
Figure 4. Potential temperature (θ, in °C) versus salinity (in psu) for the 7 XCTDs deployed during
ICEX-11. Lines of constant density are shown as nearly vertical dashed lines, and the freezing
temperature is shown as a solid magenta line. For all casts, the surface water is at the freezing
point.
2. ANALYSIS OF XCTD PERFORMANCE
XCTD performance is evaluated through comparison to CTD casts conducted by ASL at APLIS on
26 March, 2011, and by J. Morison, University of Washington, Applied Physics Laboratory, near
the North Pole on 19 April, 2011. Table 2 shows the CTD casts conducted closest to each of the
XCTDs considered for this comparison. Although the APLIS CTD casts on 15 and 24 March were

10
closer to XCTDs 6 and 7, these CTD casts were conducted through only the upper 40m;
consequently, they have limited value for evaluating the XCTD casts.
Date Month Year Time
APLIS 03151130 15 Mar 2011 1141 72 - 56.7 N 146 - 56.3 W 6 36.5
APLIS 03241122 24 Mar 2011 1022 73 - 02.0 N 146 - 33.9 W 7 37.9
APLIS 03262015 26 Mar 2011 2042 73 - 00.7 N 146 - 45.3 W 10 544.2
APLIS 03262100 26 Mar 2011 2128 73 - 00.7 N 146 - 04.3 W 10 542.2
NPEO ctd 7 19 Apr 2011 1802 89 - 57.7 N 033 - 34.7 W 14, 15 515.8
CTD program
name
CTD cast
maximum
depth (m)
Latitude LongitudeCTD cast
name
Time of Launch (Z) deployed
closest to
XCTDs
Table 2. Arctic CTD casts which are closest in space and time to a subset of the XCTD
deployments shown in Table 1. APLIS CTD data provided by ASL. NPEO data obtained from the
University of Washington, Applied Physics Laboratory NPEO website
( http://psc.apl.washington.edu/northpole/ ).
2a. Accuracy: ICEX XCTD/APLIS CTD comparison
Temperature
Both XCTD and CTD profiles from the APLIS region of the BS exhibit several extremes in the
upper 600m. The differences between XCTD and CTD temperatures at these local minima and
maxima provide a reasonable estimate of the accuracy of the XCTD probes (manufacturer’s
specifications for which are shown in Table 4), if we regard the SeaBird Electronics SBE-19 CTD
used in both APLIS and NPEO sampling as the standard (specifications for which are shown in
Table 5). The magnitudes of the CTD-XCTD temperature differences (ΔT) are: ΔT < 0.02°C at
the base of the surface mixed layer (25 m depth); ΔT < 0.04°C at the 200 m local minimum; and
ΔT < 0.03°C at the depth of the AW temperature maximum (450 m depth). Taking into account
natural variability associated with sampling at different locations and times, these values
collectively are very close to the XCTD temperature accuracy of ± 0.02°C shown in Table 4.
Temperature variability is significantly larger in the region of the local maxima in the 50-100m
depth range. The two APLIS CTD casts conducted 45 minutes apart exhibit well defined maxima
at 75 m depth which differ in magnitude by 0.07°C. While the XCTD-CTD temperature
differences in this depth region are often larger than 0.1°C, we disregard this region for comparison,
appealing for justification to the larger range of natural variability indicated by the fast-repeat CTD
casts. Significantly larger, very near surface APLIS CTD temperature values are almost certainly
artefacts of lack of soaking of the CTD at the surface at the beginning of the cast. This is also
results in divergence of the CTD surface values from the freezing line for salinities less than 28 psu
(figure 7).
11
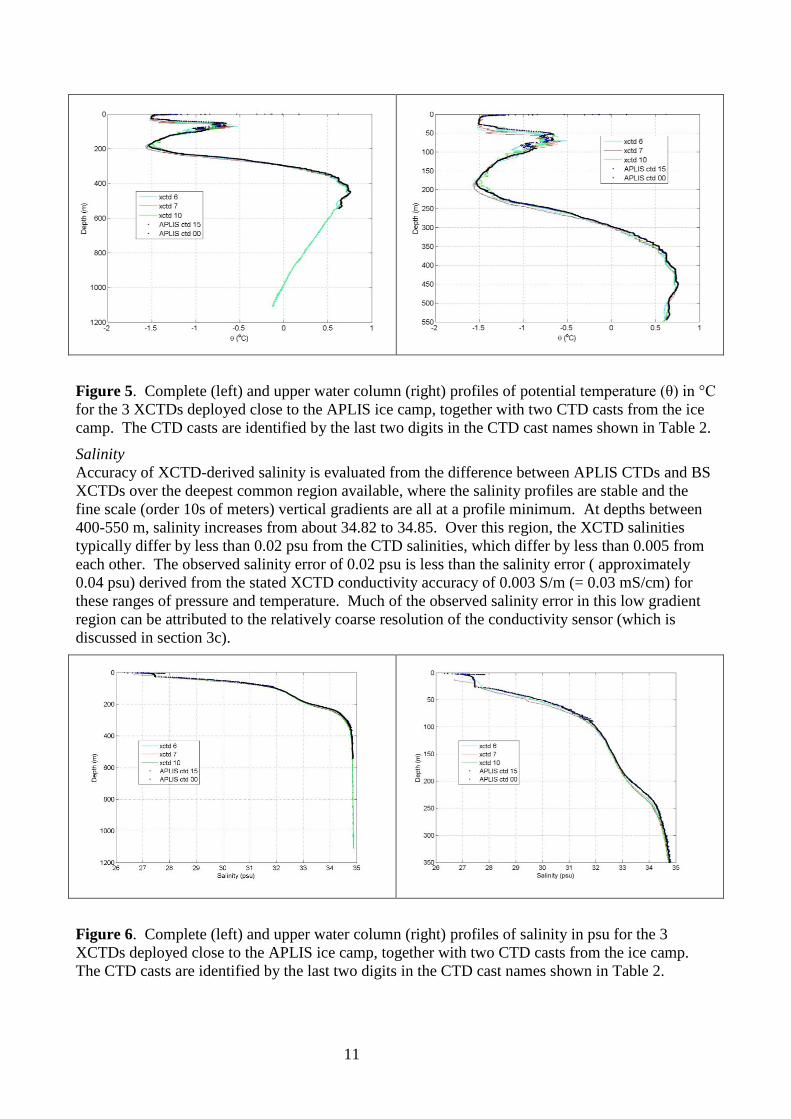
Figure 5. Complete (left) and upper water column (right) profiles of potential temperature (θ) in °C
for the 3 XCTDs deployed close to the APLIS ice camp, together with two CTD casts from the ice
camp. The CTD casts are identified by the last two digits in the CTD cast names shown in Table 2.
Salinity
Accuracy of XCTD-derived salinity is evaluated from the difference between APLIS CTDs and BS
XCTDs over the deepest common region available, where the salinity profiles are stable and the
fine scale (order 10s of meters) vertical gradients are all at a profile minimum. At depths between
400-550 m, salinity increases from about 34.82 to 34.85. Over this region, the XCTD salinities
typically differ by less than 0.02 psu from the CTD salinities, which differ by less than 0.005 from
each other. The observed salinity error of 0.02 psu is less than the salinity error ( approximately
0.04 psu) derived from the stated XCTD conductivity accuracy of 0.003 S/m (= 0.03 mS/cm) for
these ranges of pressure and temperature. Much of the observed salinity error in this low gradient
region can be attributed to the relatively coarse resolution of the conductivity sensor (which is
discussed in section 3c).
Figure 6. Complete (left) and upper water column (right) profiles of salinity in psu for the 3
XCTDs deployed close to the APLIS ice camp, together with two CTD casts from the ice camp.
The CTD casts are identified by the last two digits in the CTD cast names shown in Table 2.

12
Depth
Because the XCTD and CTD temperature profiles shown in figure 5 display very similar behaviour
with depth, the locations of the local minima and maxima can be considered as potential points for
evaluation of XCTD depth accuracy. CTD depth is derived from a pressure measurement, which is
accurate to 0.1% of the pressure sensor full range, or 1-6 m for sensor full ranges of 1000-6000 m
(Table 5). In contrast, XCTD depth is determined from elapsed time of descent and a prescribed
probe descent rate, the accuracy for which is stated as 2% (Table 4).
The high variance in XCTD and CTD records at the depth of the subsurface temperature maximum
near 60 m is suggestive of interleaving activity associated with the intrusion of Pacific origin water
(figure 7), which makes this an unsatisfactory point for comparison. In contrast, all BS XCTD and
CTD profiles are stable around the depths of the AW temperature maximum (Tmax) and the Pacific
Winter Water (PWW) temperature minimum (Itoh et al., 2007). Some variability in the observed
feature depths should be expected due to local variations in surface mixing and temporal variations
in vertical displacement of isopycnals by internal tides and waves; however, the depth comparisons
shown in Table 3 indicate that collectively the XCTD depths are biased deep relative to the CTD
casts.
Comparison of XCTD and CTD salinity profiles in the upper ocean (figure 6) reveals greater detail
about the XCTD depth error. Only one of the three XCTD profiles shown in figure 6 (XCTD 10)
exhibits a classic, homogeneous salinity surface mixed layer (SML), the base of which is deeper by
1 m than in the CTD profile. The other two XCTD profiles have shallow fresh water layers (as
does the CTD profile) above a weakly stratified layer ending with a sharp transition to higher
stratification below, which is identified here as the base of the SML. Within the upper halocline
(just below the SML), all three of the BS XCTD salinity profiles are offset deeper/fresher than the
APLIS CTD profiles. Within the steep salinity gradient of the halocline, the observed offset
corresponds to a depth error of 3-8 m equivalent to a salinity error of 0-2-0.4 psu. As this observed
bias is more than 10 times the XCTD salinity ‘sensor’ error, it suggests that the XCTD-CTD biases
in the halocline are due to errors in derived XCTD depth.
APLIS CTD
depth (m)
XCTD depths
(m)
NPEO CTD
depth (m)
XCTD depths
(m)
Base of surface mixed
layer26
30
26
27
4248
49
Pacific Winter Water
(S=33) temperature
minimum
180
187
190
179
Atlantic water
temperature maximum449
458
461
458275 290
Beaufort Sea North Pole
Feature for Comparison
Table 3. Comparison of depths of well-defined hydrographic features in XCTD and CTD potential
temperature and salinity profiles
The XCTD probe samples the temperature (T) and conductivity (C) sensors at 25Hz, and attributes
a depth to each of these T/C pairs through application of a depth equation incorporating a starting
depth and a descent rate that decreases slightly with increasing time (and therefore depth). The
depth coefficients recorded in the headers of each of the ICEX-11 data files are identical, and reflect
the surface-launched and open-water submarine-launched values for the TSK XCTD probes: z = a
+ bt + ct 2, where a = starting depth = 0.0 m; b = velocity term = 3.425432 ms
-1; and c =
acceleration term = -0.00047 ms-2
(see Appendix 1). As noted earlier, the value of a was replaced
by 12.192 m to compute the U/ISSXCTD depths. For the profiles shown in figures 5 and 6, the
13
probe velocity decreases slightly from v = 3.43 ms-1
at 12 m to v = 3.30 ms-1
at 460 m, the depth of
the warm core of the AW. The results here, showing increasing depth error with increasing depth,
suggest that the acceleration term may require adjustment. More detailed analysis of the XCTD
depth errors reflected in figures 5 and 6 is possible, but is beyond the scope of the present report.
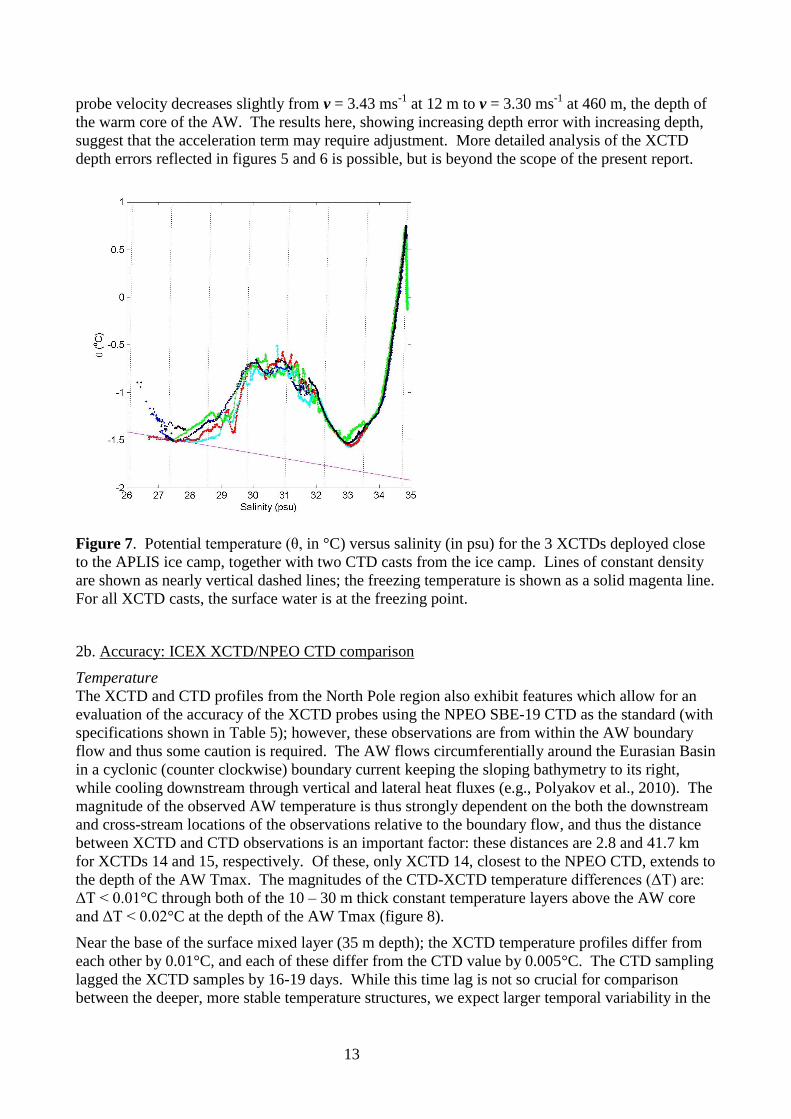
Figure 7. Potential temperature (θ, in °C) versus salinity (in psu) for the 3 XCTDs deployed close
to the APLIS ice camp, together with two CTD casts from the ice camp. Lines of constant density
are shown as nearly vertical dashed lines; the freezing temperature is shown as a solid magenta line.
For all XCTD casts, the surface water is at the freezing point.
2b. Accuracy: ICEX XCTD/NPEO CTD comparison
Temperature
The XCTD and CTD profiles from the North Pole region also exhibit features which allow for an
evaluation of the accuracy of the XCTD probes using the NPEO SBE-19 CTD as the standard (with
specifications shown in Table 5); however, these observations are from within the AW boundary
flow and thus some caution is required. The AW flows circumferentially around the Eurasian Basin
in a cyclonic (counter clockwise) boundary current keeping the sloping bathymetry to its right,
while cooling downstream through vertical and lateral heat fluxes (e.g., Polyakov et al., 2010). The
magnitude of the observed AW temperature is thus strongly dependent on the both the downstream
and cross-stream locations of the observations relative to the boundary flow, and thus the distance
between XCTD and CTD observations is an important factor: these distances are 2.8 and 41.7 km
for XCTDs 14 and 15, respectively. Of these, only XCTD 14, closest to the NPEO CTD, extends to
the depth of the AW Tmax. The magnitudes of the CTD-XCTD temperature differences (ΔT) are:
ΔT < 0.01°C through both of the 10 – 30 m thick constant temperature layers above the AW core
and ΔT < 0.02°C at the depth of the AW Tmax (figure 8).
Near the base of the surface mixed layer (35 m depth); the XCTD temperature profiles differ from
each other by 0.01°C, and each of these differ from the CTD value by 0.005°C. The CTD sampling
lagged the XCTD samples by 16-19 days. While this time lag is not so crucial for comparison
between the deeper, more stable temperature structures, we expect larger temporal variability in the

14
SML and thus the near surface comparisons do not strongly constrain our conclusions regarding the
XCTD sensor error. Overall, the differences between the XCTD and CTD values are all within the
stated accuracy of the XCTD temperature sensors (Table 4).
Salinity
Accuracy of XCTD-derived salinity for the North Pole deployments is evaluated from the salinity
differences (ΔS) between NPEO CTD 7 and XCTDs 14 and 15 over the 10-30 m thick, nearly
constant T/S steps above the AW core. For the 10 m thick layer centered at 203 m, the magnitudes
of the layer average salinity differences for XCTD 14 and 15 are ΔS = 0.0125 and ΔS = 0.0014 psu,
respectively. For the 30 m thick layer centered at 239 m the layer average salinity difference
between XCTD 14 and CTD 7 is ΔS = 0.003 psu (figure 9). No comparison exists for XCTD 15, as
the profile maximum depth (as corrected for an approximate XCTD depth error of 10 m) is 215 m.
Overall, the differences between the XCTD and CTD values are all within the stated accuracy of the
XCTD salinity sensors (Table 4).
Depth
As noted above for the BS, the few comparators using North Pole XCTD and NPEO CTD profile
features do not provide an adequate description of the XCTD depth errors. Both XCTD and CTD
profiles from the North Pole exhibit well defined mixed layers with clearly identifiable bases,
though only one of the XCTD profiles extends to the depth of the AW Tmax. The XCTDs both
show the base of the SML as 6-7 m deeper than the CTD, and the difference between the depths of
the XCTD and CTD profiles increases with depth to about 15 m by the depth of the AW Tmax
(figure 8).
Figure 8. Complete (left) and upper water column (right) profiles of potential temperature (θ) in °C
for the 2 XCTDs deployed close to the North Pole, together with NPEO 2011 aerial survey CTD
cast that was closest to the pole. The date and location of the NPEO CTD cast are shown in Table
2.
15
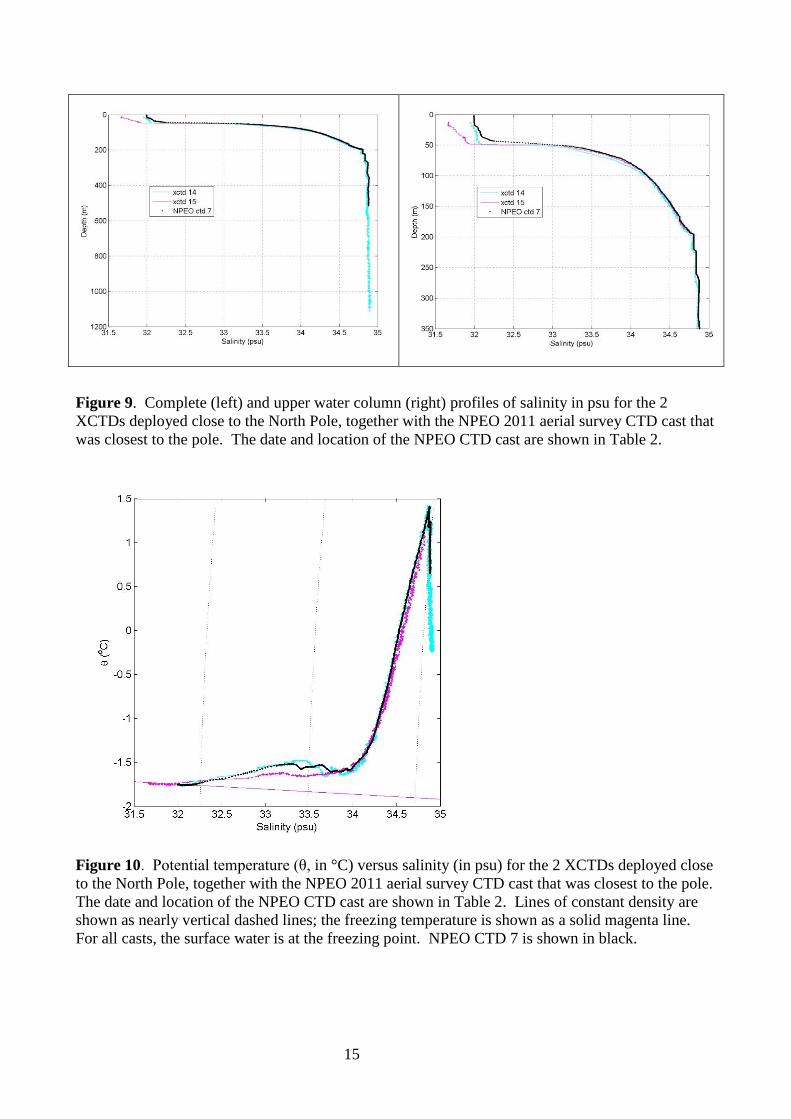
Figure 9. Complete (left) and upper water column (right) profiles of salinity in psu for the 2
XCTDs deployed close to the North Pole, together with the NPEO 2011 aerial survey CTD cast that
was closest to the pole. The date and location of the NPEO CTD cast are shown in Table 2.
Figure 10. Potential temperature (θ, in °C) versus salinity (in psu) for the 2 XCTDs deployed close
to the North Pole, together with the NPEO 2011 aerial survey CTD cast that was closest to the pole.
The date and location of the NPEO CTD cast are shown in Table 2. Lines of constant density are
shown as nearly vertical dashed lines; the freezing temperature is shown as a solid magenta line.
For all casts, the surface water is at the freezing point. NPEO CTD 7 is shown in black.
16
3c. Sensor Resolution
Below the depth of the AW temperature maximum, salinity is nearly constant with increasing depth
in the upper 1000 m of the Arctic Ocean. In this regime, much of the salinity variability is expected
to be below the resolution and accuracy of the XCTD sensors. However, within the constant T/S
steps found widely across the Arctic Ocean in the thermocline above the core of the AW, the
relatively coarse resolution of the XCTD sensors is a limiting factor in the accuracy of the derived
properties, salinity and density (table 4). In the T/S steps observed in the North Pole profiles
(figures 8-10, and close ups in figures 11-13), the resolution of the XCTD temperature and
conductivity sensors is apparent as the ‘least count noise’ in the constant T-S layer. Note that
constant temperature and conductivity result in a lower salinity at 220 m than at 200 m depth, and
thus an apparent inversion in density. This is a result of the equation of state: specifically the
pressure dependence of conductivity causes the conductivity to increase by a small amount with
depth (pressure) within such a layer of constant temperature and salinity. In the case of the XCTD
data from within constant T/S layers, the small increase in conductivity with depth is below the
resolution of the conductivity sensor (i.e., the threshold for a change in conductivity value), and
thus the derived salinity and density are inverted (decrease with increasing depth) within this layer
(figures 11 and 12). This resolution-dependent salinity inversion is also manifest as a horizontal
distribution of points in the T/S profile for the depth region of the T/S layers (figure 13)
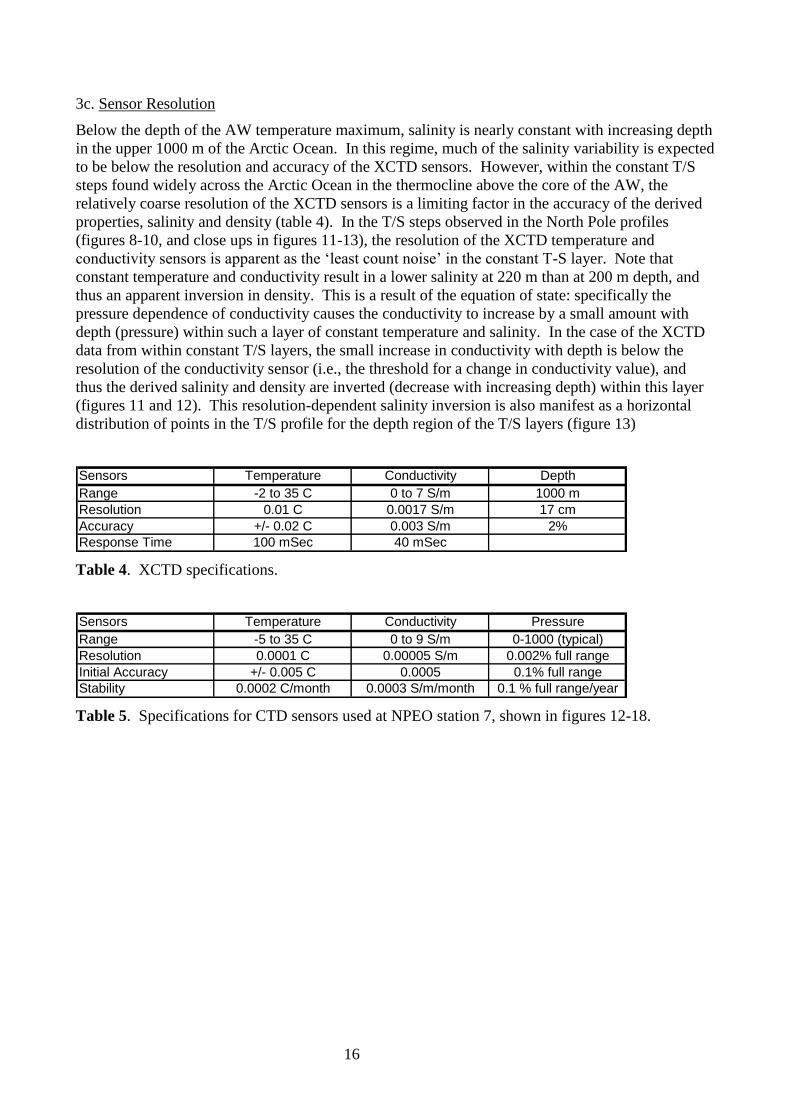
Sensors Temperature Conductivity Depth
Range -2 to 35 C 0 to 7 S/m 1000 m
Resolution 0.01 C 0.0017 S/m 17 cm
Accuracy +/- 0.02 C 0.003 S/m 2%
Response Time 100 mSec 40 mSec
Table 4. XCTD specifications.
Sensors Temperature Conductivity Pressure
Range -5 to 35 C 0 to 9 S/m 0-1000 (typical)
Resolution 0.0001 C 0.00005 S/m 0.002% full range
Initial Accuracy +/- 0.005 C 0.0005 0.1% full range
Stability 0.0002 C/month 0.0003 S/m/month 0.1 % full range/year
Table 5. Specifications for CTD sensors used at NPEO station 7, shown in figures 12-18.
17
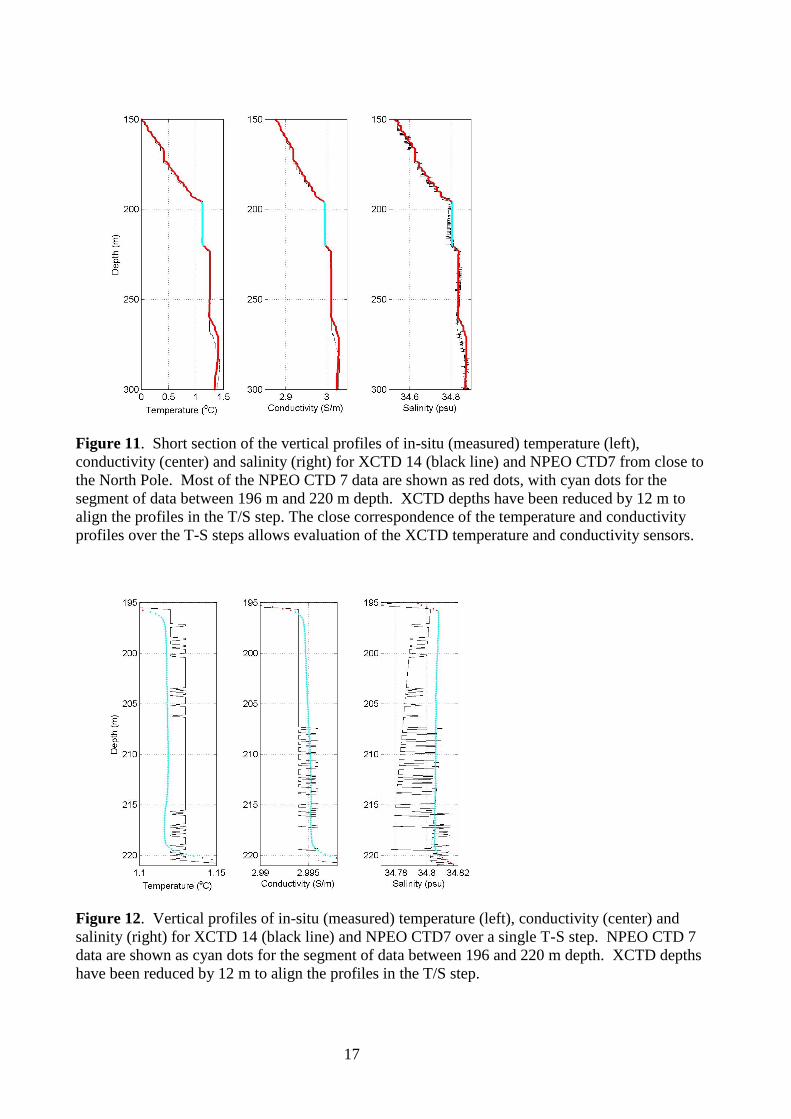
Figure 11. Short section of the vertical profiles of in-situ (measured) temperature (left),
conductivity (center) and salinity (right) for XCTD 14 (black line) and NPEO CTD7 from close to
the North Pole. Most of the NPEO CTD 7 data are shown as red dots, with cyan dots for the
segment of data between 196 m and 220 m depth. XCTD depths have been reduced by 12 m to
align the profiles in the T/S step. The close correspondence of the temperature and conductivity
profiles over the T-S steps allows evaluation of the XCTD temperature and conductivity sensors.
Figure 12. Vertical profiles of in-situ (measured) temperature (left), conductivity (center) and
salinity (right) for XCTD 14 (black line) and NPEO CTD7 over a single T-S step. NPEO CTD 7
data are shown as cyan dots for the segment of data between 196 and 220 m depth. XCTD depths
have been reduced by 12 m to align the profiles in the T/S step.

18
Figure 13. Potential temperature (θ, in °C) versus salinity (in psu) for XCTD 14 and NPEO CTD7.
Lines of constant density are shown as dashed lines. XCTD 14 data are shown as black dots. Most
NPEO CTD 7 data are shown as red dots, with cyan dots for the segment of data between 196 m
and 220 m depth.
3d. Reliability: Depth Range Profiled
At the time of XCTD procurement, the test specification was for an open-water test of the sensors
and data acquisition (DAQ) software. During the open-water test cruise in December 2010, ASL
had the opportunity to launch only 4 of 16 XCTD probes procured for this purpose. Two of these
probes failed the pre-launch tests, and the remaining 2 returned data (see Table 1). Failure to
provide the correct software version may have contributed to the failure of the DAQ software to
record data to the full design depth of 1000m for one of the probes used the in December 2010 open
water test. Twelve of the initial 16 probes were reserved for future use in ICEX-11 in the Arctic
Ocean.
During the ICEX-11 testing in the Arctic Ocean, 4 of 12 probes failed pre-launch tests and
consequently were not launched, 7 of 8 probes launched returned data, and 5 of those 7 returned
data to the full design depth (1100 m).
4. CONCLUSIONS AND RECOMMENDATIONS
For the XCTDs considered in this test, the sensor resolution has been found to be as specified by the
manufacturer. Within the limits of our ability to determine XCTD sensor accuracy with the ICEX-

19
11 XCTD data in conjunction with APLIS and NPEO CTD cast data, XCTD sensor accuracy was
found to be within the bounds specified by the manufacturer. Within the Arctic Ocean, the
relatively coarse resolutions of the XCTD temperature and conductivity sensors limit the ability of
XCTDs to resolve: (1) small scale variations associated with T/S steps in the upper ocean, and (2)
salinity variability beneath the depth of the AW temperature maximum. Nevertheless, these probes
have sufficient resolution to resolve shifts in character and distribution of large scale water masses
responsible for the major heat and freshwater features in the upper ocean. Errors in derived depth
remain an issue to be resolved for these XCTD probes. Although detailed treatment of depth errors
was beyond the scope of this report, feature comparison (Table 3) suggests that XCTD depths are
biased by up to +10 m relative to CTD pressure sensor results for much of the depth range sampled.
Reliability of probes remains an open issue: the high rate of failure of probes (out-of-the-box) to
pass pre-launch tests is unacceptable. In contrast, the vast improvement in the rate of success for
probes to achieve the designed maximum depth leads to the conclusion that this no longer a
systematic problem
Three recommendations follow from the results of the ICEX-11 testing:
1. The significant increase from 2009 in the fraction of probes which failed the pre-launch test is a
problem that must be resolved prior to significant additional investment in submarine-based XCTD
sampling. At this point it is not known whether the ‘failed’ probes were really bad, or whether this
was a case of misidentification of flawed probes during the pre-launch process. Further testing of
the ICEX-11 failed probes is not possible as these were not retained for analysis by the
manufacturer, Sippican. In the future, all U/ISSXCTD probes that fail pre-launch testing should be
retained for future analysis.
2. The significant increase in the fraction of probes to achieve the designed maximum depth since
the implementation of the data acquisition software revision indicates that this should no longer be
considered a systematic problem and should no longer represent an impediment to increased
submarine-based XCTD sampling.
3. The consistently deep bias (+10 m) of XCTD-derived feature depths relative to CTD measured
depths suggests that the XCTD fall rate equation routinely underestimates the deceleration of the
probe falling through the water column. The XCTD fall rate coefficients require further attention to
reduce or eliminate this bias.
5. REFERENCES
Interagency Arctic Research Policy Committee (2007), Arctic Observing Network: Toward a US Contribution
to Pan-Arctic Observing. Arctic Research of the United States, vol. 21, National Science Foundation,
Arlington, VA, 94 pp.
Itoh, M., E. Carmack, K. Shimada, F. McLaughlin, S. Nishino, and S. Zimmerman (2007), Formation and
spreading of Eurasian source oxygen-rich halocline water into the Canadian Basin in the Arctic Ocean,
Geophys. Res. Lett., 34, L08603, doi:10.1029/2007GL029482.
Jakobsson, M., R. Macnab, L. Mayer, R. Anderson, M. Edwards, J. Hatzky, H. W. Schenke, and P.
Johnson (2008), An improved bathymetric portrayal of the Arctic Ocean: Implications for ocean
modeling and geological, geophysical and oceanographic analyses, Geophys. Res. Lett.,
doi:10.1029/2008gl033520

20
Morison, J., M. Steele, T. Kikuchi, K. Falkner, and W. Smethie (2006), The relaxation of central
Arctic Ocean hydrography toward pre-1990’s climatology, Geophys. Res. Lett., 33, L17604,
doi:10.1029/2006GL026826.
Polyakov, I. V., L. A. Timokhov, V. A. Alexeev, S. Bacon, I. A. Dmitrenko, L. Fortier, J.-C. Gascard,
E. Hansen, V. V. Ivanov, S. Laxon, C. Mauritzen, D. Perovich, K. Shimado, H. L. Simmons, V. T.
Sokolov, M. Steele, and J. Toole (2010) Arctic Ocean warming contributes to reduced polar ice cap,
J. Phys. Oceanogr., 40, 2743-2756, doi:10.1175/2010JPO4339.1.
Shimada, K., E. C. Carmack, K. Hatakeyama, and T. Takizawa (2001), Varieties of shallow temperature
maximum waters in the western Canadian Basin of the Arctic Ocean, Geophys. Res. Lett., 28, 3441-3444.
SCICEX Science Advisory Committee (2010), SCICEX Phase II Science Plan, Part I: Technical Guidance for
Planning Science Accommodation Missions, US Arctic Research Commission, Arlington, VA, 76 pp.
Steele, M., J. Morison, W. Ermold, I. Rigor, M. Ortmeyer, and K. Shimada (2004), Circulation of summer
Pacific halocline water in the Arctic Ocean, J. Geophys. Res., 109, doi:10.1029/2003JC002009.
Task Force Climate Change / Oceanographer of the Navy (2009), U.S. Navy Arctic Roadmap, Vice Chief of
Naval Operations, Washington, D.C., 32 pp.

21
APPENDIX 1: Header from Sippican Export Data File (EDF)
// MK21 EXPORT DATA FILE (EDF)
// File Information
Raw Data Filename: D:\Documents and Settings\jeffrey.GOSSETT\Desktop\Mod XCTDs\XCTD
06.RDF
// System Information
Units : Metric
// Probe Information
Probe Type : SSXCTD-1
Terminal Depth : 1100 m
Depth Equation : Standard
Depth Coeff. 1 : 0.0
Depth Coeff. 2 : 3.425432
Depth Coeff. 3 : -0.00047
Depth Coeff. 4 : 0.0
// Launch Information
Num Info Fields : 6
Date of Launch : 03/15/2011
Time of Launch : 22:07:33
Sequence Number : 6
Latitude :
Longitude :
Serial Number : 10058867
// Memo
// Hardware
MK21 Device : Default
// Information - XCTD
// Calibration Coefficients - XCTD
Cal Coeff State : Original
Temperature1 : -5.866000E-02
Temperature2 : 9.945160E-01
Temperature3 : 0.000000E+00
Temperature4 : 0.000000E+00
Conductivity1 : -8.574220E-02
Conductivity2 : 1.040820E+00
Conductivity3 : 0.000000E+00
Conductivity4 : 0.000000E+00
// Post-Processing
Operations : None
// Data Fields
Num Data Fields : 9
Field1 : Time (sec)
Field2 : Frame
Field3 : Depth (m)
Field4 : Temperature (°C)
Field5 : Conductivity (mS/cm)
Field6 : Salinity (ppt)
Field7 : Sound Velocity (m/s)
Field8 : Density (kg/m³)

22
Field9 : Status
// Data
0.000 96C05E67 0.0000 -1.50 22.11 27.28 1438.82 1021.87 8000
0.040 96C05EAD 0.1370 -1.49 22.11 27.27 1438.81 1021.87 8000
0.080 96C45E59 0.2740 -1.50 22.13 27.30 1438.85 1021.89 8000
.
336.640 9E387FF1 1099.8400 -0.07 29.40 34.89 1466.73 1033.24 8000
336.680 9E387FF1 1099.9644 -0.07 29.40 34.89 1466.73 1033.24 8000
336.720 9E347FD6 1100.0887 -0.07 29.39 34.89 1466.73 1033.24 8000