Embed Size (px)
Citation preview
Copyright © 2015 Boeing. All rights reserved.Copyright © 2015 Boeing. All rights reserved. Author, 1/5/2016, Filename.ppt | 1
Jeanne Mason, Associate Technical Fellow, Boeing Propulsion Engine OperabilityMelissa Bravin, Boeing Propulsion Engine OperabilityErick Hall, Boeing Flight Operations Engineering
Ice Crystal Icing –Detection & Avoidance Research
Copyright © 2015 Boeing. All rights reserved.
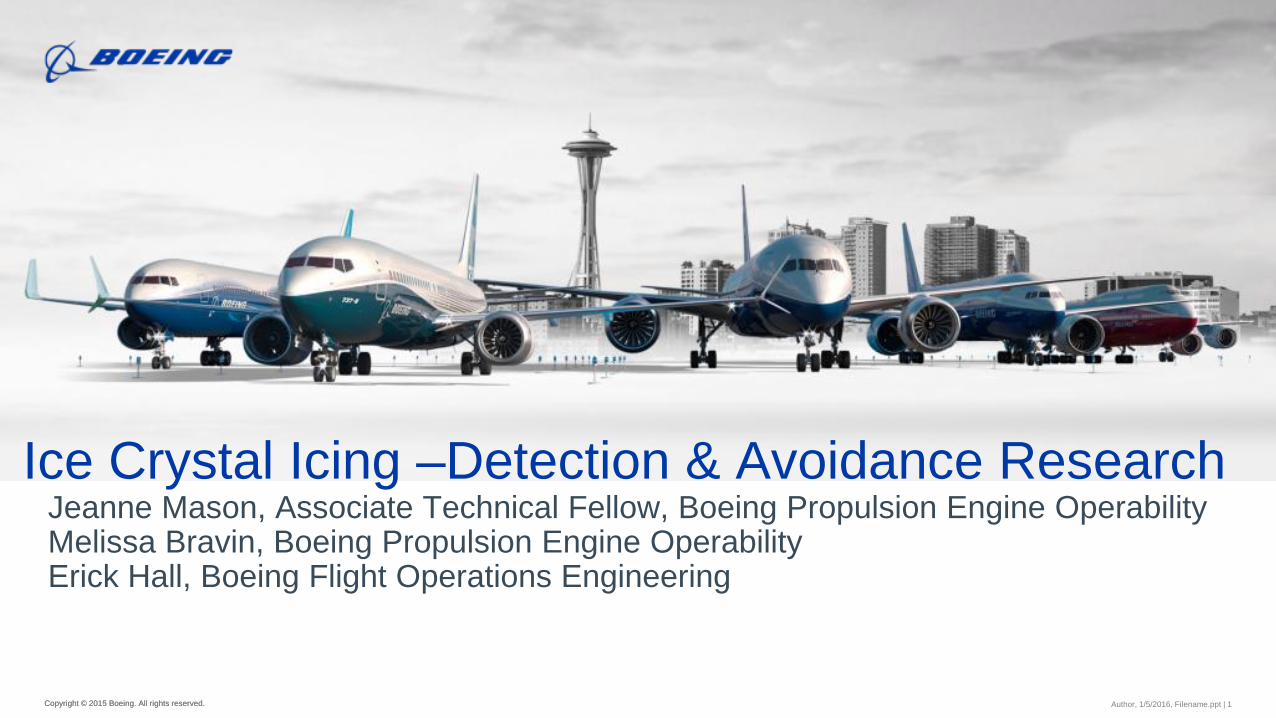
Ice Crystal Icing – Ice on the Engine Core Flowpath
Fan
Ice shed from compressor surfaces can cause engine instability
Physics:• Crystals can form ice on engine surfaces warmer than freezing• These warm engine surfaces are in the compressor (aft of the fan)
Potential ice crystal accretion areas
Core air travels downstream to the combustor
Copyright © 2015 Boeing. All rights reserved.Copyright © 2011 Boeing. All rights reserved.
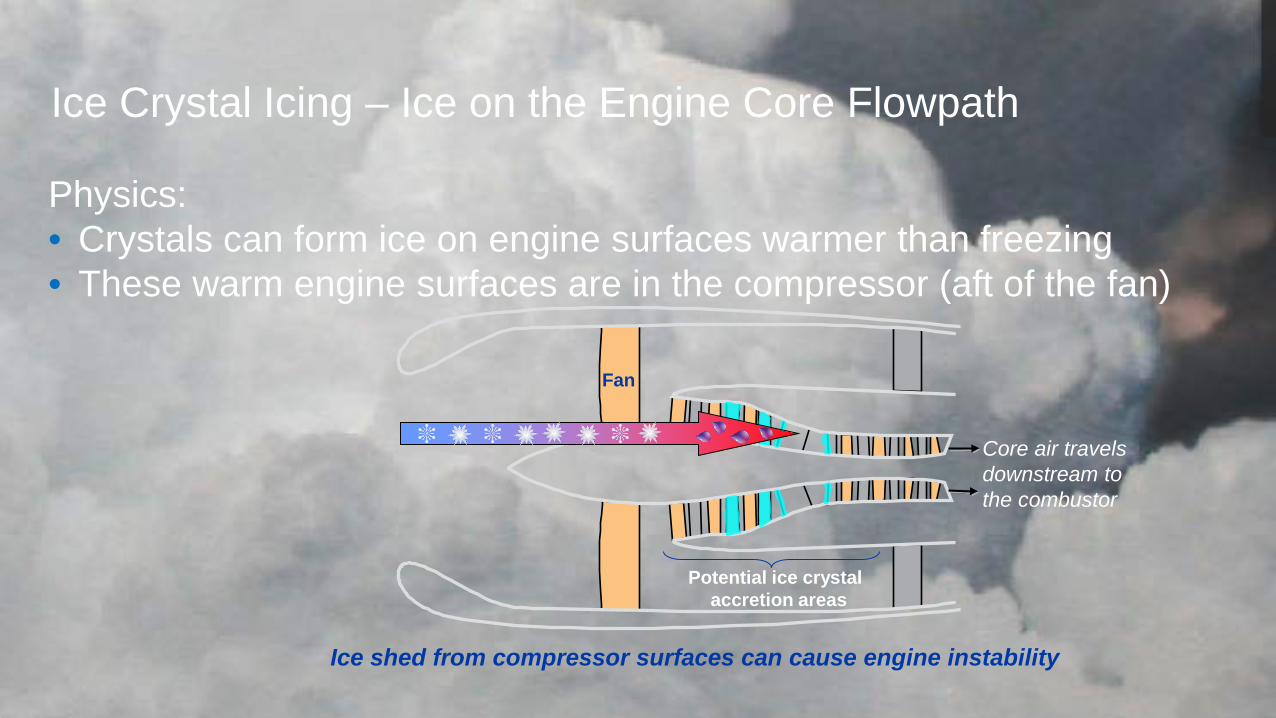
Ice Crystals Characteristics80% of all events - few or no returns at flight levelAmber and red returns below the aircraft Low updraft velocity, light to moderate turbulenceAircraft in deepest (tallest) part of the cloudClouds can spread out hundreds of miles
Freezing level
TropopauseMany engine events occur without flight-level weather radar returns
Copyright © 2015 Boeing. All rights reserved.
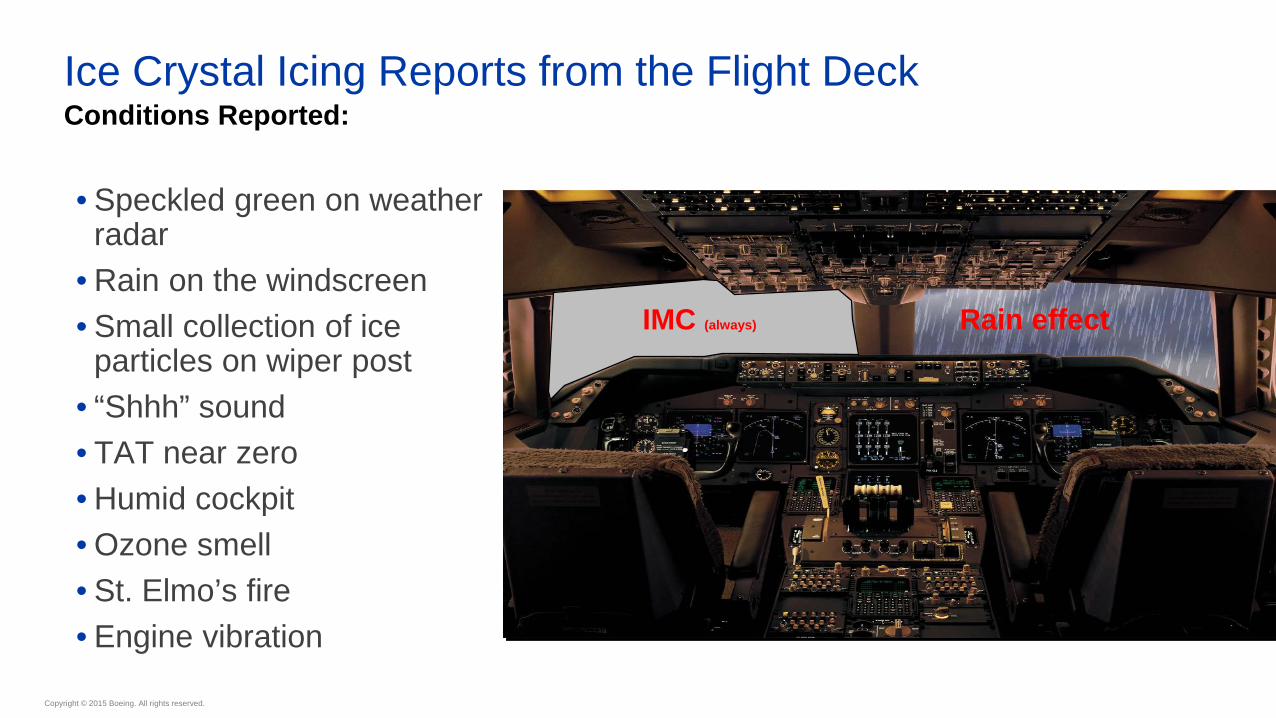
Ice Crystal Icing Reports from the Flight DeckConditions Reported:
• Speckled green on weather radar
• Rain on the windscreen• Small collection of ice
particles on wiper post• “Shhh” sound• TAT near zero• Humid cockpit• Ozone smell• St. Elmo’s fire• Engine vibration
IMC (always) Rain effect
Copyright © 2015 Boeing. All rights reserved.
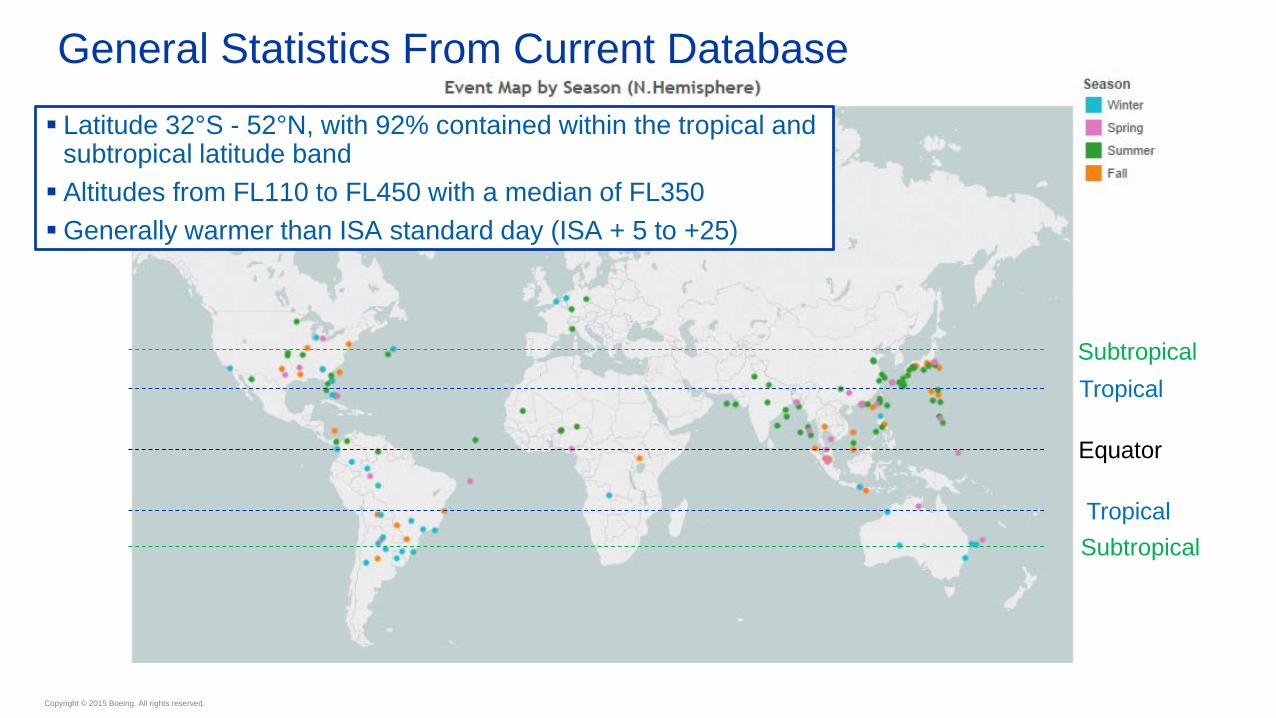
Equator
Tropical
TropicalSubtropical
Subtropical
General Statistics From Current Database Latitude 32°S - 52°N, with 92% contained within the tropical and
subtropical latitude band Altitudes from FL110 to FL450 with a median of FL350Generally warmer than ISA standard day (ISA + 5 to +25)
Copyright © 2015 Boeing. All rights reserved.
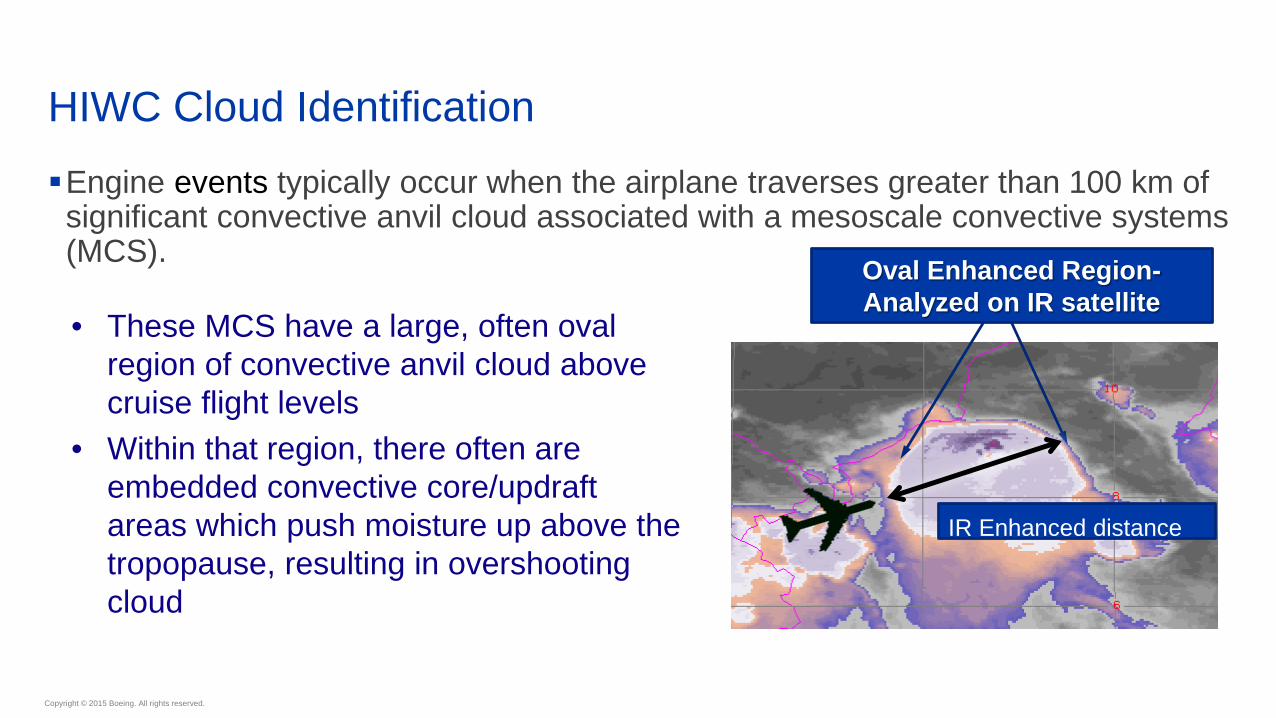
HIWC Cloud IdentificationEngine events typically occur when the airplane traverses greater than 100 km of
significant convective anvil cloud associated with a mesoscale convective systems (MCS).
• These MCS have a large, often oval region of convective anvil cloud above cruise flight levels
• Within that region, there often are embedded convective core/updraft areas which push moisture up above the tropopause, resulting in overshooting cloud
Oval Enhanced Region-Analyzed on IR satellite
IR Enhanced distance
Copyright © 2015 Boeing. All rights reserved.
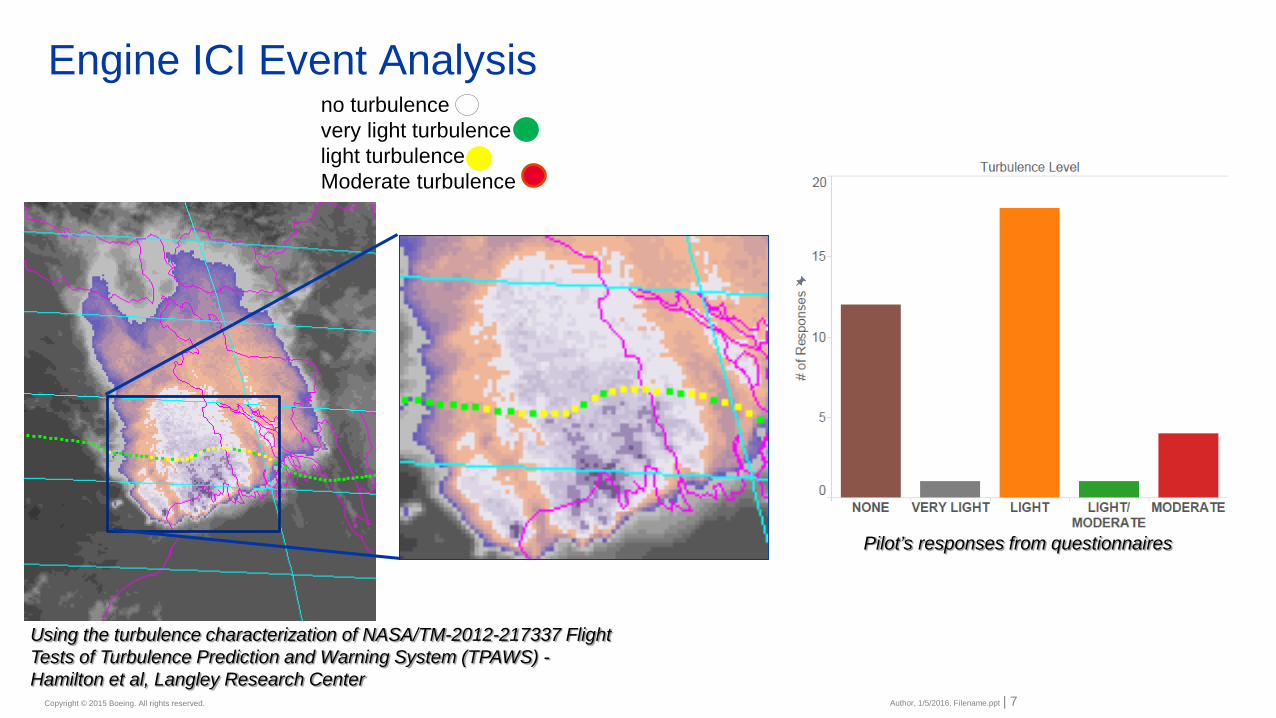
Engine ICI Event Analysis
Author, 1/5/2016, Filename.ppt | 7
no turbulencevery light turbulencelight turbulenceModerate turbulence
Using the turbulence characterization of NASA/TM-2012-217337 Flight Tests of Turbulence Prediction and Warning System (TPAWS) -Hamilton et al, Langley Research Center
Pilot’s responses from questionnaires
Copyright © 2015 Boeing. All rights reserved.
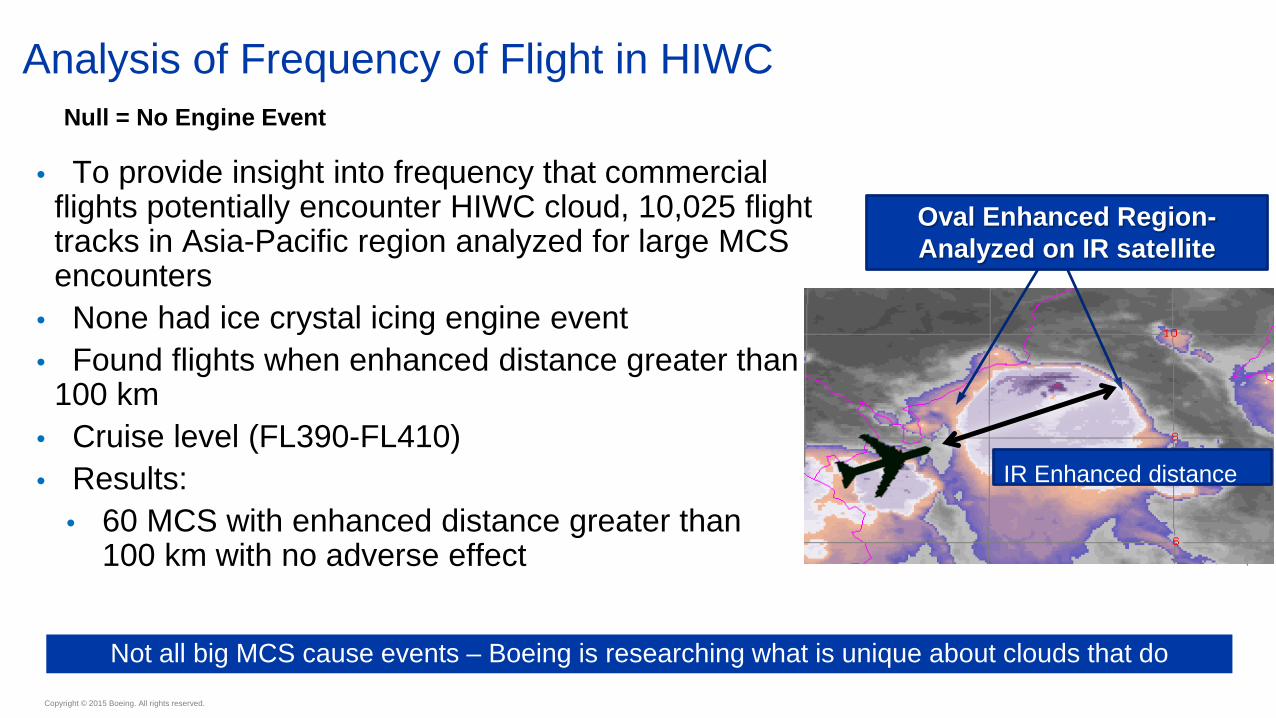
• To provide insight into frequency that commercial flights potentially encounter HIWC cloud, 10,025 flight tracks in Asia-Pacific region analyzed for large MCS encounters
• None had ice crystal icing engine event• Found flights when enhanced distance greater than
100 km • Cruise level (FL390-FL410)• Results:
• 60 MCS with enhanced distance greater than 100 km with no adverse effect Grzych et al| 8
Not all big MCS cause events – Boeing is researching what is unique about clouds that do
Commercial FlightsAnalysis of Frequency of Flight in HIWCNull = No Engine Event
Oval Enhanced Region-Analyzed on IR satellite
IR Enhanced distance
Copyright © 2015 Boeing. All rights reserved.
Convective Maximum
Such regions are hypothesized to be associated with local maximum in ice water content Some convective clouds peak in intensity overnight, diminishing during daytime
hoursCommercial aircraft fly during all hours of the day
–Flight crews have more challenges / fewer cues to identify weather at night, since ice crystals are poor reflectors of radar energy
Flight test measurements will be taken only in day-time hours for safety reasons
SAE 2015-01-2130
ICI Event Characteristics
Copyright © 2015 Boeing. All rights reserved.
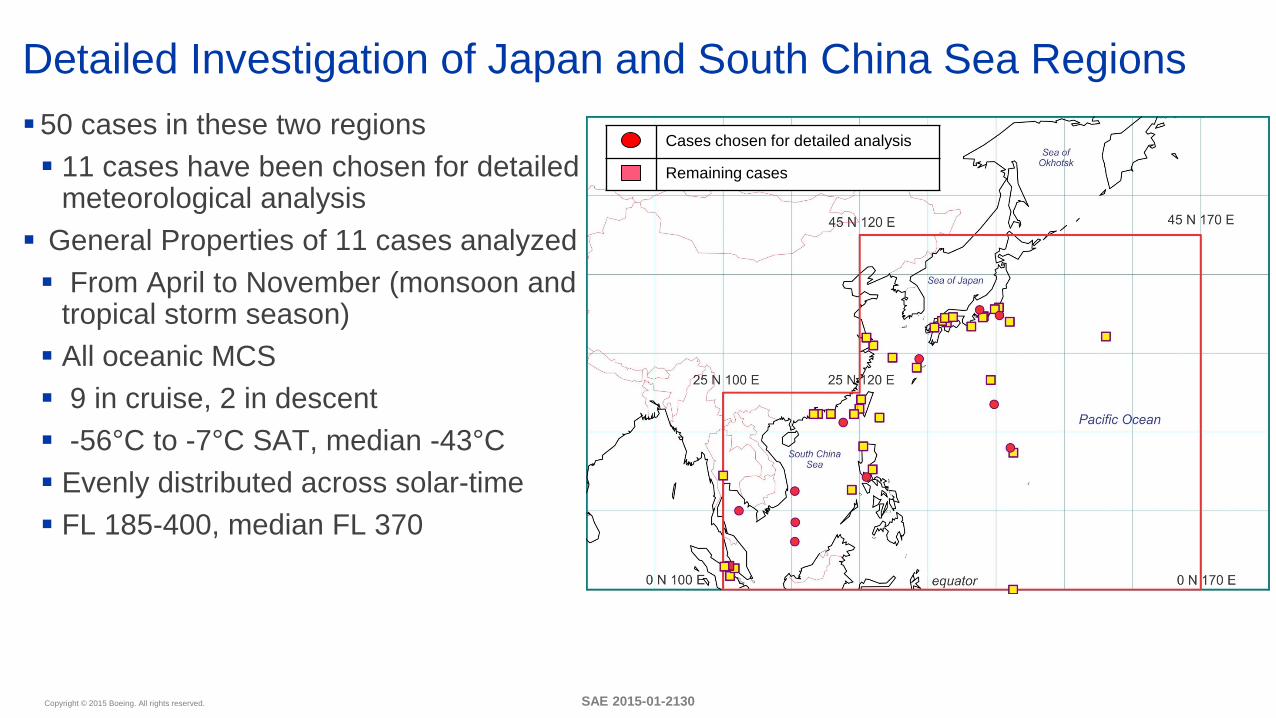
Detailed Investigation of Japan and South China Sea Regions50 cases in these two regions 11 cases have been chosen for detailed
meteorological analysis General Properties of 11 cases analyzed From April to November (monsoon and
tropical storm season) All oceanic MCS 9 in cruise, 2 in descent -56°C to -7°C SAT, median -43°C Evenly distributed across solar-time FL 185-400, median FL 370
Cases chosen for detailed analysis
Remaining cases
SAE 2015-01-2130
Copyright © 2015 Boeing. All rights reserved.
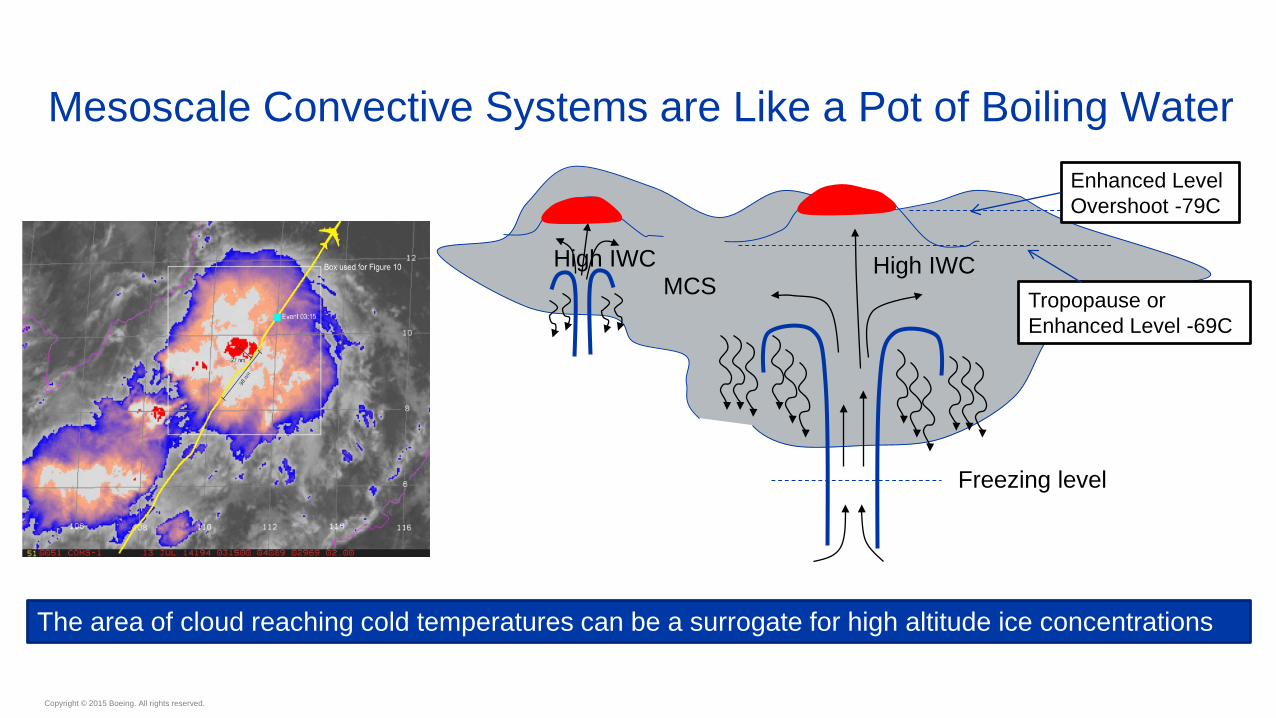
The area of cloud reaching cold temperatures can be a surrogate for high altitude ice concentrations
Mesoscale Convective Systems are Like a Pot of Boiling Water
MCS
Freezing level
Tropopause or Enhanced Level -69C
Enhanced Level Overshoot -79C
High IWCHigh IWC
Copyright © 2015 Boeing. All rights reserved.
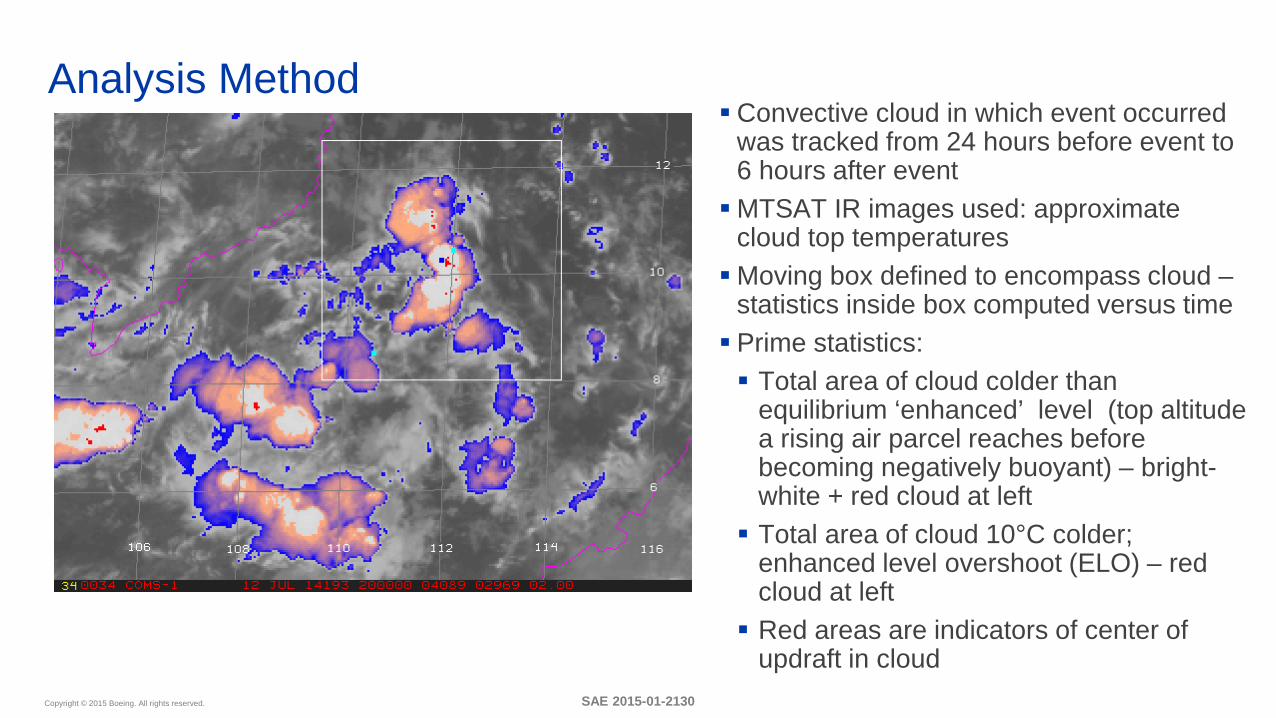
Analysis MethodConvective cloud in which event occurred
was tracked from 24 hours before event to 6 hours after eventMTSAT IR images used: approximate
cloud top temperaturesMoving box defined to encompass cloud –
statistics inside box computed versus time Prime statistics: Total area of cloud colder than
equilibrium ‘enhanced’ level (top altitude a rising air parcel reaches before becoming negatively buoyant) – bright-white + red cloud at left Total area of cloud 10°C colder;
enhanced level overshoot (ELO) – red cloud at left Red areas are indicators of center of
updraft in cloudSAE 2015-01-2130
Copyright © 2015 Boeing. All rights reserved.
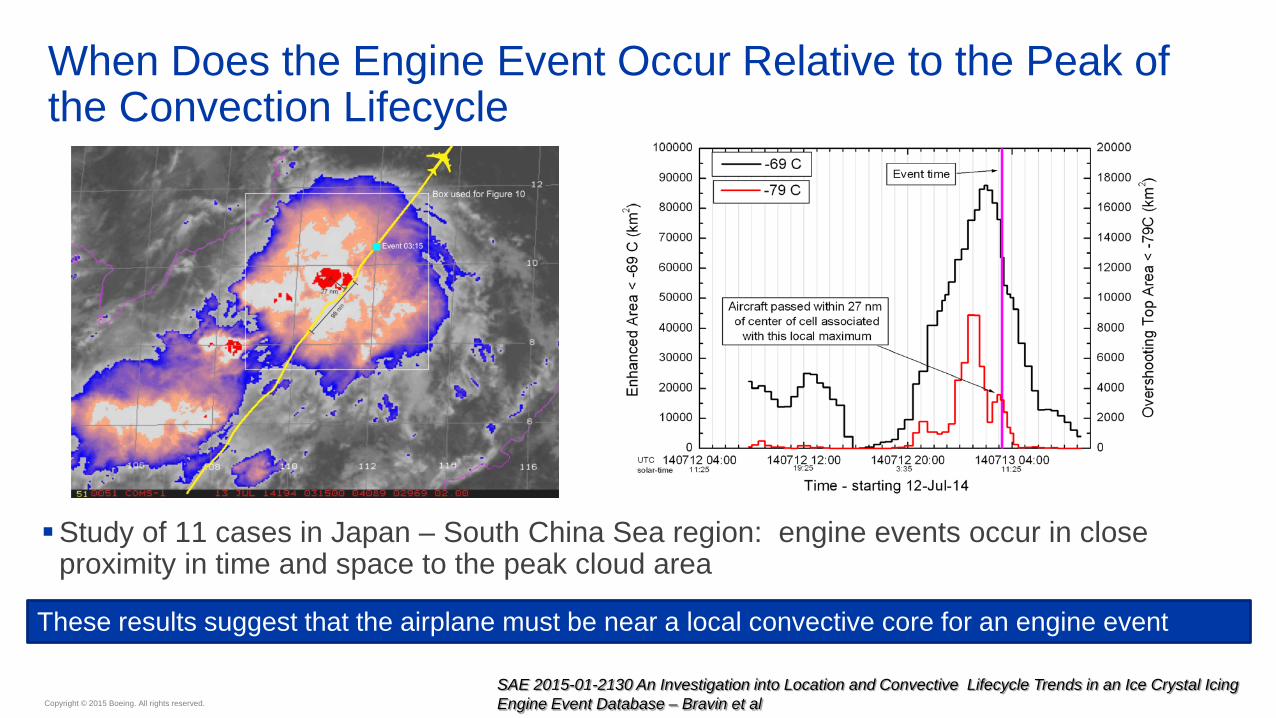
These results suggest that the airplane must be near a local convective core for an engine event
SAE 2015-01-2130 An Investigation into Location and Convective Lifecycle Trends in an Ice Crystal Icing Engine Event Database – Bravin et al
When Does the Engine Event Occur Relative to the Peak of the Convection Lifecycle
Study of 11 cases in Japan – South China Sea region: engine events occur in close proximity in time and space to the peak cloud area
Copyright © 2015 Boeing. All rights reserved.
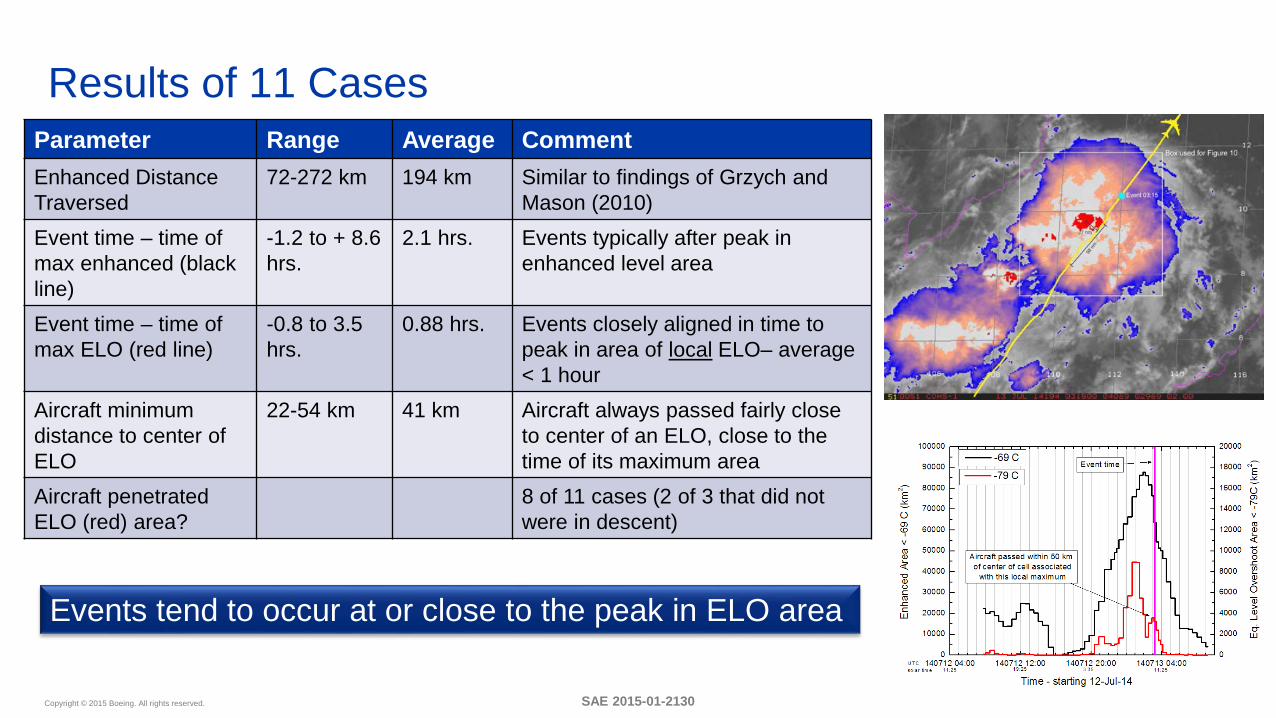
Results of 11 CasesParameter Range Average CommentEnhanced Distance Traversed
72-272 km 194 km Similar to findings of Grzych and Mason (2010)
Event time – time of max enhanced (black line)
-1.2 to + 8.6hrs.
2.1 hrs. Events typically after peak in enhanced level area
Event time – time of max ELO (red line)
-0.8 to 3.5hrs.
0.88 hrs. Events closely aligned in time to peak in area of local ELO– average < 1 hour
Aircraft minimum distance to center of ELO
22-54 km 41 km Aircraft always passed fairly close to center of an ELO, close to the time of its maximum area
Aircraft penetratedELO (red) area?
8 of 11 cases (2 of 3 that did not were in descent)
Events tend to occur at or close to the peak in ELO area
SAE 2015-01-2130
Copyright © 2015 Boeing. All rights reserved.
SummaryBoeing database has been updated from Mason et al. (2006) with 46 events to
current 162 eventsTypes of clouds, temperature levels, and length of cloud traversed similar to
previous studies Regional influences hard to identify due to low frequencies in each regionNo evidence overall of a time-of-day bias in events, even though research
literature reports time-of-day influences on deep convective cloud frequenciesMost significant new finding is that events occur in MCS close to a local active cell
near the time of its peak intensity, identified herein as an "Enhanced Level Overshoot" (ELO). Time of the event ELO may be quite different from the time of the MCS system overall peak intensity
15ICE-0113

Copyright © 2015 Boeing. All rights reserved.