Embed Size (px)
Citation preview
8/13/2019 ICCT Comments on RFS2 2014 renewable fuel volume obligation
http://slidepdf.com/reader/full/icct-comments-on-rfs2-2014-renewable-fuel-volume-obligation 1/20
1225 I Street NW
Suite 900
Washington DC 20005
+1 202.534.1600
www.theicct.org
January 28, 2014
RE: International Council on Clean Transportation comments on “2014 Standards for theRenewable Fuel Standard Program” Notice of Proposed Rulemaking (EPA–HQ–OAR–2013–0479; FRL–9900-90-OAR)
These comments are submitted by the International Council on Clean Transportation (ICCT).The ICCT is an independent nonprofit organization founded to provide unbiased research andtechnical analysis to environmental regulators. Our mission is to improve the environmentalperformance and energy efficiency of road, marine, and air transportation, in order to benefitpublic health and mitigate climate change. We promote best practices and comprehensivesolutions to increase vehicle efficiency, increase the sustainability of alternative fuels, reducepollution from the in-use fleet, and curtail emissions of local air pollutants and greenhouse gases(GHG) from international goods movement.
The ICCT welcomes the opportunity to provide comments on the U.S. EPA Renewable FuelsStandard (RFS) program. We commend the agency for its continuing efforts to promote acleaner, lower-carbon transportation sector that uses less petroleum-based fuels. As we havecommented before, the RFS program has set strong standards with thorough, comprehensivescientific analyses and rigorous life-cycle emission accounting. This proposed rule builds uponthe impressive steps EPA has undertaken to promote low-carbon biofuels. The comments belowoffer a number of technical observations and recommendations for EPA to consider in itscontinued efforts to strengthen the program and maximize the program’s benefits in mitigatingthe risks of climate change and reducing petroleum use.
We would be glad to clarify or elaborate on any points made in the below comments. If there areany questions, EPA staff can feel free to contact Dr. Stephanie Searle ([email protected])and Dr. Chris Malins ([email protected]).
Fanta Kamakaté
Chief Program Officer
International Council on Clean Transportation
8/13/2019 ICCT Comments on RFS2 2014 renewable fuel volume obligation
http://slidepdf.com/reader/full/icct-comments-on-rfs2-2014-renewable-fuel-volume-obligation 2/20
International Council on Clean Transportation comments on “2014 Standards for the
Renewable Fuel Standard Program” Notice of Proposed Rulemaking (EPA–HQ–OAR–2013–0479; FRL–9900-90-OAR)
Summary of comments
ICCT supports EPA’s proposed 2014 volumes of 15.21 billion gallons for renewable fuel, 2.20billion gallons for advanced biofuel, and 1.28 billion gallons for biomass-based diesel, andsupports EPA’s methodology in estimating cellulosic biofuel availability. ICCT also supportsEPA’s intention to consider the amount of ethanol than can reasonably be consumed in futurevolume rulemakings, as this will provide some certainty to all stakeholders. Related to this, thebest approach to fostering certainty and investment in the renewable fuel industry is to proposeas soon as possible a revised compliance schedule for 2016-2022. As a result, the ICCTsupports EPA’s publishing of targets for these later years in a manner that similarly makesadjustments based on the amount of biofuel that will likely be consumed.
EPA’s proposed use of the general waiver authority to waive a fraction of the renewable volumemandated in the statute due to insufficient supply is appropriate and legal, as we understand it.
Our research supports EPA’s conclusion that insufficient infrastructure to deliver ethanol blendsabove 10% presents a real and significant barrier to meeting a total renewable fuel volumeabove 15.21 billion gallons. While E85 consumption can be expected to increase with greaterprice support, we present an analysis showing that D6 (renewable) RIN prices would likely needto rise above $1/RIN to provide a real financial incentive for the installation of new E85 stations.Using different assumptions, this threshold D6 RIN price could be much higher. Such anoutcome would impose a significant burden on obligated parties and consumers. Our analysis issimple and relies on several assumptions, but provides an indication that increased deploymentof E85 is unlikely to be easily achieved through increasing the 2014 renewable fuel volumeabove EPA’s proposal.
EPA has proposed that carryover RINs not be considered in setting volumes for 2014.Carryover RINs provide an important flexibility mechanism to obligated parties, helping toreduce the impact on the RFS2 program and the alternative fuel and RIN markets in the event ofdrought or other unexpected compliance issues. Given these, we see no need reason for EPAto actively seek to draw down RIN stocks by increasing volume obligations.
EPA’s approach in proposing to reduce the advanced biofuel volume along with the reduction incellulosic biofuel volume for 2014 is appropriate and provides a clear steer that the slowcommercialization of cellulosic fuel will not lead to a vast increase in the mandate for firstgeneration advanced fuels. EPA’s proposal to set the 2015 biomass-based diesel volume at thistime will provide a clear and timely signal to all stakeholders. The proposed biomass-baseddiesel volume of 1.28 billion gallons (1.92 billion ethanol equivalent gallons) is appropriate and
allows flexibility for obligated parties to use the best value advanced biofuel pathways to meettheir obligations. The biodiesel tax credit has expired and is unlikely to be renewed early enoughin 2104 to support production of biomass-based diesel this year; without this tax credit,biomass-based diesel prices and D4 (biomass-based diesel) RIN prices are likely to rise. Inaddition, increasing demand for waste oils in the EU may divert some of this feedstock from theU.S., limiting availability to meet the 2014-15 biomass-based diesel requirements. For all thesereasons, the biomass-based diesel requirement should not be raised above 1.28 billion gallonsin 2014 and 2015.
8/13/2019 ICCT Comments on RFS2 2014 renewable fuel volume obligation
http://slidepdf.com/reader/full/icct-comments-on-rfs2-2014-renewable-fuel-volume-obligation 3/20
We support EPA’s methodology in determining the cellulosic volume. We request that if EPAapproves the proposed pathway for cellulosic RINs from landfill biogas in 2014, they then addthe projected volume of this pathway to the cellulosic biofuel volume already proposed for the2014 standard.
Renewable fuel volume
ICCT supports EPA’s proposal for a total renewable fuel volume of 15.21 billion gallons in 2014.We agree that the limited capacity of infrastructure to deliver ethanol to vehicles is a real andserious barrier to meeting the original statutory volume for total renewable fuel in 2014.
ICCT also agrees with EPA’s intention to use the proposed framework to calculate volumes insubsequent years. Using this consistent and reasonable approach would provide valuableregulatory certainty to obligated parties, fuel producers, farmers and ranchers, and allstakeholders in the U.S. agricultural, energy, and transportation sectors. This pragmaticapproach is the right way forward to preserve the original intent of the Renewable Fuel StandardProgram and achieve meaningful greenhouse gas reductions without undue burden onstakeholders and the U.S. economy.
Legal basis for general waiver authority
As the ICCT understands it, EPA’s use of the general waiver authority to reduce the volumeof total renewable fuel in 2014 is appropriate and is a proportionate response to thechallenge represented by the blend wall in particular. In legal terms, we believe that the‘absurdity doctrine’ can be applied here. The current situation in which the blendwallprovides a clear limit on the rate at which the use of ethanol in American vehicles can beincreased means that mandating excessive volumes would result in excessive RIN prices,market distortions and undesirable outcomes. We do not believe that it is the intent of the
law to force higher blends of ethanol into the market at unlimited speed and cost, and atexcessive risk to older vehicles and warranties. Congress included the “inadequate supply”clause in the creation of the RFS program under EPACT05 and we presume they did so inorder to prevent a malfunctioning program, as characterized by unreasonably high RINprices and unachievable mandates for obligated parties. Whether “inadequate supply”occurs directly due to limitations of agriculture or processing, or indirectly due to lack ofcapacity to bring fuels to market, the effect on business and consumers will be comparable.EPA is therefore correct in applying a broad interpretation of “inadequate domestic supply”to include the situation where the statutory volumes of total renewable fuel cannotreasonably be supplied to market.
The blendwall
There are currently real impediments to both the supply and use of ethanol blends higherthan E10. Supply constraints include limited availability of E85 pumps and very limitedavailability of E15 pumps and storage tanks due to installation cost, certification issues, andthe need for more robust misfueling controls. The use of higher ethanol blends isconstrained by relatively low penetration of flex-fuel vehicles (FFVs), low consumerawareness and demand, and warranty issues in non-flex fuel vehicles.
8/13/2019 ICCT Comments on RFS2 2014 renewable fuel volume obligation
http://slidepdf.com/reader/full/icct-comments-on-rfs2-2014-renewable-fuel-volume-obligation 4/20
E85 supply has remained low compared to total fuel consumption by gasoline-poweredvehicles. Only about 1% of gasoline stations in the U.S. offer E85 (calculated fromAlternative Fuels Data Center, 2012; Department of Energy, 2004). Another major factor isthe geographic mismatch between E85 stations (located in the Midwest) and FFVs (moredisbursed, with many in the southern U.S.), as demonstrated by Babcock & Pouliot (2013a).
Supply of E15 has been even more limited. Currently, E15 pumps are much less commonthan E85 pumps (Alternative Fuels Data Center, 2013a). Newer gasoline pumps andstorage tanks may be able to serve E15 with few problems (Kass, Theiss, Janke, & Pawel,2012; Kass, Theiss, Janke, Pawel, & Lewis, 2011), and in fact Gilbarco, a majormanufacturer of fuel dispensers, has retroactively extended its warranty for the use of E15in all dispensers sold since 2008(Gilbarco Veeder-Root, 2013). However, UnderwriterLaboratories, a major certifier of fuel dispensers, does not certify any regular gasolinedispensers for use of E15 (Underwriter Laboratories, 2013), and certification of fueldispensers may be required by law, depending on location. According to the testimony ofone fuel station owner at EPA’s public hearing on December 5, 2013, many station ownerslack proper records of their dispensers, storage tanks, and fuel lines, and do not know if
E15 can be safely used in their equipment. So while some existing gasoline dispensers andtanks may technically be E15 compatible, many station owners lack the information andcertification to supply it. Regular gasoline dispensers may be retrofitted to be E15-compatible for a price of around $1,000-4,000 (Domestic Fuel, 2013; Gilbarco Veeder-Root,2013). It is not clear from our research whether underground storage tanks can beaffordably retrofitted, and at the very least they must be cleaned out before storing E15.Although this cost is small relative to the cost of a new dispenser, station owners are likelyreluctant to pay for the retrofit without a clear indication that supplying E15 would boost theiroverall sales, or at least profits.
The use of both E85 and E15 has remained relatively low. Although flex-fuel vehicles aremore common than stations (about 6% of the fleet, calculated from Babcock & Pouliot,
2013b; Larsen, 2013), many FFV owners do not know their vehicle is flex-fuel (AlternativeFuels Data Center, 2013b), and those who do generally exhibit low demand for E85. AsTable 1 shows, on average only about 1% of fuel consumed by FFVs in the U.S. is E85.The data used in Table 1 was only available through 2010, but we can roughly estimate thepercentage of fuel consumed by FFVs that is E85 in 2013 using EPA’s estimate of about100 million gallons E85 consumed in 2013, and an estimate of 15 million FFVs currently inthe U.S. fleet (from Babcock & Pouliot, 2013b) to arrive at about 7 gallons E85 per FFV, orabout 1% of FFV fuel consumption of 650 gallons per year.1 This estimate suggests that theproportion of fuel consumed by FFVs that is E85 has remained very low through thepresent.
1 Assuming a typical annual mileage of 15,000 per vehicle per year and a typical fuel economy of 23 mpg
for new vehicles from EPA’s fuel economy labels.

8/13/2019 ICCT Comments on RFS2 2014 renewable fuel volume obligation
http://slidepdf.com/reader/full/icct-comments-on-rfs2-2014-renewable-fuel-volume-obligation 5/20
Table 1 The RIN price necessary to incentivize faster rollout of E85 stations is
discussed further in the next section. FFV consumption of E85 fuel, vehiclepopulation, and percent E85 usage
YEAR
E85 FUEL
CONSUMPTION
(MILLION
GALLONS) (EIA,2012)
E85 FFV
VEHICLEPOPULATION
(NREL, 2010)
(MILLIONVEHICLES)
ANNUALVOLUME OF E85
USE (GALLONE85/FFV)
ANNUAL E85
CONSUMPTION
BY FFVS, AS %
OF TOTAL FFV
FUEL
CONSUMPTION2
(ORNL, 2012)
1998 2 0.1 12.3 1.4%
1999 4 0.5 8.9 1.0%
2000 12 0.9 13.7 1.6%
2001 15 1.4 10.9 1.3%
2002 18 2.1 8.8 1.0%
2003 26 2.8 9.3 1.1%
2004 32 3.4 9.2 1.1%
2005 38 4.1 9.2 1.1%
2006 44 5.1 8.7 1.1%
2007 54 6.2 8.8 1.1%
2008 62 7.3 8.6 1.1%
2009 71 8.4 8.5 1.1%
2010 90 9.73 9.3 1.1%
But perhaps the main reason that drivers who are aware they own an FFV do not consumemore E85 is that E85 is usually more expensive than gasoline on an energy equivalentbasis. With an average ethanol content of about 75% in E85, this fuel typically has 77% theenergy content per gallon as gasoline. But data from e85prices.com shows that in 2013,
2 Calculated based on annual E85 volume and total fuel use.
3 Estimated from 2010 FFV production from Alternative Fuels Data Center.

8/13/2019 ICCT Comments on RFS2 2014 renewable fuel volume obligation
http://slidepdf.com/reader/full/icct-comments-on-rfs2-2014-renewable-fuel-volume-obligation 6/20
E85 was priced higher than this, on average 85% the price per gallon of gasoline.Economically rational drivers cannot be expected to purchase a fuel that is more expensiveper mile driven. That said, E85 prices may drop if RIN prices rise.
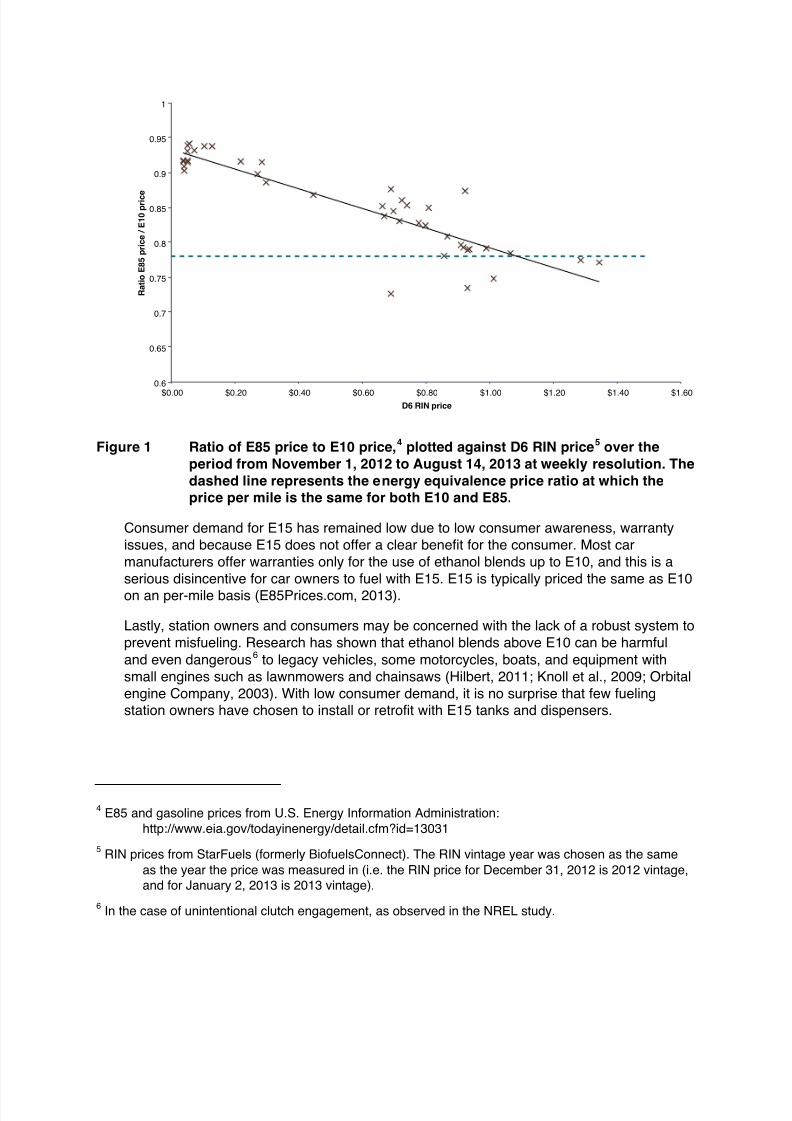
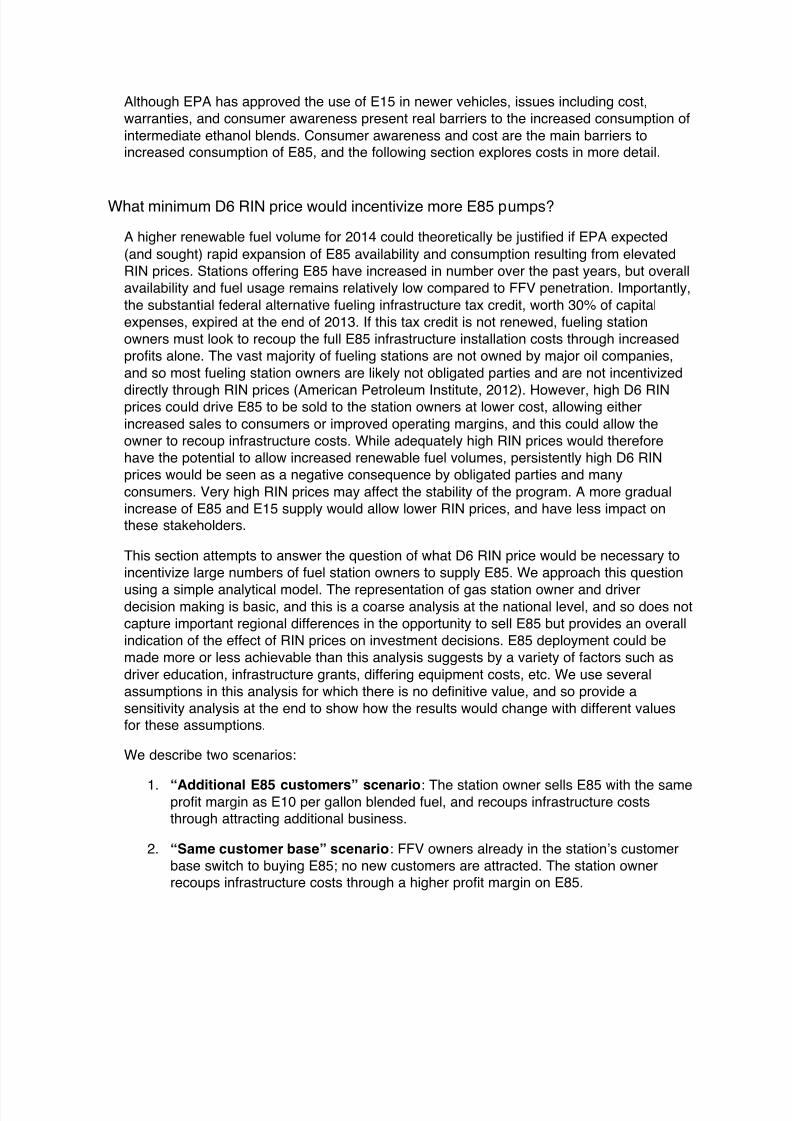
Figure 1 shows the relationship of the E85-to-E10 price on a per-gallon of blended fuelbasis, as indexed to the D6 RIN price over a recent one-year span. We examine the D6 RIN
because the vast majority of ethanol blended into E10 and E85 falls into this category. Datafrom the past year shows that, on a national average, E85 was cheaper per mile than E10for a few weeks. During these weeks of inexpensive E85, the D6 RIN price was relativelyhigh ($0.69-$1.34; data points below the dashed equivalence line in Figure 1). Overall, asignificant negative correlation can be observed between the ratio of E85 price/E10 priceand the D6 RIN price (Equation 1). This suggests that high D6 RIN prices can drive downthe relative price of E85. This correlation suggests that fuel suppliers pass some of thevalue of the RIN to consumers. Fuel blenders who purchase more ethanol receive moreRINs, and these blenders can then sell the detached RINs to other obligated parties,generating revenue. If the cost of ethanol to the blender increases by less than the RINprice, then the fuel blender’s revenue would increase during times of high RIN prices, and
the blender may pass this value on to gasoline stations and consumers by selling blendedE10 or E85 at a lower price in order to attract higher sales. Data from Minnesota(Minnesota Department of Commerce, 2013) that EPA cited in the RFS2 2014 volumesproposal shows that U.S. consumers respond to this price signal; E85 sales increasedwhen its price was lower compared to E10.
Using the data shown in Figure 1, we can build a simple multiple linear regression modelthat projects the D6 RIN price at varying E85/gasoline price ratio:
PD6RIN = (-5.6101 x PE85/PE10) + 5.3537 Equation 1
Where PD6RIN is the price of a D6 RIN, PE85 is the price of E85 and PE10 is the price of E10.The PE85/PE10 coefficient and intercept are both statistically significant at p<0.001, and
R2=0.79. Following this relationship, one could expect E85 to be at price parity with E10when the D6 RIN price is about $1/RIN. Driving a substantial increase in consumer demandfor E85 would likely require noticeable cost savings for motorists using E85, which impliesthat RIN prices somewhat above $1 would be necessary to achieve any large increase inE85 sales. In this context, given the barriers to rapid expansion of the E85 to E15 markets,EPA’s middle estimate of 180 million gallons of E85 consumption in 2014 is reasonable andshould not be set any higher, presuming that D6 RIN prices well in excess of $1 are notconsidered desirable.
8/13/2019 ICCT Comments on RFS2 2014 renewable fuel volume obligation
http://slidepdf.com/reader/full/icct-comments-on-rfs2-2014-renewable-fuel-volume-obligation 7/20
Figure 1 Ratio of E85 price to E10 price,4 plotted against D6 RIN price5 over the
period from November 1, 2012 to August 14, 2013 at weekly resolution. The
dashed line represents the energy equivalence price ratio at which theprice per mile is the same for both E10 and E85.
Consumer demand for E15 has remained low due to low consumer awareness, warrantyissues, and because E15 does not offer a clear benefit for the consumer. Most carmanufacturers offer warranties only for the use of ethanol blends up to E10, and this is aserious disincentive for car owners to fuel with E15. E15 is typically priced the same as E10on an per-mile basis (E85Prices.com, 2013).
Lastly, station owners and consumers may be concerned with the lack of a robust system toprevent misfueling. Research has shown that ethanol blends above E10 can be harmfuland even dangerous6 to legacy vehicles, some motorcycles, boats, and equipment withsmall engines such as lawnmowers and chainsaws (Hilbert, 2011; Knoll et al., 2009; Orbitalengine Company, 2003). With low consumer demand, it is no surprise that few fuelingstation owners have chosen to install or retrofit with E15 tanks and dispensers.
4 E85 and gasoline prices from U.S. Energy Information Administration:
http://www.eia.gov/todayinenergy/detail.cfm?id=13031
5 RIN prices from StarFuels (formerly BiofuelsConnect). The RIN vintage year was chosen as the same
as the year the price was measured in (i.e. the RIN price for December 31, 2012 is 2012 vintage,and for January 2, 2013 is 2013 vintage).
6 In the case of unintentional clutch engagement, as observed in the NREL study.
0.6
0.65
0.7
0.75
0.8
0.85
0.9
0.95
1
$0.00 $0.20 $0.40 $0.60 $0.80 $1.00 $1.20 $1.40 $1.60
R a t i o E 8 5 p r i c e / E 1 0 p r i c e
D6 RIN price
8/13/2019 ICCT Comments on RFS2 2014 renewable fuel volume obligation
http://slidepdf.com/reader/full/icct-comments-on-rfs2-2014-renewable-fuel-volume-obligation 8/20
Although EPA has approved the use of E15 in newer vehicles, issues including cost,warranties, and consumer awareness present real barriers to the increased consumption ofintermediate ethanol blends. Consumer awareness and cost are the main barriers toincreased consumption of E85, and the following section explores costs in more detail.
What minimum D6 RIN price would incentivize more E85 pumps?
A higher renewable fuel volume for 2014 could theoretically be justified if EPA expected(and sought) rapid expansion of E85 availability and consumption resulting from elevatedRIN prices. Stations offering E85 have increased in number over the past years, but overallavailability and fuel usage remains relatively low compared to FFV penetration. Importantly,the substantial federal alternative fueling infrastructure tax credit, worth 30% of capitalexpenses, expired at the end of 2013. If this tax credit is not renewed, fueling stationowners must look to recoup the full E85 infrastructure installation costs through increasedprofits alone. The vast majority of fueling stations are not owned by major oil companies,and so most fueling station owners are likely not obligated parties and are not incentivized
directly through RIN prices (American Petroleum Institute, 2012). However, high D6 RINprices could drive E85 to be sold to the station owners at lower cost, allowing eitherincreased sales to consumers or improved operating margins, and this could allow theowner to recoup infrastructure costs. While adequately high RIN prices would thereforehave the potential to allow increased renewable fuel volumes, persistently high D6 RINprices would be seen as a negative consequence by obligated parties and manyconsumers. Very high RIN prices may affect the stability of the program. A more gradualincrease of E85 and E15 supply would allow lower RIN prices, and have less impact onthese stakeholders.
This section attempts to answer the question of what D6 RIN price would be necessary toincentivize large numbers of fuel station owners to supply E85. We approach this question
using a simple analytical model. The representation of gas station owner and driverdecision making is basic, and this is a coarse analysis at the national level, and so does notcapture important regional differences in the opportunity to sell E85 but provides an overallindication of the effect of RIN prices on investment decisions. E85 deployment could bemade more or less achievable than this analysis suggests by a variety of factors such asdriver education, infrastructure grants, differing equipment costs, etc. We use severalassumptions in this analysis for which there is no definitive value, and so provide asensitivity analysis at the end to show how the results would change with different valuesfor these assumptions.
We describe two scenarios:
1. “Additional E85 customers” scenario: The station owner sells E85 with the sameprofit margin as E10 per gallon blended fuel, and recoups infrastructure coststhrough attracting additional business.
2. “Same customer base” scenario: FFV owners already in the station’s customerbase switch to buying E85; no new customers are attracted. The station ownerrecoups infrastructure costs through a higher profit margin on E85.
8/13/2019 ICCT Comments on RFS2 2014 renewable fuel volume obligation
http://slidepdf.com/reader/full/icct-comments-on-rfs2-2014-renewable-fuel-volume-obligation 9/20
In both scenarios, we use conservative assumptions in the sense that our analysis maytend to underestimate the required D6 RIN price. At the end of this section, we provideresults from a sensitivity analysis, showing how the estimated D6 RIN price is affected byvarying assumptions.
In the “additional E85 customers” scenario we calculate the number of new customers that
would be required to recoup the cost of installing the E85 pump. We compare this to thepotential pool of new E85 customers, and then use a demand curve to estimate the E85price discount necessary to attract that proportion of customers. Lastly, we use ourregression model (Equation 1; Figure 1) to estimate the D6 RIN price necessary to achievethe required E85 price discount.
For the cost of installing new E85 pumps, we use an estimate of $131,000 for an E85installation with one dispenser from EPA (U.S. Environmental Protection Agency, 2010). Inthe “additional E85 customers” scenario, this cost is recouped entirely through additionalsales from new customers. We assume a profit margin of 25 cents per gallon, taken fromthe California Energy Commission (2013). This margin includes both profit and operatingcost for the station owner. We were unable to separate the true profit margin from this figure.This simplified assumption has the effect of overestimating real profits from increased fuelssales with E85, and thus underestimates the RIN price necessary to incentivize E85infrastructure installation. With this profit margin, a station owner must sell about 578,000gallons of E85 to recoup the $131,000 in infrastructure cost. That is 289,000 additionalgallons per annum. We assume the station owner will aim to recoup costs within 2 years,although we note that we are not very familiar with the detail of how these businessdecisions are made in practice. Fuel dispensing equipment depreciates in 5 years under taxlaw7 and we assume a station owner would want to recoup the investment significantlyfaster than it depreciates. We include an opportunity cost of 5% per year to represent thereturn that would be realized if the station owner invested the $131,000 in a differentventure. With a typical fuel tank of 13 gallons for U.S. passenger vehicles, this amounts to
about 22,000 new visits needed per year. The typical U.S. passenger vehicle drives about15,000 miles per year with a fuel economy of about 23 mpg.8 A FFV fueled by E85 mustrefuel more frequently due to the lower energy density of E85 compared to E10; afteraccounting for this, the typical FFV owner must refuel 65 times per year (instead of 50 timesper year for a comparable vehicle fueled with E10).9 A fueling station owner would thusneed 341 new customers buying E85 to recoup costs over 2 years.
Now in order to determine how feasible it is to attract this much E85 business, we estimatethe number of E85 customers who could potentially visit this gasoline station. An analysisby Babcock & Pouliot (2013b) found that about 8 million FFVs were within reasonabledriving distance to an E85 station. With 2332 existing E85 stations (Alternative Fuels DataCenter, 2012), each station has about 3,400 FFVs in its range. As discussed in the previous
7 http://cs.thomsonreuters.com/ua/fixa/cs_us_en/ass_life_tbl/hid_help_asset_lives.htm , Asset class 57.0
8 Default values used in EPA’s 2013 fuel economy labels.
9 Assuming all vehicles only refuel when their tank runs empty, and refills the tank completely. Adjusting
this assumption (e.g. assuming vehicles refuel when half empty, and do so twice as frequently)does not change the result.

8/13/2019 ICCT Comments on RFS2 2014 renewable fuel volume obligation
http://slidepdf.com/reader/full/icct-comments-on-rfs2-2014-renewable-fuel-volume-obligation 10/20
section, the distribution of FFVs is not uniform across the country, but for the purposes ofdetailing the situation for a generic U.S. gasoline station owner it is appropriate to usevalues representing the U.S. average. Of course, adding more E85 stations, as we arecontemplating in this example, would reduce the number of FFVs per station, but as we aredescribing the decision of one gasoline station owner, it is reasonable to assume the sameconcentration of FFVs per station as exists today. For this example we assume acompetition factor of 0.5, meaning that 50% of the FFVs within driving distance of thisexample gasoline station are also within a reasonable distance to another E85 station andchoose to drive to an alternative station. As more stations add E85 pumps, competition forFFV customers increases and recouping the investment cost becomes more difficult. Asdiscussed in the previous section of these comments, many FFV owners are not awarethey drive an FFV; this has been estimated to be 75%(Jessen, 2011). Thus, the potentialE85 customer base of our example gasoline station is 3,400 x 50% (competition) x 25%(aware) = 429.
This gasoline station has the potential to attract 429 new E85 customers, but only needs341 to recoup its infrastructure costs. Thus, 80% of its potential new customers must
choose to fuel with E85 instead of E10. We use a demand curve by Pouliot (2013) toestimate the E85 price discount necessary to attract this proportion of FFV customers.There is not sufficient data in the U.S., so Pouliot presents data from Brazil to construct thedemand curve. We note that the U.S. market is not the same as Brazil; for example, at acurrent average price premium of 10% per mile, Pouliot’s curve predicts about 20% of FFVswould choose E85, but in the previous section we estimated that U.S. FFV owners chooseE85 1% of the time. This is not surprising as there is much higher consumer awareness andacceptance of E85 in Brazil than in the U.S. While over time U.S. consumer awareness islikely to increase and perhaps match that of Brazil, it is not likely to be substantially differentfrom 2013 in 2014, which is the target year of this analysis. Thus, using this curveoverestimates how many customers our example gasoline station would attract and thus
underestimates the required RIN price. Nonetheless, this curve predicts that E85 would
have to be discounted by about 15% compared to E10 on an energy equivalent basis inorder for 80% of potential customers to choose E85. This means that one gallon of E85must actually be sold at 62% of the price of E10. We then input this figure into our linearmodel (Equation 1, Figure 1) to predict a D6 RIN price of $1.90/RIN.
In the “same customer base” scenario the gasoline station owner does not attract newcustomers and instead increases his or her profit margin in order to recoup investmentcosts. First we estimate this station owner’s existing FFV customer base. Given a total U.S.passenger vehicle fleet of about 250 million (Larsen, 2013) and about 168,000 gasolinestations in the U.S. (Department of Energy, 2004), a gasoline station has on average about1480 customers. FFVs in the U.S. total about 15 million (Babcock & Pouliot, 2013b) or 6%of the U.S. passenger vehicle fleet. Thus, one gasoline station has, on average, 89 existing
customers who drive FFVs. As discussed above, only 25% of FFV owners are thought to beaware they drive an FFV. Additionally, only a fraction of aware FFV owners will choose E85over E10 at any given price difference; in this example, profits are maximized at a discountof 15% per mile, when 80% of aware FFV owners would choose E85 according to Pouliot’sdemand curve. Thus, the potential E85 customer base for this station owner is 22, with totalE85 consumption of about 15,000 gallons per year.
8/13/2019 ICCT Comments on RFS2 2014 renewable fuel volume obligation
http://slidepdf.com/reader/full/icct-comments-on-rfs2-2014-renewable-fuel-volume-obligation 11/20
In order to recoup investment costs within 2 years, the station owner must profit $4.77 pergallon. Since a majority of aware FFV owners will only choose E85 if it is cheaper thangasoline per mile, it is not possible to price E85 cheap enough to sell enough gallons torecoup the cost in this example.
In order to continue with the “same customer base” scenario, we relax the assumption that
the station owner must recoup costs within 2 years. If the station owner is willing to wait 5years for costs to be recouped, the required profit margin would be $2.21. Assuming an E10price of $3.53 (the average national price E10 price in 2013) and a required 15% retaildiscount per mile or 35% per gallon, E85 must be sold at $2.31 per gallon. For the stationowner to sell at this price and have a profit margin of $2.21, he or she must be able to buyE85 at $0.10/gallon, or 97% less than the price at which he or she buys E10 ($3.52 - $0.25margin). This corresponds to a D6 RIN price of $5.22/RIN.
In Table 2 we provide a sensitivity analysis that shows how the required D6 RIN price wouldchange if we vary certain assumptions. For the “additional E85 customers” scenario, therequired RIN price varies from $0.95 to infinity (i.e. cost cannot be recouped) under variouschanges to assumptions, and the “same customer base” scenario is only possible underone set of assumptions (allowing 5 years to recoup the investment cost). Interestingly, if weadjust Pouliot’s demand curve to reflect the 2013 U.S. data point of 1% E85 consumption ata 10% price premium, the required D6 RIN price rises dramatically to $2.55 for the“additional E85 customers” scenario, and cannot be achieved in the “same customer base”scenario. Another important factor is that station owners may discount the price support ofRINs due to price volatility. As cited in a recent ICCT report (Miller et al., 2013), a top officialat a second-generation biofuel company said his company discounts RIN support by up to50% or more due to price instability. If we assume fuel suppliers use a similarlyconservative approach in pricing fuel they sell to station owners, the required D6 RIN pricedoubles to $3.80 in the “additional E85 customers”, and remains unattainable in the “samecustomer base” scenario.

8/13/2019 ICCT Comments on RFS2 2014 renewable fuel volume obligation
http://slidepdf.com/reader/full/icct-comments-on-rfs2-2014-renewable-fuel-volume-obligation 12/20
Table 2 Sensitivity analysis for predicting the D6 RIN price necessary to incentivize
installation of a new E85 pump. A RIN price of indicates that it is not
possible to recoup the cost of the E85 pump.
PARAMETER ASSUMED VALUE
D6 RIN PRICE IN
“ADDITIONAL E85CUSTOMERS”
SCENARIO
D6 RIN PRICE IN
“SAME CUSTOMERBASE” SCENARIO
Baseline scenario (all values as describedabove)
$1.90
Years to recoup cost
1
3 $1.29
5 $0.95 $5.22
Profit margin pergallon
$0.15 N/A
$0.40 $1.21 N/A
Proportion of FFVdrivers who are awarethey drive FFVs
0.15
0.5 $1.04
Competition factor
0.25 $1.25 N/A
0.75 N/A
Demand curve forE85 at varying pricediscount
Adjusted to reflectU.S. market10
$2.55
Discount RIN price
due to volatility50% $3.80
10 As described in the section “The blendwall,” the observation of 1% E85 consumption by FFVs at a 10%
price premium does not fall along Pouliot’s demand curve. We adjust the curve to fit this datapoint, such that for any proportion of FFV owners choosing E85, the required price discount is20% greater than the original curve predicts.
8/13/2019 ICCT Comments on RFS2 2014 renewable fuel volume obligation
http://slidepdf.com/reader/full/icct-comments-on-rfs2-2014-renewable-fuel-volume-obligation 13/20
These results suggest that it will be difficult to incentivize installation of E85 pumps throughprice alone, and that high D6 RIN prices must be tolerated in order to do so. In this analysiswe are assuming the average U.S. fuel station owner, but of course the particular situationof station owners varies. For instance, a station owner in an area with abundant FFVs andfew existing E85 stations (e.g. Texas) may find it more easily profitable to install an E85pump. But on the other hand, there are many stations with few FFVs, or with highcompetition from other stations offering E85, for whom it would never be profitable to addan E85 pump. In addition some station owners may choose to offer E85 at a loss becauseof their personal political views or because they believe the novelty will attract morecustomers. To predict the number of fuel stations who would benefit from adding an E85pump under the current circumstances is beyond the scope of this analysis. But we believethese findings provide a meaningful indication that providing E85 will be financially difficultfor many U.S. fuel station owners unless the D6 RIN price rises considerably. High D6 RINprices, likely greater than $1/RIN, would be required for fuel suppliers to sell E85 at a lowenough price that station owners could expect to recoup investment costs through eitherincreased sales or increased profit margins. Such high D6 RIN prices, if sustained, wouldimpose a significant burden on obligated parties and consumers. The benefits of increased
ethanol consumption through E85 should be weighed against the cost of compliance formany involved parties. Although the analysis presented here is simple and relies on severalassumptions, it provides an indication that increasing market penetration of E85 in order tosupport a renewable volume obligation of higher than 10% ethanol may be difficult throughthe RFS alone, and hence that complementary measures might be appropriate if allowingincreased renewable fuel supply is a priority in the near term.
Carryover RINs
EPA argued that carryover RINs from 2013 should not be included in the volumerequirements for 2014 because some carryover stock should be maintained for flexibility.
We agree with this reasoning and agree that the flexibility in the carryover provision isnecessary. This flexibility mechanism is likely what Congress intended in allowing carryoverRINs under EPACT05. For example, following the drought in 2012, banked RINs were usedin part to meet the total renewable volume requirement. Allowing obligated parties to keepsome carryover RINs into 2015 by keeping the total renewable fuel volume at a level thatcan reasonably be achieved through actual fuel consumption will help protect the RFSagainst extreme market distortions in the event of another drought or other unforeseenevent.
Advanced fuel volume
ICCT supports EPA’s proposed 2014 volume of 2.2 billion gallons for advanced biofuel. This isthe first year that EPA has lowered the advanced biofuel volume along with reducing thecellulosic biofuel volume, and we agree that is the correct approach. Congress did not intend forthe RFS2 program to result in 21 billion gallons of (primarily) soybean biodiesel and sugarcaneethanol in 2022, as would be the case if cellulosic biofuel production remained very low andEPA did not adjust the advanced volumes. If Congress had intended this level of expansion ofthe advanced biofuel category, they could have directly mandated it in the RFS2 programregardless of cellulosic volumes. EPA’s current approach in proposing to reduce the 2014volume to 2.2 billion gallons is both achievable and prudent. Since the RFS2 began, concerns

8/13/2019 ICCT Comments on RFS2 2014 renewable fuel volume obligation
http://slidepdf.com/reader/full/icct-comments-on-rfs2-2014-renewable-fuel-volume-obligation 14/20
about biofuel impacts on food markets, poverty, and indirect land use change have only risen(e.g. a well-publicized report by a coalition of international organizations: FAO et al., 2011), andthese concerns apply to all RFS2 advanced pathways that are not cellulosic or waste. Given thecurrent trajectory of the cellulosic biofuel industry, it was inevitable that the advanced volumesmust be revised at some point; in doing so this year, EPA is sending a clear signal to allstakeholders that it will act to maintain the RFS2 at manageable volumes that limit compliance,costs, market distortions, and unintended social impacts.
Biomass-based diesel volume
ICCT supports EPA’s proposed biomass-based diesel volume of 1.28 billion gallons (1.92 billionethanol equivalent gallons) in 2014 and 2015. It is important to finalize the 2015 biomass-baseddiesel volume in this rulemaking as it will provide a clear and early signal to stakeholders.
Biodiesel tax credit and RIN prices
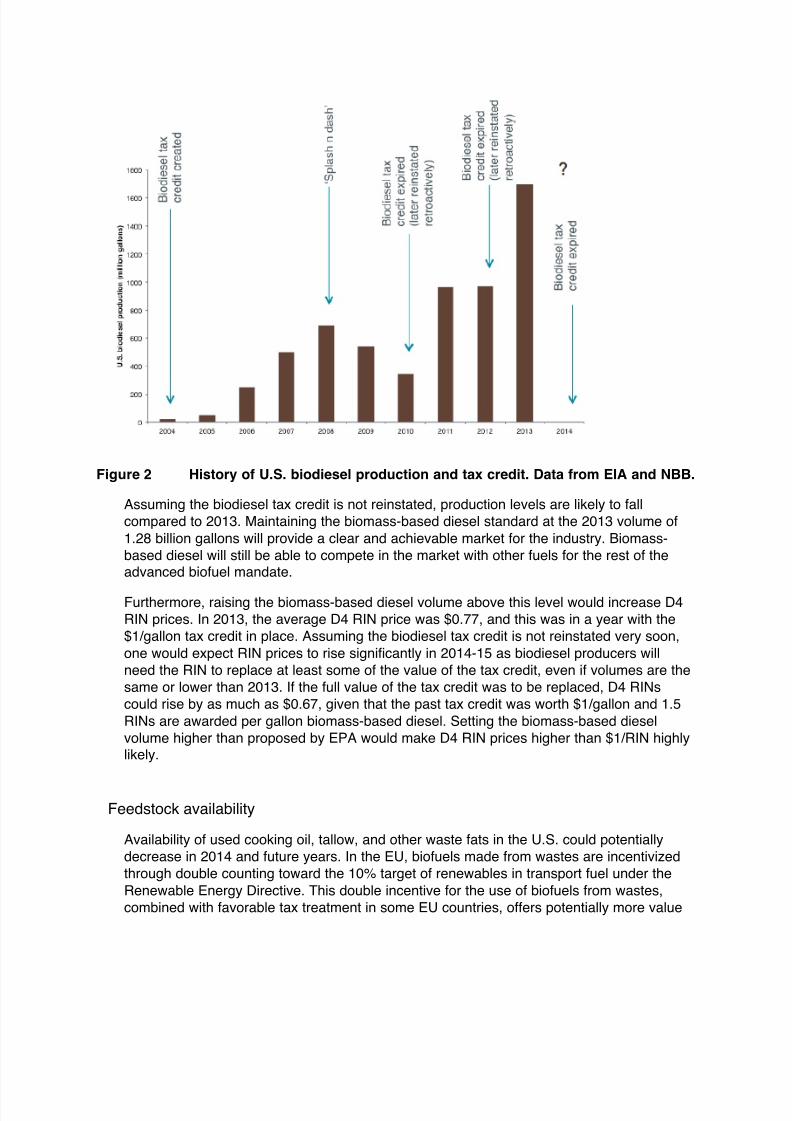
The U.S. biodiesel industry has been heavily dependent on tax support. As Figure 2 shows,in years when the biodiesel tax credit was in place at the beginning of the year, productionramped up with robust growth. At the end of both 2009 and 2011, the tax credit expired andwas not reinstated until over a year later; it can be seen that production did not increase inthose years of no tax credit (i.e. 2010 and 2012). In 2010, production actually decreasedfrom the previous year, although some of this decrease can likely be attributed to the end of‘splash n dash’. At the beginning of 2011 and 2013, the biodiesel tax credit wasretroactively reinstated to cover 2010 and 2012, but this did not actually help production inthose years since it was awarded after the fact.
The biodiesel tax credit again expired at the end of 2013. It is possible that this tax creditwill be retroactively reinstated early enough in 2014 to affect production this year, but it isunclear what Congress will decide.
8/13/2019 ICCT Comments on RFS2 2014 renewable fuel volume obligation
http://slidepdf.com/reader/full/icct-comments-on-rfs2-2014-renewable-fuel-volume-obligation 15/20
Figure 2 History of U.S. biodiesel production and tax credit. Data from EIA and NBB.
Assuming the biodiesel tax credit is not reinstated, production levels are likely to fallcompared to 2013. Maintaining the biomass-based diesel standard at the 2013 volume of1.28 billion gallons will provide a clear and achievable market for the industry. Biomass-based diesel will still be able to compete in the market with other fuels for the rest of theadvanced biofuel mandate.
Furthermore, raising the biomass-based diesel volume above this level would increase D4RIN prices. In 2013, the average D4 RIN price was $0.77, and this was in a year with the$1/gallon tax credit in place. Assuming the biodiesel tax credit is not reinstated very soon,one would expect RIN prices to rise significantly in 2014-15 as biodiesel producers willneed the RIN to replace at least some of the value of the tax credit, even if volumes are thesame or lower than 2013. If the full value of the tax credit was to be replaced, D4 RINscould rise by as much as $0.67, given that the past tax credit was worth $1/gallon and 1.5RINs are awarded per gallon biomass-based diesel. Setting the biomass-based dieselvolume higher than proposed by EPA would make D4 RIN prices higher than $1/RIN highlylikely.
Feedstock availability
Availability of used cooking oil, tallow, and other waste fats in the U.S. could potentially
decrease in 2014 and future years. In the EU, biofuels made from wastes are incentivizedthrough double counting toward the 10% target of renewables in transport fuel under theRenewable Energy Directive. This double incentive for the use of biofuels from wastes,combined with favorable tax treatment in some EU countries, offers potentially more value
8/13/2019 ICCT Comments on RFS2 2014 renewable fuel volume obligation
http://slidepdf.com/reader/full/icct-comments-on-rfs2-2014-renewable-fuel-volume-obligation 16/20
to these feedstocks than is available in the D4 RIN, and the EU has been importing thesewaste oils from other countries including the U.S (e.g. the UK alone reported the supply of19 million liters of U.S. sourced used cooking oil in 2013/14).11 As the EU nears the 2020deadline for its target of 10% renewables in transport, it is likely that demand from the EUwill reduce the volumes of U.S. waste oils available as biofuel feedstock in the domesticmarket.
Flexibility in the advanced mandate
In the 2014 volumes proposal, EPA suggested that maintaining the biomass-based dieselvolume at 1.28 billion gallons for 2014 and 2015 would allow some flexibility under theadvanced biofuel volume requirement for other advanced pathways. ICCT agrees with thisreasoning and agrees that flexibility is necessary both to incentivize the commercializationof new advanced biofuel pathways and to minimize compliance costs for obligated parties,and hence cost of the RFS to fuel consumers.
Allowing flexibility in the advanced volume is especially important if the biodiesel tax creditis not reinstated early in 2014. Sufficient quantities of Brazilian sugarcane ethanol can beexpected to be available and perhaps even decrease in price; Brazil’s domestic ethanolconsumption has stagnated as gasoline has become relatively cheaper in that country in2011.12 Obligated parties under the RFS2 should have the option to fill their advancedrequirement with a cheaper fuel that delivers high greenhouse gas savings. Maintaining thebiomass-based diesel volume at 1.28 billion gallons avoids an undue burden on obligatedparties and consumers.
In addition, California’s Low Carbon Fuel Standard (LCFS) provides an incentive for the useof Brazilian sugarcane ethanol in that state. The LCFS rewards individual fuel pathways bytheir specific greenhouse gas savings, rather than by fuel category as in the RFS2. Under
the LCFS, Brazilian sugarcane ethanol has a higher greenhouse gas saving (19%) thansoybean biodiesel (12%). This incentivizes fuel blenders in California to choose Braziliansugarcane ethanol over soybean biodiesel, even if both biofuels are the same price.Without the biodiesel tax credit, California fuel blenders are even further incentivized toblend Brazilian sugarcane ethanol rather than soy biodiesel. In order to account forsugarcane ethanol consumption in California and other states, the biomass-based dieselvolume requirement would need to be lower than the advanced volume requirement.Maintaining the biomass-based diesel volume at 1.28 billion gallons (1.92 billion ethanolequivalent volumes) with an advanced volume requirement of 2.2 billion gallons fulfills thisgoal.
11 https://www.gov.uk/government/publications/renewable-transport-fuel-obligation-statistics-year-6-
report-1
12 E.g. http://www.governorsbiofuelscoalition.org/?p=7974; http://www1.folha.uol.com.br/mercado/998401-
governo-reduz-imposto-sobre-gasolina-mas-preco-nao-muda.shtml
8/13/2019 ICCT Comments on RFS2 2014 renewable fuel volume obligation
http://slidepdf.com/reader/full/icct-comments-on-rfs2-2014-renewable-fuel-volume-obligation 17/20
Vegetable oil substitution
As ICCT argued in our comments to EPA on the 2013 volumes proposal, there iscompelling evidence that a significant fraction of the increased demand for vegetable oils inthe U.S. caused by use of these oils in biodiesel is being filled with rising palm oil imports,but that this was not captured in the original RFS lifecycle analysis. The ICCT, in
conjunction with Georgetown University, is currently investigating the substitution effectbetween soybean oil and palm oil in the U.S. Preliminary results suggest a strong effect.Holding the prices of other vegetable oils constant,13 it is estimated that the cross-priceelasticity of demand of palm oil imports to soybean oil prices is about 3; this means that a1% change in soybean oil prices is associated with a 3% change in palm oil imports,according to our preliminary analysis. This result strongly suggests that palm oil is replacinga significant fraction of soybean oil demand in the U.S. Roughly one-third of domesticsoybean oil production is already diverted to biodiesel,14 raising the possibility that a highbiomass-based diesel requirement would result in significantly increased palm oil imports tothe U.S. This vegetable oil substitution analysis will be published as a Georgetown MastersThesis by Yin Qiu and will be available to EPA in the spring of 2014.
As EPA demonstrated in their Notice of Data Availability on palm oil biodiesel in 2012, palmoil production is associated with high greenhouse gas emissions. Replacing soybean oilconsumption in food and other uses with palm oil increases the net greenhouse gasfootprint of the vegetable oil sector in the U.S. and is counter to the goals of the RFS2.
Maintaining the biomass-based diesel volume at 1.28 billion gallons in 2014-15 will limit thesubstitution of soybean oil with palm oil in the U.S., and hence reduce the risk that the RFSmay be supporting fuel pathways with less favorable carbon intensity than intended.
Carryover RINs
As in our comments on the total renewable fuel volume, it is important to allow a pool ofcarryover RINs to provide flexibility in the event of a drought or other unexpectedcircumstances later in the program. We do not think EPA should actively aim to draw downthe supply of carryover RINs by considering them in calculating the biomass-based dieselor advanced volumes for 2014 and 2015.
Cellulosic biofuel volume
ICCT supports EPA’s methodology in determining the cellulosic volume for 2014 and agreesthat EPA’s use of the Monte Carlo simulations is appropriate.
ICCT requests that if EPA decides to approve a cellulosic biogas pathway in 2014, they thenraise the 2014 cellulosic biofuel volume commensurate with the expected production ofcellulosic biogas this year. This action will be necessary to ensure that landfill biogas does not
13 Prices of palm oil, canola oil, corn oil were held constant in this analysis.
14 From approximately 1.48 billion gallons of biomass-based diesel produced in 2013, inferred from EPA’s
EMTS data, and 2012/2013 annual soybean oil production from USDA data.
8/13/2019 ICCT Comments on RFS2 2014 renewable fuel volume obligation
http://slidepdf.com/reader/full/icct-comments-on-rfs2-2014-renewable-fuel-volume-obligation 18/20
excessively undermine the value of cellulosic RINs and thereby displace other cellulosic biofuelsfrom the market, and to give a positive signal to investors and blenders to support all cellulosicbiofuel pathways.
Revised compliance schedule for 2016-2022
The implementation of the RFS2 has started to diverge significantly from the complianceschedule laid out in the 2010 RFS2 rule and in the statute. By statute, EPA is required toestablish revised volumes for the period 2016-2022 if at least 20% of the applicable volumerequirement has been waived for two consecutive years. This currently applies to the cellulosicmandate and may apply to the advanced and total renewable mandates in 2016 or soonthereafter.
We urge EPA to propose revised volumes for all RFS2 categories for the years 2016-2022 assoon as possible and to identify the criteria that will be used to set these volumes. Releasing aproposal in the near future would allow enough time for public comment and finalization before2016 begins. This would provide needed certainty for all stakeholders and stability of the RFSprogram.
Conclusions
EPA has proposed the right approach to successfully implement the RFS2 program giventoday’s challenges with the blendwall. Mandating volumes above the proposed 15.21 billiongallons for total renewable fuel would likely result in either incompliance or unacceptably highRIN prices. These undesirable outcomes can be avoided by maintaining the RFS2 volumes at alevel that can reasonably be met, a sensible approach that we hope will be implemented infuture volume rulemakings.
EPA is also proposing effective measures to allow continued flexibility in the RFS2 program.These steps include: [1] not including carryover RINs in the 2014 volume calculations and [2]
maintaining the biomass-based diesel volume at a level lower than the advanced volume. Thisis the right approach to allow obligated parties flexibility in meeting their requirements andensuring the success of the RFS2 program in the event of drought or other disaster.
Lastly, we support EPA’s methodology in determining the 2014 cellulosic volume.
Literature cited
Alternative Fuels Data Center. (2012). Ethanol Fueling Station Locations. Retrieved Jan 7,2014, from http://www.afdc.energy.gov/fuels/ethanol_locations.html
Alternative Fuels Data Center. (2013a). E15. Retrieved Jan 7, 2014, fromhttp://www.afdc.energy.gov/fuels/ethanol_e15.html
Alternative Fuels Data Center. (2013b). Flexible Fuel Vehicles. Retrieved October 26, 2013,
from http://www.afdc.energy.gov/vehicles/flexible_fuel.html
American Petroleum Institute (API). (2012). 2012 Retail Outlets by Owner and Operation. fromhttp://www.api.org/oil-and-natural-gas-overview/consumer-information/~/media/Files/Oil-and-Natural-Gas/Service Station/Retail-Outlet-2012-Chart.ashx
Babcock, B.A., & Pouliot, S. (2013a). Impact of Sales Constraints and Entry on E85 DemandCARD Policy Brief 13-PB 12 (pp. 9). Ames, IA: Iowa State University.

8/13/2019 ICCT Comments on RFS2 2014 renewable fuel volume obligation
http://slidepdf.com/reader/full/icct-comments-on-rfs2-2014-renewable-fuel-volume-obligation 19/20
Babcock, B.A., & Pouliot, S. (2013b). Price It and They Will Buy: How E85 Can Break the BlendWall CARD Policy Brief 13-PB 11: Iowa State University.
California Energy Commission. (2013). Estimated 2014 Gasoline Price Breakdown & MarginsDetails. Energy Almanac. Retrieved Jan 8, 2014, fromhttp://energyalmanac.ca.gov/gasoline/margins/index.php
Department of Energy. (2004). How many gas stations are there in the U.S.? Retrieved Jan 7,2014, from http://www.fueleconomy.gov/feg/quizzes/answerQuiz16.shtml
Domestic Fuel. (2013). E15 Additions At the Right Price. Retrieved October 26, 2013, fromhttp://domesticfuel.com/2013/09/10/e15-additions-at-the-right-price/
E85Prices.com. (2013). E85 Price Map. Retrieved October 26, 2013, fromhttp://e85prices.com/
Energy Information Administration. (2012). Annual Energy Review. Retrieved October 26, 2013,from http://www.eia.gov/totalenergy/data/annual/showtext.cfm?t=ptb1005
FAO, IFAD, IMF, OECD, UNCTAD, WFP, . . . HLTF, the UN. (2011). Price volatility in Food andAgricultural Markets: Policy Responses. Policy Report to the G20 group of nations.
Gilbarco Veeder-Root. (2013). Retrieved October 26, 2013, from http://www.gilbarco.com/us/
Hilbert, D. (2011). High Ethanol Fuel Endurance: A Study of the Effects of Running Gasolinewith 15% Ethanol Concentration in Current Production Outboard Four-Stroke Enginesand Conventional Two-Stroke Outboard Marine Engines. NREL/SR-5400-52909 (pp. 55).Golden, CO: National Renewable Energy Laboratory.
Jessen, H. (2011). Educating the Clueless. Retrieved Jan 17, 2014, fromhttp://www.ethanolproducer.com/articles/7414/educating-the-clueless
Kass, M.D., Theiss, T., Janke, C.J., & Pawel, S.J. (2012). Analysis of Underground StorageTank System Materials to Increased Leak Potential Associated with E15 Fuel ORNL/TM-
2012/182 . Oak Ridge, TN: Oak Ridge National Laboratory.
Kass, M.D., Theiss, T., Janke, C.J., Pawel, S.J., & Lewis, S.A. (2011). Intermediate EthanolBlends Infrastructure Materials Compatibility Study: Elastomers, Metals, and SealantsORNL/TM-2010/326 (pp. 109). Oak Ridge, TN: Oak Ridge National Laboratory.
Knoll, K., West, B.H., Clark, W., Graves, R., Orban, J., Przesmitzki, s., & Theiss, T. (2009).Effects of Intermediate Ethanol Blends on Legacy Vehicles and Small Non-RoadEngines, Report 1 - Updated NREL/TP-540-43543; ORNL/TM-2008-117 (pp. 135):National Renewable Energy Laboratory.
Larsen, J. (2013). Falling Gasoline Use Means United States Can Just Say No to New Pipelinesand Food-to-Fuel. Data Highlights. Retrieved from http://www.earth-policy.org/data_highlights/2013/highlights38
Miller, N, Christensen, A, Park, JE, Baral, A, Malins, C, & Searle, S. (2013). Measuring andaddressing investment risk in the second-general biofuels industry (pp. p. 50).Washington, DC: International Council on Clean Transportation.
8/13/2019 ICCT Comments on RFS2 2014 renewable fuel volume obligation
http://slidepdf.com/reader/full/icct-comments-on-rfs2-2014-renewable-fuel-volume-obligation 20/20
Minnesota Department of Commerce. (2013). 2013 Minnesota E85 + Mid-blends Station Report.Retrieved January 6, 2014, from http://mn.gov/commerce/energy/images/E-85-Fuel-Use-Data.pdf
National Renewable Energy Laboratory. (2010). Data, Analysis and Trends: E85 FFVs in Use inU.S. (1998-2009). Retrieved April 20, 2013, from
http://www.afdc.energy.gov/data/categories/vehicles
Oak Ridge National Laboratory. (2012). Transportation Energy Data Book: Edition 31 (pp. 422).Washington, DC: Department of Energy.
Orbital engine Company. (2003). Market Barriers to the Uptake of Biofuels Study: MarineOutboard Driveability Assessment to Determine Impacts of a 10% and 20% EthanolGasoline Fuel Blend on a Small Batch of Engines Report to Environment Australia (pp.40).
Pouliot, S. (2013). Arbitrage between ethanol and gasoline: evidence from motor fuelconsumption in Brazil. Selected Paper prepared for presentation at the Agricultural &Applied Economics Association’s 2013 AAEA & CAES Annual Meeting, Washington DC,
August 4-6, 2013. Ames, Iowa: Iowa State University.
U.S. Environmental Protection Agency. (2010). Renewable Fuel Standard Program (RFS2)Regulatory Impact Analysis (pp. 1120). Washington, DC: EPA.
Underwriter Laboratories. (2013). UL. Retrieved October 26, 2013, fromhttp://www.ul.com/global/eng/pages/