Embed Size (px)
Citation preview
© 2012 International Council on Clean Transportation
Washington Berlin San Francisco
+1 202 534 1600 +1 415 399 9172
[email protected] | www.theicct.org
Comments of the ICCT on EPA palm oil pathway NODA
EPA-HQ-OAR-2011-0542-0057
Author: Dr Chris Malins
Date: 27 April 2012
Comments
The ICCT believes that the EPA’s initial analysis of the carbon intensity of palm oil biodiesel production is an important contribution, and we are supportive of the overall methodology. However, there are several points on which we believe there is room for improvement in the analysis – we would further anticipate that the overall result of adopting such improvements would be to increase the carbon intensity value proposed for palm oil biodiesel.
Summary• It seems likely that 2022 yield predictions are too optimistic. We would
recommend that serious consideration be given to the credibility of the current values, and suggest that 4.7 tCPO/ha and 4.8 tCPO/ha for Indonesia and Malaysia respectively might be considered the upper bounds on the appropriate assumption for the 2022 value, if one is optimistic about continu-ation of recent trend yield growth. Without that optimism, values not more than 4.5 tCPO/ha might seem reasonable, and thus we suggest that it would be appropriate for the EPA to adopt a value around 4.5 tCPO/ha as the central estimate. While current government initiatives exist to boost palm yields, we see no reason to believe that even if these initiatives work yield increase will grow substantially above the trend rate.
• The GEOMOD approach to land use prediction is fundamentally flawed as currently applied to oil palm. While it has some prima facie appeal compared to MODIS data as previously used, we show that the predictions are so out of sync with what is generally expected by industry analysts, and with analysis of historical trends, that the approach should be abandoned for this pathway. With additional work, a future iteration may represent a useful addition for
2 International Council on Clean Transportation Comments
ICCT comments on the EPA palm oil NODA
future revisions to the various pathway analyses.
• A wealth of current evidence supports the expectation that more oil palm plantations will be placed on peat in the next ten years than the last ten. The current analysis assumes the opposite. We recommend that the EPA should assume in its analysis that at least 32% of new palm plantations planted in response to RFS2 would be on peat – we consider this value conservative, as it assumes the recent acceleration will stop, so a value of perhaps up to 50% would be appropriate for any sensitivity and uncertainty analysis.
• There is no strong evidence that policies currently in effect are having or will have a strong effect in limiting palm oil expansion on peatland. Miettinen et al. (2012a) show that neither policy nor physical limitations will prevent expansion on peat from continuing to 2022. The Indonesian peat/forest conversion moratorium contains substantial carve outs to allow palm plantation expansion to continue. Neither RSPO nor ISPO is expected to place substantial restriction on peat conversion in the near term. The EPA should re-evaluate the palm biodiesel pathway in future should it be clearly demon-strated that policy measures to prevent land use change emissions are in place and effective, but should not pre-empt such policies before they exist.
Current and future Indonesian and Malaysia palm oil yieldsThe data in the FAPRI-CARD model seem to suggest a surprisingly high estimate of both current and future Indonesia palm oil yield. According to FAOstat FFB yield in Indonesia has been relatively stable over the period 2007-2010 at 17.2 t/ha, while Malaysia FFB yields have been higher by nearly 25%, rising slightly from 21.14 to 21.20 t/ha in the same period. This could indicate that estimates of Indonesian palm oil yields by FAPRI may be rather optimistic – at palm crushing yields of 0.2 tCPO/tFFB (taken from the input-assumptions document) this would be below 3.5 tCPO/ha for Indonesia.
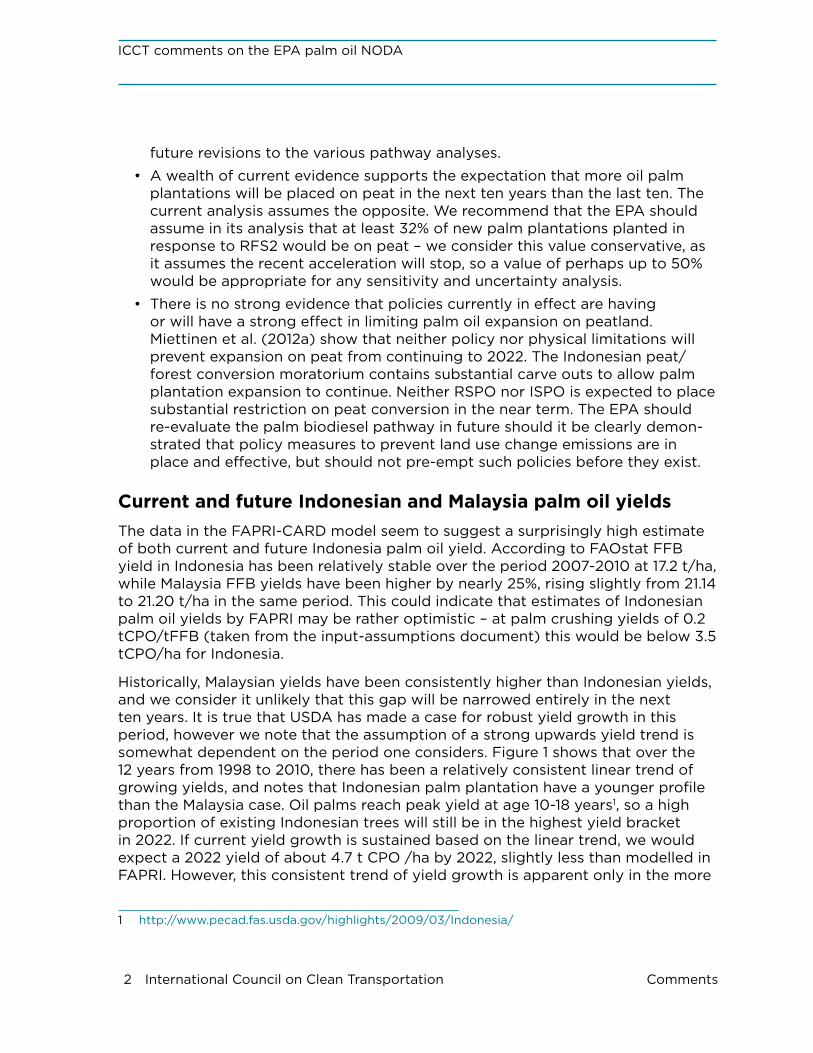
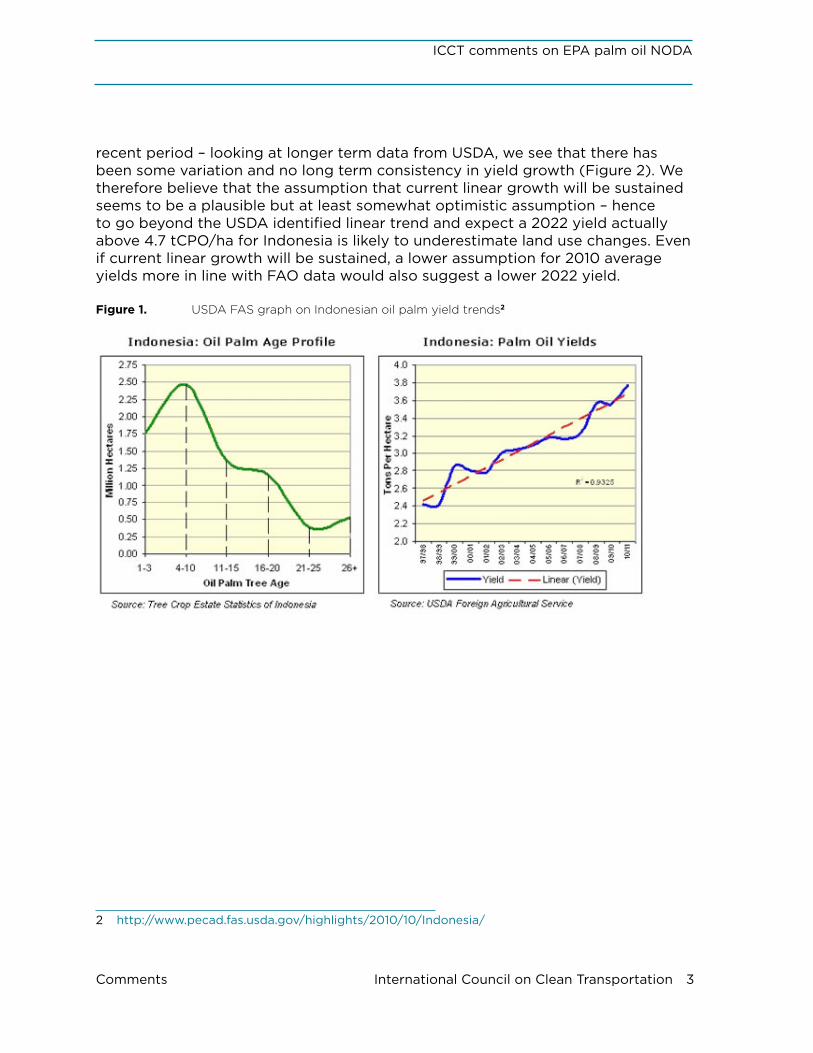
Historically, Malaysian yields have been consistently higher than Indonesian yields, and we consider it unlikely that this gap will be narrowed entirely in the next ten years. It is true that USDA has made a case for robust yield growth in this period, however we note that the assumption of a strong upwards yield trend is somewhat dependent on the period one considers. Figure 1 shows that over the 12 years from 1998 to 2010, there has been a relatively consistent linear trend of growing yields, and notes that Indonesian palm plantation have a younger profile than the Malaysia case. Oil palms reach peak yield at age 10-18 years1, so a high proportion of existing Indonesian trees will still be in the highest yield bracket in 2022. If current yield growth is sustained based on the linear trend, we would expect a 2022 yield of about 4.7 t CPO /ha by 2022, slightly less than modelled in FAPRI. However, this consistent trend of yield growth is apparent only in the more
1 http://www.pecad.fas.usda.gov/highlights/2009/03/Indonesia/
Comments International Council on Clean Transportation 3
ICCT comments on EPA palm oil NODA
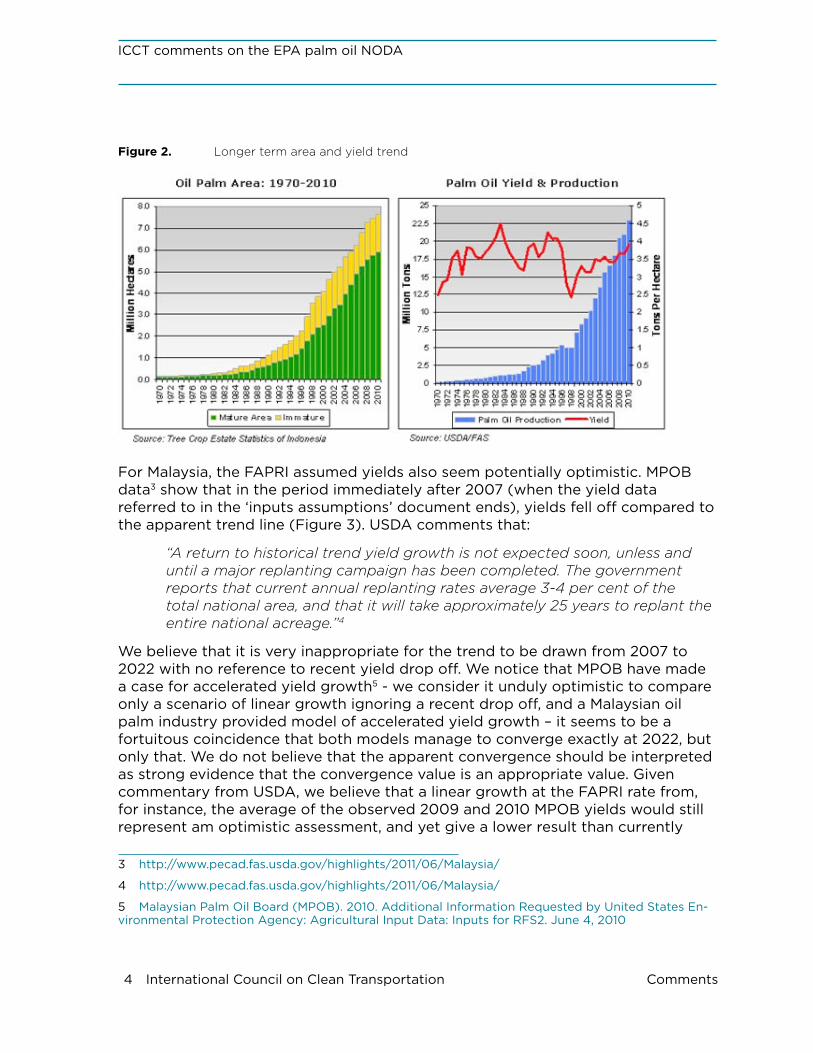
recent period – looking at longer term data from USDA, we see that there has been some variation and no long term consistency in yield growth (Figure 2). We therefore believe that the assumption that current linear growth will be sustained seems to be a plausible but at least somewhat optimistic assumption – hence to go beyond the USDA identified linear trend and expect a 2022 yield actually above 4.7 tCPO/ha for Indonesia is likely to underestimate land use changes. Even if current linear growth will be sustained, a lower assumption for 2010 average yields more in line with FAO data would also suggest a lower 2022 yield.
Figure 1. USDA FAS graph on Indonesian oil palm yield trends2
2 http://www.pecad.fas.usda.gov/highlights/2010/10/Indonesia/
4 International Council on Clean Transportation Comments
ICCT comments on the EPA palm oil NODA
Figure 2. Longer term area and yield trend
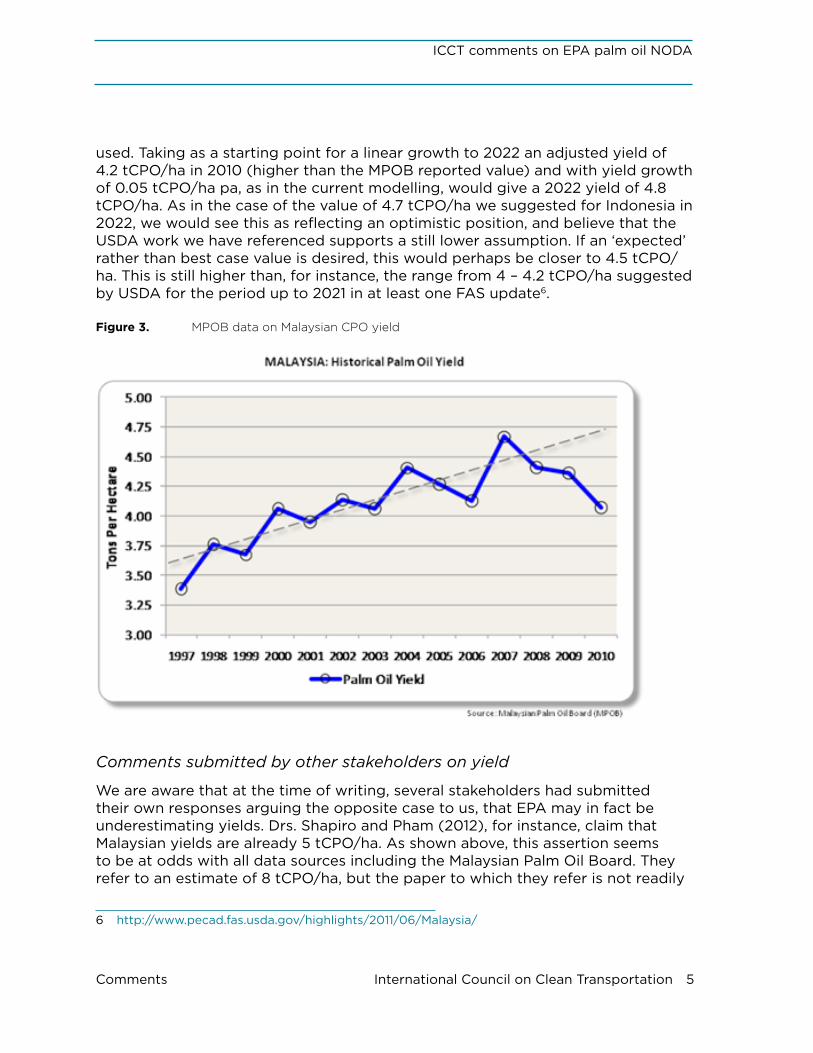
For Malaysia, the FAPRI assumed yields also seem potentially optimistic. MPOB data3 show that in the period immediately after 2007 (when the yield data referred to in the ‘inputs assumptions’ document ends), yields fell off compared to the apparent trend line (Figure 3). USDA comments that:
“A return to historical trend yield growth is not expected soon, unless and until a major replanting campaign has been completed. The government reports that current annual replanting rates average 3-4 per cent of the total national area, and that it will take approximately 25 years to replant the entire national acreage.”4
We believe that it is very inappropriate for the trend to be drawn from 2007 to 2022 with no reference to recent yield drop off. We notice that MPOB have made a case for accelerated yield growth5 - we consider it unduly optimistic to compare only a scenario of linear growth ignoring a recent drop off, and a Malaysian oil palm industry provided model of accelerated yield growth – it seems to be a fortuitous coincidence that both models manage to converge exactly at 2022, but only that. We do not believe that the apparent convergence should be interpreted as strong evidence that the convergence value is an appropriate value. Given commentary from USDA, we believe that a linear growth at the FAPRI rate from, for instance, the average of the observed 2009 and 2010 MPOB yields would still represent am optimistic assessment, and yet give a lower result than currently
3 http://www.pecad.fas.usda.gov/highlights/2011/06/Malaysia/
4 http://www.pecad.fas.usda.gov/highlights/2011/06/Malaysia/
5 Malaysian Palm Oil Board (MPOB). 2010. Additional Information Requested by United States En-vironmental Protection Agency: Agricultural Input Data: Inputs for RFS2. June 4, 2010
Comments International Council on Clean Transportation 5
ICCT comments on EPA palm oil NODA
used. Taking as a starting point for a linear growth to 2022 an adjusted yield of 4.2 tCPO/ha in 2010 (higher than the MPOB reported value) and with yield growth of 0.05 tCPO/ha pa, as in the current modelling, would give a 2022 yield of 4.8 tCPO/ha. As in the case of the value of 4.7 tCPO/ha we suggested for Indonesia in 2022, we would see this as reflecting an optimistic position, and believe that the USDA work we have referenced supports a still lower assumption. If an ‘expected’ rather than best case value is desired, this would perhaps be closer to 4.5 tCPO/ha. This is still higher than, for instance, the range from 4 – 4.2 tCPO/ha suggested by USDA for the period up to 2021 in at least one FAS update6.
Figure 3. MPOB data on Malaysian CPO yield
Comments submitted by other stakeholders on yield
We are aware that at the time of writing, several stakeholders had submitted their own responses arguing the opposite case to us, that EPA may in fact be underestimating yields. Drs. Shapiro and Pham (2012), for instance, claim that Malaysian yields are already 5 tCPO/ha. As shown above, this assertion seems to be at odds with all data sources including the Malaysian Palm Oil Board. They refer to an estimate of 8 tCPO/ha, but the paper to which they refer is not readily
6 http://www.pecad.fas.usda.gov/highlights/2011/06/Malaysia/
6 International Council on Clean Transportation Comments
ICCT comments on the EPA palm oil NODA
available making it difficult to comment on the basis of such a value. Nevertheless, we are quite confident that such a value will not be achieved as an average yield in the 2022 timeframe. The comments from ISPO (2012) similarly point to a single estimate of achievable palm oil yield (this time 7.7 tCPO/ha) as evidence that 5 tCPO/ha is an underestimate. We strongly emphasise that demonstrating that a yield is achievable is not by any means the same as demonstrating that that yield will in fact be achieved as an average at some point in the future, and thus encourage EPA to disregard such arguments unless accompanied by a compelling narrative for why the rate of increase will be so out of tune with historical precedent.
Projected land use changesFor the other pathways analysed for RFS2, the determination of types of land affected by land use change has been based on the use of satellite mapping information from MODIS, analysed (notably, differenced between two years) by Winrock. There are documented and, in our view, legitimate concerns that the rate of land use identification error using MODIS is high compared to the actual rate of land use change in many areas. Given this error rate, we believe that the error terms in this analysis become large compared to the identified land use changes, potentially rendering the results misleading. We therefore see the adoption of a different approach (using GEOMOD in analysis again performed by Winrock) as a positive move in principle – however, we believe that the results are adequately out of sync with informed expectation and other analyses, and that there are enough outstanding methodological questions, that we would question strongly whether they are fit at this time to be used in a rulemaking.
In our analysis of the GEOMOD work below, we focus on the Malaysian analysis; as the methodology is the same for Indonesia, we see no reason to believe that in general our critique is not also applicable to the Indonesian case.
Spatial data
The spatial data on palm oil areas in 2003 and 2009 shows a surprisingly large area of palm oil falling apparently out of production between 2003 and 2009, a period of only 6 years – especially given the persistent perennial nature of the oil palm, with a plantation lifespan of over 25 years. This is suggestive that the spatial data may be of inadequate quality to undertake robust differencing (and hence to calibrate/validate GEOMOD) – a similar issue in some respects to that identified in the previous MODIS based differencing work. Winrock notes that, “The locations of oil palm plantations in the years 2003 and 2009 were supplied in shapefile format to EPA by the Government of Malaysia. The shapefiles contained no metadata and the accuracy of the maps is unknown.” We suggest that without undertaking further analysis to demonstrate or refute the accuracy
Comments International Council on Clean Transportation 7
ICCT comments on EPA palm oil NODA
of the palm oil plantation location data, and to explain the rather large apparent rate of plantation retirement, it is inappropriate to rely on this data for an EPA rulemaking.
Factor maps (Malaysia)
Central to the GEOMOD approach is the generation and use of ‘factor maps’ that aim to associate specific ‘biogeophysical’ characteristics of land areas with the likelihood that those areas would be exploited for palm oil production. The following factors were considered relevant to plantation location choices:
• Elevation
• Precipitation
• Temperature
• Slope
• Soil type
• Land cover in 2001
• Roads*
• Rivers
• Railroads*
• Settlements*
• Existing palm oil plantations 2003*
We believe that several of the factors identified for the factor maps are likely to systematically favour the assumption that palm oil will expand close to existing palm oil areas – i.e. to tend to lock in the 2003 national distribution of palm oil plantations when making projections. These are marked with * in the list above, and are: distance to roads, distance to railroads, distance to settlements. We believe that all of these factors when treated as determinative in land use decision making would tend to actively favour the assumption that future distribution of land use will track existing distribution – distance to roads, railroads, settlements do not reflect the likelihood that if major expansion occurs in a new region it will occur concurrently with infrastructure expansion and settlement. We raise this issue because we believe that for Malaysia in particular there is a reasonable (and widely held) expectation that palm oil expansion will occur disproportion-ately in Sarawak in the years to come, as opposed to Sabah or the peninsular states. The factor map approach, however, is unable to reflect the various non-biogeophysical reasons to expect this trend, and on the contrary will inevitably favour an assumption of expansion in the gaps between concentrations of existing plantations – this pattern is even commented on in the preamble, “Our modelling indicates that the most likely area for incremental expansion is on the mainland where existing plantations may be able to expand around the fringes in order
8 International Council on Clean Transportation Comments
ICCT comments on the EPA palm oil NODA
to increase productive area.” We believe that rather than being a result of the modelling, this assumption is effectively input to the modelling via the factor map approach.
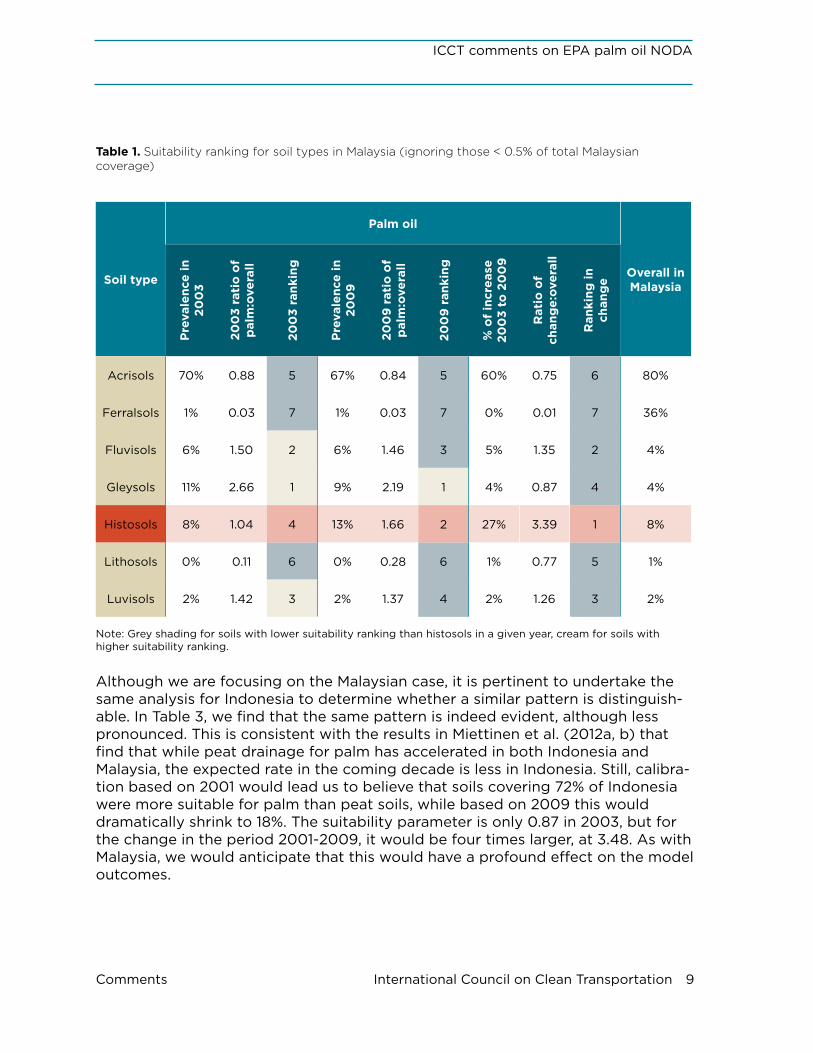
Another fundamental concern in the factor map approach is the treatment of soil type, and in particular peat soils (histosols) as a determinative factor in plantation location. Calibration of the factor suitability maps is done using the 2003 data. Suitability, as we understand it, is determined by the ratio between the prevalence of palm plantations on a given soil type and the overall prevalence of that soil type in Malaysia as a whole – we refer to this henceforth as the suitability parameter. In both 2003 and 2009, histosols are well represented in palm planta-tions compared to general prevalence – however, the comparative soil rankings changes distinctly in this period, as we show in Table 2. Based on 2003, we would conclude that histosols are the fourth most suitable soil type for palm cultivation (ignoring soil types with very limited prevalence, i.e. < 0.5%, in Malaysia). Ahead of it are Eluvisols, Gleysols and Luvisol, which account for 10% of total Malaysian soils. In 2009, however, histosols are ranked second, with a 60% increase in the suitability parameter, and only Gleysols ranking higher. Calibrating based on 2003 therefore has 10% of Malaysian soils categorised as more suitable for palm expansion than peat soils – whereas calibrating based on 2009 would have only 4% of Malaysian soils categorised as more suitable for palm expansion than peat soils, a major difference. It would also have been possible to calibrate the suit-ability map not on a particular year, but on the change from 2003-2009.7 In this case, the results show another marked change. In the period 2003 – 2009, peat soils were the most favoured type of soils for palm expansion by some difference, with a suitability parameter as we have calculated it of 3.39, more than double that for any other soil type and three times the value when considering the state of Malaysian palm oil in 2003.
As we note elsewhere in these comments, the trajectory of peat drainage to allow palm plantation development has been constantly accelerating over the last two decades. The current GEOMOD analysis assigns peat soil a suitability rating consistent with the state of the entire industry in 2003, i.e. determined by many decades of palm expansion and ignoring any recent changes. Had the suitability rating been assigned based solely on changes in the last decade, peat soils would have been assigned a much higher suitability rating, and presumably GEOMOD would have projected a great deal more conversion of peat land to meet marginal palm oil demand.
7 We have already noted that differencing can introduce additional inaccuracy into analysis, and such an approach would not be an exception. However, we believe that it is rather illustrative of how different the conclusions are depending on whether we believe that the status at a single point in time or recent trends are a better guide to future behavior.
Comments International Council on Clean Transportation 9
ICCT comments on EPA palm oil NODA
Table 1. Suitability ranking for soil types in Malaysia (ignoring those < 0.5% of total Malaysian coverage)
Soil type
Palm oil
Overall in Malaysia
Pre
vale
nce
in
200
3
200
3 ra
tio
of
pal
m:o
vera
ll
200
3 ra
nkin
g
Pre
vale
nce
in
200
9
200
9 r
atio
of
pal
m:o
vera
ll
200
9 r
anki
ng
% o
f in
crea
se
200
3 to
20
09
Rat
io o
f ch
ang
e:ov
eral
l
Ran
king
in
chan
ge
Acrisols 70% 0.88 5 67% 0.84 5 60% 0.75 6 80%
Ferralsols 1% 0.03 7 1% 0.03 7 0% 0.01 7 36%
Fluvisols 6% 1.50 2 6% 1.46 3 5% 1.35 2 4%
Gleysols 11% 2.66 1 9% 2.19 1 4% 0.87 4 4%
Histosols 8% 1.04 4 13% 1.66 2 27% 3.39 1 8%
Lithosols 0% 0.11 6 0% 0.28 6 1% 0.77 5 1%
Luvisols 2% 1.42 3 2% 1.37 4 2% 1.26 3 2%
Note: Grey shading for soils with lower suitability ranking than histosols in a given year, cream for soils with higher suitability ranking.
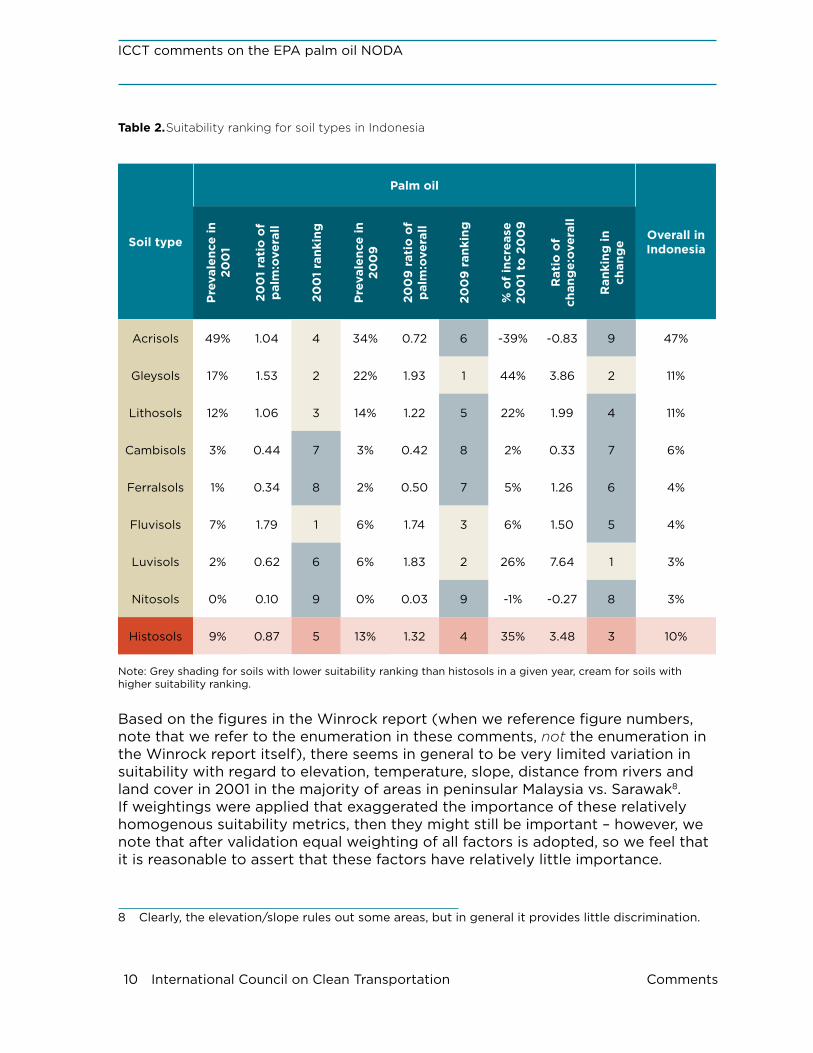
Although we are focusing on the Malaysian case, it is pertinent to undertake the same analysis for Indonesia to determine whether a similar pattern is distinguish-able. In Table 3, we find that the same pattern is indeed evident, although less pronounced. This is consistent with the results in Miettinen et al. (2012a, b) that find that while peat drainage for palm has accelerated in both Indonesia and Malaysia, the expected rate in the coming decade is less in Indonesia. Still, calibra-tion based on 2001 would lead us to believe that soils covering 72% of Indonesia were more suitable for palm than peat soils, while based on 2009 this would dramatically shrink to 18%. The suitability parameter is only 0.87 in 2003, but for the change in the period 2001-2009, it would be four times larger, at 3.48. As with Malaysia, we would anticipate that this would have a profound effect on the model outcomes.
10 International Council on Clean Transportation Comments
ICCT comments on the EPA palm oil NODA
Table 2. Suitability ranking for soil types in Indonesia
Soil type
Palm oil
Overall in Indonesia
Pre
vale
nce
in
200
1
200
1 ra
tio
of
pal
m:o
vera
ll
200
1 ra
nkin
g
Pre
vale
nce
in
200
9
200
9 r
atio
of
pal
m:o
vera
ll
200
9 r
anki
ng
% o
f in
crea
se
200
1 to
20
09
Rat
io o
f ch
ang
e:ov
eral
l
Ran
king
in
chan
ge
Acrisols 49% 1.04 4 34% 0.72 6 -39% -0.83 9 47%
Gleysols 17% 1.53 2 22% 1.93 1 44% 3.86 2 11%
Lithosols 12% 1.06 3 14% 1.22 5 22% 1.99 4 11%
Cambisols 3% 0.44 7 3% 0.42 8 2% 0.33 7 6%
Ferralsols 1% 0.34 8 2% 0.50 7 5% 1.26 6 4%
Fluvisols 7% 1.79 1 6% 1.74 3 6% 1.50 5 4%
Luvisols 2% 0.62 6 6% 1.83 2 26% 7.64 1 3%
Nitosols 0% 0.10 9 0% 0.03 9 -1% -0.27 8 3%
Histosols 9% 0.87 5 13% 1.32 4 35% 3.48 3 10%
Note: Grey shading for soils with lower suitability ranking than histosols in a given year, cream for soils with higher suitability ranking.
Based on the figures in the Winrock report (when we reference figure numbers, note that we refer to the enumeration in these comments, not the enumeration in the Winrock report itself), there seems in general to be very limited variation in suitability with regard to elevation, temperature, slope, distance from rivers and land cover in 2001 in the majority of areas in peninsular Malaysia vs. Sarawak8. If weightings were applied that exaggerated the importance of these relatively homogenous suitability metrics, then they might still be important – however, we note that after validation equal weighting of all factors is adopted, so we feel that it is reasonable to assert that these factors have relatively little importance.
8 Clearly, the elevation/slope rules out some areas, but in general it provides little discrimination.
Comments International Council on Clean Transportation 11
ICCT comments on EPA palm oil NODA
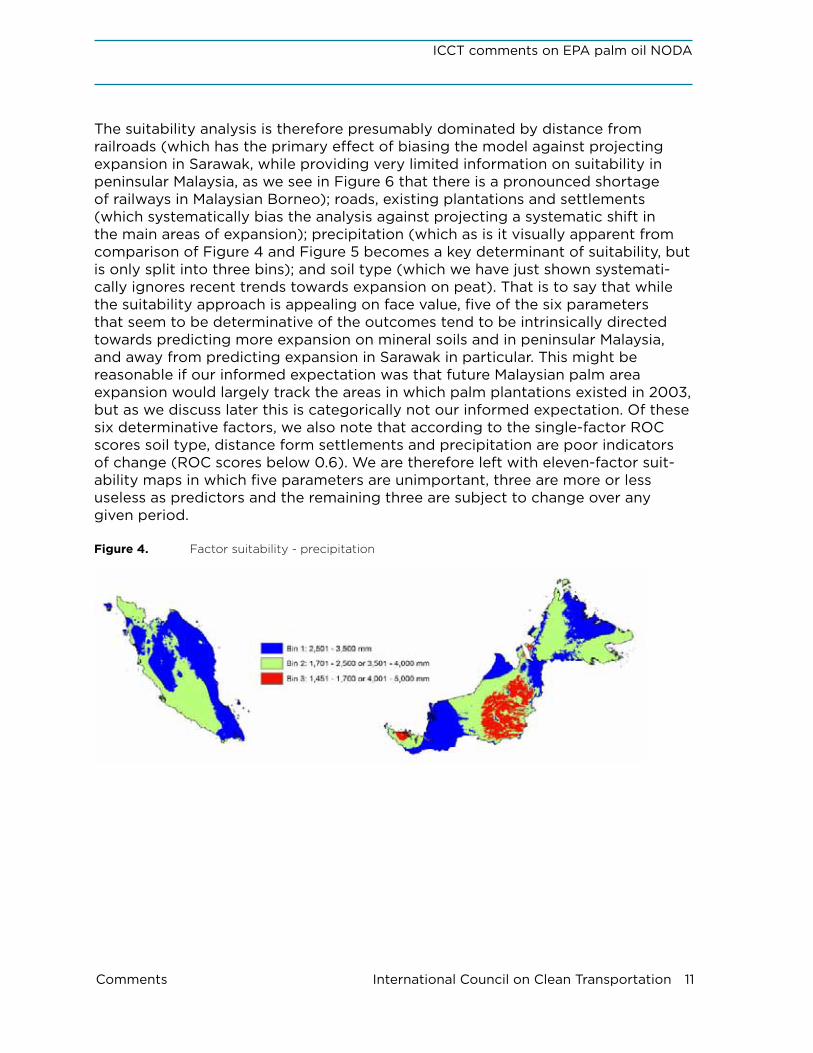
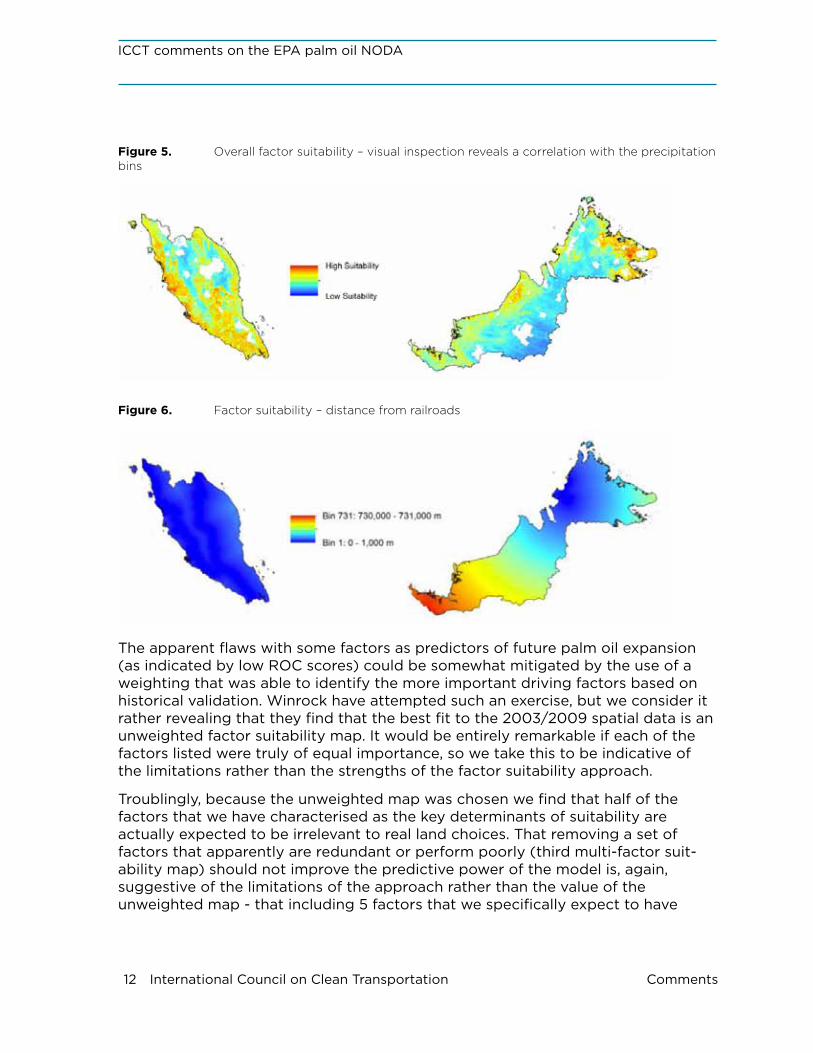
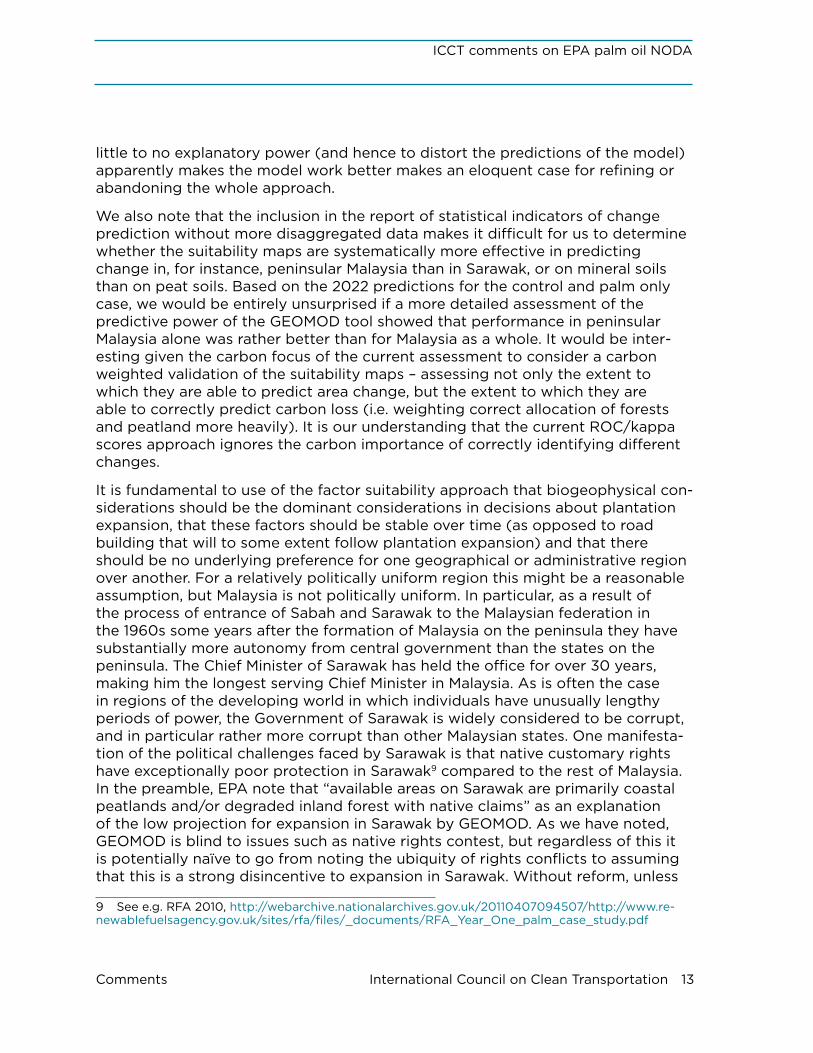
The suitability analysis is therefore presumably dominated by distance from railroads (which has the primary effect of biasing the model against projecting expansion in Sarawak, while providing very limited information on suitability in peninsular Malaysia, as we see in Figure 6 that there is a pronounced shortage of railways in Malaysian Borneo); roads, existing plantations and settlements (which systematically bias the analysis against projecting a systematic shift in the main areas of expansion); precipitation (which as is it visually apparent from comparison of Figure 4 and Figure 5 becomes a key determinant of suitability, but is only split into three bins); and soil type (which we have just shown systemati-cally ignores recent trends towards expansion on peat). That is to say that while the suitability approach is appealing on face value, five of the six parameters that seem to be determinative of the outcomes tend to be intrinsically directed towards predicting more expansion on mineral soils and in peninsular Malaysia, and away from predicting expansion in Sarawak in particular. This might be reasonable if our informed expectation was that future Malaysian palm area expansion would largely track the areas in which palm plantations existed in 2003, but as we discuss later this is categorically not our informed expectation. Of these six determinative factors, we also note that according to the single-factor ROC scores soil type, distance form settlements and precipitation are poor indicators of change (ROC scores below 0.6). We are therefore left with eleven-factor suit-ability maps in which five parameters are unimportant, three are more or less useless as predictors and the remaining three are subject to change over any given period.
Figure 4. Factor suitability - precipitation
12 International Council on Clean Transportation Comments
ICCT comments on the EPA palm oil NODA
Figure 5. Overall factor suitability – visual inspection reveals a correlation with the precipitation bins
Figure 6. Factor suitability – distance from railroads
The apparent flaws with some factors as predictors of future palm oil expansion (as indicated by low ROC scores) could be somewhat mitigated by the use of a weighting that was able to identify the more important driving factors based on historical validation. Winrock have attempted such an exercise, but we consider it rather revealing that they find that the best fit to the 2003/2009 spatial data is an unweighted factor suitability map. It would be entirely remarkable if each of the factors listed were truly of equal importance, so we take this to be indicative of the limitations rather than the strengths of the factor suitability approach.
Troublingly, because the unweighted map was chosen we find that half of the factors that we have characterised as the key determinants of suitability are actually expected to be irrelevant to real land choices. That removing a set of factors that apparently are redundant or perform poorly (third multi-factor suit-ability map) should not improve the predictive power of the model is, again, suggestive of the limitations of the approach rather than the value of the unweighted map - that including 5 factors that we specifically expect to have
Comments International Council on Clean Transportation 13
ICCT comments on EPA palm oil NODA
little to no explanatory power (and hence to distort the predictions of the model) apparently makes the model work better makes an eloquent case for refining or abandoning the whole approach.
We also note that the inclusion in the report of statistical indicators of change prediction without more disaggregated data makes it difficult for us to determine whether the suitability maps are systematically more effective in predicting change in, for instance, peninsular Malaysia than in Sarawak, or on mineral soils than on peat soils. Based on the 2022 predictions for the control and palm only case, we would be entirely unsurprised if a more detailed assessment of the predictive power of the GEOMOD tool showed that performance in peninsular Malaysia alone was rather better than for Malaysia as a whole. It would be inter-esting given the carbon focus of the current assessment to consider a carbon weighted validation of the suitability maps – assessing not only the extent to which they are able to predict area change, but the extent to which they are able to correctly predict carbon loss (i.e. weighting correct allocation of forests and peatland more heavily). It is our understanding that the current ROC/kappa scores approach ignores the carbon importance of correctly identifying different changes.
It is fundamental to use of the factor suitability approach that biogeophysical con-siderations should be the dominant considerations in decisions about plantation expansion, that these factors should be stable over time (as opposed to road building that will to some extent follow plantation expansion) and that there should be no underlying preference for one geographical or administrative region over another. For a relatively politically uniform region this might be a reasonable assumption, but Malaysia is not politically uniform. In particular, as a result of the process of entrance of Sabah and Sarawak to the Malaysian federation in the 1960s some years after the formation of Malaysia on the peninsula they have substantially more autonomy from central government than the states on the peninsula. The Chief Minister of Sarawak has held the office for over 30 years, making him the longest serving Chief Minister in Malaysia. As is often the case in regions of the developing world in which individuals have unusually lengthy periods of power, the Government of Sarawak is widely considered to be corrupt, and in particular rather more corrupt than other Malaysian states. One manifesta-tion of the political challenges faced by Sarawak is that native customary rights have exceptionally poor protection in Sarawak9 compared to the rest of Malaysia. In the preamble, EPA note that “available areas on Sarawak are primarily coastal peatlands and/or degraded inland forest with native claims” as an explanation of the low projection for expansion in Sarawak by GEOMOD. As we have noted, GEOMOD is blind to issues such as native rights contest, but regardless of this it is potentially naïve to go from noting the ubiquity of rights conflicts to assuming that this is a strong disincentive to expansion in Sarawak. Without reform, unless
9 See e.g. RFA 2010, http://webarchive.nationalarchives.gov.uk/20110407094507/http://www.re-newablefuelsagency.gov.uk/sites/rfa/files/_documents/RFA_Year_One_palm_case_study.pdf
14 International Council on Clean Transportation Comments
ICCT comments on the EPA palm oil NODA
companies are RSPO members or have other CSR policies to restrain them, the risks from rights conflicts in Sarawak may be rather less than the benefits from easy access to planting concessions for those with the right links to the ruling regime – in contrast, the much better enforced policies on nature protection, native rights and governance in general on the peninsula may make expansion seem relatively difficult.
Palm expansion in Malaysia – why we expect Sarawak to play a dominant role to 2022
As mentioned above, the GEOMOD suitability ratings suggest that expansion of palm oil area in Malaysia will be skewed towards incremental expansion around existing areas, rather than a significant shift to expansion in new areas. We have already explained why it is unsurprising that GEOMOD gives this result regardless of whether it matches an informed expectation of the future – now we will explain what that informed expectation suggests, and why we find the GEOMOD results incredible.
Malaysia can be thought of, for the purpose of this discussion, as divided into three key regions – peninsular Malaysia, Sabah and Sarawak. The peninsular states have a well-established palm oil industry, as does Sabah, with palm agriculture covering very large areas of potential agricultural land. Sarawak, on the other hand, has a comparatively undeveloped palm oil sector – it is generally agreed (as noted in the preamble) that the potential for expansion in Sarawak is much higher than in either Sabah or Sarawak. This high potential for expansion is evidenced in the MPOB data for palm oil expansion from 2000 to 2009. They note that expansion in that period in Sarawak (area growth of 154%) was higher in absolute terms than in either Sabah or peninsular Malaysia in the same period.
The analysis using GEOMOD implies that this trend will be reversed in the coming decade. While MPOB data shows just under 40% of expansion 2000-2009 occurring in Sarawak, the GEOMOD results to 2022 have only 7% of expansion in the palm only case occurring in that state. This might seem less unreasonable if the local land use dynamics were reversed – i.e. if available land in Sarawak rather than elsewhere was running out, Sarawak had a stronger regulatory enforcement of rules limiting land use change than other areas and the Sarawaki Government was against rather than committed to plantation expansion – but in reality it seems likely that the Sarawaki dominance in land expansion for palm will not be reversed but accelerated. Indeed, the Sarawaki Government is targeting 2 million hectares of palm area by 2020. The Borneo Post10 reported in 2011 that according to industry analyst Mahbob Abdullah, “The remaining areas suitable for oil palm are not significant in size in Peninsular Malaysia or in Sabah. In Sarawak however
10 http://www.theborneopost.com/2011/09/18/sarawaks-palm-oil-industry-the-next-catalyst-for-growth/
Comments International Council on Clean Transportation 15
ICCT comments on EPA palm oil NODA
this is not the case. There are large peat areas and I believe that one day most will be planted as we gain knowledge on increasing productivity in peat areas.” The Post noted that “with the limited landbank left available in Peninsular Malaysia, Sarawak has been put on the spotlight as the final frontier of the Malaysian oil palm industry”, and further that Deputy Chief Minister Datuk Patinggi Tan Sri Alfred Jabu had announced that Sarawak intended to double areas allocated to plantation.
Of course, a single news report is not in itself compelling, but this is not an isolated case – this message is repeated often in news reporting, Sarawaki Government announcements and industry and NGO analysis.11 We are confident that the vast majority of experts on the state of the Malaysian palm oil industry would agree that Sarawak will be a key source of additional land for any overall expansion.
There is no doubt that by failing to capture plausibly the level of expansion in Sarawak, GEOMOD introduces an enormous error term into the attempt to understand the carbon consequences of expansion in the Malaysian palm oil industry. The GEOMOD results contrast very clearly with the trend in plantation expansion apparent in Malaysian Government data. As Miettinen et al. (2012a) show, if the trend from 2007-2010 were continued, we would expect 47% of palm expansion to occur in Sarawak12, and 82% of that to be on peatland. Based on these values, even if no peatland was destroyed anywhere else in Malaysia we would still have 39% of new palm occurring in peat – i.e. a projection of the coming decade that is consistent with recent trends would imply at the absolute minimum four times more emission from peat soils than is currently modelled in the palm NODA. Given the magnitude of peat emissions, this would substantially increase the modelled carbon intensity of palm pathways – we calculate that correcting for expansion onto peat in Sarawak alone as indicated by these data would add 20 kgCO2e/mmBtu to the carbon footprint of palm oil biodiesel/renewable diesel, changing the carbon saving for palm oil biodiesel from EPA’s initial estimate of 17% to -3% in the central case.
The MPOB projections provided to EPA support the viewpoint that GEOMOD is producing systematically implausible results. MPOB expects 51% of palm expansion to occur in Sarawak and Sabah combined – GEOMOD predicts only 22% of the incremental expansion in those states.
11 http://news.mongabay.com/2011/0706-sarawak_palm_oil_target.html, http://borneoproject.org/updates/two-recent-studies-report-on-the-destruction-of-the-malaysian-rainforest, http://www.btimes.com.my/articles/20110705233602/Article/, http://biz.thestar.com.my/news/story.asp?file=/2010/11/30/business/7432538&sec=business, http://www.oxfordbusinessgroup.com/eco-nomic_updates/sarawak-planting-future
12 Note that we see that the proportion of expansion occurring in Sarawak in 2007-2010 is higher than 2000-2009 consistent with the narrative of expansion focused in Sarawak that we have laid out.
16 International Council on Clean Transportation Comments
ICCT comments on the EPA palm oil NODA
Malaysia and Indonesia together
We have focused on Malaysia and Sarawak here because the connection between expansion in Sarawak and peat/forest loss is so well documented. Still, the systematic weaknesses in the GEOMOD approach for Malaysia are also reflected in Indonesia, even if it seems that the Indonesian outcomes are not quite so divergent from rational expectation as the Malaysian ones. Nevertheless, if we compare the GEOMOD predictions for palm expansion on peat in Indonesia with recent trends we see the same pattern. GEOMOD predicts 13% of marginal expansion to 2022 to occur on peat, rather less than the 22% of palm that is currently on peat. It also contradicts the trend identified by Miettinen et al. (2012a) who predict a minimum of 28% of palm to go on peat in the coming decade based on the period 2007-10, and ISPO (2012)13 who identify 25% of palm oil expansion from 2005-10 occurring on peat, in line with a steadily increasing trend. New work by Carlson et al. (2012) shows that for West Kalimantan specifically, in 2001 only 19% of palm was on peat – whereas in the period 2008-2011 fully 69% of new conversion happened on peat lands. Based on all of this data, we believe that the rate of marginal palm expansion onto peat in Indonesia will be at least twice the rate predicted by GEOMOD, and potentially more. Doubling the value would add a further 16 kgCO2e/mmBtu to the emissions profile of palm oil biodiesel – still almost certainly an underestimate given recent trends.
Thus, if we correct the rate of oil palm expansion on to peat to plausible levels for both Malaysia and Indonesia, the carbon intensity would increase by at least 40 kgCO2e/mmBtu14 – and we note again that we consider these to be minimum reasonable estimates and that the central case should be even higher than this. With these extra emissions, far from meeting the 20% threshold for carbon savings to qualify as a renewable fuel, palm oil biodiesel would have an emissions intensity more than 20% higher than fossil diesel.
Determination of land use change in palm only case
The GEOMOD factor suitability results are applied to the FAPRI land use change results via the assumption that the available areas will be used in order of suit-ability as the palm oil area expands. That is to say, the GEOMOD/FAPRI model is built on the presumption that it is possible to identify not only general trends in land use, but that the most appropriate way to predict LUC outcomes is to identify specific land parcels that are expected to be used. We believe that this approach injects false precision to the model, and by doing so actually creates a risk of introducing substantial errors into the results. The control case represents
13 Comments for Docket ID No. EPA-HQ-OAR-2011-0542: “Notice of Data Availability Concerning Renewable Fuels Produced from Palm Oil under the RFS Program.” by: Dr. Rosediana Suharto Indo-nesian Sustainable Palm Oil (ISPO) Commission
14 20 kgCO2e/mmBtu in Sarawak, 3 kgCO2e/mmBtu elsewhere in Malaysia, 16 kgCO2e/mmBtu in Indonesia.
Comments International Council on Clean Transportation 17
ICCT comments on EPA palm oil NODA
a baseline for 2022 that the modellers would not claim aims to be an accurate reflection of the world as it will be in 2022. Certainly, it will attempt to capture key trends, but the FAPRI modelling structure is designed to give a meaningful delta between a control and scenario case, not to give an accurate prediction of the world in 2022. This is because there will be many market forces between now and 2022 that represent larger shocks to the system than biofuel mandates, and to attempt to predict these is well beyond the scope of the modelling. The point is that the value for predicted additional incremental land use change, the delta between the control and scenario cases, is supposed to be somewhat robust – but assumptions about which specific land parcels that increment will include have no robustness whatsoever.
To put it another way, if one accepted the efficacy of the GEOMOD approach and believed that its predictions for the order in which new land areas will be converted were 100% accurate, then if the ‘real’ 2022 baseline land use for oil palm were out by a relatively minor 100 kha (the approximate size of the incremental demand in the palm only case) then every single parcel of land identified for incremental expansion would be wrong. If the ‘real’ baseline had an extra 100 kha, then the parcels identified with GEOMOD would, by hypothesis, already be in use. If the ‘real’ baseline had 100 kha less, then none of the parcels identified by GEOMOD would be suitable enough to be converted. We therefore argue that insofar as the results of the GEOMOD parcel-wise land allocation reflect the broader trend, there is no point in doing specific allocations in the first place – and in so far as the specific allocations depart from the broader trend, these departures should be considered as error terms rather than as improved resolution.
Alternative approaches
As outlined above, we believe that there are good reasons to consider the GEOMOD approach unsuitable for the analysis in hand, and hence to reject it in favour of a simpler approach based on recent trends. In this, we echo the conclu-sions of Sloan and Pelletier (2012)15 who assess the usefulness of GEOMOD based spatial allocation modelling using a Panamanian example, and “recommend ‘stepping back’ from such detailed, projected baselines to take a simpler, more aggregate approach to reference levels, be it spatially explicit or otherwise. Doing so may lessen or even preclude allocation error while exploiting the likelihood that forest-cover change is more consistent at greater spatial scales, all features which promote accuracy.” Such an approach would also be much more consistent with the premise of the MODIS analysis used for other pathways (although as mentioned above we have concerns about the accuracy of those specific results).
15 Sean Sloan, Johanne Pelletier (2012). How accurately may we project tropical forest-cover change? A validation of a forward-looking baseline for REDD. Global Environmental Change 22 (2012) 440–453.
18 International Council on Clean Transportation Comments
ICCT comments on the EPA palm oil NODA
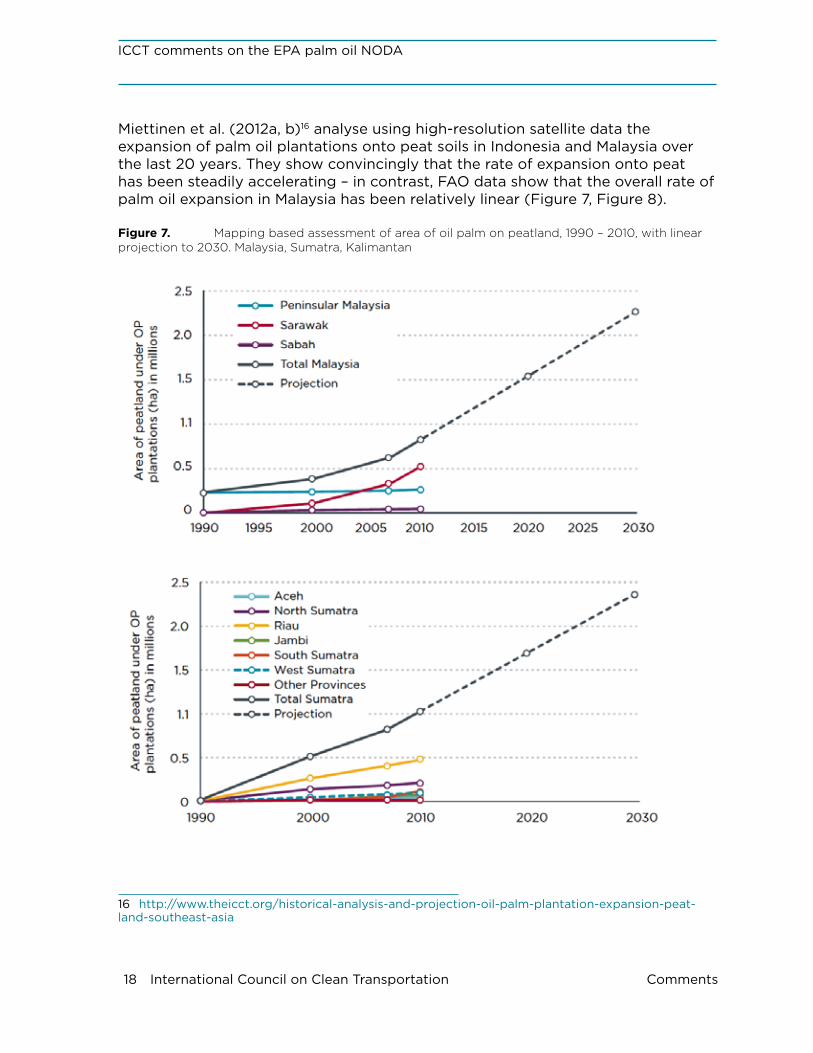
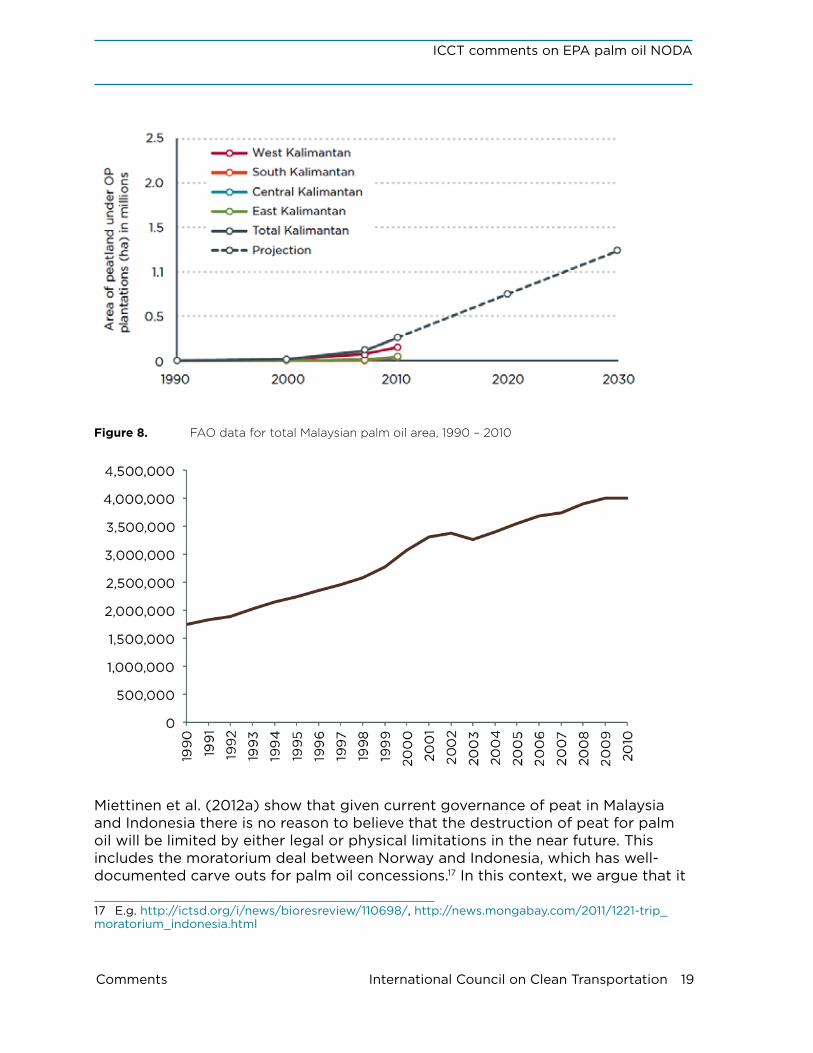
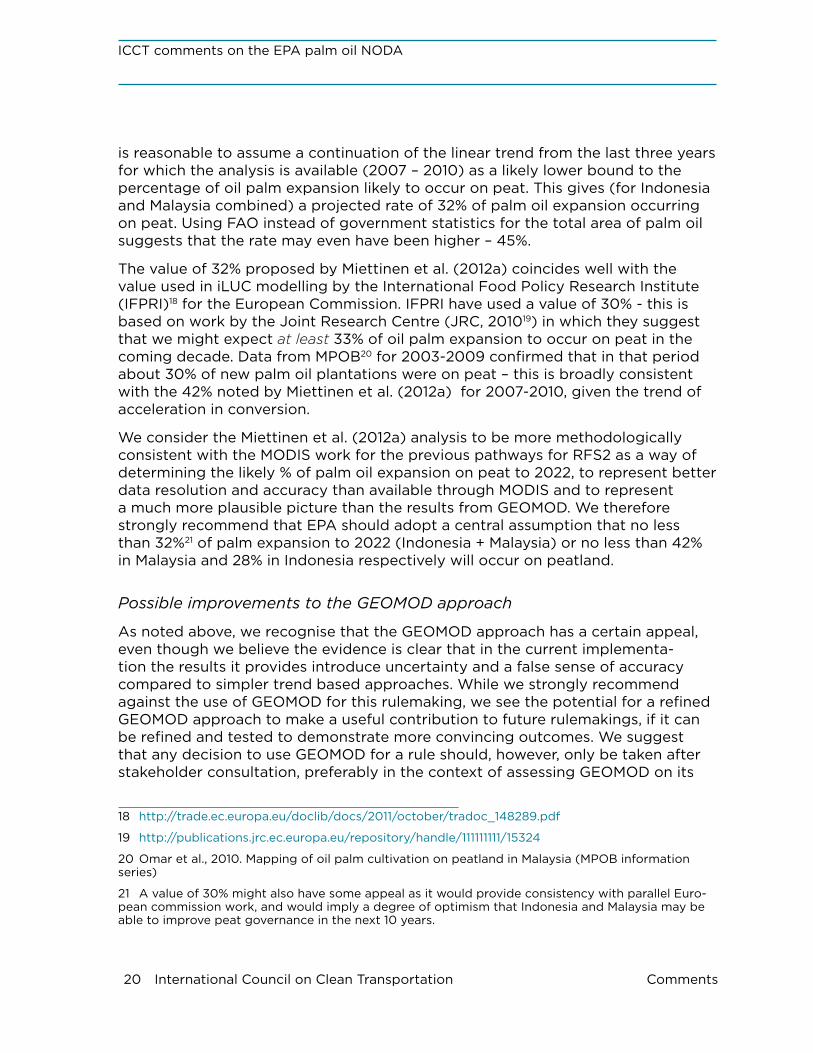
Miettinen et al. (2012a, b)16 analyse using high-resolution satellite data the expansion of palm oil plantations onto peat soils in Indonesia and Malaysia over the last 20 years. They show convincingly that the rate of expansion onto peat has been steadily accelerating – in contrast, FAO data show that the overall rate of palm oil expansion in Malaysia has been relatively linear (Figure 7, Figure 8).
Figure 7. Mapping based assessment of area of oil palm on peatland, 1990 – 2010, with linear projection to 2030. Malaysia, Sumatra, Kalimantan
16 http://www.theicct.org/historical-analysis-and-projection-oil-palm-plantation-expansion-peat-land-southeast-asia
Comments International Council on Clean Transportation 19
ICCT comments on EPA palm oil NODA
Figure 8. FAO data for total Malaysian palm oil area, 1990 – 2010
Miettinen et al. (2012a) show that given current governance of peat in Malaysia and Indonesia there is no reason to believe that the destruction of peat for palm oil will be limited by either legal or physical limitations in the near future. This includes the moratorium deal between Norway and Indonesia, which has well-documented carve outs for palm oil concessions.17 In this context, we argue that it
17 E.g. http://ictsd.org/i/news/bioresreview/110698/, http://news.mongabay.com/2011/1221-trip_moratorium_indonesia.html
20 International Council on Clean Transportation Comments
ICCT comments on the EPA palm oil NODA
is reasonable to assume a continuation of the linear trend from the last three years for which the analysis is available (2007 – 2010) as a likely lower bound to the percentage of oil palm expansion likely to occur on peat. This gives (for Indonesia and Malaysia combined) a projected rate of 32% of palm oil expansion occurring on peat. Using FAO instead of government statistics for the total area of palm oil suggests that the rate may even have been higher – 45%.
The value of 32% proposed by Miettinen et al. (2012a) coincides well with the value used in iLUC modelling by the International Food Policy Research Institute (IFPRI)18 for the European Commission. IFPRI have used a value of 30% - this is based on work by the Joint Research Centre (JRC, 201019) in which they suggest that we might expect at least 33% of oil palm expansion to occur on peat in the coming decade. Data from MPOB20 for 2003-2009 confirmed that in that period about 30% of new palm oil plantations were on peat – this is broadly consistent with the 42% noted by Miettinen et al. (2012a) for 2007-2010, given the trend of acceleration in conversion.
We consider the Miettinen et al. (2012a) analysis to be more methodologically consistent with the MODIS work for the previous pathways for RFS2 as a way of determining the likely % of palm oil expansion on peat to 2022, to represent better data resolution and accuracy than available through MODIS and to represent a much more plausible picture than the results from GEOMOD. We therefore strongly recommend that EPA should adopt a central assumption that no less than 32%21 of palm expansion to 2022 (Indonesia + Malaysia) or no less than 42% in Malaysia and 28% in Indonesia respectively will occur on peatland.
Possible improvements to the GEOMOD approach
As noted above, we recognise that the GEOMOD approach has a certain appeal, even though we believe the evidence is clear that in the current implementa-tion the results it provides introduce uncertainty and a false sense of accuracy compared to simpler trend based approaches. While we strongly recommend against the use of GEOMOD for this rulemaking, we see the potential for a refined GEOMOD approach to make a useful contribution to future rulemakings, if it can be refined and tested to demonstrate more convincing outcomes. We suggest that any decision to use GEOMOD for a rule should, however, only be taken after stakeholder consultation, preferably in the context of assessing GEOMOD on its
18 http://trade.ec.europa.eu/doclib/docs/2011/october/tradoc_148289.pdf
19 http://publications.jrc.ec.europa.eu/repository/handle/111111111/15324
20 Omar et al., 2010. Mapping of oil palm cultivation on peatland in Malaysia (MPOB information series)
21 A value of 30% might also have some appeal as it would provide consistency with parallel Euro-pean commission work, and would imply a degree of optimism that Indonesia and Malaysia may be able to improve peat governance in the next 10 years.
Comments International Council on Clean Transportation 21
ICCT comments on EPA palm oil NODA
merits rather than as a subcategory of commentary on a specific pathway.
We imagine that other stakeholders would be able to make many useful sug-gestions regarding how the GEOMOD analysis could be made more useful – the following ideas occur to us at this time:
• The validation of GEOMOD is based on comparing its predictions for areas in which oil palm was expected to expand in the period 2003-2009. This validation process does not distinguish between an identification failure that would make little difference to carbon emissions, with an identification failure that could have a major impact on emissions – so, for instance, a systematic failure to identify peat conversion could be masked in the statistics by relatively good performance on other areas. Given that carbon is the focus of the RFS2 analyses, we would encourage any future GEOMOD analysis to include carbon weighted validation statistics (i.e. favour weightings that give the most realistic carbon emissions result).
• The GEOMOD approach will work most effectively when applied to relatively politically/legally/economically homogenous regions. Applying it country by country is clearly preferable to applying it at an even broader regional level, but as discussed above there can be very significant differences between administrative regions in countries. We suspect that the GEOMOD analysis for this NODA would likely have been more convincing if an alternative methodology had been used (such as historical trend analysis) to determine distribution of expansion between administrative regions such as Malaysian states, and GEOMOD had then been applied to each state individually.
• We believe that the attempt to specify an exact set of land parcels where expansion will occur is fundamentally flawed, as such accuracy is impossible with future projections of this sort. As noted above, such false-accuracy can, if it makes a difference, only introduce error terms with no real analytic meaning. An alternative scheme in which an average per-hectare result over a much larger incremental change was determined would introduce less noise to the results.
• Calibration based on the state of the industry in a given year makes the factor suitability maps dependent on the entire history of palm oil develop-ment up to that point. We suggest that unless solid evidence is available that there have been no systematic changes in trends over the history of the plantation sector, it may be more appropriate to calibrate based on more recent changes. We note that differencing introduces its own issues into any analysis, and therefore caution should be exercised to ensure that data quality supports such an approach.
• The biogeophysical characterisation of agricultural decision-making clearly ignores other (and potentially more important) factors, like governance, economics and so forth. We imagine that it would be challenging to construct a broadly acceptable metric to measure these more political
22 International Council on Clean Transportation Comments
ICCT comments on the EPA palm oil NODA
factors as suitability inputs, but without a successful characterisation of more of these issues we doubt that GEOMOD could ever be considered an adequate modelling tool, at least for cases such as this where biogeophysical parameters are unlikely to be the key determinants of land use choice. In the current case, examples of metrics that might be considered as proxies for political factors (implementation of any of these would require careful thought) could be existing undeveloped palm concessions, % of court cases on native customary rights in which the native plaintiffs are successful, labour force availability etc. It is unlikely that such metrics could be meaning-fully constructed at the high resolution used for the other biogeophysical characteristics, but this may not be insurmountable. The inclusion of land management zones in the Indonesian analysis represents a starting point in this direction.
• A great deal more analysis and reasoning should be put into determining a weighting. In general, in cases where equal weighting including factors expected to be irrelevant gives the best statistics, we would tend to see this as an indication more that no appropriate weighting has been found than that an equal weighting is a good solution. Unless a weighting can be found that makes logical sense and matches important near term trends as well as giving strong correlation statistics, it is probably reasonable to assume that the allocation system will have limited power.
Peat degradation emissions
We are aware that several commenters have questioned the primary conclusion of our literature review on peat emissions (Page et al. 2011)22. We stand by the con-clusions and recommendations of this paper, and refer EPA to comments that we understand will be submitted by several co-authors of that report addressing the concerns expressed by third parties in more detail, and which we fully support.
Deforestation
We consider peat to be the dominant emissions issue for palm oil expansion, but deforestation is also important both from a carbon point of view and in terms of broader environmental cost-benefit considerations, such as biodiversity. We note that the proportion of expansion predicted on forested areas by GEOMOD seems to be consistent with the recent values for Indonesia reported by ISPO (2012), suggesting that the forest loss emissions as currently calculated may be reasonable. In their comments, ISPO argue that the values are inconsistent by re-categorising disturbed forest from the papers they reference as ‘mixed’. We would suggest that this is inappropriate, and note that the carbon loss on conversion of
22 Page, S. E., Morrison, R., Malins, C., Hooijer, A., Rieley, J. O. & Jauhiainen, J. (2011). REVIEW OF PEAT SURFACE GREENHOUSE GAS EMISSIONS FROM OIL PALM PLANTATIONS IN SOUTHEAST ASIA. ICCT White Paper
Comments International Council on Clean Transportation 23
ICCT comments on EPA palm oil NODA
degraded tropical forest is on a comparable scale (albeit in general lower) to that of conversion of natural forest23.
Other issuesIn addition to the detailed comments above focused on yields and the land use change analysis, we have the following additional observations:
Reduction in food consumption
FAPRI predicts that 42% of the additional palm oil required for biofuel production will come from reductions in food consumption. We note that this gives a sub-stantial reduction in iLUC, and we understand that this is a higher rate of food consumption reduction than seen in, for instance, the canola rule. 42% seems within the range that is plausible based on the economic literature, and we presume that if the proportion of feedstock from reduced food consumption is higher than in other pathways it is because palm oil, more so than canola oil, is the primary oil of many of the world’s poor and that poor people have more elastic food consumption than rich people. Reducing food consumption is, of course, a potential welfare issue and this should be recognised.
Substitution by other oils
We understand that the FAPRI modelling includes relatively strong substitu-tion of palm by other vegetable oils. While we agree that vegetable oils are highly substitutable, because of palm oil’s character as the world’s cheapest oil we are surprised that it should be more strongly substituted by other oils (soy and canola) than they are by palm in the other pathways. We would expect the reverse to be true, in general. MIRAGE modelling for the European Commission (Laborde, 2011), for instance, has 97% of additional vegetable oil supply in its palm oil biodiesel scenario being met by palm oil, while 78% of additional supply in the rapeseed biodiesel scenario comes from rapeseed and only 40% of additional supply in its soy biodiesel scenario coming from soy. These values seem more plausible than a case where palm oil is heavily substituted by other oils, and soy less strongly so.
The principle of modelling of indirect land use change
Several commenters have questioned the legitimacy of modelling pathways in the way that the EPA has done for RFS2. We reiterate our support for the principle of
23 E.g. Hendri, Takao Yamashita, Arno Adi Kuntoro and Han Soo Lee (2012). Carbon stock measure-ments of a degraded tropical logged-over secondary forest in Manokwari Regency, West Papua, Indonesia. FORESTRY STUDIES IN CHINA Volume 14, Number 1 (2012), 8-19 http://www.springerlink.com/content/550g18j0u5812626
24 International Council on Clean Transportation Comments
ICCT comments on the EPA palm oil NODA
pathway analyses that include land use change and our agreement that EPA has correctly interpreted EISA by including these terms in the analysis. We support EPA in applying a consistent analytic approach for the palm rulemaking with the other RFS2 pathways.
Malaysian National Key Economic Areas
The comments by the Juday Group have placed heavy emphasis on the ‘National Key Economic Areas’ policy of the Malaysian Government as a reason to expect stronger than trend yield growth. While the NKEA is no doubt relevant to this discussion, we dispute the conclusion that it should be expected to drive yields beyond the historical trend. Indeed, the NKEA itself notes that, “Current National Yield FFB Level has stagnated at 21 MT per hectare with independent smallhold-ers still lagging behind with a 17 MT per hectare average.”24 We therefore believe that it is reasonable to argue that such initiatives will be part of making trend yield improvement plausible, rather than driving improvement above trend. Juday Group seems to imply that yield growth should be credited twice, as the specified growth from 21 t/ha to 26 t/ha FFB yield is broadly consistent with EPA’s current predicted increase to 5 t/ha oil yield. The idea that this 25% growth should be considered to be additional to the baseline growth is not supported by the aspira-tions in the NKEA, and seems to be a wilful misrepresentation or else to show that Juday Group has failed to appreciate that EPA already anticipates strong yield growth. We also note that not all policies succeed, and it might therefore be reasonable to expect that the aspirational goal of the Malaysian Government in the NKEA plans is an upper bound, rather than expected level, for yield growth to 2022.
Trade and the WTO
Several commenters have exhorted the EPA to have regard to the ideal of free trade, and hence not to regulate palm oil biodiesel based on its environmental footprint. It has also been suggested that iLUC-based analysis may be incompat-ible with WTO rules. On the first question, we note that EPA is acting in line with the democratic wishes of the American people, as expressed by Act of Congress, by implementing RFS2 in line with the requirements of EISA. EPA has no power to re-prioritise the RFS to ignore the environmental requirements under EISA, least of all for a single fuel pathway. As regards WTO rules, we note that while the Juday Group wrote that, “The European Union (EU) policy supporting biofuels utilization has been interpreted as having a WTO-illegal domestic industrial protection construct,” such interpretation has not been made by either the WTO, which has not considered the question, or the EU, which continues to apply envi-ronmental restrictions in its policy.
24 http://etp.pemandu.gov.my/Palm_Oil-@-Palm_Oil_-%E2%97%98-_Rubber_-_EPP_2-;_Improve_fresh_fruit_bunch_yield.aspx
Comments International Council on Clean Transportation 25
ICCT comments on EPA palm oil NODA
Social impacts
Several commenters refer to the argued social/economic benefits of palm oil production. In addition to the well documented impact of biofuel demand on food price and consumption, and the parallel tendency to increase food price volatility25, both of which have general negative social impacts, we note that palm oil expansion is strongly associated with land rights conflicts and has at best mixed developmental implications, see for instance RFA (2010).
Expansion of palm oil beyond Southeast Asia
The FAPRI analysis for EPA assumes, reasonably, that the bulk of any new demand for palm oil will be met by the world’s two major palm oil exporters, Indonesia and Malaysia. We believe that this is appropriate given current state of the palm oil market, and reasonable expectations for development. Several commenters have noted that palm oil industries do exist and in several cases are growing in other regions, and that these regions are not well represented in the FAPRI analysis. For a generic palm oil analysis, we believe that the current results are entirely reasonable – however, we note that it might be appropriate in future to consider a separate pathway for palm oil specifically from Latin America. Given the fungibility of global vegetable oil markets, it is not clear that the results would be strikingly different, but it would be reasonable to undertake a full analysis and assessment in due course if there seemed to be reason to believe that the outcomes would differ.
World Growth
We note that the NGO ‘World Growth’ has submitted comments challenging the preliminary finding. We refer the EPA to ‘An Open Letter about Scientific Credibility and the Conservation of Tropical Forests’, available at http://www.scribd.com/forestdata/d/40046525-An-Open-Letter-about-Scientific-Cred-ibility-and-the-Conservation-of-Tropical-Forests, which we believe correctly characterises the credibility of World Growth on these issues.
ReferencesCarlson, K. M., Curran, L. M., Datnasari, D., Pittman, A. M., Soares-Filho, B. S., Asner, G. P.,, Trigg, S., Gaveau, D. A., Lawrence, L., and Rodrigues, H. O. (2012). Committed carbon emissions, deforestation, and community land conversion from oil palm plantation expansion in West Kalimantan, Indonesia. PNAS 2012 : 1200452109v1-201200452.
Diffenbaugh, N., Hertel, T., Scherer, M. and Verma, M. (2012). Response of corn
25 See for instance the 2012 paper ‘Response of corn markets to climate volatility under alternative energy futures’ by Noah S. Diffenbaugh, Thomas W. Hertel, Martin Scherer and Monika Verma1.
26 International Council on Clean Transportation Comments
ICCT comments on the EPA palm oil NODA
markets to climate volatility under alternative energy futures Nature Climate Change
Hendri, Takao Yamashita, Arno Adi Kuntoro and Han Soo Lee (2012). Carbon stock measurements of a degraded tropical logged-over secondary forest in Manokwari Regency, West Papua, Indonesia. FORESTRY STUDIES IN CHINA Volume 14, Number 1 (2012), 8-19 http://www.springerlink.com/content/550g18j0u5812626
Indonesian Sustainable Palm Oil (ISPO) Commission (2012). Comments for Docket ID No. EPA-HQ-OAR-2011-0542: “Notice of Data Availability Concerning Renewable Fuels Produced from Palm Oil under the RFS Program.” by: Dr. Rosediana Suharto
Laborde, D. (2011). Assessing the Land Use Change Consequences of European Biofuel Policies. Washington, D.C.: International Food and Policy Research Institute.
Miettinen, J., Hooijer, A., Tollenaar, D., Page, S. E., Malins, C., Vernimmen, R., Shi, C. and Liew, S. C. (2012a). Historical Analysis and Projection of Oil Palm Plantation Expansion on Peatland in Southeast Asia, The International Council on Clean Transportation
Miettinen, J., Hooijer, A., Shi, C., Tollenaar, D., Vernimmen, R., Liew, S. C., Malins, C. and Page, S. E. (2012b), Extent of industrial plantations on Southeast Asian peatlands in 2010 with analysis of historical expansion and future projections. GCB Bioenergy. doi: 10.1111/j.1757-1707.2012.01172.x
Omar et al., 2010. Mapping of oil palm cultivation on peatland in Malaysia (MPOB information series)
Page, S. E., Morrison, R., Malins, C., Hooijer, A., Rieley, J. O. & Jauhiainen, J. (2011). REVIEW OF PEAT SURFACE GREENHOUSE GAS EMISSIONS FROM OIL PALM PLANTATIONS IN SOUTHEAST ASIA. ICCT White Paper
Renewable Fuels Agency (2010) Palm Oil Cultivation in Malaysia: Case Study, Renewable Fuels Agency http://webarchive.nationalarchives.gov.uk/20110407094507/http://www.renewablefuelsagency.gov.uk/sites/rfa/files/_documents/RFA_Year_One_palm_case_study.pdf.
Shapiro, R. and Pham, N. (2012) Submission to the Environmental Protection Agency Regarding Its Analysis of Palm Oil as an Additive for Transportation Fuels Under the Renewable Fuel Standard Program
Sloan, S., Pelletier, J. (2012). How accurately may we project tropical forest-cover change? A validation of a forward-looking baseline for REDD. Global Environmental Change 22 (2012) 440–453.