Embed Size (px)
Citation preview

1
ICCI 2015BİLDİRİLER KİTABI / PROCEEDINGS BOOK 6-7-8 Mayıs / May 2015 İstanbul Fuar Merkezi / Istanbul Expo Centerwww.icci.com.tr
21. Uluslararası Enerji ve Çevre Fuarı ve Konferansı21st International Energy and Environment Fair and Conference

BU FUAR 5174 SAYILI KANUN GEREĞİNCE TOBB (TÜRKİYE ODALAR VE BORSALAR BİRLİĞİ) DENETİMİNDE DÜZENLENMEKTEDİR.THIS FAIR IS ORGANIZED WITH THE INSPECTION OF THE UNION OF CHAMBERS AND COMMODITY EXCHANGES OF TURKEY IN
ACCORDANCE WITH THE LAW NUMBER 5174.
27-29 Nisan / April 2016 İstanbul Fuar Merkezi / Istanbul Expo Centerwww.icci.com.tr
ICCI 2016
22. Uluslararası Enerji ve Çevre Fuarı ve Konferansı22nd International Energy and Environment Fair and Conference
Destekleyenler / Supporters
T.C.ÇEVRE VE ŞEHİRCİLİKBAKANLIĞI
REPUBLIC OF TURKEYMINISTRY OF ENVIRONMENTAND URBANISATION
REPUBLIC OF TURKEYMINISTRY OFENERGY AND
NATURAL RESOURCES
İSTANBUL SANAYİ ODASI
ICCI 2015BİLDİRİLER KİTABI / PROCEEDINGS BOOK

2
© Bukitaptayayımlananyazıvegrafiklerinherhakkımahfuzdur.SektörelFuarcılıkLtd.Şti.’ninyazılıiznialınmadan, kaynakgösterilerekdeolsaiktibasedilemez.Bildirilerinbütünsorumluluğuyazarlarına,ilanlarınsorumluluğuilan sahiplerineaittir.
© Allrightsreserved.Nopartsofthispublicationmaybereproducedinanyformorbyanymeans,whetherasa sourcewithouttheconsentoftheSektörelFuarcılıkLtd.Şti.Theresponsibilityofallpresentationsandadsbelong totheirauthoursandowners.
ICCI2015-BildirilerKitabı/ProceedingsBook

3
İçindekiler / Index
ICCI2015-BildirilerKitabı/ProceedingsBook
NükleerEnerjininSürdürülebilirKalkınmaAçısındanDeğerlendirilmesiveDerinliğineGüvenlikFelsefesi 6A.Beril TUĞRUL
HidroelektrikSantrallerinTürkiye’deKuruluGüceSürdürülebilirKatkısı 11Ali İhsan AKAL
AB-TürkiyeEnerjiDiyaloğu’ndaAtılanAdımlar 15Ayşegül UÇKUN
ŞebekedenBağımsızMikroŞebekelerdeEnerjiYönetimininRolü 21Behçet KOCAMAN
TheErection,Operation&MaintenanceofWindFarms-MeasurestoMinimizeProjectRelatedRisksbyDraftingAdaptedTurbineSupplyAgreements,BalanceofPlantand“O&M”Contracts 27Bettina GEISSELER
FGDandSCRRetrofitofCoalFiredPowerPlants 31Ceren MESZELINSKY, Jens REICH
KeyFactorstoBeConsideredinLargeScaleSolarPVProjects 35Cezmi BILMEZ, Kadem Berker YAŞAR, Leila TAVENDALE
IntelligentManagementofDistributionGrids 40Dirk RIESENBERG
TenderProceduresinRelationtoWindandSolarPreliminaryLicenseApplicationsandRecentLegalAmendments 42Döne YALÇIN
BioenergyFromTheAquaticPlantDuckweed 46E.Işıl Arslan TOPAL, Murat TOPAL
BiogasProductionFromFishWastesasAlternativeEnergySource 49E.Işıl Arslan TOPAL, Murat TOPAL
EnhancementofBiogasProductionbyUsageofGreenBiomass 53E.Işıl Arslan TOPAL, Murat TOPAL
ApplicationofZeotropicMixtureofR245fa/R134ainSmallScaleOrganicRankinePowerGenerationCycles 56Gholamreza Bamorovat ABADI, Kyung Chun KIM
ExplosionProtectioninThePowerIndustry 60Hank PAUL, Seher YILMAZ
ControlRoomDesignandRetrofittingofControlStationsinPowerPlants 64Hartmut ERLER
TrijenerasyonSistemiSeçimiveTasarımı 67H. Hüseyin ÖZTÜRK

4
ICCI 2015 - Bildiriler Kitabı / Proceedings Book
İçindekiler / IndexExergyandEnvironment 72İkbal SARIKAYA, Selçuk BILGEN, Lokman Murat AYYILDIZ
ExergyandSustainableDevelopment 78İkbal SARIKAYA, Selçuk BILGEN, Ali BAHADIR, Kamil KAYGUSUZ
20GW’aGidenYoldaEnSıkYaşananBeşRüzgârÖlçümHatasıvePratikÇözümÖnerileri 84İskender KÖKEY
ComparisonofDifferentApproachestoReduceOperationalCosts 88Jens LIPNIZKI, Karina ZEDDA, Burcu Kaleli ÖZTÜRK, Şebnem Aybige ŞENER
CurrentStatusandOperationModesofCogenerationandTrigenerationPlantsDrivenbyGasEngines 91Kasım ZOR, Ahmet TEKE
KojenerasyonSantrallerindeYükAtmaUygulamaları 95Levent KILIÇ, Ayşen Basa ARSOY, Fatih Mehmet NUROĞLU
ÖzelSektörElektrikSantrallerinde154KVŞaltBakımlarınınStandartlaştırılması 99Levent KILIÇ, Ayşen Basa ARSOY, Fatih Mehmet NUROĞLU
Türkiye’deDoğalGazTüketimininİncelenmesiveFarkliYönlerdenİrdelenmesi 103M. Ayşe YIKILMAZ, A. Beril TUĞRUL
NükleerSantrallerinEnerjiPiyasasınaEtkisininİncelenmesiveÜlkemizAçısındanDeğerlendirilmesi 107Mehmet ŞİMŞEK, A. Beril TUĞRUL
GazYakıtlıMutfakOcaklarındaYakıtTasarrufuSağlanması 112Mesut YAZICI, Sezayi YILMAZ, Süleyman Hilmi YILMAZ, Bayram KÖSE
Türkiye’deElektrikEnerjisiÜretimiveTüketimininDeğerlendirilmesi 117Murat TOPAL, E.Işıl Arslan TOPAL
Türkiye’deYenilenebilirEnerjiKaynaklarındanEnerjiÜretenİşletmelerinMevcutDurumu 121Murat TOPAL, E.Işıl Arslan TOPAL
Türkiye’deYenilenebilirEnerjiKaynaklarınınKuruluGücüveÜretimMiktarlarınınDeğerlendirilmesi 124Murat TOPAL, E.Işıl Arslan TOPAL
DünyadaNükleerEnerjiyeGenelBirBakış 128Muzaffer BAŞARAN
EndüstriyelTesislerinElektrikÜretimSistemlerininYükKontrolü(LoadControlUnit,LCU) 134Selahattin KÜÇÜK, Mehmet BAYRAK, A. Serdar YILMAZ
GlobalEnergyConsumptionSectors 138Selçuk BILGEN, İkbal SARIKAYA, Ayça TAÇ
5
ICCI 2015 - Bildiriler Kitabı / Proceedings Book
İçindekiler / IndexEnvironmentalImpactofGlobalEnergyConsumption 143Selçuk BILGEN
EnergyEfficiencyandWaterQualityofTheGalyanRiver 147Selçuk BILGEN, Volkan Numan BULUT
Tunceli’deRüzgârEnerjisiileElektrikÜretimPotansiyeli 151Serhat AKSUNGUR, Tarkan KOCA, Alper Tunga ÖZGÜLER, Emrah GÜRKAN
EnerjiSantrallerinde“GazTransferMembranı”UygulamalarıileİşletmeveYatırımMaliyetlerininDüşürülmesi 155Şebnem Aybige ŞENER, Burcu Kaleli ÖZTÜRK
RüzgârEnerjisiileElektrikÜretimPotansiyeli;MalatyaİliArapgirİlçesiÖrneği 159Tarkan KOCA, Serhat AKSUNGUR, Alper Tunga ÖZGÜLER, Emrah GÜRKAN
GüneşEnerjisiileElektrikÜretimPotansiyeli;MalatyaİliArapgirİlçesiÖrneği 163Tarkan KOCA, Serhat AKSUNGUR, Alper Tunga ÖZGÜLER, Emrah GÜRKAN
SyngasCleanup 167Turgay KAR, Sedat KELEŞ
BubblingFluidizedBedandCirculatingFluidizedBed(CFB) 172Turgay KAR, Sedat KELEŞ, Ali BAHADIR, Kamil KAYGUSUZ
FundamentalsofGasification 177Turgay KAR, Sedat KELEŞ, Kamil KAYGUSUZ
TopluTaşımadaSıkıştırılmışDoğalGaz(CNG)KullanımınınSeraGazıEmisyonlarınaEtkisi 182Yavuz YALÇIN, Şenay AKCAN

6
Nükleer Enerjinin Sürdürülebilir Kalkınma Açısından Değerlendirilmesi ve Derinliğine Güvenlik Felsefesi
A.BerilTUĞRULİstanbul Teknik ÜniversitesiEnerji Enstitüsü
ÖZETSürdürülebilir kalkınma açısından ele alındığında, nükleer santrallerin; doğrudan CO2 salınımlarının olmaması, nispeten küçük mekanda büyük güç üretebilen santrallerin kurulabilmesi, dolayısıyla kurulum gücünün yüksek olması, işletim ve yakıt maliyetinin düşük olması ve santral ömrünün uzun olması vb. gibi hususlar önemli avantajlar olarak öne çıkmaktadır. Günümüz teknolojisi ile “Derinliğine Güvenlik” felsefesi ile olabilecek kaza riski hayli minimize edilebilmektedir. Bu çalışmada, nükleer santrallerin sürdürülebilir kalkınma felsefesi ile değerlendirilmesi ve nükleer güvenliğinin sağlanmasında, nükleer santrallerin tasarımlanmasından ve inşaatına ve lisanslanmasından hayata geçirilmesine kadar derinliğine güvenlik felsefesi göz önünde tutulmasına ilişkin hususlar ele alınarak irdelenmektedir.
1. GİRİŞGünümüzde, önemli bir konu; “Sürdürülebilir Kalkınma” konusudur. Globalleşen ve teknolojik gelişimlerin hızla hayata geçirilebildiği bu dönemde sürdürülebilir kalkınma konusu, göz ardı edilmemesi gereken, hayati önemi haiz bir konu durumundadır[1-3]. Sürdürülebilir kalkınmayı kavramsal olarak açıklayabilmek için, öncelikle kalkınmayı tanımlamak gerekmektedir.
“Kalkınma” sözlük anlamıyla; “toplumsal yapının değişkenlerini hükümetin belli bir siyaset güderek geliştirme çabası” olarak tanımlanmaktadır. “Kalkınmak eylemi” ise; “durumu düzeltmek, kademeli bir şekilde gelişmek, büyümek, ilerlemek” olarak betimlenmektedir.
Kalkınma, refah ekonomisinin hayata geçirilmesini gerektirmektedir ki; bu husus kısaca, makroekonominin kaynak dağıtım verimini ve onun gelir dağılımını beraberce belirlemek üzere mikro ekonomik tekniklerin kullanılması olmaktadır. Bir başka deyişle, refaha hizmet edecek pek çok eylemin hayata geçirilebilmesi ancak uygun bir enerji politikası uygulanmasıyla mümkün olabilmektedir.
Dönüşümü ve kullanımı kolay olması nedeniyle enerji tüketimi içinde elektrik enerjisinin yadsınamaz bir yeri bulunmaktadır. Bir başka deyişle, insanların sosyal, ekonomik ve kültürel çevrelerini yaratabilmeleri ve bu ortamların sürdürülebilmesi büyük boyutlarda enerji talebini ortaya çıkarmaktadır. Dolayısıyla, günümüzde
tüm ülkeler için önde gelen, başat gereksinim; enerjiye ve/veya enerji kaynaklarına ulaşmak olmaktadır. Ayrıca, artan nüfus, teknolojik gelişmeler ve sanayileşme, enerji ihtiyacını artırmakta ve enerjinin önemini pekiştirmektedir [4-5].
Ancak, enerji üretimi ve kullanımı, entropiyi bir başka deyişle değersizleşen enerji miktarını artırmaktadır. Termodinamiğin 2. Kanunu; bir süreç içinde gerekli toplam enerji sabit kaldığı halde, kullanılabilir enerji azalmaktadır demektedir. Kısaca, bu kanun; izole sistemlerin entropisinin asla azalmayacağını belirtir. Değersizleşen enerjinin esas itibariyle çevreye bırakılması, çevre dengelerini negatif etkileyebilmektedir. Dolayısıyla, enerji kullanımı böylesi farklı sonuçlar da doğurabilmektedir.
Burada, Termodinamiğin 1. Kanunu çerçevesinde enerjinin korunum prensibine konu olan enerjiden kullanılabilen enerjiyi ayırt etmek gerekir. Ancak, unutulmaması gereken önemli bir husus; kullanılabilen enerji yanında Termodinamiğin 2. Kanunu çerçevesinde değersiz enerji de söz konusu olacaktır. Bu durumda, fiziksel olarak enerji korunsa da mühendislik kullanımı açısından değersizleşen enerji daima olacaktır. Bu enerji de farklı biçimlerde olabilirse de sonuçta esas itibariyle çevreye bir girdi olarak karşımıza çıkmaktadır. Entropi, doğal döngü içinde yer almaktadır. Ancak, günümüzde enerji kullanımının artmasıyla entropi de giderek artmakta ve doğada çoğu kez negatif etki olarak karşımıza çıkmaktadır.
Bu bağlamda, sanayi devriminin yaygınlaşması sonucunda çevreye bırakılan değersizleşen enerji, artık ve sera gazları gibi unsurlar, sonuçta doğa ve doğal devinimde sorunlar oluşturmaya başlamış ve tehdit boyutuna ulaşmış bulunmaktadır. Bu husus, kalkınma kavramının tekrar ele alınmasını gerektirmiş ve “sürdürülebilir kalkınma” kavramının ortaya çıkmasına neden olmuş bulunmaktadır.
2. SÜRDÜRÜLEBİLİR KALKINMA VE ENERJİ ÜRETİMİ“Sürdürülebilir” kelimesi, sözlük anlamı itibariyle; “gelişim ve süre açısından ele alınan bir eylemin devamlılığını ve/veya devam ettirilebilirliğini” ifade etmektedir. Sürdürülebilir kalkınma ise; “Bugünkü kuşakların yaşam kalitesini yükseltirken, gelecek kuşaklara yaşam kalitesini yükseltme şansı verecek bir dünya bırakmak” anlamına gelmektedir[6].
ICCI2015-BildirilerKitabı/ProceedingsBook
7
ICCI 2015 - Bildiriler Kitabı / Proceedings Book
İlk bakışta, kalkınma için sürdürülebilirliğin kolaylıkla sağlanabileceği düşünülebilir. Ancak, kalkınma gereği olarak ortaya çıkan teknolojik ürünlerin çevreye, canlılara ve insanlara negatif etkilerinin olması söz konusudur. Sürdürülebilir kalkınma gerçekte vazgeçilemez bir unsurdur. Sadece gelecek kuşaklar açısından değil kendi yaşam süremiz boyunca da negatif etkilerden uzak kalabilmek için gereklilik ve elzemlik ifade etmektedir. Bu bağlamda, ülkeler, politikalarını belirlerken sürdürülebilir kalkınmayla uyumlu olması gereken unsurları dikkate almak zorundadırlar. Bu şekilde yaşanabilir bir dünyadan söz etmek mümkün olabilir.
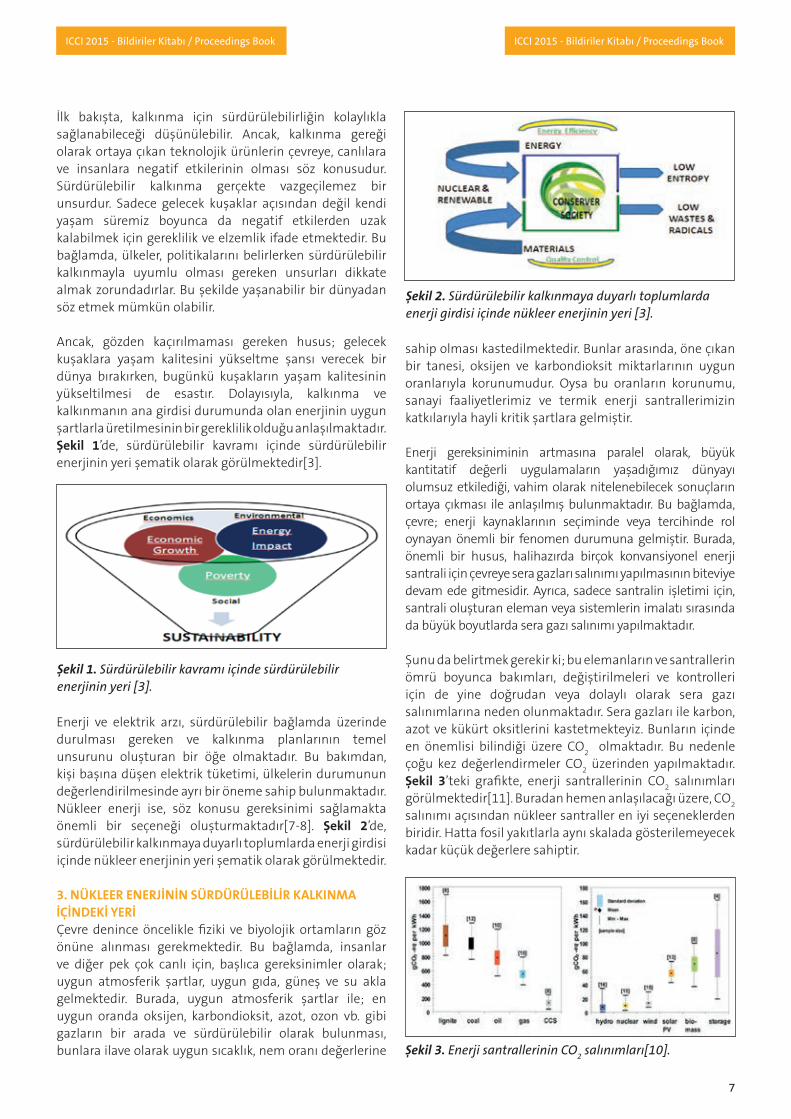
Ancak, gözden kaçırılmaması gereken husus; gelecek kuşaklara yaşam kalitesini yükseltme şansı verecek bir dünya bırakırken, bugünkü kuşakların yaşam kalitesinin yükseltilmesi de esastır. Dolayısıyla, kalkınma ve kalkınmanın ana girdisi durumunda olan enerjinin uygun şartlarla üretilmesinin bir gereklilik olduğu anlaşılmaktadır. Şekil 1’de, sürdürülebilir kavramı içinde sürdürülebilir enerjinin yeri şematik olarak görülmektedir[3].
Enerji ve elektrik arzı, sürdürülebilir bağlamda üzerinde durulması gereken ve kalkınma planlarının temel unsurunu oluşturan bir öğe olmaktadır. Bu bakımdan, kişi başına düşen elektrik tüketimi, ülkelerin durumunun değerlendirilmesinde ayrı bir öneme sahip bulunmaktadır. Nükleer enerji ise, söz konusu gereksinimi sağlamakta önemli bir seçeneği oluşturmaktadır[7-8]. Şekil 2’de, sürdürülebilir kalkınmaya duyarlı toplumlarda enerji girdisi içinde nükleer enerjinin yeri şematik olarak görülmektedir.
3. NÜKLEER ENERJİNİN SÜRDÜRÜLEBİLİR KALKINMA İÇİNDEKİ YERİ Çevre denince öncelikle fiziki ve biyolojik ortamların göz önüne alınması gerekmektedir. Bu bağlamda, insanlar ve diğer pek çok canlı için, başlıca gereksinimler olarak; uygun atmosferik şartlar, uygun gıda, güneş ve su akla gelmektedir. Burada, uygun atmosferik şartlar ile; en uygun oranda oksijen, karbondioksit, azot, ozon vb. gibi gazların bir arada ve sürdürülebilir olarak bulunması, bunlara ilave olarak uygun sıcaklık, nem oranı değerlerine
sahip olması kastedilmektedir. Bunlar arasında, öne çıkan bir tanesi, oksijen ve karbondioksit miktarlarının uygun oranlarıyla korunumudur. Oysa bu oranların korunumu, sanayi faaliyetlerimiz ve termik enerji santrallerimizin katkılarıyla hayli kritik şartlara gelmiştir.
Enerji gereksiniminin artmasına paralel olarak, büyük kantitatif değerli uygulamaların yaşadığımız dünyayı olumsuz etkilediği, vahim olarak nitelenebilecek sonuçların ortaya çıkması ile anlaşılmış bulunmaktadır. Bu bağlamda, çevre; enerji kaynaklarının seçiminde veya tercihinde rol oynayan önemli bir fenomen durumuna gelmiştir. Burada, önemli bir husus, halihazırda birçok konvansiyonel enerji santrali için çevreye sera gazları salınımı yapılmasının biteviye devam ede gitmesidir. Ayrıca, sadece santralin işletimi için, santrali oluşturan eleman veya sistemlerin imalatı sırasında da büyük boyutlarda sera gazı salınımı yapılmaktadır.
Şunu da belirtmek gerekir ki; bu elemanların ve santrallerin ömrü boyunca bakımları, değiştirilmeleri ve kontrolleri için de yine doğrudan veya dolaylı olarak sera gazı salınımlarına neden olunmaktadır. Sera gazları ile karbon, azot ve kükürt oksitlerini kastetmekteyiz. Bunların içinde en önemlisi bilindiği üzere CO2 olmaktadır. Bu nedenle çoğu kez değerlendirmeler CO2 üzerinden yapılmaktadır. Şekil 3’teki grafikte, enerji santrallerinin CO2 salınımları görülmektedir[11]. Buradan hemen anlaşılacağı üzere, CO2
salınımı açısından nükleer santraller en iyi seçeneklerden biridir. Hatta fosil yakıtlarla aynı skalada gösterilemeyecek kadar küçük değerlere sahiptir.
Şekil 1. Sürdürülebilir kavramı içinde sürdürülebilir enerjinin yeri [3].
Şekil 2. Sürdürülebilir kalkınmaya duyarlı toplumlarda enerji girdisi içinde nükleer enerjinin yeri [3].
Şekil 3. Enerji santrallerinin CO2 salınımları[10].
ICCI2015-BildirilerKitabı/ProceedingsBook
8
ICCI 2015 - Bildiriler Kitabı / Proceedings Book
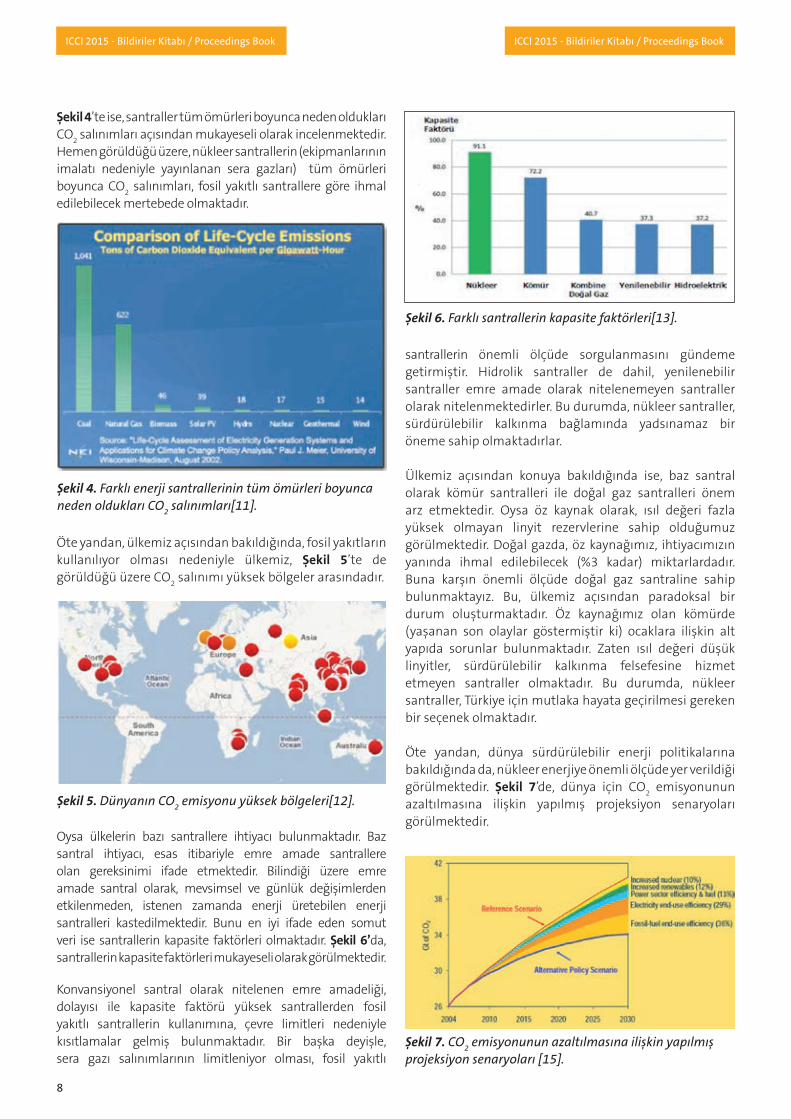
Şekil 4’te ise, santraller tüm ömürleri boyunca neden oldukları CO2 salınımları açısından mukayeseli olarak incelenmektedir. Hemen görüldüğü üzere, nükleer santrallerin (ekipmanlarının imalatı nedeniyle yayınlanan sera gazları) tüm ömürleri boyunca CO2 salınımları, fosil yakıtlı santrallere göre ihmal edilebilecek mertebede olmaktadır.
Öte yandan, ülkemiz açısından bakıldığında, fosil yakıtların kullanılıyor olması nedeniyle ülkemiz, Şekil 5’te de görüldüğü üzere CO2 salınımı yüksek bölgeler arasındadır.
Oysa ülkelerin bazı santrallere ihtiyacı bulunmaktadır. Baz santral ihtiyacı, esas itibariyle emre amade santrallere olan gereksinimi ifade etmektedir. Bilindiği üzere emre amade santral olarak, mevsimsel ve günlük değişimlerden etkilenmeden, istenen zamanda enerji üretebilen enerji santralleri kastedilmektedir. Bunu en iyi ifade eden somut veri ise santrallerin kapasite faktörleri olmaktadır. Şekil 6’da, santrallerin kapasite faktörleri mukayeseli olarak görülmektedir.
Konvansiyonel santral olarak nitelenen emre amadeliği, dolayısı ile kapasite faktörü yüksek santrallerden fosil yakıtlı santrallerin kullanımına, çevre limitleri nedeniyle kısıtlamalar gelmiş bulunmaktadır. Bir başka deyişle, sera gazı salınımlarının limitleniyor olması, fosil yakıtlı
santrallerin önemli ölçüde sorgulanmasını gündeme getirmiştir. Hidrolik santraller de dahil, yenilenebilir santraller emre amade olarak nitelenemeyen santraller olarak nitelenmektedirler. Bu durumda, nükleer santraller, sürdürülebilir kalkınma bağlamında yadsınamaz bir öneme sahip olmaktadırlar.
Ülkemiz açısından konuya bakıldığında ise, baz santral olarak kömür santralleri ile doğal gaz santralleri önem arz etmektedir. Oysa öz kaynak olarak, ısıl değeri fazla yüksek olmayan linyit rezervlerine sahip olduğumuz görülmektedir. Doğal gazda, öz kaynağımız, ihtiyacımızın yanında ihmal edilebilecek (%3 kadar) miktarlardadır. Buna karşın önemli ölçüde doğal gaz santraline sahip bulunmaktayız. Bu, ülkemiz açısından paradoksal bir durum oluşturmaktadır. Öz kaynağımız olan kömürde (yaşanan son olaylar göstermiştir ki) ocaklara ilişkin alt yapıda sorunlar bulunmaktadır. Zaten ısıl değeri düşük linyitler, sürdürülebilir kalkınma felsefesine hizmet etmeyen santraller olmaktadır. Bu durumda, nükleer santraller, Türkiye için mutlaka hayata geçirilmesi gereken bir seçenek olmaktadır.
Öte yandan, dünya sürdürülebilir enerji politikalarına bakıldığında da, nükleer enerjiye önemli ölçüde yer verildiği görülmektedir. Şekil 7’de, dünya için CO2 emisyonunun azaltılmasına ilişkin yapılmış projeksiyon senaryoları görülmektedir.
Şekil 6. Farklı santrallerin kapasite faktörleri[13].
Şekil 5. Dünyanın CO2 emisyonu yüksek bölgeleri[12].
ICCI2015-BildirilerKitabı/ProceedingsBook
Şekil 4. Farklı enerji santrallerinin tüm ömürleri boyunca neden oldukları CO2 salınımları[11].
Şekil 7. CO2 emisyonunun azaltılmasına ilişkin yapılmış projeksiyon senaryoları [15].
9
ICCI 2015 - Bildiriler Kitabı / Proceedings Book
4. NÜKLEER SANTRALLERDE DERİNLİĞİNE GÜVENLİKFELSEFESİ UYGULAMASI Emre amadeliğin yanı sıra, doğrudan CO2 salınımlarının olmaması, nispeten küçük mekanlarda büyük güç üretebilen santraller olarak kurulabilmesi, dolayısıyla kurulum gücünün yüksek olması, işletim ve yakıt maliyetinin düşük olması ve santral ömrünün uzun olması vb. gibi hususlarla önemli avantajlara sahip olan nükleer santrallerin sürdürülebilir kalkınmaya hizmet etmesi isteniyorsa art arda kurulması gerekmektedir.
Nükleer santraller için normal çalışma şartlarında sorun olmamasına karşın kaza halinde istenmeyen şartlar oluşabilmektedir. Ancak, burada da katastrofik kaza olarak nitelenebilecek şartlarda, çevrenin etkilenme riski söz konusu olabilmektedir. Şunu da belirtmek gerekir ki; nükleer santrallerde “tüm tedbirlerin alınmış olmasına karşın istem dışı olarak meydana gelen ve istenmeyen, olumsuz sonuçlara neden olan olay” olarak tanımlanan kazanın meydana gelmemesi için alınan tedbirler, başka hiçbir enerji santralinde olmadığı kadar artırılmış bulunmaktadır. Bu bakımdan, nükleer santraller, tüm enerji santralleri göz önüne alındığında olasılıksal olarak en düşük kaza riskine sahip santraller arasındadır.
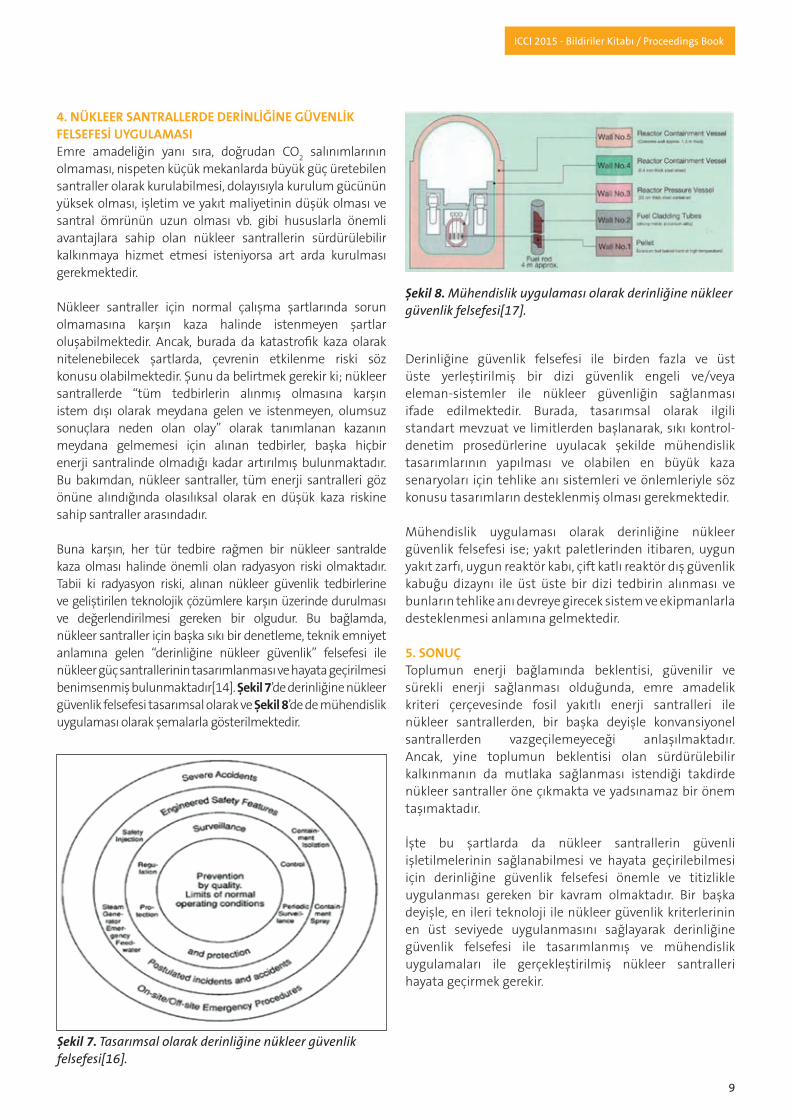
Buna karşın, her tür tedbire rağmen bir nükleer santralde kaza olması halinde önemli olan radyasyon riski olmaktadır. Tabii ki radyasyon riski, alınan nükleer güvenlik tedbirlerine ve geliştirilen teknolojik çözümlere karşın üzerinde durulması ve değerlendirilmesi gereken bir olgudur. Bu bağlamda, nükleer santraller için başka sıkı bir denetleme, teknik emniyet anlamına gelen “derinliğine nükleer güvenlik” felsefesi ile nükleer güç santrallerinin tasarımlanması ve hayata geçirilmesi benimsenmiş bulunmaktadır[14]. Şekil 7’de derinliğine nükleer güvenlik felsefesi tasarımsal olarak ve Şekil 8’de de mühendislik uygulaması olarak şemalarla gösterilmektedir.
Derinliğine güvenlik felsefesi ile birden fazla ve üst üste yerleştirilmiş bir dizi güvenlik engeli ve/veya eleman-sistemler ile nükleer güvenliğin sağlanması ifade edilmektedir. Burada, tasarımsal olarak ilgili standart mevzuat ve limitlerden başlanarak, sıkı kontrol-denetim prosedürlerine uyulacak şekilde mühendislik tasarımlarının yapılması ve olabilen en büyük kaza senaryoları için tehlike anı sistemleri ve önlemleriyle söz konusu tasarımların desteklenmiş olması gerekmektedir.
Mühendislik uygulaması olarak derinliğine nükleer güvenlik felsefesi ise; yakıt paletlerinden itibaren, uygun yakıt zarfı, uygun reaktör kabı, çift katlı reaktör dış güvenlik kabuğu dizaynı ile üst üste bir dizi tedbirin alınması ve bunların tehlike anı devreye girecek sistem ve ekipmanlarla desteklenmesi anlamına gelmektedir.
5. SONUÇToplumun enerji bağlamında beklentisi, güvenilir ve sürekli enerji sağlanması olduğunda, emre amadelik kriteri çerçevesinde fosil yakıtlı enerji santralleri ile nükleer santrallerden, bir başka deyişle konvansiyonel santrallerden vazgeçilemeyeceği anlaşılmaktadır. Ancak, yine toplumun beklentisi olan sürdürülebilir kalkınmanın da mutlaka sağlanması istendiği takdirde nükleer santraller öne çıkmakta ve yadsınamaz bir önem taşımaktadır.
İşte bu şartlarda da nükleer santrallerin güvenli işletilmelerinin sağlanabilmesi ve hayata geçirilebilmesi için derinliğine güvenlik felsefesi önemle ve titizlikle uygulanması gereken bir kavram olmaktadır. Bir başka deyişle, en ileri teknoloji ile nükleer güvenlik kriterlerinin en üst seviyede uygulanmasını sağlayarak derinliğine güvenlik felsefesi ile tasarımlanmış ve mühendislik uygulamaları ile gerçekleştirilmiş nükleer santralleri hayata geçirmek gerekir.
Şekil 7. Tasarımsal olarak derinliğine nükleer güvenlik felsefesi[16].
Şekil 8. Mühendislik uygulaması olarak derinliğine nükleer güvenlik felsefesi[17].
10
ICCI 2015 - Bildiriler Kitabı / Proceedings Book
KAYNAKLAR[1] Tugrul,A.B.“Energy, Sustainable Development and Importance of Worldwide Cooperation”, Novel Energy for the Regenerative Built Environment Technical and Managerial Aspects Workshop, 3-6 Mart 2014, Istanbul.[2] Tugrul, A. B., “Energy Policy and Sustainable Development”, Novel Energy and Biotechnology Developments in the Sustainable Built Environment Workshop, 24-27 Mart 2014, İstanbul.[3] Tugrul,A.B.,Cimen,S,Assessment of Sustainable Energy Development, ICEM-2014, 5-7 June, 2014, Istanbul[4] Tugrul, A.B., “Energy Policy and Interactions with Politics and Economics”, International Conference on Energy Environmental Engineering - ICEEE 2014, Proc. pp. 801-804, 21-22 November 2014, Paris-France.[5] Tugrul, A.B., Cimen, S., “Energy Initiatives for Turkey”, International Conference on Economics and Econometrics - ICEE 2013, Proc. pp. 40-44, 2-3 December 2013, Dubai-BAE.[6] UN-World Commission on Environment and Development (1987): Our Common Future[7] Tuğrul.A.B., “Nuclear Energy in the Energy Expansion of Turkey”, “Journal of Energy and Power Engineering, Vol. 5, No 10, pp. 905-910, Oct.2011[8] Tuğrul, A.B., “Türkiye’nin Enerji Açılımları”, 15. Uluslararası Enerji ve Çevre Konferansı ICCI-2009 Bildiri Kitabı, s: 15-17, 13-15 Mayıs 2009, İstanbul.[9] Tugrul,A.B., “Enerji Santralları ve Farklı Yönlerden Mukayeseli Değerlendirilmesi”, 18. Uluslararası Enerji ve Çevre Konferansı ICCI-2012, İstanbul, 25-27 Nisan 2012, Bildiri Kitabı s:1-4.[10] D. Weisser A guide to Life-cycle Greenhouse Gas (GHG) Emissions from Electric Supply Technologies, Energy 32 (2007) 1543-1559.[11] Meier,P.J., “Life-cycle Assessment of Electricity Generation Systems and Applications for Climate Change Policy Analysis”, University of Wisconsin- Madison-USA, August 2002.[12] Raffensperger, L., Web Site Maps CO2 Emissions from Power Plants Worldwide, Earth Trends- Environmental Information, World Resources Institute (WRI)[13] Fitz,J.A., Record Set by Nuclear Power Plant for Continuous Days of Operation, 2010.[14] IAEA, 2001 Regulatory Control of Nuclear Power Plants, Vienna.[15] WEA-World Energy Outlook (2006) OECD/IEA[16] Probabilistic Safety Assessment: An Analytical Tool for Assessing Nuclear Safety, http://www.nuce.boun.edu.tr/psaover.html [17] Barton,C., Avoiding Nuclear Safety, The Energy Collective, April, 2011.
SUMMARYEnergy has a pivotal role in every society, touching upon all aspects of life and creating, in particular, an accelerated sustainable economic and social development, which in turn enhances the welfare of people and consolidates the country’s standing in the world. “Ecosystems approach” is vital importance in sustainable development concept . Energy technologies must developed with using available resources ,and resource utilization. Nuclear energy is an important alternative for producing huge electricity amount, but no CO2 emissions. In here, the depth of nuclear safety came forward for decreasing of the risk of nuclear accidents. Therefore, a hierarchical deployment of different levels of equipment and procedures in order to maintain the effectiveness of physical barriers placed between radioactive materials and workers, the public or environment.

11
ICCI 2015 - Bildiriler Kitabı / Proceedings Book
Hidroelektrik Santrallerin Türkiye’de Kurulu Güce Sürdürülebilir Katkısı
AliİhsanAKALBirecik A.Ş.
ÖZETTürkiye’de Hidroelektrik Santrallerin (HES) kurulu gücünün; son beş yılda %70 oranında artmış olmasına karşın, toplam kurulu güç üzerindeki HES payı aynı kalmıştır (yaklaşık %34). Halen ENTSO-E ile deneme aşamasında olan, Avrupa ile bütünleşmiş gelişkin bir iletim sisteminin varlığı, Türkiye Yenilenebilir Enerji Sektörü’ne Avrupa’nın ilgisini canlı tutmaktadır. Mevcut santrallerin varlığı ve emre amadelik (availability) durumları aynı ölçüde dikkatle izlenmektedir. Mevcut kurulu güç kadar, santrallerin emre amade olmasının önemi, Ağustos 2014 puantının karşılanmasında yaşanan güçlükler ile yakından izlenmiştir.
Türkiye’deki HES yatırımları açısından ulaşılması hedeflenen potansiyelin 36.000 MW olduğu göz önüne alınırsa; T.C. Enerji ve Tabii Kaynaklar Bakanlığı’nın (ETKB) 2015 – 2019 Strateji Planı’nda, 2019 yılı için öngördüğü 32.000 MW, su kaynaklarının yaklaşık %90 kullanımına karşılık gelmektedir. Mevcut HES yatırımlarına 2019 yılı sonuna kadar %50’nin üzerinde yatırım eklenmesi öngörüsü, son beş yılda işletmeye alınan yatırım miktarı göz önüne alındığında, ulaşılabilir bir hedef olarak değerlendirilebilir.
Rehabilitasyon konusu, HES potansiyelinin tümüyle kullanılması hedefine yaklaştıkça, daha önemli hale gelmektedir. Bu çalışma; Türkiye’de mevcut HES varlığının emre amadelik durumunun yüksek oranda ve sürdürülebilir kılınması için; ünitelerin yaşlanma durumuna göre uygulanabilecek rehabilitasyon çalışmalarını değerlendirecektir. Santraller öncelikle örnek havzalar için ele alınacak; yaş ortalaması, ünite özellikleri, orjinal imalatçı, yıllık ortalama çalışma süresi ve dur-kalk sayıları açısından değerlendirmeler yapılacak, rehabilitasyon için yerli katkı durumları gözden geçirilecektir.
1. GİRİŞTürkiye’de mevcut havzalar Şekil 1’de gösterilmektedir. Yıllık su potansiyeli ortalama 186 km3 (milyar m3) olarak tahmin edilen havzalar arasındaki en büyük havza Fırat Dicle Havzası olmakta, ardından sırasıyla Doğu Karadeniz ve Doğu Akdeniz Havzaları gelmektedir[1].
Devlet Su İşleri (DSİ) tarafından Hidroelektrik Santral (HES) tesisi açısından gelişimi büyük ölçüde tamamlanan Fırat Havzası, aynı zamanda en büyük enerji üretim potansiyeline sahiptir. Havzaların su ve enerji üretim potansiyeli Tablo 1’de gösterilmektedir.
DSİ tarafından 2000’li yılların başında 475 proje ile tanımlanan HES potansiyeli, yeniden gözden geçirilmiş ve artık 2014 yılı içinde; enerji üretimi aşamasında olan HES sayısı 461, toplam sayı 1.446, yapımı DSİ tarafından bugüne kadar gerçekleştirilmiş HES sayısı ise 141 olarak tanımlanmaktadır[3].
2. EÜAŞ TARAFINDAN İŞLETİLEN HİDROELEKTRİK SANTRALLERElektrik Üretim A.Ş. (EÜAŞ) tarafından işletilmekte olan HES sayısı; 2006 yılında 109, nehir tipi bazı santrallerin özelleştirilmesi ardından azalarak, 2013 yılında 69 olmuştur[4][5]. Özelleştirme İdaresi Başkanlığı tarafından özelleştirme programına alınan ve ihalesi planlanan HES sayısı ise 27 olarak açıklanmaktadır[6].
Hirfanlı, Kesikköprü, Kapulukaya, Altınkaya ve Derbent (Kızılırmak); Almus, Köklüce, Kılıçkaya, Çamlıgöze, Hasan Uğurlu ve Suat Uğurlu (Yeşilırmak); H.P. Sarıyar, Gökçekaya ve Yenice (Sakarya); Özlüce ve Karkamış (Fırat); Menzelet ve Aslantaş (Ceyhan); Çatalan (Seyhan), Kürtün ve Doğankent (Harşit); Adigüzel ve Kemer (Büyük Menderes); Karacaören I (Aksu), Demirköprü (Gediz), Gezende (Göksu) ve Tortum gibi santraller için 2014 yılında özelleştirme ihalesi yapılarak, işletme haklarının devri beklenmektedir.
Şekil 1. Türkiye’de mevcut havzalar[1].
Tablo 1. Havzalara Göre HES Adet, Kurulu Güç ve Üretim Durumu[2]

12
ICCI 2015 - Bildiriler Kitabı / Proceedings Book
Yukarıda adı geçen ve yaş ortalaması 34 olan santrallerin kurulu gücü 3.670 MW, tahmini üretim miktarı ise 11,0 GWh, çalışmakta olan çeşitli tip ünite sayısı 85’tir. Santrallerin Havza bazında incelenmesi sırasında; Yeşilırmak ve Kızılırmak Havzaları üzerinde tesis edilmiş olan santrallerin durumları gözden geçirilirken, ünitelerin ortalama çalışma süresi (saat/yıl), dur/kalk sayıları ve kullanım faktörleri (%) dikkate alınmaktadır. Bir dur/kalk, literatürde 10 ile 1000 saat arası çalışma süresine eşdeğer olmakta, hatta bakım/onarım çalışmaları üzerindeki parasal etki araştırılarak, her dur/kalk için bir bedel saptanmaya çalışılmaktadır[7].
3. KIZILIRMAK HAVZASI
Kızılırmak üzerinde çalışan santrallerin yaş ortalaması 32’dir. Çeşitli farklı firmalar tarafından inşa edilen santrallerin işletme sonuçlarından; ardışık (cascade) biçimde çalışmadıkları anlaşılmaktadır. Altınkaya’nın ortalama dur/kalk sayısı, santralin Bölge Yük Tevzi Merkezi tarafından, diğer santrallere oranla daha fazla tercih edilmekte olduğunu göstermektedir.
2014 yılı sonu itibariyle Hirfanlı üniteleri 200.000 saat çalışma seviyesine yaklaşmakta; Kesikköprü ve Altınkaya üniteleri 100.000 saat üzerinde, Derbent üniteleri ise 100.000 saat yakınında bir çalışma saatine ulaşmıştır. Kapulukaya’nın Kırıkkale Rafinerisi nedeniyle (%41,5), Derbent’in nehir santrali özelliği nedeniyle kullanım faktörünün yüksek olduğu (%52,3) görülmektedir.
Hirfanlı, Kesikköprü ve Altınkaya kullanım faktörleri %30’un altında kalmaktadır.
Kızılırmak üzerindeki santrallerin üniteleri; English Electric, Ansaldo ve Toshiba imalatlarıdır. Hirfanlı’nın dördüncü ünitesi ise TEK tarafından yürütülen yerli imalat nedeniyle önemli bir tarihi fonksiyona sahiptir. Santraller için rehabilitasyon programı menbadan
başlayarak (Hirfanlı), mansaba doğru düzenlenebilir. Kızılırmak Havzası’nın bir bütün olarak ele alınması yararlı olacak, fakat çeşitli noktalardan havza içindeki şehir ve bölgelere kullanım veya sulama amaçlı su alınmakta oluşu, projelerin rantabilitesini olumsuz etkileyebilir.
4. YEŞİLIRMAK HAVZASI
Yeşilırmak üzerindeki santrallerin yaş ortalaması 31’dir. Santrallerin dur/kalk sayıları ardışık santraller şeklinde çalışmadıklarını göstermektedir. Çamlıgöze, Kılıçkaya’dan; Suat Uğurlu, Hasan Uğurlu’dan daha fazla çalışmaktadır. Suat Uğurlu en verimli çalışan santral (%57,2), diğer santraller de %35’in üzerinde yüksek kullanım faktörüne sahiptir.
Yeşilırmak üzerindeki santrallerin üniteleri; Temsan, Andritz, Reşita, Voith ve Toshiba imalatlarıdır.
50 yaşında olan Almus ünitelerinin ortalama çalışma süresi 200.000 saatin üzerindedir. Çalışma sürelerinin yüksek olması nedeniyle, tüm santraller için rehabilitasyon yapılmasında yarar vardır.
Şekil 2. Kızılırmak Havzası üzerindeki santraller.
Tablo 2. Ünitelerin Ortalama Çalışma, Dur/Kalk Sayıları ve Kullanım Faktörü
Şekil 3. Yeşilırmak Havzası üzerindeki santraller.

13
ICCI 2015 - Bildiriler Kitabı / Proceedings Book
5. REHABİLİTASYON ÇALIŞMALARITürkiye’de Hidroelektrik Santrallerin kurulu gücünün; son beş yılda yüzde yetmiş oranında artmış olmasına karşın, toplam kurulu güç üzerindeki HES payı aynı kalmıştır (yaklaşık %34). Halen ENTSO-E ile deneme aşamasında olan, Avrupa ile bütünleşmiş gelişkin bir iletim sisteminin varlığı, Türkiye Yenilenebilir Enerji Sektörü’ne Avrupa’nın ilgisini canlı tutmaktadır. Mevcut santrallerin varlığı ve emre amadelik (availability) durumları aynı ölçüde dikkatle izlenmektedir. Mevcut kurulu güç kadar, santrallerin emre amade olmasının önemi, Ağustos 2014 puantının karşılanmasında yaşanan güçlükler ile yakından izlenmiştir.
Türkiye’deki HES yatırımları açısından ulaşılması hedeflenen potansiyelin 36.000 MW olduğu göz önüne alınırsa; T.C. Enerji ve Tabii Kaynaklar Bakanlığı’nın (ETKB) 2015 – 2019 Strateji Planında, 2019 yılı için öngördüğü 32.000 MW, su kaynaklarının yaklaşık yüzde 90 kullanımına karşılık gelmektedir. Mevcut HES yatırımlarına 2019 yılı sonuna kadar %50’nin üzerinde yatırım eklenmesi öngörüsü, son beş yılda işletmeye alınan yatırım miktarı göz önüne alındığında, ulaşılabilir bir hedef olarak değerlendirilebilir.
Rehabilitasyon konusu, HES potansiyelinin tümüyle kullanılması hedefine yaklaştıkça, daha önemli hale gelmektedir. Türkiye’de mevcut HES varlığının emre amadelik durumunun yüksek oranda ve sürdürülebilir kılınması gerekir. Havza bazında uygulanabilecek rehabilitasyon çalışmalarının, ünitelerin yaşlanma durumuna göre ve yerli katkı durumunu dikkate alınarak düzenlenmesi sürdürülebilirlik açısından yararlı olacaktır.
Ancak, İşletme Hakkı Devri şeklinde yürütülecek santral özelleştirilmelerinin başarılı olması için, havza bazında ve sürdürülebilir bir model uygulanması ve EÜAŞ’ın çalışmaların içinde tutulması yararlı olacaktır. Sürdürülebilir bir model olarak “Public – Private – Partnership (PPP)” tercih edilebilir. Orijinal imalatçıların yerli firmalar ile birlikte PPP model içinde yer alması, işletme sırasında orijinal imalatçıların desteğinin sürdürülebilir olmasını sağlayacaktır.
KAYNAKLAR[1] Devlet Su İşleri (DSI) Web Sitesi.[2] DSI Proje Listesi, 2000.[3] Dünya Gazetesi haberi, Mayıs 8, 2014.[4] Elektrik Üretim A.Ş. (EÜAŞ) Yıllık Rapor (2006).[5] Elektrik Üretim A.Ş. (EÜAŞ) Yıllık Rapor (2013).[6] Enerji ve Tabii Kaynaklar Bakanlığı (ETKB) Web Sitesi.[7] “Hydrogenerator Start/Stop Costs”, June 2014, U.S. Department of the Interior, Bureau of Reclamation, Technical Service Center.
SUMMARYInstalled capacity of the Hydroelectrical Power Plants (HES) in Turkey increased seventy percent during the last five years; but HES share in the overall installed capacity remained the same (nearly 34 percent). European interest in the Renewable Energy Sector in Turkey continues to be alive, due to the well-developed Transmission System which is currently in a trial period with ENTSO-E. Existing plants are carefully followed by their installed capacity as well as their availability status. Peak power demand observed in August 2014 had proven that availability is a very important parameter to overcome the challenges required to meet the peak power demand.
If we consider the Ministry of Energy and Natural Resources (MENR) analysis for the HES potential as 36,000 MW in the 2015 – 2019 Strategic Plan, the target of 32,000 MW for 2019 corresponding nearly 90 percent utilization of the potential. The target to add more than 50 percent investment to the HES installations until the end of 2019 appears to be reasonable, if we take into account the amount of investments in the last five years.
Rehabilitation (refurbishment) subject will be more important when the utilization of the HES potential
Tablo 4. Türkiye’nin Kurulu Gücü İçindeki HES Varlığı ve Yıl İçindeki Katkılar[6]
Tablo 3. Ünitelerin Ortalama Çalışma, Dur/Kalk Sayıları ve Kullanım Faktörü

14
ICCI 2015 - Bildiriler Kitabı / Proceedings Book
approaches to the maximum potential. This paper attempts to analyze what is required to keep the availability of the units at the maximum in a sustainable manner, considering the rehabilitation efforts in line with the age of the units. Power plants will be considered in accordance with the river basin they belong; their average age, unit characteristics, original equipment manufacturers, average working hours per year and the number of start-stops per year, with local scope that may be available during rehabilitation. In order to have success for the privatization in the form of Operation Transfer Rights, the method “Public – Private – Partnership (PPP)” could be executed to the river basins in partnership with EÜAŞ, to have sustainable results. When the Original Equipment Manufacturers are involved in a model including the local companies in a PPP Model, support of the manufacturers will be made sustainable during the operation period.
15
ICCI 2015 - Bildiriler Kitabı / Proceedings Book
AB-Türkiye Enerji Diyaloğu’nda Atılan Adımlar
AyşegülUÇKUNKTO Karatay ÜniversitesiEnerji Yönetimi Bölümü
ÖZETAB’nin enerjide dışa bağımlı olması, enerji güvenliği konusunu gündeme getirmektedir. Türkiye’nin jeopolitik konumu, AB için önem arz etmekte ve AB’nin yürüteceği enerji politikaları, enerji güvenliğinin sağlanması açısından oldukça büyük bir potansiyele sahiptir. Ankara Anlaşması ile başlayan Türkiye’nin AB ile ilişkileri, Helsinki Zirvesi’nde Türkiye’nin adaylık statüsü kazanmasıyla büyük bir ivme kazanmıştır. Türkiye özellikle 2001 yılından itibaren enerji alanındaki mevzuat çalışmalarına ve kurumsal yapıya ilişkin olarak önemli gelişmeler kaydetmiş ve AB ile olan enerji diyaloğunu geliştirme adına önemli adımlar atmıştır. ENTSO-E, TANAP bunlardan başlıca olanlarıdır. Türkiye, bu anlaşmalarının yanında AB müktesebatına uyum çerçevesinde Enerji Faslı altındaki mevzuata uyum kapsamında önemli ilerlemeler kaydetmektedir.
Anahtar Kelimeler: Enerji diyaloğu, Enerji Faslı, Mevzuata uyum
1. GİRİŞAvrupa Birliği (AB) kurulduğu günden itibaren enerji konusuna önem vermektedir. AB’nin temellerinin atıldığı Avrupa Kömür Çelik Topluluğu’ndan bu yana enerji aslında AB’nin öncelikli alanlarından birisidir. 1970’li yıllarda yaşanan iki petrol krizi, enerjinin Avrupa Birliği’nin gündeminde önemli yer tutmasına yol açmış ve konulan Tek Pazar hedefinin parçası olarak da enerji, Avrupa Birliği’nin öncelikli konuları arasına girmiştir. 2009 Lizbon Antlaşması ile “Enerji” başlığının antlaşma metninin içine alınmasıyla da enerji konusu yeni bir boyut kazanmıştır.
Türkiye ise enerji konusuna son on yıl içinde daha fazla önem vermeye başlamıştır. 2001 yılında Bağımsız İdari Otorite olan EPDK’nın kurulması atılan önemli adımlardan birisidir. Ayrıca Türkiye, enerji alanında çıkarmış olduğu kanunlar ile enerji piyasasının hukuki boyutunu güçlendirmektedir.
1999 yılında gerçekleştirilen Helsinki Zirvesi’nde, Türkiye’nin adaylık statüsünü kazanmasıyla AB müktesebatına uyum çerçevesinde önemli adımlar atılmaktadır. Enerji faslına uyum çerçevesinde gerek kurumsal yapının güçlendirilmesi, gerek mevzuat uyum çalışmalarının yapılması ve gerekse AB-Türkiye
enerji diyaloğunun gerçekleştirilmesi için çok boyutlu anlaşmaların imzalanması, Türkiye’nin AB yolunda güçlü adımlarla ilerlediğinin kanıtıdır.
2. ENERJİ DİYALOĞUNDA ATILAN ADIMLAR
2.1. ENTSO-EAB tarafından elektrik ağı için atılan ilk adım, elektrik ağının enterkonneksiyonu ile devreye sokulan ve enerji kaynaklarının daha etkin kullanımı yoluyla ekonomik faaliyetlerin gelişimine katkıda bulunma hedefi doğrultusunda 1951 yılında oluşturulan UCPTE (Elektrik Üretim ve İletim Koordinasyonu Birliği)’dir[1]. Daha sonra, 1999 yılında UCPTE, temel hedefi arz güvenliğini ve elektriğin etkili bir şekilde iletilmesini sağlamak olan UCTE (Avrupa Elektrik İletimi Koordinasyon Birliği)’ye dönüşmüştür[2]. 1 Temmuz 2009 tarihinde ise, Avrupa’da var olan altı iletim sistemi operatörünü (UCTE, NORDEL, UKTSOA, ATSOI, BALTSO, ETSO) tek bir çatı altında toplayarak ENTSO-E (Avrupa Elektrik İletim Sistem Operatörleri Ağı) oluşturulmuştur[3].
ENTSO-E, Avrupa genelinde 34 ülkeden 41 iletim sistemi operatörünü temsil etmektedir. “Toplam 305.000 km’nin üzerinde Yüksek Gerilim (YG) hatlarından oluşan, 880 GW kurulu güçteki bu sistem, 532 milyondan fazla tüketicinin yıllık 3200 TWh seviyesindeki elektrik enerjisi talebini karşılamaktadır. ENTSO-E tarafından sağlanan koordinasyon, üye sistemler arasında yılda yaklaşık 380 TWh alışveriş yapılabilmesine olanak sağlamaktadır”[4].
Türkiye elektrik iletim sisteminin ENTSO-E sistemine bağlantısını anlayabilmek için atılan adımlara bakacak olursak, 1975 yılından beri Avrupa iletim sistemine senkron paralel bağlantısı konusunda çalışmalar yürütülmektedir. “1990’lı yıllardan itibaren Türkiye, Yunanistan ve Bulgaristan sistemlerinin enterkonneksiyonu konusunda çeşitli ön çalışmalar yapılmıştır”. 2000-2001 yıllarında Türkiye elektrik sisteminin UCTE sistemine bağlantısı konusunda yapılan analiz çalışmaları Avrupa Komisyonu tarafından oluşturulan çalışma grubu tarafından gerçekleştirilmiş ve “Türkiye elektrik sisteminin Bulgaristan ve/veya Yunanistan üzerinden UCTE sistemine bağlantısının mümkün ve uygulanabilir olduğu” gösterilmiştir[4]. “Türkiye elektrik sisteminin UCTE sistemine bağlantısı için yapılmış

16
ICCI 2015 - Bildiriler Kitabı / Proceedings Book
olan tüm analizleri incelemek ve yapılması gerekenleri belirlemek üzere görevlendirilen” Türkiye’nin Bağlantısı Alt Çalışma Grubu, 2001 yılının ortalarında çalışmalarına başlamıştır. 2005-2007 tarihleri arasında “Türkiye Elektrik İletim Sisteminin UCTE Sistemine Bağlantısı Tamamlayıcı Teknik Çalışmalar” projesi (1. UCTE Projesi) başarı ile tamamlanmış ve “Türkiye Elektrik Sisteminin UCTE Sistemi ile Senkron İşletilmesi için Frekans Kontrol Performansının İyileştirilmesi” projesi (2. UCTE Projesi) geliştirilmiştir[5]. 2009’da “Avrupa Kıtası Senkron Bölgesi ile Türkiye elektrik sisteminin bağlantısı için yöntem ve alınacak önlemler konusunda anlaşma imzalanmıştır”[6]. Tüm bu gelişmeleri takiben, 18 Eylül 2010’da ENTSO-E ile senkron deneme çalışmaları başlatılmıştır[7]. ENTSO-E tarafından belirlenen teknik ve piyasa kurallarına göre yürütülecek olan elektrik enerjisi alışverişleri, Bulgaristan, Yunanistan ve Avrupa’dan Türkiye’ye 400 MW’a, ters yönde ise 300 MW’a kadar gerçekleştirilecektir. ENTSO-E sayesinde, Türkiye Avrupa’dan enerji kaynağını ithal edip onu kendi ülkesinde elektrik enerjisine dönüştürmek yerine, daha iyi iletim hatları kurarak direkt Avrupa’dan elektrik enerjisinin ithalini gerçekleştirmiş olacaktır.
2.2. TANAPTrans Anadolu Doğalgaz Boru hattı Projesi (TANAP), Azerbaycan doğal gazının Türkiye ve Avrupa’ya güvenli bir şekilde ulaştırılmasını içeren dev bir projedir. TANAP, Güney Kafkasya Boru Hattı (SCP) ve Trans Adriyatik Doğal Gaz Boru Hattı Projesi (TAP) ile birleşerek Güney Gaz Koridoru’nu oluşturmaktadır. Azerbaycan’ın en büyük doğal gaz sahalarından birisi olan Şah Deniz Sahası’ndan çıkarılacak olan gaz, TANAP ile Türkiye’ye, Türkiye’den de TAP ile Avrupa’ya taşınacaktır. Yıllık 16 milyar m3 doğal gazın taşınması planlanmaktadır[8]. 16 milyar m3’lük doğal gazın 6 milyar m3’ünü Türkiye kullanırken, 10 milyar m3’ü Avrupa’ya ulaştırılacaktır.
TANAP, Türkiye Gürcistan sınırından başlayarak 20 ilden geçecek ve Yunanistan sınırında son bulacaktır. Bu sınırdan Avrupa ülkelerine ise TAP Doğal Gaz Boru Hattı’na bağlanacaktır. “Proje kapsamında Türkiye sınırları içerisinde biri Eskişehir ve diğeri Trakya’da olmak üzere, ulusal doğal gaz iletim şebekesine bağlantı için iki çıkış noktası yer alacaktır”. Trans Anadolu Doğalgaz Boru Hattı Sistemine İlişkin Hükümetlerarası Anlaşması’nın son hali ise 21 Ekim 2014 tarihinde Resmi Gazete’de yayımlanarak yürürlüğe girmiştir[9].
2.3. Enerji Şartı AnlaşmasıDoğu Avrupa ve Sovyetler Birliği’nde ekonomik kalkınmanın enerji sektöründe yapılacak işbirliği ile gerçekleşeceği görüşü ile 1991’de Komisyonun “Avrupa Enerji Şartı” kavramını önermesiyle başlayan süreç, 1994 yılında 50 ülke ve AB’nin Enerji Şartı Anlaşması ve Enerji Verimliliği ve ilgili Çevresel Hususlara İlişkin Enerji Şartı Protokolü’nü imzalamasıyla tamamlanmıştır. Enerji Şartı Anlaşması’nın temel amacı; “enerji alanında uzun dönemli işbirliğinin teşvik edilmesi için hukuki bir çerçeve tesis etmektir”[10]. Türkiye de Aralık 1994’te imzalamış ve Şubat 2000’de onaylamıştır. Enerji Şartı Anlaşması’nın hedeflerine bakacak olursak, aslında en temel hedef, enerji arzı güvenliğini artırmak ve açık ve rekabet eder bir enerji piyasası geliştirmektir[11]. Diğer hedefleri ise, enerji yatırımlarının teşvik edilmesi, çevresel sorunlara dikkat edilmesi, enerji üretimi, kullanımı konularında verimliliğin artırılmasına önem vermektir. Bu doğrultudan bakıldığında, Enerji Şartı Anlaşması’nın ulusal enerji politikalarına müdahale etme hedefi bulunmamaktadır.
2.4. Akdeniz İçin BirlikTürkiye’nin başından beri süreçte yer aldığı Akdeniz İçin Birlik, AB ve Akdeniz’e komşu olan ülkelerin tek bir çatı altında toplanması ve kurumsal bir işbirliği çerçevesinin
Kaynak: TANAP
17
ICCI 2015 - Bildiriler Kitabı / Proceedings Book
oluşturulması amacıyla 2008 yılında kurulan bir platformdur. Akdeniz İçin Birlik’in hedeflerini anlayabilmek için tarihsel sürecine bakmak gerekmektedir. İlk olarak AT, Kuzey Afrika ve Doğu Akdeniz’deki eski sömürgeleriyle yapıcı bir diyaloğa girebilmek adına 1961-1972 yıllarını kapsayan Global Akdeniz Politikası ile ülkelerle ikili olarak tercihli olmayan ticaret ve ortaklık anlaşmaları yapılmıştır. 1972’de var olan ikili anlaşmaların ülkelerin kalkınmasına katkısının çok az olması nedeniyle, Global Akdeniz Politikası’nda ikili anlaşmalar yerine bölgesel çapta bir anlayış benimseyerek tercihli ticaret anlaşmaları yapılmıştır. Ancak AT’de 1981 ve 1986’da gerçekleşen genişlemelerin ardından, arzulanan sonuca ulaşılamamıştır. Bu nedenle, Global Akdeniz Politikası yerini 1992 yılında oluşturulan Yenileştirilmiş Akdeniz Politikası’na bırakmıştır. Bu politika, daha çok bölgesel işbirliğine odaklanılması ve kalkınma projelerinin desteklenmesine odaklanmaktadır. Ancak, Yenileştirilmiş Akdeniz Politikası da ülkelerin kalkınmasına çok az katkıda bulunması nedeniyle başarısız olunca, 1994’ten itibaren daha kalıcı bir işbirliğinin oluşturulması doğrultusunda çalışmalar başlatılmış (Barselona Süreci) ve Yenileştirilmiş Akdeniz Politikası yerini 1995 yılında Avrupa-Akdeniz Ortaklığı’na bırakmıştır[12]. Daha sonra ise, Avrupa-Akdeniz Ortaklığı da yerini 2008 yılında Barselona Sürecini güçlendirmeyi amaçlayan ve bu sürecin devamı niteliğinde olan Akdeniz için Birlik’e bırakmıştır. Akdeniz için Birlik’in temel amacı; projeler yoluyla Akdeniz’deki işbirliğini artırmaktır. Bu doğrultuda belirlemiş olduğu öncelikli alanlar: “Akdeniz’in temizlenmesi, deniz ve kara ulaşımı, sivil koruma, alternatif enerjiler ve Akdeniz Güneş Enerjisi Planı, yükseköğrenim ve araştırma, iş olanaklarının geliştirilmesi”[13]. Akdeniz Güneş Enerjisi Planı’na göre, güneş enerjisinden elektrik üretiminin gerçekleştirilmesi ve 2020 yılına kadar Akdeniz’in güney ve doğu bölgelerinde yaklaşık 20 GW’lık yenilenebilir enerji üretim kapasitesinin oluşturulması gerekmektedir.
2.5. Karadeniz Bölgesel Enerji Merkezi (BSREC)1995 yılında AB enerji siyasetinin dış boyutunu ele alan Sinerji Programı altında oluşturulan Karadeniz Bölgesel Enerji Merkezi, Avrupa Komisyonu’nun ortak bir girişimidir. Üyeleri ise, Arnavutluk, Ermenistan, Azerbaycan, Bulgaristan, Gürcistan, Yunanistan, Moldova, Romanya, Rusya, Makedonya, Ukrayna, Sırbistan, Türkiye ve AB’dir. Karadeniz Bölgesel Enerji Merkezi, enerji alanında Karadeniz bölgesindeki ülkeler ile AB arasındaki işbirliğini geliştirmeyi amaçlamaktadır[14].
3. ENERJİ FASLINA UYUM SÜRECİNDE ATILAN ADIMLARAB müktesebatının 15. Faslı olan “Enerji Faslı”, elektrik ve doğal gaz piyasaları, enerji verimliliği, yenilenebilir enerji kaynakları ve nükleer enerji konularına ağırlık vermektedir. Enerji faslı, mevcut durumda AB Konseyi’nde görüşmesi süren fasıllar arasında yer almakta ve faslın müzakereye açılması Kıbrıs tarafından bloke edilmektedir.
3.1. Elektrik ve Doğal Gaz Piyasalarına Uyum SüreciAB’de elektrik ve doğal gaz piyasalarının liberalleştirilmesine yönelik (enerji iç pazarının sağlanması) üç enerji paketi yayımlanmıştır. ‘Birinci Enerji Paketi’ kapsamında 1996 yılında Elektrik Direktifi ve 1998 yılında Doğal Gaz Direktifi yayımlanmıştır. Bu direktifler ile elektrik ve doğal gaz piyasalarında istenen liberalleşme sağlanamadığı için, 2003 yılında ‘İkinci Enerji Paketi’ kapsamında yeni direktifler yayımlanmıştır. Yine istenen liberalleşmenin sağlanamaması üzerine çıkarılan ‘Üçüncü Enerji Paketi’ kapsamında 2009/72/EC sayılı Elektrik Direktifi ve 2009/73/EC sayılı Doğal Gaz Direktifi yayımlanmış ve 2009 yılında yürürlüğe girmiştir[15].
Türkiye’de ise AB’nin liberalleşme yolunda çıkartmış olduğu Direktifler doğrultusunda, AB’nin elektrik ve doğal gaz piyasalarına uyum sağlanabilmek adına 2001 yılında 4628 sayılı Elektrik Piyasası Kanunu ve 4646 sayılı Doğal Gaz Piyasası Kanunu yürürlüğe girmiştir. AB’nin enerji paketleri kapsamında değişen mevzuatlarına uyum sağlayabilmek için mevcut kanunlar gözden geçirilmiş ve 6464 sayılı yeni Elektrik Piyasası Kanunu Mart 2013’te yürürlüğe girmiştir[16].
Mevzuat uyumlaştırılmasının yanı sıra Türkiye ile AB arasında elektrik iletim şebekelerinin bağlantısını sağlayabilmek için yapılan 1. UCTE ve 2. UCTE Projesinin başarıyla tamamlanmasının ardından, 18 Eylül 2010’da ENTSO-E ile senkron deneme çalışmaları başlatılmıştır.
3.2. Enerji VerimliliğiEnerji verimliliği, AB düzeyinde düzenlenen bir konu olduğu için üye ülkeler enerji verimliliği konusunda belirlemiş olduğu politikalarını uyumlu hale getirmelidirler. Bu nedenle, daha çok “enerji verimliliği ve enerji hizmetleri, binalarda enerji verimliliği, enerji kullanan ürünlerin eko-tasarımı, kojenerasyon, enerji kullanan ürünlerin enerji etiketlemesi gibi konular AB düzeyinde belirlenmektedir”[17]. Mevcut durumda ilgili konularda AB düzeyinde çıkartılmış direktiflere bakıldığında, 2010/31/EU sayılı Binaların Enerji Performansı Direktifi, iklim gerekliliği ve maliyet etkinliğinin yanı sıra iklim ve yerel şartları dikkate alarak Birlik içinde binaların enerji performansının geliştirilmesini teşvik etmektedir[18]. 2012/27/EU sayılı Enerji Verimliliği Direktifi, 2020’ye kadar %20 oranında enerji verimliliğinin sağlanması hedefini sağlayabilmek için Birlik içinde enerji verimliliği konusunda genel bir çerçeve oluşturmakta ve kojenerasyonun enerji tasarrufu konusunda büyük bir potansiyele sahip olduğunu vurgulamaktadır[19]. 2009/125/EC sayılı Direktif ise, iç pazarda enerji ile ilgili ürünlerin serbest dolaşımını sağlamak amacıyla bu ürünlerin çevreye duyarlı tasarımı için bir çerçeve oluşturmaktadır[20]. 2010/30/EU sayılı Direktif de tüketicilerin en verimli ürünleri seçebilmeleri için ürünlerin üretim bilgileri ve enerji etiketlemesinin gösterilmesi hakkında bir çerçeve çizmektedir[21].

18
ICCI 2015 - Bildiriler Kitabı / Proceedings Book
Türkiye de enerji verimliliği konusunda çok önem vermekte ve AB mevzuatına uyum çerçevesinde önemli adımlar atmaktadır. Enerji verimliliği konusunda atmış olduğu en önemli adımlardan birisi 2007 yılında çıkartmış olduğu Enerji Verimliliği Kanunu’dur. “Bu Kanunun amacı; enerjinin etkin kullanılması, israfının önlenmesi, enerji maliyetlerinin ekonomi üzerindeki yükünün hafifletilmesi ve çevrenin korunması için enerji kaynaklarının ve enerjinin kullanımında verimliliğin artırılmasıdır”[22]. Bu amaç doğrultusunda yıllık toplam enerji tüketimleri 50 bin TEP ve üzeri olan endüstriyel işletmelerde, enerji yöneticisi ve enerji uzmanlarının sorumluluğunda enerji yönetim birimi kurulması gerektiği belirtilmektedir. Kanunun yanı sıra Türkiye’de ilgili Bakanlıklar nezdinde AB tarafından çıkarılan direktiflere uyum sağlanabilmek adına yönetmelikler çıkarılmıştır.
3.3. Yenilenebilir Enerji KaynaklarıAB’nin belirlemiş olduğu 20-20-20 hedefleri arasında, 2020’ye kadar yenilenebilir enerji kaynaklarının kullanım oranını %20 oranında artırmak yer almaktadır. Bu hedefe ulaşabilmek adına, 2009/28/EC sayılı yenilenebilir kaynaklardan üretilen enerjinin kullanımının teşvikine ilişkin direktif çıkartılmıştır. Bu direktif, ulaşımda kullanılan yenilenebilir enerji kaynaklarının payı ve toplam enerji tüketiminde yenilenebilir kaynaklardan üretilen enerjinin payı konusunda zorunlu ulusal hedefler koymaktadır[23].
Türkiye’de, yenilenebilir enerji kaynaklarının kullanım oranının artırılmasının sağlanması, fosil yakıt kullanım oranının azaltılmasına katkıda bulunarak sera gazı salınımının azaltılması, enerjide dışa bağımlılığın azaltılmasına katkıda bulunulması, kaynak çeşitliliğinin sağlanması ve çevrenin korunması gibi hedefler doğrultusunda çıkarılan 5346 sayılı ‘Yenilebilir Enerji Kaynaklarının Elektrik Enerjisi Üretimi Amaçlı Kullanımına İlişkin Kanun’ 2005 yılında yürürlüğe girmiştir. Mevcut durumda ise, Aralık 2010’da yürürlüğe giren 6094 sayılı Kanun ile 5346 sayılı Kanun’da birtakım değişiklikler yapılmıştır. Ayrıca, belirlenen 2023 hedefleri arasında, yenilenebilir enerjinin elektrik üretimindeki payının %30 olması; rüzgâr enerjisi kurulu gücünün 20.000 MW seviyesine çıkarılması, jeotermal kurulu gücünün 1000 MW seviyesine çıkarılması gibi hedefler yer almaktadır.
3.4. Nükleer EnerjiNükleer enerji 1950’li yıllardan beri AB’nin gündeminde yer almaktadır. AB’nin, 1957’de enerjide bağımsızlığa ulaşmanın bir aracı olarak nükleer enerjiyi görmesi ve atom enerjisini barışçıl amaçlarla kullanmak istemesi üzerine Avrupa Atom Enerjisi Topluluğu (EURATOM) oluşturulmuş ve EURATOM’u kuran Roma Anlaşması imzalanmıştır. 1958 yılında da Roma Anlaşması yürürlüğe girmiştir. 1995 yılında da EURATOM Anlaşması konsolide edilmiştir. 2009/71/EURATOM direktifinde değişiklik yapan 2014/87/EURATOM
sayılı Nükleer Güvenlik direktifi ile nükleer güvenliğinin teşvik edilmesi için bir çerçeve oluşturulmaktadır[24].
Türkiye, yaklaşık %70 seviyelerinde olan enerjide dışa bağımlılığını azaltmak için alternatif yollar aramaktadır. Bu yollardan birisi de nükleer enerjiden elektrik üretilmesidir. Bu doğrultuda, Türkiye Mersin ve Sinop’ta olmak üzere iki nükleer santral projesine sahiptir. Bunların yanı sıra, AB mevzuatına uyum çerçevesinde de çalışmalar yapılmaktadır. Bunlardan başlıca olanları arasında; 2009 yılında yayımlanan, bir sahada nükleer güç sahalarının kurulabilmesi için nükleer güvenlik konusunda uyulması gereken hususları anlatan Nükleer Güç Santrali Sahalarına İlişkin Yönetmelik[25]; 2012 yılında yayımlanan Nükleer Tesislerin ve Nükleer Maddelerin Fiziksel Korunması Yönetmeliği; 2012 yılında yayımlanan nükleer amaç için hazırlanmış ekipman ve malzemelerin tespiti ve takibini sağlamak, ayrıca nükleer silah ve patlayıcı olarak üretilmesini önlemek üzere uyulacak usul ve esasları belirten Nükleer Madde Sayım ve Kontrol Yönetmeliği[26]; 2013 yılında yayımlanan radyoaktif atıkların toplum, çevre ve gelecek nesillere zarar vermeyecek şekilde güvenli olarak yönetilmesine ilişkin usul ve esasları belirten Radyoaktif Atık Yönetmeliği[27] yer almaktadır.
4. SONUÇBu çalışmada, Türkiye ve AB’nin enerji diyaloğunu sağlayabilmek adına attığı adımlar anlatılmıştır. ENTSO-E, TANAP, Akdeniz için Birlik ve Karadeniz Bölgesel Enerji Merkezi gibi enerjide işbirliğinin güçlendirilmesine yönelik atılan adımlar AB-Türkiye enerji diyaloğunun oluşturulması için önemli bir etmen olmaktadır. Bunun yanı sıra, diyaloğun güçlendirilebilmesi için Türkiye mevzuat uyum çalışmalarına büyük önem vermektedir. Bu doğrultuda, AB’nin liberalleşme yolunda yayımlamış olduğu Elektrik ve Gaz Direktifleri doğrultusunda, Türkiye’de Elektrik Piyasası Kanunu ve Doğal Gaz Piyasası Kanunu yürürlüğe girmiştir. Ayrıca, Türkiye ve AB enerji verimliliği konusuna çok önem vermektedir. AB’nin yayımlamış olduğu direktiflere uyum doğrultusunda, Türkiye’de ilgili Bakanlıklar nezdinde yönetmelikler çıkarılmıştır. 2007 yılında ise Enerji Verimliliği Kanunu yürürlüğe girmiştir. Yenilenebilir enerji kaynaklarının kullanım oranını artırabilmek için AB 20-20-20 diye nitelendirdiği hedeflere sahiptir. Buna paralel olarak, Türkiye de 2023 hedefleri diye nitelendirdiği hedefler kapsamında yenilenebilir enerji kaynaklarının kullanım oranının artırılmasına yönelik hedefler de yer almaktadır. Bunlara ilaveten, nükleer enerjiden elektrik üretilmesi hem AB hem de Türkiye’nin üstünde durduğu bir konudur. Nükleer enerji 1950’li yıllardan beri AB’nin gündeminde yer almaktadır. Bu doğrultuda 1957 yılında EURATOM oluşturulmuş ve hala devam etmektedir. Türkiye, yaklaşık %70’lerde olan enerjide dışa bağımlılığını azaltabilmek için alternatif yollar aramaktadır. Bunlardan birisi de nükleer enerjiden elektrik üretilmesidir. Bu doğrultuda, Mersin ve Sinop’ta olmak üzere iki adet nükleer santral projesi mevcuttur.
19
ICCI 2015 - Bildiriler Kitabı / Proceedings Book
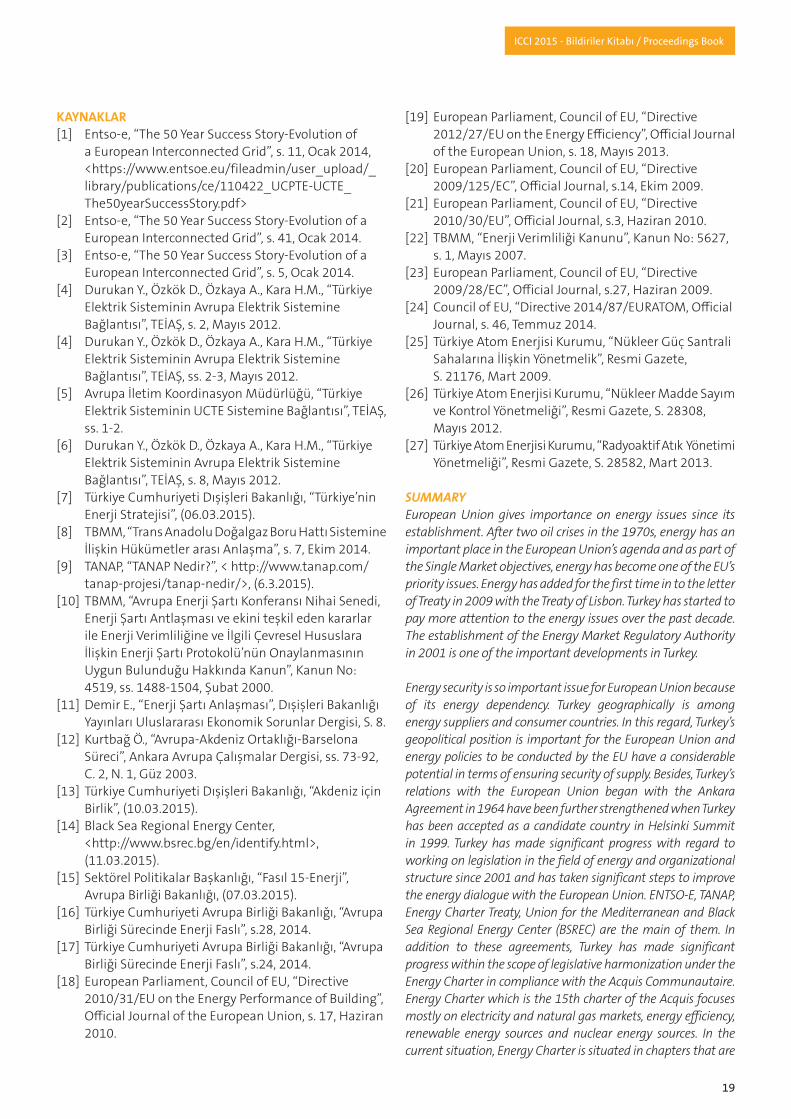
KAYNAKLAR[1] Entso-e, “The 50 Year Success Story-Evolution of a European Interconnected Grid”, s. 11, Ocak 2014, <https://www.entsoe.eu/fileadmin/user_upload/_ library/publications/ce/110422_UCPTE-UCTE_ The50yearSuccessStory.pdf>[2] Entso-e, “The 50 Year Success Story-Evolution of a European Interconnected Grid”, s. 41, Ocak 2014.[3] Entso-e, “The 50 Year Success Story-Evolution of a European Interconnected Grid”, s. 5, Ocak 2014.[4] Durukan Y., Özkök D., Özkaya A., Kara H.M., “Türkiye Elektrik Sisteminin Avrupa Elektrik Sistemine Bağlantısı”, TEİAŞ, s. 2, Mayıs 2012.[4] Durukan Y., Özkök D., Özkaya A., Kara H.M., “Türkiye Elektrik Sisteminin Avrupa Elektrik Sistemine Bağlantısı”, TEİAŞ, ss. 2-3, Mayıs 2012.[5] Avrupa İletim Koordinasyon Müdürlüğü, “Türkiye Elektrik Sisteminin UCTE Sistemine Bağlantısı”, TEİAŞ, ss. 1-2.[6] Durukan Y., Özkök D., Özkaya A., Kara H.M., “Türkiye Elektrik Sisteminin Avrupa Elektrik Sistemine Bağlantısı”, TEİAŞ, s. 8, Mayıs 2012.[7] Türkiye Cumhuriyeti Dışişleri Bakanlığı, “Türkiye’nin Enerji Stratejisi”, (06.03.2015).[8] TBMM, “Trans Anadolu Doğalgaz Boru Hattı Sistemine İlişkin Hükümetler arası Anlaşma”, s. 7, Ekim 2014.[9] TANAP, “TANAP Nedir?”, < http://www.tanap.com/ tanap-projesi/tanap-nedir/>, (6.3.2015).[10] TBMM, “Avrupa Enerji Şartı Konferansı Nihai Senedi, Enerji Şartı Antlaşması ve ekini teşkil eden kararlar ile Enerji Verimliliğine ve İlgili Çevresel Hususlara İlişkin Enerji Şartı Protokolü’nün Onaylanmasının Uygun Bulunduğu Hakkında Kanun”, Kanun No: 4519, ss. 1488-1504, Şubat 2000.[11] Demir E., “Enerji Şartı Anlaşması”, Dışişleri Bakanlığı Yayınları Uluslararası Ekonomik Sorunlar Dergisi, S. 8. [12] Kurtbağ Ö., “Avrupa-Akdeniz Ortaklığı-Barselona Süreci”, Ankara Avrupa Çalışmalar Dergisi, ss. 73-92, C. 2, N. 1, Güz 2003. [13] Türkiye Cumhuriyeti Dışişleri Bakanlığı, “Akdeniz için Birlik”, (10.03.2015).[14] Black Sea Regional Energy Center, <http://www.bsrec.bg/en/identify.html>, (11.03.2015).[15] Sektörel Politikalar Başkanlığı, “Fasıl 15-Enerji”, Avrupa Birliği Bakanlığı, (07.03.2015).[16] Türkiye Cumhuriyeti Avrupa Birliği Bakanlığı, “Avrupa Birliği Sürecinde Enerji Faslı”, s.28, 2014.[17] Türkiye Cumhuriyeti Avrupa Birliği Bakanlığı, “Avrupa Birliği Sürecinde Enerji Faslı”, s.24, 2014.[18] European Parliament, Council of EU, “Directive 2010/31/EU on the Energy Performance of Building”, Official Journal of the European Union, s. 17, Haziran 2010.
[19] European Parliament, Council of EU, “Directive 2012/27/EU on the Energy Efficiency”, Official Journal of the European Union, s. 18, Mayıs 2013.[20] European Parliament, Council of EU, “Directive 2009/125/EC”, Official Journal, s.14, Ekim 2009.[21] European Parliament, Council of EU, “Directive 2010/30/EU”, Official Journal, s.3, Haziran 2010.[22] TBMM, “Enerji Verimliliği Kanunu”, Kanun No: 5627, s. 1, Mayıs 2007.[23] European Parliament, Council of EU, “Directive 2009/28/EC”, Official Journal, s.27, Haziran 2009.[24] Council of EU, “Directive 2014/87/EURATOM, Official Journal, s. 46, Temmuz 2014.[25] Türkiye Atom Enerjisi Kurumu, “Nükleer Güç Santrali Sahalarına İlişkin Yönetmelik”, Resmi Gazete, S. 21176, Mart 2009.[26] Türkiye Atom Enerjisi Kurumu, “Nükleer Madde Sayım ve Kontrol Yönetmeliği”, Resmi Gazete, S. 28308, Mayıs 2012.[27] Türkiye Atom Enerjisi Kurumu, “Radyoaktif Atık Yönetimi Yönetmeliği”, Resmi Gazete, S. 28582, Mart 2013.
SUMMARYEuropean Union gives importance on energy issues since its establishment. After two oil crises in the 1970s, energy has an important place in the European Union’s agenda and as part of the Single Market objectives, energy has become one of the EU’s priority issues. Energy has added for the first time in to the letter of Treaty in 2009 with the Treaty of Lisbon. Turkey has started to pay more attention to the energy issues over the past decade. The establishment of the Energy Market Regulatory Authority in 2001 is one of the important developments in Turkey.
Energy security is so important issue for European Union because of its energy dependency. Turkey geographically is among energy suppliers and consumer countries. In this regard, Turkey’s geopolitical position is important for the European Union and energy policies to be conducted by the EU have a considerable potential in terms of ensuring security of supply. Besides, Turkey’s relations with the European Union began with the Ankara Agreement in 1964 have been further strengthened when Turkey has been accepted as a candidate country in Helsinki Summit in 1999. Turkey has made significant progress with regard to working on legislation in the field of energy and organizational structure since 2001 and has taken significant steps to improve the energy dialogue with the European Union. ENTSO-E, TANAP, Energy Charter Treaty, Union for the Mediterranean and Black Sea Regional Energy Center (BSREC) are the main of them. In addition to these agreements, Turkey has made significant progress within the scope of legislative harmonization under the Energy Charter in compliance with the Acquis Communautaire. Energy Charter which is the 15th charter of the Acquis focuses mostly on electricity and natural gas markets, energy efficiency, renewable energy sources and nuclear energy sources. In the current situation, Energy Charter is situated in chapters that are

20
ICCI 2015 - Bildiriler Kitabı / Proceedings Book
discussed at the European Council and the opening charter to the negotiation has been blocked by Cyprus.
In terms of harmonization to the Energy Charter, Electric and Gas Directives were issued within the scope of the energy packages by the EU. In line with the EU Directives have been issued towards liberalization, Electric Market Law and Natural Gas Market Law have entered into force in Turkey. Besides, Turkey and EU give importance on energy efficiency. Accordingly, EU has issued Directives about energy efficiency so Turkey has issued regulations to ensure compliance with the Directives. Also, Turkey has enacted Energy Efficiency Law in 2007. Additionally, EU sets targets that are related with renewable energy resources in 20-20-20 targets. In response to these targets, Turkey has 2023 targets that have targets related with renewable energy resources. Furthermore, since 1950s, EU has given importance nuclear energy in its agenda. EURATOM has been created in this regard. Turkey is looking for alternative ways to reduce energy dependency which is about 70%. One alternative way is the nuclear energy. Hence, Turkey has 2 nuclear power plant projects that are in Mersin and Sinop.

21
ICCI 2015 - Bildiriler Kitabı / Proceedings Book
Şebekeden Bağımsız Mikro Şebekelerde Enerji Yönetiminin Rolü
BehçetKOCAMANBitlis Eren Üniversitesi Tatvan Meslek Yüksekokulu Elektrik ve Enerji Bölümü
ÖZETSon yıllarda enerji tüketimi giderek artmakta, çevre koruma bilinci gelişmekte ve enerji piyasasındaki serbestleşme istikrarlı ilerlemektedir. Bunların yanında dünya üzerindeki geleneksel enerji kaynakları dağılımı homojen değildir. Bu sebepler, yenilenebilir enerji kaynaklarından yeni teknolojiler geliştirerek daha fazla yararlanmayı gerekli kılan politikalar üretmeye ve yakıt hücre tabanlı alternatif dağıtılmış üretim sistemlerine olan ilgiyi artırmaktadır. Bu çalışmada, enerji dağıtım şebekelerinden uzak yerleşim birimlerinin elektrik enerji ihtiyacını karşılamak amacıyla yenilenebilir enerji kaynaklı hibrit bir mikro şebekenin enerji yönetimi, Microsoft Visual Studio C Sharp(C#) dilinde geliştirilen bilgisayar programıyla sağlanmıştır. Elde edilen bir aylık sonuçlar grafiklerle analiz edilerek, enerji yönetimin rolü açıklanmıştır.
Anahtar Kelimeler: Enerji yönetimi, Mikro şebeke, Yenilenebilir enerji kaynakları
1. GİRİŞElektrik enerjisi; iletimi, kullanımı ve kontrolü kolay, diğer enerji türlerine kolay dönüşebilen ve hayatımızda varlığı olmadan hiçbir şeyin anlam kazanmadığı temiz bir enerji türüdür. Bu enerji; insan yaşamında hayat kalitesini iyileştiren, sanayi üretimi için temel gereksinimlerden biri olan, ekonomik ve sosyal ilerlemeyi sağlayan en önemli faktördür. Artan enerji fiyatları, küresel ısınma ve iklim değişikliği, gerek dünyada gerekse ülkemizdeki nüfus artışı ve yaşam standartlarının yükselmesi, sanayi ve teknolojideki gelişmelere paralel olarak enerji talebindeki artış, hızla tükenmekte olan fosil yakıtlara bağımlılığın yakın gelecekte devam edecek olması, diğer dünya ülkelerine bağımlılıktan kurtulmak, arz güvenliği sağlamak ve yeni enerji teknolojileri alanındaki gelişmeler ülkeleri yeni arayışlara götürmektedir. Bu da elektrik enerjisi üretimi için yenilenebilir enerji kaynaklarının yüksek oranda kullanılmasına ihtiyaç olduğunu göstermektedir. Çok çeşitli yenilenebilir enerji kaynakları (biyokütle, jeotermal, güneş ısı enerjisi, dalga, çöp gazı gibi) olmasına rağmen bu çalışma; rüzgâr türbini, fotovoltaik (FV) panel ve mikro hidroelektrik üretim birimlerinden oluşmuş hibrit yenilenebilir enerji sistemleri ile sınırlandırılmıştır.
Türkiye, yenilenebilir enerji kaynaklarının çeşitliliği ve potansiyeli bakımından oldukça şanslı bir coğrafyada bulunmaktadır. Bu enerji kaynaklarının maliyetleri oldukça azdır, yenilenebilir olduklarından tükenmezler ve konvansiyonel yakıtların aksine çevre ve insan sağlığı için önemli bir tehdit oluşturmazlar. Ancak yenilenebilir enerji kaynaklarının kesikli ve doğal olarak tahmin edilememeleri yaygın olarak kullanımlarını engellemektedir. Bu problem, enerji üretim ve yük gereksinimleri arasındaki zaman uyumsuzluğunu gideren depolama sistemi ve uygun yönetim stratejisi ile giderilebilir.
Geleneksel olarak yerleşim yerlerinin uzağında bulunan kaynaklardan üretilen elektrik enerjisi, kayıpları azaltmak amacıyla yüksek gerilimlere yükseltilmekte, alternatif gerilim şeklinde iletilmekte ve dağıtım noktasında alçak gerilime indirilerek dağıtılmaktadır[1]. Önceleri, elektrik enerjisi merkezi olarak üretilip, uzak mesafelere iletim ve dağıtımı yapılırken, son yıllarda artan tüketim ve geleneksel enerji üretiminin neden olduğu çevresel sorunlardan dolayı elektrik enerjisi üretiminde merkezi olmak yerine dağıtılmış üretim sistemlerine ve mikro şebekelere ilgi artmıştır.
2. MİKRO ŞEBEKEMikro şebeke; geçen yüzyılın sonunda ortaya çıkan yeni bir enerji kaynağı ve şebeke yönetim teknolojisi olup bağımsız olarak kontrol edilen, dağıtılmış üretimle birlikte güç sağlayan elektrik şebekeleridir. Bunlar, yenilenebilir ve temiz kaynakların şebekeye dahil olmalarına ve var olan enerjinin maksimum kullanımına izin verebilir. Temel şebekenin bir parçası ve endüstriyel/ticari tüketici uygulamalarından oluşan bir mikro şebeke sistem, şebekeden bağımsız veya şebeke bağlantılı mod olarak çalışabilir. Dağıtılmış enerji kaynakları, mikro şebeke içinde hem dağıtılmış üretim hem de dağıtılmış depolama enerji olabilir.
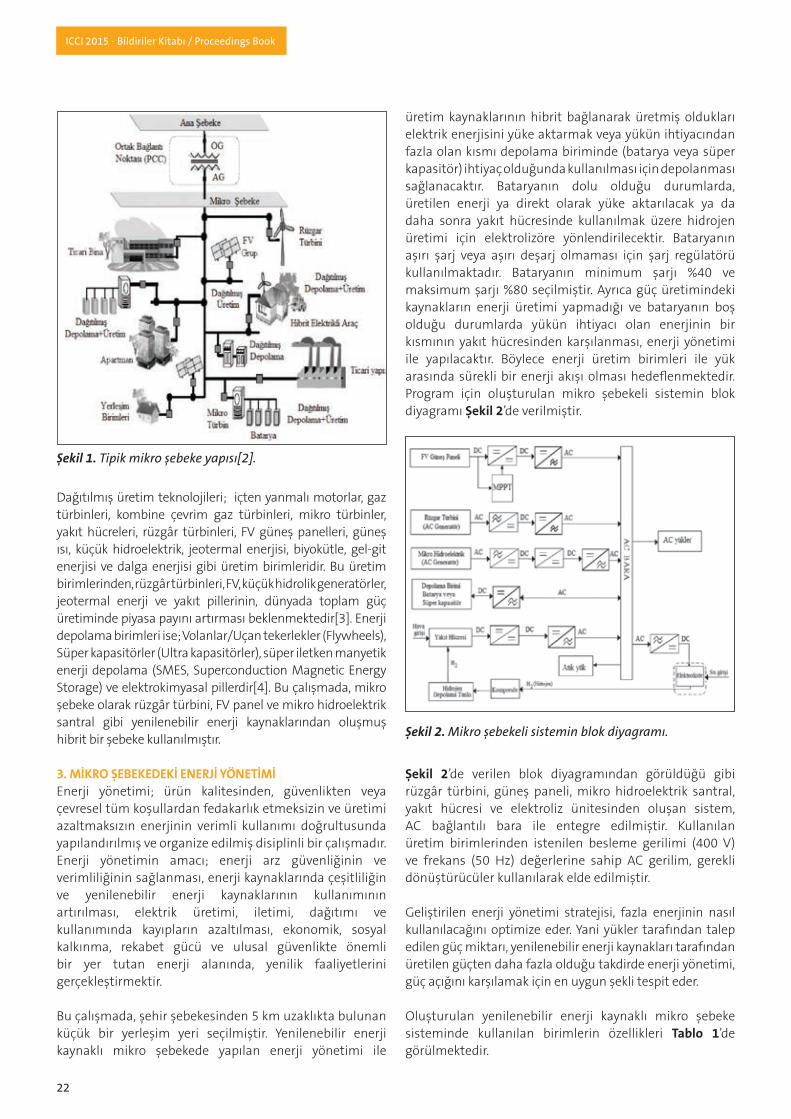
Şekil 1’de tipik mikro şebeke yapısı ve bu yapıda bulunan rüzgâr türbinleri, mikro türbinler, yakıt hücreleri ve FV modüller gibi kaynaklar görülmektedir.
22
ICCI 2015 - Bildiriler Kitabı / Proceedings Book
Dağıtılmış üretim teknolojileri; içten yanmalı motorlar, gaz türbinleri, kombine çevrim gaz türbinleri, mikro türbinler, yakıt hücreleri, rüzgâr türbinleri, FV güneş panelleri, güneş ısı, küçük hidroelektrik, jeotermal enerjisi, biyokütle, gel-git enerjisi ve dalga enerjisi gibi üretim birimleridir. Bu üretim birimlerinden, rüzgâr türbinleri, FV, küçük hidrolik generatörler, jeotermal enerji ve yakıt pillerinin, dünyada toplam güç üretiminde piyasa payını artırması beklenmektedir[3]. Enerji depolama birimleri ise; Volanlar/Uçan tekerlekler (Flywheels), Süper kapasitörler (Ultra kapasitörler), süper iletken manyetik enerji depolama (SMES, Superconduction Magnetic Energy Storage) ve elektrokimyasal pillerdir[4]. Bu çalışmada, mikro şebeke olarak rüzgâr türbini, FV panel ve mikro hidroelektrik santral gibi yenilenebilir enerji kaynaklarından oluşmuş hibrit bir şebeke kullanılmıştır.
3. MİKRO ŞEBEKEDEKİ ENERJİ YÖNETİMİEnerji yönetimi; ürün kalitesinden, güvenlikten veya çevresel tüm koşullardan fedakarlık etmeksizin ve üretimi azaltmaksızın enerjinin verimli kullanımı doğrultusunda yapılandırılmış ve organize edilmiş disiplinli bir çalışmadır. Enerji yönetimin amacı; enerji arz güvenliğinin ve verimliliğinin sağlanması, enerji kaynaklarında çeşitliliğin ve yenilenebilir enerji kaynaklarının kullanımının artırılması, elektrik üretimi, iletimi, dağıtımı ve kullanımında kayıpların azaltılması, ekonomik, sosyal kalkınma, rekabet gücü ve ulusal güvenlikte önemli bir yer tutan enerji alanında, yenilik faaliyetlerini gerçekleştirmektir.
Bu çalışmada, şehir şebekesinden 5 km uzaklıkta bulunan küçük bir yerleşim yeri seçilmiştir. Yenilenebilir enerji kaynaklı mikro şebekede yapılan enerji yönetimi ile
üretim kaynaklarının hibrit bağlanarak üretmiş oldukları elektrik enerjisini yüke aktarmak veya yükün ihtiyacından fazla olan kısmı depolama biriminde (batarya veya süper kapasitör) ihtiyaç olduğunda kullanılması için depolanması sağlanacaktır. Bataryanın dolu olduğu durumlarda, üretilen enerji ya direkt olarak yüke aktarılacak ya da daha sonra yakıt hücresinde kullanılmak üzere hidrojen üretimi için elektrolizöre yönlendirilecektir. Bataryanın aşırı şarj veya aşırı deşarj olmaması için şarj regülatörü kullanılmaktadır. Bataryanın minimum şarjı %40 ve maksimum şarjı %80 seçilmiştir. Ayrıca güç üretimindeki kaynakların enerji üretimi yapmadığı ve bataryanın boş olduğu durumlarda yükün ihtiyacı olan enerjinin bir kısmının yakıt hücresinden karşılanması, enerji yönetimi ile yapılacaktır. Böylece enerji üretim birimleri ile yük arasında sürekli bir enerji akışı olması hedeflenmektedir. Program için oluşturulan mikro şebekeli sistemin blok diyagramı Şekil 2’de verilmiştir.
Şekil 2’de verilen blok diyagramından görüldüğü gibi rüzgâr türbini, güneş paneli, mikro hidroelektrik santral, yakıt hücresi ve elektroliz ünitesinden oluşan sistem, AC bağlantılı bara ile entegre edilmiştir. Kullanılan üretim birimlerinden istenilen besleme gerilimi (400 V) ve frekans (50 Hz) değerlerine sahip AC gerilim, gerekli dönüştürücüler kullanılarak elde edilmiştir.
Geliştirilen enerji yönetimi stratejisi, fazla enerjinin nasıl kullanılacağını optimize eder. Yani yükler tarafından talep edilen güç miktarı, yenilenebilir enerji kaynakları tarafından üretilen güçten daha fazla olduğu takdirde enerji yönetimi, güç açığını karşılamak için en uygun şekli tespit eder.
Oluşturulan yenilenebilir enerji kaynaklı mikro şebeke sisteminde kullanılan birimlerin özellikleri Tablo 1’de görülmektedir.
Şekil 1. Tipik mikro şebeke yapısı[2].
Şekil 2. Mikro şebekeli sistemin blok diyagramı.

23
ICCI 2015 - Bildiriler Kitabı / Proceedings Book
Yükün enerjisiz kalmamasını sağlamak için oluşturulan hibrit sistemle entegre bir enerji yönetim stratejisi belirlenmiş, anlık enerji ihtiyacını, hangi kaynakların devrede olduğunu ve sistemin diğer birimlerinin durumlarını göstermek için Microsoft Visual Studio C Sharp dilinde bilgisayar programı geliştirilmiştir. Benzer çalışmalardan alınan veriler, veri tabanına aktarılarak programın bu verileri kullanması sağlanmıştır. Kullanılan program için oluşturulan kontrol stratejisinin blok diyagramı Şekil 3’te görülmektedir.
Şekil 3’teki blok diyagramından görüldüğü gibi rüzgâr, FV ve mikro hidroelektrik üretim kaynaklarından üretilen toplam güç, yükün talep ettiği güçten daha büyük olması durumunda, bataryanın şarj durumuna bakılır. Bataryanın şarj durumu maksimum değerine eşit veya büyükse, bu durumda fazla gücün elektrolizörün maksimum ve minimum değerleri arasında bir değerde ise elektrolizör H2 üretmesi için çalıştırılır. Eğer fazla güç değeri, elektrolizörün maksimum değerinden büyük ise elektrolizör çalıştırılır ve geriye kalan güç atık yüke yönlendirilir. Fazla güç değeri, sıfır ile elekrolizörün minimum değeri arasında ise bu durumda elektrolizör çalıştırılmaz ve fazla güç, ya batarya şarjına ya da atık yüke yönlendirilir. Bataryanın şarj durumu maksimum seviyeye ulaştığında şarj süreci kontrolör yardımıyla durdurulur.
Şekil 3’te gösterilen blok diyagramında P YEK(t): Yenilenebilir enerji kaynakları gücü (kW), BŞD: Batarya şarj durumu (%), BŞDmin: Bataryanın Minimum Şarj durumu, BŞDmax: Bataryanın Maksimum Şarj durumu, Pelek: Elektrolizör gücü (kW), Pyh: Yakıt hücresi gücü (kW), P bat: Batarya gücü (kW) olarak belirlenmiştir.
Yenilenebilir enerji kaynaklarından üretilen güç, yükün talep ettiği güce eşit veya daha az ise bu durumda bataryanın şarj durumuna bakılır. Eğer batarya şarj durumu maksimum seviyesinin üzerinde veya minimum ile maksimum değeri arasında ise depolanan enerjiden kontrolör yardımı ile deşarj durumu başlar. Batarya şarjı azalarak minimum seviyeye ulaştığında, sistemden bataryanın bağlantısı kesilir. Bu durumda yakıt hücresi çalıştırılarak hem bataryanın şarj edilmesi hem de yükün ihtiyacı olan güç yakıt hücresi tarafından karşılanır. Üretilen toplam enerji ve yük talebi eşit olduğunda batarya şarj durumu değişmeden kalacaktır.
Yenilenebilir enerji kaynaklı üretim birimlerinin ürettiği güç, talep edilen güçten daha fazla olması durumunda, fazla güç ya bataryayı şarj etmek ya da elektrolizörde hidrojen (H2) üretmek için kullanılabilir. Bu işlem şarj olarak adlandırılır. Bunun aksine yenilenebilir enerji kaynakları tüm enerji talebini karşılayamıyorsa, ihtiyaç duyulan enerji ya bataryalardan ya da depolanan hidrojenden faydalanılarak alternatif enerji kaynağı olarak kullanılabilen 4 kWp değerindeki bir PEM yakıt hücresi tarafından karşılanmalıdır. Bu işlem deşarj olarak adlandırılır. Deşarj işlemi sırasında gerekli enerji batarya ve yakıt hücresi tarafından değerlendirilmelidir.
Yakıt hücresinin çalışması sırasında üretilen su, elektrolizörde kullanılması için su depolama tankına kapalı bir döngü içinde geri kazandırılır. Elektrolizör ve yakıt hücresi aynı anda çalışmamaktadır. Ayrıca kısa süreli üretilen enerji dalgalanmaları ve sistemin düzgün çalışması için kurşun asit batarya kullanılmıştır.
Microsoft Visual Studio C Sharp dilinde yazılan bilgisayar programı çalıştırıldığında ekrandan istenilen saat(örneğin 12. gün) seçilip “Çözümle” kutucuğu tıklandığında ekrana Şekil 4’te görüldüğü gibi o günün enerji durumu gelir.
Tablo 1. Mikro Şebeke Sistemi Birimleri ve Özellikleri
Şekil 3. Kontrol stratejisinin blok diyagramı. Şekil 4. Ayın 12.günü için enerji durumu.

24
ICCI 2015 - Bildiriler Kitabı / Proceedings Book
Şekil 4’te görüldüğü gibi ayın 12. gününde rüzgâr türbininden 187,2 kWh, FV panelden 62,4 kWh ve mikro hidroelektrik santralden 144 kWh enerji üretilmiştir. Yenilenebilir enerji kaynaklarından üretilen enerji yükün talebi olan 400,8 kWh enerjinin tamamını karşılamadığından, ihtiyaç duyulan 7,2 kWh’lık enerji batarya tarafından karşılamaktadır. Aynı programla ayın her günü için program ayrı ayrı çalıştırılıp elde edilen 31 günlük değerlerle, Şekil 5-11’deki grafikler elde edilir.
Şekil 5. Aylık yük talebi değişimi.
Şekil 8. Mikro hidroelektrik santralden aylık enerji üretimi değişimi.
Şekil 9. Yenilenebilir enerji kaynaklarından aylık enerji miktarı değişimi.
Şekil 10. Aylık batarya tarafından karşılanan enerji üretimi değişimi.
Şekil 11. Aylık yakıt hücresinin yüke aktardığı enerji değişimi.
Şekil 6. Aylık rüzgâr türbininden üretilen enerji değişimi.
Şekil 7. FV panelden aylık enerji üretimi değişimi.

25
ICCI 2015 - Bildiriler Kitabı / Proceedings Book
Şekil 5-11’de görülen grafiklerde bir aylık yük talebi, yenilenebilir enerji kaynaklarından (rüzgâr, güneş ve hidrolik) elde edilen enerji durumu, yakıt hücre, elektrolizör ve batarya şarj durumları ayrı ayrı verilmiştir. Bu değerlere göre, bir aylık yük talebinin günler bazında hangi enerji kaynaklarından sağlandığı Şekil 12’de verilmiştir.
Şekil 12’’de görüldüğü gibi, talep edilen yükün çoğu yenilenebilir enerji kaynaklarından karşılanmıştır. Ancak yenilenebilir enerji kaynakları üretiminin yeterli olmadığı günlerde, yükün enerji ihtiyacı yenilenebilir enerji kaynaklı üretim birimleri ile birlikte batarya ve/veya yakıt hücresi tarafından karşılanmıştır. Böylece yükün enerji ihtiyacı ay boyunca karşılanmıştır.Bir ayda tüm üretim kaynaklarından üretilen enerjinin, mikro şebekede bulunan kaynaklara göre dağılımları ve yüzdeleri Tablo 2’de verilmiştir.
Tablo 2’de görüldüğü gibi, ay boyunca üretilen enerjinin %43,64’ü (en büyük pay) rüzgâr türbininden ve % 0,72 (en küçük pay) ile yakıt hücresinden karşılanmıştır. Ay boyunca yükün tükettiği enerjiden fazla kalan enerjinin bir miktarı, elektrolizörde daha sonra yakıt hücresinde kullanılmak üzere hidrojen üretiminde, geriye kalan kısmı ise batarya şarjında kullanılmıştır. Bataryaların maksimum şarj olması durumunda elektrolizörün maksimum enerjisinden fazla kalan enerji, atık yüke aktarılarak boşaltılmıştır.
4. SONUÇ VE ÖNERİLERElektrik enerjisine olan talebin gün geçtikçe artmasından dolayı, diğer dünya ülkelerine bağımlılıktan kurtulmak, arz güvenliği sağlamak ve elektrik enerjisi üretimi için yenilenebilir enerji kaynaklarının yüksek oranda kullanılmasına ihtiyaç duyulmaktadır. Yenilenebilir enerji kaynaklarından dağıtılmış üretimin yaygınlaşmasıyla, fosil yakıt kullanımının azalmasının yanında, iletim ve dağıtım kaynaklarında azalma olması da beklenmektedir. Enerji yönetimi, kuruluşların enerji politikalarını belirlemesi, amaç ve hedefleri doğrultusunda oluşturduğu enerji yönetim programları çerçevesinde enerji tüketimini yönetmesi ve enerji yönetim sisteminin performansını değerlendirerek iyileştirmelerin sağlanmasına dayanmaktadır. Bu çalışmayla, enerji dağıtım şebekelerinden veya yerleşim yerlerinden uzak tatil köyü gibi küçük yerleşim birimlerinin elektrik enerji ihtiyacını karşılamak amacıyla yenilenebilir enerji kaynaklı hibrit bir mikro şebekede enerji yönetimi yapılarak yükün enerji ihtiyacının sürekli karşılanması sağlanmıştır. Elektrolizör ve yakıt hücresinin sık sık çalıştırılıp durdurulması, performansını azaltır ve sonrasında ömrünü kısaltır. Bu nedenle yenilenebilir enerji kaynaklarının kısa süreli değişkenliğinde depolama birimi önemli bir bileşen olmaktadır. Enerji yönetimi, üretim kaynaklarının değişik şartlardaki üretiminin yük talebini karşılamasını sağlamak ve işletme bakım maliyetlerini mantıklı bir seviyede tutması açısından önemlidir. Bir aylık veriler kullanılarak yapılan enerji yönetimi ile güneşten veya rüzgârdan yeteri miktarda enerji üretilmediği zamanlarda yükün talep ettiği enerji, batarya ve yakıt hücresi gibi üretim birimlerinden karşılanmıştır. Daha büyük yük taleplerinin olduğu yerler için de enerji yönetiminin yapılması yük taleplerinin karşılanması açısından büyük önem taşımaktadır. Böylece yenilenebilir enerji kaynaklı mikro şebekede yük talebini karşılamada enerji yönetiminin rolünün önemli olduğu anlaşılmaktadır.
KAYNAKLAR[1] Sevgi L., “EMC, Güç Kalitesi ve Harmonik Analizi”, Endüstri & Otomasyon Dergisi, 2005.[2] Shah J.K.., “Dynamic power flow control for a smart micro - grid by a power electronic transformer”, Doktora Tezi, University of Minnesota, 2011.[3] Özdemir E., “Dağılmış Enerji Üretim Sistemleri ve Yardımcı Hizmetler”, Elektrik-Elektronik-Bilgisayar Mühendisliği 12. Ulusal Kongresi ve Fuarı, 2007.[4] Kocaman B. “Akıllı Şebekeler ve Mikro Şebekelerde Enerji Depolama Teknolojileri”, BEÜ Fen Bilimleri Dergisi, 2(1), 119-127, 2013.
Şekil 12. Aylık talep edilen enerjinin, üretim birimlerinden karşılanması.
Tablo 2. Bir Aylık Üretilen Elektrik Enerjisinin Kaynakları ve Yüzdeleri
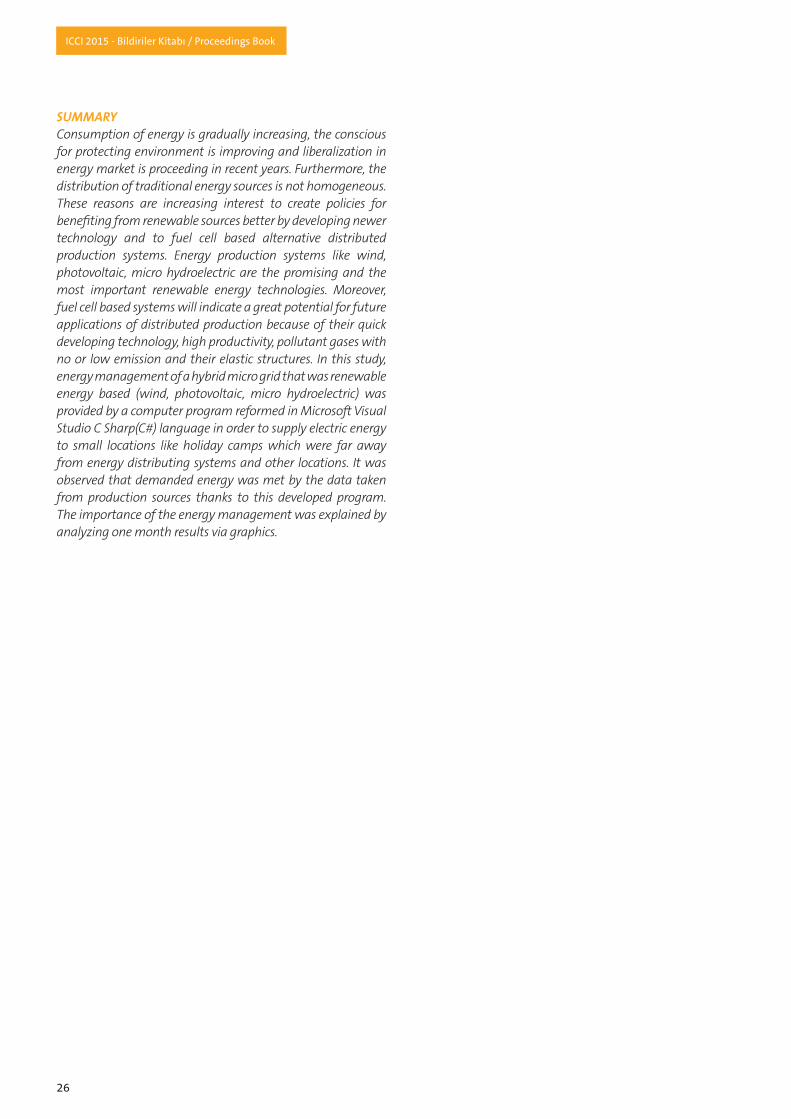
26
ICCI 2015 - Bildiriler Kitabı / Proceedings Book
SUMMARYConsumption of energy is gradually increasing, the conscious for protecting environment is improving and liberalization in energy market is proceeding in recent years. Furthermore, the distribution of traditional energy sources is not homogeneous. These reasons are increasing interest to create policies for benefiting from renewable sources better by developing newer technology and to fuel cell based alternative distributed production systems. Energy production systems like wind, photovoltaic, micro hydroelectric are the promising and the most important renewable energy technologies. Moreover, fuel cell based systems will indicate a great potential for future applications of distributed production because of their quick developing technology, high productivity, pollutant gases with no or low emission and their elastic structures. In this study, energy management of a hybrid micro grid that was renewable energy based (wind, photovoltaic, micro hydroelectric) was provided by a computer program reformed in Microsoft Visual Studio C Sharp(C#) language in order to supply electric energy to small locations like holiday camps which were far away from energy distributing systems and other locations. It was observed that demanded energy was met by the data taken from production sources thanks to this developed program. The importance of the energy management was explained by analyzing one month results via graphics.

27
ICCI 2015 - Bildiriler Kitabı / Proceedings Book
The Erection, Operation & Maintenance of Wind Farms - Measures to Minimize Project Related Risks by Drafting Adapted Turbine Supply Agreements, Balance of Plant and “O & M” Contractsi
BettinaGEISSELERGeisseler Law, Law Firm
ABSTRACTWind farm erection contracts are very complex. Adapted and balanced legal provisions are necessary in order to avoid or minimize project related risks. One of the most crucial issues is the exact description of the scope of supply including the description of the agreed quality parameters and technical standards together with an exact definition of the (provisional) acceptance procedure. The paper presents possibilities of drafting adapted legal solutions for situations of delay, defects and other impairment of performance and highlights the crucial issues to be considered within the framework of an O & M Contract.
1. THE LEGAL FRAMEWORKThe aim of this paper is not to substitute individual legal advice, but to highlight typical project related risks and present legal clauses to cope with these situations in order to minimize disputes during the project execution phase. The detailed legal solution will always depend on the law governing the contract between the contractual parties. The parties (especially if having their company seat in different countries) should choose the applicable lawii. An in-depth knowledge of the chosen law will enable them to assess potential pitfalls of the applicable law and to evaluate to which extent they can and should derogate from provisions of the chosen lawiii. Contracts should provide for a dispute resolution mechanism (ordinary – state – courts or arbitration), determine the order of precedence of all documents being an integral part of the contract (in order to avoid ambiguities e.g. in the application of agreed standards resulting from different codes and guidelines) and – important! – determine the contract language and the language in which (technical and other) documents have to be submitted.
Before starting the procurement process the wind farm owner/ operator should carefully think about the contractual set-up. Besides the question of whether using internationally well-known and accepted standard form contracts such as the FIDIC contracts the owner will opt either for a Turnkey strategy or a multi – contracting strategy. Each of those strategies has advantages and disadvantages. By using a Turnkey strategy the interface risk between the different lots such as the supply of the turbine, the foundations and the
inner - park - cabling is much lesser. On the other hand the owner has less possibility to exert influence on the execution of the main lots and has to pay a higher price.
2. INVOLVED PARTIES AND ATTRIBUTION OF RISKSOne of the success factors of a good contract is the attribution and balancing of risks between the Employer and the Contractor. The parties should carefully think about potential risks and allocate them to either of both parties. That will later on avoid discussions on claims for extension of time (EOT claims) and compensation of additional costs incurred by Contractor in case of unforeseen events. If – as an example - the stability of the underground, on which the foundations are to be erected is of other quality or depth than foreseen, it should be clear which of both contractual parties bears the risk.
In complex projects as it is the case for wind farm erection projects a lot of (third) parties are involved. Between some of them there is a contractual relationship, between others not. Here again, the contractual parties should be aware to which party the acts or omissions of third parties will or should be attributed in case of an impairment of performance. The cause for the delayed issuance of a necessary permit can be the result of omissions of the state authority, but can be as well the result of poor design submitted by Contractor. In case of incorrect load specifications issued by the turbine supplier resulting in an instability of the foundations it will be the Employer bearing this risk in the contractual relationship to the Contractor supplying and installing the foundations.

28
ICCI 2015 - Bildiriler Kitabı / Proceedings Book
3. THE CRUCIAL CLAUSE: EXACT DEFINITION OF THE SCOPE OF SUPPLY/SERVICES AS WELL AS EMPLOYER’S OBLIGATION TO PROVIDE INFORMATIONExperience shows that a lot of disputes between the contractual parties result from a lack of clarity or exactitude in the definition of the scope of supply. Employers with a long - lasting experience in the construction of energy generating plants sometimes prefer to issue detailed specifications, whereas others focus on the definition of the requirements of the plant (“fit for purpose” / “Employer’s Requirements”) and leave it to the Contractor how to achieve these requirements. In any case the applicable technical standard – if they do not result from the applicable law – should be clearly defined. The determination of whether the wind farm respectively its components has a defect or not depends on the clear description of the scope of supply including the exact definition of the agreed quality.
The Employer usually has to provide Contractor with information, e.g. regarding the site conditions (wind assessment reports etc.), whereas it will be the turbine supplier’s obligation to provide a site suitability statement. A contract should clearly state which of the information provided by an Employer is so–called rely upon information having the effect that Contractor is released from the obligation to perform own investigations or even from the obligation to cross check the information provided by Employer.
4. PROJECT EXECUTION: CONTRACTOR’S FURTHEROBLIGATIONS AND EMPLOYER’S RIGHTSAnother success factor is the regular reporting by Contractor and the exchange of information on events having an impact on the due performance. Thus a contract should provide for Contractor’s obligation to inform Employer immediately on any delay of the project or any obstacles the Contractor incurs. The mutual communication is particularly important in case of a multi – contracting strategy allowing the Employer to coordinate the different lots and to minimize interface risks.
It is standard that contracts provide for Contractor’s obligation to submit (design) documents for approval, which usually does not release Contractor from any of its obligations to meet Employers Requirements, and for broad inspection rights of Employer. Usually the Employer reserves the right to approve subcontractors for main components and the key personnel (especially the Contractor’s project manager). Part of the contract – especially in large wind farm erection projects - should be detailed provisions on the project organisation including the language to be used on the site and in the communication with the Employer.
Some legal systems provide for broad instruction rights in favour of the Employer. Nevertheless the exercising of such instruction rights by Employer is a critical issue. In those cases Contractor has and must (!) have the right to oppose by informing Employer on potential negative impacts on Employer’s Requirements. In case Employer insists on its instruction, Contractor is released from its responsibility when complying with the instruction.
An important part of Contractor’s obligation is the hand-over of a complete and accurate documentation (as built drawings, operation manual) at the end of the execution phase. Employers are well advised to link this obligation with a payment of a considerable amount in order to avoid that this obligation is neglected.
5. “TIME IS OF ESSENCE”: THE MILESTONE SCHEDULE AND LEGAL CONSEQUENCES OF DELAYParties should agree on the consequences of a delay attributable to Contractor. Different legal systems provide for different rights of Employer. Thus it is of utmost importance – as mentioned before - to know the provisions of the applicable law. Usually the contracts provide not only for a fixed date of completion, but for various milestones – Key Dates -, which are fixed dates. In case the contractor does not achieve those milestones for reasons attributable to it, the contract usually provides for acceleration measures and the payment of pre- agreed liquidated damages (LDs). It is up the parties to agree whether Employer would like to reserve any further rights resulting from the applicable law such as claims for compensation of further damages (not covered by the payment of the LDs) or even – as the German civil code provides for – rescission rights or whether the parties want to exclude those Employer’s rights by stipulating that the agreed LDs are Employer’s sole and exclusive rights in case of a delay.

29
ICCI 2015 - Bildiriler Kitabı / Proceedings Book
6. CHANGES TO THE CONTRACT AND IMPAIRMENT OF PERFORMANCE/ PROBLEMS DURING THE PROJECT EXECUTION PHASE – ADJUSTMENTS TO THE MILESTONE SCHEDULE AND THE CONTRACT PRICE?Obstacles or unforeseen events during the execution phase always lead to the question whether and to which extent the Contractor is entitled to an extension of time and / or the compensation of additional costs incurred. This depends on the cause for the obstacle. In cases of a “Force Majeure” event Contractor is not only released from its obligation to perform, but contracts typically provide for an extension of time including an adequate time for remobilisation. But in should be kept in mind that not every unforeseen situation can be considered as Force Majeure. When the parties have clearly attributed risks to one or the other party, the materialisation of one of these risks will not be considered as Force Majeure.
In cases of other obstacles, e.g. in cases, in which the Employer does not fulfil its duties in a correct or timely manner, contracts will usually grant the Contractor an extension of time and the compensation for additional costs incurred.
The contract should contain adequate provisions regarding variations to the (scope of) the contract. It might be in the interest of the Employer to reserve the right instruct a variation order, at least within a certain spread (e.g. x% of the contract price), whereas Contractors want to protect themselves by accepting variations only after an agreement on the adjustment of the contract price, the time schedule and – if necessary - other contractual conditions such as guaranteed parameter.
In case of breaches of contract by Contractor (other than defects or delays) the contract usually grants the Employer a termination right depending on the severity of the non-compliance. And last but not least contracts often grant Employer a right to declare the suspension of the contract execution for a certain period. In such cases Contractor usually will be granted a right to claim the compensation of additional costs and a right to terminate the contract in case of long – lasting suspension.
7. PROVISIONAL ACCEPTANCE PROCEDURE AND DEFECTS’ LIABILITY, ESPECIALLY IN CASE OF NON–ACHIEVEMENT OF GUARANTEED PARAMETERSIt is of utmost importance to clearly stipulate the provisional acceptance procedure with fixed deadlines within which Employer has to fulfil its cooperation and approval duties. The contract should provide for solutions regarding situations in which acceptance cannot be achieved for reasons beyond Contractor’s responsibility. Regarding the evidencing of the guaranteed parameters (power curve, noise emissions, availability) the definitions have to be clear and the parties should pre-agree on the measuring methods respectively certifying bodies performing the measuring.
Employer’s remedies in case of defects are usually the right to claim repair and or replacement, to claim a price reduction or to make use of the rescission right (a real sword of Damocles for a Contractor, which any contractor will try to limit to severe defects). Parties should be aware that legal systems (the applicable law) might grant Employer the right to additionally (besides the right of rescission) claim compensation of damages.
In case of non - achievement of the guaranteed parameters parties usually agree on the payment of LDs.
The contract should stipulate the defects’ liability period and Employer’s remedies in case of serial defects.
8. LIMITATION OF LIABILITY Any Contractor wishes to limit its liability. Regarding the payment of LDs those are often capped to a certain amount - a % of the contract price. Often contracts allow Employer to make use of its rescission right once the cap for the LDs, especially regarding guaranteed parameters, is reached. The same mechanism – the limitation to a % of the contract price - usually applies for the overall liability. Parties should agree on whether the overall cap applies as well to repairing costs and removal costs in case of the rescission of the contract. Additionally Contractor will request the exclusion of the liability for so – called consequential damages such as loss of production etc. This is – in view of the fact that quite a number of countries grant feed–in tariffs - a very important / critical issue.
9. OPERATION AND MAINTENANCE AGREEMENTS (“O & M CONTRACT”)There is not ONE strategy for the operation and maintenance of a wind farm. The parties of the turbine supply agreement often agree on an O & M Contract at least for an initial period in line with the defects’ liability period – often with Employer’s option to prolong the contract for a further period. In the offshore wind business the trend seems to go towards long-time (15 –

30
ICCI 2015 - Bildiriler Kitabı / Proceedings Book
20 years) full service agreements. The above mentioned principles apply more or less to the same extent to O & M Contracts. One of the core provisions of such a contract is the availability guaranty which turbine suppliers often only want to guaranty if they can perform the service and maintenance within the framework of an “O& M Contract”. The agreed fee covers in principle all regular maintenance and repair work during scheduled or unscheduled standstills. In case the O & M Contractor is the turbine supplier (OEM) the causality question for unscheduled standstills is not crucial, whereas the O & M Contractor will request compensation for repairing costs in case of external causes for unscheduled standstills.
i See as well Bettina Geisseler, “Wesentliche Aspekte zur Errichtung und Wartung von Windparks (On- und Offshore) – Strategien zur Risikominimierung“ ; published in “Kraftwerkstechnik 2014 - Strategien, Anlagentechnik und Betrieb“ (Kraftwerkstechnisches Kolloquium Dresden, 2014).ii The law applicable to the contract is not necessarily identical with the (administrative) law
applicable at the site of the plant, which will be the decisive law for issues such as the granting of the building and operation permit, allowed emissions etc. iii This is not possible in case of mandatory law / “ordre publique” provisions.

31
ICCI 2015 - Bildiriler Kitabı / Proceedings Book
1. INTRODUCTIONThe Large Combustion Plants Directive (LCPD) in the EU, as well as national clean air programs worldwide, have made retrofits of Flue Gas Desulphurization (FGD) and Selective Catalytic Reduction (SCR) system necessary to fulfil (more) stringent emission limits for sulfur oxides (SOx) and nitrogen oxides (NOx). Table 1 and Table 2 show the emission limit values for new plants according to “DIRECTIVE 2010/75/EU OF THE EUROPEAN PARLIAMENT AND OF THE COUNCIL of 24 November 2010 on industrial emissions (IED)” and Turkish regulations.
STEAG Energy Services (STEAG) in the role of the independent owner’s engineer has planned and supervised FGD and SCR in hard coal, lignite and oil-fired power plants for a combined capacity of more than 20,000 MW at home and abroad. Subsequently STEAG latest experiences concerning FGD and SCR retrofits are presented:
2. STATE OF THE ART OF FGD TECHNOLOGYAn overview on the mostly applied FGD processes is given in the following Figure 1. Limestone scrubbing is the most common FGD process with 85%. The dry/semi-dry scrubbing processes shares approximately 10% of the FGD processes. The Walther-/Ammonia-FGD is not widely used but still interesting. The regenerative processes e.g. the Wellmann-Lord- or activated carbon process gain nearly 3.5%.
2.1. Limestone ProcessThe wet lime/limestone process has become the most commonly used FGD technology. In the process the flue gas comes into contact with an aqueous solution containing lime or limestone as sorbent. The SO2 in the flue gas reacts with the sorbent in the absorber or scrubber and a wet mixture of calcium sulfate and calcium sulfite is formed. In the wet lime/limestone FGD process 90 % and more SO2 removal efficiencies are obtained with an almost stoichiometric sorbent consumption. An oxidation step results in producing the marketable by-product gypsum (CaSO4 x 2 H2O). The overall reaction of the SO2 absorption is:
FGD and SCR Retrofit of Coal Fired Power Plants
CerenMESZELINSKYSTEAG Energy Services GmbH
JensREICHSTEAG Energy Services GmbH
Table 1. Emission Limit Values for Solid-Fuel Combustion Plants According to IED Regulation
Table 2. Emission Limit Values for Solid-Fuel Combustion Plants According to Turkish Regulation
Figure 1. Overview on desulphurization processes.
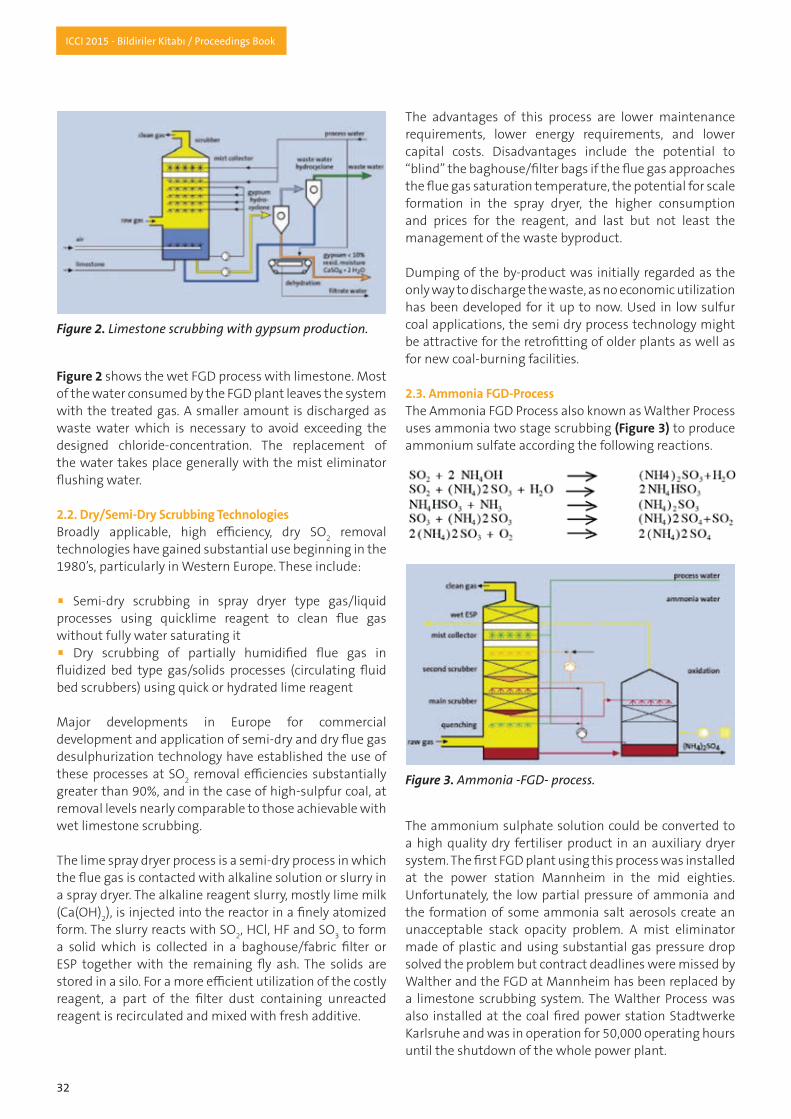
32
ICCI 2015 - Bildiriler Kitabı / Proceedings Book
Figure 2 shows the wet FGD process with limestone. Most of the water consumed by the FGD plant leaves the system with the treated gas. A smaller amount is discharged as waste water which is necessary to avoid exceeding the designed chloride-concentration. The replacement of the water takes place generally with the mist eliminator flushing water.
2.2. Dry/Semi-Dry Scrubbing TechnologiesBroadly applicable, high efficiency, dry SO2 removal technologies have gained substantial use beginning in the 1980’s, particularly in Western Europe. These include:
• Semi-dry scrubbing in spray dryer type gas/liquid processes using quicklime reagent to clean flue gas without fully water saturating it• Dry scrubbing of partially humidified flue gas in fluidized bed type gas/solids processes (circulating fluid bed scrubbers) using quick or hydrated lime reagent
Major developments in Europe for commercial development and application of semi-dry and dry flue gas desulphurization technology have established the use of these processes at SO2 removal efficiencies substantially greater than 90%, and in the case of high-sulpfur coal, at removal levels nearly comparable to those achievable with wet limestone scrubbing.
The lime spray dryer process is a semi-dry process in which the flue gas is contacted with alkaline solution or slurry in a spray dryer. The alkaline reagent slurry, mostly lime milk (Ca(OH)2), is injected into the reactor in a finely atomized form. The slurry reacts with SO2, HCl, HF and SO3 to form a solid which is collected in a baghouse/fabric filter or ESP together with the remaining fly ash. The solids are stored in a silo. For a more efficient utilization of the costly reagent, a part of the filter dust containing unreacted reagent is recirculated and mixed with fresh additive.
The advantages of this process are lower maintenance requirements, lower energy requirements, and lower capital costs. Disadvantages include the potential to “blind” the baghouse/filter bags if the flue gas approaches the flue gas saturation temperature, the potential for scale formation in the spray dryer, the higher consumption and prices for the reagent, and last but not least the management of the waste byproduct.
Dumping of the by-product was initially regarded as the only way to discharge the waste, as no economic utilization has been developed for it up to now. Used in low sulfur coal applications, the semi dry process technology might be attractive for the retrofitting of older plants as well as for new coal-burning facilities.
2.3. Ammonia FGD-ProcessThe Ammonia FGD Process also known as Walther Process uses ammonia two stage scrubbing (Figure 3) to produce ammonium sulfate according the following reactions.
The ammonium sulphate solution could be converted to a high quality dry fertiliser product in an auxiliary dryer system. The first FGD plant using this process was installed at the power station Mannheim in the mid eighties. Unfortunately, the low partial pressure of ammonia and the formation of some ammonia salt aerosols create an unacceptable stack opacity problem. A mist eliminator made of plastic and using substantial gas pressure drop solved the problem but contract deadlines were missed by Walther and the FGD at Mannheim has been replaced by a limestone scrubbing system. The Walther Process was also installed at the coal fired power station Stadtwerke Karlsruhe and was in operation for 50,000 operating hours until the shutdown of the whole power plant.
Figure 2. Limestone scrubbing with gypsum production.
Figure 3. Ammonia -FGD- process.

33
ICCI 2015 - Bildiriler Kitabı / Proceedings Book
The process generates ammonium salt aerosols when the SOx content in the flue gas is high (> 1000 ppm). To absorb these aerosols a wet electrostatic precipitator (WESP) is installed downwards the scrubbing section today. The WESP collects all aerosols contained in the clean gas thus avoiding a visible plume at the stack outlet.
2.4. Criteria for Selection of a FGD ProcessPotentially suitable processes and their arrangement are evaluated taking the following aspects into account:
• Raw gas properties e.g. sulfur oxide content• Flue gas volume• Emission limits• Existing plant components and periphery• Prices of consumables• Available disposal sites• Market of products (e.g. gypsum, fertilizer)
3. EXPERIENCES OF LATEST PROJECTSRefurbishmentofFlueGasDesulfurisationPlantinVoerdePowerStation,Germany:
• Operator: Steag GmbH• Arrangements: New technology flue gas desulfurization plant and auxiliary buildings, new “wet-stack“• Combustibles: Hard coal• Unit capacity with new FGD: 2 x 760 MWel• “Wet-stack“: 230 meter• Project start : September 2002• Test run completion : October 2005
Other FGD retrofit projects are given below:
• Retrofit of Flue Gas Desulphurisation on Power Plant Pego Unit 1 & 2, 2008• Retrofit of Flue Gas Desulphurisation on Power Plant Cottam Unit 1-4, 2007• Retrofit of Flue Gas Desulphurisation on Power Plant West Burton Unit 1-4, 2005• Retrofit of Flue Gas Desulphurisation on Heat and Power Plant Yatagan Unit 1-3, 2002• Retrofit of Flue Gas Desulphurisation on Power Plant Orhaneli, 1998• Retrofit of Flue Gas Desulphurisation on Power Plant Cayirhan Unit 1 & 2, 1992
4. STATE OF THE ART OF SCR TECHNOLOGY In general NOx abatement from flue gases following processes can be applied:
4.1. Primary MeasuresLow- NOx burners will be established for controlling the NOx emissions by means of primary measures. The pulverized coal concentration at a defined point at burner
outlet causes a sub-stoichiometric zone which concurs with the gasification phase as regards space and time. The secondary air flows into the primary burner throat where the gasification process and ignition of fuel take place in an air deficient zone. At last, tertiary air envelops the internal flame zone and causes a delay in oxygen admixture with regard to time and space with simultaneous oxygen enrichment in boundary area of flame propagation. Over fire air may be used as an alternative in addition to tertiary air. Here it is important to avoid wall corrosions.
4.2. Selective Catalytic Reduction (SCR)SCR is a dry process where ammonia acts as a reducing agent to decompose NOx contained in the flue gas to nitrogen and water in the presence of the SCR catalyst. Ammonia is injected into the flue gas through an injection grid upstream of the catalyst. The flue gas ammonia mixture then passes the catalyst and the following reactions take place.
For coal firing applications the flue gas temperature range for SCR process is 300 to 450 °C. The most common location for the SCR catalyst is at the economizer outlet where the operating temperature range usually falls within the above mentioned temperature window.
The catalyst reactor process is designed in order to allow the required NOx reduction by ammonia without resulting significant NH3 slip. The catalysts may be produced in different configurations. The type of catalyst, honeycomb or plate type should be chosen according to the suppliers experience and operation guarantees. The catalytic material is mainly composed of TiO2 because of its resistance to SO3 corrosion. The loss of catalytic activity over time is divided in chemical and physical deactivation which has the effect of reducing the DeNOx capability of the catalyst.
The reducing agent ammonia can be stored as pure ammonia (about 99 %) also called anhydrous ammonia, pressure liquefied at 8.6 bar / 20°C or unpressurized, deep refrigerated at –34 °C or as aqueous ammonia (NH4OH) with 20 – 25 % ammonia content.
The third alternative is urea pellets which either has to be dissolved in water or supplied directly as urea solution. In the urea conversion system the aqueous solution of urea is converted by heat to a gaseous media of ammonia, carbon dioxide and vapor.
34
ICCI 2015 - Bildiriler Kitabı / Proceedings Book
The SCR process is the feasible and reliable solution for power stations of great size. The system is simple to handle and the quality of the byproducts can be guaranteed if the system is well operated and maintained.
5. EXPERIENCES OF LATEST PROJECTSRetrofitofFlueGasDesulphurisationonPowerPlantPegoUnit1&2,2008
• Owner: Tejo Energia• Site: 2 x 314 MWel• Fuel: Hard coal• Flue gas volume for every site is about: 1.420.000 Nm³/h• Measures: • 2 flue gas desulfurization plants (wet and limestone process) including subsystems and wastewater treatment • 2 flue gas de-nitrification plants (High Dust SCR) including ammonia water tank systems and subsystems • Training of the present electrostatic filter • Funnel renovation• Takeover of the retrofits: 2008
Other SCR retrofit projects are given below:
• SCR DeNOx System Retrofit Moneypoint Unit 1-3, 2010• SCR DeNOx System Retrofit Sugözü Unit 10/20, ongoing
6. CONCLUSIONFor 20 years STEAG, as power station owner, has been gaining extensive operating experience with installed desulphurization and denitrification plants of the most varied designs and has naturally optimized their operation and maintenance. National and international know-how acquired in the planning and handling of such power station projects have produced a substantial body of experience, which will greatly facilitate the task of plant engineers responsible for retrofitting of new FGD and SCR units. Primarily, plant operators handling FGD and SCR projects have in recent years almost always opted for the following procedure:
• Preparation of a feasibility study/environmental compatibility study• Application for approval on the basis of a non-specified process• Preparation of a functional specification to supply a complete flue gas desulphurization and denitrification plant by an engineering office which usually lacks any experience of operating flue gas desulphurization and denitrification plants.• RFP for EPC contract.• RFP for owner’s engineer with FGD and SCR experiences
In order to appreciate the statements below, please bear in mind the following facts:
• The goal of the power station operator is to minimize total operating costs as well as capital costs throughout the life of the FGD and SCR plants.• The goal of the plant supplier is to maximize profits from the sale of the FGD and SCR equipment, optimize additional deliveries and “survive” the guarantee period.
These goals are not in themselves negative, but may become controversial and thus create a potential conflict between the customer and the supplier. The plant operator must remember that a supplier’s offer which is frequently a technically incorrect tender is predicated on that particular supplier’s interests, not those of the operator. Bringing in the “experts” as owner’s engineer after the EPC award is too late and can only modify this situation to a limited extent; mostly this implies substantial supplementary deliveries and resultant time wastage. Ensuring contractual conformity is the owner’s engineer task. However, the owner’s engineer should also protect the power operator’s own interests. If not, this frequently leads to changes in the scope of supply (e.g. higher quality of components, different materials), and the supplier tries to ensure that high prices are paid for these supplementary deliveries. Often many aspects of the project can no longer be modified; this can result in increased operating costs.
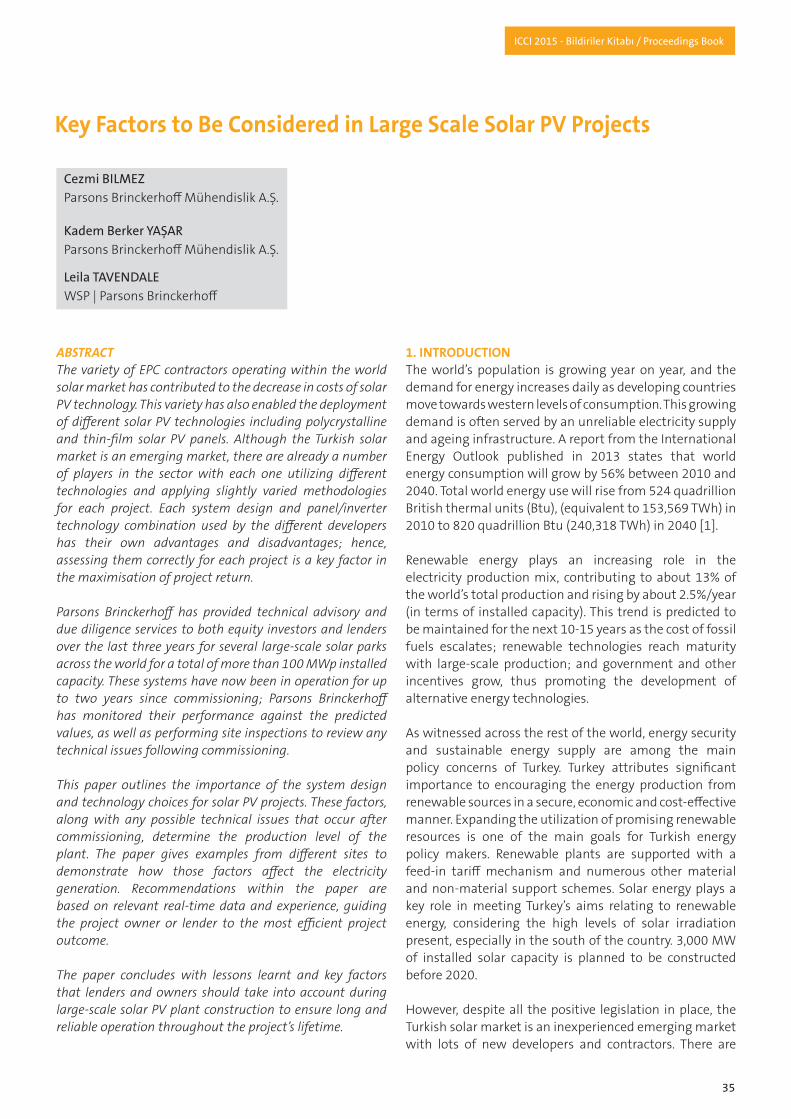
35
ICCI 2015 - Bildiriler Kitabı / Proceedings Book
ABSTRACTThe variety of EPC contractors operating within the world solar market has contributed to the decrease in costs of solar PV technology. This variety has also enabled the deployment of different solar PV technologies including polycrystalline and thin-film solar PV panels. Although the Turkish solar market is an emerging market, there are already a number of players in the sector with each one utilizing different technologies and applying slightly varied methodologies for each project. Each system design and panel/inverter technology combination used by the different developers has their own advantages and disadvantages; hence, assessing them correctly for each project is a key factor in the maximisation of project return.
Parsons Brinckerhoff has provided technical advisory and due diligence services to both equity investors and lenders over the last three years for several large-scale solar parks across the world for a total of more than 100 MWp installed capacity. These systems have now been in operation for up to two years since commissioning; Parsons Brinckerhoff has monitored their performance against the predicted values, as well as performing site inspections to review any technical issues following commissioning.
This paper outlines the importance of the system design and technology choices for solar PV projects. These factors, along with any possible technical issues that occur after commissioning, determine the production level of the plant. The paper gives examples from different sites to demonstrate how those factors affect the electricity generation. Recommendations within the paper are based on relevant real-time data and experience, guiding the project owner or lender to the most efficient project outcome.
The paper concludes with lessons learnt and key factors that lenders and owners should take into account during large-scale solar PV plant construction to ensure long and reliable operation throughout the project’s lifetime.
1. INTRODUCTIONThe world’s population is growing year on year, and the demand for energy increases daily as developing countries move towards western levels of consumption. This growing demand is often served by an unreliable electricity supply and ageing infrastructure. A report from the International Energy Outlook published in 2013 states that world energy consumption will grow by 56% between 2010 and 2040. Total world energy use will rise from 524 quadrillion British thermal units (Btu), (equivalent to 153,569 TWh) in 2010 to 820 quadrillion Btu (240,318 TWh) in 2040 [1].
Renewable energy plays an increasing role in the electricity production mix, contributing to about 13% of the world’s total production and rising by about 2.5%/year (in terms of installed capacity). This trend is predicted to be maintained for the next 10-15 years as the cost of fossil fuels escalates; renewable technologies reach maturity with large-scale production; and government and other incentives grow, thus promoting the development of alternative energy technologies.
As witnessed across the rest of the world, energy security and sustainable energy supply are among the main policy concerns of Turkey. Turkey attributes significant importance to encouraging the energy production from renewable sources in a secure, economic and cost-effective manner. Expanding the utilization of promising renewable resources is one of the main goals for Turkish energy policy makers. Renewable plants are supported with a feed-in tariff mechanism and numerous other material and non-material support schemes. Solar energy plays a key role in meeting Turkey’s aims relating to renewable energy, considering the high levels of solar irradiation present, especially in the south of the country. 3,000 MW of installed solar capacity is planned to be constructed before 2020.
However, despite all the positive legislation in place, the Turkish solar market is an inexperienced emerging market with lots of new developers and contractors. There are
Key Factors to Be Considered in Large Scale Solar PV Projects
CezmiBILMEZParsons Brinckerhoff Mühendislik A.Ş.
KademBerkerYAŞARParsons Brinckerhoff Mühendislik A.Ş.
LeilaTAVENDALEWSP | Parsons Brinckerhoff

36
ICCI 2015 - Bildiriler Kitabı / Proceedings Book
several key factors that influence the production level of the plant. Assessing those factors, such as EPC contractor experience, system design and technology choice, plays a very important role in securing the return on the investment for the lenders and owners.
There are currently no large solar PV plants commissioned in Turkey. Lessons learnt from projects located across the rest of the world provide vital experience for the developers in Turkey. This paper gives a general description of solar PV systems and evaluates the lessons learnt across several related Parsons Brinckerhoff projects in order to determine a suitable roadmap for developers of large solar PV projects in Turkey.
2. PROJECT BACKGROUNDSParsons Brinckerhoff has been involved with many aspects of solar PV power plants in recent years, acting as both lender’s and owner’s engineers across the globe. Involved in all stages of project development, Parsons Brinckerhoff has produced full feasibility studies, managed plant construction and provided operations and maintenance supervision throughout the lending period. This work has involved the development of Minimum Functional Specifications, due diligence, layout design, design review against project specifications, Energy Yield Assessments, technical assistance, tender form preparation and market studies for both mature and emerging markets.
The following projects are sites across which Parsons Brinckerhoff has had significant involvement over the last 24 months. They have been chosen as suitable examples for use in this study due to their variance in location, climatic conditions, capacity and module and inverter technology installed.
All projects considered were commissioned on a full EPC turnkey contract and therefore the main contactor had full responsibility for the design and commissioning of relevant equipment, as well as proposing and agreeing the full commissioning procedure.
Sample Project 1 - (SA-PV1)Developed as part of the Round 1 REIPPP (Renewable Energy Independent Power Producer Procurement) in South Africa, Sample Project 1 is located in the north west province of South Africa and has an installed DC capacity of 6.93 MWp. The plant area is 10.67 ha and panel area is 9.23 ha. There are 29,808 PV modules pitched at 20° arranged in a 4x12 landscape pattern. There are 24 modules per string with 2 strings per array and 6 arrays per central inverter. A total of 11 central inverters are used on the site.
Sample Project 2 - (UK-PV1)Sample Project 2 is located in the south of England and has an installed DC capacity of 10 MWp. The plant is made up of 35,104 polycrystalline modules and 208 string inverters feeding a number of sub-collectors, which sequentially connect to a collector panel and transformer.
Sample Project 3 - (UK-PV2)Sample Project 3 is located in the south of England and has an installed DC capacity of 4.99 MWp, made up of thin-film modules. The plant uses five central inverters. Both Sample Projects 2 and 3 are registered in the United Kingdom under the Renewables Obligation (RO) scheme, which is the main support mechanism for renewable electricity projects in the UK. The scheme involves the issue of tradable Renewables Obligation Certificates (ROCs) to operators of accredited renewable generation plant for the electricity they generate. Smaller-scale renewable electricity generation in the UK is subject to a feed-in tariff. Table 1 summarises the sites that will be outlined in the following sub-sections.
3. PANEL TECHNOLOGYSolar PV modules and balance-of-plant (BoP) items are the key cost components of a PV system. Inverters, the mounting structure, system design and project management, cabling, civil works, permits and installation costs all form part of the BoP. Module costs constitute 52-56% of the total installed cost of a PV system. The inverter constitutes 7-9% and the mounting structure constitutes 9-10% of the system cost. SD&PM, cables, civil works, permits and installation costs add to the total cost of a grid-connected PV system.[2] As modules are the highest-cost item and are the most important in the system, choosing the right module for a specific project is vital. Three main types of technology are used in modules: monocrystalline silicon, polycrystalline silicon and thin-film. All three technologies have their own advantages and drawbacks, which should be carefully considered in line with site conditions and project expectations.
Table 1. Solar PV Sites Breakdown
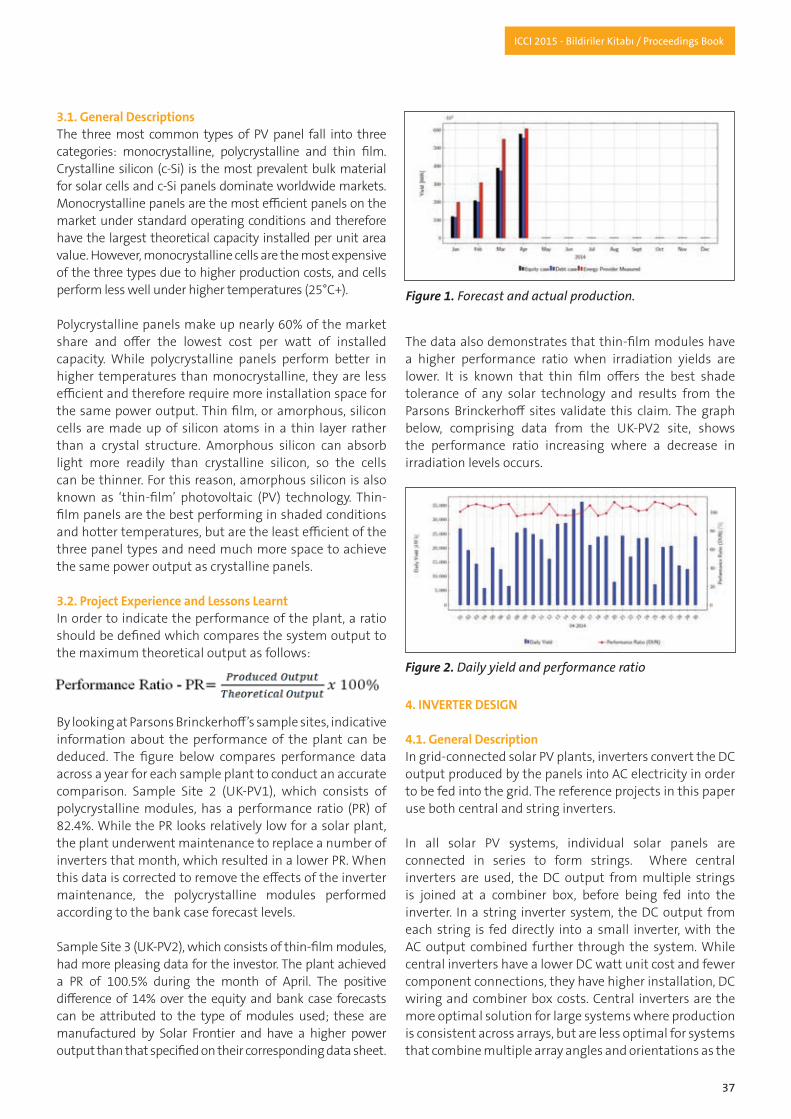
37
ICCI 2015 - Bildiriler Kitabı / Proceedings Book
3.1. General DescriptionsThe three most common types of PV panel fall into three categories: monocrystalline, polycrystalline and thin film. Crystalline silicon (c-Si) is the most prevalent bulk material for solar cells and c-Si panels dominate worldwide markets. Monocrystalline panels are the most efficient panels on the market under standard operating conditions and therefore have the largest theoretical capacity installed per unit area value. However, monocrystalline cells are the most expensive of the three types due to higher production costs, and cells perform less well under higher temperatures (25°C+).
Polycrystalline panels make up nearly 60% of the market share and offer the lowest cost per watt of installed capacity. While polycrystalline panels perform better in higher temperatures than monocrystalline, they are less efficient and therefore require more installation space for the same power output. Thin film, or amorphous, silicon cells are made up of silicon atoms in a thin layer rather than a crystal structure. Amorphous silicon can absorb light more readily than crystalline silicon, so the cells can be thinner. For this reason, amorphous silicon is also known as ‘thin-film’ photovoltaic (PV) technology. Thin-film panels are the best performing in shaded conditions and hotter temperatures, but are the least efficient of the three panel types and need much more space to achieve the same power output as crystalline panels.
3.2. Project Experience and Lessons Learnt In order to indicate the performance of the plant, a ratio should be defined which compares the system output to the maximum theoretical output as follows:
By looking at Parsons Brinckerhoff’s sample sites, indicative information about the performance of the plant can be deduced. The figure below compares performance data across a year for each sample plant to conduct an accurate comparison. Sample Site 2 (UK-PV1), which consists of polycrystalline modules, has a performance ratio (PR) of 82.4%. While the PR looks relatively low for a solar plant, the plant underwent maintenance to replace a number of inverters that month, which resulted in a lower PR. When this data is corrected to remove the effects of the inverter maintenance, the polycrystalline modules performed according to the bank case forecast levels.
Sample Site 3 (UK-PV2), which consists of thin-film modules, had more pleasing data for the investor. The plant achieved a PR of 100.5% during the month of April. The positive difference of 14% over the equity and bank case forecasts can be attributed to the type of modules used; these are manufactured by Solar Frontier and have a higher power output than that specified on their corresponding data sheet.
The data also demonstrates that thin-film modules have a higher performance ratio when irradiation yields are lower. It is known that thin film offers the best shade tolerance of any solar technology and results from the Parsons Brinckerhoff sites validate this claim. The graph below, comprising data from the UK-PV2 site, shows the performance ratio increasing where a decrease in irradiation levels occurs.
4. INVERTER DESIGN
4.1. General DescriptionIn grid-connected solar PV plants, inverters convert the DC output produced by the panels into AC electricity in order to be fed into the grid. The reference projects in this paper use both central and string inverters.
In all solar PV systems, individual solar panels are connected in series to form strings. Where central inverters are used, the DC output from multiple strings is joined at a combiner box, before being fed into the inverter. In a string inverter system, the DC output from each string is fed directly into a small inverter, with the AC output combined further through the system. While central inverters have a lower DC watt unit cost and fewer component connections, they have higher installation, DC wiring and combiner box costs. Central inverters are the more optimal solution for large systems where production is consistent across arrays, but are less optimal for systems that combine multiple array angles and orientations as the
Figure 1. Forecast and actual production.
Figure 2. Daily yield and performance ratio

38
ICCI 2015 - Bildiriler Kitabı / Proceedings Book
inverters typically block the output from lower producing strings when dealing with a range of inputs.
Central inverters are much more proven in terms of field reliability than string inverters, but string inverters have a lower balance of plant cost associated with their installation and lower on-going maintenance costs due to their simpler design and modular nature. In the event of inverter failure, a far smaller percentage of the plant would be affected where string inverters are installed in comparison to sites utilising central inverters.
4.2. Project Experience and Lessons LearntDue to the essential nature of the inverters within solar PV plants, any inverter failure can dramatically affect the performance of the plant and the exporting capacity of the system. In order to explain the possible risks of poor inverter design on a project, Parsons Brinckerhoff’s two sites Sample Project 1 (SA-PV1) and Sample Project 2 (UK-PV1) can be compared.
SA-PV1 has central inverters with the self-learning technology. Self-learning control systems automatically detect any string failures and in the event of isolation problems, the affected string group will be automatically disconnected by the DC-switches from the rest of the plant, so that the inverter need not be disconnected. However, SA-PV1 suffered from DC-breaker trips with an average of 4.2 trips per day. These trips resulted in a reduced performance ratio of approximately 72.5%, below the designed minimum PR of 72.8%.
On the other hand, UK-PV1, which is constructed with string inverters, achieved a higher performance ratio during the inverter failures for the given month. While it is difficult to compare the severity of the inverter failures for both plants, the plant utilising central inverters failed to reach the design minimum PR, while the plant with string inverters maintained PR values exceeding 80%.
5. EFFECT OF TEMPERATUREThe performance of PV systems is impacted by ambient temperature and climatic conditions. PV module and inverter performance is directly affected by changes in temperature, resulting in variations in performance ratio of the whole system. Like all other semiconductor devices, solar cells are sensitive to temperature. Increases in temperature reduce the band gap of a semiconductor, thereby affecting most of the semiconductor material parameters. Thus, PV panels are more efficient at lower temperatures. System designs can include active and passive cooling, where cooling PV panels allows them to function at a higher efficiency and produce more power.
The performance of inverters located indoors is not significantly affected by seasonal weather changes if climate-stabilising measures are employed, such as air conditioning in summer. Systems located outdoors perform slightly better in the colder winter temperatures than during the hot summer weather. Studies show that the inverter efficiency drops approximately 1% for every 12 ºC increase in temperature. This is not significant, but it is worthwhile to design the site such that the inverter is subject to cooler, breezier conditions through the summer months[3].
In addition to individual component performance loss, additional system loss can also occur as a result of poor design. Within each individual PV system, good design ensures that all equipment is suitably specified, guaranteeing that the system runs at maximum efficiency. Different inverters are rated for different maximum voltages and have higher efficiencies between different voltage ranges. System designers must carefully size the PV system in different temperature environments to ensure that the output voltage is not too high, which could damage the equipment.
In accordance with above-mentioned temperature effects, Parsons Brinckerhoff suggests that for projects located in areas with high ambient temperatures, shading the equipment (for example covering the inverters) and installing additional cooling equipment (such as fans for the inverters and transformers), can greatly assist with protecting expensive equipment and keeping the system performance within the design limits. These simple and cheap solutions should be considered by contractors and developers when designing and installing solar PV plants in arid climates such as those found in Turkey[4].
6. SPECIAL CASES FOR TURKEY
6.1. 2 Hectare LimitationThe EMRA Board Decision dated 24/05/2012 and numbered 3,842 (published in the Official Gazette dated 14.06.2012 and numbered 28,323) states in ‘item f’ that a maximum area of 20 decares (2 hectares) can be used for each MW of the solar PV plant project in licence applications. Application for projects exceeding this limit will not be accepted. This Board Decision was aimed at explaining the procedures related to the 600 MW capacity reserved for solar power projects with application deadlines of 14 June 2013. This decision is still valid and applicable for the electricity licence procedure. This land limitation is one of the main design criteria for solar projects in Turkey.
Projects which use tracking systems to maximise plant output typically require more than 2 hectares of land spare

39
ICCI 2015 - Bildiriler Kitabı / Proceedings Book
per 1 MW of installed capacity. However, due to the above board decision, it is not possible to exceed this limitation. EMRA (Energy Market Regulatory Authority) may change its decision in the future, but the design criteria for the land is currently clear and remains a problem for systems with tracking mechanisms.
6.2. Solar Irradiation Minimum ValueThe EMRA Board Decision dated 24/05/2012 and numbered 3,842 (published in the Official Gazette dated 14.06.2012 and numbered 28,323), states in ‘item g’ that sites with a measured irradiation value under 1,620 kWh/m2/year cannot be granted a generation licence. In general, solar irradiation levels are higher than this value across the south of Turkey; however, each proposed project site should be carefully assessed using publicly available irradiation figures before the decision is made whether to install pyranometers or other irradiation-measuring equipment, therefore mitigating the risk of losing any initial investment. Projects in the north of Turkey and southern projects subject to a high shading effect from nearby buildings or vegetation may be under the minimum irradiation level resulting in the rejection of pre-licence applications.
6.3. Capacity LimitThe Electricity Market Licence Regulation (published in the Official Gazette dated 02.11.2013, numbered 28,809) states in temporary item 3 that installed capacity for solar power plants cannot exceed 50 MW for pre-licence applications. According to this regulation, any solar power plant in Turkey must be designed under 50 MW installed capacity.
7. CONCLUSIONTurkey is an emerging market for solar PV with huge potential. Nevertheless, since it is a new sector with no actual experience, investors should carefully assess lessons learnt from projects located across the rest of the world, particularly in relation to module and inverter type and system design.
There are several key factors that influence the production level of the plant. PV module technology selection, inverter design, temperature effect on system design and local regulations can be described as main factors.
Monocrystalline, polycrystalline and thin-film solar cells are widely used technologies with different parameters in efficiency, cost and shade tolerance. While central inverter design is more optimal for large systems with consistent production across arrays, string inverter has simpler design and modularity with lower maintenance costs. The performance of PV cells and inverters are affected negatively by high ambient temperature, resulting in a decrease in performance ratio of the whole system.
Safely securing the return on investment for the lenders and owners is dependent on the full evaluation of the above-mentioned factors and local constraints for the specific project.
REFERENCES[1] Energy Information Administration (EIA), International Energy Outlook 2013 (IEO 2013).[2] Global Data, Solar PV Power in Turkey, Market Outlook to 2025, 2014.[3] Frank Vignola, Fotis Mavromatakis, Performance of PV Inverters, 2009.[4] Nick Quarta, Luca Santoni, Perspectives on Solar PV Project Commissioning Procedures: International Comparisons, Improvements and Lessons Learnt From Solar PV Plants in South Africa And The United Kingdom, 2012.

40
ICCI 2015 - Bildiriler Kitabı / Proceedings Book
Intelligent Management of Distribution Grids
DirkRIESENBERGBilfinger Mauell GmbH
ABSTRACTiNES- The Intelligent Distribution Substation For The Low-Voltage GridThe increasing number of decentralized generating plants and consumers with a high demand for power can lead to voltage band violation (DIN EN 50160) and equipment overload situations in the distribution grid. The protection systems of today’s distribution substations, however, can neither detect nor actively respond to these problems. Core component of the intelligent distribution substation is the decentralized management of the low-voltage grid capacities. “Intelligence” in this respect means automatic identification of the grid status in real-time and provision of appropriate control and regulation measures so that the available grid capacity can be optimally utilized.
Over the last several years, Europe’s energy supply systems has undergone fundamental changes, with drastic effects especially for the generation of electrical energy.
Centralized generation is increasingly replaced by decentralized generation of renewable energy.
The existing medium and low voltage supply grids however, were not designed nor prepared to cope with the problems that may result from the volatile, decentralized feed-in of renewable energy.
The problems which have to be solved are:• voltage band violation• maintaining voltage stability• equipment overload.
To meet these challenges, a self-sustaining monitoring and control system for the low voltage grid has been developed. This system monitors the low voltage grid’s infeed and power flow situation and controls individual decentralized generating units and consumer loads to compensate for any instability.
The system’s core component is a new and cost-effective control unit (Smart RTU) installed in the distribution substation of the low voltage grid. The control unit communicates with the control sensors and actuators positioned in the grid at only a small number of critical points. Merely 10% to 15% of the network nodes and feed-in stations need actually to be equipped.
A newly developed power flow algorithm computes the grid status and determines possible changes in the grid topology, forming the basis for an intelligent, secure and self-sustaining grid control in real-time.
This innovative project has already received several awards. Amongst others, it received the Hessian States price in Germany for intelligent energy in the category “energy grids” and was appraised to be a very innovative alternative to conventional grid extension measures by the German Commission for Electrical, Electronic and Information Technologies of DIN and VDE.
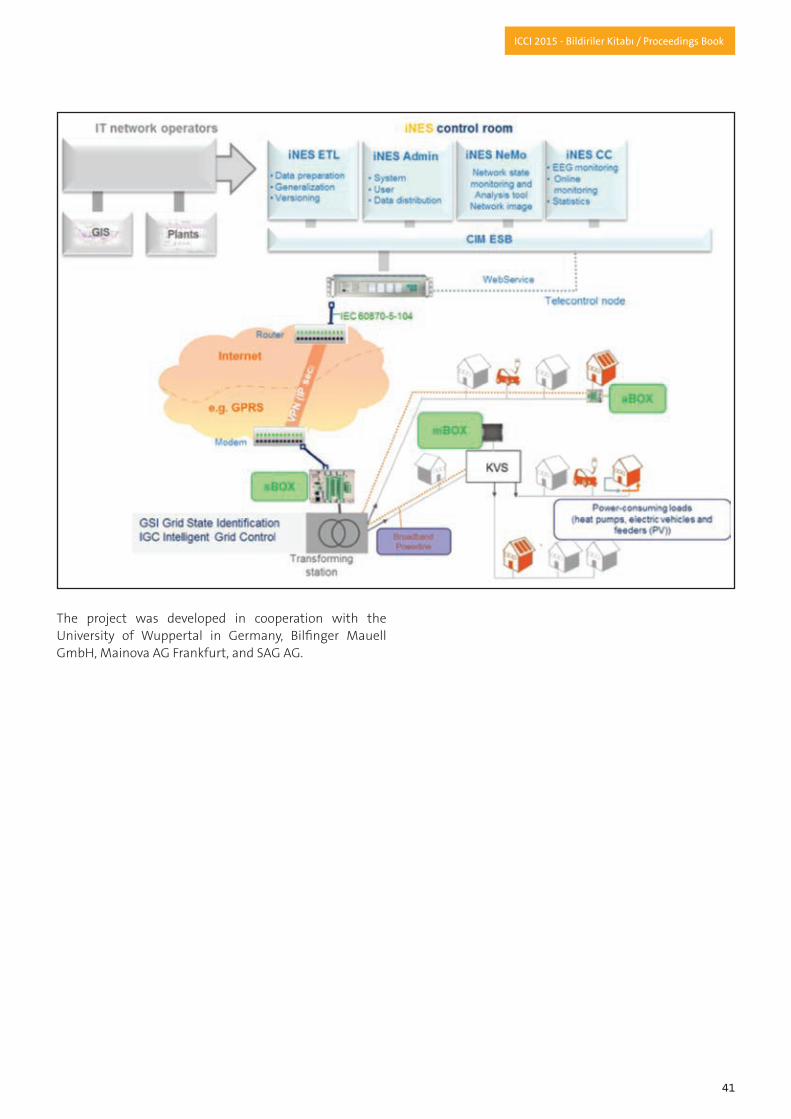
41
ICCI 2015 - Bildiriler Kitabı / Proceedings Book
The project was developed in cooperation with the University of Wuppertal in Germany, Bilfinger Mauell GmbH, Mainova AG Frankfurt, and SAG AG.

42
ICCI 2015 - Bildiriler Kitabı / Proceedings Book
Tender Procedures in Relation to Wind and Solar Preliminary License Applications and Recent Legal Amendments
Dr.DöneYALÇINManaging PartnerYalçın & Babalıoğlu Attorney Partnership
1. INTRODUCTION The tender process for wind and solar preliminary generation licenses is regulated under the Tender Regulation on Preliminary License Applications for the Establishment of Wind and Solar Generation Plants (“Tender Regulation”). As there are not too many available connection points declared each year, it is normal for there to be more than one application for the same region and/or connection points, which in total are in excess of the grid connection capabilities. In this case, the Turkish Electricity Transmission Company (“TEİAŞ”) will initiate a tender to determine which applicants will be granted the right of connection to the grid. The investor offering the highest contribution fee to TEİAŞ will be granted the license for that particular connection point.
In order to understand the necessity of such tender procedure for wind and solar energy power plants, this subject needs to be evaluated by taking into consideration the licencing process in the electricity market, reasons for the demand for wind and solar power plants, the requirements of the licencing process for wind and solar power plants and reasons for restrictions on the connection of wind and solar power plants to the electricity network.
2. GENERAL OVERVIEW OF THE ELECTRICITY MARKETEntry to the electricity market is not without restrictions. Only limited liability companies and joint-stock companies established in Turkey may obtain electricity generation licenses. However, there are no restrictions on foreign ownership.
The Electricity Market Law No. 6446 (the “EML”) and the Law on the Use of Renewable Resources for the Generation of Electricity Law No. 5346 (the “Renewable Energy Law”) have been supplemented with various regulations and annexes that detail the provisions of the main legislation. Under the EML and the Electricity Market License Regulation (the “Licensing Regulation”), generation, transmission, distribution, supply, export, import and market operation activities require the issuance of a license by the Energy Market Regulatory Authority (“EMRA”).
The EML has introduced a number of new features to Turkey’s electricity market such as preliminary licenses
for generation activities, supply licenses for retail and wholesale activities, share transfer restrictions and the incorporation of a new market operator – Enerji Piyasaları İşletme Anonim Şirketi.
The EML provides a two-tier licensing system. Accordingly, a preliminary license for up to twenty four (24) months will be granted to those companies intending to carry out generation activities. The preliminary license refers to the period in which the investor is required to secure clearances and permits from other governmental authorities to start the construction of the project. Depending on the location and type of investment, an investor may be required to obtain clearances and permits from a dozen different governmental entities, including the system connection and usage agreements with TEİAŞ, environmental clearances and/or acquisition of real property and usufruct rights pertaining to the proposed site of the project. No license is required for renewable projects with a maximum installed capacity of one (1) MW.
The Licensing Regulation prohibits holders of a preliminary license from changing, whether directly or indirectly, their shareholding structure; transfer their shares and/or engage in any type of transaction that could result in a share transfer. This restriction shall not apply where the license holder is a publicly traded entity (such exemption will be applicable to the publicly traded part of the related companies) or if there is an indirect change in the shareholding structure due to a change of ownership at the shareholders-level residing abroad.
Once the generation license is obtained, any transfer of shares (whether direct or indirect) corresponding to ten percent (10%) (or five percent (5%), if publicly traded) of the license holder’s share capital, is subject to approval by the EMRA.
3. INCENTIVES IN RELATION TO RENEWABLE ENERGYSOURCESThe Renewable Energy Law provides the legal framework for electricity generation from renewable energy sources. The Renewable Energy Law defines renewable energy sources as “wind, solar, geothermal, biomass, biogas, wave,
43
ICCI 2015 - Bildiriler Kitabı / Proceedings Book
current and tidal energy sources together with hydraulic generation plants either canal or run-of-river type or with a reservoir area of less than fifteen square kilometres”. The purpose of this law is to incentivise private investments in the renewable energy market and to finalise the liberalisation of the electricity market using renewable and domestic resources. It also aims to diversify energy resources, increase recycling of waste products and to reduce gas emissions from the use of fossil fuels.
Facilities generating electricity from renewable energy sources, within the meaning of the definition in the Renewable Energy Law, may apply for a renewable energy source certificate which is issued by the EMRA in order to benefit from the purchase guarantee under the renewable energy source incentive mechanism and other incentives under the Renewable Energy Law. Please find below a list of the main incentives available for renewable energy sources:
• Purchase guarantee;• Feed-in tariff prices;• Domestic components increase the feed-in tariff prices;• Construction on forestry land, land owned by the treasury or land under the control and disposal of the state;• Discount on the fees payable for such rights during the investment period and the first ten (10) years of the operation period of power plants along with preliminary license fee and generation license fee;• Non-payment of annual license fees for the first eight years after the completion date of the facility;• Priority in terms of their connection to the transmission and/or distribution systems;• Undertaking a construction / upgrade for additional capacity within the area specified in their respective licenses provided that the power delivered to the system does not exceed the installed capacity stated in their licenses;• Construction in national parks, natural parks, natural conservation zones, protected forests and wildlife protection areas with the affirmative opinion of the relevant ministry or the relevant regional protection council; and• Exemption from the contribution fee of one percent (1%) of the revenue of the facility constructed over land owed by the treasury, in addition to any fee for the transfer of land rights, such as a usufruct fee.
4. LICENCING PROCESS OF WIND AND SOLAR POWERPLANTS In recent years the development of the renewable energy market has become the primary energy strategy of the Turkish government with the intention of improving energy efficiency and decreasing energy import dependency. In
particular, there is an immense potential for solar power to become a fundamental source of electricity in the near future, especially in the south of Turkey where there is potential for an annual irradiance of approximately one point thirty three MWh (1.33 MWh) per square meter.
The Ministry of Energy and Natural Resources (“Ministry”)’s strategy is to increase the installed capacity in solar energy to at least three thousand MW (3,000 MW) and in wind energy to at least twenty thousand MW (20,000 MW) by 2023. However, solar energy efficiency is currently still very low and significant foreign investment is likely to be required in order to meet the Ministry’s target.
Like with all regulated activities in the electricity market, a preliminary license must be obtained to start construction of a renewable energy power plant (“REPP”) and subsequently, the EMRA issues a generation license in order to establish and operate a REPP in Turkey.
REPPs have the opportunity to obtain a renewable energy resource certificate from the EMRA. The certificate entitles REPPs to benefit from certain incentives of the Turkish government including the purchase guarantee, and regulated rate for the use of locally-manufactured components.
The license application procedure for REPPs differs from the licensing procedure of other power plants. That is, investors cannot apply for solar or wind licenses any time they want. They need to wait for the pre-determined application dates. The reason being that the Turkish transmission system needs to have available capacities to connect REPPs to the national grid.
According to the Licensing Regulation, vacant capacity for solar and wind energy facilities will be declared by TEİAŞ by April 1st of each year. Based on those available capacity figures, the investors will be able to make preliminary license applications to the EMRA (i) during the first five days of October of that year for wind projects and (ii) during the last five days of October of that year for solar projects. Only for 2015, the EMRA has announced that the preliminary generation license application period for wind projects will be from April 24th, 2015 to April 30th, 2015. Such preliminary generation license applications for wind power plants will be limited to three thousand MW (3,000 MW). It is expected that the preliminary generation license applications for solar projects will be accepted in the course of 2015, although no official announcement is publicly available.
Please find below the map of the Republic of Turkey which indicates capacities of three thousand MW (3,000 MW) for each region:

44
ICCI 2015 - Bildiriler Kitabı / Proceedings Book
Figure 1. The map of the republic of Turkey in relation to available capacities for each region[1].

45
ICCI 2015 - Bildiriler Kitabı / Proceedings Book
i. Pre-licensing requirements Prior to the licensing period, applicants must obtain a pre-license which is attainable provided that certain requirements are met. For instance, the legal entity applying for the license must be incorporated as a joint stock company or limited liability company and all of its shares must be registered shares. The minimum share capital of the company must exceed five percent (5%) of the total investment amount which is determined by EMRA with regard to the installed capacity. The company’s articles of association must also comply with EMRA regulations.
ii. Generation License requirementsIn order to then apply for a generation license, applicants must ensure that their share capital has been augmented from five percent (5%) to twenty percent (20%) before the license is applied for and must obtain an additional letter of a bank guarantee equal to a minimum of six percent (6%) of the total investment amount.
Please note that share transfers during the license period are subject to EMRA’s approval when ten percent (10%) of the shares of the license holding company are subject to direct or indirect acquisition or where a change of control occurs without any change in the shareholding structure.The diagram below briefly explains the steps for obtaining a license for a wind or solar power plant.
5. GENERAL CRITERIA OF LIMITATION ON THE CONNECTION OF WIND AND SOLAR POWER PLANTSThe limitation on the connection of the wind and solar power plants is related with transmission constraint of overhead power line on the Turkish electricity network.
Previously, main condition of connection to a substation, installed capacity of wind power plant was required to be less than five percent (5%) of short-circuit power of the substation. Thus, when this condition was met, the wind power plant could be connected to electricity network.
In the current situation, the connection capacities of wind and solar power plants are determined according to the TS EN 61400 standards. Different than the previous limitation, the new limitations on solar and wind power plants are related to insufficiencies in the transmission lines. 6. TENDER PROCESS FOR WIND AND SOLAR ENERGY SOURCESWhere there is more than one application for the same region and/or connection point, which in total are in
excess of the grid connection capabilities, the TEİAŞ will initiate a tender to determine which applicants will be granted the right of connection to the grid.
In relation to each proposed tender, each tender participant has to submit a bid (“Participation Amount”) in relation to the payment per MW for a maximum of three (3) years.
The steps of the tender application process under the Tender Regulation are as follows: • EMRA shall inform TEİAŞ of the applications that are eligible for the tender process and TEİAŞ shall publish such applicants on its website along with information on the installed capacities that will be taken into account during the tender process, • TEİAŞ will send an invitation to the relevant applicants to submit their offers on the date and time of the tender as announced on its website, • On the date of the tender, applicants shall submit their envelopes displaying the company’s title, name of the project and the registration number given by EMRA during the preliminary license application stage. The envelope must bear the signatures of the authorised signatories of the respective applicant company on the company seal. Applicants will have a minimum of thirty (30) days to collect all the documentation. It should be noted that there is no cure period in case of any discrepancies within the submitted information or if there is any missing information. The Tender Regulation explicitly states that applications will be rejected in such cases. • The participant(s) who submit(s) the highest Participant Amount will be awarded the tender. A contribution agreement is signed with the TEİAŞ.
To clarify this by an example below, participants A and B will be granted the entire capacity requested, participant C will be required to reduce its application to fifteen MW (15 MW) whilst Participant D will not be awarded any capacity.
REFERENCES[1] Çalışkan M., Presentation on Renewable Energy Opportunities in Turkey (Outlook, market trends and policy frameworks), pp. 11, 2015.

46
ICCI 2015 - Bildiriler Kitabı / Proceedings Book
ABSTRACTDuckweed plants are widely used for the aim of phytoremediation. The harvested duckweed biomass from these approaches could be used as bioenergy source. As bioenergy source, usage of duckweed biomass obtained from phytoremediation is an innovative approach that effectively supports the sustainable energy supply. This application way conserves the water resources via phytoremediation of polluted waters while acting as a renewable energy source.
Keywords: Duckweed, Bioenergy, Renewable, Plant, Phytoremediation
1. INTRODUCTIONEffects of the utilization of fossil fuels, such as global climate change, world energy conflicts and energy source shortages, have increasingly threatened world stability. Their negative effects are observed at all levels of the society, i.e. locally, regionally and globally. These global world problems can be summarized through the following three sections: (i) Decrease in fossil fuel reserves due to world population growth and increasing energy demand (ii) Global climate change due to the increase of CO2 concentration in the atmosphere (iii) Increase in levels of wastes (solid/liquid) due to increase in population among World[1].
Since fossil fuels are limited and consumption of these fuels casts a negative impact on the environment, renewable energy is playing a crucial role in sustainable energy development[2,3]. In 2012 alone, global investment in renewables has reached 244 million dollars, 8% above the 2010 level. As the world’s fourth largest source of energy (following oil, coal, and natural gas), biomass is expected to become the most promising renewable energy source[3]. Various types of wastes from agricultural (plant and animal wastes), industrial (sugar refinery, dairy wastes, confectionary waste, pulp and paper, tanneries and slaughter houses) and residential (kitchen waste and garden waste) sectors are the potential renewable energy sources to attain sustainability[1].
Many aquatic plants are utilized in natural wastewater treatment systems due to their ability to effectively treat wastewater by nutrient assimilation and organic matter reduction with resulting high growth rates of biomass that can be used for bioenergy production[4].
2. BIOENERGY AND DUCKWEED Bio-energy is now accepted and having the potential to provide a major part of the projected renewable energy provisions required for future[5]. According to the International Energy Agency an increase in bioenergy development could provide 25% of the world’s energy needs by 2035, while creating jobs, decreasing carbon emissions, and improving rural economies[6][7]. Bioenergy technologies are unique in their potential to serve all three areas of major energy demand: heat, electricity, and transport fuels and chemicals[8-11]. That is reason why bioenergy technologies have attracted great political interest from most countries worldwide. Especially, commitments to decreasing greenhouse gas emissions, the desire to secure and diversify energy supplies, and the wish to mitigate uncertainty related to oil prices are rendering various types of biomass more interesting fuels to industrialized countries[11-13].
Currently, biofuels emerged as a sustainable alternative source of energy to replace conventional fossil fuels. Biogas, biohydrogen, bioethanol and biodiesel can be obtained using biomass as a feedstock. Grain, seeds, stems, husks from a large variety of crops like wheat, rice, soyabean, etc. are used to produce biofuels[14]. The feedstocks used for bioenergy are terrestrial crops that may compete with the food chain for arable land, which results in adverse effects on food security and environment. Hence, aquatic biomass could be a candidate feedstock for bioenergy production[15].
Duckweed, the common name for four main genera of Lemnaceae: Lemna, Spirodela, Wolffia and Wolffiella, is the smallest and fastest-growing flowering plant on earth[16]. They are free-floating aquatic angiosperm plants which do not have distinct stems and leaves. The
Bioenergy From the Aquatic Plant Duckweed
E.IşılArslanTOPALDepartment of Environmental EngineeringEngineering FacultyFırat University
MuratTOPALGeneral Directorate of State Hydraulic Works, 9th District Office

47
ICCI 2015 - Bildiriler Kitabı / Proceedings Book
whole plant body is reduced to form a flat small leaf-like structure called frond[17]. These aquatic plants are available in natural water bodies around the World[4].
Several aquatic, free floating, submerged, plant species (e.g. Echhornia, Azolla, Lemna, Pistia, Typha, Phragmites, Cyperus, Juncus, Colocasia, Phalaris, Scirpus, etc.) are considered to be effective biological agent to remove impurities from wastewaters (Figure 1). Phytoremediation technology using aquatic macrophytes for wastewater treatment have been promoted as sound option to manage wastewater resources in many parts of the World[18]. Innovative technologies have been developed to use duckweed in natural wastewater treatment[4]. As an aquatic plant, duckweed is commonly used to recover nutrients (e.g., nitrogen and phosphorus) and toxic metals from agricultural and municipal wastewater (phytoremediation)[16]. It is widely accepted that the use of duckweed in wastewater treatment is a cost effective and environment-friendly approach[4].
In addition to the treatment ability of wastewater, aquatic plants have the potential as a bridge between wastewater and energy. Currently, aquatic plant biomass can be efficiently converted into electrical power by gasification or be anaerobically digested to produce methane or converted to methanol or butanol. The energy production rate is the product of biomass production rate, biomass energy content, and the conversion process efficiency.
Since the biomass energy content does not have a large variability, the energy production rate is primarily determined by biomass production rate[4]. Duckweed relies mainly on vegetative reproduction[19]. Duckweeds have high reproduction rates, and can double its biomass in favorable water environmental conditions in 2 days or even less[4]. Many factors such as nutrient, temperature, light and so on affect the growth of duckweed[19]. The biomass production of duckweed showed high variability depending on the environment conditions from 2 to 79 ton dry wt/ha annually[4]. In the study of Ge et al.[16], duckweed (Lemna minor) was grown in swine lagoon wastewater and Schenk & Hildebrandt medium (under ideal culture conditions as control) with a growth rate of 3.5 and 14.1 g/m2 day (dry basis), respectively detected.
Landolt obtained its highest growth rate at 64 g/g-week. This growth rate is 28 times greater than that of corn, which grows at 2.3 g/g-week, indicating that duckweed can produce much more biomass than most terrestrial crops[19]. In the study of Fedler and Duan[4], the potential biomass production from duckweed was investigated using recycling wastewater from an integrated natural waste treatment system from 2005 to 2008. In their study, the daily growth rates of duckweed in three big tanks and three small square PVC frames were 0.099 kg wet/m2 (361 ton wet/ha annually) and 0.127 kg wet/m2 (464 ton wet/ha annually), respectively. They were reported that the aquatic biomass produced can be harvested as a source of biomass for energy production. Solar energy is caught by plants and stored in the biomass and gaseous carbon dioxide, one component of greenhouse gas, is utilized and reduced via biomass production. Finally, biomass produced in this system can be converted to electricity or other forms of consumable green energy. Duckweed has an energy content of 10.1 kJ/g dry wt[4].
Scientists have made oil and biogas from duckweed in the latest years, highlighting its great potential as a novel bio-energy feedstock[19]. Recently, duckweed has garnered increasing attentions as a potential feedstock for bioethanol production due to its excellent growth and great starch accumulation capability (up to 70% dry weight)[16]. Studies have showed that duckweed can produce significant quantities of starch that can be readily converted to bioethanol, thus serving as an industrial feedstock for clean energy production[16,18]. In contrast to high content of starch accumulated, duckweed biomass has relatively low cellulose contents (~10% dry weight) as compared to terrestrial plants (~40% dry weight). Although starch is the component of interest for bioethanol production, conversion of cellulose fraction to ethanol is also necessary considering fuel ethanol is a bulk and low-value industrial product, and any improvement in full utilization of its feedstock will be economically and environmentally attractive[16]. In the study of Ge et al.[16], without prior thermal-chemical pretreatment, up to 96.2% (w/w) of glucose could be enzymatically released from both the cellulose and starch fractions of duckweed biomass. The enzymatic hydrolysates could be efficiently fermented by two yeast strains with a high ethanol yield of 0.485 g/g (glucose). As an aquatic species, duckweed biomass lack of lignin and deficient in hemicellulose is much less recalcitrant to saccharification than terrestrial plants, which would make the biomass-to-ethanol conversion process easy and cost-effective[16]. Ethanol has been made from duckweed with a yield of 25.8% of the original dry duckweed biomass or a concentration of 30.8 g/l. Duckweed has also been successfully converted into biobutanol[19].
Figure 1. Wastewater treatment with duckweed[4].

48
ICCI 2015 - Bildiriler Kitabı / Proceedings Book
3. CONCLUSIONSEnergy consumption is increasing due to the population increase and industrialization. Renewable energy resources are solutions both for the shortage in fossil fuels and environmental problems seen. Duckweed plants can be found in the different areas of the world. They are commonly used in wastewater treatment. This treatment method is a cost-effective method. The method also provides a high valuable product (harvested duckweed) that can be used as a source for bioenergy. Duckweed plants have some properties (e.g. high starch accumulation and high reproduction rates) which supports them as bioenergy sources.
REFERENCES[1] Kothari R., Tyagi V.V., Pathak A., 2010. Waste-to-energy: A way from renewable energy sources to sustainable development, Renewable and Sustainable Energy Reviews, 14, 9, 3164-3170. [2] Chen Z.M., Chen G.Q., 2011. An overview of energy consumption of the globalized world economy, Energy Policy, 39, 5920–5928.[3] Wu X.F., Wu X.D., Li J.S., Xia X.H., Mi T., Yang Q., Chen G.Q., Chen B., Hayat T., Alsaedi A., 2014. Ecological accounting for an integrated “pig–biogas-fish” system based on emergetic indicators, Ecological Indicators, 47, 189-197.[4] Fedler C.B., Duan R., 2011. Biomass production for bioenergy using recycled wastewater in a natural waste treatment system, Resources, Conservation and Recycling, 55, 8, 793-800.[5] Rezania S., Ponraj M., Md Din M.F., Songip A.R., Md Sairan F., Chelliapan S., 2015. The diverse applications of water hyacinth with main focus on sustainable energy and production for new era: An overview, Renewable and Sustainable Energy Reviews, 41, 943-954.[6] Kopetz H., 2013. Building a biomass energy market, Nature, 494 (7435), 29–31.[7] Smith L.L., Allen D.J., Barney J.N., 2015. Yield potential and stand establishment for 20 candidate bioenergy feedstocks, Biomass and Bioenergy, 73, 145-154.[8] Thornley P., Cooper D., 2008. The effectiveness of policy instruments in promoting bioenergy, Biomass Bioenergy, 32, 903–913.[9] Jha V., Trade flows, barriers and market drivers in renewable energy supply goods: the need to level the playing field. ICTSD Trade and Environment Issue Paper 10, International Centre for Trade and Sustainable Development: Geneva; 2009.[10] Jeffers R.F., Jacobson J.J., Search E.M., 2013. Dynamic analysis of policy drives for bioenergy commodity markets, Energy Policy, 52, 249–263.[11] Sung B., 2015. Public policy supports and export performance of bioenergy technologies: A dynamic
panel approach, Renewable and Sustainable Energy Reviews, 42, 477-495.[12] Heinimö J., Junginger M., 2009. Production and trading of biomass for energy – An overview of the global status, Biomass Bioenergy, 33, 1310–1320.[13] Zafeiriou E., Arabatzis G., Tampakis S., Soutsas K., 2014. The impact of energy prices on the volatility of ethanol prices and the role of gasoline emissions, Renew Sustain Energy Rev, 33, 87–95.[14] Saba N., Jawaid M., Hakeem K.R., Paridah M.T., Khalina A., Alothman O.Y., 2015. Potential of bioenergy production from industrial kenaf (Hibiscus cannabinus L.) based on Malaysian perspective, Renewable and Sustainable Energy Reviews, 42, 446-459.[15] Huang M., Fang Y., Xiao Y., Sun J., Jin Y., Tao X., Ma X., He K., Zhao H., 2014. Proteomic analysis to investigate the high starch accumulation of duckweed (Landoltia punctata) under nutrient starvation, Industrial Crops and Products, 59, 299-308.[16] Ge X., Zhang N., Phillips G.C., Xu J., 2012. Growing Lemna minor in agricultural wastewater and converting the duckweed biomass to ethanol, Bioresource Technology, 124, 485-488.[17] Rahman M.A., Hasegawa H., 2011. Aquatic arsenic: Phytoremediation using floating macrophytes, Chemosphere, 83, 5, 633-646.[18] Verma R., Suthar S:, 2014. Synchronized urban wastewater treatment and biomass production using duckweed Lemna gibba L., Ecological Engineering, 64, 337-343.[19] Xiao Y., Fang Y., Jin Y., Zhang G., Zhao H., 2013. Culturing duckweed in the field for starch accumulation, Industrial Crops and Products, 48, 183-190.
49
ICCI 2015 - Bildiriler Kitabı / Proceedings Book
ABSTRACTAs energy source, wastes are renewable and sustainable. Large amounts of fish wastes are generated from fishing industry. These wastes are generally used in the production of low value products. They are disposed in landfills or buried with lime. Therefore, biogas production from these wastes as alternative energy source would be a rational option.
Keywords: Renewable energy,Fish waste, Biogas, Methane
1. INTRODUCTIONNowadays, energy is key consideration in discussions of sustainable development. So, sustainable development requires a sustainable supply of clean and affordable renewable energy sources that do not cause negative societal impacts. Wastes and biomass fuels are usually viewed as sustainable energy sources. Wastes are convertible to useful energy forms like hydrogen (biohydrogen), biogas, bioalcohol, etc., through waste-to-energy technologies[1].
Anaerobic digestion is a biological process by which organic matter is degraded in the absence of oxygen and biogas is produced as a bye-product. The gas can be used directly for cooking, heating or production of electricity. Biogas has very useful by-products and positive impacts on public health and pollution. This, together with the growing shortage of firewood and rising cost of fossil fuels, has made anaerobic digestion increasingly demanding. These advantages of the process might make it well suited for use in developing countries[2][3].
2. FISH WASTES AND METHANE PRODUCTIONThe fishing sector produces large amounts of waste in fish markets and processing industries[4]. Waste resulting from fishing and fish processing are fish offal (fish guts, frames, skins, heads, guts and frames of processed product etc.)[5] which can amount to 60% of the raw material mass[6] and whole discards (whole fish, squid or other bycatch) [5]. The UN Food and Agricultural Organisation has estimated the annual world fish harvest resulting from commercial
fishing in wild fisheries and fish farms to be 140 million tons[7]. Assuming 45% of the live weight to be waste[8], it can be estimated that nearly 64 million tonnes of fish waste are generated annually[9].
The fishing industry is important both for Turkey and some other countries. It is one of the most important industries in many Arctic regions, e.g. in Greenland where it generates about 14,000 tons of waste each year, where of only about 20% is utilized [10][11]. Laos et al.[12] reported that the production of rainbow trout in farming cages is an important activity, developed during the last 15 yr in the Andean–Patagonian region (NW Patagonia). Fish offal production (viscera, racks, heads, and other components) is about 150-300 t/yr, with a projected trend towards 1800 t/yr during the next five years. Its current disposal is landfilling or burying with lime[12]. The fish canning industries are an important sector in Galicia (NW of Spain), representing most of the total Spanish production. The amount of solid waste generated in fish canning industries is important. During the manufacturing processes of fishes, the amount of raw products converted into waste can reach up to 50% by weight (data provided by Xunta de Galicia)[13].
Waste lipids are ideal substrates for methane production since their degradation does theoretically produce more biogas (1.42 L/g) than proteins or carbohydrates (0.92 and 0.83 L/g, respectively)[13,14]. For instance digestion of sewage sludge will result in a biogas yield of about 1–2 m3 biogas/m3 reactor volume per day, while this number would be increased to 4–10 m3 biogas/m3 reactor volume when adding approx. 20% fatty waste[11,15].
Manufacturing processes in fish canning industries generate a considerable amount of solid waste that can be digested anaerobically[13]. Waste such as fish waste and fish sludge, which are rich in lipids and proteins, have the advantage of giving high methane yields, and can be attractive as substrates in an anaerobic digestion process[9,16].
Biogas Production From Fish Wastes as Alternative Energy Source
E.IşılArslanTOPALDepartment of Environmental EngineeringEngineering FacultyFırat University
MuratTOPALGeneral Directorate of State Hydraulic Works, 9th District Office

50
ICCI 2015 - Bildiriler Kitabı / Proceedings Book
At the same time, fish waste also have properties that make them less suitable for anaerobic microbial degradation, for example; (i) Free long-chain fatty acids can inhibit methanogenesis[16][17], (ii) Protein degradation causes high concentrations of free ammonia (NH3) in the process, which might inhibit aceticlastic methanogenesis[18], (iii) High concentrations of light metals such as calcium, sodium, potassium and magnesium are known to be inhibitory to methanogens. Co-digestion could be used to overcome the inhibition[9] Co-digestion is a technology that is increasingly being applied for simultaneous treatment of several solid and liquid organic wastes[19][20]. It combines different organic substrates to generate a homogeneous mixture as input to the anaerobic reactor in order to increase process performance[21].
3. LITERATURE STUDIESLiterature on methane production from fish waste is scarce. Callaghan et al.[22] used a continuously stirred tank reactor (18 L) as an anaerobic reactor to examine the effect of adding fish offal to a system which was digesting cattle slurry. The concentrations of free ammonia which were present in the liquors tended to decrease when the fish offal was present and did not exceed 100 mg/L. This is below the concentrations which have been shown to be inhibitory.
Callaghan et al.[23] tried to increase the batch biomethane production of cattle slurry through co-digestion with fish offal obtained from a rainbow trout farm. The co-digestion mixture was 70% (w/w) cattle slurry, 20% fish offal and 10% digester inoculum. The methane (CH4) yield was enhanced from 0.28 L CH4/g VSremoved obtained with cattle slurry alone to 0.38 L CH4/g VSremoved obtained with the mixture.
Mshandete et al.[24] tested the batch anaerobic digestion of fish waste obtained from the landing beach which consisted of offal, scales, gills and washing water. The highest CH4 yield from fish waste was 0.39 L CH4/g VS added at 0.05 g VS waste/g VS inoculum and 5%TS of waste[13].
In the study of Bouallagui et al.[21], the effect of fish waste addition as co-substrate on the fruit and vegetable waste anaerobic digestion performance was investigated under mesophilic conditions using anaerobic sequencing batch reactor. The reactor was operated at an organic loading rate (OLR) of 2.46–2.51 g VSs/L d, of which approximately 90% were from fruit and vegetable waste, and a hydraulic retention time of 10 days. Fish waste addition led to improvement of the process stability, as indicated by the low VFAs/Alkalinity ratio of 0.28, and permitted anaerobic digestion of fruit and vegetable waste without chemical alkali addition. Despite a considerable decrease in the C/N
ratio from 34.2 to 27.6, the addition of fish waste slightly improved the gas production yield (8.1%) compared to anaerobic digestion of fruit and vegetable waste alone.
Regueiro et al.[25] evaluated co-digestion of pig manure with fish waste and compared with sole pig manure digestion. Results indicated that co-digestion of pig manure with fish waste is possible as long as ammonium and volatile fatty acids remained under inhibitory levels by adjusting the operating conditions, such as feed composition and OLR. Pig manure and fish waste co-digestion (90:10 and 95:5, w/w) was possible at OLR of 1–1.5 g COD/L d, resulting in biogas production rates of 0.4–0.6 L/L d.
Eiroa et al.[13] studied the biochemical CH4 potential of different solid fish waste. Anaerobic batch assays were performed with tuna, sardine, mackerel and needle fish waste. Co-digestion assays of fish waste with gorse were undertaken in order to try to improve CH4 production. For tuna, sardine and needle fish waste, around 0.47 g COD–CH4/g COD added(0.26 L CH4/g VS added) was obtained in batch experiments with 1%TS.
Kafle et al.[26] investigated biogas production from fish waste obtained from a fish processor. The fish waste silages were prepared by mixing fish waste with bread waste and brewery grain waste. The biogas and CH4 yield for fish waste silages after 96 days was calculated to be 671–763 mL/g VS and 441–482 mL/g VS, respectively.
Solli et al.[27] studied the co-digestion of fish waste silage and cow manure. The reactors were operated in the mesophilic range (37 °C) with a HRT of 30 days, and the entire experiment lasted for 450 days. The highest CH4 production from co-digestion of fish waste silage and cow manure was 0.400 L CH4 g/VS. Compared to anaerobic digestion of cow manure only, the methane production was increased by 100% at most, when fish waste silage was added to the feed stock.
Gunnarsdóttir[11] used addition of Greenlandic Halibut (GH) and shrimp offal in the study of mesophilic anaerobic digestion with aerobic storage in blackwater. 91% of the total CH4 production was obtained within the first 10 days of incubation. Specific CH4 yield of blackwater + fish offal mixture was 619.7 ± 13.5 mL g/VS. The high specific CH4 yield of blackwater + GH was in accordance with what would be expected, taking into consideration the high lipid content of the GH (over 80% of the VS content). The results indicate that anaerobic digestion of wastewater could benefit from the addition of fish offal, with respect to both microbial reduction and energy production.

51
ICCI 2015 - Bildiriler Kitabı / Proceedings Book
4. CONCLUSIONSIn the last years, anaerobic digestion of animal wastes has been promoted in order to avoid the uncontrolled emissions of CH4 during storage[25]. Fish waste is mainly composed of heads, viscera, bones and scales, and is rich in lipids and proteins. Fish waste is often under-utilized[28] being mainly used in the production of low-value animal feed products such as fish meal or fish silage[9]. Fish offal and fish oil have been shown to have a promising biogas yield[15].
REFERENCES[1] Kothari R., Tyagi V.V., Pathak A., 2010. Waste-to energy: A way from renewable energy sources to sustainable development, Renewable and Sustainable Energy Reviews, 14, 9, 3164-3170.[2] Gunnarsson C.C., Petersen C.M., 2007. Water hyacinths as a resource in agriculture and energy production: a literature review. Waste Manage. 27,117–129.[3] Rahman M.A., Hasegawa H., 2011. Aquatic arsenic: Phytoremediation using floating macrophytes, Chemosphere, 83, 633–646.[4] López-Mosquera M.E., Fernández-Lema E., Villares R., Corral R., Alonso B., Blanco C., 2011. Composting fish waste and seaweed to produce a fertilizer for use in organic agriculture, Procedia Environmental Sciences, 9, 113-117.[5] Abraham E.R., Pierre J.P., Middleton D.A.J., Cleal J., Walker N.A., Waugh S.M.,2009. Effectiveness of fish waste management strategies in reducing seabird attendance at a trawl vessel, Fisheries Research, 95, 2–3, 210-219.[6] Kołodziejska I., Skierka E., Sadowska M., Kołodziejski W., Niecikowska C., 2008. Effect of extracting time and temperature on yield of gelatin from different fish offal, Food Chemistry, 107, 2, 700-706.[7] FAO, 2005. Review of the Scale of World Marine Fishery Resources. FAO Fisheries Technical Paper.[8] Rai A.K., Swapna H.C., Bhaskar N., Halami P.M., Sachindra N.M., 2010. Effect of fermentation ensilaging on recovery of oil from fresh water fish viscera, Enzyme and Microbial Technology, 46, 9-13.[9] Nges I.A., Mbatia B., Björnsson L., 2012. Improved utilization of fish waste by anaerobic digestion following omega-3 fatty acids extraction. Journal of Environmental Management, 110, 159-165.[10] Nielsen U., Nielsen K., Mai P., Frederiksen O., 2006. Organisk industriaffald i Grønland-Værktøjer til fremme af bedste tilgængelige teknik og nyttiggørelse af restprodukter, Realistiske muligheder for nyttiggørelse/udnyttelse af organisk industriaffald i Grønland, nr. M. 127/001–0164.[11] Gunnarsdóttir R., Heiske S., Jensen P.E., Schmidt J.E., Villumsen A., Jenssen P.D., 2014. Effect of anaerobiosis on indigenous microorganisms in blackwater with fish offal as co-substrate, Water Research, 63, 1-9.
[12] Laos F., Mazzarino M.J., Walter I., Roselli L., Satti P., Moyano S., 2002. Composting of fish offal and biosolids in northwestern Patagonia, Bioresource Technology, 81, 3, 179-186.[13] Eiroa M., Costa J.C., Alves M.M., Kennes C., Veiga M.C., 2012. Evaluation of the biomethane potential of solid fish waste, Waste Management, 32, 7, 1347-1352.
[14] Alves M.M., Pereira M.A., Sousa D.Z., Cavaleiro A.J., Picavet M., Smidt H., Stams A.J.M., 2009. Waste lipids to energy: how to optimize methane production from long-chain fatty acids (LCFA) (Minireview), Microbial Biotechnology, 2, 5, 538–550.[15] Ahring B., 2003. Perspectives for anaerobic digestion, Biomethanation,1–30.[16] Cirne D.G., Paloumet X., Bjornsson L., Alves M.M., Mattiasson B., 2007. Anaerobic digestion of lipid-rich waste e effects of lipid concentration. Renewable Energy 32, 965-975.[17] Pereira M.A., Pires O.C., Mota M., Alves M.M., 2005. Anaerobic biodegradation of oleic and palmitic acids: evidence of mass transfer limitations caused by long chain fatty acid accumulation onto the anaerobic sludge. Biotechnology and Bioengineering, 92, 15-23.[18] Schnurer A., Nordberg Å., 2008. Ammonia, a selective agent for methane production by syntrophic acetate oxidation at mesophilic temperature. Water Science and Technology, 57, 735-740.[19] Alatriste M., Felipe S., Parviz C., Huub H., Ahring J., Birgitte K., Iranpour R., 2006. Anaerobic codigestion of municipal, farm, and industrial organic wastes: a survey of recent literature. Water Environ. Res. 78, 607–636.[20] Perez M., Rodriguez-Cano R., Romero L.I., Sales D., 2006. Anaerobic thermophilic digestion of cutting oil wastewater: effect of co-substrate. Biochem. Eng. J. 29, 250–257.[21] Bouallagui H., Lahdheb H., Romdan E. B., Rachdi B., Hamdi M., 2009. Improvement of fruit and vegetable waste anaerobic digestion performance and stability with co-substrates addition, Journal of Environmental Management, 90, 1844–1849.[22] Callaghan F.J., Wase D.A.J., Thayanithy K., Forster C.F., 1998. An Examination of the Continuous Anaerobic Co-Digestion of Cattle Slurry and Fish Offal, Process Safety and Environmental Protection, 76, 3, 224-228.[23] Callaghan F.J., Wase D.A.J., Thayanithy K., Orster C.F., 1999. Co-digestion of waste organic solids: batch studies, Bioresour. Technol., 67, 2, 117–122.[24] Mshandete A., Kivaisi A., Rubindamayugi M., Mattiasson B., 2004. Anaerobic batch co-digestion of sisal pulp and fish wastes, Bioresour. Technol., 95, 1, 19–24.[25] Regueiro L., Carballa M., Álvarez J.A., Lema J.M., 2012. Enhanced methane production from pig

52
ICCI 2015 - Bildiriler Kitabı / Proceedings Book
manure anaerobic digestion using fish and biodiesel wastes as co-substrates, Bioresource Technology, 123, 507–513.[26] Kafle G.K., Kim S.H., Sung K.I., 2013. Ensiling of fish industry waste for biogas production: A lab scale evaluation of biochemical methane potential (BMP) and kinetics, Bioresource Technology, 127, 326-336.[27] Solli L., Bergersen O., Sørheim R., Briseid T., 2014. Effects of a gradually increased load of fish waste silage in co-digestion with cow manure on methane production, Waste Management, 34, 8, 1553-1559.[28] Berge J. P., 2007. For a better use of marine by- products and wastes. FAO Fisheries Report 819, 103-110.
53
ICCI 2015 - Bildiriler Kitabı / Proceedings Book
ABSTRACTAs a result of the increase of energy consumption, depletion of fossil fuels is emerged. Therefore, alternative energy sources have become important. Biogas is an alternative energy source to fossil fuels. Biogas technology also minimizes environmental problems caused by fossil fuels. It could be done by several ways. Usage of green biomass is one of the efficient ways to enhance the biogas production.
Keywords: Energy, Biogas, Enhancement, Plant, Biomass
1. INTRODUCTIONThe majority of the world’s energy is provided by the petrochemical sources, coal and natural gases, all of these energy sources are finite. These sources going to be consumed shortly in the incoming years due to over exploitations and the growing human population[1][2]. In recent decades, the combination of increasing energy demands, food problems and environmental stresses has drawn more and more attention to the exploration and research of alternative energy sources[3] which are renewable as well as eco-friendly[4]. The most important property of alternative energy source is their environmental compatibility. Inline with this characteristic, renewable energy sources (mainly organic waste materials to energy) likely will become one of the most attractive substitutes in the near future. Renewable waste materials from agriculture, industries, and domestic sources are convertible to useful energy forms like biohydrogen, biogas, bioalcohols, etc., through waste-to-energy routes for sustainable growth of the World[5].
Biogas is a product of anaerobic degradation of organic substrates, which is one of the oldest processes used for the treatment of industrial wastes and stabilization of sludges[4]. Biogas is an environment friendly, economic and an alternative means to fossil fuel[6]. Biogas production, a primary way of using biomass to provide modern energy services, has continued to increase, especially in developing countries[7][8].
2. BIOGAS PRODUCTIONUnder anaerobic conditions, the organic materials are converted through microbiological reactions in to gases (biogas) and organic fertilizer (manure). Biogas and manure are the end products obtained from biogas technology. Methane is the main constituent of biogas. About 90% of energy of substrate is retained in methane. It is used mainly for cooking, lighting and in internal combustion engines to power water pumps and electric generators[5].
The production of biogas through anaerobic digestion offers significant advantages over other forms bioenergy production. It has been evaluated as one of the most energy-efficient and environmentally beneficial technology for bioenergy production. Limitation of carbon dioxide and other emission through emission regulations, carbon taxes and subsidies on biomass energy is making anaerobic digestion a more attractive and competitive technology for waste management[6]. Thus, biogas technology could be considered as better option for its compactness, cleaner operation and better product range (i.e. both gas as energy source and processed solid waste as manure)[5].
2.1. Enhancement of Biogas ProductionDespite its numerous advantages, the potential of biogas technology could not be fully harnessed or tapped as certain constraints are also associated with it. Most common among these are: the large hydraulic retention time of 30–50 days, low gas production in winter, etc. Therefore, efforts are needed to remove its various limitations so as to popularize this technology in the rural areas[4].
Anaerobic fermentation being a slow process leads to a large volume of the digester and hence high cost of the system. Gas generation decreases during winter season. Kalia and Singh[9] found that biogas production reduced from around 1700 l/day in May–July to around 99l/d in January–February. All this has resulted in restricted popularization of biogas technology in rural areas.
Enhancement of Biogas Production by Usage of Green Biomass
E.IşılArslanTOPALDepartment of Environmental EngineeringEngineering FacultyFırat University
MuratTOPALGeneral Directorate of State Hydraulic Works, 9th District Office

54
ICCI 2015 - Bildiriler Kitabı / Proceedings Book
Thus there is a need to improve the overall efficiency of anaerobic digestion process in the biogas plants. This could be done by several methods. Different methods used to enhance biogas production can be classified into the following categories:(i)Use of additives.(ii)Recycling of slurry and slurry filtrate.(iii)Variation in operational parameters like temperature, hydraulic retention time and particle size of the substrate.(iv)Use of fixed film/biofilters[4].
In these categories, enhancement of biogas production by usage of green biomass is the subject of this study. Therefore, usage of plant biomass is discussed in the present study.
2.1.1. Usage of green biomass Some attempts have been made in the past to increase gas production by stimulating the microbial activity using various biological and chemical additives under different operating conditions. Biological additives include different plants, weeds, crop residues, microbial cultures, etc., which are available naturally in the surroundings. As such, generally these are of less significance in terms of their use in the habitat, however if used as additives in biogas plant could improve its performance significantly. The suitability of an additive is expected to be strongly dependent on the type of substrate[4].
Plant biomass is a biological additive which include different plants, weeds etc. They are available naturally in the surroundings and help in improving anaerobic digestion. Plant biomass is mainly composed of cellulose, hemicellulose, and lignin. The composition of these constituents can vary from one plant species to another. Cellulose and hemicelluloses are easily degradable compared to lignin present in the plant biomass leading to increase or decrease of biogas production[10].
There are several studies about the usage of green biomass for enhancing biogas production. Powdered leaves of some plants and legumes (like Gulmohar, Leucacena leucocephala, Acacia auriculiformis, Dalbergia sisoo and Eucalyptus tereticonius) have been found to stimulate biogas production between 18% and 40%. Increase in biogas production due to certain additives appears to be due to adsorption of the substrate on the surface of the additives. This can lead to high-localized substrate concentration and a more favourable environment for growth of microbes. The additives also help to maintain favourable conditions for rapid gas production in the reactor, such as pH, inhibition/promotion of acetogenesis and methanogenesis for the best yield, etc.[4]. Dar and Tandon[11] evaluated the contribution of alkali-treated plant residues as a supplement to cattle dung for biogas
production. Lantana slurry gave 63.6% methane in the biogas; apple leaf litter, 59.6%, wheat straw, 58%, and peach leaf litter, 57.7%, against cattle dung, 56.1%. The digestion efficiency in terms of biogas release per gram of dry matter with pre-treated plant residues was 341–372 ml/g, 31%–42% higher than cattle dung[10]. Partially decomposed ageratum produced 43% and Euphorbia tirucalli L. produced 14% more gas as compared to pure cattle dung. Trujillo et al.[12] found that the addition of the tomato-plant wastes to the rabbit wastes in proportion higher than 40% improved the methane production. Crop residues like maize stalks, rice straw, cotton stalks, wheat straw and water hyacinth each enriched with partially digested cattle dung enhanced gas production in the range of 10–80%. Babu et al.[13] observed improvement in biomethanation of mango processing wastes by several folds by the addition of extracts of seeds of Nirmali, common bean, black gram, guar and guargum at the rate of 1500 ppm. Mixture of Pistia stratiotes and cowdung (1:1) gave a biogas yield of 0.62 m3/(m3 day) (CH4=76.8%, HRT=15 days). Recently Sharma [14] observed an increase of 40–80% in biogas production on addition of 1% onion storage waste to cattle dung in a 400-l floating drum biogas reactor [4].The methane content of the gas varied between 60% and 70% by addition of Parthenium hysterophorus, a weed with cattle manure at 10% level reported by Gunaseelan et al.[15]. Mixtures of partially decomposed Ageratum and cattle dung yielded about 9% more biogas than did pure cattle dung. The methane contents of the gas obtained from Ageratum mixtures were 62%–77% as compared to 56%–60% from pure cattle dung[16].
3. CONCLUSIONS Fossil fuels cause greenhouse gases which results in global warming. Biogas is a clean and sustainable energy. It can be generated from locally available biomass. The limitations of the biogas technology can be overcome by enhancement techniques. Green biomass could be used to enhance the biogas production rate.
REFERENCES[1] Muhammad S.R., Naim R., Ameena S., Tariq M., Jong-In H., Potential of bioenergy production from industrial hemp (Cannabis sativa): Pakistan perspective, Renewable Sustainable Energy Rev, 18 (2013), pp. 154–164.[2] Saba N., Jawaid M., Hakeem K.R., Paridah M.T., Khalina A., Alothman O.Y., Potential of bioenergy production from industrial kenaf (Hibiscus cannabinus L.) based on Malaysian perspective, Renewable and Sustainable Energy Reviews, Volume 42, February 2015, 446-459.[3] Xiao Y., Fang Y., Jin Y., Zhang G., Zhao H., Culturing duckweed in the field for starch accumulation, Industrial Crops and Products, Volume 48, 2013, Pages 183-190.

55
ICCI 2015 - Bildiriler Kitabı / Proceedings Book
[4] Yadvika, Santosh, Sreekrishnan T.R., Kohli S., Rana V., Enhancement of biogas production from solid substrates using different techniques––a review, Bioresource Technology, Volume 95, Issue 1, 2004, 1-10[5] Kothari R., Tyagi V.V., Pathak A., 2010. Waste-to-energy: A way from renewable energy sources to sustainable development, Renewable and Sustainable Energy Reviews, 14, 9, 3164-3170.[6] Merlin Christy P., Gopinath L.R., Divya D., A review on anaerobic decomposition andenhancement of biogas production through enzymes and microorganisms, Renewable and Sustainable Energy Reviews, Volume 34, 2014, 167-173.[7] Olugasa T.T., Odesola I.F., Oyewola M.O., Energy production from biogas: a conceptual review for use in Nigeria Renewable Sustainable Energy Rev., 32 (2014), pp. 770–776.[8] Wu X.F., Wu X.D., Li J.S., Xia X.H., Mi T., Yang Q., Chen G.Q., Chen B., Hayat T., Alsaedi A., Ecological accounting for an integrated “pig–biogas–fish” system based on emergetic indicators, Ecological Indicators, Volume 47, December 2014, Pages 189-197.[9] Kalia A.K., Singh S.P., Performance evaluation of Pragati and KVIC biogas plant in hilly regions Biogas Forum, 64 (1996), pp. 6–10.[10] Gupta P., Singh R.S., Sachan A., Vidyarthi A.S., Gupta A., A re-appraisal on intensification of biogas production, Renewable and Sustainable Energy Reviews, Volume 16, Issue 7, 2012, 4908-4916.[11] Hassan Dar Gh., Tandon S.M., Biogas production from pretreated wheat straw, lantana residue, apple and peach leaf litter with cattle dung Biological Wastes, 21 (2) (1987), pp. 75–83[12] Trujillo D., Perez J.F., Cerebros F.J., Energy recovery from wastes: anaerobic digestion of tomato plant mixed with rabbit wastes Bioresour. Technol., 45 (2) (1993), pp. 81–83.[13] Babu K.S., Nand K., Srilatha H.R., Srinath K., Madhukara K., Improvement in biomethanation of mango processing wastes by addition of plant derived additives Biogas Forum, III (58) (1994), pp. 16–19.[14] Sharma D.K., 2002. Studies on availability and utilization of onion storage waste in a rural habitat. Ph.D. thesis, Centre for Rural Development and Technology, Indian Institute of Technology, Delhi, India.[15] V.Nallathambi Gunaseelan Parthenium as an additive with cattle manure in biogas production Biological Wastes, 21 (3) (1987), pp. 195–202.[16] Anjan K. Kalia, Sarbjit S., Kanwar Anaerobic fermentation of ageratum for biogas production Biological Wastes, 32 (2) (1990), pp. 155–158.

56
ICCI 2015 - Bildiriler Kitabı / Proceedings Book
ABSTRACTThe efficiency of organic Rankine cycles (ORC) is directly dependent on the utilized refrigerant. In this study the experimental result of utilizing the zeotropic mixture of R245fa 60%-R134a 40% molar concentration is presented. It is shown that compared to pure R245fa working fluid, the mixture based ORC is capable of generating power from heat sources with lower temperature while maintaining acceptable thermal efficiency. Also, in the same conditions the mixture based ORC can generate up to 20% more power compared to a pure R245fa based ORC.
INTRODUCTIONThe idea of recovering low grade heat and convert it to useful power in form of electricity has been around for a while. The literature is full of models and experiments carried on different aspects of ORCs. Kang[1] designed and experimented an R245fa based ORC using a radial turbine connected to a high-speed generator. In his experiment the maximum cycle efficiency, turbine efficiency and electric power were 5.22%, 78.7% and 32.7 kW, respectively. Li et al[2] experimented effect of different heat source temperatures on performance of ORC system. They considered the heat source temperatures of 100, 90, 80 and 70°C. They showed that the heat source with temperature of 80°C has a thermal efficiency of 7.4% and a turbine isentropic efficiency of 68%. They utilized a dry working fluid, R123, for their experiment. Marion et al[3] presented their result of the experiment on combining a solar panel and an ORC. They did a simulation on utilizing three different working fluids, namely, R134a, R227ea and R365mfc. They reported the strong dependence of the power output on the fluid mass flow rate. Maximum achieved thermal efficiency of their setup was 11%. Wang et al[4] performed an experiment on a low temperature solar Orc with recuperator. Using R245fa in their ORC, they did the experiment in two distinctive conditions of
constant flow rate and variable flow rate. They reported that for the constant flow rate case, the Rankine cycle efficiency does not improve even if a recuperator is used, the recuperator in fact decreased the efficiency. Yamada et al[5] considered R1234yf as the working fluid because of its zero global warning potential and ozone depletion potential. They reported that the thermal efficiency of the R1234yf based ORC is comparable to R134a based ORCs. The highest thermal efficiency, 8.8%-11.4% in their simulation was obtained in a supercritical ORC with expander inlet temperature of 170 °C and condensation temperature of 20-40°C. Zeotropic mixtures has become of interest recently. Chys et al[6] analyzed the effect of different zeotropic mixture working fluids on performance of ORC. They concluded that for heat sources of 150°C and 250°C the cycle efficiency can be increased by 16 and 6% respectively if a zeotropic mixture is utilized instead of a pure fluid. Zhao et al[7] considered 4 different zeotropic mixtures and compared the data with the data from Chys et al[6]. They also concluded based on their simulation that the heat source inlet temperature has a strong effect of performance of mixture based ORC systems and if the heat source inlet temperature is increased, there will be a heat source inlet temperature in which pure working fluid has better performance than zeotropic mixture. Lecompte et al[8] considered R245fa–pentane, R245fa–R365mfc, isopentane–isohexane, isopentane–cyclohexane, isopentane–isohexane, isobutane– isopentane and pentane–hexane as working fluids and studied the second law efficiency of ORC in each case. They reported that the best performance of ORC is achieved when the temperature profiles in heat exchangers are matched. They observed an increase in range of 7-14% in second law efficiency for zeotropic mixtures compared to pure fluid based ORC. Jung et al[9] experimented an R245fa/ R365mfc 48.5%/51.5% molar concentration based ORC by using a 1 kW scroll expander. They could achieve 0.7 kW while the nominal
Application of Zeotropic Mixture of R245fa / R134a in Small Scale Organic Rankine Power Generation Cycles
GholamrezaBamorovatABADISchool of Mechanical Engineering Pusan National University
KyungChunKIMSchool of Mechanical EngineeringPusan National University
Acknowledgment: This work was supported by SMMA and KETEP of South Korea.
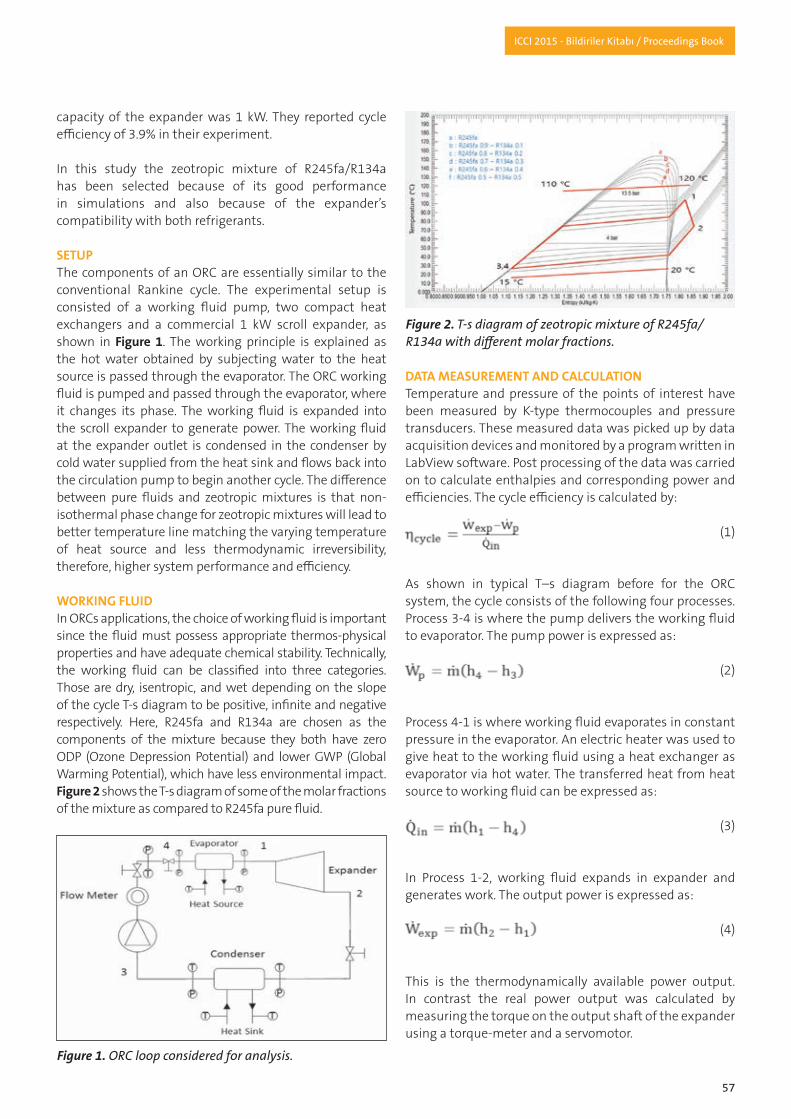
57
ICCI 2015 - Bildiriler Kitabı / Proceedings Book
capacity of the expander was 1 kW. They reported cycle efficiency of 3.9% in their experiment.
In this study the zeotropic mixture of R245fa/R134a has been selected because of its good performance in simulations and also because of the expander’s compatibility with both refrigerants.
SETUPThe components of an ORC are essentially similar to the conventional Rankine cycle. The experimental setup is consisted of a working fluid pump, two compact heat exchangers and a commercial 1 kW scroll expander, as shown in Figure 1. The working principle is explained as the hot water obtained by subjecting water to the heat source is passed through the evaporator. The ORC working fluid is pumped and passed through the evaporator, where it changes its phase. The working fluid is expanded into the scroll expander to generate power. The working fluid at the expander outlet is condensed in the condenser by cold water supplied from the heat sink and flows back into the circulation pump to begin another cycle. The difference between pure fluids and zeotropic mixtures is that non-isothermal phase change for zeotropic mixtures will lead to better temperature line matching the varying temperature of heat source and less thermodynamic irreversibility, therefore, higher system performance and efficiency.
WORKING FLUIDIn ORCs applications, the choice of working fluid is important since the fluid must possess appropriate thermos-physical properties and have adequate chemical stability. Technically, the working fluid can be classified into three categories. Those are dry, isentropic, and wet depending on the slope of the cycle T-s diagram to be positive, infinite and negative respectively. Here, R245fa and R134a are chosen as the components of the mixture because they both have zero ODP (Ozone Depression Potential) and lower GWP (Global Warming Potential), which have less environmental impact. Figure 2 shows the T-s diagram of some of the molar fractions of the mixture as compared to R245fa pure fluid.
DATA MEASUREMENT AND CALCULATIONTemperature and pressure of the points of interest have been measured by K-type thermocouples and pressure transducers. These measured data was picked up by data acquisition devices and monitored by a program written in LabView software. Post processing of the data was carried on to calculate enthalpies and corresponding power and efficiencies. The cycle efficiency is calculated by:
(1)
As shown in typical T–s diagram before for the ORC system, the cycle consists of the following four processes. Process 3-4 is where the pump delivers the working fluid to evaporator. The pump power is expressed as:
(2)
Process 4-1 is where working fluid evaporates in constant pressure in the evaporator. An electric heater was used to give heat to the working fluid using a heat exchanger as evaporator via hot water. The transferred heat from heat source to working fluid can be expressed as:
(3)
In Process 1-2, working fluid expands in expander and generates work. The output power is expressed as:
(4)
This is the thermodynamically available power output. In contrast the real power output was calculated by measuring the torque on the output shaft of the expander using a torque-meter and a servomotor.
Figure 1. ORC loop considered for analysis.
Figure 2. T-s diagram of zeotropic mixture of R245fa/R134a with different molar fractions.

58
ICCI 2015 - Bildiriler Kitabı / Proceedings Book
Process 2-3 is the condensation process in constant pressure. A heat exchanger coupled with an air-cooled chiller and utilizing water as coolant was used as the condenser. The transferred heat from working fluid to heat sink can be expressed as:
(5)
The maximum allowable expander inlet pressure determined by the manufacturer is 13.5 bar. This pressure has been considered as the limit therefor the maximum achievable expander inlet pressure.
The condensing pressure was also fixed at 4 bar to achieve the same pressure ratio in all cases. It’s seen that in this condensing pressure and pressure ratio, not all the concentrations are applicable. Mixtures having R134a more than 40% molar concentrations are then removed because their boiling point in 4 bar is less than ambient temperature (less than 25°C).
RESULTS AND DISCUSSIONPerformance of a small scale, 1kW, ORC has been investigated in this study. Figure 3 shows the T-S diagram of the experimental data as compared with R245fa pure refrigerant. It was observed that with a heat source with temperature of 120 °C, the mixture is able to produce 1.2 kW power, very similar to the ORC with pure R245fa but with a big difference, the mixture produce the same power output in a much less pressure ratio. It is then concluded that the mixture is much more useful for heat sources with lower temperatures in which the pure fluid cannot achieve high pressure ratios, therefore the comparison between the two would be more valid. If we consider two ORCs in the same pressure ratio, it is shown in Figure 4 that the mixture in fact increases power output by 15%. In this case the thermal efficiency did not change between the pure fluid and the mixture but the expander efficiency was increased in the case with mixture refrigerant as working fluid.
As mentioned, lower temperature heat sources are better to compare the two ORCs. Hence, the experiment was done in a lower temperature heat source with temperature of 80 °C. It is observed in Figure 5 that still in a very low grade heat source, the mixture is capable of generating 450 W power with efficiency of 4%, in a condition that pure refrigerant would make less than half this power.
The influence of heat source temperature on power output is very strong in ORC with zeotropic mixtures as working fluid. Therefore the comparison between pure fluids and zeotrpoic mixtures should always be carried on a range of temperatures since there is no general rule to say which one, pure fluid or mixture, would generate more power. Instead, there are areas where mixture is more efficient than pure fluids and there are areas that pure refrigerants make much more power.
Figure 6 shows the dependence of power output on heat source temperatures based on experimental data. As it is seen in the figure in lower temperatures the mixture is much more powerful but eventually the mixture and pure R245fa will reach the same point in terms of power production. In Figure 6 the comparison has been made on the maximum available power output in a given heat source temperatures, hence the pressure ratios and mass flow rates in each case is different.
Figure 3. T-s diagram of zeotropic mixture of R245fa/R134a with different molar fractions.
Figure 4. 15% increase in power output for R245fa/R134a mixture ORC, Pr=3.5, Mass flow=0.06 kg/s, 3600 RPM, Heat Source 120 °C.
Figure 5. Power output and thermal efficiency for R245fa/R134a mixture ORC, Pr=2.2, Mass flow=0.041 kg/s, 3000 RPM, Heat Source 80 °C.
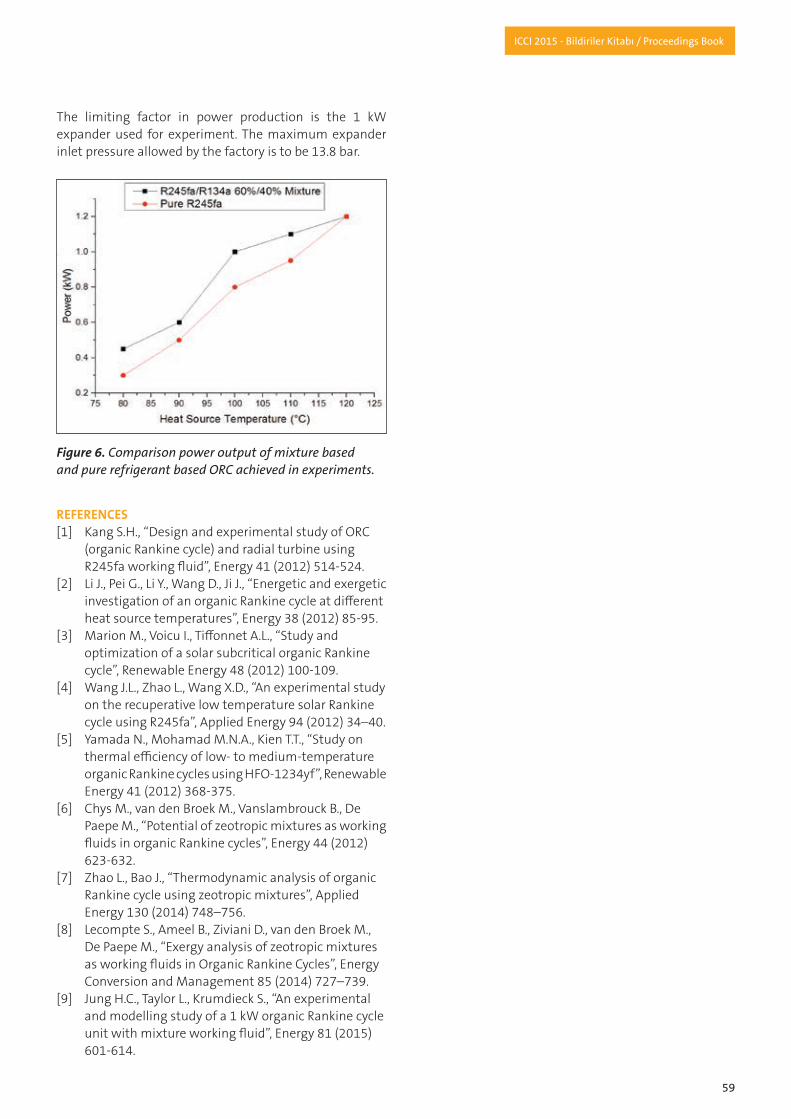
59
ICCI 2015 - Bildiriler Kitabı / Proceedings Book
The limiting factor in power production is the 1 kW expander used for experiment. The maximum expander inlet pressure allowed by the factory is to be 13.8 bar.
REFERENCES[1] Kang S.H., “Design and experimental study of ORC (organic Rankine cycle) and radial turbine using R245fa working fluid”, Energy 41 (2012) 514-524.[2] Li J., Pei G., Li Y., Wang D., Ji J., “Energetic and exergetic investigation of an organic Rankine cycle at different heat source temperatures”, Energy 38 (2012) 85-95.[3] Marion M., Voicu I., Tiffonnet A.L., “Study and optimization of a solar subcritical organic Rankine cycle”, Renewable Energy 48 (2012) 100-109.[4] Wang J.L., Zhao L., Wang X.D., “An experimental study on the recuperative low temperature solar Rankine cycle using R245fa”, Applied Energy 94 (2012) 34–40.[5] Yamada N., Mohamad M.N.A., Kien T.T., “Study on thermal efficiency of low- to medium-temperature organic Rankine cycles using HFO-1234yf”, Renewable Energy 41 (2012) 368-375.[6] Chys M., van den Broek M., Vanslambrouck B., De Paepe M., “Potential of zeotropic mixtures as working fluids in organic Rankine cycles”, Energy 44 (2012) 623-632.[7] Zhao L., Bao J., “Thermodynamic analysis of organic Rankine cycle using zeotropic mixtures”, Applied Energy 130 (2014) 748–756.[8] Lecompte S., Ameel B., Ziviani D., van den Broek M., De Paepe M., “Exergy analysis of zeotropic mixtures as working fluids in Organic Rankine Cycles”, Energy Conversion and Management 85 (2014) 727–739.[9] Jung H.C., Taylor L., Krumdieck S., “An experimental and modelling study of a 1 kW organic Rankine cycle unit with mixture working fluid”, Energy 81 (2015) 601-614.
Figure 6. Comparison power output of mixture based and pure refrigerant based ORC achieved in experiments.

60
ICCI 2015 - Bildiriler Kitabı / Proceedings Book
ABSTRACTFounded in 1945 and celebrating 70 years in 2015, Fike is a global company with manufacturing facilities and offices across the world.
Committed to the safety of our customers, we Innovate and develop products & solutions that protect lives and processes against industrial explosions, process-over pressurizations & fires.
Our strong local presence makes us efficiently serve demanding customers complex process safety requirements, we offer a broad portfolio of services particularly developed for the power industry. There are many specific application profiles ranging from the explosion protection of coal fired power plants, the processing, transport and storage of biomass fuels, reciprocating engine and gas turbine power plants to applications in the wind and solar industry.
Numerous industrial processes handle materials with the potential for fire and/or an explosion. Statutory requirements and voluntary standards exist to take both preventative and protective measures.
Like many other industries, the power generation industry must comply with the safety requirements of (Çalışanların Patlayıcı Ortamların Tehlikelerinden Korunması Hakkında Yönetmelik) EU Directive 99/92/EC (also known as ‘ATEX 137’ or the ‘ATEX Workplace Directive’). While the fire and explosion hazards presented by flammable gases and coal are well studied and documented, newer processes such as sewage drying, wood pelletizing and co-generation present a renewed fire and explosion hazard challenge.
In the Power industry, safety hazards exist in the mining, transport, acceptance of raw materials, storage, mills and furnaces, production of flammable powders and gases. With the introduction of new fuels from recycling and co-generation with a variety of biomass materials, the probability of ignition and self-heating has increased. Transport and bulk storage of the final products, mainly in pellet form, also presents the risk of self-heating and a subsequent risk of fire.
Preventative measures such as the avoidance of ignition scenarios, complemented with protection measures such as explosion relief panels or explosion suppression provide a coherent protection against the flame and pressure effects of explosions.
1. EXPLOSION HAZARDS WITHIN THE POWER INDUSTRY Electricity produced by power plants is indispensable for the maintenance of industry as well as public and private life. The thermal energy released by the combustion of biomass, coal or other fuels mechanically drives generators that produce electric energy. However, such an energy conversion chain holds various risks of fire and in many cases if unchecked, an explosion. Sparks and glowing particles, which can cause serious fire and explosions, can be generated in the individual processes.
Danger zones of fossil fuel based power plantsFire or explosions in power plants can damage or even destroy facilities. The following equipment and areas are most at risk.• Filter/ Electrostatic Precipitator• Mill/crusher• Extraction system• Conveying systems• Furnace backfire protection• Cyclone• Silo• Smoke gas filter• Gas Turbine/Engine Exhaust systems
Explosion Protection in the Power Industry
HankPAULRegional & Export Sales Manager Fike Europe
SeherYILMAZCountry Manager Fike Turkey

61
ICCI 2015 - Bildiriler Kitabı / Proceedings Book
Explosion PentagonTwo additional elements are added to the fire triangle to create an explosion Pentagon:
• Dispersion of dust• Confinement of dust Foreign bodies, defective machines and high temperatures can be the cause of sparks, glowing embers and overheating. If these ignition sources reach the plant areas via extraction systems or conveying facilities, they can suddenly and unforeseeably trigger off fire or explosions.
2. CAUSES OF EXPLOSIONS Biomass is simply plant material, or even animal waste, that can be used as a source of energy. Biomass is nothing new; in fact, coal itself is a form of ancient biomass. Combustible Dust: It’s a fact that coal movement generates fugitive dust. Whether coal is moving along on a conveyor, passing through a transfer point, or being discharged into or exiting a container, dust is produced. The main hazard introduced with biomass is that most biomass materials also produce combustible dust as they flow though the handling system.
A value called the deflagration index, denoted as Kst, is assigned to all combustible dusts based on standard ASTM testing protocol. The higher the Kst value, in essence, the bigger the explosion.
Spontaneous Combustion: A second hazard is that of spontaneous combustion. Well known for its contributions to fires and explosions in coal plants, spontaneous combustion can be just as prevalent with most biomass materials. Heat production in biomass typically begins as an aerobic process. Then, as the temperature rises, the chemical chain reaction takes over. Self-ignition has been found to correlate with silo/bunker volume: The larger the volume of the silo, the lower the self-ignition temperature of the biomass.
Duality of Fuel Mixes: A third hazard arises from blending coal and biomass products. Significant information is available regarding the reactive and explosive hazards of various ranks of coals. However, there has been very little research into the same characteristics of biomass and coal-biomass blends. The Technical Research Center of Finland found that coal-biomass mixtures are less reactive than just coal alone but more reactive than biomass alone. This means that blending coal and biomass in the same silo will contribute to higher levels of reactivity than if the silo contained just biomass.
3. CONSEQUENCES OF EXPLOSIONS Explosions can have a deadly and dangerous impact at power plants and could be responsible for:
• Injury and loss of human life• Damage to equipment, transport facilities and storage space• Production interruptions
Maximum explosion pressure (Pmax)Maximum rate of pressure rise (KST)
Dust Explosions by equipment type in industries

62
ICCI 2015 - Bildiriler Kitabı / Proceedings Book
• Loss of income• Repair costs owing to damaged equipment• Replacement costs owing to destroyed equipment
Coal Power Plant Catastrophy StatisticsBetween 1984 and 2004 there were 23 reported coal dust explosions at U.S. power plants; they killed 16 and injured 95 (see table).
Coal dust explosions at U.S. power plants, 1984 through 2004. Source: Bechtel Power Corp. Other notable Hydrocarbon based Power plant catastrophes in recent times.• 1999, Michigan power plant. – 6 Deaths /38 Injuries – CNG primary explosion followed by Coal dust secondary explosion. • 2010, Brilon, Germany a biomass plant. – 3 Deaths. • 2010, Connecticut Gas Powerplant – 5 Fatalities/ 12 Injuries- “Gas Blow”/Gas Purging to clean debris in piping system.• 2011 England. MW Tilbury Power Station- Coal to Biomass powerplant 100.000m³ storage facility fire & explosion.
CSB (Chemical Safety Board) statistics on all dust explosions across the industries.
4. APPLICATION PROFILE: PULVERIZED COAL SYSTEMSThe pulverization of coal to improve burning efficiency and maximize energy output is a method that has been used for more than 75 years. Compliance Directive 2010/75/EU on industrial emissions (integrated pollution prevention and control) came into force in 2011 and replaces seven previous pieces of legislation, including Directive 2001/80/EC on the limitation of emissions of certain pollutants into the air from large combustion plants.
For all its advantages, the pulverizing process, as well as the conveying and storing of pulverized coal, poses substantial explosion hazards. Many installations include some prevention strategies, such as inerting systems, but these systems only minimize the occurrence of explosions.
The purpose of this application guide is to provide an understanding of the possible explosion hazards and protection solutions for pulverized coal systems. This document is intended to be a guideline and is not applicable to all situations.
Fire and explosion can occur where coal is handled,processed, and used. This is one reason why electric power plants are included in OSHA’s National Emphasis Program.

63
ICCI 2015 - Bildiriler Kitabı / Proceedings Book
THE PROBLEM: DEFLAGRATION (EXPLOSION) The potential for explosions in pulverized coal processes is well known. Equipment such as crushers, pulverizers, and conveyors all contribute to the creation of dust. When this coal dust is suspended in air (in the pulverizer, conveying lines, bag filters, cyclones, and storage bins) and an ignition occurs, there is the potential for explosion.
The trend to switch to sub-bituminous coal (lower sulfur) addresses the environmental concerns, however the degree of explosion hazard is greatly increased compared to bituminous coal (see Table 1). In steel making, the conversion of using coal in lieu of coke also increases the potential for explosion due to the higher explosibility ratings for coal (see Table 1).
This application bulletin outlines responsive protection strategies for the primary areas of explosion potential: pulverizing, conveying, and dust collection/storage.
THE SOLUTION:
Protecting The PulverizerExplosion venting of the pulverizer is not allowed as it is typically installed indoors and makes, so this equipment is best protected by either containment, or an Explosion Suppression System.
Protecting The Conveying LinesConnected duct work is best protected by a Chemical Explosion Isolation System.
Protecting The Dust Collector/Coal Storage BinDust collection and storage bins are best protected by either:
Explosion Vents and/or anExplosion Suppression System
5. CONCLUSIONSExplosion Protection solutions for the power generation industry have become essential to ensure the well being of employees and the overall efficiency of the power plant.Furthermore, a power plant devastated by an explosion can lead to great financial and economic implications throughout the entire energy supply chain.
By choosing the right explosion protection solutions, energy companies can achieve a greater sense of comfort, security and continuity of their high value investments whilst complying with the relevant norms and directives specific to the industry.
Table 1

64
ICCI 2015 - Bildiriler Kitabı / Proceedings Book
ABSTRACTControl centers and control rooms are the interface between the operator and the process. It is here that all signals and process information are brought together and displayed. This data forms the basis for controlled operator intervention and thus the safe operation of the plant. Reliable and user-friendly control of the process depends to a large extent on the design of the control room. A human-centered workplace is one of the key considerations for control room planning. Creating a perfect ergonomic environment is an essential component of reaching this goal.
WORK PLACE OF THE SHIFT PERSONNEL IN BOTH CONVENTlONAL AND NUCLEAR POWER PLANTS IS THE CONTROL ROOM AND THE LOCAL CONTROL STATIONSControl centers and control rooms are the interface between the operator and the process. It is here that all signals and process information are brought together and displayed. This data forms the basis for controlled operator intervention and thus the safe operation of the plant. Reliable and user-friendly control of the process depends to a large extent on the design of the control room. A human-centered workplace is one of the key considerations for control room planning. Creating a perfect ergonomic environment is an essential component of reaching this goal.
At the planning stage, architects and engineers take into account all technical standards, guidelines and material requirements, analyze the spatial conditions and produce a computer simulation of the future control room in close cooperation with the plant operator.
Preliminary steps towards a successful design solution include the assessment of the initial situation, the requirements specification in cooperation with the plant operator taking into account the technical/ ergonomic conditions and the workflow processes in the control station, and the calculation of the floor space required taking into account existing rooms.
Based on this information, different layouts of the control room are created to find a design solution that is optimally tailored to both workflow processes and daylighting effects.
This preliminary draft follows the basic design including the color and material design and lighting system planning.
CAD drawings of the control room are created that form the basis for the final ground plan and are used for verifying the blueprints (wall views and sectional views). The ergonomic characteristics of the workplaces are verified by means of visibility surveys.
All hardware components are installed with a focus on user-friendly operation and easy maintenance.
Our emphasis on future-oriented design opens the possibility of later extension.
We integrate our control room planning into the overall planning of the existing building.
This often requires comprehensive architectural changes.
In addition to the design and construction of “real” control rooms, so-called simulator control rooms are of considerable importance. This facility simulates the conditions of the plant control room environment. The integrated instruments behave in the same way as the instruments in the real control room.
With a structure and room design that is completely identical with the real control room, the simulator control room can be used to simulate fault incidents for practicing the best operator response. The ideal environment for an intensive and realistic training of your personnel.
Here are some examples of implemented real simulator control rooms:
• Kärnkraftsäkerhet och Utbildning AB - Studsvik Vattenfall AB, Ringhals Blocks 1 and 2, Sweden• Nuclear power plant KKW Gösgen, Switzerland • Nuclear power plant KKW Mühleberg, Switzerland • KärnKraftsäkerhet och Uitbildning AB-Studsvik KKW Oskarshamn Blocks 2 and 3/Sweden • Nuclear power plant KKW Beznau, Switzerland • Westingshouse, Pittsburgh Ringhals, Sweden, Twice Project
Control Room Design and Retrofitting of Control Stations in Power Plants
HartmutERLERBilfinger Mauell GmbH
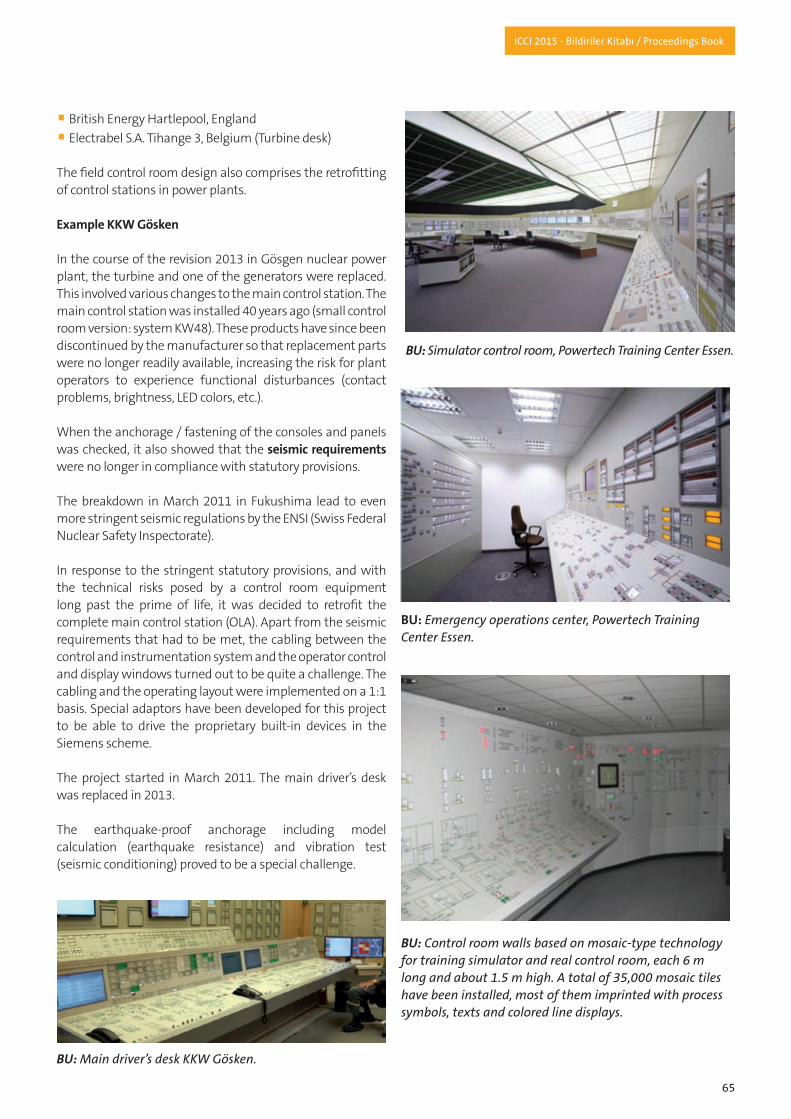
65
ICCI 2015 - Bildiriler Kitabı / Proceedings Book
• British Energy Hartlepool, England• Electrabel S.A. Tihange 3, Belgium (Turbine desk)
The field control room design also comprises the retrofitting of control stations in power plants.
Example KKW Gösken
In the course of the revision 2013 in Gösgen nuclear power plant, the turbine and one of the generators were replaced. This involved various changes to the main control station. The main control station was installed 40 years ago (small control room version: system KW48). These products have since been discontinued by the manufacturer so that replacement parts were no longer readily available, increasing the risk for plant operators to experience functional disturbances (contact problems, brightness, LED colors, etc.).
When the anchorage / fastening of the consoles and panels was checked, it also showed that the seismic requirements were no longer in compliance with statutory provisions.
The breakdown in March 2011 in Fukushima lead to even more stringent seismic regulations by the ENSI (Swiss Federal Nuclear Safety Inspectorate).
In response to the stringent statutory provisions, and with the technical risks posed by a control room equipment long past the prime of life, it was decided to retrofit the complete main control station (OLA). Apart from the seismic requirements that had to be met, the cabling between the control and instrumentation system and the operator control and display windows turned out to be quite a challenge. The cabling and the operating layout were implemented on a 1:1 basis. Special adaptors have been developed for this project to be able to drive the proprietary built-in devices in the Siemens scheme.
The project started in March 2011. The main driver’s desk was replaced in 2013.
The earthquake-proof anchorage including model calculation (earthquake resistance) and vibration test (seismic conditioning) proved to be a special challenge.
BU: Main driver’s desk KKW Gösken.
BU: Emergency operations center, Powertech Training Center Essen.
BU: Control room walls based on mosaic-type technology for training simulator and real control room, each 6 m long and about 1.5 m high. A total of 35,000 mosaic tiles have been installed, most of them imprinted with process symbols, texts and colored line displays.
BU: Simulator control room, Powertech Training Center Essen.

66
ICCI 2015 - Bildiriler Kitabı / Proceedings Book
BU: Power plant control station before retrofit.
BU: Power plant control station after retrofit.

67
ICCI 2015 - Bildiriler Kitabı / Proceedings Book
ÖZETTrijenerasyon sistemlerinin tasarımında; düzensiz ve ayrışık enerji talepleri, tesis tasarımı, ekipmanların boyutlandırılması, işletme yönetimi, enerji fiyatları ve yasal düzenlemeler dikkate alınmalıdır. Bu etmenler tesisin düzenlenmesi, boyutlandırılması ve işletilmesini etkilediğinden, trijenerasyon sistemlerinin tasarımında bütün bu etmenlerin birlikte dikkate alınması gerekir. Diğer taraftan, sistem verimi birçok farklı etmene bağlı olarak değiştiğinden, sistemlerin kendi başına değerlendirilmesi oldukça güç bir işlemdir. Tesisin ekonomik kârlılığı üretilen elektriğin satış fiyatına bağlı olduğundan, trijenerasyon tesislerinin optimum tasarımı, öncelikle yasal düzenlemelere bağlıdır. Bu nedenle, sadece enerji veya sadece ekonomik analizler yanıltıcı sonuçlar verebileceğinden, birincil enerji tasarrufu veya kirletici emisyonlara dayanan farklı değerlendirme ölçütleri, ekonomiklik göstergeleri ile birlikte dikkate alınmalıdır. Bu durumda, trijenerasyon tesislerinin tasarım ve değerlendirilmesine ilişkin materyal ve yöntemlerin geliştirilmesi, bu tür yüksek verimli sistemlerin yaygınlaştırılması bakımından büyük önem taşımaktadır. Bu çalışmada, trijenerasyon sistemlerinin seçimi ve tasarımında dikkate alınması gereken etmenler tartışılmıştır.
Anahtar Kelimeler: Trijenerasyon, Sistem seçimi, Tasarım ölçütleri
1. GİRİŞKojenerasyon teknolojisi, 19. yüzyılın sonlarından bu yana endüstriyel uygulamalarda kullanılmaktadır. Bununla birlikte, son on yılda bu teknoloji hızlı bir şekilde gelişmiş ve kojenerasyon sistemleri; otel, hastane, okul, atık işlem tesisleri gibi tesislerde yaygın olarak kullanılmaya başlanmıştır. Bu teknolojideki son gelişmeler, hidrojen ve biyokütle gibi alternatif yakıtların kullanılması, iklimlendirme ve değişik endüstriyel işlemlerde atık ısıdan soğutma amacıyla yararlanılmasıdır. Kojenerasyon sistemine soğutma işleminin de dahil edilmesiyle oluşan toplam sistem “trijenerasyon sistemi” olarak adlandırılmaktadır. Absorpsiyonlu soğutucular veya atık ısı enerjisi ile çalışan soğutma teknolojilerinin ticari olarak yaygınlaşması nedeniyle, trijenerasyon teknolojisi ekonomik olarak önem kazanmaya başlamıştır. Trijenerasyon sistemleri, merkezi elektrik üretim santrallerine kıyasla, birincil enerji kaynağının daha etkin, ekonomik kullanılmasını sağlar ve çevresel etkiler bakımından daha güvenilirdir.
Trijenerasyon sistemleri, birincil enerji kaynağı olarak yakıttan sağlanılan enerjinin daha etkin olarak kullanılması nedeniyle, ekonomik ve enerji tasarrufu açısından önemli bir potansiyele sahiptir. Bir trijenerasyon sisteminde; ısı, güç ve soğutma işlemleri birbirinden ayrı olarak uygulanabilmekle birlikte, birbirinden bağımsız olarak farklı yüklerde gerçekleştirilemeyebilir. Trijenerasyon sistemlerinin tasarımı, birbirini etkileyen farklı birçok etmen ve yatırımın ekonomikliğini etkileyen koşulların olması nedeniyle, çok güç ve karmaşık bir işlemdir. Tesisin ekonomik karlılığı, üretilen elektriğin satış fiyatına bağlı olduğundan, trijenerasyon tesislerinin optimum tasarımı, öncelikle yasal düzenlemelere bağlıdır. Tasarım etmenleri, tesisin düzenlenmesi, boyutlandırılması ve işletilmesini etkilediğinden, trijenerasyon sistemlerinin tasarımında, bütün bu etmenlerin birlikte dikkate alınması gerekir. Bu çalışmada, trijenerasyon sistemlerinin tasarımında dikkate alınması gereken etmenler tartışılmıştır.
2. TRİJENERASYON SİSTEMİ Bir trijenerasyon sisteminin genel tasarım şeması Şekil 1’de verilmiştir. Trijenerasyon sistemlerinin; ortam ısıtma, kullanım suyu ısıtma ve soğutma gereksinimlerini karşılayacak şekilde boyutlandırılması gerekir. Tesis; elektrik ve ısı enerjisi üreten bir ana hareket makinası, ısı geri kazanılan kazan ünitesi ve soğurmalı soğutma ünitesinden oluşur. Tesiste üretilen elektrik satılacak şekilde tasarımlanırsa, tüketicilerin elektrik talebi dikkate alınmaz, sadece yıl boyunca değişen ısıtma ve soğutma gereksinimleri dikkate alınır. Çalışma yöntemi, durma ve başlama işlemlerinin sistem verimine olan olumsuz etkileri ihmal edilerek, tam yükte ısı gereksiniminin karşılanmasına dayanır.
Trijenerasyon sisteminin ana hareket makinası, küçük ölçekli sistemlerde yaygın olarak kullanıldığı gibi, pistonlu bir motor olabilir. Gaz türbinleri ile karşılaştırıldığında, egzoz gazlarından yüksek sıcaklıkta (HT) ve motorun soğutma sisteminden düşük sıcaklıkta olmak üzere, pistonlu motorlarda iki farklı şekilde ısı enerjisi açığa çıkar. Bu durum, her bir akış için ısı geri kazanma kazanı ve iki farklı soğurmalı soğutma ünitesinin yerleştirilmesini gerektirir. Veriminin yüksek olması nedeniyle, çift etkili soğutma ünitesi tercih edilmekle birlikte, bu tip soğutma ünitelerinin sadece yüksek sıcaklıktaki ısı akımı ile çalıştırılabileceği unutulmamalıdır.
Trijenerasyon Sistemi Seçimi ve Tasarımı
H.HüseyinÖZTÜRKÇukurova Üniversitesi Ziraat Fakültesi Tarım Makinaları ve Teknolojileri Mühendisliği Bölümü
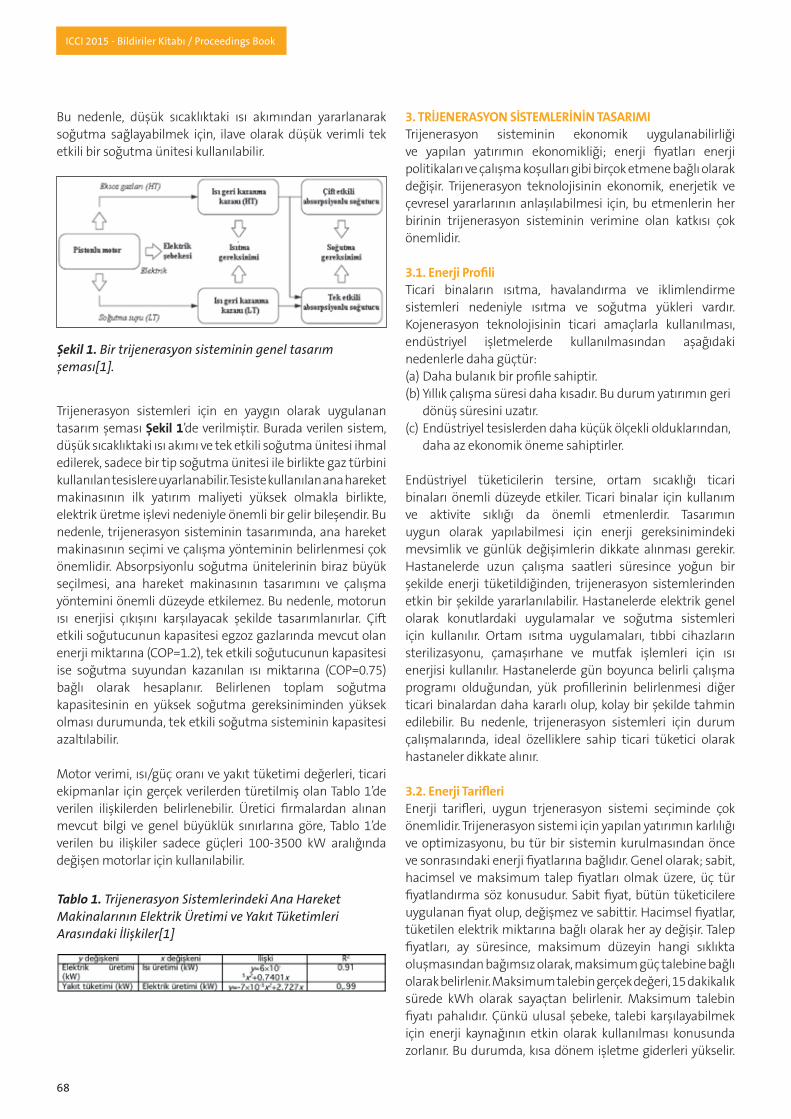
68
ICCI 2015 - Bildiriler Kitabı / Proceedings Book
Bu nedenle, düşük sıcaklıktaki ısı akımından yararlanarak soğutma sağlayabilmek için, ilave olarak düşük verimli tek etkili bir soğutma ünitesi kullanılabilir.
Trijenerasyon sistemleri için en yaygın olarak uygulanan tasarım şeması Şekil 1’de verilmiştir. Burada verilen sistem, düşük sıcaklıktaki ısı akımı ve tek etkili soğutma ünitesi ihmal edilerek, sadece bir tip soğutma ünitesi ile birlikte gaz türbini kullanılan tesislere uyarlanabilir. Tesiste kullanılan ana hareket makinasının ilk yatırım maliyeti yüksek olmakla birlikte, elektrik üretme işlevi nedeniyle önemli bir gelir bileşendir. Bu nedenle, trijenerasyon sisteminin tasarımında, ana hareket makinasının seçimi ve çalışma yönteminin belirlenmesi çok önemlidir. Absorpsiyonlu soğutma ünitelerinin biraz büyük seçilmesi, ana hareket makinasının tasarımını ve çalışma yöntemini önemli düzeyde etkilemez. Bu nedenle, motorun ısı enerjisi çıkışını karşılayacak şekilde tasarımlanırlar. Çift etkili soğutucunun kapasitesi egzoz gazlarında mevcut olan enerji miktarına (COP=1.2), tek etkili soğutucunun kapasitesi ise soğutma suyundan kazanılan ısı miktarına (COP=0.75) bağlı olarak hesaplanır. Belirlenen toplam soğutma kapasitesinin en yüksek soğutma gereksiniminden yüksek olması durumunda, tek etkili soğutma sisteminin kapasitesi azaltılabilir.
Motor verimi, ısı/güç oranı ve yakıt tüketimi değerleri, ticari ekipmanlar için gerçek verilerden türetilmiş olan Tablo 1’de verilen ilişkilerden belirlenebilir. Üretici firmalardan alınan mevcut bilgi ve genel büyüklük sınırlarına göre, Tablo 1’de verilen bu ilişkiler sadece güçleri 100-3500 kW aralığında değişen motorlar için kullanılabilir.
3. TRİJENERASYON SİSTEMLERİNİN TASARIMITrijenerasyon sisteminin ekonomik uygulanabilirliği ve yapılan yatırımın ekonomikliği; enerji fiyatları enerji politikaları ve çalışma koşulları gibi birçok etmene bağlı olarak değişir. Trijenerasyon teknolojisinin ekonomik, enerjetik ve çevresel yararlarının anlaşılabilmesi için, bu etmenlerin her birinin trijenerasyon sisteminin verimine olan katkısı çok önemlidir.
3.1. Enerji ProfiliTicari binaların ısıtma, havalandırma ve iklimlendirme sistemleri nedeniyle ısıtma ve soğutma yükleri vardır. Kojenerasyon teknolojisinin ticari amaçlarla kullanılması, endüstriyel işletmelerde kullanılmasından aşağıdaki nedenlerle daha güçtür:(a) Daha bulanık bir profile sahiptir.(b) Yıllık çalışma süresi daha kısadır. Bu durum yatırımın geri dönüş süresini uzatır.(c) Endüstriyel tesislerden daha küçük ölçekli olduklarından, daha az ekonomik öneme sahiptirler.
Endüstriyel tüketicilerin tersine, ortam sıcaklığı ticari binaları önemli düzeyde etkiler. Ticari binalar için kullanım ve aktivite sıklığı da önemli etmenlerdir. Tasarımın uygun olarak yapılabilmesi için enerji gereksinimindeki mevsimlik ve günlük değişimlerin dikkate alınması gerekir. Hastanelerde uzun çalışma saatleri süresince yoğun bir şekilde enerji tüketildiğinden, trijenerasyon sistemlerinden etkin bir şekilde yararlanılabilir. Hastanelerde elektrik genel olarak konutlardaki uygulamalar ve soğutma sistemleri için kullanılır. Ortam ısıtma uygulamaları, tıbbi cihazların sterilizasyonu, çamaşırhane ve mutfak işlemleri için ısı enerjisi kullanılır. Hastanelerde gün boyunca belirli çalışma programı olduğundan, yük profillerinin belirlenmesi diğer ticari binalardan daha kararlı olup, kolay bir şekilde tahmin edilebilir. Bu nedenle, trijenerasyon sistemleri için durum çalışmalarında, ideal özelliklere sahip ticari tüketici olarak hastaneler dikkate alınır.
3.2. Enerji TarifleriEnerji tarifleri, uygun trjenerasyon sistemi seçiminde çok önemlidir. Trijenerasyon sistemi için yapılan yatırımın karlılığı ve optimizasyonu, bu tür bir sistemin kurulmasından önce ve sonrasındaki enerji fiyatlarına bağlıdır. Genel olarak; sabit, hacimsel ve maksimum talep fiyatları olmak üzere, üç tür fiyatlandırma söz konusudur. Sabit fiyat, bütün tüketicilere uygulanan fiyat olup, değişmez ve sabittir. Hacimsel fiyatlar, tüketilen elektrik miktarına bağlı olarak her ay değişir. Talep fiyatları, ay süresince, maksimum düzeyin hangi sıklıkta oluşmasından bağımsız olarak, maksimum güç talebine bağlı olarak belirlenir. Maksimum talebin gerçek değeri, 15 dakikalık sürede kWh olarak sayaçtan belirlenir. Maksimum talebin fiyatı pahalıdır. Çünkü ulusal şebeke, talebi karşılayabilmek için enerji kaynağının etkin olarak kullanılması konusunda zorlanır. Bu durumda, kısa dönem işletme giderleri yükselir.
Şekil 1. Bir trijenerasyon sisteminin genel tasarım şeması[1].
Tablo 1. Trijenerasyon Sistemlerindeki Ana Hareket Makinalarının Elektrik Üretimi ve Yakıt Tüketimleri Arasındaki İlişkiler[1]

69
ICCI 2015 - Bildiriler Kitabı / Proceedings Book
Son kullanıcılar için genel olarak iki seçenek vardır. Her iki seçenek için maksimum gücün pahalı fakat enerjinin ucuz olarak yüklendiği veya enerjinin pahalı ve talebin ucuz olarak yüklendiği tariflerin seçilmesidir. Endüstriyel tesislerde indirimli elektrik kullanılır. Şebekeye geri elektrik satmak için, her türlü tüketici için aynı olan, sadece hacimsel tarifler uygulanır. Bu tariflerin fiyatı ucuzdur.
Trijenerasyon sistemlerinde yakıt olarak yaygın olarak doğal gaz kullanılır. Enerji kullanımı bakımından, enerjinin sadece temiz değil, aynı zamanda ucuz olarak üretilmesi de önemlidir. Enerji maliyeti, üretiminde kullanılan yakıt çeşidine bağlı olarak değişir. Doğal gaz tarifleri sabit değildir, yakıt fiyatları ve diğer jeopolitik etmenlere bağlı olarak aylık olarak değişir. Bu durum yatırımın karlılığını önemli düzeyde etkiler.
3.3. Sistem TasarımıBir trijenerasyon tesisinin başlıca çalışma ilkesi, yakıtın içerdiği enerjiyi doğrudan, elektrik üretimi için bir jeneratörü çalıştırabilen mekanik şaft gücüne dönüştürmektir. Atık ısı enerjisinden, ısıtma ve soğutma gereksinimlerini karşılayabilmek için yararlanılabilir. Trijenerasyon tesisinin tasarım özellikleri kullanılan teknolojiye bağlı olarak değişir. Ticari binalar için uygun olan orta-ölçekli uygulamalarda içten yanmalı motorlar kullanılır. Bu motorların elektrik üretme verimi %35’gibi yüksek bir düzeydedir. İçten yanmalı motor kullanılan bir trijenerasyon tesisinde işlem akışı Şekil 2’de verilmiştir. Bu tesisin çalışma ilkesi aşağıda anlatılmıştır.
İçten yanmalı motor, hava ve yakıt olarak doğal gaz ile yüklenir. Yanma işlemi sonucunda, yakıtın kimyasal enerjisi, elektrik üretimi için kullanılan jeneratörü çalıştıran mekanik şaft gücüne dönüştürülür. İçten yanmalı motorlar, Otto veya Dizel çevrimine bağlı olarak çalışırlar ve sıcaklık derecesi farklı olan atık ısı açığa çıkar. Motoru soğutmak için kullanılan akışkanın sıcaklığı 90-125°C düzeylerinde olup, düşüktür. Diğer taraftan egzoz gazının sıcaklığı ise 200-400°C düzeylerindedir. İçten yanmalı motorun egzoz gazları, ısıl işlemlerde doğrudan kullanılabileceği gibi, aşırı ısınmış buhar üreten buhar jeneratöründe dolaylı olarak kullanılabilir. Ticari binalarda, çok yüksek sıcaklıkta ısı yüklerine gereksinim duyulmaz. Bu nedenle, egzoz gazlarının doğrudan kullanılmasına gerek yoktur.
Ana makinanın ısı enerjisi çıktısı, talebi karşılamak için yeterli olmadığı zaman, kazan ünitesinin çalışması gereklidir. Trijenerasyon tesisinin tasarımından sonra, soğutma enerjisi iki yöntemle üretilebilir. Atık ısıdan absorpsiyonlu soğutucuda yararlanılır veya elektrikli ısı pompasında elektrik kullanılır. Elektrikli soğutucuda, soğutucu buharını düşük buharlaştırma basıncından yüksek yoğuşturma basıncına artırabilmek için mekanik kompresör kullanılır. Absorpsiyonlu soğutucularda bu işlem, ısıl bir kompresör işlevindeki bir çözelti devresi aracılığıyla gerçekleştirilir. Absorpsiyonlu soğutucu devreleri, iki akışkanın belirli termodinamik özelliklerine bağlı olarak çalışırlar. Bu akışkanlardan birisi soğutucu, diğer ise soğurucudur. Bu amaçla yaygın olarak kullanılan akışkan çiftleri şunlardır:
• Soğutucu-amonyak/soğurucu-su: Düşük (0°C’den daha düşük) buharlaşma sıcaklıkları gerektiğinde bu akışkan çifti kullanılır. • Soğutucu-su/soğurucu-lityum biromid: Buharlaştırıcıda üretilen buhar, soğurucudaki sıvı soğurgan içerinde soğurulur. Soğutucuyu tutan soğurucu jeneratöre pompalanır. Soğutucu akışkan, yoğuşturucuda yoğuşan buhar (veya su) tarafından serbest bırakılan atık ısı ile tekrar buhar formuna gelir. Yenilenen soğurucu akışkan, soğutucu buhar toplamak üzere tekrar soğurucuya geri gönderilir.
Genel olarak, absorpsiyonlu soğutucularda, trijenerasyon tesisindeki ana makinanın egzozundan açığa çıkan ısı enerjisi kullanılır. Bu durumda, aşırı elektrik talebi azalır ve elektrikli soğutucunun çalışma süresinin azalması ile elektrik tasarrufu sağlanır, ısıl yüke karşılık elektriksel yük artar. Atık ısı açığa çıkmaması durumunda, absorpsiyonlu soğutucuların verimleri (COP= 0.7-1.2) elektrikli olanlara (COP=2.5-5) kıyasla düşük olduğundan, yakıt yakarak ısı enerjisi üretmek hiçbir zaman ekonomik olmayacaktır. Bu nedenle, atık ısı enerjisi açığa çıkması ve soğutma gereksiniminin ısıtma gereksiniminden önemli düzeyde daha fazla olması durumunda, elektrikli soğutuculara Şekil 2. Bir trijenerasyon sisteminin akış diyagramı[2].

70
ICCI 2015 - Bildiriler Kitabı / Proceedings Book
kıyasla, soğurmalı soğutucular tercih edilmelidir. Absorpsiyonlu soğutucuların kısmi yük verimi yüksek ve çok az sayıda hareketli parçalarının olması nedeniyle bakım giderleri düşüktür. Bununla birlikte, yatırım giderleri kısmen yüksektir. Diğer taraftan, sıkıştırmalı soğutucular kısmi yüklerde iyi çalışmazlar, bakım giderleri kısmen yüksek, işletme giderleri ise yüksektir. Yatırım giderleri düşüktür.
Sonuç olarak, ısı enerjisi gereksinimindeki değişimlerin dengelenmesi için bazı önlemlerin alınması gerekir. Ticari binalarda, borulama sisteminin tamamı sonlu ısı kapasitesine sahip olarak dikkate alınabilir. Talepten fazla üretildiği zamanlarda enerji depolanır ve talebin üretilen miktardan fazla olduğu zamanlarda ise geri kazanılır. Isı enerjisi, uygulamada tüketiciler tarafından kolay bir şekilde depolanabilen bir enerjidir. Elektrik bölgesel olarak depolanabilmekle birlikte, maliyeti yüksektir ve depolama verimi düşüktür.
3.4. İşletme YöntemiTrijenerasyon tesisinin çalışmasına, elektrik, şebeken alındığı fiyattan daha düşük fiyata üretildiği zamanlarda üretilerek teorik olarak basit bir şekilde karar verilebilir. Uygulamada işletme yöntemi, aşağıdaki etmenlere bağlı olan işlem kontrol sisteminin bir parçasıdır:• Enerji türlerine olan gereksinim,• Sistemin nominal gücü,• Sistem verimi,• Kullanılan enerji dönüşüm cihazlarının dönüştürme faktörleri.
Uygulamada yaygın olarak kullanılan işletme yöntemleri aşağıdaki gibi özetlenebilir[2]:1) Isı gereksiniminin izlenmesi: Sistem öncelikle ısı yükünü karşılar. Daha sonra, enerji gereksiniminin geri kalanını karşılayabilmek için elektrik satar veya satın alır. 2) Elektrik gereksiniminin izlenmesi: Sistem öncelikle elektrik yükünü karşılar. Daha sonra, enerji gereksiniminin geri kalanını karşılayabilmek için, yardımcı bir kazan ünitesi yardımıyla ısı üretir veya atık durumda ısı bırakır. 3) Sürekli çalışma: Sistem sadece, enerji gereksinimi dikkate alınmadan, daha önce tanımlanan bir sürede çalışır. Bu yöntem, teknolojilerinin kısmi yükte çalışmalarına olanak sağlamayan belirli tip motorlar için uygulanır. Şebekeye enerji satan enerji üreticileri tarafından tercih edilen çalışma yöntemidir. 4) Aşırı tüketim durumunda takviye uygulaması: Sistem, aşırı elektrik gereksinimi olduğunda, yükün belirlenen bir kısmını karşılayabilmek için, sınırlı bir süre için çalışır. Sonuç olarak, aşırı talep olduğunda şebekeden satın alınan güç miktarı azalır. 5) Asıl yükte çalışma: Sistem, elektrik yükünün sadece sabit bir miktarını karşılamak amacıyla tasarımlanır. Bu yaklaşım, dinamik verimi zayıf olan geniş gruplar tarafından yaygın olarak kabul görmektedir.
Son iki işletme yöntemi Şekil 3 ’te verilmiştir. Her iki yöntemin de çalışma süresi birkaç dakikadan birkaç saate ulaşacak kadar değişebilir. Bu durum, değişken hızlı ana tahrik makinası kullanarak veya yakıt girişi ayarlanarak düzenlenebilir. Bu dalgalanmaların, ana makinanın olanak tanınan çalışma aralığında olması gerekir.
Bununla birlikte, bir trijenerasyon sisteminde ısı ve elektrik gereksinimini izleyen işletme yöntemleri aşağıdaki nedenlerle yaygın olarak uygulanmaz. • Isı gereksiniminin izlenmesi yönteminde, ana hareket makinası sürekli olarak gereksinim duyulan ısı enerjisini üretir. Bu durumda, absorpsiyonlu soğutma sistemini çalıştıracak herhangi bir atık ısı açığa çıkmayacaktır.• Elektrik gereksiniminin izlenmesi yönteminde, ana hareket makinası sürekli olarak gereksinim duyulan elektriği üretir. Bununla birlikte, soğutma işlemi, ısı veya elektrik yüküyle karşılanabilecek ise, bu tanımlanmaz. Elektrikli soğutucunun da gereksinim duyduğu toplam elektrik yükü dikkate alındığında, absorpsiyonlu soğutucu yararsız olacaktır. Soğutmasız elektrik yükü dikkate alındığında, soğutma gereksiniminin tamamı absorpsiyonlu soğutucudan karşılanacaktır. Bu durumda, aşırı ısı üretimi gibi, istenilmeyen bazı durumlarla karşılaşılacaktır.
Bu sorun, soğutma cihazlarında tüketilen elektrik dikkate alınmadan, ısı/güç oranı yüksek olan uygulamalar için çok daha önemlidir. Bu sorunun önlenebilmesi için, elektrik eşdeğeri yük izleme olarak adlandırılan farklı bir yük izleme yöntemi dikkate alınır. Elektrik eş değeri yük, absorpsiyonlu soğutucunun elektrik tüketimi dikkate alınmadan, elektrik ve soğutma gereksinimlerini karşılamak için gerekli olan elektrik miktarıdır. Bu çalışma yöntemindeki temel varsayım, absorpsiyonlu soğutucu için sadece trijenerasyon sisteminin ana makinasından atık ısı açığa çıkması durumunda soğutma enerjisi üretileceğidir. Diğer bir deyişle, absorpsiyonlu soğutucuyu çalıştırmak için, ek bir kazan ünitesinden ısı üretimi yapılmayacaktır. Bu durumda, elektrik eş değeri yük, sistemdeki ana hareket makinasının tipi ve büyüklüğüne bağlıdır. Isı/güç oranı yüksek olan ana hareket
Şekil 3. Trijenerasyon sistemi çalışma yöntemleri[2].
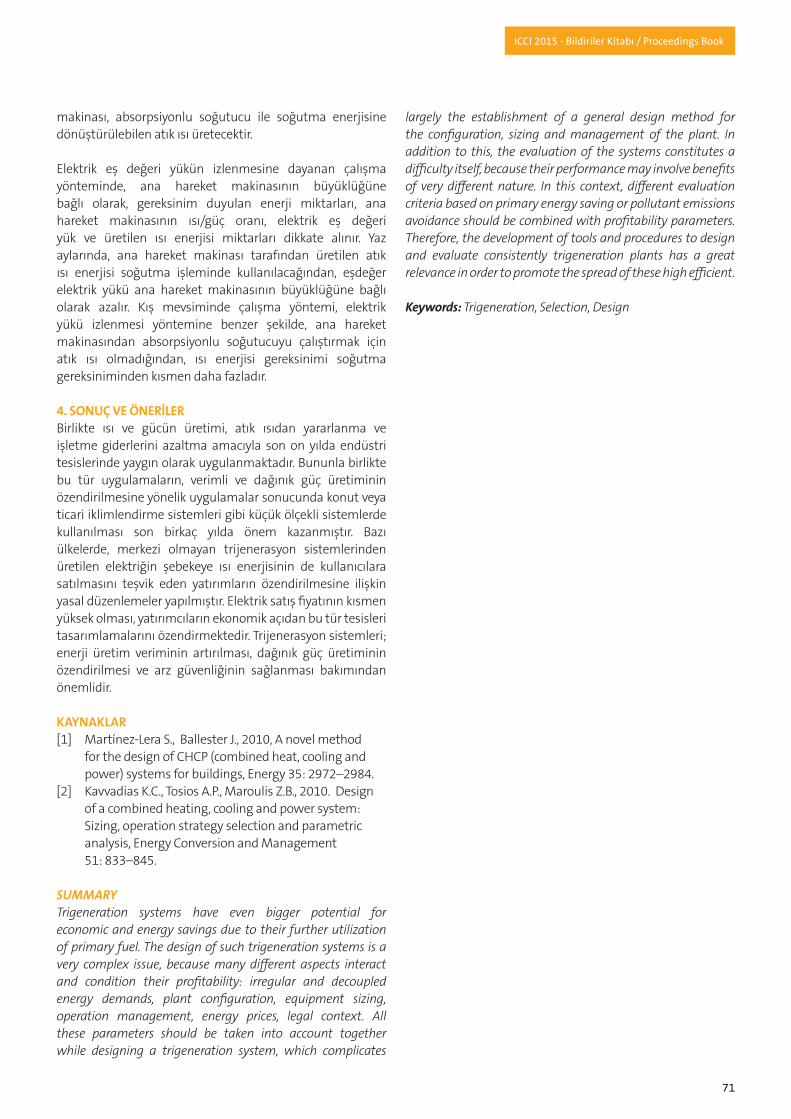
71
ICCI 2015 - Bildiriler Kitabı / Proceedings Book
makinası, absorpsiyonlu soğutucu ile soğutma enerjisine dönüştürülebilen atık ısı üretecektir.
Elektrik eş değeri yükün izlenmesine dayanan çalışma yönteminde, ana hareket makinasının büyüklüğüne bağlı olarak, gereksinim duyulan enerji miktarları, ana hareket makinasının ısı/güç oranı, elektrik eş değeri yük ve üretilen ısı enerjisi miktarları dikkate alınır. Yaz aylarında, ana hareket makinası tarafından üretilen atık ısı enerjisi soğutma işleminde kullanılacağından, eşdeğer elektrik yükü ana hareket makinasının büyüklüğüne bağlı olarak azalır. Kış mevsiminde çalışma yöntemi, elektrik yükü izlenmesi yöntemine benzer şekilde, ana hareket makinasından absorpsiyonlu soğutucuyu çalıştırmak için atık ısı olmadığından, ısı enerjisi gereksinimi soğutma gereksiniminden kısmen daha fazladır.
4. SONUÇ VE ÖNERİLERBirlikte ısı ve gücün üretimi, atık ısıdan yararlanma ve işletme giderlerini azaltma amacıyla son on yılda endüstri tesislerinde yaygın olarak uygulanmaktadır. Bununla birlikte bu tür uygulamaların, verimli ve dağınık güç üretiminin özendirilmesine yönelik uygulamalar sonucunda konut veya ticari iklimlendirme sistemleri gibi küçük ölçekli sistemlerde kullanılması son birkaç yılda önem kazanmıştır. Bazı ülkelerde, merkezi olmayan trijenerasyon sistemlerinden üretilen elektriğin şebekeye ısı enerjisinin de kullanıcılara satılmasını teşvik eden yatırımların özendirilmesine ilişkin yasal düzenlemeler yapılmıştır. Elektrik satış fiyatının kısmen yüksek olması, yatırımcıların ekonomik açıdan bu tür tesisleri tasarımlamalarını özendirmektedir. Trijenerasyon sistemleri; enerji üretim veriminin artırılması, dağınık güç üretiminin özendirilmesi ve arz güvenliğinin sağlanması bakımından önemlidir.
KAYNAKLAR[1] Martínez-Lera S., Ballester J., 2010, A novel method for the design of CHCP (combined heat, cooling and power) systems for buildings, Energy 35: 2972–2984.[2] Kavvadias K.C., Tosios A.P., Maroulis Z.B., 2010. Design of a combined heating, cooling and power system: Sizing, operation strategy selection and parametric analysis, Energy Conversion and Management 51: 833–845.
SUMMARYTrigeneration systems have even bigger potential for economic and energy savings due to their further utilization of primary fuel. The design of such trigeneration systems is a very complex issue, because many different aspects interact and condition their profitability: irregular and decoupled energy demands, plant configuration, equipment sizing, operation management, energy prices, legal context. All these parameters should be taken into account together while designing a trigeneration system, which complicates
largely the establishment of a general design method for the configuration, sizing and management of the plant. In addition to this, the evaluation of the systems constitutes a difficulty itself, because their performance may involve benefits of very different nature. In this context, different evaluation criteria based on primary energy saving or pollutant emissions avoidance should be combined with profitability parameters. Therefore, the development of tools and procedures to design and evaluate consistently trigeneration plants has a great relevance in order to promote the spread of these high efficient.
Keywords: Trigeneration, Selection, Design
72
ICCI 2015 - Bildiriler Kitabı / Proceedings Book
ABSTRACTEfficient energy use which requires exergy analysis is a key solution to the environmental problems. Exergy provides the basis for an effective measure of the potential of an energy form to impact the environment A primary aim to minimize the environmental impact is to increase the efficiency and decrease the related overall environmental impact, especially global warming, ozone depletion, and acid rain. Increasing energy efficiency reduces environmental impact by decreasing energy losses This paper has been written with a view to draw attention and to examine the range of views for integration of exergy for environment.
1. INTRODUCTIONEnvironmental problems, issues and concerns span a continuously growing range of pollutants, hazards and ecosystem degradation factors that impress areas ranging from local through regional to global. Many environmental issues are caused by related to the production, transformation and use of energy. For instance, water pollution plays a significant role in energy in area of environmental concern[1]. The determination of completely of the state of the reference environment is extremely important for exergy analysis. For that, commonly the temperature, pressure and chemical composition of the reference environment are specified. The results of exergy analyses are relative to the specified reference environment. Every substance not in equilibrium with its environment has some quantity of exergy[2].
The states of the system and the environment determine the magnitude of the exergy of a system. This is zero only for the system in equilibrium with its environment. The increase of energy efficiency by reduction of energy losses can reduce environmental impact. This increase exergy efficiency and reduce exergy losses. An understanding of the relations between exergy and the environment
forces impressing changes in the environment, and help researchers to deal better with environmental damage[3].
From an exergy viewpoint, such activities lead to increased exergy efficiency and reduced exergy losses. Thus, a thorough understanding of the relations between exergy and the environment may reveal underlying fundamental patterns and forces impressing changes in the environment, and help researchers deal better with environmental damage. The second law of thermodynamics is instrumental in providing insights into environmental impact. The most appropriate link between the second law and environmental impact has been suggested to be exergy because exergy is a measure of the departure between the system and the environment states[4].
2. ENVIRONMENTAL PROBLEMS Environmental problems have been a concern for many years. The science of environmental problems is complex. There are many stakeholders involved in both the causes and solutions to environmental problems. Solution of global environmental problems will require changes in our consumption and pollution of natural resources. Research of global environmental problems involves a mixture of detailed investigations into specific problems as well as putting together the results from investigations to try to understand larger systems[5].
Many researchers work hard to solve environmental problems. Meanwhile, the most of them solve very few environmental problems. They approach problems wrongly. Thus, their efforts make situation worse rather than better. Environmental problems will not be solved unless people lead the problem-solving crusade. Environmental problems are solved by groups rather than by individuals. Many people rely on common sense, practicality, structured rules, formulas, protocols and creative thinking to solve these problems[6].
Exergy and Environment
İkbalSARIKAYADepartment of Chemistry Karadeniz Technical University
SelçukBILGENDepartment of Chemistry Karadeniz Technical University
LokmanMuratAYYILDIZDepartment of Chemistry Karadeniz Technical University

73
ICCI 2015 - Bildiriler Kitabı / Proceedings Book
The growth of range of pollutants, hazards and eco-system degradation factors triggers environmental problems. Many environmental issues are related to the production, transformation and use of energy. The risk and reality of environmental problems have become more apparent recently. The growing of environmental problems is a combination of several factors. The increase of world population, consumption, industrial activity, etc has been grown the environmental impact of human activities dramatically[2].
There is a critical need for a more effective multi-scalar governance framework. Table 1 gives summary of fuel used for heating and fuel characteristics, and corresponding emissions if the fuel is used. Using electricity clearly causes the greatest environmental problems and emissions. Each kilowatt of electricity generated the power plants emit about 1kg of CO2 and 7 kg SO2[1].
New technological advances will make up for the dramatic increases in vehicle miles driven. The increase in auto and truck travel is the key force behind the energy consumption, air quality impact, and climate changes. We are starting to give back air quality gains because sprawling development patterns demand more driving. Table 2 compares the land and air impacts of development at densities[7].
The quantification of the environmental problems can be better driven by the use of the exergy concept. Exergy is a tool to representative of the system under study and awareness of potential environmental problems. The use
of exergy analysis in solving environmental problems is substantial. The three most important environmental problems are the global warming, the ozone depletion and the acid rain.
2.1. Global WarmingSolar radiation heats the earth. Accumulation of carbon dioxide and other trace gases affect this process. One of the most important global problems is the greenhouse problem. The amount of trace gases in the atmosphere change to the mean global surface temperature. It is estimated that mean global temperature would be 33 oC cooler without greenhouse gases[8]. There is a need to avoid producing carbon dioxide (CO2) because of global warming. Gases like CO2 travel up into the upper atmosphere (the troposphere). They act as a screen to sunlight in there. They allow the sun’s rays in but stop the heat radiation from re-emerging, much as happens with the glass in greenhouse. Consequently, greenhouse heats up the whole world.
One of the main effects of climate change is the increase of temperature. The Intergovernmental Panel on Climate Change (IPCC) reports a linear warming trend over the last 50 years at an average rate of 0.13 °C per decade, and foresees a further warming of about 0.1–0.2 °C per decade, even if greenhouse gases and aerosol emissions will be kept constant[9]. There is a cause-effect relationship between the observed emissions of greenhouse gases and global warming. If atmospheric concentrations of greenhouse gases continue to increase, the earth’s temperature may increase in the next century by another 2 oC and perhaps by up to 4 oC. This situation causes rise by between 30 and 60 cm in the sea level before the end of the 21st century. The impact of such a phenomenon could jeopardize the survival of entire populations[10].
Currently, the main focus of interest is on assessing and reducing the amount of green house gas emissions of operations to decelerate further global warming. Priority is given to a detailed investigation of production processes because they usually offer a huge potential for energy and emission reduction and are, thus, enforced by environmental regulations of national and international organizations[11].
One of the effects of global warming is its influence on physical, chemical and biological properties of aquatic ecosystems, with predominantly adverse impacts on the water quality, as well as animal and plant communities’ composition. Studies on the impact of global warming on toxicity of environmental compounds describe the increase of temperature as possible cause of chemical and physical alterations in the behavior of polluters, with influence in their distribution and toxicity[9].
Table 1. Summary of Fuel Used for Heating and Fuel Characteristics, and Corresponding Emissions If The Fuel is Used
Table 2. Projected Environmental Impact of 400 000 New Housing Units
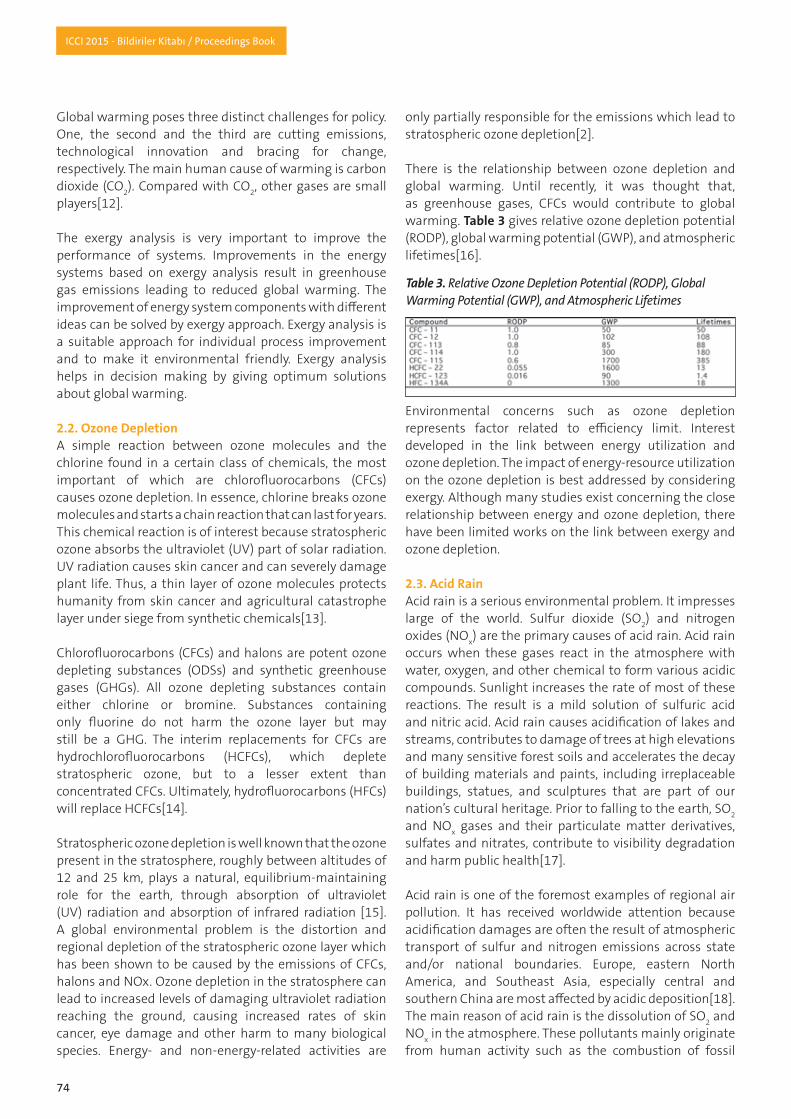
74
ICCI 2015 - Bildiriler Kitabı / Proceedings Book
Global warming poses three distinct challenges for policy. One, the second and the third are cutting emissions, technological innovation and bracing for change, respectively. The main human cause of warming is carbon dioxide (CO2). Compared with CO2, other gases are small players[12].
The exergy analysis is very important to improve the performance of systems. Improvements in the energy systems based on exergy analysis result in greenhouse gas emissions leading to reduced global warming. The improvement of energy system components with different ideas can be solved by exergy approach. Exergy analysis is a suitable approach for individual process improvement and to make it environmental friendly. Exergy analysis helps in decision making by giving optimum solutions about global warming.
2.2. Ozone DepletionA simple reaction between ozone molecules and the chlorine found in a certain class of chemicals, the most important of which are chlorofluorocarbons (CFCs) causes ozone depletion. In essence, chlorine breaks ozone molecules and starts a chain reaction that can last for years. This chemical reaction is of interest because stratospheric ozone absorbs the ultraviolet (UV) part of solar radiation. UV radiation causes skin cancer and can severely damage plant life. Thus, a thin layer of ozone molecules protects humanity from skin cancer and agricultural catastrophe layer under siege from synthetic chemicals[13].
Chlorofluorocarbons (CFCs) and halons are potent ozone depleting substances (ODSs) and synthetic greenhouse gases (GHGs). All ozone depleting substances contain either chlorine or bromine. Substances containing only fluorine do not harm the ozone layer but may still be a GHG. The interim replacements for CFCs are hydrochlorofluorocarbons (HCFCs), which deplete stratospheric ozone, but to a lesser extent than concentrated CFCs. Ultimately, hydrofluorocarbons (HFCs) will replace HCFCs[14].
Stratospheric ozone depletion is well known that the ozone present in the stratosphere, roughly between altitudes of 12 and 25 km, plays a natural, equilibrium-maintaining role for the earth, through absorption of ultraviolet (UV) radiation and absorption of infrared radiation [15]. A global environmental problem is the distortion and regional depletion of the stratospheric ozone layer which has been shown to be caused by the emissions of CFCs, halons and NOx. Ozone depletion in the stratosphere can lead to increased levels of damaging ultraviolet radiation reaching the ground, causing increased rates of skin cancer, eye damage and other harm to many biological species. Energy- and non-energy-related activities are
only partially responsible for the emissions which lead to stratospheric ozone depletion[2].
There is the relationship between ozone depletion and global warming. Until recently, it was thought that, as greenhouse gases, CFCs would contribute to global warming. Table 3 gives relative ozone depletion potential (RODP), global warming potential (GWP), and atmospheric lifetimes[16].
Environmental concerns such as ozone depletion represents factor related to efficiency limit. Interest developed in the link between energy utilization and ozone depletion. The impact of energy-resource utilization on the ozone depletion is best addressed by considering exergy. Although many studies exist concerning the close relationship between energy and ozone depletion, there have been limited works on the link between exergy and ozone depletion.
2.3. Acid Rain Acid rain is a serious environmental problem. It impresses large of the world. Sulfur dioxide (SO2) and nitrogen oxides (NOx) are the primary causes of acid rain. Acid rain occurs when these gases react in the atmosphere with water, oxygen, and other chemical to form various acidic compounds. Sunlight increases the rate of most of these reactions. The result is a mild solution of sulfuric acid and nitric acid. Acid rain causes acidification of lakes and streams, contributes to damage of trees at high elevations and many sensitive forest soils and accelerates the decay of building materials and paints, including irreplaceable buildings, statues, and sculptures that are part of our nation’s cultural heritage. Prior to falling to the earth, SO2 and NOx gases and their particulate matter derivatives, sulfates and nitrates, contribute to visibility degradation and harm public health[17].
Acid rain is one of the foremost examples of regional air pollution. It has received worldwide attention because acidification damages are often the result of atmospheric transport of sulfur and nitrogen emissions across state and/or national boundaries. Europe, eastern North America, and Southeast Asia, especially central and southern China are most affected by acidic deposition[18]. The main reason of acid rain is the dissolution of SO2 and NOx in the atmosphere. These pollutants mainly originate from human activity such as the combustion of fossil
Table 3. Relative Ozone Depletion Potential (RODP), Global Warming Potential (GWP), and Atmospheric Lifetimes

75
ICCI 2015 - Bildiriler Kitabı / Proceedings Book
fuels within thermal power plants and automobiles[19]. The disposing these gases in many countries is difficult and requires high cost. So, they are generally emitted into the atmosphere with no effective treatments[20].
Acid rain is a global environmental issue and exerts deleterious effects on the phenotype and physiological characteristics of various plants[21]. These effects induce changes in the plant population structure and the plant community functions. Acid rain can also cause the acidification of surface waters and soils, inhibiting plant growth[22]. The deleterious effect mechanisms of acid rain on plants have been explained from proton effect, ion effect, photosynthesis effect, free radical effect, etc.[23].
Acid rain is very harmful to plant species as it damages leaves, limits nutrients available from soil, etc. Consequently, weak or damaged plant species easily attract diseases and finally may become dead. SO2 is relatively short-lived in the atmosphere and converts to SO3. It is more reactive than SO2 and combines rapidly with any available moisture to form sulfuric acid mist. Similar phenomenon occurs with the NO2, forming nitric acid as well.
Some energy-related activities are major sources of acid rain. For instance, electric power generation, residential heating and industrial energy use account for 70% of SO2
emissions, with coal use alone accounting for about 70% of SO2 emissions. Another source of acid precipitation is sour gas treatment. It produces H2S that reacts to form SO2 when exposed to air. Road transport is an important source of NOx emissions, accounting for 48% of the total in OECD countries. The reason of most of the remaining NOx emissions is fossil fuel combustion in stationary sources. Countries in which the energy-related activities occur widely are likely to be significant contributors to acid precipitation[10].
The acid gases that cause acid rain are materials which initially in a state of disequilibrium with the environment. They are unconstrained emissions of exergy. Therefore, they differ from the initial fuel material. Many resources in nature contain constrained exergy. Unconstrained emissions of exergy may cause environmental damage. If unconstrained exergy is constrained, pollutant can remove and cannot damage the environment and the constrained emission may become a source of exergy.
3. SOLUTION TO ENVIRONMENTAL PROBLEMSSustainable and realistic solutions must be implemented and that the root causes of the environmental problems we now face must be addressed. Such problems cannot be solved using science and technology alone. The human aspect must also be taken into account. Technological
solutions are insufficient unless society is willing to use them. Through a combination of scientific analysis, technological advances, and the continuing development of social institutions, humanity must lessen its detrimental impact on the environment if we are to avoid living on an impoverished planet in a very bleak postindustrial age[24].
Recently, a large number of potential solutions to environmental problems associated with the harmful pollutant emissions have been worked out. These include hydrogen energy, renewable energy technologies, energy conservation, cogeneration, district heating, energy storage technologies, alternative energy dimensions for transport, energy source switching from fossil fuels to environmentally benign energy forms, coal cleaning technologies, process change, acceleration of forestation, carbon or fuel taxes, materials substitution, promoting public transport, changing life styles and increasing public awareness[2].
A combined fuel cell, wind turbine and photovoltaic panel energy system would be an effective way to generate renewable energy as they have minimal environmental impact with no hazardous emission and have no or very low noise. The proton exchange membrane fuel cell (PEMFC) uses hydrogen. For the required conditions, PEM fuel cell seems to be the best solution. Since emission of the PEM fuel cell is water, the energy produced through fuel cell is environmentally clean. A combined hybrid system shows to be a promising way to generate renewable energy with relatively decent exergy efficiencies[25].
Figure 1 shows how metadisciplinary approach will require researcher to consider sustainability in the context of environmental, societal, and economic/industrial if the world is to achieve a sustainable future[26].
In order to meet the growing energy demand, natural resources are being depleted faster than they can be
Figure 1. Sustainability triangle showing the three facets of the metadisciplinary approach for solving environmental problems.
76
ICCI 2015 - Bildiriler Kitabı / Proceedings Book
replenished. Destruction of natural resources can be associated not only to global increase in energy demand but also to our heavy reliance on non-renewable sources of energy. To ensure the stability of global climate and natural resources, it is required to move toward renewable energy sources that have minimal environmental side effects[27].
Crucial to discussions on averting global climate change are thorough evaluations of the costs of reducing CO2
emissions. The discussion of costs and benefits has to take into account the need for policies promoting rapid economic growth in developing countries. Achieving such a balance between economic development and emissions abatement requires the adoption of domestic policies aimed at improving the efficiency of energy use and the implementation of international policies enabling easier access to advanced technologies and external resources.
Many developed and developing countries through several national and international institutes and agencies have started taking actions to reduce (or eliminate) the pollutant emissions and to attain a sustainable supply of energy sources. In the December 1997 International Kyoto Conference on climate change, a list of 15 concrete proposals came out for curbing global greenhouse gas emissions. The list includes improving the fuel efficiency of automobiles, introducing solar power facilities and planting forests in densely populated areas[10].
If people want to solve the acid rain problem, they must to understand how acid rain causes damage to the environment. They also need to understand what changes could be made to the air pollution sources that cause the problem. The answer to these questions help leaders make better decisions about how to control air pollution and therefore how to reduce acid rain. There are many solutions to the acid rain problem. Leaders have a choice of which options or combinations of options are best. Some of these options are clean up smokestacks and exhaust pipes, use alternative energy sources, restore a damaged environment, look to the future, and take action as individuals[17].
Exergy analysis is one of the potential solutions for current environmental problems and used in various fields. It is a useful solution methodology for environmental problems. The potential usefulness of exergy in solving environmental problems is crucial. Exergy analysis of environmental solutions is a generic problem with the boundaries. The relations between exergy and environmental problems allow the problems to be addressed and ensure solutions for economy.
4. CONCLUSIONThis study discussed exergy concept and demonstrated its use extensively to describe a variety of systems in particular for built environmental conditioning. It is more
easy to perform and integrate the environment by using exergy. Exergy is a much more suitable approach than energy because the difference between energy qualities is taken into account if the exergy is calculated for a system. Exergy analysis aims at quantitatively evaluating the exergy destructions and losses within a system. Exergy and the introduction of renewable energy technologies can significantly help solve environmental issues. Exergy methods can offer unique insights into possible improvements with special emphasis on environment. The efficiency and environmental impact of energy systems are required for engineer or scientist working in the area of energy systems and environment. Energy policies must be developed in global environmental concerns. Policy makers need to appreciate the exergy concept and its ties to these concerns. The need to understand the linkages between exergy and environment has become increasingly significant.
REFERENCES[1] Dincer I. and Rosen M.A., “Exergy: Energy, Environment and Sustainable Development”, Elsevier, London, UK, 2007.[2] Dincer I., “Technical, Environmental and Exergetic Aspects of Hydrogen Energy Systems”, Int J Hydrogen Energ, Vol.27, pp.265-285, 2002.[3] Dincer I., “The Role of Exergy in Energy Policy Making”, Energy Policy, Vol.30, pp.137-149, 2002.[4] Paksoy H.Ö. (Ed.), “Thermal Energy Storage for Sustainable Energy Consumption: Fundamentals, Case Studies and Design”, Springer, Dordrecht, NLD, 2007.[5] Harris H. (Ed.), “Global Environmental Issues”, John Wiley&Sons, Chichester, UK, 2004.[6] Jeffrey W.H., “Environmental Problem Solving: A How- to Guide”, University Press of New England, Lebanon, NH, 2007.[7] Squires G.D., “Urban Sprawl: Causes, Consequences & Policy Responses”, The Urban Institute Press, Washington, D.C., USA, 2002.[8] Dornbusch R. and Poterba J.M. (Eds.), “Global Warming: Economic Policy Responses”, Routledge, Cambridge, UK, 1991.[9] Manciocco A., Calamandrei G. and Allevac E., “Global Warming and Environmental Contaminants in Aquatic Organisms: The Need of the Etho-Toxicology Approach”, Chemosphere, Vol.100, pp.1-7, 2014.[10] Dincer I., “Environmental Impacts of Energy”, Energy Policy, Vol.27, pp.845-854, 1999.[11] Treitl S., Nolz P.C. and Jammernegg W., “Incorporating Environmental Aspects in an Inventory Routing Problem. A Case Study from the Petrochemical Industry”, Flex Serv Manuf J, Vol.26, pp.143-169, 2014.[12] Victor D.G., “Global Warming Gridlock: Creating More Effective Strategies for Protecting the Planet”, Cambridge University Press, Cambridge, UK, 2011.

77
ICCI 2015 - Bildiriler Kitabı / Proceedings Book
[13] Hoffmann M.J., “Ozone Depletion and Climate Change: Constructing a Global Responce”, State University of New York Press, New York, USA, 2005.[14] Karstensen K.H., Parlikar U.V., Ahuja D., Sharma S., Chakraborty M.A., Maurya H.P., Mallik M., Gupta P.K., Kamyotra J.S., Bala S.S. and Kapadia B.V., “Destruction of Concentrated Chlorofluorocarbons in India Demonstrates an Effective Option to Simultaneously Curb Climate Change and Ozone Depletion”, Environ. Sci. Policy, Vol.38, pp.237-244, 2014.[15] Dincer I., “Renewable Energy and Sustainable Development: A Crucial Review”, Renew and Sustainable Energy Rev, Vol.4, pp.157-175, 2000.[16] Parker L. and Morrissey W.A., “Stratospheric Ozone Depletion”, Nova Science Publishers, New York, USA, 2003.[17] Lane C.N. (Ed.), “Acid Rain: Overview and Abstracts”, Nova Science Publishers, New York, USA, 2003.[18] Menz F.C. and Seip H.M., “Acid Rain in Europe and the United States: An Update”, Environ. Sci. Policy, Vol.7, pp.253-265, 2004.[19] Zhang J.E., Ouyang Y. and Ling D.J., “Impacts of Simulated Acid Rain on Cation Leaching from the Latosol in South China”, Chemosphere, Vol. 67, pp.2131-2137, 2007.[20] Chen S., Shen X., Hu Z., Chen H., Shi Y. and Yan L., “Effects of Simulated Acid Rain on Soil CO2 Emission in a Secondary Forest in Subtropical China”, Geoderma, Vol.189-190, pp.65-71, 2012.[21] Wang X., Liu Z., Niu L. and Fu B., “Long-Term Effects of Simulated Acid Rain Stress on a Staple Forest Plant, Pinus Massoniana Lamb: A Proteomic Analysis”, Treesstruct. Funct., Vol.27, pp.297-309, 2013.[22] Larssen T., Lydersen E., Tang D., He Y., Gao J., Liu H., Duan L., Seip H.M., Vogt R.D. and Mulder J., “Acid Rain in China”, Environ. Sci. Technol, Vol.40, pp.418-425, 2006.[23] Sun Z., Wanga L., Zhou Q. and Huang X., “Effects and Mechanisms of the Combined Pollution of Lanthanum and Acid Rain on the Root Phenotype of Soybean Seedlings”, Chemosphere, Vol.93, pp.344-352, 2013.[24] McKinney M.L., Schoch R.M. and Yonavjak L., “Environmental Science: Systems and Solutions”, Jones&Bartlett Learning, Burlington, USA, 2013.[25] Calderón M., Calderón A.J., Ramiro A., González J.F. and González I., “Evaluation of a Hybrid Photovoltaic– Wind System with Hydrogen Storage Performance Using Exergy Analysis”, International Journal of Hydrogen Energy, Vol.36, pp.5751-5762, 2011.[26] Nemerow N.L. and Agardy F.J., “Environmental Solutions”, Elsevier, Burlington, USA, 2005.[27] Zafar S. and Dincer I., “Energy, Exergy and Exergoeconomic Analyses of a Combined Renewable Energy System for Residential Applications”, Energ Buildings, Vol.71, pp.68-79, 2014.
78
ICCI 2015 - Bildiriler Kitabı / Proceedings Book
ABSTRACTThe potential of exergy analysis for sustainable development implications are reviewed in this study. There is perfect relationship between exergy and sustainable development. Exergy is a key tool for sustainable development. Therefore, it is performed to determine the effect of some parameters on performance of the system. Exergy is a central concept in sustainable development and exergy methods can be used to enhance sustainability. Sustainable development includes economic viability. The methods relating exergy and economics also reinforce the link between exergy and sustainable development. The use of exergy analysis is one important element in obtaining sustainable development.
1. INTRODUCTIONExergy methods can be used to improve sustainability. One important element in obtaining sustainable development is the use of exergy analysis. Environmental effects associated with emissions and resource depletion can be expressed in terms of one exergy-based indicator[1]. Exergy is a powerful and effective tool for helping to achieve sustainable development. Because of the relation between exergy and both energy and environment, it is clear that exergy is central concept in sustainable development. Exergy methods can be used to enhance sustainability. Exergy losses should be minimized in order to obtain sustainable development. Sustainable development also includes economic viability. Thus, the methods relating exergy and economics also reinforce the link between exergy and sustainable development.
Exergy presents the impact of energy resource utilization on the environment in the best way. The exergy of a
quantity of energy or a substance is a measure of its usefulness, quality or potential to cause change. Exergy appears to be an effective measure of the potential of a substance to impact the environment. Exergy has interdisciplinary character as the confluence of energy, environment and sustainable development[2].
The intensive use of natural resources for anthropogenic activities is progressively depleting the reservoirs accumulated over the millennia. The large quantities of waste materials and effluents released to the atmosphere, the oceans, or to the land surface are altering the delicately balanced natural cycles that make the life possible on Earth. Therefore, minimization of resource use constitutes the primary objective of policies pursued for sustainable development. For this purpose exergy is the most suitable indicator for both resource accounting and waste accounting[3].
2. SUSTAINABILITY NEEDS The sustainability of the system should be assessed for decision-making to guide future investment of a renewable energy source based system. There is no common agent available to evaluate all the aspects of sustainability. For instance, cost is only used to reflect the aspect of economic sustainability, but it is in capable of evaluating the system quality of other sustainability criteria like environmental and social considerations[4].
The need for sustainable energy is increasing rapidly in the world. In fact, widespread use of sustainable energy technologies such as hydrogen and fuel cell technologies
Exergy and Sustainable Development
İkbalSARIKAYADepartment of Chemistry Karadeniz Technical University
SelçukBILGENDepartment of Chemistry Karadeniz Technical University
KamilKAYGUSUZDepartment of Chemistry Karadeniz Technical University
AliBAHADIRŞıran Mustafa Beyaz Vocational High School Gümüşhane University

79
ICCI 2015 - Bildiriler Kitabı / Proceedings Book
is important for achieving sustainability in the energy sectors in both developing and industrialized countries. These technologies are a key component of sustainable development. They have numerous advantages, such as energy efficient and compatible with renewable energy sources and carriers for future energy security, economic growth and sustainable development[5].
Determining whether a process is sustainable is by no means a simple feat. It is more a kin to a multi-variable optimization that is very familiar to systems engineers. For an objective assessment of the sustainability of a process, there is the need to utilize the tools that system engineers have developed during recent years and apply them with a life cycle approach. In a more general sense, sustainable bioprocesses in particular, and processes in general are/will be the processes that minimize environmental impacts, are economically viable, and are socially responsible[6].
The term sustainability needs to discard its negative perception, particularly in terms of being expensive to both industry and consumers, and emphasise how sustainable practices have evolved into a cost and environmentally friendly strategy that helps provide value to consumer’s lives. The branding of sustainable products and services is not enough in today’s marketplace because of the negative perception toward cost to quality ratio[7].
3. DIMENSIONS OF SUSTAINABILITYIn encompassing all aspects of our world, sustainability has been framed by considering multiple dimensions called the triple bottom line. The multiple dimensions of sustainability are echoed in the field of business strategy which expounds the sustainability concept at the business level. Accordingly, a holistic corporate responsibility model has been proposed, recently. This model integrates multiple values of sustainability. A mathematical model for a composite sustainable development index is proposed and made comparable in an economics case of Krajnc and Glavic[8].
Sustainable development, conceptually founded on the three dimensions economical, ecological and social sustainability is the main paradigm for the future improvement of humankind in the 21st century. Sustainability considers the three dimensions Economy, Ecology and Society. The Integrated Sustainability Triangle is all a graphical representation of actions and achievements, based on the three dimensions of sustainability: economy, ecology and society. The segments of the Integrated Sustainability Triangle are shown in Figure 1[9].
Sustainability cannot be achieved unless understanding of the economic dimension goes beyond the current thinking that economic growth is the only important measure of economic well-being. The economic dimension of sustainability also involves the need to create for posterity an ecologically balanced and socially just economic system that provides humans with the goods, services, and economic justice for a high quality of life[10].
The most successful attempts to measure sustainable development have been made in regarding to environmental sustainability. One of the most known indicators of the state of the environment is the ecological dimension measuring the area of bio-productive land and sea available, and how much of this area is appropriated for human use[11].
Socially, sustainability refers to the need to effectively deal with a plethora of social issues facing communities and nations worldwide. Included among these issues are population growth, the economic gulf between the developed and developing worlds, human rights, gender equity, the digital divide, and community viability. A social issue related to the rapid expansion and globalization of economic activity is the viability of communities[10].
Studying their efficiency provides insights for further developing of new investments. The topic of investments’ efficiency is very complex. These effects generate three distinctive concepts: Economic efficiency of investments; Ecological (or environmental) efficiency of investments and Social efficiency of investments[12].
4. EXERGY AND SUSTAINABILITYReduction of environmental impact, increasing efficiencies of resources utilization, energy sustainability, pollutant emissions reduction, land use and urban planning for
Figure 1. Subdividing the fields of economical, ecological and social relevancies in the Integrated Sustainability Triangle.

80
ICCI 2015 - Bildiriler Kitabı / Proceedings Book
sustainability are best addressed by using the exergy. Exergy is strictly connected to environmental impact, because pollution potential is proportional to the extent of energy conversion and utilization processes. The irreversibility of the real processes implies exergy destruction and waste flow to the environment. Exergy is an extensive quantity and all materials have a calculable exergy-content with respect to the defined external environment. This exergy content is connected to environmental damage, closely[13].
It is important to mention that in practice a thorough understanding of exergy and the insights it can provide into the effciency, environmental impact and sustainability of energy systems, are required for the engineer or scientist working in the area of energy systems and the environment[14]. During the past decade, the need to understand the linkages between exergy and sustainability has become increasingly significant. Exergy analysis is consequently linked to sustainability because of increasing of the sustainability of energy use. It must be concerned with not only loss of energy but also loss of energy quality (or exergy). Sustainable development requires both sustainable energy resources be used and the resources be used as efficiently as possible. Many feel that exergy methods can help improve sustainability[15]. Exergy analysis is of major importance in the assessment of sustainability because exergy-based efficiency of systems and processes represents a true measure of imperfections. Exergy analysis also indicates the possible ways to improve energy systems and to design better ones. Destruction of exergy must be reduced as much as possible. Assessment of exergy destruction offers the opportunity to quantify the environmental impact and the sustainability of any energy system[16].
The ratio of the thermo-ecological cost to the exergy characterizes the fraction of the non-renewable exergy in the fabrication process of the considered useful product. Usually its value is greater than 1. It can be obtain values smaller than 1 for some products fabricated with a large participation of the renewable exergy. Its value smaller than 1 is desirable as a condition of sustainable development. The name sustainability index has been proposed for the thermo-ecological cost to exergy ratio. Some exemplary values of the sustainability index have been presented in Table 1[17].
Major aspect of sustainability are efficient resource intake and reduction of emissions. Exergy is a useful tool for sustainability. Exergetic content of emissions hardly reflects the environmental impact. This is important in the assessment of sustainability.
5. EXERGETIC ASPECTS OF SUSTAINABLE PROCESSES The European Union (EU) from the beginning of 2007 has focused its emphasis on developing a new policy that puts energy back at the heart of EU action. European energy strategy and policy are strongly driven by the twin objectives of sustainability (including environmental aspects) and security of supply. Implementation of new energy technologies are of big importance for satisfying these objectives, such as renewable energy systems at the supply side and improved energy end-use efficiency (EEE) at the demand side[18].
The exergy is a very helpful tool to build a sustainable environment. The strategies developed for a better building design can help in pinpointing specific actions to reach this goal. In recent years, exergy analysis method has been widely used in the design, simulation and operation of energy related systems. In addition, exergy has gained a big importance in establishing energy policies. The exergy analysis is the modern thermodynamic method used as an advanced tool for engineering process evaluation. Whereas the energy analysis is based on the first law of thermodynamics, the exergy analysis is based on both the first and second laws of thermodynamics. Both analyses utilize also the material balance for the considered system. Unlike energy, exergy is conserved only during ideal processes because of irreversibilities in real processes[19].
Exergy analysis is an efficient technique for revealing whether or not and by how much it is possible to design more efficient thermal systems by reducing the inefficiencies. Recently, significant attention has been directed toward the use of exergy analysis in the assessment of thermal and other industrial processes and their environmental impacts since exergy analysis is an effective tool, both for achieving efficient energy utilization with reduced environmental and sustainability impact, and for providing optimum designs and operation[20].
Embodied energy is related to the natural gas combustion energy, GHG (greenhouse gas) and AP (air pollution) emissions per MJ of produced electricity, hydrogen and gasoline from previous studies for various production technologies are presented in Table 2. The GHG and AP emissions from producing a unit of electricity from natural gas are calculated assuming that electricity production from natural gas with an average efficiency of 40%[21].
Table 1. Sustainability Index of Some Industrial and Agricultural Products

81
ICCI 2015 - Bildiriler Kitabı / Proceedings Book
6. RENEWABLES FOR SUSTAINABLE DEVELOPMENTWood, coal, natural gas and petroleum are conventional non-renewable energy sources which have been benefited for ages. These sources are exhausted with utilization in conjunction with the increase in population and living standards. The greenhouse gases are occurred in the atmosphere because of the using up conventional energy source. For this reason, these conventional energy sources are not sustainable positive so that alternative renewable energy sources should be searched[22].
Climate change reduction processes such as put account of renewable energy resources in power generation involving change in fuel mix, energy efficient appliances, request for side management strategies, and smart appliances can be implemented to decrease emissions from electricity infrastructure[23]. Mitigation strategies are needed to be enhanced for promoting such a transition in favorable instituted power sector. Assessment and quantification of the emission mitigation ability for an electricity system with diversifying penetration of renewable power generation are needed to procure the national and international emission targets [24].
There are twin challenges for the future development of the energy sector: the first is to make more energy available at cost-efficient prices to meet the growing power request; the second is to prosecute energy efficiency and to put account more environmentally sustainable energy sources. To face these matters, renewable energy sources are getting concern in previous years, mainly because they represent a good reach a deal with between costs and emissions[25].
The effect of conventional fossil fuels on the environment has caused an investigation for a confident and productive energy source created less pollution while still permitting for continued economic growth. Renewable energy comes from natural sustainable resources and emits a low amount of pollution. Energy variation reduces rely on imported fuels; eventually, renewable energy development has become an important focus in countries around the world[26].
Conventionally, electricity planning is attributed on least-cost principles, in which systems perform in environments of relative cost certainty, relatively slow technological progress, high availability of homogeneous electricity generating technologies and steady energy prices. Meanwhile, fossil fuel prices have been fluctuating significantly in the last decades. Using a traditional planning model would result in an option for fossil fuel techniques, so overlooking the advantage of renewable energy, including the elimination of price volatility associated with fossil fuels. This approach would not be preferable for countries that highly depend on imported energy. As of late, rapid technological progress has substantially decreased the price of renewable energy; consequently, the variance prices and rangeability of this kind of energy lead to increased uncertainty when incorporated into power systems. It is therefore essential to integrate the features of renewable energy into traditional analytical frameworks of electricity planning[27].
Renewable energy continued its strong growth in 2010 as well. In 2009, renewable energy supplied an estimated 16% of global final energy consumption including traditional biomass, hydropower, wind, solar, geothermal, modern biomass, and biofuels. Traditional biomass used primarily for cooking and heating in rural areas of developing countries, accounted for approximately 10% of the total renewable energy share. In several countries, however, the growth in these renewable technologies far exceeds the global average. Table 3 shows the global renewable energy capacities in 2010[28].
Table 3. Global Renewable Energy Capacities in 2010
Table 2. GHG and AP Emissions (in g/MJ) of Electricity or LGV of Hydrogen And Gasoline For Various Production Technologies
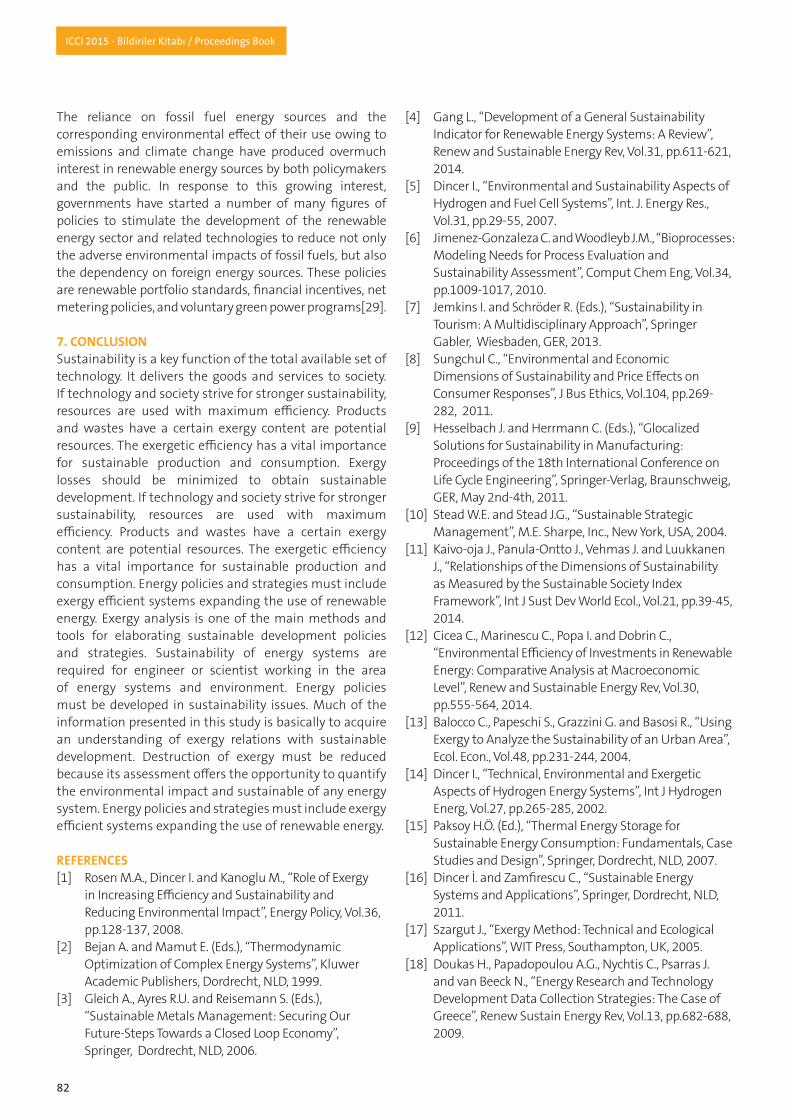
82
ICCI 2015 - Bildiriler Kitabı / Proceedings Book
The reliance on fossil fuel energy sources and the corresponding environmental effect of their use owing to emissions and climate change have produced overmuch interest in renewable energy sources by both policymakers and the public. In response to this growing interest, governments have started a number of many figures of policies to stimulate the development of the renewable energy sector and related technologies to reduce not only the adverse environmental impacts of fossil fuels, but also the dependency on foreign energy sources. These policies are renewable portfolio standards, financial incentives, net metering policies, and voluntary green power programs[29].
7. CONCLUSIONSustainability is a key function of the total available set of technology. It delivers the goods and services to society. If technology and society strive for stronger sustainability, resources are used with maximum efficiency. Products and wastes have a certain exergy content are potential resources. The exergetic efficiency has a vital importance for sustainable production and consumption. Exergy losses should be minimized to obtain sustainable development. If technology and society strive for stronger sustainability, resources are used with maximum efficiency. Products and wastes have a certain exergy content are potential resources. The exergetic efficiency has a vital importance for sustainable production and consumption. Energy policies and strategies must include exergy efficient systems expanding the use of renewable energy. Exergy analysis is one of the main methods and tools for elaborating sustainable development policies and strategies. Sustainability of energy systems are required for engineer or scientist working in the area of energy systems and environment. Energy policies must be developed in sustainability issues. Much of the information presented in this study is basically to acquire an understanding of exergy relations with sustainable development. Destruction of exergy must be reduced because its assessment offers the opportunity to quantify the environmental impact and sustainable of any energy system. Energy policies and strategies must include exergy efficient systems expanding the use of renewable energy.
REFERENCES[1] Rosen M.A., Dincer I. and Kanoglu M., “Role of Exergy in Increasing Efficiency and Sustainability and Reducing Environmental Impact”, Energy Policy, Vol.36, pp.128-137, 2008.[2] Bejan A. and Mamut E. (Eds.), “Thermodynamic Optimization of Complex Energy Systems”, Kluwer Academic Publishers, Dordrecht, NLD, 1999.[3] Gleich A., Ayres R.U. and Reisemann S. (Eds.), “Sustainable Metals Management: Securing Our Future-Steps Towards a Closed Loop Economy”, Springer, Dordrecht, NLD, 2006.
[4] Gang L., “Development of a General Sustainability Indicator for Renewable Energy Systems: A Review”, Renew and Sustainable Energy Rev, Vol.31, pp.611-621, 2014.[5] Dincer I., “Environmental and Sustainability Aspects of Hydrogen and Fuel Cell Systems”, Int. J. Energy Res., Vol.31, pp.29-55, 2007.[6] Jimenez-Gonzaleza C. and Woodleyb J.M., “Bioprocesses: Modeling Needs for Process Evaluation and Sustainability Assessment”, Comput Chem Eng, Vol.34, pp.1009-1017, 2010.[7] Jemkins I. and Schröder R. (Eds.), “Sustainability in Tourism: A Multidisciplinary Approach”, Springer Gabler, Wiesbaden, GER, 2013.[8] Sungchul C., “Environmental and Economic Dimensions of Sustainability and Price Effects on Consumer Responses”, J Bus Ethics, Vol.104, pp.269- 282, 2011.[9] Hesselbach J. and Herrmann C. (Eds.), “Glocalized Solutions for Sustainability in Manufacturing: Proceedings of the 18th International Conference on Life Cycle Engineering”, Springer-Verlag, Braunschweig, GER, May 2nd-4th, 2011.[10] Stead W.E. and Stead J.G., “Sustainable Strategic Management”, M.E. Sharpe, Inc., New York, USA, 2004.[11] Kaivo-oja J., Panula-Ontto J., Vehmas J. and Luukkanen J., “Relationships of the Dimensions of Sustainability as Measured by the Sustainable Society Index Framework”, Int J Sust Dev World Ecol., Vol.21, pp.39-45, 2014.[12] Cicea C., Marinescu C., Popa I. and Dobrin C., “Environmental Efficiency of Investments in Renewable Energy: Comparative Analysis at Macroeconomic Level”, Renew and Sustainable Energy Rev, Vol.30, pp.555-564, 2014. [13] Balocco C., Papeschi S., Grazzini G. and Basosi R., “Using Exergy to Analyze the Sustainability of an Urban Area”, Ecol. Econ., Vol.48, pp.231-244, 2004.[14] Dincer I., “Technical, Environmental and Exergetic Aspects of Hydrogen Energy Systems”, Int J Hydrogen Energ, Vol.27, pp.265-285, 2002.[15] Paksoy H.Ö. (Ed.), “Thermal Energy Storage for Sustainable Energy Consumption: Fundamentals, Case Studies and Design”, Springer, Dordrecht, NLD, 2007.[16] Dincer İ. and Zamfirescu C., “Sustainable Energy Systems and Applications”, Springer, Dordrecht, NLD, 2011.[17] Szargut J., “Exergy Method: Technical and Ecological Applications”, WIT Press, Southampton, UK, 2005.[18] Doukas H., Papadopoulou A.G., Nychtis C., Psarras J. and van Beeck N., “Energy Research and Technology Development Data Collection Strategies: The Case of Greece”, Renew Sustain Energy Rev, Vol.13, pp.682-688, 2009.

83
ICCI 2015 - Bildiriler Kitabı / Proceedings Book
[19] Hepbasli A., “Energetic and Exergetic Aspects of Cotton Stalk Production in Establishing Energy Policies”, Energy Policy, Vol.35, pp.3015-3024, 2007.[20] Bilgen S. and Kaygusuz K., “Second Law (Exergy) Analysis of Cogeneration System”, Energy Sources, Part A, Vol.30, pp.1267-1280, 2008.[21] Dincer I. and Rosen M.A., “Exergy: Energy, Environment and Sustainable Development”, Elsevier, London, UK, 2007.[22] Caliskan H., Dincer I. and Hepbasli A., “Energy, Exergy and Sustainability Analyses of Hybrid Renewable Energy Based Hydrogen and Electricity Production and Storage Systems: Modeling and Case Study”, Appl Therm Eng, Vol.61, pp.784-798, 2013.[23] Hart E.K. and Jacobson M.Z., “A Monte Carlo Approach to Generator Portfolio Planning and Carbon Emissions Assessments of Systems with Large Penetrations of Variable Renewables”, Renew Energy, Vol.36, pp.2278- 2286, 2011.[24] Abdullah M.A., Agalgaonkar A.P. and Muttaqi K.M., “Climate Change Mitigation with Integration of Renewable Energy Resources in the Electricity Grid of New South Wales, Australia”, Renew. Energy, Vol.66, pp.305-313, 2014.[25] Calderaro V., Conio G., Galdi V., Massa G. and Piccolo A., “Active Management of Renewable Energy Sources for Maximizing Power Production”, Int J Electr Power Energy Syst, Vol.57, pp.64-72, 2014.[26] Huang Y.H. and Wu J.H., “Energy Policy in Taiwan: Historical Developments, Current Status and Potential Improvements”, Energies, Vol.2, pp.623-645, 2009.[27] Wu J.H. and Huang Y.H., “Electricity Portfolio Planning Model Incorporating Renewable Energy Characteristics”, Appl. Energy, Vol.119, pp.278-287, 2014.[28] Keleş S. and Bilgen S., “Renewable Energy Sources in Turkey for Climate Change Mitigation and Energy Sustainability”, Renew Sustain Energy Rev, Vol.16, pp.5199-5206, 2012.[29] Apergis N. and Payne J.E., “Renewable Energy, Output, CO2 Emissions, and Fossil Fuel Prices in Central America: Evidence from a Nonlinear Panel Smooth Transition Vector Error Correction Model”, Energy Econ., Vol.42, pp.226-232, 2014.

84
ICCI 2015 - Bildiriler Kitabı / Proceedings Book
ÖZET2023 20.000MW hedefine giden yolda oldukça önemli bir dönüm noktası olan Nisan 2015 lisans başvurularında, teknik ve yasal olarak zorunlu olan rüzgâr ölçümleri için 1400’ün üzerinde rüzgâr ölçüm direğinin Türkiye’nin çeşitli bölgelerinde kurulduğu bilinmektedir. Uzun süredir rüzgâr enerji santralleri için lisans başvurusunun kabul edilmemiş olması ile bu süreçte değişen yasal mevzuatlar, talep artışının başlıca sebepleri olarak sayılabilir. Diğer taraftan, kısa süre içerisinde çok sayıda ölçüm direğinin kurulması kritik hataları da beraberinde getirmiştir. Bu çalışma kapsamında, en sık yaşanan beş sorun incelenmiş ve çözüm önerileri paylaşılmıştır.
Anahtar Kelimeler: Rüzgâr ölçüm, Veri kaydı, Ölçüm hatası, Anemometre, Data logger, Windvane
1. GİRİŞRüzgâr enerjisinin son yıllardaki sektörel trendi incelendiğinde, her yıl bir önceki yıla göre yaklaşık %30 yeni kurulu güce sahip olan sektörün, gerek ulusal hedefler gerekse enerji talebinin doğurmuş olduğu bir gereklilikle bu hızlı büyümesini sürdürmekte olduğu konusunda tüm taraflar hemfikirdir. Bir rüzgâr enerji santralinin kurulumundaki ilk ve en önemli basamaklardan birisi olan rüzgâr ölçümü ise, santralin tüm çalışma ömrüne ışık tutacak nitelikteki teknik verilerin toplandığı, yatırımın seyrine yön veren bir süreçtir. Bu sebeple sürdürülebilir ve güven veren bir sektörün oluşması için, yapılan yatırımların minimum belirsizlikle hayat bulması tüm sektör bileşenleri adına önem taşımaktadır. Bunun için de yatırımcının her şeyden önce minimum veri kaybı ve minimum belirsizlikle ölçüm sürecini atlatması kritik öneme sahiptir. Nisan 2015 başvuruları için geçen süreçte Türkiye’deki en yoğun rüzgâr ölçüm direği kurulumu yaşanmış, bu durum sektörel olarak birçok tecrübenin yaşanmasına sebep olmuştur. Kurulumlar sırasında en sık yaşanan beş hata ve çözümleri aşağıda paylaşılmıştır.
2. TOPRAKLAMA HATALARIBir rüzgâr ölçüm direğinin topraklanması iki başlık altında incelenmelidir. Bunlardan ilki, ölçüm sisteminin tamamını yıldırım riskine karşı koruyabilmek için kullanılan, rüzgâr ölçüm direğinin en üst noktasında konumlandırılmış bakır yıldırım yakalama çubuğunun topraklanması, diğeri
ise data kablolarında yer alan koruyucu kılıfın ve data logger’ın manyetik etkilere ve yıldırım geçişlerine karşı topraklanmasıdır.
Sahada meteorolojik risklere açık olarak çalışan ve çoğunlukla da yüksek rakımlı noktalarda görev yapan rüzgâr ölçüm direkleri, yıldırıma karşı savunmasız durumdadır. Bu riski minimize etmek için, rüzgâr ölçüm direğinin en üst noktasında bir yıldırım yakalama çubuğu kullanılmalı, bu çubuk bakırdan imal edilmiş, uç kısmı sivriltilmiş ve 60 derecelik koruma koniği altında tepe anemometresini koruyacak şekilde direğe konumlandırılmış olmalıdır. Yakalama çubuğunun türbülans yaratarak rüzgâr akışını engellemeyecek şekilde konumlandırılmasına dikkat edilmelidir. Yıldırım yakalama çubuğu herhangi bir direnç oluşturmayacak şekilde ve en az 70mm2 kesit alanına sahip bir bakır kablo ile, direğin metal aksamından tamamen yalıtılarak zemine indirilmelidir. Bakır yakalama çubuğunun, rüzgâr ölçüm direği gövdesi üzerinden topraklanmaya çalışılması çok büyük toprak direncinin oluşmasına sebep olduğu için kesinlikle tercih edilmemesi gereken hatalı bir uygulamadır.
Sıkça karşılaşılan hataların bir diğeri ise, bu bakır çubuğun toprakla ilişkilendirilmesinin düzgün yapılamamasıdır. Direk gövdesinden yalıtılarak zemine indirilen topraklama kablosu yine bir bakır çubuk ya da genişletilmiş bakır plaka ile gömülmeli, mutlak suretle topraklama direnci kontrol edilmelidir. Rüzgâr ölçüm direği uygulamalarında genellikle 10ohm ve altı topraklama dirençleri yeterli kabul edilmektedir. Ancak riskin yüksek olduğu yerlerde ya da güvenliğin daha yüksek olması istenen uygulamalarda 5ohm ve altı direnç hedeflenmelidir. Çevre etkileri tartışmalı olsa dahi kimi uygulamalarda toprağa gömülen ekipmanların direnç düşürücü kimyasallar yardımıyla gömülmesinin, hedef topraklama dirençlerine ulaşmakta yardımcı olduğu bilinmektedir. Ayrıca zemine ulaşan topraklama kablosunun kaz ayağı uygulaması yapılarak toprağa gömülmesi yine direnç düşüşünü destekleyecektir. Yıldırıma karşı maksimum koruma sağlamak için yıldırım yakalama çubuğunun en üst noktasından, toprağa gömülen bakırın en alt noktasına kadar en düşük direnci yakalamak ana hedef olmalı ve bu hedeften uzaklaşılmasına neden olabilecek; direnç
20 GW’a Giden Yolda En Sık Yaşanan Beş Rüzgâr Ölçüm Hatası ve Pratik Çözüm Önerileri
İskenderKÖKEYKintech Mühendislik Ölçüm ve Eğitim Hizmetleri Tic. Ltd. Şti.

85
ICCI 2015 - Bildiriler Kitabı / Proceedings Book
yaratacak ek bağlantı noktaları, klamens bağlantılarının gevşek bırakılması gibi hatalardan kaçınılmaya özen gösterilmelidir.
Çok önemli bir diğer topraklama ise kullanılan tüm sensörlerin ve data logger’ın topraklamasıdır. Bu sadece yıldırımdan sensörlerin zarar görme riskini azaltmakla kalmaz, aynı zamanda manyetik gürültülerin de filtrelenmesini sağlar. Unutulmamalıdır ki, kare dalga taşıyarak direğin en üst noktasından data logger’a indirilen anemometre kabloları etrafında bir manyetik alan oluşacaktır. Eğer sensör kabloları düzgün şekilde topraklanmaz ise, bu manyetik alanın etkisiyle komşu sinyal kabloları içerisinde istenmeyen sinyaller taşınabilir. Cross-talk olarak bilinen bu hata neticesinde olağan dışı rüzgâr hızı kayıtları alınabileceği gibi, tespit edilebilmesi de oldukça güç olacaktır. Ölçümlerin güvenilirliğinin en üst düzeyde korunabilmesi için, her bir sensör kablosunu sarmalayan koruyucu kılıflar mutlak suret ile data logger’ın topraklama klamensine bağlanmalı, data logger ve pano ise direkten bağımsız şekilde mutlaka topraklanmalıdır. Bu noktada yapılan hataların birisi, panonun topraklamasının direkte bulunan topraklama hattı üzerinden yapılmasıdır (Şekil 1). Bu uygulama kesinlikle amaca hizmet etmediği gibi, data logger ve sensörlerin yıldırımdan zarar görme riskini artıracağından tercih edilmemelidir. Tercihen pano topraklaması direk topraklamasının zıt yönünde tasarlanmalıdır.
3. WINDVANE KUZEY KALİBRASYONU HATALARIRüzgâr ölçüm istasyonlarında en sık yaşanan sorunlardan birisi de, windvane yön kalibrasyonlarının düzgün olarak yapılamamasıdır. Üretici firmalar tarafından rüzgâr yön ölçerler üzerine bir kuzey işareti (North Mark – N) yerleştirilmiştir. Yön ölçerler bu işaretin bulunduğu noktadan rüzgâr geldiği zaman logger’a tam kuzey sinyali (0 ya da 360 deg.) gönderirler. Ancak saha şartlarında
windvane’in montajı yapılırken bu “N” işaretini tam olarak kuzeye kalibre etmek her zaman mümkün olamamaktadır. Bu sebeple birçok uygulamada N işareti kuzey yerine yönü kesin olarak bilinebilecek bir başka noktaya kalibre edilirler. Bunların başında ise bom kolları gelmektedir. Rüzgâr ölçüm istasyonları henüz kurulmadan önce dahi, sahanın hakim rüzgâr yönüne göre bom kolu oryantasyonları belirlenir. Montaj sırasında plandan sapmalar olsa dahi, bom kollarının tam olarak hangi doğrultuda konumlandırıldığı hatasız olarak sahada saptanabilmektedir. Windvaneler de bilinen bu doğrultuya kolaylıkla kalibre edilebilirler (Şekil 2).
Sahada yapılan bu kalibrasyon sonucunda ölçüm verilerinin bir offset değeri ile düzeltilmesi gerekmektedir. Aksi halde N işaretinin baktığı bom kolu yönü kuzey kabul edileceğinden hatalı kayıt alınacaktır. Uygulamada yaşanan en önemli hata, bu offset değerinin yanlış olarak girilmesi sonucunda hatalı veri kaydı yapılmasıdır. Örnek bir uygulamayla, hakim rüzgâr yönünün kuzeydoğu olduğu, bu sebeple 315-135 doğrultusunda konumlandırılan bom kollarından, 315 dereceye bakan bom kolu üzerinde, north işareti 135 dereceye yani bom kolunun içerisinde bakacak şekilde kalibre edilmiş bir windvane’e ait doğru offset değerinin nasıl bulunacağını inceleyelim:
İlk olarak rüzgârın güneydoğudan ve tam olarak 135 dereceden estiği farz edilsin. Bu durumda okunması gereken gerçek değer 135 olmalı; ancak bu durumda windvane tam N işaretinin baktığı yön üzerinden rüzgârı aldığı için tam kuzey yani 0 derece sinyali üretecektir.
Şekil 1. Data logger’ın içinde yer aldığı pano ile direğin yıldırımdan korunmasını amaçlayan topraklama hatları birbirinden bağımsız olmalıdır.
Şekil 3. Doğru offset değeri hesaplama çizelgesi.
Şekil 2. Kuzey işareti bom kolu içerisine kalibre edilmiş bir windvane.

86
ICCI 2015 - Bildiriler Kitabı / Proceedings Book
Verilmesi gereken offset değeri 135 (135-0) derecedir. Bir diğer senaryo olarak, rüzgârın tam güneyden yani 180 dereceden estiği farz edilirse, okunması gereken değer 180 derece iken windvane 45 derece sinyali gönderecektir; bu durumda da yine verilmesi gereken offset değeri 135 derece (180-45) olarak bulunur. Benzer şekilde, 270 dereceden esen rüzgâr için de doğru değerin okunabilmesi için 135 derecelik bir offset’in tanımlanmış olması gerektiği bulunabilir. (Şekil 3)
4. LOGGER KONFİGÜRASYON HATALARIRüzgâr ölçüm ekipmanları analog ya da dijital çıkışlı olarak çalışan elektronik cihazlardır. Örneğin cup tipi anemometreden kare dalga DC sinyal alınır ve bu sinyaller logger üzerinde Hz cinsinden kaydedilir, windvane için ise çıkış sinyali V (voltaj) olarak kaydedilmektedir. Bu sinyaller anlamlandırılırken her sensör karakteristiği için farklı olan slope ve offset değerleri kullanılır. Bir transfer fonksiyonu ile, sensörden okunan Hz ya da V değeri, m/s ya da deg. değerine dönüştürülür. Tam bu sırada, bu transfer fonksiyonun katsayıları olan slope ve offset değerlerinin doğru olarak tanımlanmış olması önem kazanmaktadır. Tipik bir anemometre için slope değeri 0.048, offset değeri ise 0.22’ye yakın değerler olarak akredite bir rüzgâr tünelinde belirlenir. İnsan kaynaklı hataların en önemlilerinden birisi logger konfigürasyonu sırasında bu değerlerin hatalı olarak girilmesi sonucu hatalı kayıtların alınmasıdır. Bilindiği gibi olaşabilecek küçük hatalar ölçüm sonuçlarını tamamen belirsiz hale getirebilir. Bu nedenle ölçüm sisteminde kullanılan data logger’ın mutlaka ham data kaydı yapması gerekmektedir. Ham data kaydı yapan bir logger’da, bu tip insan kaynaklı bir hata uzun süre sonra fark edilse dahi, transfer fonsksiyonunu doğru değerler ile yeniden tanımlayıp, ham dataları yeniden çözümlemek oldukça kolaydır.
5. ENERJİ SİSTEMİNDEN KAYNAKLI HATALAR Rüzgâr ölçüm ekipmanları şebekenin olmadığı noktalarda çalışan sistemler olduğu için enerji gereksinimlerini genellikle PV paneller aracılığı ile güneşten elde ederler.
Bir ölçüm sisteminin sorunsuz çalışabilmesi için, besleme voltajının düzenli olması kritik önem taşımaktadır. Bu nedenle her bir istasyon PV panel, akü ve şarj kontrol ünitesinden oluşan bir güç sistemi ile çalıştırılmakta olduğundan, ölçüm periyodu boyunca güç sisteminin sorunsuz olarak şarj ettiği çok dikkatli takip edilmelidir. Bu sebeple kullanılan data logger’ın sadece ölçüm parametrelerini değil güç sistemini de izlemesi ve bir arıza oluşması durumunda sistemin gücü kesilmeden önce müdahale edilebilmesi için son kullanıcıya zaman kazandırması gerekmektedir. Geçmişe dönük akü voltajının karakteristiği ve son 48 saat içerisindeki akü voltajının maksimum/minimum değerlerini görebilmek güç sistemi hakkında öngörüde bulunabilmek için kritik öneme sahiptir (Şekil 5).
Veri transferi ve anlık veri takipleri sırasında logger güç tüketimi dramatik şekilde artacağı için, logger ile mümkün olan en kısa süre uzaktan iletişim kurulmalıdır. Türkiye coğrafyası göz önünde bulundurulduğunda minimum 26Ah jel tipi akü ve 20Wp PV panel yeterli gözükmekle birlikte, eğer çok sık eş zamanlı veri takibi ya da veri indirmesi yapılacaksa veya istasyonun bulunduğu noktada GSM şebekesi güçlü çekim gücüne sahip değilse güneş paneli ve akü grubunun büyütülmesi gerekecektir. Bir diğer önemli hata ise, logger ile güç ünitesinin bağlantısı sırasında gözlenmektedir. Logger güç girişi, solar şarj kontrol ünitesinin yük çıkışı yerine doğrudan aküden alınmalıdır. Bu sayede solar şarj kontrol ünitesinden kaynaklı arızalarda güç kesinti riski bertaraf edilmiş olacaktır.
6. GSM OPERATÖR AYARLARINDAN KAYNAKLI HATALARGünümüz data logger’ları iletişim ihtiyaçlarını, GSM operatörleri tarafından sağlanan internet aracılığıyla karşılamaktadırlar. Logger üzerinde yer alan SIM kart
Şekil 4. EOL Zenith veri kaydediciye ait konfigürasyon ekranı.
Şekil 5. Logger üzerinden akü voltajının son 48 saatlik minimum değeri ile anlık değerinin takibi.

87
ICCI 2015 - Bildiriler Kitabı / Proceedings Book
aracılığı ile internete erişen sisteme, son kullanıcılar kendi PC’leri üzerinden bağlanıp veri indirme, eş zamanlı veri izleme, ayar yükleme gibi operasyonları yürütebilirler. Bir rüzgâr ölçüm istasyonunun standartlara uygun şekilde kurulması kadar işletilmesi de oldukça önemli olduğundan, ölçüm sisteminin internete erişebilmesi için gerekli ayarlar doğru şekilde tanımlanmalıdır. Örneğin, sistemde kullanılan SIM kartın APN (Access Point Name) adı doğru şekilde logger’a tanımlanmaz ya da bu APN daha sonra GSM operatörü tarafından geçersiz kılınırsa, logger ile uzaktan iletişim kurmak imkansız hale gelecektir. Her SIM kart için farklı APN’lerin aktif olabilme ihtimaline karşı, kullanılan SIM kart sahibi şahıs/firmaların öncelikle GSM operatörlerinden ilgili SIM kartta hangi APN’lerin tanımlı olduğunu öğrenmeleri sonrasında ise bu ayarları logger’ın iletişim ayarları bölümünde doğru şekilde tanımlamaları gereklidir. Unutulmamalıdır ki, data logger’ın sahaya sevkiyatından önce ofiste ilgili bağlantı testlerinin yapılarak tüm ayarların doğru şekilde tanımlandığından emin olmak, ileride karşılaşılacak sorunların ortadan kaldırılması adına oldukça önemlidir. Logger ile iletişim kurmak minimum belirsizlikli bir ölçüm periyodu için çok önemli olduğundan, sisteme günün 24 saati kesintisiz erişilebilmelidir. Bu erişimler sırasındaki güç tüketimini minimum tutabilmek adına sadece bu amaçla üretilmiş modemlerin yer aldığı sistemleri tercih etmek enerji problemlerinin önüne geçecektir. Piyasada bulunan universal tip harici modem kullanan data logger’larda güç tüketimi çok yükseldiği için günün her anı bağlantı sağlanamamakta ve bu durumun sonucunda sahada oluşacak sorunlar sistemi takip eden kullanıcıya zaman farkı ile ulaşacağından veri kaybına neden olmaktadır.
7. SONUÇBaşarılı bir rüzgâr enerji santrali projesinin ilk basamağı, öncelikle düşük belirsizlikli bir rüzgâr ölçüm periyodundan geçmektedir. Bu sebeple santral bütçesi yanında oldukça düşük bir bütçeye sahip olan rüzgâr ölçüm süreci, teknik olarak tüm santralin geleceğine etkiyecek nitelikte öneme sahiptir. Bu denli önemli bir sürecin başarılı yönetilmesi sadece uluslararası standartlara uygun ekipmanlar tercih etmekle değil, aynı zamanda başarılı bir uygulamayla mümkün olabilmektedir. Bu sebeple başta bu çalışmaya konu sorunlar olmak üzere, burada paylaşılamamış birçok problem ölçüm sürecinde belirsizlik yaratabileceğinden, mümkün olan en üst hassasiyetle ve uzmanlıkla sürecin yönetilmesi gerekmektedir.
KAYNAKLAR[1] http://www.kintech-engineering.com/media/pdf/ productcatalogue-en.pdf[2] ICE – 61400-12 International Standart,[3] Patel M., 2006. Wind and Solar Power System, Taylor&Francis Group, FL, ABD
SUMMARYIt is known that more than 1400 met masts are erected in Turkey within 2 years to collect valid data for new licence applications which is scheduled in April 2015. In In this paper, most common 5 problems of wind measurement campaigns are investigated to highlight the importance of measurement. It is aimed to improve quality of wind campaigns in Turkey to have more sustainable wind market.

88
ICCI 2015 - Bildiriler Kitabı / Proceedings Book
ABSTRACTA high flow seawater reverse osmosis membrane was developed by LANXESS Germany. The characterization in the laboratory was performed with Boron and the membrane showed a high permeability and a good Boron rejection. Pilot plant tests in a demonstration plant in Sharm-El Shaik, Egypt supported the observation of a good rejection. The new design software LewaPlus was used to calculate the impact of such a high flow membrane on the water quality and the energy consumption of this plant. It could be shown that a high flow membrane could achieve the requested water quality and would save 6% of the energy consumption. Additional 35% energy saving could be realize changing the Energy recovery devices from turbocharger to isobaric devices.
INTRODUCTIONReverse osmosis (RO) process serves as a benchmark for desalination technologies as it is the most energy efficient technology to desalinate seawater. With the introduction of thin film composite RO membrane elements for seawater desalination in the eighties, the energy consumption dropped from 12 kWh/m3 to approx. 2.5 kWh/m3 today. One reason was the development of new RO membranes, improved energy recovery equipment and new system designs to make the RO desalination process more efficient.
When LANXESS started the development of a new Seawater (SW) membrane the focus was to produce a membrane which can produce water which complies with current World Health Organization (WHO) recommendations and to achieve it in a single pass process with a low the energy
requirement. Since the development of an energy saving membrane goes together with a decrease of rejection it was essential to investigate carefully the impact on the water quality.
Therefore the characterization of the membrane was carried out in the laboratory and in a demonstration plant in Sharm-El Shaik, Egypt. The feed water supply is an existing beach well and the water is used in a hotel for both drinking and process water at a major hotel.
Still the membrane is not the only part which can help to reduce energy. A new design software, which was used in this research, helped to detected additional options to reduce the energy consumption.
EVALUATION OF THE SEAWATER MEMBRANEChemicals and Materials:All chemicals used in this study are of analytical grade, unless specified otherwise. Sodium chloride, hydrochloric acid and sodium hydroxide for the preparation of feed water were purchased from VWR International (Langenfeld, Germany). For the rejection experiments, boron in the form of boric acid was obtained from Merck (Darmstadt, Germany).
In this study, highly crosslinked commercial RO membranes were used (O/N ratio ~ 1.2). Seawater membrane coupons were cut from membrane sheets and stored in deionized water at 4°C in the dark before each experiment. According to the manufacturer, all tested membranes are thin-film composite RO membrane with a polyamide active layer.
Comparison of Different Approaches to Reduce Operational Costs
JensLIPNIZKIHead of Technical Marketing MembraneLanxess Germany
KarinaZEDDAHead of Technical Marketing MembraneLanxess Germany
ŞebnemAybigeŞENERTechnical Manager Ökotek
BurcuKaleliÖZTÜRKTechnical Manager Ökotek

89
ICCI 2015 - Bildiriler Kitabı / Proceedings Book
Experimental Protocol for Rejection of Boron:An evaluation of boron rejections process by seawater RO membrane was performed by conducting rejection experiments at strictly controlled conditions. These experiments were conducted in a pilot-scale coupon tester, using coupons cut from sheets of membrane and placed in twelve, parallel connected filtration cells in a closed-loop, cross-flow configuration.
To simulate the condition of seawater in a controlled environment, feed water containing 32,000 mg/L of NaCl and compound of interest was prepared in the feed tank for the rejection experiments. Temperature of the feed water was automatically controlled and adjusted to 25°C.
Results of the Boron rejection at different pH:In order to observe the effects of boron speciation on the seawater RO membrane rejection performance, rejection experiments were conducted at various pH values, from 6 to 11. As the pKa of boron is 9.24, boron is present as an uncharged species, B(OH)3 below this pH value, and as a negatively charged species, BO(OH)2- at higher pH values.
Figure 1 presents the boron rejection of a commercial seawater RO membrane tested at different pH values. As can be seen, at the highest pH values (10 and 11), boron was rejected more than 97%. At pH value near pKa, rejection is still high at around 94%. Below this point, rejection of boron decreases, as boron is protonated and exists as uncharged species. The highly crosslinked seawater RO membrane, however, maintains a high boron rejection at lower pH. Improved boron rejection in this case is mainly caused by small effective pore size, which leads to diffusional effects. This is shown by excellent rejection performance of non-dissociated boric acid at lower pH values. At pH values higher than pKa, charge repulsion to a lesser extent adds to the improved rejection.
Table 1 presents an alternative method of analyzing the capability of the seawater membrane in rejecting solutes in comparison to a commercial brackish water RO membrane. As can be seen, the permeability of boron through the membranes are the highest at pH values below its pKa. At pH values of 5.6 and 7.6, boron is more permeable in both membranes, whereas at pH 9.6, the permeability decreases by half for both brackish water and seawater membranes. When compared at the same pH values, seawater membrane always exhibits lower permeability of boron due to the more dense polyamide layer and smaller effective pore size, at half of the value than that of brackish water RO membrane.
The characterization shows that the high demanded Boron rejection could be achieved with the high permeability SW membrane. Therefore the next step was to test the membrane in a real operational plant.
PILOT TEST OF THE SW RO ELEMENTSThe selected plant is using beach well as water source. The pretreatment consist out of a depth filtration and cartridge filters. If needed anti-scalant is added. Apart from that Oxygen is added for iron removal. The plants are cleaned every 4-6 months. The rejection of each element is checked every three months with the center tube method. The water source of the plant supplies a water with a fairly constant TDS in the range of 41,000 mg/l at at a temperature range of around 25°C (+/- 3°C).
The plant consist out of 8 trains. Each train produces 1000 – 1100 m3/day. It is a single stage system with 18 vessels with 6 elements per vessel . The lifetime of the competitive installed elements varied since only some elements were exchange frequently. Therefore an average age of three years were assumed for this calculation.
The elements were installed in a pressure vessel in pass one and had in average a flow higher than 7.200 gpd.
Figure 1. Effects of pH on boron rejection of a commercial seawater RO membrane.
Table 1. Boron Permeability of Commercial Seawater and Brackish Water RO Membranes at Different pH Values*
*BW denotes brackish water RO membrane; SW denotes seawater RO membrane. Seawater conditions (NaCl 32,000 mg/l, 25°C) and brackish water conditions (NaCl 8,000 mg/l, 25°C) were used for rejection experiments of SW and BW, respectively.
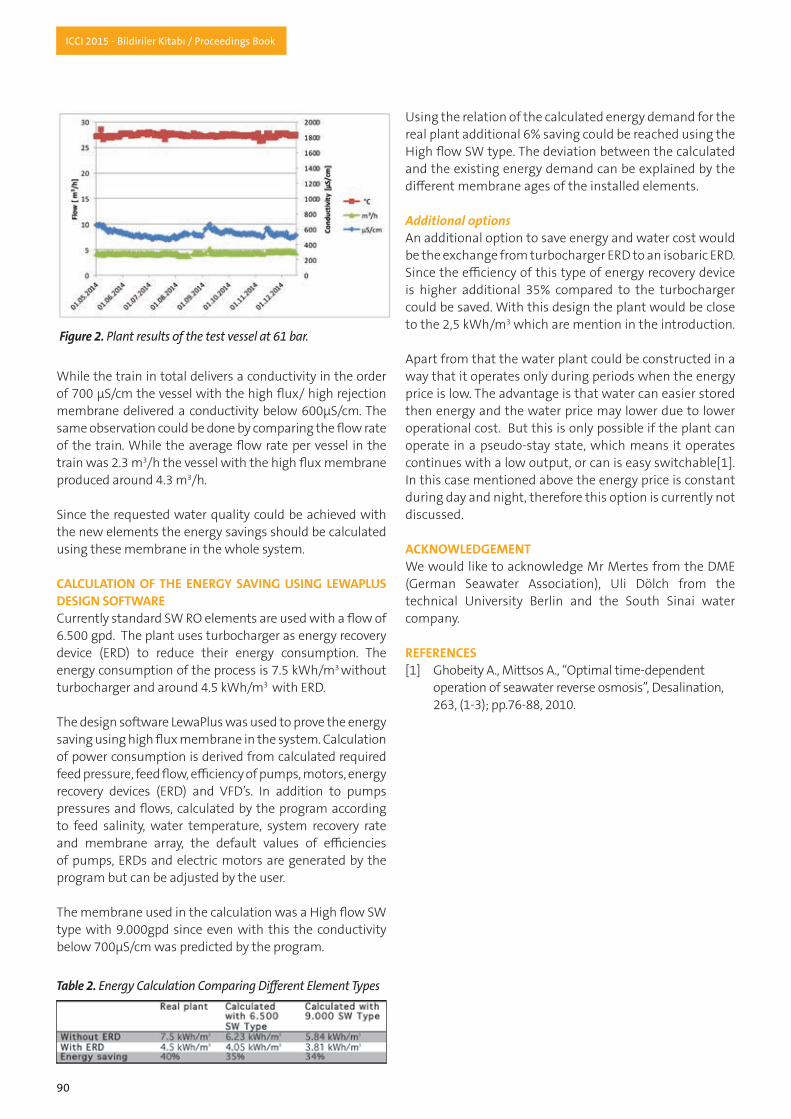
90
ICCI 2015 - Bildiriler Kitabı / Proceedings Book
Figure 2. Plant results of the test vessel at 61 bar.
While the train in total delivers a conductivity in the order of 700 µS/cm the vessel with the high flux/ high rejection membrane delivered a conductivity below 600µS/cm. The same observation could be done by comparing the flow rate of the train. While the average flow rate per vessel in the train was 2.3 m3/h the vessel with the high flux membrane produced around 4.3 m3/h.
Since the requested water quality could be achieved with the new elements the energy savings should be calculated using these membrane in the whole system.
CALCULATION OF THE ENERGY SAVING USING LEWAPLUS DESIGN SOFTWARECurrently standard SW RO elements are used with a flow of 6.500 gpd. The plant uses turbocharger as energy recovery device (ERD) to reduce their energy consumption. The energy consumption of the process is 7.5 kWh/m3 without turbocharger and around 4.5 kWh/m3 with ERD.
The design software LewaPlus was used to prove the energy saving using high flux membrane in the system. Calculation of power consumption is derived from calculated required feed pressure, feed flow, efficiency of pumps, motors, energy recovery devices (ERD) and VFD’s. In addition to pumps pressures and flows, calculated by the program according to feed salinity, water temperature, system recovery rate and membrane array, the default values of efficiencies of pumps, ERDs and electric motors are generated by the program but can be adjusted by the user.
The membrane used in the calculation was a High flow SW type with 9.000gpd since even with this the conductivity below 700µS/cm was predicted by the program.
Using the relation of the calculated energy demand for the real plant additional 6% saving could be reached using the High flow SW type. The deviation between the calculated and the existing energy demand can be explained by the different membrane ages of the installed elements.
Additional options An additional option to save energy and water cost would be the exchange from turbocharger ERD to an isobaric ERD. Since the efficiency of this type of energy recovery device is higher additional 35% compared to the turbocharger could be saved. With this design the plant would be close to the 2,5 kWh/m3 which are mention in the introduction.
Apart from that the water plant could be constructed in a way that it operates only during periods when the energy price is low. The advantage is that water can easier stored then energy and the water price may lower due to lower operational cost. But this is only possible if the plant can operate in a pseudo-stay state, which means it operates continues with a low output, or can is easy switchable[1]. In this case mentioned above the energy price is constant during day and night, therefore this option is currently not discussed.
ACKNOWLEDGEMENTWe would like to acknowledge Mr Mertes from the DME (German Seawater Association), Uli Dölch from the technical University Berlin and the South Sinai water company.
REFERENCES[1] Ghobeity A., Mittsos A., “Optimal time-dependent operation of seawater reverse osmosis”, Desalination, 263, (1-3); pp.76-88, 2010.
Table 2. Energy Calculation Comparing Different Element Types
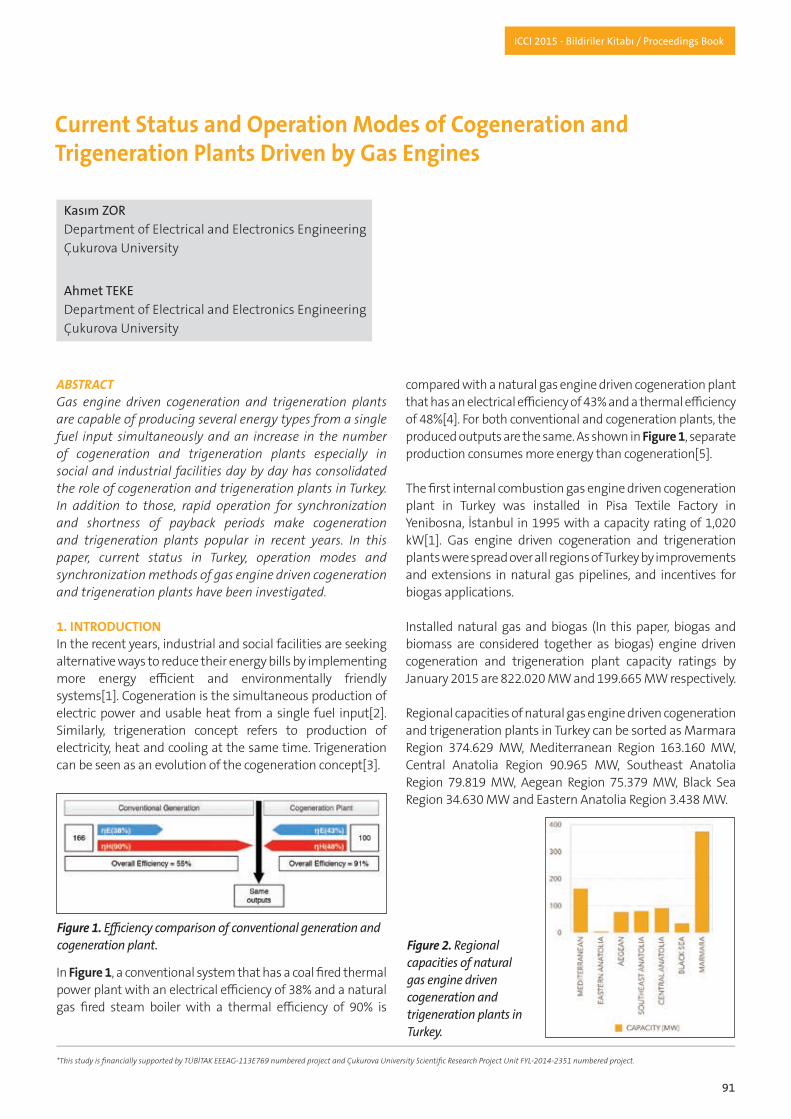
91
ICCI 2015 - Bildiriler Kitabı / Proceedings Book
ABSTRACTGas engine driven cogeneration and trigeneration plants are capable of producing several energy types from a single fuel input simultaneously and an increase in the number of cogeneration and trigeneration plants especially in social and industrial facilities day by day has consolidated the role of cogeneration and trigeneration plants in Turkey. In addition to those, rapid operation for synchronization and shortness of payback periods make cogeneration and trigeneration plants popular in recent years. In this paper, current status in Turkey, operation modes and synchronization methods of gas engine driven cogeneration and trigeneration plants have been investigated.
1. INTRODUCTIONIn the recent years, industrial and social facilities are seeking alternative ways to reduce their energy bills by implementing more energy efficient and environmentally friendly systems[1]. Cogeneration is the simultaneous production of electric power and usable heat from a single fuel input[2]. Similarly, trigeneration concept refers to production of electricity, heat and cooling at the same time. Trigeneration can be seen as an evolution of the cogeneration concept[3].
In Figure 1, a conventional system that has a coal fired thermal power plant with an electrical efficiency of 38% and a natural gas fired steam boiler with a thermal efficiency of 90% is
compared with a natural gas engine driven cogeneration plant that has an electrical efficiency of 43% and a thermal efficiency of 48%[4]. For both conventional and cogeneration plants, the produced outputs are the same. As shown in Figure 1, separate production consumes more energy than cogeneration[5].
The first internal combustion gas engine driven cogeneration plant in Turkey was installed in Pisa Textile Factory in Yenibosna, İstanbul in 1995 with a capacity rating of 1,020 kW[1]. Gas engine driven cogeneration and trigeneration plants were spread over all regions of Turkey by improvements and extensions in natural gas pipelines, and incentives for biogas applications.
Installed natural gas and biogas (In this paper, biogas and biomass are considered together as biogas) engine driven cogeneration and trigeneration plant capacity ratings by January 2015 are 822.020 MW and 199.665 MW respectively.
Regional capacities of natural gas engine driven cogeneration and trigeneration plants in Turkey can be sorted as Marmara Region 374.629 MW, Mediterranean Region 163.160 MW, Central Anatolia Region 90.965 MW, Southeast Anatolia Region 79.819 MW, Aegean Region 75.379 MW, Black Sea Region 34.630 MW and Eastern Anatolia Region 3.438 MW.
Current Status and Operation Modes of Cogeneration and Trigeneration Plants Driven by Gas Engines
KasımZORDepartment of Electrical and Electronics Engineering Çukurova University
AhmetTEKEDepartment of Electrical and Electronics Engineering Çukurova University
Figure 2. Regional capacities of natural gas engine driven cogeneration and trigeneration plants in Turkey.
*This study is financially supported by TÜBİTAK EEEAG-113E769 numbered project and Çukurova University Scientific Research Project Unit FYL-2014-2351 numbered project.
Figure 1. Efficiency comparison of conventional generation and cogeneration plant.
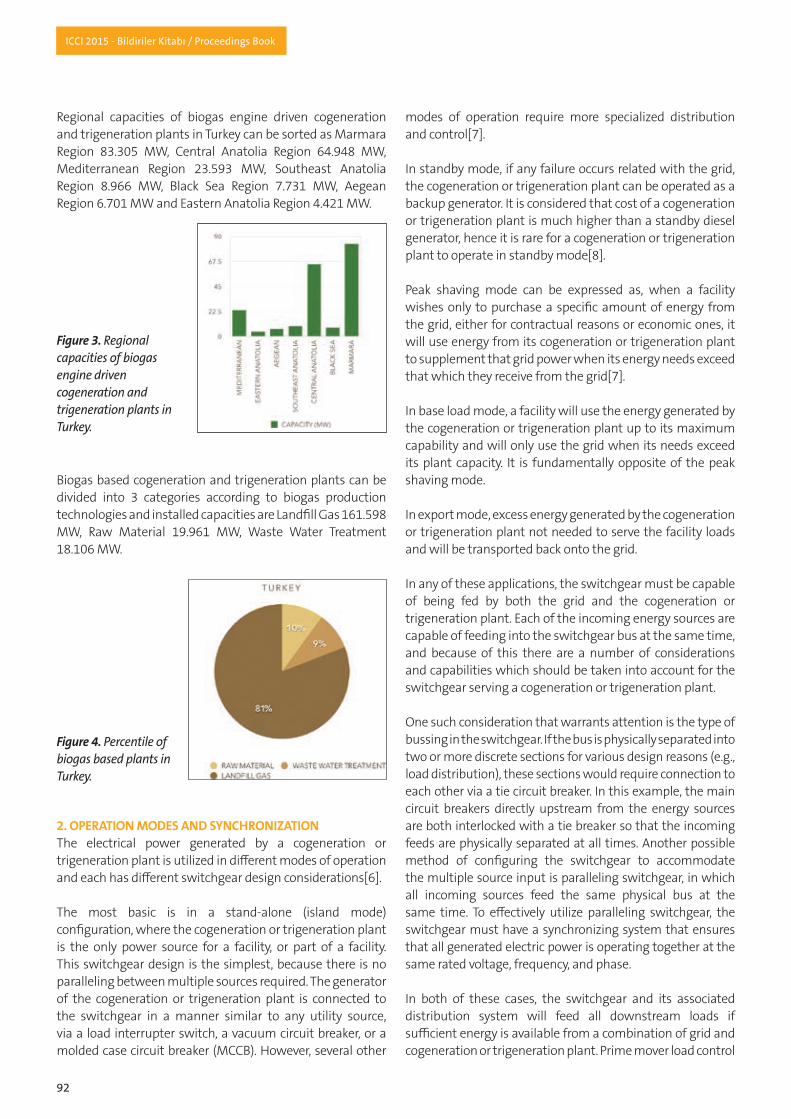
92
ICCI 2015 - Bildiriler Kitabı / Proceedings Book
Regional capacities of biogas engine driven cogeneration and trigeneration plants in Turkey can be sorted as Marmara Region 83.305 MW, Central Anatolia Region 64.948 MW, Mediterranean Region 23.593 MW, Southeast Anatolia Region 8.966 MW, Black Sea Region 7.731 MW, Aegean Region 6.701 MW and Eastern Anatolia Region 4.421 MW.
Biogas based cogeneration and trigeneration plants can be divided into 3 categories according to biogas production technologies and installed capacities are Landfill Gas 161.598 MW, Raw Material 19.961 MW, Waste Water Treatment 18.106 MW.
2. OPERATION MODES AND SYNCHRONIZATIONThe electrical power generated by a cogeneration or trigeneration plant is utilized in different modes of operation and each has different switchgear design considerations[6].
The most basic is in a stand-alone (island mode) configuration, where the cogeneration or trigeneration plant is the only power source for a facility, or part of a facility. This switchgear design is the simplest, because there is no paralleling between multiple sources required. The generator of the cogeneration or trigeneration plant is connected to the switchgear in a manner similar to any utility source, via a load interrupter switch, a vacuum circuit breaker, or a molded case circuit breaker (MCCB). However, several other
modes of operation require more specialized distribution and control[7].
In standby mode, if any failure occurs related with the grid, the cogeneration or trigeneration plant can be operated as a backup generator. It is considered that cost of a cogeneration or trigeneration plant is much higher than a standby diesel generator, hence it is rare for a cogeneration or trigeneration plant to operate in standby mode[8].
Peak shaving mode can be expressed as, when a facility wishes only to purchase a specific amount of energy from the grid, either for contractual reasons or economic ones, it will use energy from its cogeneration or trigeneration plant to supplement that grid power when its energy needs exceed that which they receive from the grid[7].
In base load mode, a facility will use the energy generated by the cogeneration or trigeneration plant up to its maximum capability and will only use the grid when its needs exceed its plant capacity. It is fundamentally opposite of the peak shaving mode.
In export mode, excess energy generated by the cogeneration or trigeneration plant not needed to serve the facility loads and will be transported back onto the grid.
In any of these applications, the switchgear must be capable of being fed by both the grid and the cogeneration or trigeneration plant. Each of the incoming energy sources are capable of feeding into the switchgear bus at the same time, and because of this there are a number of considerations and capabilities which should be taken into account for the switchgear serving a cogeneration or trigeneration plant.
One such consideration that warrants attention is the type of bussing in the switchgear. If the bus is physically separated into two or more discrete sections for various design reasons (e.g., load distribution), these sections would require connection to each other via a tie circuit breaker. In this example, the main circuit breakers directly upstream from the energy sources are both interlocked with a tie breaker so that the incoming feeds are physically separated at all times. Another possible method of configuring the switchgear to accommodate the multiple source input is paralleling switchgear, in which all incoming sources feed the same physical bus at the same time. To effectively utilize paralleling switchgear, the switchgear must have a synchronizing system that ensures that all generated electric power is operating together at the same rated voltage, frequency, and phase.
In both of these cases, the switchgear and its associated distribution system will feed all downstream loads if sufficient energy is available from a combination of grid and cogeneration or trigeneration plant. Prime mover load control
Figure 3. Regional capacities of biogas engine driven cogeneration and trigeneration plants in Turkey.
Figure 4. Percentile of biogas based plants in Turkey.

93
ICCI 2015 - Bildiriler Kitabı / Proceedings Book
in the switchgear will ensure that power from all sources is balanced and efficient. However, if one of the sources is lost, or for some other reason inadequate energy is generated to serve the facility (e.g., voltage irregularities or low frequency), load shedding will be required to control the ability of the switchgear to drop or shed certain lower priority electric loads.Another capability to be considered in switchgear design includes voltage and reactive power control, which refers to controlling voltage regulation delivered by each energy source and automatic adjustments for varying reactive power levels. Another design consideration for remote overcurrent and protection controls includes either automatic on/off and reset capabilities of overcurrent devices or manual capabilities from a remote location. Each of these key elements of switchgear design should be carefully considered by the designer of the cogeneration or trigeneration plant to ensure maximum optimization and safety of the system.
In the scenario of cogeneration plant shown in Figure 5, an 820 kW generator is coupled via a 1600 A MCCB to synchronization panel of LV (low voltage) switchgear with two 1650 kVA standby diesel generators. In this formation, cogeneration plant operates with the grid in peak shaving mode. For contractual reasons, facility has to purchase 100 kWh energy per hour from the grid, and the rest is produced by the cogeneration plant. Diesel generators run only due to a failure of the grid[1].
In Figure 6, a HV (high voltage) switchgear synchronized gas engine driven trigeneration plant single line diagram is demonstrated. In the scenario of trigeneration plant, a 2100
kW generator is respectively coupled via a 4000 A MCCB and a 0.4/31.5 step-up transformer to synchronization panel of HV switchgear. In this formation, trigeneration plant operates with the grid in export mode. Facility sells surplus energy to the grid.
Consequently, selection of either LV or HV switchgear for synchronization depends on electrical structure and needs for each facility. Basically, for facilities that have several distribution transformers and does not consider feeding a specific one by a cogeneration or trigeneration plant, HV switchgear synchronization is recommended. On the contrary, a facility that has only one distribution transformer or wants to feed a specific bus of a transformer by a cogeneration or trigeneration plant should consider LV switchgear synchronization.
3. CONCLUSIONCogeneration and trigeneration plants generate several energy types simultaneously using a single fuel input, utilize
Figure 5. Single-line diagram of LV peak-shaving mode scenario[1].
Figure 6. Single-line diagram of HV export mode scenario[1].

94
ICCI 2015 - Bildiriler Kitabı / Proceedings Book
higher efficiency ratings compared with conventional plants having separate production, and strengthens its role in Turkey’s energy sector day by day.
Internal combustion gas engines are used in cogeneration and trigeneration plants for rapid operation of synchronization, part load operational flexibility, good load following capability and short payback periods. By January 2015, installed capacity of gas engine driven cogeneration and trigeneration plants exceeds 1 GW in Turkey.
In this paper, fundamentals, grid synchronization of gas engine driven cogeneration and trigeneration plants are described from Electrical and Electronics Engineering’s point of view. Current status of gas engines in Turkey is identified by graphical representation.
ACKNOWLEDGEMENTThe authors gratefully acknowledge the Electrical, Electronics and Informatics Research Group of Scientific and Technological Research Council of Turkey (TUBITAK) for the research project (Project Number: EEEAG - 113E769), and also Scientific Research Project Unit of Çukurova University for the financial support (Project number: FYL-2014-2351).
REFERENCES[1] Zor K., Developing a software program to determine the optimal capacity rating of cogeneration and trigeneration plants driven by gas engines for unlicensed generation of electricity, M.Sc. Thesis, Çukurova University Electrical and Electronics Eng. Dept., 87 p., 2015.[2] Cakir U., Comakli K., Yuksel F., The role of cogeneration systems in sustainability of energy, Energy Conversion and Management, Vol. 63, pp. 196-202, 2012.[3] Chicco G., Mancarella P., From cogeneration to trigeneration: profitable alternatives in a competitive market, IEEE Transactions on Energy Conversion, Vol. 21, pp. 265-272, 2006.[4] Salata F., Vollaro A. D. L., Lietovollaro R. D., Mancieri L., Method for energy optimization with reliability analysis of a trigeneration and teleheating system on urban scale: A case study, Energy and Buildings, Vol. 86, pp. 118-136, 2015. [5] Zor K., Teke A., Onsite Energy production with cogeneration plants driven by reciprocating gas engines. Proceedings of the 1st South East Europe Conference on Sustainable Development of Energy, Water and Environment Systems, Ohrid, Former Yugoslav Republic of Macedonia (FYROM), June 29 - July 3, 2014, SEESDEWES2014.0237, Pages 1-9.[6] Cho W., Kim J., Lee K., Combined heat and power unit capacity for high-heat to power ratio buildings without selling excess electricity to grid, Energy, Vol. 38, pp. 354-361, 2012.
[7] Mamer K. J., Rosenberger D. C., Hankin J. S., Electrical design characteristics and issues, (Meckler M. and Hyman L. B. editors) SUSTAINABLE ON-SITE CHP SYSTEMS: Design, Construction, and Operations, McGraw-Hill Companies Inc., USA, Pages 181-201, 2010.[8] Zor K., Teke A., Pistonlu gaz motorlarıyla tahrik edilen kojenerasyon sistemleri ile yerinde enerji üretimi, 3e Electrotech – Aylık Enerji, Elektrik, Elektronik Teknolojileri Dergisi, Vol. 234, pp. 176-182, Aralık 2013.
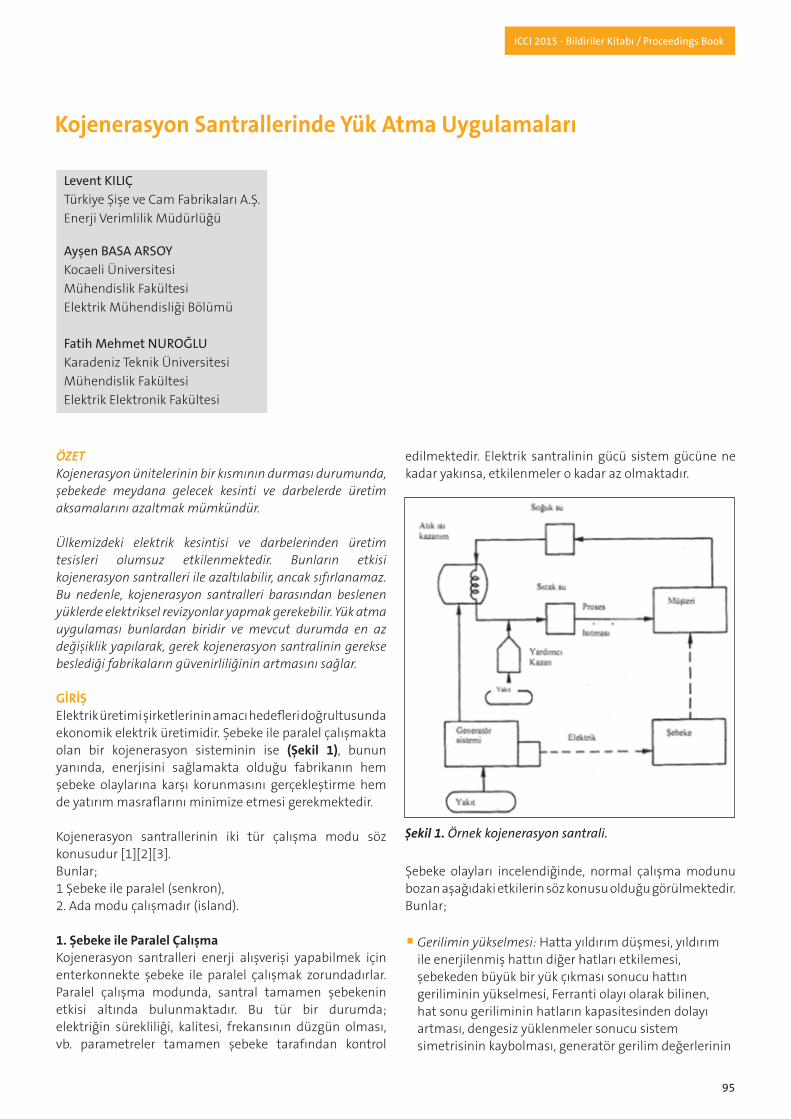
95
ICCI 2015 - Bildiriler Kitabı / Proceedings Book
ÖZETKojenerasyon ünitelerinin bir kısmının durması durumunda, şebekede meydana gelecek kesinti ve darbelerde üretim aksamalarını azaltmak mümkündür.
Ülkemizdeki elektrik kesintisi ve darbelerinden üretim tesisleri olumsuz etkilenmektedir. Bunların etkisi kojenerasyon santralleri ile azaltılabilir, ancak sıfırlanamaz. Bu nedenle, kojenerasyon santralleri barasından beslenen yüklerde elektriksel revizyonlar yapmak gerekebilir. Yük atma uygulaması bunlardan biridir ve mevcut durumda en az değişiklik yapılarak, gerek kojenerasyon santralinin gerekse beslediği fabrikaların güvenirliliğinin artmasını sağlar.
GİRİŞElektrik üretimi şirketlerinin amacı hedefleri doğrultusunda ekonomik elektrik üretimidir. Şebeke ile paralel çalışmakta olan bir kojenerasyon sisteminin ise (Şekil 1), bunun yanında, enerjisini sağlamakta olduğu fabrikanın hem şebeke olaylarına karşı korunmasını gerçekleştirme hem de yatırım masraflarını minimize etmesi gerekmektedir.
Kojenerasyon santrallerinin iki tür çalışma modu söz konusudur [1][2][3]. Bunlar; 1 Şebeke ile paralel (senkron),2. Ada modu çalışmadır (island).
1. Şebeke ile Paralel ÇalışmaKojenerasyon santralleri enerji alışverişi yapabilmek için enterkonnekte şebeke ile paralel çalışmak zorundadırlar. Paralel çalışma modunda, santral tamamen şebekenin etkisi altında bulunmaktadır. Bu tür bir durumda; elektriğin sürekliliği, kalitesi, frekansının düzgün olması, vb. parametreler tamamen şebeke tarafından kontrol
edilmektedir. Elektrik santralinin gücü sistem gücüne ne kadar yakınsa, etkilenmeler o kadar az olmaktadır.
Şebeke olayları incelendiğinde, normal çalışma modunu bozan aşağıdaki etkilerin söz konusu olduğu görülmektedir. Bunlar;
• Gerilimin yükselmesi: Hatta yıldırım düşmesi, yıldırım ile enerjilenmiş hattın diğer hatları etkilemesi, şebekeden büyük bir yük çıkması sonucu hattın geriliminin yükselmesi, Ferranti olayı olarak bilinen, hat sonu geriliminin hatların kapasitesinden dolayı artması, dengesiz yüklenmeler sonucu sistem simetrisinin kaybolması, generatör gerilim değerlerinin
Kojenerasyon Santrallerinde Yük Atma Uygulamaları
LeventKILIÇTürkiye Şişe ve Cam Fabrikaları A.Ş.Enerji Verimlilik Müdürlüğü
AyşenBASAARSOYKocaeli Üniversitesi Mühendislik FakültesiElektrik Mühendisliği Bölümü
FatihMehmetNUROĞLUKaradeniz Teknik Üniversitesi Mühendislik FakültesiElektrik Elektronik Fakültesi
Şekil 1. Örnek kojenerasyon santrali.

96
ICCI 2015 - Bildiriler Kitabı / Proceedings Book
uyarma hızı, sistemleri, vb. nedenlerinden dolayı artması, aşırı kompanzasyon, vb. gibi benzeri nedenler,• Gerilimin düşmesi: Devreye büyük bir yük bağlanması, sistem empedans değerlerini değiştirecek şekilde kısadevreler.
2. Ada Modu ÇalışmaAda modunda çalışma, sistemden ayrı, kendi şartlarınızla çalışma durumudur. Ada modunda, şebekedeki olaylardan etkilenme söz konusu olmayacaktır. Ancak bu modun da, kendine göre eksiklikleri vardır. Bunlar; ada modunda çalışırken sistemin durmasına yol açacak bir arıza oluştuğunda, bu esnada şebekede hiçbir sorun olmasa dahi, beslenmekte olunan sistem etkilenecektir. Ayrıca, şebeke ile enerji alışverişi de söz konusu olmayacaktır.
Şebekenin kararlı çalışma durumu bozulduğunda, bununla paralel çalışan kojenerasyon sistemi röle değerleri doğrultusunda şebekeden ayrılmakta ve ada modunda çalışmaya devam etmektedir. Ada modunda çalışmaya başladıktan sonra, üretilen aktif ve reaktif güçle, tüketilenin eşit olması gereklidir (Şekil 2). Şebeke enerjisinin olmadığı durumda bir ya da (n-1) sayıdaki ünitenin devre dışı olması durumunda, tüketimle üretimi dengelemek zorunluluğu doğar. Bu yük değişimi, ufak salınımlar için önemli
olmayabilir. Ancak, bara frekansının %90. Nf değerlerine inmesi kojenerasyon sistemi için büyük sıkıntılar doğurur. Genellikle de, eğer yük atma uygulaması yoksa, sistemin tamamının enerjisiz kalmasına yol açabilir. Bu nedenle, kojenerasyon tesislerinden beslenen fabrikalarda, şebeke enerjisinin gitmesi durumunda tamamen durmak ile yük atma sistemi kurarak belirli yüklerin devreden çıkarılması arasındaki fark iyi değerlendirilmelidir (Şekil 3). Aynı zamanda ada modunda düşük frekans ile çalışılırsa, şebekeye tekrar senkronizasyon sorunları da yaşanacaktır.
Sorunu, (Ada modunda iken) frekans için yakıt miktarını, gerilim ayarı için ise uyartım akımını artırmakla manuel olarak da gidermek mümkündür. Ancak, gerek arızanın çok kısa sürede anlaşılması gerekse derhal karar verip uygulama ve tepki alma, otomasyon sistemi kadar hızlı olamamaktadır.
Uygulamada dikkat edilmesi gerekenler aşağıda tanımlanmaktadır:
1) Maksimum aşırı yükAslında bunun için bir sınır yoktur. Teorik olarak %100’e kadar yük atma sağlanabilir. Makinelerin yük/frekans eğrisine göre ayarlama yapılabilir.
2) Yük atma kademe sayısı ve kademelerdeki yük miktarlarıBunun için en basit yol, önceden bir yük yüzdesi saptamak ve bir grup röleye bunu frekans düşmesi olarak göndermektir.
3) Frekans ayarlarıΔP yükü belirlenerek, df/dt hesaplanır. Makinelerin entegre=stabil (isochronous) ya da orantısal (speed droop) yük/hız karakteristiklerine dikkat edilmesi gerekir.
Burada; df/dt= frekansın birim (p.u.) değişimi, ΔP= birim yük değişimi, H= eylemsizlik sabitini (kWs/kVA) göstermektedir.
4) Zaman ayarı (ya da gecikmesi)Düşük gecikmeli röle kullanımı, aşırı yüklerin daha kısa sürede devreden çıkmasını sağlayacaktır.
5.1) Frekans rölelerinin yerleşimiBazı yüklerin frekans düşmesine etkisi daha fazla olabilir. Yerleşim bu nedenle önemlidir.
5.2) PLC çözümleriUygun seçim uygulanarak, PLC çözümü de uygulanabilir. Çabuk değişiklikler bakımından da uygun çözüm olacaktır (Şekil 4).
Şekil 2. Aktif / Reaktif güç akışı.

97
ICCI 2015 - Bildiriler Kitabı / Proceedings Book
Yük atma sisteminin uygulandığı yüklerin seçilebilir olması da bakım yönetimi için önemlidir. Bakımda olan tesis makinelerinin geçici de olsa yük atma sistemine dahil edilmesi ile, diğer makinelerin devredışı edilmesi engellenir.
TOPKAPI ELEKTRİK SANTRALİNDE YÜK ATMA UYGULAMASI12,2 MW kurulu gücünde olan işletme, barasından doğrudan yaklaşık 8,5 MW’lık yükü beslemektedir. İşletme
iki eşdeğer üniteden oluşmaktadır. Tek ünite çalışma durumunda yük atma uygulamasının kaçınılmaz olduğu görülmektedir.
2001-2005 arası şebeke ve işletme duruş istatistikleri çıkarıldığında şöyle bir tablo oluşmaktadır:
Tablo 1’i gören şebeke rölesinin ayar değerleri Tablo 2’deki gibidir:
Röle ayar değerlerinin dışındaki şebeke olaylarından yükler etkilenmediği için, bunlar kaydedilmemiştir.
Kojenerasyon ünitelerinin bu beş yıllık dönem içerisindeki toplam duruşları Tablo 3’te görülmektedir:
Bu duruşlar;• Planlı bakım, • Kestirimci bakım, • Arıza duruş ve bakımı,• Test ve ölçüm duruşları, • Yedek parça, servis bekleme,• Müşteri talepleri, • Gaz kesilmesi, • Grev, vb. gibi nedenlerden oluşmaktadır.
Tablolardan duruş sayısı azaldıkça, doğal olarak buna denk gelen yük atma durumunun da azaldığı görülmektedir.
Şekil 3. Yük atma şeması.
Şekil 4. Yük atma uygulaması.
Tablo 1. Şebeke Olay Sayısı (Sayı Olarak)
Tablo 2. Şebeke Rölesi Ayar Değerleri
Tablo 3. Kojenerasyon Ünitelerinin Duruş Değerleri (Yüzdesel)

98
ICCI 2015 - Bildiriler Kitabı / Proceedings Book
Ancak yapılacak çok basit ve ucuz yük atma uygulaması ile bunu da sıfıra yaklaştırmak mümkün olabilecektir. Ayrıca daha hassas yük durumlarında zararın çok daha büyük olacağı düşünülmelidir.
SONUÇ VE ÇÖZÜM ÖNERİLERİTopkapı Elektrik Santrali’nde röle yerine PLC uygulaması seçilmiştir (Şekil 4). Özellikle kış aylarına denk gelen duruşlarda, şebeke olaylarında %5-10 arası ilave koruma sağlandığı görülmektedir.
Fabrikaların teknik altyapısına göre uygulama tercih edilmelidir.
KAYNAKLAR[1] Özkaya M., Yüksek Gerilim Tekniği 2, İstanbul Teknik Üniversitesi, İstanbul, 1988.[2] Mahon L.L.J., Diesel Generator Handbook, Butterworth Heinemann, Oxford, 2003.[3] Blackburn J. L., Protective Relaying Principles and Applications, Marcel Dekker, New York, 1998.
SUMMARYWhen one of the units of a cogeneration power plant stops, the load of the busbar can be selectively reduced to last consumption. Grid failures really affect productions of factories and power plants. These impacts can be reduced by cogeneration power plants. It is possible to make load shedding in case of unit(s) loss. This way, the reliability of the production phase is increased.

99
ICCI 2015 - Bildiriler Kitabı / Proceedings Book
ÖZETÜlkemizin artan elektrik enerjisi ihtiyacı ve özelleştirme çalışmaları sonrasında, ulusal şebekeye yeni bağlanan ve işletmeciliği değişmiş özel sektör elektrik santrallerinin sayısı gün geçtikçe artmaktadır. Büyük güçteki bu santrallerin şebekedeki etkileri de büyük olmaktadır. Santrallerin şebekeye bağlanması için gerekli hesaplamalar daha çok ekipmanların seçiminde ve korumaların hangi değerlere göre ayarlanacağının belirlenmesinde rol oynamaktadır. Ekipmanlar doğru seçilse de bazı özelliklerinin zamanla kaybolması mümkündür. Bu nedenle şebeke güvenilirliği kendine doğrudan bağlanmış bu ekipmanların doğru kurulum ve işletmeciliğinden doğrudan etkilenmektedir. Santrallerde, gerekli elektrik bakımlarında yapılacak işlerin standartlaştırılması, çok çeşitli çalışma koşullarını haiz ve çeşitlilik arz eden bu tür özel sektör santrallerinde yapılacak işlerin münferitlikten kurtarılmasını sağlayacaktır. Bakımlar, özellikle bağlandıkları sistemin frekans, gerilim ve güvenirlilik kalitesini etkiledikleri için, tüm katılımcıların standart uygulaması önem taşımaktadır.
1. GİRİŞBildiride, 154 kV enerji iletim hattı ile enterkonnekte sisteme bağlanan bir (doğal gaz) termik santralinde, şebeke kriterleri ve santral gereksinimleri doğrultusunda yapılması gereken şalt sistemi bakımlarının standartlarının belirlenmesi ve buna göre uygulanması incelenecektir.
Elektrik santralleri, temel olarak mekanik (türbin – generatör) ve elektrik (yüksek gerilim şalt sistemi) sisteminden oluşan pahalı yatırımlardır. Santralin öncelikle ekipman kaybına kadar ulaşan plansız duruşlarının azaltılması, bakım maliyetlerinin düşürülmesi ve iş emniyeti için, ilave olarak ise çalışan moralinin
artırılması, üretimin istenildiğince gerçekleştirilmesi ve de iyileştirmeler için planlı bakımların yapılması gereklidir.
Ulusal şebekeye bağlanan santrallerin sayısı her geçen gün artmaktadır. Ulusal şebekeye bağlanmak için gereken şartlar [1][2][3][4]de verilmiştir. Bunlara göre yapılan hesaplar, bağlantı için gereken ekipmanların doğru seçimini sağlayacaktır. Ancak işletmeye alındıktan sonra bunların etkin işletmeciliği için gereken bir koşul bulunmamaktadır.
Şalt sistemi primer ve sekonder sistem olmak üzere iki kısma ayrılabilir (Şekil 1). Primer ekipmanlar olarak kesici, ayırıcı, transformatör, vb., sekonder ekipmanlar olarak ise koruma ve ölçme/izleme sistemleri tanımlanmaktadır[5].
Şebeke güç kalitesini doğrudan etkileyen sekonder bakımlar için, TEİAŞ tarafından uygulanmakta olan ve özel sektöre de önerilen bakım talimatları mevcuttur[6].
Bakım yapacak ekibin, özellikle ilgili standartlara uyması ve uygulatması zorunluluk olmalıdır. Uygulama bakımından ilgili bakım/test standartları (Tablo 1) oluşturulmuştur[7][8].
Şebeke güç kalitesi frekans, gerilim ve güvenilirlik kriterlerinden oluşmaktadır. Şebeke Yönetmeliği’nin 2009 yılından itibaren uygulanmaya başlanan Yan Hizmetler Yönetmeliği kapsamında, frekans ve gerilim kontrolüne sürekli katılım sağlanmakta, toleransların dışına çıkanları ağır cezalar beklemektedir. Buna uyma durumu anlık olarak da raporlanmaktadır. Bir uyumsuzluk olmasa dahi belli periyotlarla, akreditasyon yetkisi olan bağımsız şirketlerce test yapılması da istenmektedir.
Özel Sektör Elektrik Santrallerinde 154 KV Şalt Bakımlarının Standartlaştırılması
LeventKILIÇTürkiye Şişe ve Cam Fabrikaları A.Ş.Enerji Verimlilik Müdürlüğü
AyşenBASAARSOYKocaeli Üniversitesi Mühendislik FakültesiElektrik Mühendisliği Bölümü
FatihMehmetNUROĞLUKaradeniz Teknik Üniversitesi Mühendislik FakültesiElektrik Elektronik Fakültesi

100
ICCI 2015 - Bildiriler Kitabı / Proceedings Book
Frekans ve gerilim kadar önemli olan ve hatta onları doğrudan etkileyen santral periyodik bakımlarının da, her ne kadar işletmelere başlangıçta ağır yükler getirse de, aynı yöntemle kontrol altına alınmasına gerek duyulmaktadır. Bakım şirketlerinin de akredite süreç ve koşullarını sağlamaları gereklidir.
2. UYGULAMA ÖRNEĞİBurada standart hale gelmiş 154 kV sistemden ulusal şebekeye bağlanan 252 MW’lık kojenerasyon santraline ait şalt sahası bakımları standardize edilecektir.
2.1. Bakım PlanlamasıBakımlar, getirisi doğrudan görülemediği için gereksiz masraf gibi görünebilir. Oysa bu, sigorta gibidir. Özellikle elektrik ile ilgili personelin, elektrik ile ilgili bakımların önemini bilmesi ve yetkililere doğru aktarabilmesi gerekmektedir. Bakımın planlanmasında; sürekli üretimin gerekliliği, ekipmanın bakımı mı yoksa arıza nedeniyle değişiminin mi tercih edileceği, bunların karşılaştırmalı maliyetleri, öncelikleri, bakım ekibinin seçimi, yapılan işlerin onayı, raporlanması, daha sonrasında periyodik takibi önemlidir.
2.1.1. Sorumlulukların belirlenmesiBakım yapacak ekibin, saha sorumlusunun, özellikle şalt bakımlarında manevra yapacak TEİAŞ personelinin ve bağlı bulunulan Yük Tevzi Sistemi ilgililerinin, karşılıklı tam uyum içerisinde hareket etmesi gerekmektedir. Özellikle kısmi enerjili sahalarda yapılan bakımlarda, saha sorumlusunun iş süresince işin başında olması hayati önem taşımaktadır. 2.1.2. Zaman planlamasıZaman, gerek ekipmanların çalışma koşullarına, gerek ekonomik ömürlerine ve gerekse şebeke ve işletme şartlarının kesiştiği noktada yapılmalıdır.
2.1.3. İş planlamasıÖzellikle teknik işlerde, yapılan işin teknik değerlerinin verilmesi önemlidir. Bu değerlerin üretici verileriyle, işletme koşullarında maruz kaldığı durumun karşılaştırılması önemlidir. Sayısal yapılmayan, görülmeyen bakımların teknik anlamda geçerliliği olmayacaktır.
2.1.4. KayıtKolay ulaşılabilir ve anlaşılabilir formlar her zaman fayda sağlayacaktır. Kayıtlar düzenli ve standart oluşturulmalıdır.
2.2. Teknik Gereklilikler
2.2.1 Saha projeleriSaha projelerinin güncel olması gerekmektedir. Güncel olmayan, sadece belli kişilerin bildiği, fakat revize edilmemiş projelerde, telafisi zor can ve mal kaybına neden olacak olaylar yaşanabilecektir (Şekil 2).
2.2.2. Ekipmanların listelenmesiElektrik sistemi bir santralin şebekeye bağlantısındaki en hayati yerdir. Bu sistemin aksaması doğrudan santralin aksamasına yol açacaktır. Bu sistemde yaşanabilecek bir arızanın etkisi doğrudan diğer santral ekipmanlarının da olumsuz etkilenmesine yol açacaktır. Bu nedenle
Şekil 1. Primer / Sekonder sistem.
Tablo 1. Bakım/Test Standartları

101
ICCI 2015 - Bildiriler Kitabı / Proceedings Book
ekipmanların eksiksiz listelenmesi ve önem derecesine göre bakım programına alınması gerekmektedir (Tablo 2)[9].
2.2.3. Periyodu etkileyen çevre koşullarıSantralin bulunduğu noktanın, ekipmanların ömürlerine doğrudan etkisi bulunmaktadır. Bu nedenle her santralin bakım periyodu aynı olmayacaktır.
Santralin çalışma durumları (tam yük, kısmi yük, gece durma, vb.), şebekede yaşanan olayların etkileri, santral personelinin tecrübeleri, bölge sistem yöneticisinin önerileri, diğer santrallerden elde edilebilecek veriler, daha etkin bir sistemin kurulmasına olanak sağlayacaktır.
3. SONUÇ VE ÖNERİLERŞebeke güvenilirliğinin artırılmasında özel sektör santrallerinin önemli etkisi bulunmaktadır. Bu nedenle santrallerdeki bakımların standartlaştırılması önemlidir.Bu standartlaşmanın Yan Hizmetler Yönetmeliği kapsamında yapılmasının etkili olacağı düşünülmektedir.Bakım yapacak şirketlerin akreditasyon sürecinden geçerek yetkilendirilmeleri önemlidir. Bu özel sektörün seçim kriterlerine de kolaylık sağlayacaktır.Santrallerde, sürekli güncel projeler tutulması gerekmektedir.
KAYNAKLAR[1] 26.11.2009 Tarihli ve 27418 Sayılı Elektrik Piyasası Şebeke Yönetmeliği.[2] 16.12.2009 Tarihli ve 27434 Sayılı Elektrik Tesisleri Proje Yönetmeliği.
Şekil 2. Tek hat diyagramı.
Tablo 2. Bakım Listesi

102
ICCI 2015 - Bildiriler Kitabı / Proceedings Book
[3] 13.05.2010 Tarihli ve 27580 Sayılı Elektrik Piyasası Yan Hizmetler Yönetmeliği.[4] 10.11.2004 Tarihli ve 25639 Sayılı Elektrik İletim Sistemi Arz Güvenilirliği ve Kalite Yönetmeliği.[5] Kaempfer S., Kopatsch G., Switchgear Manual, ABB AG, Germany, 2012.[6] www.teias.gov.tr [7] www.iec.ch [8] www.ieee.org [9] Şişecam Mersin Cogeneration Powerplant Data.
SUMMARYPower plants are expensive investments. As they will be connected to the national grid, their impacts need to be well analyzed. The maintenance on power plants occurs periodically. As the increase of power plants connected to national grid and the change in marketing conditions such as time sequence to have an active role may require an additional machine to the existing structure.
Obtaining the correct procedure from the grid and power plant itself and also running them correctly in coordination will increase the accuracy and efficiency of the maintenance. Failure to do so can not be corrected due to the change in structure, even if it is technically possible. In addition, the system operator by the grid side bring strict rules that have to be obeyed by the plant operator.
Prosedures have to be obeyed by all power plants in the same way. Grid connection criterias have to be applied and standartized for all items. This will not only provide more reliability but also less faults.
Although some studies are available on maintenance of generating units connected to high voltage level, the private sector contribution to the literature is not enough. This study is based on execution of international standards in practice.

103
ICCI 2015 - Bildiriler Kitabı / Proceedings Book
ÖZETTürkiye, kısıtlı enerji kaynakları nedeniyle enerji ihtiyacının önemli bir kısmını ithal kaynaklardan karşılamaktadır. Enerjide dışa bağımlılığı oldukça yüksek olan ülkemizde, yerli üretimin tüketimi karşılama oranı ise hayli düşüktür. Bu çalışmada, 2008-2014 yılları arasında Türkiye’nin doğal gaz tüketimi günlük, haftalık, aylık, mevsimlik ve yıllık bazda analiz edilmektedir. Ulaşılan sonuçlarla, ithalat bağımlılığı, iletim hatlarının kapasitesi, elektrik üretiminde doğal gaz yakıtlı santrallerin oranı, depolama tesislerinin kapasiteleri vb. bileşenler değerlendirilmektedir. Bu bağlamda, doğal gaz arzı değer zincirinde yaşanabilecek darboğazların önüne geçilmesi ve kısa dönemli arz kesintilerinin en aza indirgenerek Türkiye doğal gaz arz güvenliğinin sağlanmasına katkı sağlayacak argümanlar belirlenerek irdelenmektedir.
1. GİRİŞToplumlar ve toplumları oluşturan bireylerin varlıklarını sürdürebilmeleri için gerekli olan gıda ve temiz suyun temini, yaşam standartlarını iyileştirme eğiliminin bir sonucu olarak karşımıza çıkan sanayileşme, kentleşme ve teknolojik gelişmeler, temel ihtiyaçların karşılanmasının başka bir temel ihtiyaç olan enerji ile mümkün olduğu gerçeğini gün yüzüne çıkarmaktadır[1-4].
Enerjiye erişim, temel ihtiyaçları karşılama güdüsünün bir sonucu olan toplumsal ve sosyal boyutunun yanı sıra, ülkelerin iç ve dış politikalarına yön veren, siyasi dengelerin enerji zengini ülkelerin lehine değiştiği küresel, politik bir mesele olarak karşımıza çıkmaktadır. Bu durum, ülkelerin enerji kaynak tedariğinde usul farklılıklarını da beraberinde getirmektedir. Ülkeler, tarımdan endüstriye, iklimlendirmeden ulaşıma kadar hayatın her alanında kritik öneme sahip olan enerjiyi temin etmek, nüfus, ekonomi ve gelişmişlik düzeyleriyle doğru orantılı olarak değişkenlik gösteren enerji ihtiyaçlarını karşılayabilmek adına kaynak arayışına girmiş bulunmaktadırlar.
Enerji, mevsim ve gece-gündüz fark etmeksizin her daim önde gelen bir gereksinim durumundadır. Bu nedenle,
enerji üretiminin sürekli ve güvenilir olması öncelik arz etmektedir. Kesintisiz ve güvenilir enerji temini dendiğinde, “emre amadelik” kavramı ön plana çıkmaktadır. Sözlük anlamıyla emre amadelik, verilen bir komutun her an yerine getirilebilir olması demek iken, enerji üretimi için emre amadelik, enerji santrallerinin herhangi bir anda üretimde olma veya üretime hazır olması anlamına gelmektedir[5][6]. Pratikte emre amadelik, kapasite faktörü ile de ifade edilebilmektedir ve enerji santralleri mukayesesinde önemli bir kavram durumundadır. Kapasite faktörü, “belli bir zaman aralığı için, bir santralin üretmiş olduğu elektrik enerjisinin, santralin o zaman diliminde üretebileceği maksimum enerji miktarına oranıdır” şeklinde tanımlanabilmektedir[7].
Tablo 1’de görüldüğü üzere, (karbon yakalama ve tutma teknolojili) kömür santralleri, doğal gaz kombine çevrim santralleri ve nükleer santrallerin kapasite faktörleri %85 mertebesindedir. Ancak bu santraller, ortalama gecelik maliyet, ortalama kurulum ve kullanım süresi, işletme ve bakım maliyetleri vb. özellikleri ile birbirlerinden oldukça farklılaşmaktadırlar. Doğal gaz kombine çevrim santralleri, kömür ve nükleer santrallere kıyasla, hem ortalama gecelik maliyet hem de işletme ve bakım maliyetleri açısından oldukça avantajlıdır. Ayrıca, doğal gaz santrallerinin ortalama kurulum süresi, kömür santrallerinin yarısı, nükleer santrallerin ise üçte birinden daha az olmaktadır. Bu bağlamda, doğal gaz kullanımı dünyada giderek yaygınlaşmaktadır.
Doğal gaz piyasası gün geçtikçe daha küresel bir yapıya ulaşmaktadır. Gelişen ekonomiler ve artan enerji talebi doğal gaz ihtiyacını artırmakta ve yeni rezervuarların bulunmasını teşvik etmektedir. 2040 yılı projeksiyonlarına göre, enerji arzındaki en büyük büyümenin doğal gazdan gelmesi beklenmektedir. Çok amaçlı kullanımı, ekonomik oluşu ve elektrik üretimi amaçlı kullanımında kömüre kıyasla %60 daha az CO2 salımına sebep olması nedeniyle doğal gazın, enerji kaynakları içerisindeki öneminin giderek artması beklenmektedir. Ayrıca, teknolojik gelişmelerle birlikte yeni bulunan konvansiyonel ve konvansiyonel
Türkiye’de Doğal Gaz Tüketiminin İncelenmesi ve Farklı Yönlerden İrdelelenmesi
M.AyşeYIKILMAZİstanbul Teknik ÜniversitesiEnerji Enstitüsü
A.BerilTUĞRULİstanbul Teknik ÜniversitesiEnerji Enstitüsü

104
ICCI 2015 - Bildiriler Kitabı / Proceedings Book
olmayan gaz rezervlerinin piyasalara girişiyle, küresel enerji arzının piyasalardaki rekabetinin artması ve fiyat politikalarının değişmesiyle bölgeler arası fiyat farklarının azalması beklenmektedir[8][9]. Bu durumda, doğal gazın yirmi birinci yüzyılda etkinliğini artırarak enerji politikaları ve enerji planlamalarında yerini alması beklenmektedir.
2. TÜRKİYE’DE DOĞAL GAZ Artan nüfusu ve büyümekte olan ekonomisi ile enerji talebi her geçen gün daha da artan Türkiye, kısıtlı enerji kaynakları nedeniyle enerji ihtiyacının önemli bir kısmını ithal kaynaklardan karşılamaktadır. Enerjide dışa bağımlılığı oldukça yüksek olan ülkemizde, yerli üretimin tüketimi karşılama oranı ise hayli düşüktür. Şekil 1’de, Türkiye’de enerji üretiminin yıllara göre tüketimi karşılama oranı görülmektedir[11]. Bu durum, Türkiye’nin enerjide giderek dışa bağımlılığının arttığını göstermektedir.
Şekil 2’de, Türkiye doğal gaz tüketiminde yerli üretimin payı ve gelişimi gösterilmiştir. Şekil 2’den de anlaşılacağı üzere, yerli üretimin tüketimi karşılama oranı oldukça düşüktür ve bu sebeple Türkiye, doğal gaz ihtiyacının neredeyse tamamını ithalat ile karşılamaktadır.
Doğal gazın Türkiye’nin enerji ihtiyacını karşılamadaki önemi oldukça büyüktür. Bu bağlamda doğal gazın enerji arz güvenliğinin sağlanmasındaki rolü de yadsınamaz derecede fazladır. Jeopolitik ve konjonktürel gelişmelerden kolayca etkilenen doğal gaz arzının kesintisiz ve güvenilir bir şekilde devam edebilmesi adına Türkiye, dünyanın önemli bazı doğal gaz ihracatçılarıyla doğal gaz alım
anlaşmaları imzalamıştır. Tablo 2’de mevcut doğal gaz alım anlaşmaları verilmektedir.
2014 yıl sonu itibariyle kaynak bazında kurulu güç oranlarına bakıldığında, doğal gaz santrallerinin 21.476 MW ile Türkiye’nin toplam kurulu gücünün yaklaşık üçte birini oluşturduğu görülmektedir. Doğal gaz tüketiminin yaklaşık %46’sı ise elektrik üretiminde kullanılmaktadır[12]. Şekil 3’te Türkiye doğal gaz kurulu güç gelişimi görülmektedir.
Doğal gazın, ithalat oranları, toplam kurulu güçteki ve elektrik üretimindeki payı, evsel kullanım, ısınma, ulaşım vb. nihai tüketim alanlarının çeşitliliği, yatırım maliyetlerinin ve amortisman sürelerinin görece düşük olması ülkemizin gerçeklerini oluşturmaktadır. Bu bağlamda, değinilen hususlarla beraber komşu ülkelerdeki rezerv bolluğu vb. sebepler dikkate alındığında, doğal gazın Türkiye enerji sektörü ve ülke ekonomisi içindeki yeri
Tablo 1. Enerji Kaynaklarına Göre Santral Özellikleri[10]
Şekil 1. Türkiye’de enerji üretiminin yıllara göre tüketimi karşılama oranı[11].
Tablo 2. Doğal Gaz Alım Anlaşmaları[13]
Şekil 3. 2014 yıl sonu itibariyle Türkiye doğal gaz kurulu güç gelişimi (MW) [12][14].
Şekil 2. Türkiye doğal gaz tüketiminde yerli üretimin payı ve gelişimi (milyon metreküp)[12].
*Karbon yakalama ve tutma teknolojisi ile.**Karadaki (onshore) rüzgâr santralleri.
* 9000 kcal/m³ ısıl değer baz alınmıştır.

105
ICCI 2015 - Bildiriler Kitabı / Proceedings Book
hayli kritiktir. Ülkemizin, özellikle elektrik üretiminde artan doğal gaz talebini karşılayabilmek için komşu ve çevre ülkelerdeki kaynaklardan faydalanabilmesi, kesintisiz ve güvenilir doğal gaz arzı sağlayabilmesi, enerji arz güvenliği açısından önem taşımaktadır.
Ülkemizin doğal gaz ithal ettiği ülkeler içerisinde en büyük paya sahip olan ülke Rusya’dır. Arz güvenliğinin sağlanmasında kaynak ülke çeşitliliği oldukça önemlidir ve ithalatta Rusya’nın payı arz güvenliği için ciddi bir risk teşkil etmektedir. Bu bağlamda, farklı ihracatçı ülkelerin değerlendirilip, yeni alım anlaşmaları ve uluslararası projelerle hem kaynak ülke sayısının artırılması hem de ülkelere olan bağımlılık oranlarının azaltılması arz güvenliğinin tesis edilmesi yolunda atılacak önemli adımlar olacaktır. Şekil 4’te, 2013 yıl sonu itibariyle kaynak ülkeler bazında Türkiye’nin doğal gaz ithalat payları gösterilmiştir.
Doğal gaz tüketiminin yüksek olduğu kış aylarında ve elektrik üretiminde doğal gaza olan talebin yaz aylarında aşırı artışında, kısa süreli veya dönemsel doğal gaz arz açığı oluşabilmektedir. İthalat kesintileri, ani talep artışları, boru hatlarındaki bakımlar gibi sebeplerden dolayı yaşanabilecek arz açıklarını tolere etmede ve tüketiciye yansımalarını en aza indirmede spot piyasadan arz açığını telafi edecek miktarda yapılan LNG ithalatı ve doğal gaz depolama tesisleri kilit öneme sahip olmaktadır.
3. TÜRKİYE DOĞAL GAZ TÜKETİMİNİN İRDELENMESİBu çalışmada, 2008-2014 yılları arasında Türkiye’nin doğal gaz tüketiminin günlük, aylık, mevsimlik ve yıllık bazda irdelemesi yapılmaktadır[4]. İncelenen son 7 yıl için yıllık doğal gaz tüketimi (365 güne ilişkin verilerden hareketle) mukayesesi Şekil 5’te görülmektedir.
İncelenen son 7 yıl için yıllık toplam doğal gaz tüketimi (aylık bazda) mukayeseli grafik olarak Şekil 6’da, aylık bazda günlük ortalama bağlamında Şekil 7’de görülmektedir.
Yıllara göre ilkbahar, yaz, sonbahar ve kış mevsimlerine göre toplam doğal gaz tüketimlerine ilişkin mukayeseli değerlendirme grafikleri Şekil 8’de verilmektedir.Şekil 4. 2013 yılı kaynak ülkeler bazında Türkiye’nin doğal
gaz ithalatı[15]
Şekil 8. Mevsimlere göre toplam doğal gaz tüketimi mukayesesi (Sm3) (2008-2014).
* Spot LNG ithalatının yapıldığı ülkeleri temsil etmektedir.
Şekil 5. Yıllara göre günlük doğal gaz tüketimi karşılaştırması (Sm3/gün).
Şekil 6. Yıllık toplam doğal gaz tüketiminin aylık bazda mukayese grafiği (Sm3) (2008-2014).
Şekil 7. Yıllık doğal gaz tüketiminin aylık bazda günlük ortalama olarak mukayese grafiği (Sm3/gün) (2008-2014).
106
ICCI 2015 - Bildiriler Kitabı / Proceedings Book
4. SONUÇTürkiye’nin emre amade enerji kaynakları ve kurulu santral gücü içinde yadsınamaz bir yere sahip olan doğal gazın önemi, tüm incelemelerde kendini göstermektedir. Ancak, Türkiye’nin enerji kaynaklarında dışa bağımlılığını, özellikle Rusya bazında artırdığı da bir gerçek olarak karşımıza çıkmaktadır. Bu bağlamda, ülkenin bütçe açığında, doğal gaz ithalatının önemli bir yer tuttuğu da kendini göstermektedir. Türkiye’nin doğal gaz ithalatına bakıldığında ise, beklenti doğrultusunda kış aylarında tüketimin daha yüksek ve buna karşın yaz aylarında daha düşük bir talebin olduğu görülmektedir. Bununla beraber, aradaki fark nisbi olarak çok da büyük değildir. Bu husus, emre amade baz santralleri arasında doğal gaz santrallerinin yer alıyor olmasından kaynaklanmaktadır denebilir. Ayrıca, doğal gaza olan bağımlılığın azaltılması hedeflenmesine karşın, son 7 yıla ilişkin tüm tüketim verilerinde, söz konusu bu süreçte, doğal gaz tüketiminde artış trendi farkedilmektedir. Öz olarak ifade edilmek istenirse; ülkemiz için öz kaynak payı çok düşük olmasına karşın doğal gazın, tüketimde gösterdiği artış trendi ve tercih edilirliği, yakın ve orta vadeli gelecekte etkinliğini koruyacağını göstermektedir.
KAYNAKLAR[1] Tugrul A.B., “Energy Policy and Interactions with Politics and Economics”, International Conference on Energy Environmental Engineering - ICEEE 2014, Proc. pp. 801- 804, 21-22 November 2014, Paris-France.[2] Tugrul A.B., Cimen S., “Energy Initiatives for Turkey”, International Conference on Economics and Econometrics - ICEE 2013, Proc. pp. 40-44, 2-3 December 2013, Dubai-BAE.[3] Tuğrul A.B., “Türkiye’nin Enerji Açılımları”, 15. Uluslararası Enerji ve Çevre Konferansı ICCI-2009 Bildiri Kitabı, s: 15- 17, 13-15 Mayıs 2009, İstanbul.[4] Yıkılmaz M.A., “Türkiye Doğal Gaz Tüketimi Değerlendirmesi”, İTÜ Enerji Enstitüsü, Yüksek Lisans Tezi 2015 (Teslim aşamasındadır).[5] Engin B., Tuğrul A.B., “Evaluation of Natural Gas Supply Security in Turkey with Future Projection”, “Journal of Energy and Power Engineering, Vol. 8, No 7, pp. 1237-1245, July 2014.[6] Engin B., Tugrul A.B., “Supply Security of Natural Gas in Turkey and SWOT Analysis”, The International Conference on Water, Energy and Environment (ICWEE’2013), CD, Proc. 87/1-10, 21-24 Sept. 2013, Kuşadası-Turkey.[7] U.S. Energy Information Administration (U.S. EIA), (2013). “Overview of oil and natural gas in the Eastern Mediterranean Region”, August 15, 2013.[8] Exxon Mobil, (2014). “The Outlook for Energy: A View to 2040”, Texas.[9] International Energy Agency (IEA), (2013). “World Energy Outlook 2013”, OECD/IEA, Paris.
[10] International Energy Agency (IEA), OECD Nuclear Energy Agency (NEA), (2010). Projected Costs of Generating Electricity, 2010 edition, OECD/IEA, Paris.[11] Dünya Enerji Konseyi -Türk Milli Komitesi (DEK-TMK), “Enerji Raporu”, 2010, Ankara[12] ETKB, (2014). “Dünya ve Ülkemiz Enerji ve Tabii Kaynaklar Görünümü”, Strateji Geliştirme Başkanlığı Ankara.[13] BOTAŞ (2014). “Doğal Gaz Alım Anlaşmaları”, Alındığı tarih: 11.11.2014, Adres: http://www.botas.gov.tr/ index.asp[14] Türkiye Elektrik İletim A.Ş. (TEİAŞ), (2015). Kurulu Güç, Yük Tevzi Daire Başkanlığı İşletme Faaliyetleri Raporları. Adres: http://www.teias.gov.tr/YukTevziRaporlari.aspx, Alındığı tarih: 08.02.2015.[15] Enerji Piyasası Düzenleme Kurumu (EPDK), (2014). “Doğal Gaz Piyasası 2013 Yılı Sektör Raporu”, Strateji Geliştirme Dairesi Başkanlığı, Ankara.
SUMMARYDue to its limited indigenous resourses, Turkey supplies majority of its increasing energy needs, resulting from its growing population and economy, by imports. With a very small share of domestic production in energy supply, Turkey is increasingly dependent on imports. Conventional natural gas’ import rates, share in installed capacity and electricity production, variety of end-use sectors including the residential, commercial, industrial and transportation sectors, relatively low overnight investment costs and depreciable lifeconstitute Turkey’s energy facts. Regarding the above mentioned facts and the neighbouring countries rich in resources, natural gas holds an inevitably critical share in Turkish economy and energy sector. It is of significant importance that Turkey should benefit from neighbouring and nearby countries in order to meet the growing natural gas demand, particularly in electricity production, in a continuous and reliable manner and contribute to security of supply. During winter when natural gas consumption increases and during summer when natural gas demand in electricity production grows extremely, short-term natural gas supply shortages may occur. There is also the risk of supply shortages resulting from unplanned supply outages from imports, sudden increase in energy demand or maintenance of pipelines. Hence, spot LNG imports and natural gas storage facilities are of the essence on tolerating possible suppy deficits and reducing the reflections on consumers. In this study, natural gas consumption of Turkey during 2008-2014 is analyzed on a daily, monthly, seasonal and annual basis. Results of this study are utilized to assess elements such as dependence on imports, capacity of transmission lines, and share of natural gas-fired power plants in electricity production and total capacity of natural gas storage facilities. In this context, arguments regarding avoiding possible bottlenecks on natural gas supply chain and minimizing the risk of any supply shortages to contribute to the security of natural gas supply in Turkey are addressed.
107
ICCI 2015 - Bildiriler Kitabı / Proceedings Book
ÖZETEnerjiye duyulan gereksinim, dünya çapında dinamik bir enerji piyasası oluşumuna sebep olmuştur. Piyasa dinamikleri ekonomik, teknolojik ve yerel kaynaklar gibi birçok parametre üzerine kurulu olmakla beraber, siyasi faktörler gibi dış politikayı güdümleyen argümanlara da sahip bulunmaktadır. Nükleer santraller enerji piyasalarının istikrarını sağlayan bir argüman olarak nitelendirilmektedir. Çalışmada, bu husus örnekleriyle vurgulanmaktadır. Baz santral olmasına karşın, ülkemizde şimdiye dek uygulamaya geçirilemeyen tek kaynak olan nükleer enerjinin devreye girmesi ile emre amade enerji arzında önemli bir girdi oluşturması beklenmektedir. Bu çalışmada, ülkemizin ilk nükleer santrali olacak olan Akkuyu Nükleer Güç Santral (NGS)’inin Türkiye Enerji Piyasasına yapacağı etki incelenmektedir. Bu amaçla, halen çalışmaları devam eden Akkuyu NGS’nin piyasaya yapacağı etki değerlendirilmektedir. Dört üniteden oluşacak olan Akkuyu NGS’nin devreye giriş tarihleri öngörülüp APLUS modelleme programı kullanılarak enerji piyasasına etkisinin irdelenmesi gerçeklenmektedir.
GİRİŞGloballeşen dünyada ülkelerin enerji gereksinimleri; sanayi devriminden sonra nüfus artışı ve teknolojik gelişimlerle birlikte değişim geçirerek yeni şartlara ayak uydurabilmek için giderek artmaktadır. Enerji kaynaklarının kısıtlı olması, tüm kaynakların etkin olarak kullanılmasına yönelik çalışmaları artırmış olup daha ucuz, daha temiz ve daha verimli yöntemlerle enerjinin sürdürülebilir olarak üretimi de ön plana çıkmıştır. Bu bağlamda, pek çok ülkenin ve bu arada ülkemizin de nükleer santraller kurmayı gündemine aldığı gözlenmektedir[1-4].
Enerji piyasası, enerjiye duyulan gereksinim çerçevesinde dünya çapında dinamik bir yapıya sahip bulunmaktadır. Piyasa dinamikleri ekonomik, teknolojik ve yerel kaynaklar gibi birçok parametreden etkilenmekte, fazla olarak siyasi faktörlerle birlikte dış politikayı da güdümleyen argümanlara sahip bulunmaktadır. Bu bağlamda, nükleer
santraller enerji piyasalarının istikrarını sağlayan önemli bir argüman olmakta ve ulusal enerji arz güvenliğini doğrudan etkilemektedir. Ulusal olarak yapılan tüm planlamalarda enerji son derece etkin bir rol oynarken, ülke jeopolitiği de enerji politikalarında stratejik öneme sahip bulunmaktadır[5-7].
TÜRKİYE AÇISINDAN DURUM DEĞERLENDİRMESİÜlkemiz için de enerji yadsınamaz bir öneme sahip bulunmakta olup, enerjiye ulaşım ve kullanım politikaları, etkin olarak hayata geçirilmeye çalışılmaktadır. Nitekim, İktisadi İşbirliği ve Kalkınma Teşkilatı (OECD) ülkeleri içerisinde, geçtiğimiz 10 yıllık dönemde Türkiye, yıllık ortalama %6-7 oranında artışla enerji talep artışının en hızlı gerçekleştiği ülke durumundadır[8].
Özellikle, sanayileşme ve şehirleşmenin ekonomik gelişmeleri tetiklemesiyle talep giderek artan bir profil çizmiştir. Bu durum artan nüfus da göz önünde bulundurulursa gelecek için büyük bir potansiyel artışa işaret etmektedir. Uluslararası Enerji Ajansı (EIA) raporlarına göre bu artışın 2015 – 2030 döneminde yıllık ortalama % 4,5 oranında görülmesi beklenmektedir (Tablo 1)[9].
Ülkemizde, elektrik enerjisi ihtiyacı, esas olarak doğal gaz ve kömürden karşılanmaktadır[10]. Şekil 1’de Türkiye’de elektrik enerjisi üretiminin kaynaklara göre dağılımı gösterilmektedir. Görüldüğü gibi ciddi oranlarda yurt dışından tedarik ediliyor olması nedeniyle alternatif birçok politika belirlenmiş ve uygulamaya konulmaya çalışılmıştır. Ancak söz konusu bu politikaların şimdiye dek başarıyla uygulandığı da söylenememektedir[11].
Ülkemizde, enerjinin cari açığa olan etkisi yadsınamaz bir gerçektir. Zira Türkiye enerji kaynakları bakımından %72 gibi büyük bir oranda yurt dışına bağlı bir ülke durumundadır. Bu oranın mümkün olduğunca düşürülebilmesi için her türlü seçeneğin değerlendirilmesi gerektiği aşikârdır.
Nükleer Santrallerin Enerji Piyasasına Etkisinin İncelenmesi ve Ülkemiz Açısından Değerlendirilmesi
MehmetŞİMŞEKİstanbul Teknik ÜniversitesiEnerji Enstitüsü
A.BerilTUĞRULİstanbul Teknik ÜniversitesiEnerji Enstitüsü

108
ICCI 2015 - Bildiriler Kitabı / Proceedings Book
NÜKLEER ENERJİ SEÇENEĞİVerilen tüm bu arz ve talebe ilişkin bilgiler ışığında, gelecek dönemde artan talebin dengelenebilmesi için her yıl ortalama 4.000-5.000 MW üretim tesisinin devreye alınması gerektiği belirtilmektedir[14]. Hâlihazırda devam eden yatırımlar ile gerek yenilenebilir enerji kaynaklarına dayalı tesislerin kapasite faktörlerinin düşük olması ve gerekse bu talebi karşılamak için gerekli yatırımların yeteri kadar yapılamamış olması nedeniyle gelecekteki enerji talebinin karşılanamayacağı öngörüsü yapılmaktadır. Bu da, “enerji açığı” anlamına gelmektedir. Bu açığın telafi edilmesi adına, ülkemizde enerji üretiminde kullanılamayan tek kaynak olan nükleer enerji son dönemde öne çıkan en önemli alternatif olarak görülmektedir. Enerji temin kaynaklarına nükleerin de dâhil edilmesiyle söz konusu enerji açığının daha kolay kapatılabileceği yapılan çalışmalarla gösterilmiştir[15].
Bu çerçevede nükleer enerji;•Enerjide dışa bağımlılığının azaltılması, •Sürekli ve güvenilir kaynak olması,•Emre amadeliğinin yüksek olması,•Öngörülen enerji açığını ciddi oranda gidermesi,•Arz güvenliği ve fiyat istikrarına yapacağı katkı,
•Çevre dostu olması (hava kirliliği ve iklim değişikliğine yapacağı pozitif katkı)
sebepleriyle çok boyutlu ve uzun soluklu enerji politika ve stratejilerimizde önemli bir oyuncu olarak yerini almaktadır denebilir.
Önemli bir baz santral olmasına karşın, ülkemizde şimdiye dek uygulamaya geçirilemeyen nükleer enerjinin devreye girmesi ile emre amade enerji arzında önemli bir girdi oluşturması beklenmektedir. Bu bağlamda, ülkemizin ilk nükleer santrali olacak olan Akkuyu Nükleer Güç Santral (NGS)’inin Türkiye Enerji Piyasasına yapacağı etkinin incelenmesi enerji politikaları açısından önem arz etmektedir. Dolayısıyla, halen çalışmaları devam eden Akkuyu NGS’nin piyasaya yapacağı etki değerlendirilmesinin rasyonel şekilde yapılması bir gereklilik olarak kendini göstermektedir.
APLUS BİLGİSAYAR PROGRAMIAPLUS bilgisayar programı gelişkin bir yazılım olup, Türkiye Elektrik Piyasasının modellenmesi, analiz edilmesi ve ileriye dönük trend ve yönelimlerinin belirlenmesi ile piyasa izlemesine yönelik geriye dönük analiz yapılmasına olanak veren bir programdır (APLUS, 2015)[16]. Programda kullanılan modelleme çerçevesinde oluşturulan veritabanında göz önünde bulundurulan parametreler Şekil 2’de verilmektedir.
APLUS bilgisayar programı, orta ve uzun vadeli öngörüler için piyasaya yeni kapasite girişlerini modelleyebilmektedir. Bu çalışmada, yazılımın söz konusu bu performansı kullanılarak öngörülen fiyatlar, maliyetler ve yük eğrisi ile
Tablo 1. Türkiye Elektrik Üretim Talebi Senaryoları (TEİAŞ,2013)[13]
Şekil 2. APLUS bilgisayar programında kullanılan modelleme çerçevesinde oluşturulan veritabanında göz önünde bulundurulan parametreler (APLUS, 2015)[16].
Şekil 1. 2013 yılı genelinde üretim tipine göre enerji üretimi (TEİAŞ, 2014)[12].
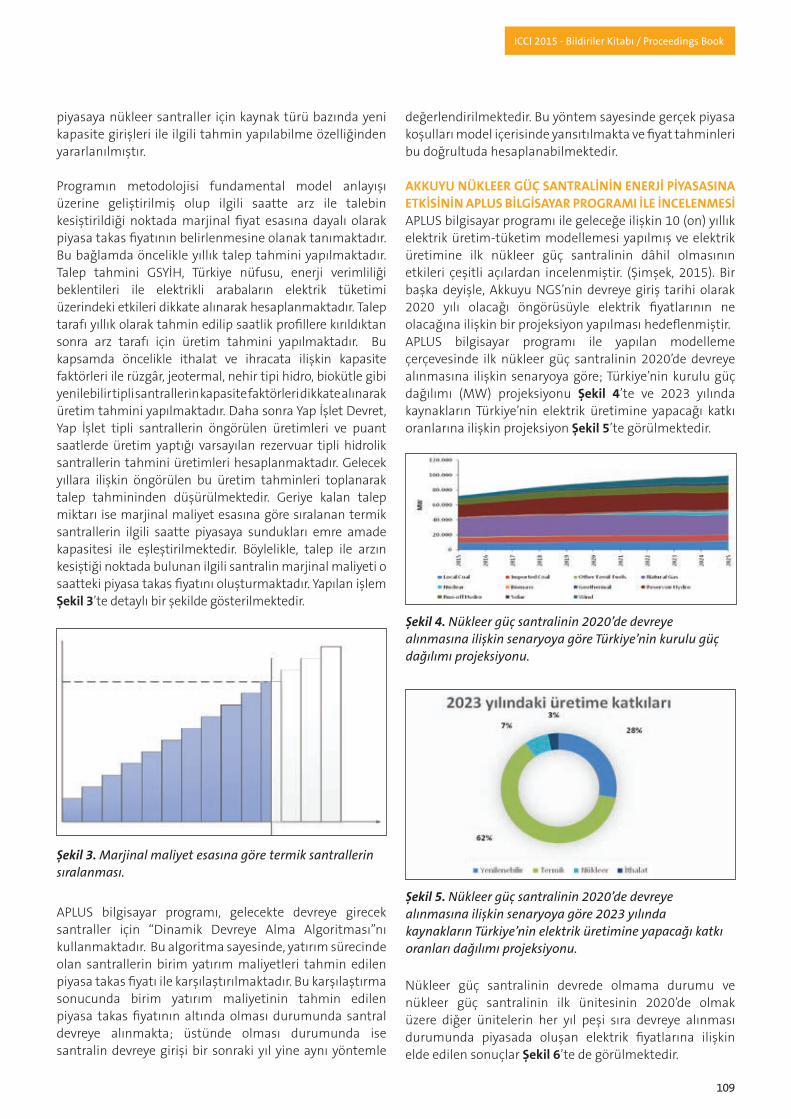
109
ICCI 2015 - Bildiriler Kitabı / Proceedings Book
piyasaya nükleer santraller için kaynak türü bazında yeni kapasite girişleri ile ilgili tahmin yapılabilme özelliğinden yararlanılmıştır.
Programın metodolojisi fundamental model anlayışı üzerine geliştirilmiş olup ilgili saatte arz ile talebin kesiştirildiği noktada marjinal fiyat esasına dayalı olarak piyasa takas fiyatının belirlenmesine olanak tanımaktadır. Bu bağlamda öncelikle yıllık talep tahmini yapılmaktadır. Talep tahmini GSYİH, Türkiye nüfusu, enerji verimliliği beklentileri ile elektrikli arabaların elektrik tüketimi üzerindeki etkileri dikkate alınarak hesaplanmaktadır. Talep tarafı yıllık olarak tahmin edilip saatlik profillere kırıldıktan sonra arz tarafı için üretim tahmini yapılmaktadır. Bu kapsamda öncelikle ithalat ve ihracata ilişkin kapasite faktörleri ile rüzgâr, jeotermal, nehir tipi hidro, biokütle gibi yenilebilir tipli santrallerin kapasite faktörleri dikkate alınarak üretim tahmini yapılmaktadır. Daha sonra Yap İşlet Devret, Yap İşlet tipli santrallerin öngörülen üretimleri ve puant saatlerde üretim yaptığı varsayılan rezervuar tipli hidrolik santrallerin tahmini üretimleri hesaplanmaktadır. Gelecek yıllara ilişkin öngörülen bu üretim tahminleri toplanarak talep tahmininden düşürülmektedir. Geriye kalan talep miktarı ise marjinal maliyet esasına göre sıralanan termik santrallerin ilgili saatte piyasaya sundukları emre amade kapasitesi ile eşleştirilmektedir. Böylelikle, talep ile arzın kesiştiği noktada bulunan ilgili santralin marjinal maliyeti o saatteki piyasa takas fiyatını oluşturmaktadır. Yapılan işlem Şekil 3’te detaylı bir şekilde gösterilmektedir.
APLUS bilgisayar programı, gelecekte devreye girecek santraller için “Dinamik Devreye Alma Algoritması”nı kullanmaktadır. Bu algoritma sayesinde, yatırım sürecinde olan santrallerin birim yatırım maliyetleri tahmin edilen piyasa takas fiyatı ile karşılaştırılmaktadır. Bu karşılaştırma sonucunda birim yatırım maliyetinin tahmin edilen piyasa takas fiyatının altında olması durumunda santral devreye alınmakta; üstünde olması durumunda ise santralin devreye girişi bir sonraki yıl yine aynı yöntemle
değerlendirilmektedir. Bu yöntem sayesinde gerçek piyasa koşulları model içerisinde yansıtılmakta ve fiyat tahminleri bu doğrultuda hesaplanabilmektedir.
AKKUYU NÜKLEER GÜÇ SANTRALİNİN ENERJİ PİYASASINA ETKİSİNİN APLUS BİLGİSAYAR PROGRAMI İLE İNCELENMESİAPLUS bilgisayar programı ile geleceğe ilişkin 10 (on) yıllık elektrik üretim-tüketim modellemesi yapılmış ve elektrik üretimine ilk nükleer güç santralinin dâhil olmasının etkileri çeşitli açılardan incelenmiştir. (Şimşek, 2015). Bir başka deyişle, Akkuyu NGS’nin devreye giriş tarihi olarak 2020 yılı olacağı öngörüsüyle elektrik fiyatlarının ne olacağına ilişkin bir projeksiyon yapılması hedeflenmiştir. APLUS bilgisayar programı ile yapılan modelleme çerçevesinde ilk nükleer güç santralinin 2020’de devreye alınmasına ilişkin senaryoya göre; Türkiye’nin kurulu güç dağılımı (MW) projeksiyonu Şekil 4’te ve 2023 yılında kaynakların Türkiye’nin elektrik üretimine yapacağı katkı oranlarına ilişkin projeksiyon Şekil 5’te görülmektedir.
Nükleer güç santralinin devrede olmama durumu ve nükleer güç santralinin ilk ünitesinin 2020’de olmak üzere diğer ünitelerin her yıl peşi sıra devreye alınması durumunda piyasada oluşan elektrik fiyatlarına ilişkin elde edilen sonuçlar Şekil 6’te de görülmektedir.
Şekil 3. Marjinal maliyet esasına göre termik santrallerin sıralanması.
Şekil 4. Nükleer güç santralinin 2020’de devreye alınmasına ilişkin senaryoya göre Türkiye’nin kurulu güç dağılımı projeksiyonu.
Şekil 5. Nükleer güç santralinin 2020’de devreye alınmasına ilişkin senaryoya göre 2023 yılında kaynakların Türkiye’nin elektrik üretimine yapacağı katkı oranları dağılımı projeksiyonu.

110
ICCI 2015 - Bildiriler Kitabı / Proceedings Book
SONUÇAPLUS bilgisayar programı yardımı ile Türkiye’nin ilk nükleer güç santralinin 2020’de devreye girmesi senaryosu çerçevesinde yapılan çalışmayla elde edilen sonuçlardan hareketle, nükleerin 2020 yılından itibaren yaklaşık %5’e varan bir paya sahip olacağı anlaşılmaktadır. 2020 yılından itibaren Akkuyu NGS’nin devreye girmesi ile her yıl elektrik fiyatı düşümü miktarı hesaplanmıştır. Tablo 2’de ulaşılan elektrik fiyat düşüm değerleri görülmektedir.
Tablo 3’ten görüldüğü üzere: nükleer güç santralinin hayata geçirilişinde deneme ve testler nedeniyle tam kapasite faktörü ile devreye girmesi beklenmediğinden ilk iki yılda elektrik fiyatına etkisi nispeten düşük olmakta, daha sonra yükseldiği gözlenmektedir. 2025’ten sonra ise talebin artışı etkin olduğundan elektrik fiyatındaki düşüm azalmaktadır.
Öz olarak ifade etmek istersek; nükleer güç santralinin hayata geçirilmesi ile elektrik fiyatlarında düşme meydana gelmekle birlikte, beşinci yılda elektrik fiyatlarında az da olsa bir düşümde azalma meydana geliyor. Bu durum, yeni nükleer güç santrallerinin devreye alınmasının gerekliliğini ortaya koymaktadır.
TEŞEKKÜRBu çalışmada kullanılan APLUS bilgisayar programının kullanımında yardımcı olan Ozan KORKMAZ, Erdem SEZER ve Ahmet Cihat TOKER’e teşekkür ederiz.
KAYNAKLAR[1] Tuğrul A.B., “Nuclear Energy in the Energy Expansion of Turkey”, “Journal of Energy and Power Engineering, Vol. 5, No 10, pp. 905-910, Oct.2011[2] Tuğrul A.B., “Türkiye’nin Enerji Açılımları”, “15. Uluslararası Enerji ve Çevre Konferansı ICCI-2009” İstanbul, 13-15 Mayıs 2009, Bildiri Kitabı s: 15-17.[3] Tuğrul A.B., Nükleer Enerji Değerlendirmesi ve Türkiye, “17. Uluslararası Enerji ve Çevre Konferansı ICCI-2011” İstanbul, 15-17 Haziran 2011, Bildiri Kitabı s: 11-14.
[4] Tuğrul A.B., “Nükleer Teknoloji Transferi İçin Türkiye Değerlendirmesi”, 19. Uluslararası Enerji ve Çevre Konferansı ICCI-2013, İstanbul, 24-26 Nisan 2013, CD Bildiri Kitabı, s: 1-5.[5] Tugrul A.B., Çimen S., “Energy Initiatives for Turkey”, “International Conference on Economics and Econometrics - ICEE 2013”, 2-3 December 2013, Dubai-BAE, Proc. pp. 40-44.[6] Tugrul A.B., “Energy Policy and Interactions with Politics and Economics”, “International Conference on Energy Environmental Engineering - ICEEE 2014”, 21-22 November2014, Paris-France, Proc. pp. 801-804.[7] T.C. Başbakanlık Türkiye Yatırım Destek ve Tanıtım Ajansı, “The Energy Sector: A Quick Tour for the Investor”, November 2013.[8] ETKB, “2014 Yılı Bütçesinin TBMM Plan ve Bütçe Komisyonuna Sunumu”, 13 Aralık 2013[9] EIA, “Turkey Analysis Overview”, 2014.[10] Engin B., Tuğrul A.B., “Evaluation of Natural Gas Supply Security in Turkey with Future Projection”, “Journal of Energy and Power Engineering, Vol. 8, No 7, pp. 1237-1245, July 2014.[11] Şimşek M., “Nükleer Santralların Enerji Piyasasına Etkisinin İncelenmesi ve APLUS Bilgisayar Programı İle İrdelenmesi”, İTÜ Enerji Enstitüsü, Yüksek Lisans Tezi, 2015 (Teslim aşamasındadır)[12] TEİAŞ, 2014.[13] TEİAŞ, 2013.[14] Enerji ve Tabii Kaynaklar Bakanlığı, 2010[15] Stratejik Düşünce Enstitüsü, “Türkiye’nin Enerji Açığı Sorunu ve Çözüm Önerileri”, Temmuz 2011.[16] APLUS, AVIEW-MarketSim, “Fundamental Energy Price Forecast Model”, APLUS Energy Investment Technology Consultancy, 2015.
SUMMARYEnergy requirement of countries in the globalized World, evolving and continuously increasing along with the population growth and rapid technological advances to cope with changing conditions since the Industrial Revolution. Because the energy resources are limited, researches on the effective usage of all energy resources has increased and the subject of generating energy with cheaper, cleaner, sustainably with more efficient methods
Tablo 2. Türkiye’nin İlk Nükleer Güç Santralinin 2020’de Devreye Girmesi Senaryosu Çerçevesinde Ulaşılan Elektrik Fiyat Düşüm Değerleri
Şekil 6. Nükleer güç santralinin devrede olmama hali ve nükleer güç santralinin 2020’de devreye alınmasıyla elektrik fiyatlarında oluşan değişim.

111
ICCI 2015 - Bildiriler Kitabı / Proceedings Book
come into prominence. In this regard, Turkey, like most of the countries in the World, has put construction of Nuclear Power Plants in Her agenda. On the other hand, need for energy caused establishment of a dynamic worldwide energy market. Although the market dynamics are based on economical, technological and local resources, also includes parameters like political factors that effects the foreign policy. Nuclear Power Plants are characterized as an argument to provide stability to the energy markets. In this study, this issues are highlighted with examples. The intention is the establishment security of national energy supply with taking all these factors under consideration. While energy is playing an extremely active role in all national plans, our country is becoming a major energy hub and transit route in its region. In our country, the impact of energy to the current account deficit is unquestionable. As a country depending on abroad energy resources in a large part, such as 72 %, it is obvious that all options should be evaluated to reduce this ratio as much as possible. It is expected that with the nuclear power plant, despite the only energy source that cannot be implemented as yet in Turkey becomes operational although it is a base load power plant, it will be an important input the obedient energy supply. In this study, impact of Akkuyu NPP, which will be the first nuclear power plant in our country, considered to be made on Turkish Energy Market is examined. To this end, impact of Akkuyu NPP on the energy market is evaluated. The impact of Akkuyu Nuclear Power Plant, which will consist of 4 reactors, on the energy market is simulated by APLUS computer modelling program using the predicted commissioning dates of each reactor.

112
ICCI 2015 - Bildiriler Kitabı / Proceedings Book
ÖZETBu çalışmada, gaz yakıtlı mutfak ocaklarında yakıt tasarrufu sağlayacak bir hazne dizayn ederek %15’i bulan tasarruflar sağlanmıştır. Mevcut gaz yakıtlı ocaklarda yanma ortamı atmosfere açık olduğundan dolayı alev bekinde üretilen ısı, pişirici kaba aktarıldığı gibi çok miktarda atmosfere yayılmaktadır. Bu durum yemeklerin daha geç pişmesine, bu da daha fazla yakıt sarfiyatına sebebiyet vermektedir. Dizayn ettiğimiz hazne ile birlikte yanma ortamı atmosfere karşı sınırlandırılmaktadır. Üretilen ısının atmosfere yayılması hazne ile engellenerek pişirici kaba aktarılmaktadır. Tasarımımızla yemekler standart ocaklara göre daha erken pişerek yakıt sarfiyatı azaltılmaktadır. Üretmiş olduğumuz prototiple yaptığımız deneylerde yakıttan tasarruf yapıldığı ortaya konularak tasarımımızın performans analizleri yapılmıştır.
Anahtar Kelimeler: Yakıt tasarrufu, Enerji verimliliği, Doğal gazda tasarruf, LPG’de tasarruf
1. GİRİŞÜlkemizin son yıldaki büyüme grafikleri incelendiğinde, büyümenin pozitif yönde gerçekleştiği görülmektedir. Özellikle 2008 yılında dünya çapında yaşanan ekonomik krizden çok fazla etkilenmeyen ve bu yıldan sonra oluşturduğu büyüme rakamlarıyla rekor kıran istatistikler oluşturmuştur. Türkiye’deki sanayi üretiminin ve hizmet sektörünün büyümesi, ayrıca kullanılır konut sayısının artması, ülkemizin enerji tüketim miktarlarını da haliyle artırmıştır.
Ülkemiz, petrol ve doğal gaz gibi iki önemli hidrokarbon kaynağı bakımından zengin olan Hazar Denizi Havzası ve Ortadoğu benzeri bölgelere komşu olmasına rağmen,
bu iki kaynak açısından rezervlerimiz yok denilecek kadar azdır. Petrol ve doğal gaz vb. hidrokarbonlar açısından fakir olan ülkemiz, birincil enerji kaynakları açısından dışa bağımlıdır.
Ülkelerin dış politikalarına yıllarca yön veren birincil enerji kaynakların konumu, ülkemizin büyümesini frenleyebilecek önemli bir parametredir. Birincil enerji kaynakları mevcut rezervlerimizi artırma imkânımız mümkün değilken enerjide tasarruf sağlamak en gerçekçi çözüm olarak karşımıza çıkmaktadır.
Enerji verimliliği, yaşam kalitemizden, ihtiyaçlarımızdan ve üretimimizden ödün vermeden enerjiyi yüksek verimle ve tasarrufla kullanmaktır[1]. Enerjide dışa bağımlılığımızı azaltmak için birinci olarak yerli kaynak kullanımı yoluna gidilirken, ikinci olarak enerjide tasarruf edilerek enerjiyi verimli kullanmak söz konusudur. Son yıllarda enerji verimliliği çalışmaları önem kazanmıştır[2].
Enerji Piyasası Düzenleme Kurumu (EPDK)’nun 2013 yılı verilerine baktığımızda, %99’unu dışarıdan ithal ettiğimiz doğal gazın %25,11’i sanayide, %45,81’i elektrik üretiminde ve %20,78’i evsel tüketimde kullanılmıştır[3].
2011 TÜİK verilerine göre Türkiye’de 20 milyona yakın hane bulunmaktadır[4]. Ayrıca ülkemizde 100 binin üzerinde lokanta, catering ve yemekhane gibi ticari kuruluşlar vardır. Hanelerde ve bu ticarethanelerde pişirme işlemi için gaz yakıtlı mutfak ocakları bulunmakta, gaz yakıtlı mutfak ocaklarında yakıt olarak LPG (tüpgaz) ve doğal gaz kullanılmaktadır.
Gaz Yakıtlı Mutfak Ocaklarında Yakıt Tasarrufu Sağlanması
MesutYAZICIKarabük Üniversitesi, Enerji Sistemleri Müh.Teknoloji Fakültesi
SezayiYILMAZKarabük Üniversitesi, Enerji Sistemleri Müh.Teknoloji Fakültesi
SüleymanHilmiYILMAZKarabük Üniversitesi, Enerji Sistemleri Müh.Teknoloji Fakültesi
BayramKÖSEKarabük Üniversitesi, Enerji Sistemleri Müh.Teknoloji Fakültesi
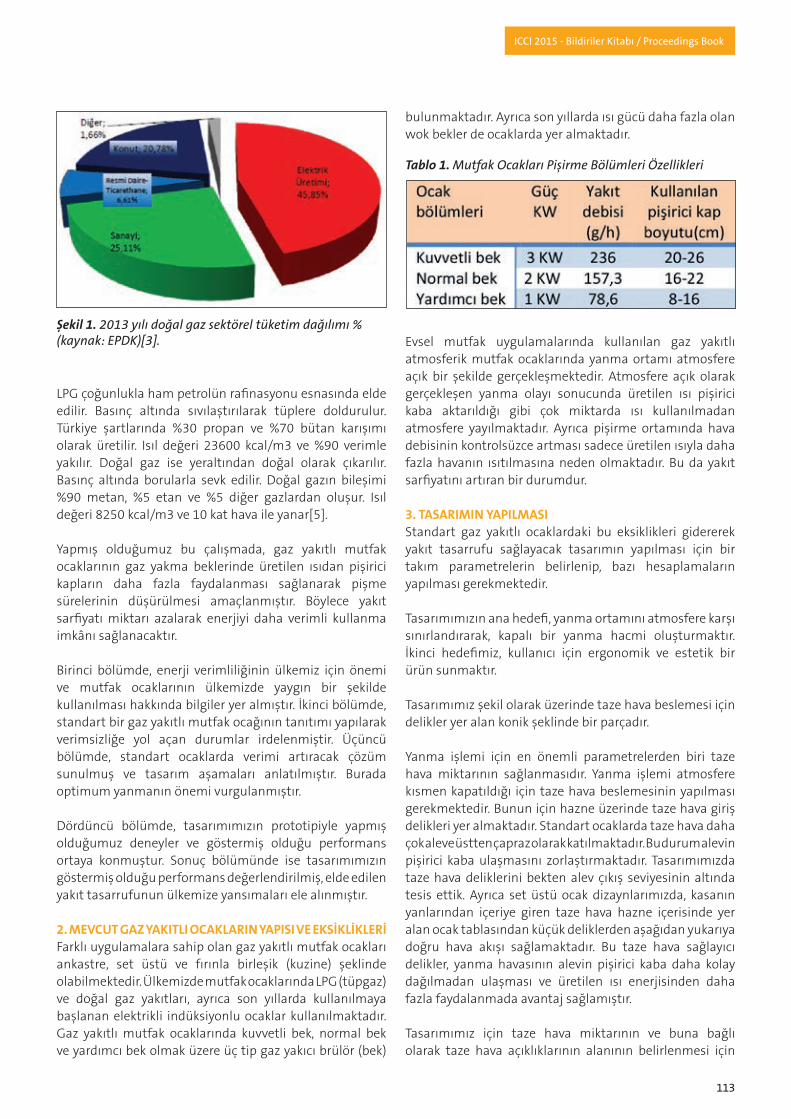
113
ICCI 2015 - Bildiriler Kitabı / Proceedings Book
Şekil 1. 2013 yılı doğal gaz sektörel tüketim dağılımı % (kaynak: EPDK)[3].
LPG çoğunlukla ham petrolün rafinasyonu esnasında elde edilir. Basınç altında sıvılaştırılarak tüplere doldurulur. Türkiye şartlarında %30 propan ve %70 bütan karışımı olarak üretilir. Isıl değeri 23600 kcal/m3 ve %90 verimle yakılır. Doğal gaz ise yeraltından doğal olarak çıkarılır. Basınç altında borularla sevk edilir. Doğal gazın bileşimi %90 metan, %5 etan ve %5 diğer gazlardan oluşur. Isıl değeri 8250 kcal/m3 ve 10 kat hava ile yanar[5].
Yapmış olduğumuz bu çalışmada, gaz yakıtlı mutfak ocaklarının gaz yakma beklerinde üretilen ısıdan pişirici kapların daha fazla faydalanması sağlanarak pişme sürelerinin düşürülmesi amaçlanmıştır. Böylece yakıt sarfiyatı miktarı azalarak enerjiyi daha verimli kullanma imkânı sağlanacaktır.
Birinci bölümde, enerji verimliliğinin ülkemiz için önemi ve mutfak ocaklarının ülkemizde yaygın bir şekilde kullanılması hakkında bilgiler yer almıştır. İkinci bölümde, standart bir gaz yakıtlı mutfak ocağının tanıtımı yapılarak verimsizliğe yol açan durumlar irdelenmiştir. Üçüncü bölümde, standart ocaklarda verimi artıracak çözüm sunulmuş ve tasarım aşamaları anlatılmıştır. Burada optimum yanmanın önemi vurgulanmıştır.
Dördüncü bölümde, tasarımımızın prototipiyle yapmış olduğumuz deneyler ve göstermiş olduğu performans ortaya konmuştur. Sonuç bölümünde ise tasarımımızın göstermiş olduğu performans değerlendirilmiş, elde edilen yakıt tasarrufunun ülkemize yansımaları ele alınmıştır.
2. MEVCUT GAZ YAKITLI OCAKLARIN YAPISI VE EKSİKLİKLERİFarklı uygulamalara sahip olan gaz yakıtlı mutfak ocakları ankastre, set üstü ve fırınla birleşik (kuzine) şeklinde olabilmektedir. Ülkemizde mutfak ocaklarında LPG (tüpgaz) ve doğal gaz yakıtları, ayrıca son yıllarda kullanılmaya başlanan elektrikli indüksiyonlu ocaklar kullanılmaktadır. Gaz yakıtlı mutfak ocaklarında kuvvetli bek, normal bek ve yardımcı bek olmak üzere üç tip gaz yakıcı brülör (bek)
bulunmaktadır. Ayrıca son yıllarda ısı gücü daha fazla olan wok bekler de ocaklarda yer almaktadır.
Evsel mutfak uygulamalarında kullanılan gaz yakıtlı atmosferik mutfak ocaklarında yanma ortamı atmosfere açık bir şekilde gerçekleşmektedir. Atmosfere açık olarak gerçekleşen yanma olayı sonucunda üretilen ısı pişirici kaba aktarıldığı gibi çok miktarda ısı kullanılmadan atmosfere yayılmaktadır. Ayrıca pişirme ortamında hava debisinin kontrolsüzce artması sadece üretilen ısıyla daha fazla havanın ısıtılmasına neden olmaktadır. Bu da yakıt sarfiyatını artıran bir durumdur.
3. TASARIMIN YAPILMASIStandart gaz yakıtlı ocaklardaki bu eksiklikleri gidererek yakıt tasarrufu sağlayacak tasarımın yapılması için bir takım parametrelerin belirlenip, bazı hesaplamaların yapılması gerekmektedir.
Tasarımımızın ana hedefi, yanma ortamını atmosfere karşı sınırlandırarak, kapalı bir yanma hacmi oluşturmaktır. İkinci hedefimiz, kullanıcı için ergonomik ve estetik bir ürün sunmaktır.
Tasarımımız şekil olarak üzerinde taze hava beslemesi için delikler yer alan konik şeklinde bir parçadır.
Yanma işlemi için en önemli parametrelerden biri taze hava miktarının sağlanmasıdır. Yanma işlemi atmosfere kısmen kapatıldığı için taze hava beslemesinin yapılması gerekmektedir. Bunun için hazne üzerinde taze hava giriş delikleri yer almaktadır. Standart ocaklarda taze hava daha çok aleve üstten çapraz olarak katılmaktadır. Bu durum alevin pişirici kaba ulaşmasını zorlaştırmaktadır. Tasarımımızda taze hava deliklerini bekten alev çıkış seviyesinin altında tesis ettik. Ayrıca set üstü ocak dizaynlarımızda, kasanın yanlarından içeriye giren taze hava hazne içerisinde yer alan ocak tablasından küçük deliklerden aşağıdan yukarıya doğru hava akışı sağlamaktadır. Bu taze hava sağlayıcı delikler, yanma havasının alevin pişirici kaba daha kolay dağılmadan ulaşması ve üretilen ısı enerjisinden daha fazla faydalanmada avantaj sağlamıştır.
Tasarımımız için taze hava miktarının ve buna bağlı olarak taze hava açıklıklarının alanının belirlenmesi için
Tablo 1. Mutfak Ocakları Pişirme Bölümleri Özellikleri

114
ICCI 2015 - Bildiriler Kitabı / Proceedings Book
yanma denklemleri oluşturulmuştur. Yanma kimyasal bir olaydır. Burada amaç, kimyasal enerjinin termik enerjiye dönüşümü yoluyla ısı üretmektir[6]. Hesaplamalarda yakıt olarak LPG (tüpgaz) kullanılmıştır. LPG’nin içeriği %70 bütan ve %30 propan gazından oluşmaktadır. Mahal şartları bir mutfak için 20°C ve bu sıcaklık için %60 bağıl nem, ayrıca %20 türbülans yoğunluğunda hava hızı 0,2 m/s olarak belirlenmiştir.
“Bir yakıtın tam yanması için gereken minimum hava miktarına sitokiyometrik veya kuramsal hava denir. Sitokiyometrik miktardan fazla hava miktarına fazla hava denir”[7].
Karışım halindeki LPG (tüpgaz)’nin CnHm kapalı formülü hesabı;
(1)
Bu formül yardımıyla n=3,7 olarak bulunur.
(2)
Buradan m=9,4 bulunur ve LPG karışımın kapalı formülü C3,7H9,4 olarak elde edilir. LPG’nin optimum yanması için gerekli havanın bulunması için %10 fazla hava miktarıyla birlikte yanma denklemi;
(3)
(4)
Bu durumda;
(5)
Hava yakıt oranı (6) numaralı denklemde yerine konularak hesaplanmıştır.
(6)
Gerekli hava debisi için;
(7)
Burada hava fazlalık katsayısı =1 olarak alınmıştır.
Hava yakıt oranının belirlenmesi için denklem (6) kullanılır ve gerekli hava debisi ise (7) numaralı denklemde
yerine konularak bulunur. Taze hava deliklerinin alan ve çaplarının belirlenmesinde (8), (9) numaralı denklemler kullanılmıştır.
(8)
Burada A taze hava deliklerinin her birinin alanı, hava taze hava debisi, havanın rakıma göre yoğunluğu 1,1905 kg/m3 olarak alınmıştır, v hava hızı %20 türbülans yoğunluğu için 0,2 m/s olarak alınmıştır ve n ise delik sayısıdır.
(9)
Yapılan işlemler üç tip gaz yakıcı bek için tekrarlanmıştır.
Yapılan hesaplarla optimum yanma için taze hava beslemesini yapacak deliklerin daire şeklinde olmasının hava akışını daha kolaylaştıracağı düşünülerek daire şeklindeki deliklerin çapı ve sayısı tabloda belirtilmiştir.
Optimum yanma havasından fazla verilen hava, yanma işlemine katılmayıp sadece üretilen ısıyı alarak atmosfere yayılacak ve bu da yanma verimini düşürecektir.
4. DENEYLERTasarımımızın deneyleri, kullanım ortamı olan orta büyüklükte bir mutfakta gerçekleştirildi. Mutfak mahal sıcaklığı 23°C olarak kaydedilmiştir. Deneylerde standart dört bölmeli gaz yakıtlı atmosferik mutfak ocağının iki adet normal beki kullanılmıştır. Bu normal beklerin bir tanesine tasarımımız yerleştirilmiştir. Deneylerde aynı özelliklere ve hacme sahip iki adet demlik kullanılarak standart ocak bölmesi ile tasarımımızın konulduğu ocak bölmesinin 1.3 litre suyu kaynatma kabiliyetleri karşılaştırılmıştır.
Deneylerin ölçümlerinde termocouple sıcaklık ölçer kullanılmış olup data logger marifetiyle her saniye için kaplardaki suyun sıcaklık değişimi kaydedilmiştir.
Deneylerin yapılmasında iki yöntem izlenmiştir. Birinci yöntemde, deney yapılıp ölçümler alındıktan sonra bir sonraki deney için tasarımımızın ve demliklerin tamamen
Tablo 2. Mutfak Ocağı Bölümlerine Göre Tasarım Özellikleri
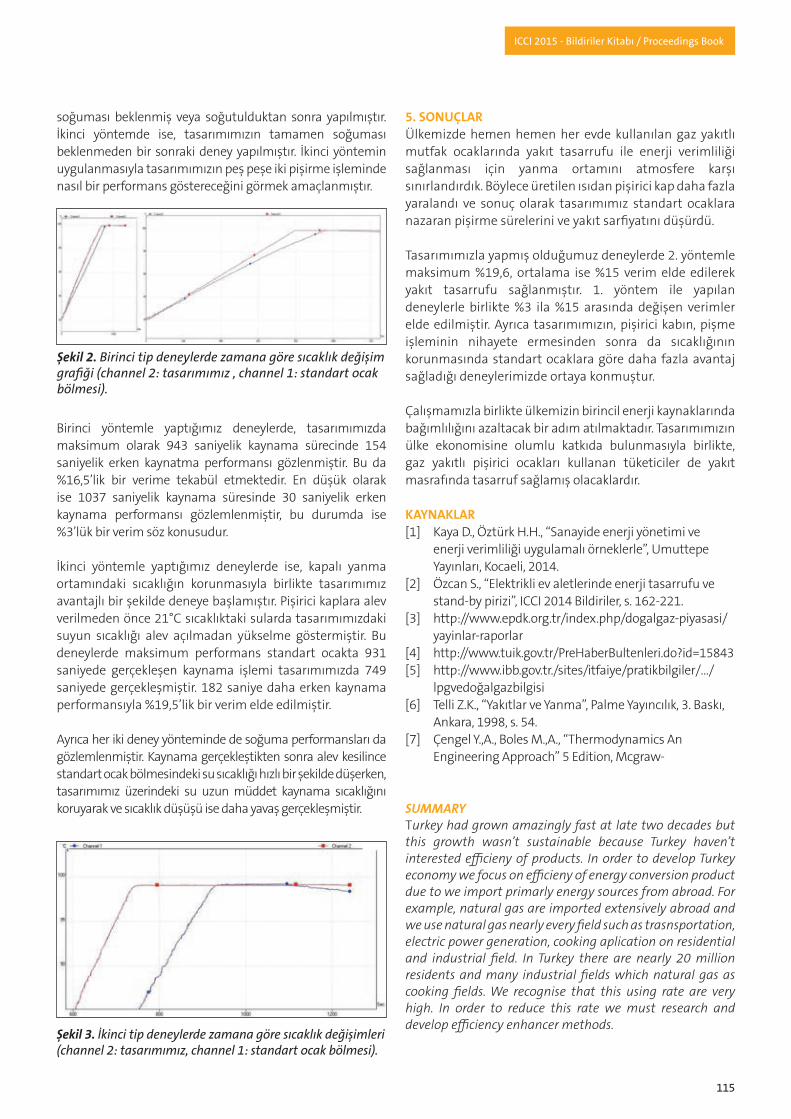
115
ICCI 2015 - Bildiriler Kitabı / Proceedings Book
soğuması beklenmiş veya soğutulduktan sonra yapılmıştır. İkinci yöntemde ise, tasarımımızın tamamen soğuması beklenmeden bir sonraki deney yapılmıştır. İkinci yöntemin uygulanmasıyla tasarımımızın peş peşe iki pişirme işleminde nasıl bir performans göstereceğini görmek amaçlanmıştır.
Birinci yöntemle yaptığımız deneylerde, tasarımımızda maksimum olarak 943 saniyelik kaynama sürecinde 154 saniyelik erken kaynatma performansı gözlenmiştir. Bu da %16,5’lik bir verime tekabül etmektedir. En düşük olarak ise 1037 saniyelik kaynama süresinde 30 saniyelik erken kaynama performansı gözlemlenmiştir, bu durumda ise %3’lük bir verim söz konusudur.
İkinci yöntemle yaptığımız deneylerde ise, kapalı yanma ortamındaki sıcaklığın korunmasıyla birlikte tasarımımız avantajlı bir şekilde deneye başlamıştır. Pişirici kaplara alev verilmeden önce 21°C sıcaklıktaki sularda tasarımımızdaki suyun sıcaklığı alev açılmadan yükselme göstermiştir. Bu deneylerde maksimum performans standart ocakta 931 saniyede gerçekleşen kaynama işlemi tasarımımızda 749 saniyede gerçekleşmiştir. 182 saniye daha erken kaynama performansıyla %19,5’lik bir verim elde edilmiştir.
Ayrıca her iki deney yönteminde de soğuma performansları da gözlemlenmiştir. Kaynama gerçekleştikten sonra alev kesilince standart ocak bölmesindeki su sıcaklığı hızlı bir şekilde düşerken, tasarımımız üzerindeki su uzun müddet kaynama sıcaklığını koruyarak ve sıcaklık düşüşü ise daha yavaş gerçekleşmiştir.
5. SONUÇLARÜlkemizde hemen hemen her evde kullanılan gaz yakıtlı mutfak ocaklarında yakıt tasarrufu ile enerji verimliliği sağlanması için yanma ortamını atmosfere karşı sınırlandırdık. Böylece üretilen ısıdan pişirici kap daha fazla yaralandı ve sonuç olarak tasarımımız standart ocaklara nazaran pişirme sürelerini ve yakıt sarfiyatını düşürdü.
Tasarımımızla yapmış olduğumuz deneylerde 2. yöntemle maksimum %19,6, ortalama ise %15 verim elde edilerek yakıt tasarrufu sağlanmıştır. 1. yöntem ile yapılan deneylerle birlikte %3 ila %15 arasında değişen verimler elde edilmiştir. Ayrıca tasarımımızın, pişirici kabın, pişme işleminin nihayete ermesinden sonra da sıcaklığının korunmasında standart ocaklara göre daha fazla avantaj sağladığı deneylerimizde ortaya konmuştur.
Çalışmamızla birlikte ülkemizin birincil enerji kaynaklarında bağımlılığını azaltacak bir adım atılmaktadır. Tasarımımızın ülke ekonomisine olumlu katkıda bulunmasıyla birlikte, gaz yakıtlı pişirici ocakları kullanan tüketiciler de yakıt masrafında tasarruf sağlamış olacaklardır.
KAYNAKLAR[1] Kaya D., Öztürk H.H., “Sanayide enerji yönetimi ve enerji verimliliği uygulamalı örneklerle”, Umuttepe Yayınları, Kocaeli, 2014.[2] Özcan S., “Elektrikli ev aletlerinde enerji tasarrufu ve stand-by pirizi”, ICCI 2014 Bildiriler, s. 162-221.[3] http://www.epdk.org.tr/index.php/dogalgaz-piyasasi/ yayinlar-raporlar[4] http://www.tuik.gov.tr/PreHaberBultenleri.do?id=15843[5] http://www.ibb.gov.tr./sites/itfaiye/pratikbilgiler/.../ lpgvedoğalgazbilgisi[6] Telli Z.K., “Yakıtlar ve Yanma”, Palme Yayıncılık, 3. Baskı, Ankara, 1998, s. 54.[7] Çengel Y.,A., Boles M.,A., “Thermodynamics An Engineering Approach” 5 Edition, Mcgraw-
SUMMARYTurkey had grown amazingly fast at late two decades but this growth wasn’t sustainable because Turkey haven’t interested efficieny of products. In order to develop Turkey economy we focus on efficieny of energy conversion product due to we import primarly energy sources from abroad. For example, natural gas are imported extensively abroad and we use natural gas nearly every field such as trasnsportation, electric power generation, cooking aplication on residential and industrial field. In Turkey there are nearly 20 million residents and many industrial fields which natural gas as cooking fields. We recognise that this using rate are very high. In order to reduce this rate we must research and develop efficiency enhancer methods.
Şekil 3. İkinci tip deneylerde zamana göre sıcaklık değişimleri (channel 2: tasarımımız, channel 1: standart ocak bölmesi).
Şekil 2. Birinci tip deneylerde zamana göre sıcaklık değişim grafiği (channel 2: tasarımımız , channel 1: standart ocak bölmesi).

116
ICCI 2015 - Bildiriler Kitabı / Proceedings Book
In this paper we focus on this field new technology that reduce natural gas using at the rate of 15%. In the available gas furnaces flame’s heat are transfered cookware. Some amount of flame heat are released to atmosphere. In order to prevent that leakage heat, we develop new design. So we restrict heating medium againt atmosphere. Within this scope of studying, developed yield wasa tested as experimantally.
At the end of studying, we obtain 3% efficiency at the beginning of the experiment; 15% efficiency at the end of experiment in first method at the second method we obtain maximum 19,6% efficency. System mean efficency is 15%. Also, we observe that cookware’s heat are protected.
As conclusion, we observe that if this structure is used in residential field, country dependence to primarly energy sources will reduce. With gas fired contribute positively to the design of the economy in consumers using the cooking stove will have savings in fuel costs.
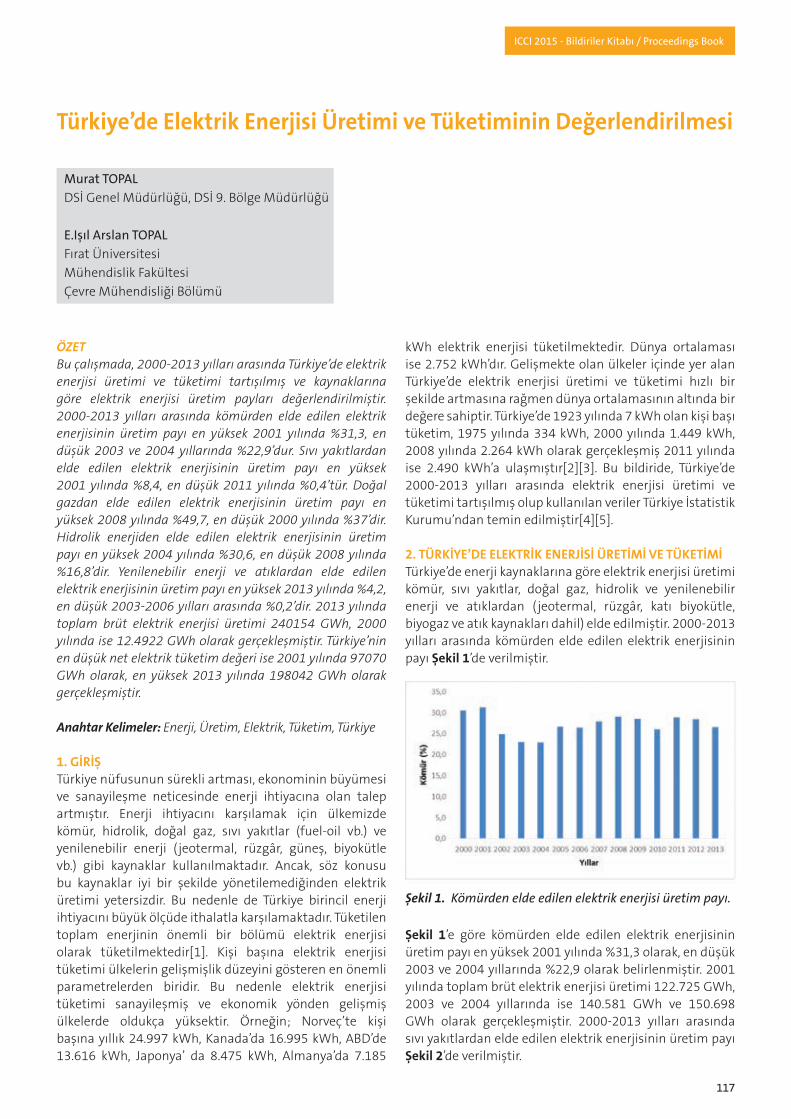
117
ICCI 2015 - Bildiriler Kitabı / Proceedings Book
ÖZETBu çalışmada, 2000-2013 yılları arasında Türkiye’de elektrik enerjisi üretimi ve tüketimi tartışılmış ve kaynaklarına göre elektrik enerjisi üretim payları değerlendirilmiştir. 2000-2013 yılları arasında kömürden elde edilen elektrik enerjisinin üretim payı en yüksek 2001 yılında %31,3, en düşük 2003 ve 2004 yıllarında %22,9’dur. Sıvı yakıtlardan elde edilen elektrik enerjisinin üretim payı en yüksek 2001 yılında %8,4, en düşük 2011 yılında %0,4’tür. Doğal gazdan elde edilen elektrik enerjisinin üretim payı en yüksek 2008 yılında %49,7, en düşük 2000 yılında %37’dir. Hidrolik enerjiden elde edilen elektrik enerjisinin üretim payı en yüksek 2004 yılında %30,6, en düşük 2008 yılında %16,8’dir. Yenilenebilir enerji ve atıklardan elde edilen elektrik enerjisinin üretim payı en yüksek 2013 yılında %4,2, en düşük 2003-2006 yılları arasında %0,2’dir. 2013 yılında toplam brüt elektrik enerjisi üretimi 240154 GWh, 2000 yılında ise 12.4922 GWh olarak gerçekleşmiştir. Türkiye’nin en düşük net elektrik tüketim değeri ise 2001 yılında 97070 GWh olarak, en yüksek 2013 yılında 198042 GWh olarak gerçekleşmiştir.
Anahtar Kelimeler: Enerji, Üretim, Elektrik, Tüketim, Türkiye
1. GİRİŞTürkiye nüfusunun sürekli artması, ekonominin büyümesi ve sanayileşme neticesinde enerji ihtiyacına olan talep artmıştır. Enerji ihtiyacını karşılamak için ülkemizde kömür, hidrolik, doğal gaz, sıvı yakıtlar (fuel-oil vb.) ve yenilenebilir enerji ( jeotermal, rüzgâr, güneş, biyokütle vb.) gibi kaynaklar kullanılmaktadır. Ancak, söz konusu bu kaynaklar iyi bir şekilde yönetilemediğinden elektrik üretimi yetersizdir. Bu nedenle de Türkiye birincil enerji ihtiyacını büyük ölçüde ithalatla karşılamaktadır. Tüketilen toplam enerjinin önemli bir bölümü elektrik enerjisi olarak tüketilmektedir[1]. Kişi başına elektrik enerjisi tüketimi ülkelerin gelişmişlik düzeyini gösteren en önemli parametrelerden biridir. Bu nedenle elektrik enerjisi tüketimi sanayileşmiş ve ekonomik yönden gelişmiş ülkelerde oldukça yüksektir. Örneğin; Norveç’te kişi başına yıllık 24.997 kWh, Kanada’da 16.995 kWh, ABD’de 13.616 kWh, Japonya’ da 8.475 kWh, Almanya’da 7.185
kWh elektrik enerjisi tüketilmektedir. Dünya ortalaması ise 2.752 kWh’dır. Gelişmekte olan ülkeler içinde yer alan Türkiye’de elektrik enerjisi üretimi ve tüketimi hızlı bir şekilde artmasına rağmen dünya ortalamasının altında bir değere sahiptir. Türkiye’de 1923 yılında 7 kWh olan kişi başı tüketim, 1975 yılında 334 kWh, 2000 yılında 1.449 kWh, 2008 yılında 2.264 kWh olarak gerçekleşmiş 2011 yılında ise 2.490 kWh’a ulaşmıştır[2][3]. Bu bildiride, Türkiye’de 2000-2013 yılları arasında elektrik enerjisi üretimi ve tüketimi tartışılmış olup kullanılan veriler Türkiye İstatistik Kurumu’ndan temin edilmiştir[4][5].
2. TÜRKİYE’DE ELEKTRİK ENERJİSİ ÜRETİMİ VE TÜKETİMİTürkiye’de enerji kaynaklarına göre elektrik enerjisi üretimi kömür, sıvı yakıtlar, doğal gaz, hidrolik ve yenilenebilir enerji ve atıklardan (jeotermal, rüzgâr, katı biyokütle, biyogaz ve atık kaynakları dahil) elde edilmiştir. 2000-2013 yılları arasında kömürden elde edilen elektrik enerjisinin payı Şekil 1’de verilmiştir.
Şekil 1’e göre kömürden elde edilen elektrik enerjisinin üretim payı en yüksek 2001 yılında %31,3 olarak, en düşük 2003 ve 2004 yıllarında %22,9 olarak belirlenmiştir. 2001 yılında toplam brüt elektrik enerjisi üretimi 122.725 GWh, 2003 ve 2004 yıllarında ise 140.581 GWh ve 150.698 GWh olarak gerçekleşmiştir. 2000-2013 yılları arasında sıvı yakıtlardan elde edilen elektrik enerjisinin üretim payı Şekil 2’de verilmiştir.
Türkiye’de Elektrik Enerjisi Üretimi ve Tüketiminin Değerlendirilmesi
MuratTOPALDSİ Genel Müdürlüğü, DSİ 9. Bölge Müdürlüğü
E.IşılArslanTOPALFırat ÜniversitesiMühendislik FakültesiÇevre Mühendisliği Bölümü
Şekil 1. Kömürden elde edilen elektrik enerjisi üretim payı.

118
ICCI 2015 - Bildiriler Kitabı / Proceedings Book
Şekil 2’ye göre sıvı yakıtlardan elde edilen elektrik enerjisinin üretim payı en yüksek 2001 yılında %8,4 olarak, en düşük 2011 yılında %0,4 olarak tespit edilmiştir. 2001 yılında toplam brüt elektrik enerjisi üretimi 122.725 GWh, 2011 yılında ise 229.395 GWh olarak gerçekleşmiştir. 2000-2013 yılları arasında doğal gaz elde edilen elektrik enerjisinin üretim payı Şekil 3’te verilmiştir.
Şekil 3’e göre doğal gazdan elde edilen elektrik enerjisinin üretim payı en yüksek 2008 yılında %49,7 olarak, en düşük 2000 yılında %37 olarak tespit edilmiştir. 2008 yılında toplam brüt elektrik enerjisi üretimi 198.418 GWh, 2000 yılında ise 124.922 GWh olarak gerçekleşmiştir. Kömür ve sıvı yakıtlardan elde edilen elektrik enerji üretimi ile doğal gazdan elde edilen elektrik enerji üretimi karşılaştırıldığında doğal gazın yüksek bir paya sahip olduğu görülmektedir. 2000-2013 yılları arasında hidrolik enerjiden elde edilen elektrik enerjisinin üretim payı Şekil 4’te verilmiştir.
Şekil 4’e göre hidrolik enerjiden elde edilen elektrik enerjisinin üretim payı en yüksek 2004 yılında %30,6, en düşük 2008 yılında %16,8 olarak tespit edilmiştir. 2004 yılında toplam brüt elektrik enerjisi üretimi 150.698 GWh, 2008 yılında ise 198.418 GWh olarak gerçekleşmiştir. 2000-2013 yılları arasında yenilenebilir enerji ve atıklardan elde edilen elektrik enerjisinin üretim payı Şekil 5’te verilmiştir.
Yenilenebilir enerji ve atıklardan elde edilen elektrik enerjisinin üretim payı en yüksek 2013 yılında %4,2, en düşük 2003-2006 yılları arasında %0,2 olarak belirlenmiştir (Şekil 5). 2013 yılında toplam brüt elektrik enerjisi üretimi 240.154 GWh, 2006 yılında ise 176.300 GWh olarak gerçekleşmiştir. Yenilenebilir enerji ve atıklardan elde edilen elektrik üretimi ile diğer enerji kaynaklarından elde edilen elektrik enerji üretim payları karşılaştırıldığında, yenilenebilir enerji ve atıklardan üretilen elektrik enerji üretim payının oldukça düşük olduğu gözlenmiştir. Türkiye’de 2000-2013 yılları arasında toplam kurulu güç değerleri Şekil 6’da verilmiştir.
Şekil 2. Sıvı yakıtlardan elde edilen elektrik enerjisi üretim payı. Şekil 4. Hidrolik enerjiden elde edilen elektrik enerjisi üretim payı.
Şekil 3. Doğal gazdan elde edilen elektrik enerjisi üretim payı. Şekil 5. Yenilenebilir enerji ve atıklardan elde edilen elektrik enerjisi üretim payı.

119
ICCI 2015 - Bildiriler Kitabı / Proceedings Book
Şekil 6’ya göre, 2000 yılından 2013 yılına kadar geçen süre içerisinde toplam kurulu güç değeri sürekli artmıştır. 2000 yılında toplam kurulu güç değeri 27.264 MW iken 2013 yılında 64.008 MW’dır. 2000 yılında 2013 yılına kadar toplam kurulu güç değeri yaklaşık 2.4 kat artış göstermiştir. 2000-2013 yılları arasında gerçekleşen toplam brüt elektrik üretim değerleri Şekil 7’de verilmiştir.
Şekil 7’ye göre Türkiye’de 2000-2013 yılları arasında en yüksek brüt üretim 2013 yılında 240.154 GWh olarak, en düşük brüt üretim 2001 yılında 122.724 GWh olarak gerçekleşmiştir. Genel olarak brüt üretim değerleri incelendiğinde 2000 yılından 2013 yılına kadar brüt elektrik üretiminde artış olduğu gözlenmiştir. 2000-2013 yılları arasında Türkiye’de elektrik enerjisi net tüketim değerleri Şekil 8’de verilmiştir.
Şekil 8’e göre Türkiye’nin en düşük net elektrik tüketim değeri 2001 yılında 97.070 GWh olarak, en yüksek 2013 yılında 198.042 GWh olarak gerçekleşmiştir. 2000 yılından 2013 yılına kadar geçen sürede elektrik üretiminde olduğu gibi net tüketim miktarlarında da bir artış olduğu gözlenmiştir. 2000 yılı ile 2013 yılı dikkate alındığında %101,5 oranında bir artış bulunmaktadır.
3. SONUÇSonuç olarak, Türkiye’de 2000-2013 yılları arasında en yüksek brüt elektrik üretimi 2013 yılında 240.154 GWh olarak, en düşük brüt elektrik üretim 2001 yılında 122.724 GWh olarak gerçekleşmiştir. Kömür ve sıvı yakıtlardan elde edilen elektrik enerji üretimi ile doğal gazdan elde edilen elektrik enerji üretimi karşılaştırıldığında doğal gazdan elde edilen elektrik üretim payının yüksek bir paya sahip olduğu görülmektedir. Yenilenebilir enerji ve atıklardan elde edilen elektrik üretimi ile diğer enerji kaynaklarından elde edilen elektrik enerji üretim payları karşılaştırıldığında yenilenebilir enerji ve atıklardan üretilen elektrik enerji üretim payının oldukça düşük bir paya sahip olduğu gözlenmiştir. 2000 yılından 2013 yılına kadar geçen süre içerisinde toplam kurulu güç değeri sürekli artmıştır. 2000 yılında toplam kurulu güç değeri 27.264 MW, 2013 yılında 64.008 MW olarak gerçekleşmiştir. 2000 yılından 2013 yılına kadar toplam kurulu güç değeri yaklaşık 2.4 kat artış göstermiştir. Genel olarak brüt üretim değerleri incelendiğinde 2000 yılından 2013 yılına kadar brüt üretimde artış olduğu gözlenmiştir. Türkiye’nin en düşük net elektrik tüketim değeri 2001 yılında 97.070 GWh olarak, en yüksek 2013 yılında 198.042 GWh olarak gerçeklemiştir. 2000 yılından 2013 yılına kadar geçen sürede elektrik üretiminde olduğu gibi net tüketim miktarlarında da bir artış olduğu gözlenmiştir. 2000 yılı ile 2013 yılı dikkate alındığında %101,5 oranında bir artış hesaplanmıştır.
KAYNAKLAR[1] Bacanlı G.Ü., 2006, Türkiye’de Enerji Kaynakları ve Hidroelektrik Enerjinin Önemi, Dünya Enerji Konseyi Türk Milli Komitesi, Türkiye 10. Enerji Kongresi, 27-30 Kasım, s.91-99, İstanbul. [2] ETKB, 2012, 2011 Yılı Genel Enerji Dengesi Tablosu, http://www.enerji.gov.tr. Erişim tarihi: 16.10.2013.[3] Yılmaz M., (2012). Türkiye’nin Enerji Potansiyeli ve Yenilenebilir Enerji Kaynaklarının Elektrik Enerjisi Üretimi Açısından Önemi, Ankara Üniversitesi Çevrebilimleri Dergisi, 4, (2), 33-54.
Şekil 6. Türkiye’nin 2000-2013 yılları arasındaki toplam kurulu güç değerleri.
Şekil 8. Türkiye’nin 2000-2013 yılları arasındaki net elektrik tüketim değerleri.
Şekil 7. Türkiye’nin 2000-2013 yılları arasındaki toplam brüt elektrik üretim değerleri.

120
ICCI 2015 - Bildiriler Kitabı / Proceedings Book
[4] TÜİK, Türkiye İstatistik Kurumu, www.tuik.gov.tr, Erişim Tarihi:29.12.2014.[5] TEİAŞ, Türkiye Elektrik Üretim-İletim İstatistikleri, www.teias.gov.tr, Erişim Tarihi:29.12.2014.
SUMMARY In this study, production and consumption of electric in Turkeybetween years of 2000 and 2013 were discussed and portions of electric energy production according to the sources were evaluated. Production portion of electric energy obtained from coal between years of 2000 and 2013 was highest (31.3%) in year 2001 and lowest (22.9%) in years 203 and 2004. Production portion of electric energy obtained from liquid fuels was highest (8.4%) in year 2001 and lowest (0.4%) in year 2011. Production portion of electric energy obtained from natural gas was highest (49.7%) in year 2008 and lowest (37%) in year 2000. Production portion of electric energy obtained from hydraulic energy was highest (30.6%) in year 2004 and lowest (16.8%) in year 2008. Production portion of electric energy obtained from renewable energy and wastes was highest (4.2%) in year 2013 and lowest (0.2%) between years 2003 and 2006. Total gross electric energy production was 240154 GWh in year 2013 and 124922 GWh in year 2000. The lowest net electric consumption value of Turkey was 97070 GWh in year 2001 and highest value was 98042 GWh in year 2013.
Keywords: Energy, Production, Electric, Consumption, Turkey
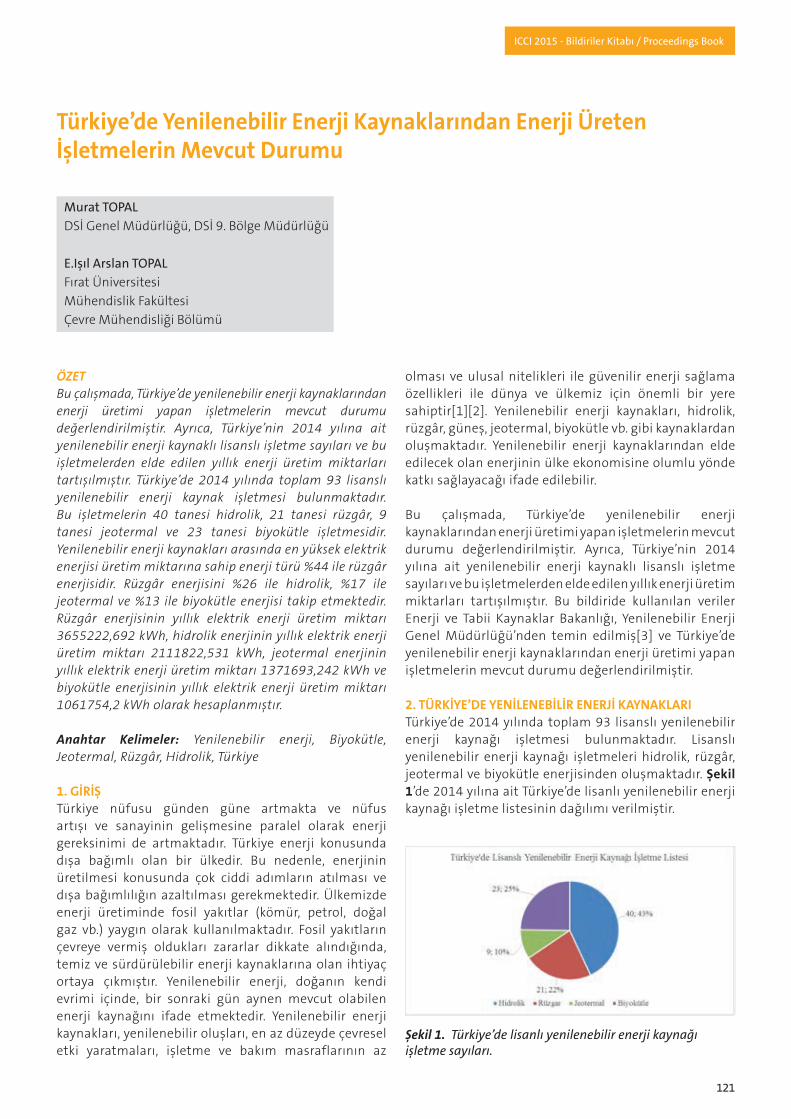
121
ICCI 2015 - Bildiriler Kitabı / Proceedings Book
ÖZETBu çalışmada, Türkiye’de yenilenebilir enerji kaynaklarından enerji üretimi yapan işletmelerin mevcut durumu değerlendirilmiştir. Ayrıca, Türkiye’nin 2014 yılına ait yenilenebilir enerji kaynaklı lisanslı işletme sayıları ve bu işletmelerden elde edilen yıllık enerji üretim miktarları tartışılmıştır. Türkiye’de 2014 yılında toplam 93 lisanslı yenilenebilir enerji kaynak işletmesi bulunmaktadır. Bu işletmelerin 40 tanesi hidrolik, 21 tanesi rüzgâr, 9 tanesi jeotermal ve 23 tanesi biyokütle işletmesidir. Yenilenebilir enerji kaynakları arasında en yüksek elektrik enerjisi üretim miktarına sahip enerji türü %44 ile rüzgâr enerjisidir. Rüzgâr enerjisini %26 ile hidrolik, %17 ile jeotermal ve %13 ile biyokütle enerjisi takip etmektedir. Rüzgâr enerjisinin yıllık elektrik enerji üretim miktarı 3655222,692 kWh, hidrolik enerjinin yıllık elektrik enerji üretim miktarı 2111822,531 kWh, jeotermal enerjinin yıllık elektrik enerji üretim miktarı 1371693,242 kWh ve biyokütle enerjisinin yıllık elektrik enerji üretim miktarı 1061754,2 kWh olarak hesaplanmıştır.
Anahtar Kelimeler: Yenilenebilir enerji, Biyokütle, Jeotermal, Rüzgâr, Hidrolik, Türkiye
1. GİRİŞTürkiye nüfusu günden güne artmakta ve nüfus artışı ve sanayinin gelişmesine paralel olarak enerji gereksinimi de artmaktadır. Türkiye enerji konusunda dışa bağımlı olan bir ülkedir. Bu nedenle, enerjinin üretilmesi konusunda çok ciddi adımların atılması ve dışa bağımlılığın azaltılması gerekmektedir. Ülkemizde enerji üretiminde fosil yakıtlar (kömür, petrol, doğal gaz vb.) yaygın olarak kullanılmaktadır. Fosil yakıtların çevreye vermiş oldukları zararlar dikkate alındığında, temiz ve sürdürülebilir enerji kaynaklarına olan ihtiyaç ortaya çıkmıştır. Yenilenebilir enerji, doğanın kendi evrimi içinde, bir sonraki gün aynen mevcut olabilen enerji kaynağını ifade etmektedir. Yenilenebilir enerji kaynakları, yenilenebilir oluşları, en az düzeyde çevresel etki yaratmaları, işletme ve bakım masraflarının az
olması ve ulusal nitelikleri ile güvenilir enerji sağlama özellikleri ile dünya ve ülkemiz için önemli bir yere sahiptir[1][2]. Yenilenebilir enerji kaynakları, hidrolik, rüzgâr, güneş, jeotermal, biyokütle vb. gibi kaynaklardan oluşmaktadır. Yenilenebilir enerji kaynaklarından elde edilecek olan enerjinin ülke ekonomisine olumlu yönde katkı sağlayacağı ifade edilebilir.
Bu çalışmada, Türkiye’de yenilenebilir enerji kaynaklarından enerji üretimi yapan işletmelerin mevcut durumu değerlendirilmiştir. Ayrıca, Türkiye’nin 2014 yılına ait yenilenebilir enerji kaynaklı lisanslı işletme sayıları ve bu işletmelerden elde edilen yıllık enerji üretim miktarları tartışılmıştır. Bu bildiride kullanılan veriler Enerji ve Tabii Kaynaklar Bakanlığı, Yenilenebilir Enerji Genel Müdürlüğü’nden temin edilmiş[3] ve Türkiye’de yenilenebilir enerji kaynaklarından enerji üretimi yapan işletmelerin mevcut durumu değerlendirilmiştir.
2. TÜRKİYE’DE YENİLENEBİLİR ENERJİ KAYNAKLARITürkiye’de 2014 yılında toplam 93 lisanslı yenilenebilir enerji kaynağı işletmesi bulunmaktadır. Lisanslı yenilenebilir enerji kaynağı işletmeleri hidrolik, rüzgâr, jeotermal ve biyokütle enerjisinden oluşmaktadır. Şekil 1’de 2014 yılına ait Türkiye’de lisanlı yenilenebilir enerji kaynağı işletme listesinin dağılımı verilmiştir.
Türkiye’de Yenilenebilir Enerji Kaynaklarından Enerji Üreten İşletmelerin Mevcut Durumu
MuratTOPALDSİ Genel Müdürlüğü, DSİ 9. Bölge Müdürlüğü
E.IşılArslanTOPALFırat ÜniversitesiMühendislik FakültesiÇevre Mühendisliği Bölümü
Şekil 1. Türkiye’de lisanlı yenilenebilir enerji kaynağı işletme sayıları.
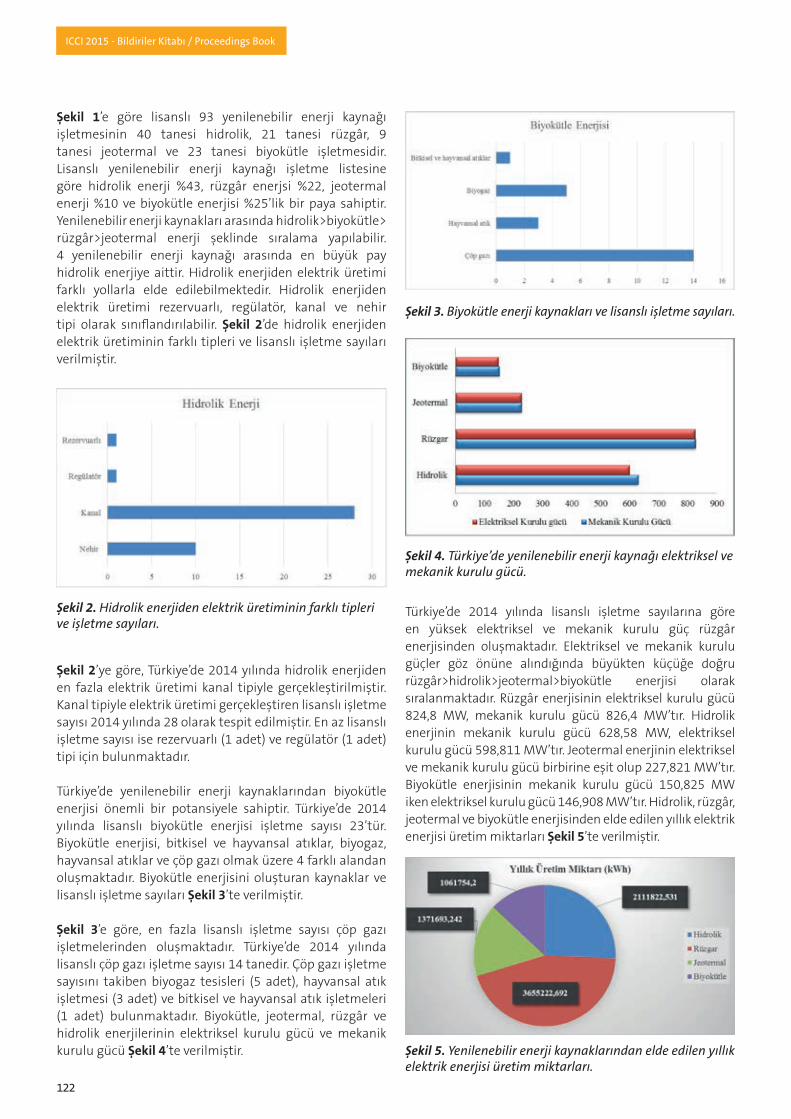
122
ICCI 2015 - Bildiriler Kitabı / Proceedings Book
Şekil 1’e göre lisanslı 93 yenilenebilir enerji kaynağı işletmesinin 40 tanesi hidrolik, 21 tanesi rüzgâr, 9 tanesi jeotermal ve 23 tanesi biyokütle işletmesidir. Lisanslı yenilenebilir enerji kaynağı işletme listesine göre hidrolik enerji %43, rüzgâr enerjsi %22, jeotermal enerji %10 ve biyokütle enerjisi %25’lik bir paya sahiptir. Yenilenebilir enerji kaynakları arasında hidrolik>biyokütle> rüzgâr>jeotermal enerji şeklinde sıralama yapılabilir. 4 yenilenebilir enerji kaynağı arasında en büyük pay hidrolik enerjiye aittir. Hidrolik enerjiden elektrik üretimi farklı yollarla elde edilebilmektedir. Hidrolik enerjiden elektrik üretimi rezervuarlı, regülatör, kanal ve nehir tipi olarak sınıflandırılabilir. Şekil 2’de hidrolik enerjiden elektrik üretiminin farklı tipleri ve lisanslı işletme sayıları verilmiştir.
Şekil 2’ye göre, Türkiye’de 2014 yılında hidrolik enerjiden en fazla elektrik üretimi kanal tipiyle gerçekleştirilmiştir. Kanal tipiyle elektrik üretimi gerçekleştiren lisanslı işletme sayısı 2014 yılında 28 olarak tespit edilmiştir. En az lisanslı işletme sayısı ise rezervuarlı (1 adet) ve regülatör (1 adet) tipi için bulunmaktadır.
Türkiye’de yenilenebilir enerji kaynaklarından biyokütle enerjisi önemli bir potansiyele sahiptir. Türkiye’de 2014 yılında lisanslı biyokütle enerjisi işletme sayısı 23’tür. Biyokütle enerjisi, bitkisel ve hayvansal atıklar, biyogaz, hayvansal atıklar ve çöp gazı olmak üzere 4 farklı alandan oluşmaktadır. Biyokütle enerjisini oluşturan kaynaklar ve lisanslı işletme sayıları Şekil 3’te verilmiştir.
Şekil 3’e göre, en fazla lisanslı işletme sayısı çöp gazı işletmelerinden oluşmaktadır. Türkiye’de 2014 yılında lisanslı çöp gazı işletme sayısı 14 tanedir. Çöp gazı işletme sayısını takiben biyogaz tesisleri (5 adet), hayvansal atık işletmesi (3 adet) ve bitkisel ve hayvansal atık işletmeleri (1 adet) bulunmaktadır. Biyokütle, jeotermal, rüzgâr ve hidrolik enerjilerinin elektriksel kurulu gücü ve mekanik kurulu gücü Şekil 4’te verilmiştir.
Türkiye’de 2014 yılında lisanslı işletme sayılarına göre en yüksek elektriksel ve mekanik kurulu güç rüzgâr enerjisinden oluşmaktadır. Elektriksel ve mekanik kurulu güçler göz önüne alındığında büyükten küçüğe doğru rüzgâr>hidrolik>jeotermal>biyokütle enerjisi olarak sıralanmaktadır. Rüzgâr enerjisinin elektriksel kurulu gücü 824,8 MW, mekanik kurulu gücü 826,4 MW’tır. Hidrolik enerjinin mekanik kurulu gücü 628,58 MW, elektriksel kurulu gücü 598,811 MW’tır. Jeotermal enerjinin elektriksel ve mekanik kurulu gücü birbirine eşit olup 227,821 MW’tır. Biyokütle enerjisinin mekanik kurulu gücü 150,825 MW iken elektriksel kurulu gücü 146,908 MW’tır. Hidrolik, rüzgâr, jeotermal ve biyokütle enerjisinden elde edilen yıllık elektrik enerjisi üretim miktarları Şekil 5’te verilmiştir.
Şekil 2. Hidrolik enerjiden elektrik üretiminin farklı tipleri ve işletme sayıları.
Şekil 3. Biyokütle enerji kaynakları ve lisanslı işletme sayıları.
Şekil 4. Türkiye’de yenilenebilir enerji kaynağı elektriksel ve mekanik kurulu gücü.
Şekil 5. Yenilenebilir enerji kaynaklarından elde edilen yıllık elektrik enerjisi üretim miktarları.
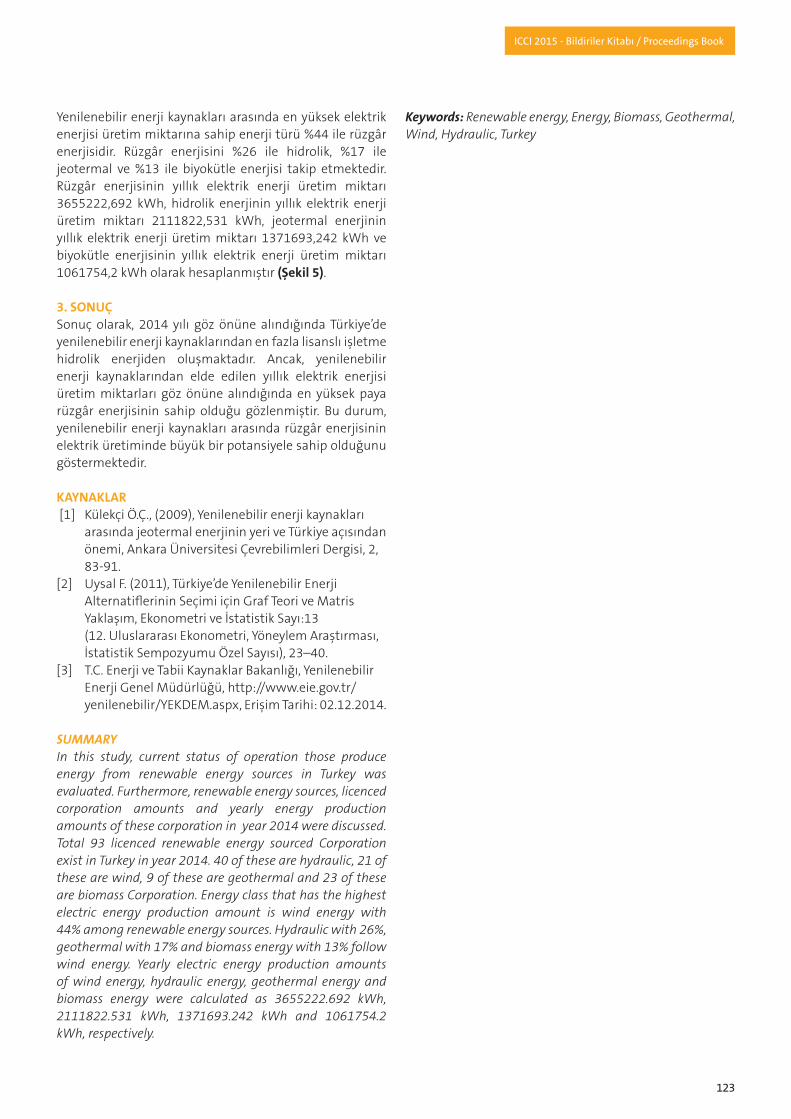
123
ICCI 2015 - Bildiriler Kitabı / Proceedings Book
Yenilenebilir enerji kaynakları arasında en yüksek elektrik enerjisi üretim miktarına sahip enerji türü %44 ile rüzgâr enerjisidir. Rüzgâr enerjisini %26 ile hidrolik, %17 ile jeotermal ve %13 ile biyokütle enerjisi takip etmektedir. Rüzgâr enerjisinin yıllık elektrik enerji üretim miktarı 3655222,692 kWh, hidrolik enerjinin yıllık elektrik enerji üretim miktarı 2111822,531 kWh, jeotermal enerjinin yıllık elektrik enerji üretim miktarı 1371693,242 kWh ve biyokütle enerjisinin yıllık elektrik enerji üretim miktarı 1061754,2 kWh olarak hesaplanmıştır (Şekil 5).
3. SONUÇSonuç olarak, 2014 yılı göz önüne alındığında Türkiye’de yenilenebilir enerji kaynaklarından en fazla lisanslı işletme hidrolik enerjiden oluşmaktadır. Ancak, yenilenebilir enerji kaynaklarından elde edilen yıllık elektrik enerjisi üretim miktarları göz önüne alındığında en yüksek paya rüzgâr enerjisinin sahip olduğu gözlenmiştir. Bu durum, yenilenebilir enerji kaynakları arasında rüzgâr enerjisinin elektrik üretiminde büyük bir potansiyele sahip olduğunu göstermektedir.
KAYNAKLAR [1] Külekçi Ö.Ç., (2009), Yenilenebilir enerji kaynakları arasında jeotermal enerjinin yeri ve Türkiye açısından önemi, Ankara Üniversitesi Çevrebilimleri Dergisi, 2, 83-91.[2] Uysal F. (2011), Türkiye’de Yenilenebilir Enerji Alternatiflerinin Seçimi için Graf Teori ve Matris Yaklaşım, Ekonometri ve İstatistik Sayı:13 (12. Uluslararası Ekonometri, Yöneylem Araştırması, İstatistik Sempozyumu Özel Sayısı), 23–40.[3] T.C. Enerji ve Tabii Kaynaklar Bakanlığı, Yenilenebilir Enerji Genel Müdürlüğü, http://www.eie.gov.tr/ yenilenebilir/YEKDEM.aspx, Erişim Tarihi: 02.12.2014.
SUMMARY In this study, current status of operation those produce energy from renewable energy sources in Turkey was evaluated. Furthermore, renewable energy sources, licenced corporation amounts and yearly energy production amounts of these corporation in year 2014 were discussed. Total 93 licenced renewable energy sourced Corporation exist in Turkey in year 2014. 40 of these are hydraulic, 21 of these are wind, 9 of these are geothermal and 23 of these are biomass Corporation. Energy class that has the highest electric energy production amount is wind energy with 44% among renewable energy sources. Hydraulic with 26%, geothermal with 17% and biomass energy with 13% follow wind energy. Yearly electric energy production amounts of wind energy, hydraulic energy, geothermal energy and biomass energy were calculated as 3655222.692 kWh, 2111822.531 kWh, 1371693.242 kWh and 1061754.2 kWh, respectively.
Keywords: Renewable energy, Energy, Biomass, Geothermal, Wind, Hydraulic, Turkey

124
ICCI 2015 - Bildiriler Kitabı / Proceedings Book
ÖZETBu çalışmada, Türkiye’de yenilenebilir enerji kaynaklarının kurulu gücü ve yenilenebilir enerji kaynaklarından elde edilen elektrik enerjisinin üretim miktarları değerlendirilmiştir. Lisanslı yenilenebilir enerji kaynağı işletme sayısı 2011 yılında 20 adet, 2012 yılında 78 adet, 2013 yılında 38 adet ve 2014 yılında 93 adet olarak belirlenmiştir. 2012 yılında hidrolik enerjiye ait mekanik kurulu güç 971,33 MW, elektriksel kurulu güç 929,64 MW olarak hesaplanmıştır. 2014 yılında rüzgâr enerjisine ait mekanik kurulu güç 826,4 MW, elektriksel kurulu güç 824,8 MW olarak hesaplanmıştır. 2014 yılında jeotermal enerjiye ait mekanik ve elektriksel kurulu güç 227,821 MW olarak hesaplanmıştır. 2014 yılında biyokütle enerjisine ait mekanik kurulu güç 150,825 MW, elektriksel kurulu güç 146,908 MW olarak hesaplanmıştır. Yenilenebilir enerji kaynaklarından hidrolik, rüzgâr, jeotermal ve biyokütle enerjisinden elde edilen yıllık enerji miktarı en yüksek 2014 yılında 8200492,665 kWh olarak gerçeklemiş olup en düşük yıllık enerji miktarı 2011 yılında 2737097,779 kWh olarak gerçekleşmiştir.
Anahtar Kelimeler: Enerji, Yenilenebilir enerji, Üretim, Güç, Türkiye
1. GİRİŞTürkiye, bir taraftan yerli kaynakların aranma faaliyetlerini yoğunlaştırırken, bir taraftan da yenilenebilir enerji kaynaklarının devreye alınması, enerji verimliliğinin artırılması, ülkenin coğrafi konumundan yararlanılması gibi diğer mümkün potansiyellerini harekete geçirmenin çabası içinde bulunmaktadır[1]. Enerjide sürekliliğin sağlanması, dışa bağımlılığın azaltılması ve yerli kaynaklarımızın kullanılması önem arz etmektedir. Ülkemizde enerji üretiminde bugüne kadar fosil yakıtlar kullanılmış ve son zamanlarda yenilenebilir enerji kaynaklarının kullanılması konusu önemli hale gelmiştir. Yenilenebilir enerji kaynakları, hidrolik, jeotermal, biyokütle, dalga, güneş ve rüzgâr enerjisi gibi enerji kaynaklarından oluşmaktadır. Hidrolik enerji, suyun potansiyel enerjisinin kinetik enerjiye dönüştürülmesi
sonucu elde edilen bir enerji türüdür. Hidrolik enerjiden yaygın olarak, nehirler üzerine barajlar inşa ederek, suyun potansiyel enerjisini elektrik enerjisine dönüştürmek suretiyle enerji elde edilmektedir. ABD’de enerji ihtiyacının %10’u hidrolik enerjiden sağlanmaktadır[2][3]. Rüzgâr enerjisi, yenilenebilir enerjiler arasındaki en gelişmiş ve ticari açıdan en elverişli enerji türüdür. Rüzgâr enerjisi doğa ile uyumlu olup hem çevreye en az zarar veren hem de tükenme ihtimali olmayan bir enerji kaynağıdır[4]. Jeotermal enerji, yerkabuğunun çeşitli derinliklerinde birikmiş ısının oluşturduğu, sıcaklıkları sürekli olarak bölgesel atmosferik ortalama sıcaklığın üzerinde olan ve çevresindeki normal yeraltı ve yerüstü sularına göre daha fazla erimiş mineral, çeşitli tuzlar ve gazlar içerebilen sıcak su ve buhar olarak tanımlanabilir[5]. Türkiye’de yapılan çalışmalardan şimdiye kadar 600 civarında irili ufaklı ve sıcaklıkları 20oC ila 100oC arasında değişen jeotermal kaynak bulunmuştur. Bu kaynaklar genel olarak Kuzey Anadolu fay hattının yakınlarında, deprem yörelerinde ve son zaman volkanlarının bulunduğu yerlerdedir[5][6]. Biyokütle enerjisi, tükenmez bir kaynak olması, özellikle kırsal alanlar için sosyo-ekonomik gelişmelere yardımcı olması nedeniyle uygun ve önemli bir enerji kaynağı olarak görülmektedir[7][8]. Türkiye’de yenilenebilir enerji kaynaklarının kullanılması hususunda gerekli mevzuatlar çıkarılmış ve işletmecilere teşvikler sağlanarak yenilenebilir enerji kaynaklarının enerji üretimindeki payının artırılması sağlanmıştır. Bu çalışmada, Türkiye’de yenilenebilir enerji kaynaklarının kurulu gücü ve yenilenebilir enerji kaynaklarından elde edilen elektrik enerjisinin üretim miktarları değerlendirilmiştir. Bu bildiride kullanılan veriler Enerji ve Tabii Kaynaklar Bakanlığı, Yenilenebilir Enerji Genel Müdürlüğü’nden derlenmiştir[9].
2. YENİLENEBİLİR ENERJİ KAYNAKLARININ KURULU GÜCÜ VE YILLIK ÜRETİM MİKTARLARIYenilenebilir enerji kaynaklarından hidrolik, rüzgâr, jeotermal ve biyokütle enerjisinin 2011-2014 yılları arasında tespit edilen lisanslı işletme sayıları Şekil 1’de verilmiştir.
Türkiye’de Yenilenebilir Enerji Kaynaklarının Kurulu Gücü ve Üretim Miktarlarının Değerlendirilmesi
MuratTOPALDSİ Genel Müdürlüğü, DSİ 9. Bölge Müdürlüğü
E.IşılArslanTOPALFırat ÜniversitesiMühendislik FakültesiÇevre Mühendisliği Bölümü

125
ICCI 2015 - Bildiriler Kitabı / Proceedings Book
Şekil 1’e göre, lisanslı işletme sayıları göz önüne alındığında en fazla lisanslı işletme sayısı; 2011 yılında rüzgâr enerjisi, 2012 yılında hidrolik enerji, 2013 yılında biyokütle enerjisi ve 2014 yılında hidrolik enerji alanında yer almıştır. Lisanslı yenilenebilir enerji kaynakları işletme sayısı 2011 yılında 20 adet, 2012 yılında 78 adet, 2013 yılında 38 adet ve 2014 yılında 93 adet olarak belirlenmiştir. Bu nedenle, toplam lisanslı yenilenebilir enerji kaynakları işletme sayısı büyükten küçüğe doğru 2014>2012>2013>2011 olarak sıralanabilir. İşletme sayılarına göre, yenilenebilir enerji kaynaklarının yıllara göre elektriksel ve mekanik kurulu güçleri hesaplanmıştır. Yenilenebilir enerji kaynaklarından hidrolik enerjiye ait mekanik ve elektriksel kurulu güç değerleri Şekil 2’de verilmiştir.
Şekil 2 değerlendirildiğinde hidrolik enerjiye ait en yüksek mekanik ve elektriksel kurulu güç 2012 yılında, en düşük mekanik ve elektriksel kurulu güç 2011 yılında tespit edilmiştir. 2012 yılında hidrolik enerjiye ait mekanik kurulu güç 971,33 MW, elektriksel kurulu güç 929,64 MW olarak hesaplanmıştır. 2011 yılında mekanik kurulu güç 22,044 MW, elektriksel kurulu güç 21,04 MW olarak hesaplanmıştır. 2014 yılında lisanslı işletme sayısı dikkate alındığında hidrolik enerjinin mekanik kurulu gücü 628,58 MW, elektriksel kurulu gücü 598,811 MW
olarak belirlenmiştir. Hidrolik enerjinin mekanik ve elektriksel kurulu gücü yıllara göre büyükten küçüğe doğru 2014>2012>2013>2011 şeklinde sıralanabilir. Yenilenebilir enerji kaynaklarından rüzgâr enerjisine ait mekanik ve elektriksel kurulu güç değerleri Şekil 3’te verilmiştir.
Şekil 3’e göre, en yüksek mekanik ve elektriksel kurulu güç 2014 yılında, en düşük mekanik ve elektriksel kurulu güç 2013 yılında tespit edilmiştir. 2014 yılında rüzgâr enerjisine ait mekanik kurulu güç 826,4 MW, elektriksel kurulu güç 824,8 MW olarak hesaplanmıştır. 2013 yılında mekanik kurulu güç ve elektriksel kurulu güç 75,9 MW olarak hesaplanmıştır. Rüzgâr enerjisinin mekanik ve elektriksel kurulu gücü yıllara göre büyükten küçüğe doğru 2014>2012>2011>2013 şeklinde sıralanabilir. Yenilenebilir enerji kaynaklarından jeotermal enerjiye ait mekanik ve elektriksel kurulu güç değerleri Şekil 4’te verilmiştir.
Şekil 4’e göre, en yüksek mekanik ve elektriksel kurulu güç 2014 yılında, en düşük mekanik ve elektriksel kurulu güç 2011 ve 2012 yıllarında tespit edilmiştir. 2014 yılında jeotermal enerjiye ait mekanik ve elektriksel kurulu güç 227,821 MW olarak hesaplanmıştır. 2011 ve 2012
Şekil 1. Lisanslı yenilenebilir enerji kaynakları işletme sayıları.
Şekil 3. Rüzgâr enerjisine ait mekanik ve elektriksel kurulu güç değerleri.
Şekil 4. Jeotermal enerjiye ait mekanik ve elektriksel kurulu güç değerleri.
Şekil 2. Hidrolik enerjiye ait mekanik ve elektriksel kurulu güç değerleri.
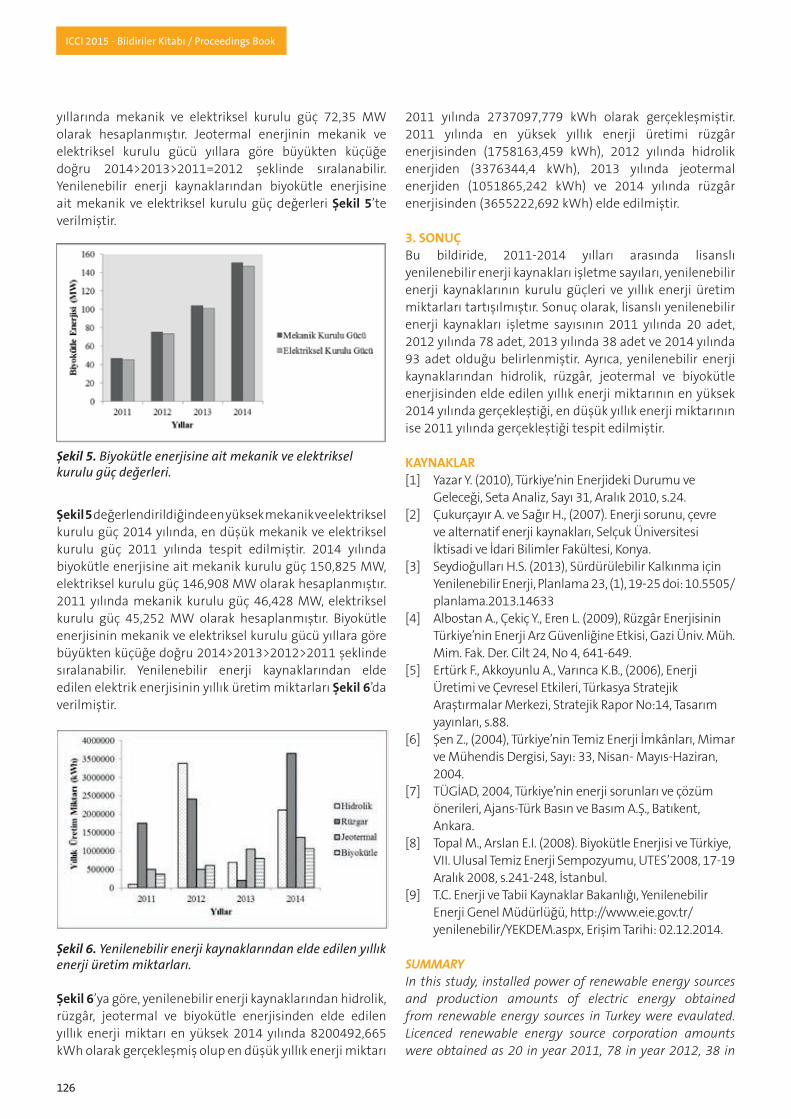
126
ICCI 2015 - Bildiriler Kitabı / Proceedings Book
yıllarında mekanik ve elektriksel kurulu güç 72,35 MW olarak hesaplanmıştır. Jeotermal enerjinin mekanik ve elektriksel kurulu gücü yıllara göre büyükten küçüğe doğru 2014>2013>2011=2012 şeklinde sıralanabilir. Yenilenebilir enerji kaynaklarından biyokütle enerjisine ait mekanik ve elektriksel kurulu güç değerleri Şekil 5’te verilmiştir.
Şekil 5 değerlendirildiğinde en yüksek mekanik ve elektriksel kurulu güç 2014 yılında, en düşük mekanik ve elektriksel kurulu güç 2011 yılında tespit edilmiştir. 2014 yılında biyokütle enerjisine ait mekanik kurulu güç 150,825 MW, elektriksel kurulu güç 146,908 MW olarak hesaplanmıştır. 2011 yılında mekanik kurulu güç 46,428 MW, elektriksel kurulu güç 45,252 MW olarak hesaplanmıştır. Biyokütle enerjisinin mekanik ve elektriksel kurulu gücü yıllara göre büyükten küçüğe doğru 2014>2013>2012>2011 şeklinde sıralanabilir. Yenilenebilir enerji kaynaklarından elde edilen elektrik enerjisinin yıllık üretim miktarları Şekil 6’da verilmiştir.
Şekil 6’ya göre, yenilenebilir enerji kaynaklarından hidrolik, rüzgâr, jeotermal ve biyokütle enerjisinden elde edilen yıllık enerji miktarı en yüksek 2014 yılında 8200492,665 kWh olarak gerçekleşmiş olup en düşük yıllık enerji miktarı
2011 yılında 2737097,779 kWh olarak gerçekleşmiştir. 2011 yılında en yüksek yıllık enerji üretimi rüzgâr enerjisinden (1758163,459 kWh), 2012 yılında hidrolik enerjiden (3376344,4 kWh), 2013 yılında jeotermal enerjiden (1051865,242 kWh) ve 2014 yılında rüzgâr enerjisinden (3655222,692 kWh) elde edilmiştir.
3. SONUÇBu bildiride, 2011-2014 yılları arasında lisanslı yenilenebilir enerji kaynakları işletme sayıları, yenilenebilir enerji kaynaklarının kurulu güçleri ve yıllık enerji üretim miktarları tartışılmıştır. Sonuç olarak, lisanslı yenilenebilir enerji kaynakları işletme sayısının 2011 yılında 20 adet, 2012 yılında 78 adet, 2013 yılında 38 adet ve 2014 yılında 93 adet olduğu belirlenmiştir. Ayrıca, yenilenebilir enerji kaynaklarından hidrolik, rüzgâr, jeotermal ve biyokütle enerjisinden elde edilen yıllık enerji miktarının en yüksek 2014 yılında gerçekleştiği, en düşük yıllık enerji miktarının ise 2011 yılında gerçekleştiği tespit edilmiştir.
KAYNAKLAR[1] Yazar Y. (2010), Türkiye’nin Enerjideki Durumu ve Geleceği, Seta Analiz, Sayı 31, Aralık 2010, s.24.[2] Çukurçayır A. ve Sağır H., (2007). Enerji sorunu, çevre ve alternatif enerji kaynakları, Selçuk Üniversitesi İktisadi ve İdari Bilimler Fakültesi, Konya.[3] Seydioğulları H.S. (2013), Sürdürülebilir Kalkınma için Yenilenebilir Enerji, Planlama 23, (1), 19-25 doi: 10.5505/ planlama.2013.14633 [4] Albostan A., Çekiç Y., Eren L. (2009), Rüzgâr Enerjisinin Türkiye’nin Enerji Arz Güvenliğine Etkisi, Gazi Üniv. Müh. Mim. Fak. Der. Cilt 24, No 4, 641-649.[5] Ertürk F., Akkoyunlu A., Varınca K.B., (2006), Enerji Üretimi ve Çevresel Etkileri, Türkasya Stratejik Araştırmalar Merkezi, Stratejik Rapor No:14, Tasarım yayınları, s.88. [6] Şen Z., (2004), Türkiye’nin Temiz Enerji İmkânları, Mimar ve Mühendis Dergisi, Sayı: 33, Nisan- Mayıs-Haziran, 2004.[7] TÜGİAD, 2004, Türkiye’nin enerji sorunları ve çözüm önerileri, Ajans-Türk Basın ve Basım A.Ş., Batıkent, Ankara.[8] Topal M., Arslan E.I. (2008). Biyokütle Enerjisi ve Türkiye, VII. Ulusal Temiz Enerji Sempozyumu, UTES’2008, 17-19 Aralık 2008, s.241-248, İstanbul.[9] T.C. Enerji ve Tabii Kaynaklar Bakanlığı, Yenilenebilir Enerji Genel Müdürlüğü, http://www.eie.gov.tr/ yenilenebilir/YEKDEM.aspx, Erişim Tarihi: 02.12.2014.
SUMMARY In this study, installed power of renewable energy sources and production amounts of electric energy obtained from renewable energy sources in Turkey were evaulated. Licenced renewable energy source corporation amounts were obtained as 20 in year 2011, 78 in year 2012, 38 in
Şekil 5. Biyokütle enerjisine ait mekanik ve elektriksel kurulu güç değerleri.
Şekil 6. Yenilenebilir enerji kaynaklarından elde edilen yıllık enerji üretim miktarları.

127
ICCI 2015 - Bildiriler Kitabı / Proceedings Book
year 2013 and 93 in year 2014. Mechanic installed capacity and electrical installed capacity of hydraulic energy were calculated as 971.33 MW and 929.64 MW, respectively in year 2012. Mechanic and electrical installed capasity of wind energy were calculated as 826.4 MW and 824.8 MW, respectively in year 2014. Mechanic installed capacity and electrical installed capacity of geothermal energy was calculated as 227.821 MW in year 2014. Mechanic installed capacity and electrical installed capacity of biomass energy was calculated as 150.825 MW and 146.908 MW, respectively in year 2014.Yearly energy amount obtained from renewable energy sources of hydraulic, wind, geothermal and biomass energy was highest in year 2014 as 8200492.665 kWh while the yearly lowest energy amount was 2737097.779 kWh in year 2011.
Keywords: Energy, Renewable energy, Production, Power, Turkey
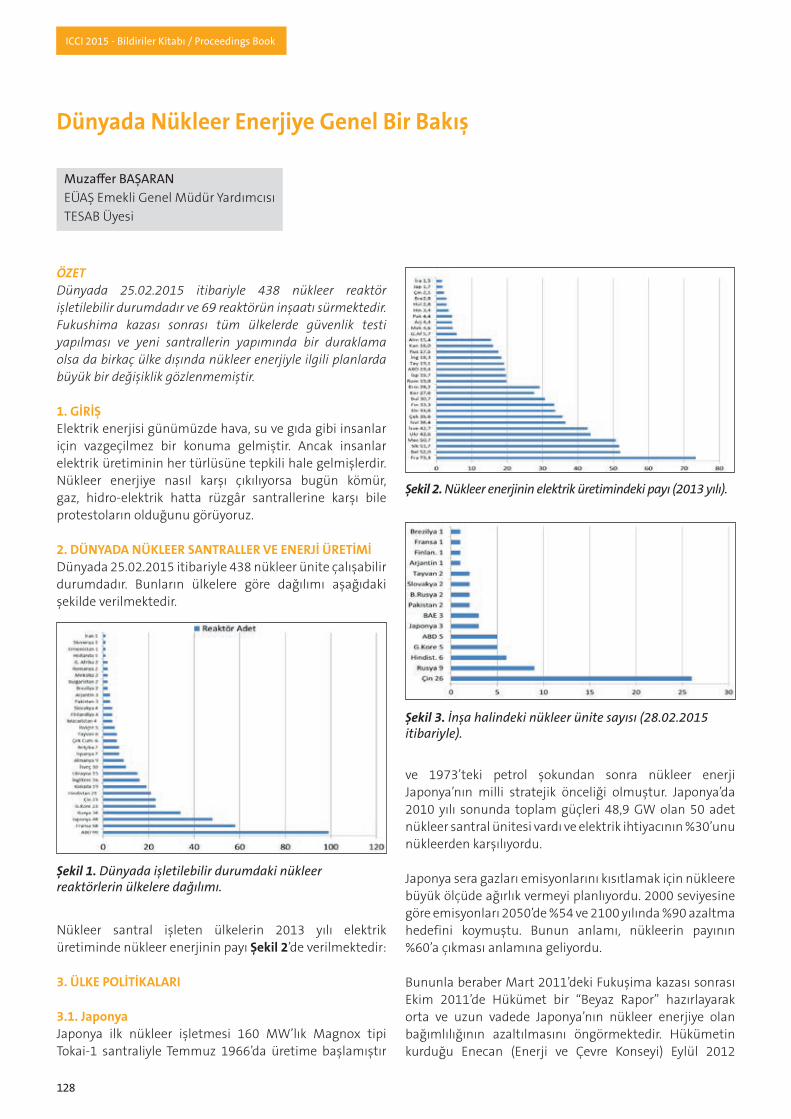
128
ICCI 2015 - Bildiriler Kitabı / Proceedings Book
ÖZETDünyada 25.02.2015 itibariyle 438 nükleer reaktör işletilebilir durumdadır ve 69 reaktörün inşaatı sürmektedir. Fukushima kazası sonrası tüm ülkelerde güvenlik testi yapılması ve yeni santrallerin yapımında bir duraklama olsa da birkaç ülke dışında nükleer enerjiyle ilgili planlarda büyük bir değişiklik gözlenmemiştir.
1. GİRİŞElektrik enerjisi günümüzde hava, su ve gıda gibi insanlar için vazgeçilmez bir konuma gelmiştir. Ancak insanlar elektrik üretiminin her türlüsüne tepkili hale gelmişlerdir. Nükleer enerjiye nasıl karşı çıkılıyorsa bugün kömür, gaz, hidro-elektrik hatta rüzgâr santrallerine karşı bile protestoların olduğunu görüyoruz.
2. DÜNYADA NÜKLEER SANTRALLER VE ENERJİ ÜRETİMİDünyada 25.02.2015 itibariyle 438 nükleer ünite çalışabilir durumdadır. Bunların ülkelere göre dağılımı aşağıdaki şekilde verilmektedir.
Nükleer santral işleten ülkelerin 2013 yılı elektrik üretiminde nükleer enerjinin payı Şekil 2’de verilmektedir:
3. ÜLKE POLİTİKALARI
3.1. Japonya Japonya ilk nükleer işletmesi 160 MW’lık Magnox tipi Tokai-1 santraliyle Temmuz 1966’da üretime başlamıştır
ve 1973’teki petrol şokundan sonra nükleer enerji Japonya’nın milli stratejik önceliği olmuştur. Japonya’da 2010 yılı sonunda toplam güçleri 48,9 GW olan 50 adet nükleer santral ünitesi vardı ve elektrik ihtiyacının %30’unu nükleerden karşılıyordu.
Japonya sera gazları emisyonlarını kısıtlamak için nükleere büyük ölçüde ağırlık vermeyi planlıyordu. 2000 seviyesine göre emisyonları 2050’de %54 ve 2100 yılında %90 azaltma hedefini koymuştu. Bunun anlamı, nükleerin payının %60’a çıkması anlamına geliyordu.
Bununla beraber Mart 2011’deki Fukuşima kazası sonrası Ekim 2011’de Hükümet bir “Beyaz Rapor” hazırlayarak orta ve uzun vadede Japonya’nın nükleer enerjiye olan bağımlılığının azaltılmasını öngörmektedir. Hükümetin kurduğu Enecan (Enerji ve Çevre Konseyi) Eylül 2012
Dünyada Nükleer Enerjiye Genel Bir Bakış
MuzafferBAŞARANEÜAŞ Emekli Genel Müdür YardımcısıTESAB Üyesi
Şekil 1. Dünyada işletilebilir durumdaki nükleer reaktörlerin ülkelere dağılımı.
Şekil 2. Nükleer enerjinin elektrik üretimindeki payı (2013 yılı).
Şekil 3. İnşa halindeki nükleer ünite sayısı (28.02.2015 itibariyle).

129
ICCI 2015 - Bildiriler Kitabı / Proceedings Book
tarihli raporunda nükleer santrallerin 2040’a kadar kapatılmasını tavsiye etmektedir. Ancak Kasım 2012’de göreve başlayan hükümet bu raporu dikkate almayarak güvenli raporu verilen santrallerin yeniden başlatılması ve durdurulan Ohma 1 ve Shimane 3’ün inşaatlarının yeniden başlamasına karar verdi.
Fukuşima kazası sonrası Japonya’nın 50 reaktöründen 17’si devredeydi, ancak kazadan sonra reaktörler tamamen durdurulmuştur. Bilahare deniz kenarındaki nükleer santrallerde tsunamiye karşı alınan önlemler artırılmıştır. Nisan 2012 ortasında çok sayıda üst seviye toplantısı sonrası Japon Hükümeti, testleri ve tedbirleri tamamlamış olan Kansai elektrik firmasının Ohi Nükleer Santrali’nin 3. ve 4. ünitelerinin yeniden devreye alınmalarını onayladı ve Temmuz 2012’de devreye alındılar. Çünkü bu üniteler olmadan 2012 yaz puantında elektrik üretimi ihtiyacı karşılanamayacaktı.
Japonya’nın yeni Nükleer Düzenleyici Kurulu NRA, Ekim 2012’de görevi NISA ve NSC’den devraldı ve yeni güvenlik tedbirleri Temmuz 2013’te yürürlüğe girdi. Daha sonra nükleer santral işleten şirketler 20 nükleer ünitenin devreye alınması için NRA’ya başvurdular ve şu anda NRA santrallerde inceleme ve testleri yürütmektedir. Şubat 2015’te Takahama Santrali’nin başlatılması için nihai onay verildi.
3.2. AlmanyaAlmanya 2011 Mart ayına kadar, kurulu güçleri 20.339 MW olan 17 nükleer reaktöründen elektrik ihtiyacının yaklaşık dörtte birini karşılıyordu. 2013 yılında ise üretilen 635 TWh’lik elektriğin %47’si kömürden, %16’sı nükleerden, %11’i gazdan, %9’u bioyakıt ve atıktan, %8’i rüzgârdan, %4’ü hidro elektrikten ve %5’i güneş enerjisinden sağlandı.
Mart 2011’deki Fukuşima kazası sonrası Başbakan Merkel, 1980 öncesi yapılan 7 nükleer santralle, uzun süredir bakımda olan Kruemmel Santrali’nin tamamen kapatılmasını, diğerlerinde stres testleri yapılması ve nükleer politikaların gözden geçirilmesi için kapatılmaları kararını verdi. Mayıs 2011’de RSK (Reaktör Güvenlik Komisyonu) tüm reaktörlerin sağlam ve güvenli olduğuna dair rapor verse de Alman Hükümeti daha önce yürürlüğe konmuş olan “kapatma kararı”nı tekrar gündeme getirerek zaten kapatılmış olan 8 nükleer santralin dışındaki 9 santralin de 2022’ye kadar kapatılması için kanun hazırladı ve kanun Parlamentoda onaylandı.
Almanya’da nükleer santral işleten 4 şirket; E-On, RWE, Vattenfall ve EnbW kapatılan nükleer santrallerde devam eden nükleer yakıt vergisi ve işletme haklarının müsadere edilmesine karşı her santral için tazminat davaları açmışlardır. Şu ana kadar bazı davaları kazanıp, tazminat alsalar da, bazı davalar hala devam etmektedir. Bu arada
BNetzA, nükleer santralsiz şebekenin dayanma sınırında olacağına dair bir rapor hazırladı. Ülkede yedek kapasitenin kalmadığı bildirildi.
8 nükleer ünitenin devre dışı edilmesi, bazı kömür santrallerinin yaşlanması ve gaz santrallerinin ekonomik olmaması nedeniyle devre dışı edilmeleri sonucu Almanya, kömür ve özellikle linyit santralleri yapımına hız vermiştir ve bu bağlamda 2015 sonuna kadar 10.700 MW yeni kömür santralini devreye alacaktır.
Almanya’nın ilave fosil yakıt kullanımı nedeniyle CO2 emisyonu 300 milyon ton artacaktır; bu da AB’nin 2011’de çıkardığı Enerji Verimliliği Direktifi’nin sağlayacağı 335 milyon tonluk CO2 azalmasını ortadan kaldıracaktır.
3.3. ABDABD, 2013 yılında 4.294 TWh elektrik üretmiştir. Bunun %40’ı kömürden, %27’si gazdan, %19’u nükleerden, %7’si hidrodan, %4’ü rüzgârdan ve %3’ü diğer kaynaklardan üretilmiştir.
ABD dünyanın en büyük nükleer elektrik üreticisidir. 2014’te 100 nükleer reaktörde üretilen 798 TWh, ABD elektrik üretiminin %19’u ve dünya nükleer elektrik üretiminin %33’ünü teşkil etmektedir. ABD’nin şu anda devrede olan 99 nükleer ünitesinin kurulu gücü 98,7 GW’dır. Toplam kurulu güç 1.068 GW’dır.
Son yıllarda nükleer santral yapılmasa da nükleer santrallerde bazı dizayn değişiklikleriyle gücün 6.500 MW artırılması, kapasite faktörünün %90’ların üzerine çıkması, yakıt yenileme sürelerinin azalması, reaktörlerin 75’inin (Ekim 2014 itibariyle) çalışma sürelerinin 20 yıl daha uzatılması, nükleer santrallerden elektrik üretimini artırmıştır. 19 ünitenin de çalışma sürelerinin uzatılması talebi incelenmektedir.
Yaklaşık 30 yıldır yeni santral yapılmasa da 2007 ortasından bu yana NRC’ye (Nükleer Düzenleyici Kurul) yeni santral kurulması amacıyla lisans verilmesi için 28 yeni büyük reaktör kurulması için başvuru yapılmış ve bunun 4-6’sının 2020’den önce devreye girmesi planlanmıştır. Ancak 2009’dan beri görülen düşük doğal gaz fiyatları bu projelerin ekonomikliğini şüpheli hale getirmiştir.
Fukuşima kazası sonrası NRC ABD’deki nükleer santrallerin Fukuşima’dan alınan dersler doğrultusunda güvenlik açısından gözden geçirilmesini istedi. Haziran 2011’de tamamlanan raporun ilk bölümü, santrallerde deprem, hortum gibi doğal afetlerde alınması gereken tedbirleri ve ikinci bölümü de gerekli olabilecek diğer değişiklikleri içeriyordu. Fukuşima’dan 3 ay sonra NRC ülkedeki 104 nükleer ünitede güvenlik açısından bir sorun olmadığını açıkladı.

130
ICCI 2015 - Bildiriler Kitabı / Proceedings Book
NRC, 9.02.2012’de 2 adet AP1000 inşaatı için Vogtle Nükleer Santrali’ne ve yine aynı tip iki reaktörün South Carolina’da inşaatına Mart 2012’de inşaat ve işletme lisansını vermiştir. Bu dört ünitede reaktör adasında beton dökülmeye Mart 2013’te başlanmıştır. Summer Nükleer Santrali’nin 2. ünitesinin 2019 ve 3. ünitesinin 2020 başında, Vogtle Santrali’nin 3. ünitesinin 2019 ve 4. ünitesinin 2020 ortasında bitmesi beklenmektedir. Daha önce inşaatı durdurulan Watts Bar 2 santral inşaatının da yeniden başlamasıyla 5 ünitenin inşaatı sürmektedir.
3.4. İngiltere2013’te üretilen 357 TWh elektriğin %20’si nükleerden, %27’si doğal gazdan, %36’sı kömürden, %8’i rüzgârdan, %2’si hidrodan, %6’sı biomasdan, %1’i diğer kaynaklardan sağlanmıştır. 2013’te 6,4 milyar kWh Fransa’dan ve 5,8 milyar kWh Hollanda’dan ithal edilmiştir.
İngiltere’de işletmedeki 16 ünitenin biri dışında hepsi 2023’e kadar emekliye ayrılacaktır. Bu sebeple İngiltere’de yeni nükleer santral yerleri ve dizaynları üzerine son yıllarda kapsamlı çalışmalar yürütülmüştür.
Fukuşima kazası sonrası Nükleer Tesisler Baş Denetçisi bir rapor hazırlayarak, çalışan santraller ve yeni yapılacak santraller konusunda bir plan değişikliğine gerek olmadığına karar verdi. Haziran 2011’de hükümet, 2025’ten önce tamamlanması planlanan santraller için sekiz sahanın listesini açıkladı. Yeni hükümet, Elektrik Piyasası Reformu Belgesinde CO2 fiyatlarını açıkladı. Buna göre CO2 fiyatı 2013’te 16 £, 2020’de 30 £ ve 2030’da 70 £ olarak belirlenmiş olup, bu da nükleer santrallerin ekonomikliğine katkıda bulunmaktadır. Bu arada Nükleer Düzenleyici Kurul, İngiltere’nin nükleer programı için EPR, AP1000 ve ABWR dizaynlarını onaylayarak kurulmalarına izin vermiştir. Rus VVER – TOI inceleme safhasındadır.
Hükümet 2025 yılına kadar 60 GW’lık yeni kapasitenin gerekli olduğunu, bunun 35 GW’ının yenilenebilir enerjiden karşılanacağını, geri kalan 25 GW’ın çoğunun nükleer enerji olacağını düşünmektedir.
İngiltere’deki nükleer santrallerin sahibi British Energy, Fransız EdF tarafından Ocak 2009’da satın alınmış ve aynı yıl Centrica, British Energy’nin %20 hissesini satın almıştır. EdF, Areva ve Çin’li ortaklarla Sizewell ve Hinkley Point sahalarında 4 tane EPR (4x1.630 MW) kurmayı planlamıştır. Devreye alma tarihi 2023 olarak planlanmıştır. Bu arada Horizon ve Hitachi’nin Wylfa ve Oldbury sahalarına 4 ABWR (4x1380 MW) ve İberdrola ve Suez’in ortak şirketi NuGeneration’ın Moorside sahasına 3 AP1000 (3x 1135 MW) tipinde nükleer santrallar kurmak istediklerini açıklamışlardır.
Kasım 2014’te yürütülen bir kamuoyu yoklamasında halkın %45’inin yeni nükleer santral kurulmasını desteklediği ve sadece %20’sinin karşı olduğu ortaya çıkmıştır.
3.5. FransaFransa 2014’te ürettiği 541 TWh’lik elektriğin %75’ini nükleer enerjiden sağlamıştır. Toplam gücü 63.130 MW olan 58 adet nükleer santral ünitesi vardır. Fransa’da elektrik fiyatları düşük olduğundan, yılda ortalama 70 milyar kWh’in üzerinde ihracatıyla dünyanın en büyük elektrik ihracatçısıdır ve yılda elektrik ihracatından 3 milyar € kazanmaktadır. Yılda 55-70 TWh civarındaki ihracat İtalya, İsviçre, Belçika, İspanya ve İngiltere’ye yapılmaktadır.
Fransa’da petrol krizi sonrası 1974’te nükleer enerjiye ağırlık verme kararı alınırken, enerjide arz güvenliği, dışa bağımlılığı azaltma, elektrik fiyatlarını ucuz ve stabil tutma hedefleri güdülmüştür. 1999’da Parlamentoda Fransa’nın enerji politikasındaki üç önemli unsur teyit edilmiştir. Bunlar arz güvenliği, çevreye saygı ve nükleer atıklara yeterli dikkatin gösterilmesidir.
2005’te çıkarılan bir kanun enerji politikaları ve arz güvenliğinin ana hatlarını oluşturdu.
Fukuşima kazası sonrası IRSN (Radyolojik Koruma ve Nükleer Güvenlik Enstitüsü), 6 ay süren reaktör güvenliği çalışmasına başladı ve bazı güvenlik tedbirlerinin alınmasını önerdi.
2012’de Francois Hollande’ın Başkan seçilmesiyle, enerji politikalarıyla ilgili ulusal bir tartışma başlatıldı. Sonuçta Ekim 2014’te çıkarılan Enerjide Geçiş Kanunu’yla 2025’e kadar elektrik üretiminde nükleerin payının %50’ye düşürülmesi, nükleer kurulu güç tavanının şu andaki seviye olan 63,2 GW olması hedeflendi.
2002’de EdF 900 MW’lık reaktörlerin işletme sürelerinin uzatılması için ASN (Nükleer Güvenlik Kurumu)’ye müracaat etti. Temmuz 2010’da çalışma sürelerinin 60 yıla çıkarılmasını değerlendirmeye aldı. Şubat 2014’te de Parlamentoya bu konuyla ilgili bütçesini sundu.
Bu arada EdF nükleer santrallerde güç artırma çalışmaları yapmaktadır. Örneğin 1.300 MW’larda güç %7 artırılmıştır.
EdF Yönetim Kurulu, Areva’nın geliştirdiği EPR tipi reaktörün prototipini yapmak için Mayıs 2006’da karar almış ve 1650 MW’lık Flamanville 3’ün yapımını onaylamıştır. Aralık 2007’de beton dökümüne başlanmıştır ve devreye alma tarihi olarak Mayıs 2012 hedeflenmiştir. Kasım 2014’te bu tarihin 2017’ye kaydığı açıklanmıştır. 2005’te 3,55 milyar € olarak hesaplanan yatırım maliyeti, Temmuz 2011’de 6 milyar € olarak revize edilmiş, Aralık 2012’de ise maliyetin 8,5 milyar € olacağı belirtilmiştir.
131
ICCI 2015 - Bildiriler Kitabı / Proceedings Book
Fransa IV nesil reaktör teknolojilerinden gaz soğutmalı hızlı reaktör, sodyum soğutmalı hızlı reaktör ve çok yüksek sıcaklıklı reaktör tipleri üzerinde çalışırken, Atom Enerji Komitesi, AR-GE çalışmalarının sodyum soğutmalı reaktör üzerine devam etmesine karar vermiştir. 2020’de start-up hedeflenmiştir.
3.6. RusyaRusya’nın 2012’de ürettiği 1.071 TWh’lik elektriğin %17’si nükleer, %49’u doğal gaz, %16’sı kömür, %16’sı hidroelektrikten karşılanmıştır. Gaz ihracatıyla, gazın elektrik üretiminde kullanımına göre 5 misli daha fazla gelir elde ettiğinden Rusya nükleer kapasitesini genişletme planlarını sürdürmektedir ve 34 reaktörüyle toplam 25.164 MW gücündeki nükleer kapasiteyi 2020’ye kadar ikiye katlamayı planlamaktadır. Zaten şu anda da 9 reaktörün inşaatı sürmektedir. Bu arada mevcut reaktörlerde rehabilitasyonlar yapılarak üretim kapasiteleri artırılmakta, çalışma süreleri de uzatılmaktadır.
Fukuşima kazası sonrası Haziran 2011’de Rusya tüm nükleer santrallerinde güvenlik kontrolleri yapmış, arkasından da reaktör ömürlerini 15 yıl daha uzatmak için bir program yürütmüştür.
Temmuz 2012’de Enerji Bakanı, santral kurulu gücünü 2020’ye kadar 83 GW artıracaklarını, bunun 10 GW’ının nükleer olacağını açıkladı.
Rusya’da nükleerin elektrik üretiminde payı 2012’de %17 olmuştur. En son Federal Hedef Programı (Federal Target Program)’na göre bu oranın 2030’da %25-30, 2050’de %45-50 ve asrın sonunda %70-80 olması öngörülmektedir.
İnşaatı süren 9 santrale ilaveten 31 santral planlanmıştır. Baltık kıyısına kurmaya başladığı 2x1.200 MW’lık Kaliningrad Santrali’nin 1. ünitesinin 2017’de tamamlanması öngörülmüş olup santralin üretiminin çoğunun Almanya, Polonya ve Baltık ülkelerine ihracatı hedeflenmektedir.
3.7. ÇinÇin’in 2012 yılındaki 4.994 TWh’lik elektrik üretiminin %76’sı kömür, %17’i hidro, %2’si gaz, %2 nükleer, %3’de diğer kaynaklardandır. Çin’in devrede olan 23 nükleer ünitesinin kapasitesi 20.115 MW’dır. Ancak inşaatı süren 26 nükleer ünitenin kapasitesi 28.461 MW’dır. Ancak Çin’in çok iddialı bir nükleer programı vardır, 2020’ye kadar 58 GW, 2030’a kadar 150 GW yapmayı planlamaktadır. Çin’in nükleer enerjiye bu kadar ağırlık vermesinin nedeni kömürden kaynaklanan hava kirliliğine karşı açtığı savaştır. Eylül 2014’te hazırlanan İklim Değişikliği Planı’na göre 2020’de karbon emisyonunun %40 azaltılması hedeflenmiştir.
Çin, nükleer teknolojiyi Fransa, Rusya ve Kanada’dan aldı, ancak yerli nükleer santral imalatı daha çok Fransız teknolojisine dayanmaktadır. En son teknoloji transferi ABD’den olmuş, Japon Toshiba’nın satın aldığı ABD’li Westinghouse’un AP 1000 reaktörü Çin’in gelecekteki teknoloji gelişiminin ana unsuru olacaktır. Çin’in geliştirdiği CAP 1400, AP 1000’i esas almıştır.
Fukuşima kazası sonrası Çin Devlet Konseyi, yeni santrallerin onayını askıya alacağını duyurdu ve işletmede olan ve inşaatı süren santrallerde güvenlik kontrolleri istedi. Mevcut ve inşaat halindeki santrallerin güvenlik denetimleri Ekim 2011’de tamamlandı.
Aralık 2011’de Milli Enerji İdaresi (National Energy Administration -NEA) gelecek 10-20 yılda nükleer enerjinin Çin elektrik üretim sisteminin temeli olacağını açıkladı. Çin’in hedefi; 2015’e kadar yılda 3, 2015’ten sonra da yılda 4 nükleer üniteyi devreye almaktır.
3.8. TürkiyeTürkiye, 12.05.2010 tarihinde Rusya Federasyonu ile Mersin-Akkuyu’da 4x1.200 MW’lık VVER 1200 tipi bir nükleer santralin tesisine ve işletimine dair bir işbirliği anlaşması imzalamıştır. Bu antlaşma ülkelerin Parlamentolarında da onaylanmıştır.
13.12.2010 tarihinde ise konuya ilişkin proje firması olan Akkuyu NGS Elektrik A.Ş. kurulmuştur. Şirket, Akkuyu sahasını EÜAŞ’tan Mart 2011’de devir alarak, saha etütlerine başlamıştır. ÇED Yönetmeliği gereği 29.03.2012 tarihinde Büyük Eceli’de halkı bilgilendirme toplantısı yapılmıştır. ÇED Kasım 2014’te onaylanmıştır.
İnşaatın 2015’te başlaması ve birinci ünitenin 2021’de devreye girmesi beklenmektedir. Üniteler arası süre 1 yıldır. Santral devreye girdiğinde 1. ve 2. ünite üretiminin %70’i ve 3. ve 4. üretiminin %30’u için 12,35 cent/kWh fiyatla alım garantisi vardır.
İkinci nükleer santral yeri olarak belirlenen Sinop’ta 2008 yılından beri çalışmalar sürdürülmektedir. Santral kurulmasıyla ilgili Kore, Japonya, Çin, Fransız ve Rus firmalarıyla görüşülmüştür. Mayıs 2013’te Japon – Fransız ortaklığıyla santralin yapılacağı açıklanmıştır. 3.9. Diğer Ülkeler
Güney Kore (20.697 MW): Fukushima kazası sonrası güvenlik kontrolleri yapıldıktan sonra nükleer santraller işletmeye devam etmiştir ve 2022’ye kadar %59 artışla 32,9 GW’a ulaşılması planlanmıştır.
Ukrayna (13.168 MW): Elektrik üretiminde nükleer enerjinin payının 2030’a kadar muhafaza edileceğini açıklamıştır; bu, yeni santrallerin yapımı anlamına da gelmektedir.

132
ICCI 2015 - Bildiriler Kitabı / Proceedings Book
Kanada (13.553 MW): Kanada nükleer teknoloji ihraç eden bir ülkedir ve yeni nükleer santraller kurarak önümüzdeki yirmi yılda nükleer kapasitesini genişletmeyi planlamaktadır.
İsveç (9.487 MW): Barsebeck 1 ve 2 santrallerinin kapatılması sonucu ortaya çıkan 1.200 MW’lık açığı kapatmak için diğer nükleer santrallerin kapasitesi 1.600 MW artırılmıştır.
İspanya (7.002 MW): Hükümetin nükleer enerjiye bakışı belirsiz görünüyordu, ancak Haziran 2014’te bir Kanunla Yenilenebilir Enerjiye verilen sübvansiyonların azaltılması nükleer lehine bir ortam doğurdu.
Belçika (5.943 MW): Hükümetin nükleer enerjiye desteği zayıf, ancak nükleer santrallerde üretilen elektriğin ucuz oluşu nedeniyle, Doel 1 ve 2 dışındaki santrallerin 40 yıllık işletme süresi uzatılacaktır.
Hindistan (5.302 MW): Nükleer kapasitenin 2020’ye kadar 14,6 GW’a çıkarılacağı ve 2050’ye kadar elektrik üretiminin %25’inin nükleerden olması planlanmıştır.
Çek Cumhuriyeti (3.766 MW): Hükümetin nükleer enerjiye desteği kuvvetli ve 2015 yılı içinde Temelin 3. ve 4. ünite için ihaleye çıkılarak teklifler alınacak.
İsviçre (3.333 MW): Haziran 2011’de işletmede olan 5 nükleer reaktörün 2034’e kadar kapatılması kararı verildi, ancak anketler halkın nükleer enerjiye devam edilmesini istediğini gösterdi.
Finlandiya (2.741 MW): Finlandiya’da 4 ünite işletmede, bir ünite inşa halindeyken yeni iki ünite daha kurulması planlanmaktadır. İnşa halindeki Olkiluoto 3’te 7 yıllık gecikme vardır.
Bulgaristan (1.906 MW): Belene’ye iki ünite yapma planlarından vazgeçildi ve Kozloduy’a bir AP 1000 kurulması için Westinghouse’la Ağustos 2012’de sözleşme imzaladılar. İnşaat 2016’da başlayacak.
Brezilya (1.901 MW): Bir ünite inşaatı sürerken 4 yeni ünite için kuzeydoğuda, 4 yeni ünite için güneydoğuda yer seçimi yapıldı ve kongreye onaya sunulacak.
Macaristan (1.889 MW): İki yeni nükleer ünite kurulmasına Mart 2009’da Parlamento çoğunlukla destek verdi. Ocak 2014’de Rosatom’la sözleşme imzalandı, 1. ünitenin 2023’te devreye girmesi planlandı.
Slovakya (1.816 MW): Nükleer enerjiye hükümetin güçlü desteği var.
Güney Afrika (1.830 MW): 2030’a kadar yapılacak yeni üretim tesislerinin %22’si nükleer olacak.
Meksika (1.600 MW): Doğal gaza olan bağımlılığı azaltmak ve karbon emisyonlarını düşürmek için hükümet nükleeri destekliyor.
Romanya (1.310 MW): İşletmede olan Cernavada 1 ve 2’ye ilaveten Cernavada 3 ve 4’ün kurulması için Çin’li CGN’nin Eylül 2014’te sunduğu teklifi uygun görüldü.
Arjantin (1627 MW): 2 yeni reaktör için 2014 sonunda Çin’li CNNC ile çerçeve anlaşma imzalandı.
İran (915 MW): Bushehri Santrali’ni Mayıs 2011’de devreye aldıktan sonra yeni üniteler için Rus ve Çin firmalarıyla görüşüyor.
Pakistan (725 MW): İnşaatı süren 2 üniteye ilaveten Çin’li CNNC ile 2 yeni reaktör için Ağustos 2013’te sözleşme imzaladı. İnşaat 2015’te başlayabilir.
Slovenya (696 MW): Çalışan 1 üniteye ilaveten yeni bir ünite kurulması Parlamento onayına sunuldu.
Ermenistan (935 MW): Bir reaktör işletmede ve hükümet yeni bir ünitenin Ruslar tarafından kurulmasını Mayıs 2014’te onayladı. İnşaatın 2018’de başlaması planlandı.
Polonya: 2 ünite için yatırım kararının 2018’de alınması ve ilkinin 2024’te devreye alınması planlandı.
BAE: KEPCO ile 4 APR-1400 için sözleşme imzaladı ve 1.’nin inşaatı Temmuz 2012, 2.’nin inşaatı Mayıs 2013, 3.’nin inşaatı Eylül 2013’de başladı. 1. ünitenin Mayıs 2017’de devreye girmesi bekleniyor.
3.10. UEA Nükleer Yol HaritasıUEA 2010 yılında nükleer enerji konusunda bir Teknoloji Yol Haritası hazırlamıştı. Bu Yol haritasını 2015 yılında güncelledi. 2010 versiyonunda 1,200 MW olan 2050 nükleer kurulu güç projeksiyonu, 2015 versiyonunda 930 MW’a; 2010 versiyonunda %25 olan 2050 elektrik üretiminde nükleerin payı projeksiyonu, 2015 versiyonunda %17’ye düşürülmüştür.
Şekil 4. UEA’nın nükleer santrallerle ilgili projeksiyonu.

133
ICCI 2015 - Bildiriler Kitabı / Proceedings Book
4. SONUÇÇoğu ülke nükleer enerji olmadan iklim değişikliği hedeflerine ulaşılamayacağının farkındadır.
Çernobil’i yaşayan Ukrayna ve Fukuşima’yı yaşayan Japonya nükleer enerjiden vazgeçememiştir.
Almanya, İsviçre ve İtalya gibi çok az sayıda ülke dışında, nükleer enerji projelerinden vazgeçilmemiştir.
Mart 2013’te ABD’de iki nükleer santralde temel için beton dökülmüştür. Bu tereddütte olan çok sayıda ülke için teşvik olacaktır.
Türkiye’de Akkuyu Nükleer Santrali inşaatının 2015’te başlaması ve birinci ünitenin 2020’de devreye girmesi beklenmektedir. İkinci nükleer santral yeri olarak belirlenen Sinop’ta 2008 yılından beri çalışmalar sürdürülmektedir.
KAYNAKLAR[1] DEK TMK Enerji Raporu 2013, DEK TMK Yayın No: 0022/2014, Ankara, Ocak 2014.[2] WNA, World Nuclear Power Reactors and Uranium Requirements, World Nuclear Association web sitesi, 25 Şubat 2015.[3] Nükleer Santraller, DEK TMK Yayın No: 0018/2010, Ankara, 2010.[4] Technology Roadmap, Nuclear Energy 2015, Edition, IEA, NEA, Paris, France, 30.10.2013.[5] WNA, Nuclear Power in Japan, 27.01.2015, WNA web sitesi.[6] WNA, Nuclear Power in Germany, December 2014, WNA web sitesi.[7] WNA, Nuclear Power in USA, March 2015, WNA web sitesi.[8] WNA, Nuclear Power in the United Kingdom, January 2015, WNA web sitesi.[9] WNA, Nuclear Power in France, February 2015, WNA web sitesi.[10] WNA, Nuclear Power in Russia, February 2015, WNA web sitesi.[11] WNA, Nuclear Power in China, February 2015, WNA web sitesi.[12] WNA, Nuclear Power in Turkey,February 2015, WNA web sitesi.[13] WNA, Nuclear Power in India, February 2015, WNA web sitesi.[14] WNA, Nuclear Power in Sweden, February2015, WNA web sitesi.[15] TAEK, Akkuyu Nükleer Santral Projesi, TAEK web sitesi, 27.03.2015.[16] TAEK, Akkuyu Nükleer Santral Lisanslaması, TAEK web sitesi, 27.03.2015.[17] TAEK, Akkuyu Nükleer Santralı - Gelişmeler, TAEK web sitesi, 27.03.2015.
[18] Akkuyu NGS A. Ş. web sitesi.[19] WNA, Nuclear Power in South Korea, January 2015, WNA web sitesi.
SUMMARYBy 25.02.2015, 438 nuclear reactor was in operatable condition in the World and 69 reactor is under construction. After Fukushima,safety inspections and stress tests were carried out on the nuclear power plants in all countries and the construction activities in new plants were interrupted, apart from a few countries, there were not big changes in nuclear energy plans.
IEA updated there technology roadmap on nuclear energy which was first prepared in 2010 and revised their figures for the projection for 2050. The installed power was reduced from 1,200MW to 930 MW and the share of nuclear energy in electricity production from 25% to 17%.

134
ICCI 2015 - Bildiriler Kitabı / Proceedings Book
ÖZETRafineri, petrokimya, demir-çelik gibi büyük endüstriyel tesisler, işletme güvenliğini ve sürekliliğini en üst düzeyde sağlayabilmek için enterkonnekte şebekeye bağlı olmanın yanında, elektriksel enerji taleplerinin bir kısmını veya tamamını karşılayacak üretim kaynaklarına da sahip olmalıdır. Bu amaçla tesis edilen veya edilecek üretim kaynaklarının, bir taraftan işletme sürekliliğini sağlayacak, diğer taraftan da bağlı olduğu iletim sisteminin gerekliliklerini yerine getirecek özel donanımlar, kontrol sistemleri ile donatılması gerekmektedir. Bu çalışmada, Yük Kontrol Ünitesi adı verilen bir işletim sisteminin, hem tasarım, hem de işletmesinin kolay, anlaşılabilir olması nedeniyle DCS kullanılarak nasıl yapıldığı hakkında bilgi verilmektedir. Kurulan işletim sistemi ile endüstriyel tesisin ihtiyaç duyduğu enerji istenen miktar ve istenen kalitede en ekonomik şekilde sağlanırken, enterkonnekte şebekenin işletim operatörünün yönetmeliklerden kaynaklanan talepleri de yerine getirilebilmektedir.
1. YÜK KONTROL ÜNİTESİBu çalışmaya konu olan yük kontrol ünitesi, Şekil 1’de tek hat diyagramı verilen endüstriyel tesisin üretim kaynakları ile iletim sisteminde emre amade elektrik enerjisi potansiyelini, talebe göre istenen kalite, miktar ve yönde, standart, kanun ve yönetmeliklere uygun olarak yönetmektedir. Yük kontrol ünitesi bu işlevleri yerine getirirken hem tesiste var olan SCADA, PLC gibi sistemler, hem de iletim sistemi operatörünün kontrol mekanizmaları ile koordineli çalışmaktadır. Yük kontrol ünitesi, gerekli bilgilerin elde edilmesinden sonra tasarımı, işletilmesi ve gerektiğinde bazı bilgileri, ilave bir ara elemana ihtiyaç duymadan doğrudan değiştirmedeki kolaylıklar içermesi nedeni ile seçilmiştir. Sistem, çok fazla eğitim gerekliliği olmayan personel tarafından, günlük operasyonların yapılmasında kolaylıkla kullanılabilmektedir.
Yük kontrol ünitesinin bu uygulamadaki görevleri;• Yük paylaşımı,• Güç faktörü kontrolü,• Yük frekans kontrolü (primer ve sekonder)
Yük kontrol ünitesinin genel blok diyagramı Şekil 2’de verilmektedir.
1.1. Yük PaylaşımıRafinerinin ihtiyacı olan elektriksel enerji ile şebekeden alınan veya şebekeye verilen elektriksel enerjinin, tesisin sahip olduğu generatörler ve enterkonnekte şebekeye bağlı iletim hatları üzerindeki dağılımı, yük kontrol ünitesinin yük paylaşım modülü tarafından yapılmaktadır. Yük paylaşım modülü bu fonksiyonu yerine getirebilmek maksadı ile Şekil 1’de verilen elektrik sistemi ile ilgili tüm bilgeleri doğrudan (dijital veya analog) veya dolaylı (SCADA ve yük atma PLC’si üzerinden) almaktadır. Yük paylaşım modülü, tesisin elektrik sisteminin enterkonnekte şebeke ile paralel veya ada modunda çalışmasına göre farklı beklentileri yerine getirmektedir.
Modül tamamen otomatik çalışabileceği gibi operatör kontrolünde de çalıştırılmaktadır. Generatör, transformatör ve iletim hatları gibi ekipmanların devre dışı olmasına neden olabilecek kapasitelere ulaşmasına, elektriksel parametrelerindeki sapmalara zamanında müdahale edebilmek için her türlü uyarıcı bilgiyi modüle yüklenebilmektedir. Dolayısı ile modüle;
• Her türlü ayar/işletme değeri operatör tarafından kolaylıkla yüklenebilmekte, böylece ne miktar gücün generatörler tarafından, ne miktar gücünde enterkonnekte şebekeden alınacağı ve hangi zamanlarda ne kadar gücün sisteme satılacağı programlanabilmektedir.
Endüstriyel Tesislerin Elektrik Üretim Sistemlerinin Yük Kontrolü(Load Control Unit, LCU)
SelahattinKÜÇÜKTÜPRAŞ – İzmit Rafinerisi Yatırımlar Müdürlüğü
MehmetBAYRAKSakarya Üniversitesi Mühendislik Fakültesi
A.SerdarYILMAZKahramanmaraş Sütçü İmam Üniversitesi Mühendislik-MimarlıkFakültesi

135
ICCI 2015 - Bildiriler Kitabı / Proceedings Book
• Ayarlanan değerlerden sapmalar olması halinde operatör ses ve ışıklı bir alarm bilgisi ile gerekli tedbirleri alması için uyarılmaktadır. Generatör ve iletim hatlarının işletilmesi ile ilgili ayar değerleri ve bu değerlerden sapmalar olması halinde oluşan alarmlar şu bilgilerden oluşmaktadır.• Enterkonnekte sistem ile iletimi sağlayan hatların kapasite, aktif/reaktif güç alış/satış bilgileri ve bunlarla ilgili alarm değerleri.• Güç transformatörlerinin kapasiteleri ile ilgili ayar bilgileri ve alarm değerleri,• Generatörlerin kapasite (MW, MVAr), programlanan üretim miktarı ve bunlarla ilgili alarm değerleri.
1.1.1. Enterkonnekte şebeke ile paralel çalışmaBu çalışma modunda, generatörler endüstriyel tesisin talebine ilaveten iletim sistemine satılacak, iletim sisteminden alınacak güç de göz önünde bulundurularak çalıştırılmaktadır. Alış veya satış miktarı, gücün herhangi bir nedenle değişmesi halinde herhangi bir müeyyide ile karşılaşmamak için sabit olması gerektiğinden, generatörler otomatik olarak yük almakta veya yük bırakmaktadır. Daha sonra operatör isterse gücü generatörler arasında ayarlayabilmektedir. Bu çalışma şeklinde generatör yük konumunda olup, frekans kontrolü şebeke tarafından belirlendiğinden, şebeke takip edilmektedir. Üretimin kısmen veya tamamen durması halinde, iletim hat kapasitesi aşılmadığı sürece, cezai yaptırım olsa da sistemden taahhüt edilen değerden daha fazla bir güç, alarm ile birlikte çekilebilir. Üretim kaynakları tesise ilaveten iletim sistemine verilen satışı karşılamayacak geçici durumlarda ise iletim sisteminden ayrılarak, ada moduna geçmektedir.
1.1.2. Ada modunda çalışmaBu işletme şeklinde rafineri elektrik sistemini gösteren Şekil 1’deki 1 ve 2 No’lu kesiciler devre dışıdır (OFF). Generatörler endüstriyel tesisin tüketimini karşılayacak şekilde, bir generatör speed (Isochronous) modda olmak üzere, kapasitelerine ve operatörün belirleyeceği yük paylaşımına göre çalışırlar. Reaktif güç ise otomatik olarak voltaj regülatörü tarafından sağlanır. Tüketimin karşılanamaması halinde ayrı bir modül (yük atma sistemi), üretim ve tüketim dengesi sağlanıncaya kadar daha önceden belirlenen yükleri atar, devre dışı eder.
1.2. Güç Faktörü KontrolüYük kontrol ünitesinin önemli görevlerinden biri de, iletim sisteminin yönetmeliklerden kaynaklanan reaktif güç talebini sürekli izleyerek, generatörlerden sağlamaktır. Bu kontrol enterkonnekte sistem ile paralel çalışma halinde aktiftir. İstenen reaktif güç, doğrudan güç faktörü ile ilgili olduğundan, izleme ve kontrol daha ziyade güç faktörü kontrolü ile yapılmaktadır.
Bu kontrol üç şekilde sağlanmaktadır.• Endüstriyel tesisin elektrik sisteminin toplam güç faktörü, daha önceden belirlenen değerden sapmaya başlarsa, kontrol sistemi generatörlerin reaktif güç üretimini artırıp, azaltarak istenen ayar değerine getirir. • Her bir generatörün güç faktörü keza belirlenen değerden sapmaya başlarsa, kontrol sistemi generatörün reaktif güç üretimini artırıp, azaltarak istenen ayar değerine getirir.• Toplam veya her bir generatörün güç faktörü, otomatik olarak ayarlanan değere ulaşamazsa, oluşacak alarm bilgisine göre, operatör tüm veya alarm bilgisi gelen generatörün reaktif gücünü artırıp, azaltarak ayarlanan değere getirir.
Şekil 1. Rafinerinin 2 adet gaz türbin, 1 adet buhar türbin generatör, iletim, dağıtım ve tüketicilerinden oluşan basitleştirilmiş tek hat diyagramı.
Şekil 2. Yük Kontrol Ünitesi (LCU) ve bağlı sistemlere ait blok diyagramı.

136
ICCI 2015 - Bildiriler Kitabı / Proceedings Book
1.3. Yük Frekans Kontrolü (Primer ve Sekonder )Yük frekans kontrolü, belirli bir gücün üzerinde iletim sistemine bağlı olan elektrik üretim tesislerinin (generatörlerin), şebekede herhangi bir nedenle meydana gelen frekans değişimlerini sabit tutmak veya iyileştirmek için, kanun ve yönetmeliklerle belirlenen sorumlulukları otomatik veya iletim sistem operatörü (TEİAŞ) denetiminde yerine getirmektedir. Bilindiği gibi normal çalışma halinde frekanstaki değişmeler üretim tüketim dengesizliğine dayanmaktadır. Kontrolün amacı, ENTSO-E bölgesi dahil tüm enterkonnekte sisteme bağlı tüketicilere temiz, güvenli, kaliteli ve sürekli bir enerjiyi sunmaktır. Şekil 1’deki rafinerinin elektrik üretim tesisinin toplam kurulu gücü dolayısı ile primer frekans kontrolüne katılma zorunluluğu bulunmaktadır. Ancak, üretim tesisi kojenerasyon olması dolayısı ile zorunluluk olmamasına rağmen gönüllü olarak sekonder frekans kontrolüne katılacak şekilde altyapısını hazırlamıştır. Enterkonnekte şebeke ile paralel çalışma halinde generatörler iletim sisteminin frekansını takip ederler. Bu durumda her bir generatör yük (droop) modunda çalışmaktadır. Herhangi bir nedenle rafineri elektrik sisteminin ada moduna geçmesi halinde daha önceden belirlenen generatörlerden biri speed moduna (Isochronous) geçerek frekansı sabit tutarken, diğer generatörler yük modunda çalışmaya devam ederek, yük alır veya verirler.
1.3.1. Primer frekans kontrolüPrimer frekans kontrolü, enterkonnekte sistem frekansın, üretim tüketim dengesizliğinin sonucu olarak daha fazla düşmesini veya yükselmesini durdurmak için yapılır. Frekansın nominal değerden sapması halinde sisteme bağlı generatörler sistem frekansını yeni bir denge noktasında tutmaya çalışırlar. Primer Frekans kontrolüne tabi generatörler ünite aktif çıkış gücünü hız regülatörleri ile otomatik artırarak veya azaltarak, sistem frekansını yeni bir denge noktasına getirirler. Primer frekans kontrolü ile sistemde üretim, tüketim dengesi sağlanmakta, frekans değişimi sona ermekte, fakat frekans tekrar 50 Hz’e getirilmemektedir. Primer frekans kontrolü merkezi müdahale olmaksızın generatörler tarafından sürekli sağlanır. Bu açıklamalardan da anlaşılacağı üzere, primer frekans kontrolü enterkonnekte sistem ile paralel çalışma halinde aktiftir. Endüstriyel tesisin Yan Hizmetler Yönetmeliğince belirlenen ve toplam kurulu gücünün bir yüzdesi oranındaki rezerv güç miktarı (2015 itibari ile %2), hiç bir şekilde başka bir piyasaya teklif edilemez veya ikili anlaşmalar yoluyla satılamaz. Sistem frekansında bir sapma olması halinde, 5, 10 saniye gibi çok kısa bir sürede kontrol sistemi çalışarak 30 saniye gibi bir sürede tüm rezerv gücü enterkonnekte şebekeye verir. Rezerv gücün generatörlerden 15 dakika süre ile sürekli sağlanması zorunluluğu vardır.
Primer frekans kontrolünün LCU üzerinden devreye alınması veya devre dışı edilmesi imkânı vardır. Primer
frekans kontrolü tabi rezerv güç miktarı (Pp_rezerv), tek bir generatörden sağlanacağı gibi, LCU üzerinden verilen komutlara göre yüzde olarak generatörlere de dağıtılabilir. Ancak LCU, her durumda generatörün nominal gücünün üzerine çıkacak bir yüklenmeye imkan vermeyecek aşağıdaki hesaplamayı yapar.
LCU, PFK raporlaması için gerekli tüm bilgileri toplayarak ilgili PLC’ye gönderir.
1.3.2. Sekonder frekans kontrolüSekonder frekans kontrolünün amacı, sistem frekansının nominal değerine ve komşu elektrik şebekleriyle olan toplam elektrik enerji alış verişinin programlanan değerine getirilmesidir. Elektrik Piyasası Yan Hizmetler Yönetmeliği hükümlerine göre sekonder frekans kontrol rezerv güç tutma zorunluluğu olan üretim tesislerinin aktif güç çıkışları, Milli Yük Tevzi Merkezi’nde bulunan otomatik üretim kontrol programı tarafından gönderilen sinyalleri alan ve işleyen teçhizat ile artırmaları veya azaltmaları yoluyla sağlanır. Sekonder frekans kontrolüne tabi generatörler 30 saniye içinde gönderilen sinyallere tepki vererek taahhüt edilen gücü sürekli sağlayabilmelidir. Sekonder frekans kontrol rezerv güç devreye girerken, primer frekans kontrolüne tabi rezerv güçler, yeni bir frekans sapmasını dengeleyebilmek için serbest bırakılır. Keza sekonder fekans kontrolüne tabi rezerv güçler, oluşabilecek bir dengesizliği gidermek için tersiyer kontrol rezerv yedek güçlerinin manuel olarak sistem işletmecisi tarafından devreye alınması ile serbest bırakılırlar.
Sekonder frekans kontrolüne tabi rezerv güç miktarı (Ps_rezerv), tek bir generatörden sağlanacağı gibi, LCU üzerinden verilen komutlara göre yüzde olarak generatörlere de dağıtılabilir. Ancak LCU, her durumda generatörün nominal gücünün üzerine çıkacak bir yüklenmeye imkan vermeyecek aşağıdaki hesaplamayı yapar.
LCU, sekonder frekans kontrol işlemlerinin raporlaması için gerekli tüm bilgileri toplayarak ilgili PLC’ye gönderir.
2. SONUÇEndüstriyel tesislerin elektrik sistemlerinin işletilmesi, hem üretim, hem dağıtım ve iletim, hem de iç taleplerin karşılanması gibi çok sayıda beklentinin aynı zamanda karşılanması nedeniyle oldukça karışık ve zordur. Bu nedenle bir karışıklığa, bir kargaşaya meydan vermemek için elektrik sisteminin koruma, kontrol ve izleme sistemlerinin birbiri ile haberleşen ‘SCADA, Yük Atma ve

137
ICCI 2015 - Bildiriler Kitabı / Proceedings Book
Yük Kontrol Ünitesi’ gibi farklı platformlarla yapılmasına karar verilmiştir. Bunlar içinde yük kontrol ünitesi işlevi nedeniyle çok dinamik bir yapıya sahip olup, yukarıdaki paragraflarda açıklandığı gibi çok sık müdahale edilmesi gerekmektedir. Bu nedenle yapılan tasarım ile daha istikrarlı olan diğer sistemlere olası yanlış müdahalelerin önüne geçildiği gibi, istenen değişikliklerin ara bir elemana ihtiyaç duyulmadan operatör tarafından kolaylıkla yapılması imkânı sağlanmıştır.
KAYNAKLAR[1] Küçük S., “ The Load Control of one local power station connected to the national grid”, International Conference on Electrical and Electronics Engineering, pages 189-193, 01-05 December 2009, Bursa. [2] Çanakçı A.K., “ Elektrik Piyasası Yan Hizmet Muayeneleri”. 18. Uluslararası Enerji ve Çevre Fuar ve Konferansı, sayfa 5-7, 25-27 Nisan 2012.[3] Yılmaz O., “ Yük- Frekans Kontrolü ve Türkiye Elektrik Sistemi Uygulamaları, Genel Değerlendirmeler”. 18. Uluslararası Enerji ve Çevre Fuar ve Konferansı, sayfa 145-152, 25-27 Nisan 2012.[4] Pamuk N., “ Üretim Santrallerindeki Frekans Kontrolleri ve Adapazarı/Gebze Doğal Gaz Kombine Çevrim Santrali İçin Örnek Bir Uygulama Yapılması”, 3e Electrotech Dergisi, sayfa 78-82., 2013. [5] Primer ve Sekonder Frekans Hizmetlerinin Uygulamasına İlişkin El Kitapları, Türkiye Elektrik İletim A.Ş. [6] TÜPRAŞ Fuel Oil Dönüşüm Projesi Kapsamında Tesis Edilen Elektrik Sisteminin Yük Kontrol Çalışımları, 2014.
SUMMARYPrimary function of Load Control Unit (LCU) within electrical system of industrial facility is to provide the energy required for plant’s operation in safety, continuity and specified quality together with economically feasible manner. Any deviation on frequency or voltage quantities of generated or exported electrical energy might reduce, quality level of product or even completely interrupt entire production of the plant. This would lead both to loss of plant production and loss of live/property upon fires or explosions due to lack of control mechanism. Thus; in order to avoid the occurrence of such incidents at above mentioned plants or similar facilities, implementation of necessary control systems has been an important obligation. In this regard, electrical system of industrial plant, being an extension of national network, has to conform required specifications, national codes and regulations. It is technologically possible for electrical system of an industrial facility to meet numerous internal and external expectations for which many designs have been developed. In this study; necessary control, monitoring and operations of a refinery electrical system with very complex and sensitive production units will be performed through the special program in Distributed Control System (DCS). The developed software in DCS will
manage the electrical energy need of industrial complex through its own generators or export the excess production, if any, to national transmission system or import from national transmission system in case of necessity. This system is named as Load Control Unit (LCU) considering the functions it performs.

138
ICCI 2015 - Bildiriler Kitabı / Proceedings Book
ABSTRACTEnergy Information Administration’s (EIA’s) portfolio of data collections includes three surveys of energy-consuming end use sectors: the Commercial Buildings energy Consumption Survey (CBECS), the Residential Energy Consumption Survey (RECS), and the Manufacturing Energy Consumption Survey. Prior to 1994, EIA also conducted a transportation energy use survey, the Residential Transportation Energy Consumption Survey, but budget cuts forced this data collection to be discontinued after 1994. This paper presents information on global energy consumption sectors (buildings, industrial, transportation and electricity).
1. INTRODUCTIONThe demand for energy in areas as varied as industry or transport means that a new paradigm in the way fuels. The need to promote energy security and policy as key themes during the twenty-first century is greater than ever[1]. In the times of globalization, international trade is playing a vital role in shaping the world energy profile by redistributing the energy embodied in industrial products in the economy. The leakage effects associated with indirect energy use at the global scale are overlooked because traditional analyses are usually focusing on direct energy use[2].
The buildings sector represents energy use in places where people reside, work, and buy goods and services. Industrial promotion is a major priority for the governments of many developing countries. Industrial development can make significant beneficial contributions to a country’s overall economic development by providing jobs, promoting socio-economic infrastructure and so on. The higher demand for transportation could be fulfilled with the assistance of new technologies, new materials and highly intelligent hardware and software systems. Electricity is essential to powering industrialized and industrializing
economies. It affects nearly every aspect of daily modern living, and indeed is an essential element to the industrial, residential, and commercial sectors of society.
2. BUILDING SECTOR (RESIDENTIAL AND COMMERCIAL)ENERGY CONSUMPTION The sector excludes industrial facilities used for producing, processing, or assembling goods. In 2010, the buildings sector accounted for more than one-fifth of total worldwide consumption of delivered energy[3]. Many governments have introduced regulations to make buildings more energy-efficient. Policies and research on energy conservation in buildings are geared primarily to saving energy through technical measures relating to the building envelope and the heating and ventilation installations[4]. Energy-saving designs do not always result in the expected energy consumption[5][6].
Energy consumption in housing and building is a key issue for sustainability, primarily because it contributes to the depletion of non-renewable fossil fuels and the production of carbon dioxide (CO2) and other pollutions. Energy use in houses and other buildings is significant proportion of energy consumption, set to rise with increases in population and the number of associated buildings, notably houses[7].
Buildings are the environment where the majority of us spend most of our lives; they deeply influence many other consumption patterns and are important factor in our life and comfort. The societal function and nature of buildings as they are currently culturally constructed accounts for many of the difficulties in moving towards sustainable consumption and production (SCP), both present and future. Buildings have a long lifetime. This domain is a major target for any structural change in consumption patterns[7].
Global Energy Consumption Sectors
SelçukBILGENDepartment of Chemistry Karadeniz Technical University
İkbalSARIKAYADepartment of Chemistry Karadeniz Technical University
AyçaTAÇDepartment of Chemistry Karadeniz Technical University

139
ICCI 2015 - Bildiriler Kitabı / Proceedings Book
Energy use in the residential sector is defined as the energy consumed by households, excluding transportation uses. In the residential sector, energy is used for equipment and to provide heating, cooling, lighting, water heating, and other household demands. All of energy consumption, income, and energy prices affect the way energy consumed in the residential sector. However, residential energy use is affected by factors such as location, building and household characteristics, weather, type and efficiency of equipment, energy access, availability of energy sources, and energy-related policies. As a result, the type and amount of energy use by households can vary widely within and across regions and countries[3]. Residential buildings have continuously improved in efficiency. Even though materials with better thermal properties and systems that are more efficient have lowered energy consumption for space heating in recent decades, substantial differences in energy consumption are still being observed in similar dwellings[4][8]. World residential delivered energy consumption increases by 57 percent from 2010 to 2040 (Table 1)[3].
Energy consumption in the commercial sector focuses on heating and cooling systems, lights, water heaters, and other equipment in the buildings located businesses, institutions, and other organizations. Schools, retail stores, restaurants, hotels, hospitals, office buildings, and leisure and recreational facilities can be given as examples of commercial sector buildings. The commercial sector included some non-building energy use contributes to such public services as traffic lights and water and sewer systems. Total world delivered commercial sector energy consumption grows at an average annual rate of 1.8 percent from 2010 to 2040, making it the fastest-growing demand sector (Table 2)[3].
In Europe, the built environment consumes 40% of the produced energy. A large proportion of this energy is consumed in residential buildings. Households account for about 30% of the total building-related energy consumption in OECD countries[9]. As around 30-57% of the energy consumed by households is spent on space and domestic water heating, conservation in this area is a matter of vital importance[4]. In a context marked by a growing effort to create sustainable development strategies, much of the research focuses on energy related issues in the built environment[10].
3. INDUSTRIAL SECTOR ENERGY CONSUMPTIONBy its very nature, industrial development can also have profound impact on the environment. All industrial require use of natural resources, many of which are limited, such as water, and so can directly affect local ecosystems. The conversion of natural resources to finished or semi-finished products results in residues that are often discharged as wastes. These wastes in solid, liquid and gaseous forms can be detrimental to the quality of life by adversely affecting land, water and air resources[11].
In Industrial and Post-Industrial Nations like those in North America and in Europe, or in Industrializing Nations like China, India, and Brazil, there are universally recognizable economic sectors that consume energy for productive purposes. Prior to the first extensive use of fossil fuels, firewood and animal power provided most of the energy input needed to satisfy society. As populations grew and advanced economically and socially, it became apparent that more intensive and more portable energy sources would be needed to support wide-scale mechanization. Wind and waterpower, and charcoal answered that challenge initially. Coal permitted tremendous expansion of industry. The fact that coal had been accumulated and intensified over millions of years made it a source that dwarfed the biomass fuels, where the forests only represented a few hundred years of accumulation[12].
With new products and increasing affluence, the composition of production is changing such that industrial energy and materials consumption are growing more slowly than the economy. Technological progress tends to reduce the overall energy and materials requirements for each industrial process. This relatively rosy scenario faces serious difficulties, however: industrial decision makers strongly discount future expenditures for energy for a variety of reasons. In addition, many slow-growing heavy industries may not have the capital and technical capabilities to invest in the best new production processes. For these reasons it is important to develop public policies to encourage the development and dissemination of more-efficient process technologies, and to assist energy-intensive industries to modernize, for example through utility demand-side management programs[13].
Table 1. Residential Sector Delivered Energy Consumption by Region, 2010-2040 (Quadrillion Btu).
Table 2. Commercial Sector Delivered Energy Consumption by Region, 2010-2040 (Quadrillion Btu)

140
ICCI 2015 - Bildiriler Kitabı / Proceedings Book
It is very important to improving energy efficiency in all industrial sectors. The overall aim is to decrease the greenhouse gas emissions, ensure the energy security and improve the industrial output and competitiveness. In the end part of the production chain, the conscious customers in the industrialized countries have woken up by the threats of global warming, changed their consuming habits and started to demand green and sustainable products and services. The uncertainty about global fossil energy reserves and their availability in the end is increasing the awareness for the development of clean and renewable energy resources and optimized energy use to prevent waste[14].
There are cases of energy consumption that is identified as industrial consumption but not clarified as the consumption of a specific disaggregated industrial sector. In such cases, the energy consumption is accounted for under the non-specified industry classification[15].
Energy consumption worldwide by the industrial sector is expected to grow from 200 quadrillion Btu in 2010 to 307 quadrillion Btu in 2040, increasing by an average of 1.4 percent per year. Most of the long-term growth in industrial sector delivered energy consumption occurs in the non-OECD countries (Table 3)[3].
4. TRANSPORTATION SECTOR ENERGY CONSUMPTIONNavigation and active communication systems can regulate optimally and safely the increasing traffic. Vehicles, airplanes and ships are becoming more and more efficient, i.e., lighter and more intelligent, with improved aerodynamics, optimized design, and higher performance. Both the population of the world and the demand for transportation has been continuously increasing. Transport has become the foundation of the
economy in all countries. In the course of this process, the environment and the climate have been changing in a remarkable way and in turn have influenced transport. The number of motor vehicles, ships, and airplanes is rapidly rising, especially in fast developing countries. Parallel to this, the amount of oil products consumed and the mass of pollutants emitted are intensively increasing. Transport burns most of the petroleum of the world and emits the most air pollution, including unburned hydrocarbons, carbon monoxide, nitrous oxides, and particles. It is the fastest growing consumption and emission sector on Earth. This leads to significant environmental and health problems especially in large cities and is a major contributor to global warming because of emissions of carbon dioxide[16].
Since the transportation sector is so heavily dependent on petroleum Table 4 present a more detailed breakdown of the various types of petroleum used. Most of the petroleum consumed in the transportation sector is motor gasoline. In 1950, it was 71% of total sector petroleum consumption. It has been about 65% in recent years[17].
Modifications in energy demand or supply will cause indirect impacts in many other domains. For example, raised prices for energy tend to make activities local through raising the costs of transportation[7]. The higher comfort level and safety of new vehicles, airplanes and ships also contributes to more sustainability in transportation. Regarding fuel consumption and emission characteristics, regulations have been intensively expanded in the last 20 years. Energy use and emissions vary greatly between several modes of transportation. Electrification and energy efficiency of transport must be increased in the next decades. However, the introduction of new technology will not happen suddenly but only gradually[16].
Less than optimal measures, to order intensive fuel saving could cause major economic losses. Fuel substitution in transportation has high investment costs in comparison to other sectors of the economy. Therefore, besides technology, a sustainable strategy requires the increased
Table 3. World Industrial Sector Delivered Energy Consumption by Region and Source, 2010-2040 (Quadrillion Btu).
Table 4. Transportation Use of Petroleum, 1950-2007 (Million Barrels Per Day)
a Other liquids here refers to natural gas liquids and those derived from the Fischer-Tropsch process.b Includes biomass used for combined heat and power operations as well as biomass for process heat.

141
ICCI 2015 - Bildiriler Kitabı / Proceedings Book
use of renewable energy resources, worldwide intelligent navigation measures, common international regulations, and voluntary agreements between governments, civil, and international organizations limiting fuel consumption and exhaust gas emissions. Transportation will grow very intensively over the next few decades in comparison to other sectors of the economy, especially in the rapidly developing countries[16]. Transportation accounts for about 20% of the global primary energy consumption and about 18% of the total anthropogenic greenhouse gas emissions. Road transport accounts for 72% of the total energy use within the world’s transportation sector and for more than 80% of the total CO2 emissions. In the period 1990– 2005, the energy requirements for transportation increased 37%, making transportation the fastest growing energy sector[18][19]. World energy consumption in the transportation sector increases by an average of 1.1 percent per year (Table 5). The most important components of transportation sector energy used throughout the projection are petroleum and other liquid fuels. Most of the growth in transportation energy use occurs in the non-OECD nations. It increases by an average of 2.2 percent per year from 2010 to 2040 (Table 5)[3].
5. ELECTRICITYIt is almost unimaginable to lack access to electricity for heating, cooling, lighting, working on computers, and watching TV shows. Electricity is the “most convenient, most flexible, and most useful of energies.” Flip a light switch and a whole room can be illuminated. Plug in an air conditioner, turn it on, and a hot, sweltering day becomes manageable for working, playing or even sleeping[12].
Coal was used to generate about half the rapidly increasing amount of electricity consumed. Petroleum became briefly important as a source of power generation in the late 1960s because it resulted in lower emissions of air pollutants, and consumption continued in the
1970s despite the price surge because natural gas was in short supply. By the 1980s, however, oil consumption by utilities dropped sharply, and in 2007, only 1.2% of power generation was oil-fired. Natural gas generation has a more complicated history. Consumption by the electric power industry increased gradually as access by pipeline became more widespread. Nuclear power started coming on line in significant amounts in the late 1960s, and 1975, in the midst of the oil crisis, was supplying 9% of total generation. Construction of major hydroelectric projects has also essentially ceased, and hydropower’s share of electricity generation has gradually declined from 30% in 1950 to 15% in 1975 and less than 10% in 2000. However, hydropower remains highly important on a regional basis. Sources of power generation vary greatly by region[17].
World net electricity generation increases by 93 percent from 20.2 trillion kilowatt-hours in 2010 to 39.0 trillion kilowatt-hours in 2040 (Table 6). Electricity is the world’s fastest-growing form of delivered energy. World electricity delivered to end users rises by 2.2 percent per year from 2010 to 2040[3].
6. CONCLUSIONThis paper focuses on energy consumption and it will provide an overview of the literature on personal consumer decisions about sustainable energy consumption. The increase in energy prices has caused to focus on energy consumption. We must to detect abnormal and unusual increases or decreases in consumption, to identify and evaluate conservation options and should take into account energy consumption sectors. This paper draws conclusions on the determinants of global energy consumption at macro level in order to analysis the effects of energy users. This study at macro level is useful because of the large number of variables that influence energy consumption. This paper aims to assess and explain the factors causing the growth of energy consumption. The current generation
Table 5. World Transportation Sector Delivered Energy Consumption by Region, 2010-2040 (Quadrillion Btu).
Table 6. OECD and Non-OECD Net Electricity Generation by Energy Source, 2010-2040 (Trillion Kilowatthours)

142
ICCI 2015 - Bildiriler Kitabı / Proceedings Book
of energy technologies is not capable of achieving the level of mitigation required. Next generations of renewable, low carbon generation and end use technologies will be needed. More innovative solutions are needed for energy consumption. Extra ordinary increase in consumption will require a global effort. One of solutions is to use energy efficiently. Industries will provide the next generation of energy efficient products for consumers in the future.
REFERENCES1] Filho W.L. and Voudouris V. (Eds.), “Global Energy Policy and Security”, Springer-Verlag, London, ENG, 2013.[2] Chen Z.M. and Chen G.Q., “An Overview of Energy Consumption of the Globalized World Economy”, Energy Policy, Vol.39, pp.5920-5928, 2011.[3] International Energy Outlook 2013: With Projections to 2040, Energy Information Administration (IEA), Washington, DC, USA, DOE/EIA-0484 /July 2013.[4] Guerra Santin O., “Actual Energy Consumption in Dwellings: The Effect of Energy Performance Regulations and Occupant Behaviour”, IOS Press, Amsterdam, NLD, 2010.[5] Branco G., Lachal B., Gallinelli P. and Weber W., “Predicted Versus Observed Heat Consumption of a Low Energy Multifamily Complex in Switzerland Based on Long- Term Experimental Data”, Energy and Buildings, Vol.36, pp.543-555, 2004.[6] Haas R., Auer H. and Biermayr P., “The Impact of Consumer Behavior on Residential Energy Demand for Space Heating”, Energy and Buildings, Vol.27, pp.195- 205, 2008.[7] Lahlou S. (Ed.), “System Innovation for Sustainability, Volume 4: Case Studies in Sustainable Consumption and Production: Energy Use and the Built Environment”, Greenleaf Publishing, Sheffield, GBR, 2010.[8] Lutzenhiser L., “A Question of Control – Alternative Patterns of Room Airconditioner Use”, Energy and Buildings, Vol.18, pp.193-200, 1992.[9] Itard L. and Meijer F., “Towards a Sustainable Northern European Housing Stock: Figures, Facts and Future”, IOS Press, Amsterdam, NLD, 2008.[10] Rey E., Lufkin S., Renaud P. and Perret L., “The Influence of Centrality on the Global Energy Consumption in Swiss Neighborhoods”, Energy and Buildings, Vol.60, pp.75-82, 2013. [11] Anjaneyulu Y. and Manickam V., “Environmental Impact Assessment Methodologies (Second Edition), BS Publications, Hyderabad, IND, 2007.[12] Ebenhack B.W. and Martinez D.M., “The Path to More Sustainable Energy Systems”, Momentum Press, New York, NY, USA, 2013.[13] White J.C. (Ed.), “Global Energy Strategies: Living with Restricted Greenhouse Gas Emissions”, Springer Science + Business Media, New York, NY, USA, 1993.
[14] Holmberg K., Siilasto R., Laitinen T., Andersson P. and Jasberg A., “Global Energy Consumption Due to Friction in Paper Machines”, Tribology International, Vol.62, pp.58-77, 2013.[15] Fujimori S. and Matsuoka Y., “Development of Method for Estimation of World Industrial Energy Consumption and Its Application”, Energy Economics, Vol.33, pp.461- 473, 2011.[16] Andresen M.P., “Decreasing Fuel Consumption and Exhaust Gas Emissions in Transportation: Sensing, Control and Reduction of Emissions”, Springer-Verlag, Berlin, Germany, 2013.[17] Peake E.G. (Ed.), “Energy Policies, Politics and Prices: U.S. Energy: Overview of the Trends, Statistics, Supply and Consumption”, Nova Science Publishers, Inc., New York, NY, USA, 2010.[18] Holmberg K., Andersson P. and Erdemir A., “Global Energy Consumption Due to Friction in Passenger Cars”, Tribology International, Vol.47, pp.221-234, 2012.[19] Bilgen S., “Structure and Environmental Impact of Global Energy Consumption”, Renewable and Sustainable Energy Reviews, Vol.38, pp.890-902, 2014.
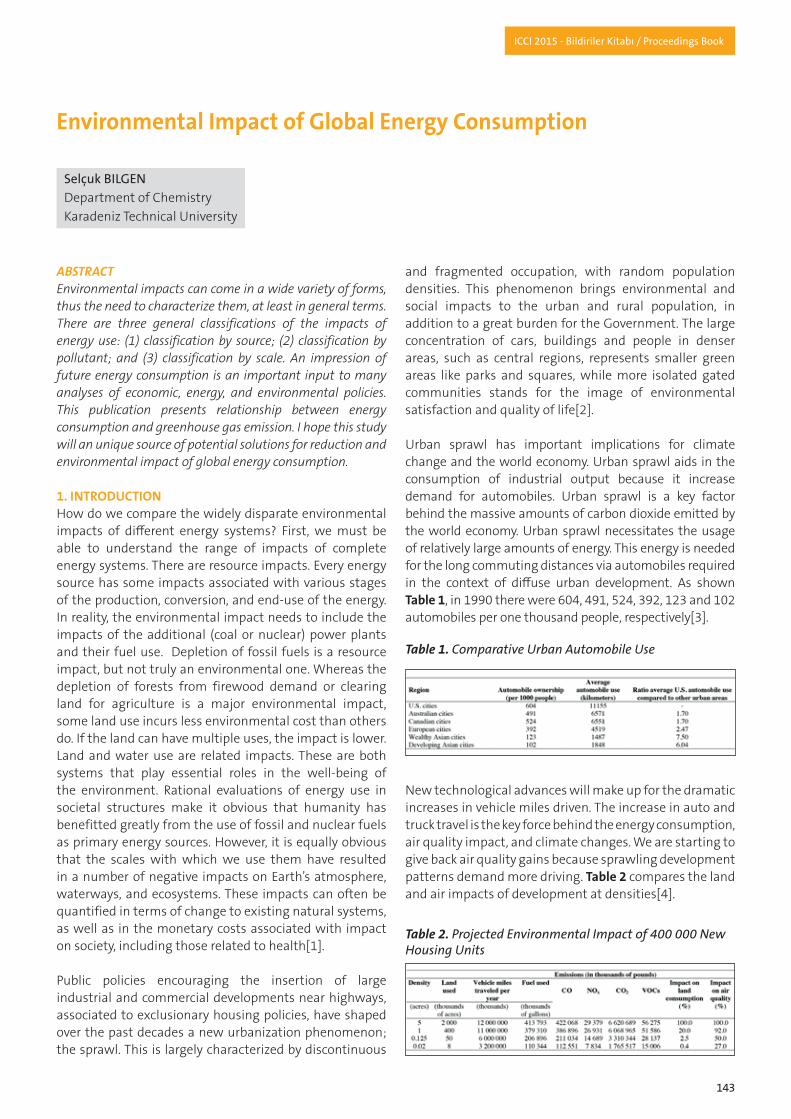
143
ICCI 2015 - Bildiriler Kitabı / Proceedings Book
ABSTRACTEnvironmental impacts can come in a wide variety of forms, thus the need to characterize them, at least in general terms. There are three general classifications of the impacts of energy use: (1) classification by source; (2) classification by pollutant; and (3) classification by scale. An impression of future energy consumption is an important input to many analyses of economic, energy, and environmental policies. This publication presents relationship between energy consumption and greenhouse gas emission. I hope this study will an unique source of potential solutions for reduction and environmental impact of global energy consumption.
1. INTRODUCTIONHow do we compare the widely disparate environmental impacts of different energy systems? First, we must be able to understand the range of impacts of complete energy systems. There are resource impacts. Every energy source has some impacts associated with various stages of the production, conversion, and end-use of the energy. In reality, the environmental impact needs to include the impacts of the additional (coal or nuclear) power plants and their fuel use. Depletion of fossil fuels is a resource impact, but not truly an environmental one. Whereas the depletion of forests from firewood demand or clearing land for agriculture is a major environmental impact, some land use incurs less environmental cost than others do. If the land can have multiple uses, the impact is lower. Land and water use are related impacts. These are both systems that play essential roles in the well-being of the environment. Rational evaluations of energy use in societal structures make it obvious that humanity has benefitted greatly from the use of fossil and nuclear fuels as primary energy sources. However, it is equally obvious that the scales with which we use them have resulted in a number of negative impacts on Earth’s atmosphere, waterways, and ecosystems. These impacts can often be quantified in terms of change to existing natural systems, as well as in the monetary costs associated with impact on society, including those related to health[1].
Public policies encouraging the insertion of large industrial and commercial developments near highways, associated to exclusionary housing policies, have shaped over the past decades a new urbanization phenomenon; the sprawl. This is largely characterized by discontinuous
and fragmented occupation, with random population densities. This phenomenon brings environmental and social impacts to the urban and rural population, in addition to a great burden for the Government. The large concentration of cars, buildings and people in denser areas, such as central regions, represents smaller green areas like parks and squares, while more isolated gated communities stands for the image of environmental satisfaction and quality of life[2].
Urban sprawl has important implications for climate change and the world economy. Urban sprawl aids in the consumption of industrial output because it increase demand for automobiles. Urban sprawl is a key factor behind the massive amounts of carbon dioxide emitted by the world economy. Urban sprawl necessitates the usage of relatively large amounts of energy. This energy is needed for the long commuting distances via automobiles required in the context of diffuse urban development. As shown Table 1, in 1990 there were 604, 491, 524, 392, 123 and 102 automobiles per one thousand people, respectively[3].
New technological advances will make up for the dramatic increases in vehicle miles driven. The increase in auto and truck travel is the key force behind the energy consumption, air quality impact, and climate changes. We are starting to give back air quality gains because sprawling development patterns demand more driving. Table 2 compares the land and air impacts of development at densities[4].
Environmental Impact of Global Energy Consumption
SelçukBILGENDepartment of Chemistry Karadeniz Technical University
Table 1. Comparative Urban Automobile Use
Table 2. Projected Environmental Impact of 400 000 New Housing Units
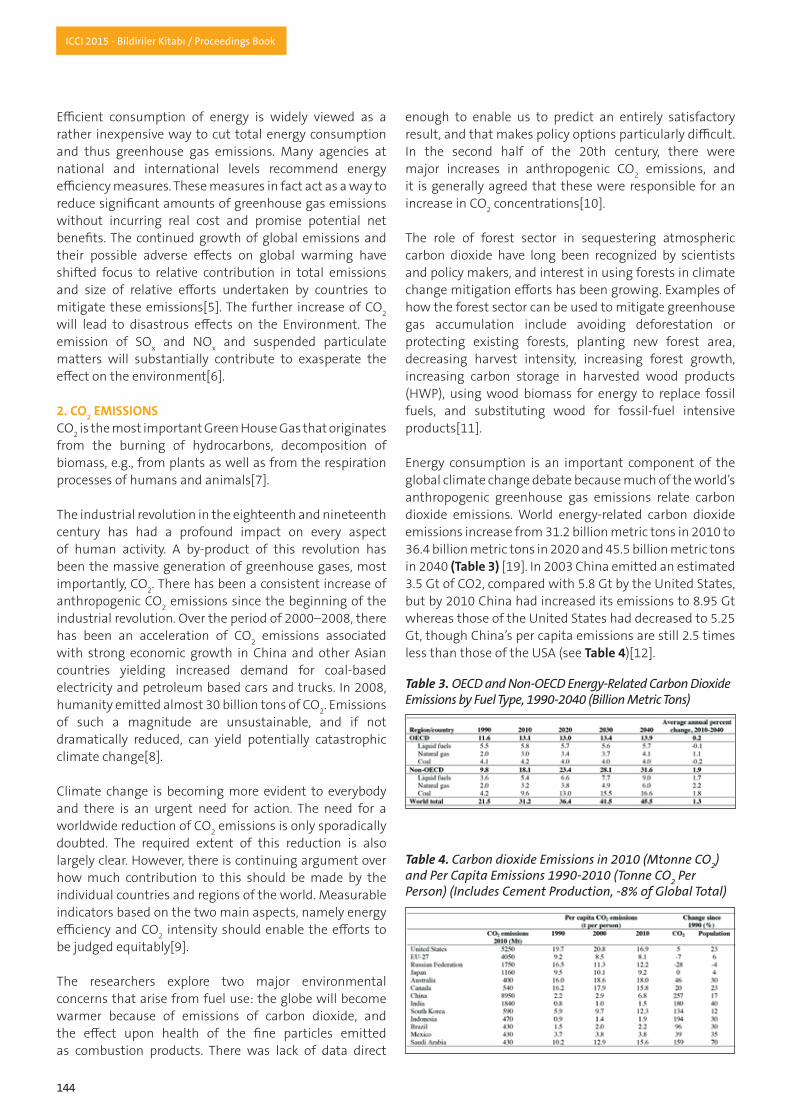
144
ICCI 2015 - Bildiriler Kitabı / Proceedings Book
Efficient consumption of energy is widely viewed as a rather inexpensive way to cut total energy consumption and thus greenhouse gas emissions. Many agencies at national and international levels recommend energy efficiency measures. These measures in fact act as a way to reduce significant amounts of greenhouse gas emissions without incurring real cost and promise potential net benefits. The continued growth of global emissions and their possible adverse effects on global warming have shifted focus to relative contribution in total emissions and size of relative efforts undertaken by countries to mitigate these emissions[5]. The further increase of CO2 will lead to disastrous effects on the Environment. The emission of SOx and NOx and suspended particulate matters will substantially contribute to exasperate the effect on the environment[6].
2. CO2 EMISSIONS CO2 is the most important Green House Gas that originates from the burning of hydrocarbons, decomposition of biomass, e.g., from plants as well as from the respiration processes of humans and animals[7].
The industrial revolution in the eighteenth and nineteenth century has had a profound impact on every aspect of human activity. A by-product of this revolution has been the massive generation of greenhouse gases, most importantly, CO2. There has been a consistent increase of anthropogenic CO2 emissions since the beginning of the industrial revolution. Over the period of 2000–2008, there has been an acceleration of CO2 emissions associated with strong economic growth in China and other Asian countries yielding increased demand for coal-based electricity and petroleum based cars and trucks. In 2008, humanity emitted almost 30 billion tons of CO2. Emissions of such a magnitude are unsustainable, and if not dramatically reduced, can yield potentially catastrophic climate change[8].
Climate change is becoming more evident to everybody and there is an urgent need for action. The need for a worldwide reduction of CO2 emissions is only sporadically doubted. The required extent of this reduction is also largely clear. However, there is continuing argument over how much contribution to this should be made by the individual countries and regions of the world. Measurable indicators based on the two main aspects, namely energy efficiency and CO2 intensity should enable the efforts to be judged equitably[9].
The researchers explore two major environmental concerns that arise from fuel use: the globe will become warmer because of emissions of carbon dioxide, and the effect upon health of the fine particles emitted as combustion products. There was lack of data direct
enough to enable us to predict an entirely satisfactory result, and that makes policy options particularly difficult. In the second half of the 20th century, there were major increases in anthropogenic CO2 emissions, and it is generally agreed that these were responsible for an increase in CO2 concentrations[10].
The role of forest sector in sequestering atmospheric carbon dioxide have long been recognized by scientists and policy makers, and interest in using forests in climate change mitigation efforts has been growing. Examples of how the forest sector can be used to mitigate greenhouse gas accumulation include avoiding deforestation or protecting existing forests, planting new forest area, decreasing harvest intensity, increasing forest growth, increasing carbon storage in harvested wood products (HWP), using wood biomass for energy to replace fossil fuels, and substituting wood for fossil-fuel intensive products[11].
Energy consumption is an important component of the global climate change debate because much of the world’s anthropogenic greenhouse gas emissions relate carbon dioxide emissions. World energy-related carbon dioxide emissions increase from 31.2 billion metric tons in 2010 to 36.4 billion metric tons in 2020 and 45.5 billion metric tons in 2040 (Table 3) [19]. In 2003 China emitted an estimated 3.5 Gt of CO2, compared with 5.8 Gt by the United States, but by 2010 China had increased its emissions to 8.95 Gt whereas those of the United States had decreased to 5.25 Gt, though China’s per capita emissions are still 2.5 times less than those of the USA (see Table 4)[12].
Table 3. OECD and Non-OECD Energy-Related Carbon Dioxide Emissions by Fuel Type, 1990-2040 (Billion Metric Tons)
Table 4. Carbon dioxide Emissions in 2010 (Mtonne CO2) and Per Capita Emissions 1990-2010 (Tonne CO2 Per Person) (Includes Cement Production, -8% of Global Total)
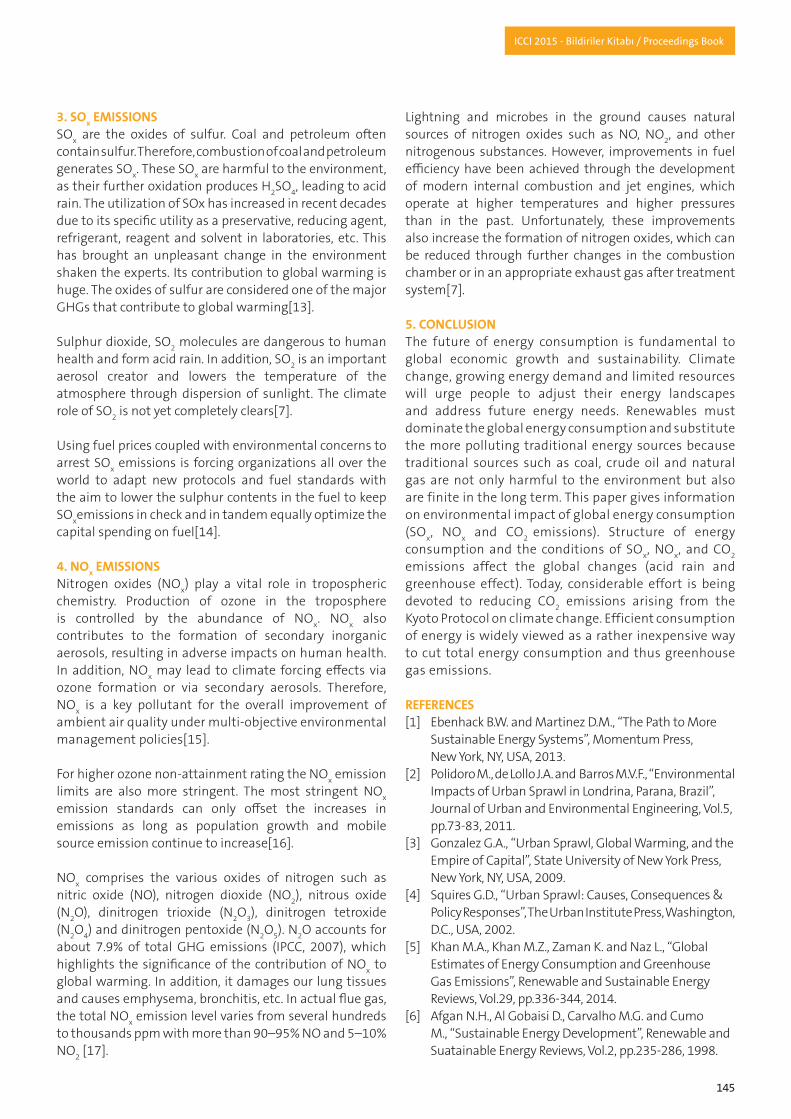
145
ICCI 2015 - Bildiriler Kitabı / Proceedings Book
3. SOx EMISSIONSSOx are the oxides of sulfur. Coal and petroleum often contain sulfur. Therefore, combustion of coal and petroleum generates SOx. These SOx are harmful to the environment, as their further oxidation produces H2SO4, leading to acid rain. The utilization of SOx has increased in recent decades due to its specific utility as a preservative, reducing agent, refrigerant, reagent and solvent in laboratories, etc. This has brought an unpleasant change in the environment shaken the experts. Its contribution to global warming is huge. The oxides of sulfur are considered one of the major GHGs that contribute to global warming[13].
Sulphur dioxide, SO2 molecules are dangerous to human health and form acid rain. In addition, SO2 is an important aerosol creator and lowers the temperature of the atmosphere through dispersion of sunlight. The climate role of SO2 is not yet completely clears[7]. Using fuel prices coupled with environmental concerns to arrest SOx emissions is forcing organizations all over the world to adapt new protocols and fuel standards with the aim to lower the sulphur contents in the fuel to keep SOxemissions in check and in tandem equally optimize the capital spending on fuel[14].
4. NOx EMISSIONSNitrogen oxides (NOx) play a vital role in tropospheric chemistry. Production of ozone in the troposphere is controlled by the abundance of NOx. NOx also contributes to the formation of secondary inorganic aerosols, resulting in adverse impacts on human health. In addition, NOx may lead to climate forcing effects via ozone formation or via secondary aerosols. Therefore, NOx is a key pollutant for the overall improvement of ambient air quality under multi-objective environmental management policies[15].
For higher ozone non-attainment rating the NOx emission limits are also more stringent. The most stringent NOx emission standards can only offset the increases in emissions as long as population growth and mobile source emission continue to increase[16].
NOx comprises the various oxides of nitrogen such as nitric oxide (NO), nitrogen dioxide (NO2), nitrous oxide (N2O), dinitrogen trioxide (N2O3), dinitrogen tetroxide (N2O4) and dinitrogen pentoxide (N2O5). N2O accounts for about 7.9% of total GHG emissions (IPCC, 2007), which highlights the significance of the contribution of NOx to global warming. In addition, it damages our lung tissues and causes emphysema, bronchitis, etc. In actual flue gas, the total NOx emission level varies from several hundreds to thousands ppm with more than 90–95% NO and 5–10% NO2 [17].
Lightning and microbes in the ground causes natural sources of nitrogen oxides such as NO, NO2, and other nitrogenous substances. However, improvements in fuel efficiency have been achieved through the development of modern internal combustion and jet engines, which operate at higher temperatures and higher pressures than in the past. Unfortunately, these improvements also increase the formation of nitrogen oxides, which can be reduced through further changes in the combustion chamber or in an appropriate exhaust gas after treatment system[7].
5. CONCLUSIONThe future of energy consumption is fundamental to global economic growth and sustainability. Climate change, growing energy demand and limited resources will urge people to adjust their energy landscapes and address future energy needs. Renewables must dominate the global energy consumption and substitute the more polluting traditional energy sources because traditional sources such as coal, crude oil and natural gas are not only harmful to the environment but also are finite in the long term. This paper gives information on environmental impact of global energy consumption (SOx, NOx and CO2 emissions). Structure of energy consumption and the conditions of SOx, NOx, and CO2 emissions affect the global changes (acid rain and greenhouse effect). Today, considerable effort is being devoted to reducing CO2 emissions arising from the Kyoto Protocol on climate change. Efficient consumption of energy is widely viewed as a rather inexpensive way to cut total energy consumption and thus greenhouse gas emissions.
REFERENCES[1] Ebenhack B.W. and Martinez D.M., “The Path to More Sustainable Energy Systems”, Momentum Press, New York, NY, USA, 2013.[2] Polidoro M., de Lollo J.A. and Barros M.V.F., “Environmental Impacts of Urban Sprawl in Londrina, Parana, Brazil”, Journal of Urban and Environmental Engineering, Vol.5, pp.73-83, 2011.[3] Gonzalez G.A., “Urban Sprawl, Global Warming, and the Empire of Capital”, State University of New York Press, New York, NY, USA, 2009.[4] Squires G.D., “Urban Sprawl: Causes, Consequences & Policy Responses”, The Urban Institute Press, Washington, D.C., USA, 2002.[5] Khan M.A., Khan M.Z., Zaman K. and Naz L., “Global Estimates of Energy Consumption and Greenhouse Gas Emissions”, Renewable and Sustainable Energy Reviews, Vol.29, pp.336-344, 2014.[6] Afgan N.H., Al Gobaisi D., Carvalho M.G. and Cumo M., “Sustainable Energy Development”, Renewable and Suatainable Energy Reviews, Vol.2, pp.235-286, 1998.
146
ICCI 2015 - Bildiriler Kitabı / Proceedings Book
[7] Andresen M.P., “Decreasing Fuel Consumption and Exhaust Gas Emissions in Transportation: Sensing, Control and Reduction of Emissions”, Springer-Verlag, Berlin, Germany, 2013.[8] Princiotta F.T. (Ed.), “Global Climate Change the Technology Challenge”, Springer Science + Business Media, Dordrecht, NLD, 2011.[9] Crastan V., “Global Energy Economics and Climate Protection Report 2009”, Springer-Verlag, Berlin, Germany, 2010.[10] Kursunoglu B.N., Mintz S.L. and Perlmutter A. (Eds.), “Global Warming and Energy Policy”, Springer Science + Business Media, New York, NY, USA, 2001. [11] Nepal P., Ince P.J., Skog K.E. and Chang S.J., “Projection of U.S. Forest Sector Carbon Sequestration Under U.S. and Global Timber Market and Wood Energy Consumption Scenarios, 2010-2060”, Biomass and Bioenergy, Vol.45, pp.251-264, 2012.[12] Andrews J., Jelley N.A. and Jelley N., “Energy Science: Principles, Technologies, and Impacts”, Oxford University Press, Oxford, UK, 2013.[13] Miah D., Masum F.H. and Koike M., “Global Observation of EKC Hypothesis for CO2, SOx and NOx Emission: A Policy Understanding for Climate Change Mitigation in Bangladesh”, Energy Policy, Vol.38, pp.4643-4651, 2010.[14] Hadis A.N., Qasmi F.A. and Askari S.J., “Practical Evaluation of Sulphur Contents in Diesel Fuel Used by Pakistani Industry for Steam and Power Generation and Establish Relationship Between Theoretical and Observed SOx Contents in Exhaust Emission”, Advanced Materials Research, Vol. 396, pp.21622165, 2012.[15] Zhao B., Wang S.X., Liu H., Xu J.Y., Fu K., Klimont Z., Hao J.M., He K.B., Cofala J. and Amann M., “NOx Emissions in China: Historical Trends and Future Perfectives”, Atmospheric Chemistry and Physics, Vol.13, pp.9869- 9897, 2013.[16] Shar A., “Regulatory Overview: NOx Emission Specifications from Stationary Sources”, Pollution Engineering, Vol.33, pp.16-21, 2001.[17] Zhao B. and Su Y., “Process Effect of Microalgal-Carbon Dioxide Fixation”, Renewable and Sustainable Energy Reviews, Vol.31, pp.121-132, 2014.
147
ICCI 2015 - Bildiriler Kitabı / Proceedings Book
ABSTRACTThe primary objective of this study is to present a unified exergy-based structure that provides useful insights and direction to those involved in exergy, environment and sustainable development for analyzing and addressing appropriately each of these areas using exergy concepts. The thermodynamic concept of chemical exergy is introduced for water quality evaluation. In this study, physical and chemical analyses of the water samples taken from the determined three stations in the Galyan River which will feed the Atasu Dam which is under the construction in order to supply the drinking and using water necessity of Trabzon province were performed.
1. INTRODUCTIONDespite the fact that many studies appeared during the past two decades concerning the close relationship between energy and the environment, there has only recently been an increasing number of works on the linkage between the exergy and environment. Environmental problems, issues and concerns span a continuously growing range of pollutants, hazards and ecosystem degradation factors that affect areas ranging from local through regional to global. Many environmental issues are caused by or related to the production, transformation and use of energy. For example, water pollution plays a significant role in energy in area of environmental concern[1].
In today’s world, the water using and consumption rates rise, and the need for the sustainable clean water resources increase every day according to industrialization and urbanization. At the same time, rivers are also excessively polluted, being used like stagnant waters in point of physical, chemical and biological as a result of unsystematic and wrong using. Rivers are widely used for removal and disposal of waste waters and other pollutants. Therefore, they are the most polluted receiving waters. The direct or indirect discharge of pollutants into rivers, effect of dams and irrigation systems, quality spoiled waters coming from agricultural irrigation and usages having recreative aims cause great pollution in rivers[2].
The efficiency of an energy conversion system is determined according to the first law of the thermodynamics. The second law of thermodynamics, on the other hand, deals with the quality of energy and determines the maximum amount of work obtainable from an energy resource. Therefore, the application of the exergy analysis in the context of the second law of thermodynamics to the thermodynamic processes has become a necessity.
2. PROCEDUREThe water samples must be taken with proper method and carefully as applied analyses technique as in order to reliable results in the physical and chemical analyses of the water samples. The physical, chemical and biological changes occur while the samples are waited. The maintaining techniques merely retard the chemical and biological changes, naturally continue, after the sample is taken away the source. The completely maintaining of the samples is difficult.
Determination of temperature in the industrial waters is generally unnecessary. Temperature in the drinking waters is required to be 6-12 0C. Temperature in the spring waters varies with the seasons. If temperature varies, there is mixing probability of other waters. Temperature measurements were performed by using an instrument, Horiba U-10 type.
Before pH is measured, the instrument must be calibrated with a known buffer solution at sample temperature. The electrode of pH meter is washed with pure water and plunge into the water sample placed into a beaker. When the value of pH is stable, pH is determined. pH measurements were performed by using an instrument, Horiba U-10 type.
Basic principle of determination is that all of the Fe+3 ions in the water sample are reduced to Fe+2 with the ascorbic acid and the formed Fe+2 ions together with the 1,10 - phenanthroline form an orange red complex. The formed red complex is measured in a 1 cm tub and an UV-VIS
Energy Efficiency and Water Quality of The Galyan River
SelçukBILGENDepartment of Chemistry Karadeniz Technical University
VolkanNumanBULUTMacka Vocational SchoolKaradeniz Technical University

148
ICCI 2015 - Bildiriler Kitabı / Proceedings Book
spectrophotometer at 510 nm. The determination interval of the performed analyses is 0.2 mg/L - 6 mg/L Fe+2. pH of the sample is held in 3 - 10 to make the determination with this method.
Basic principle of determination is that all of the Cr+3 ions in the water sample are oxidized to Cr+6 and these formed ions together with 1,5 - diphenylcarbazide form red colored 1,5 - diphenylcarbazone complex and this formed colored complex is measured in a 1 cm tub and an UV-VIS spectrophotometer at 540 nm. The determination interval of the performed analyses is 0.03 mg/L - 1 mg/L Cr+6. pH of the sample is held in 3 - 9 to make the determination with this method.
Basic principle of determination is that the aluminum ions together with Chromazurol S in a solution which is made a little acidic form together with acetic acid-sodium acetate buffer form a green colored lake complex and this formed colored complex is measured in a 1 cm tub and an UV-VIS spectrophotometer at 620 nm. The determination interval of the performed analyses is 0.02 mg/L - 0.5 mg/L Al+3. pH of the sample is held in 2.5 - 3.5 to make the determination with this method.
Determination of the copper, lead and zinc are performed with the Electrothermal AAS method. The taken samples were injected into graphite furnace, wavelengths were adjusted to 324.8(Cu), 283.3(Pb) and 213.9(Zn) nm, and measurements were performed.
3. THEORETICAL CONSIDERATIONSExergy for a given system is defined as the maximal amount of work that can be extracted from the system in the process of reaching equilibrium with its local environment, chosen to have a direct bearing on the behavior of the system with respect to the time and length scales[3]. Exergy provides a biophysical numeration to measure various forms of energy, matter and information in a unified way. On the other hand, exergy itself as the fundamental natural resource has been verified by the researches in systems ecology[4][5].
Exergy is the maximum amount of work that can be obtained if a material or some form of energy is converted to its inert reference state[6]. The chemical exergy of a substance is the maximum work that can be obtained from it by taking it to chemical equilibrium with the reference environment at constant temperature and pressure[7]. To assess the chemical exergy of a substance, the properties of the chemical elements comprising the substance must be referred to the properties of some corresponding reasonably selected substances in the environment[8].
The standard chemical exergy values of elements, whose reference species are dissolved in the river-water, are obtained by means of Eq.(1).
where j is the number of reference ions or molecules derived from one molecule of the element under consideration; is the standard normal free energy of formation of the reference species; z is the number of the elementary positive charges in the reference ion; is the number of molecules of additional elements present in the molecule of the reference species; and are standard chemical exergies of hydrogen gas and of the kth additional element, respectively; mn is the conventional standard molarity of the reference species in the river-water; is the activity coefficient (molarity scale) of the reference species in the river-water; and pH is the pH of the river-water[9-11].
The activity coefficients of the ions depend mainly on the ionic strength I of the electrolyte, which is defined as follows[12]:
where mi is molarity of the ith ion (mol /kg H2O) and zi is number of the elementary electric charges on the ith ion.
4. RESULT AND DISCUSSIONThe samples were taken from three different points (Çiftdere, Temelli and Kuştul stream) in the Galyan River to be one time in a month during the eight months.
Variation of the temperature, pH, the total iron (Fe+2, Fe+3), the total chromium (Cr+3, Cr+6), aluminum, copper, lead and zinc values according to the months in the samples taken from these points in 2004 have been given Table 1[2][12].
The results obtained from the samples taken from Değirmen place of Kuştul stream, Çiftdere place of Galyan stream and Temelli place of Galyan stream in the Galyan River between April 2004 and November 2004 are classified according to the Water Pollution Control Regulation.
According to the water temperature findings, it is seen that all of the water samples taken from Değirmen place of Kuştul stream, Çiftdere place of Galyan stream and Temelli place of Galyan stream have the first class water quality.

149
ICCI 2015 - Bildiriler Kitabı / Proceedings Book
Parameters to calculate the standard chemical exergies of some elements having reference species dissolved in the river-water are given in Table 2[12].
Table 3 gives calculated values of the standard chemical exergies for some elements having reference species dissolved in water of the Galyan River in 2004[12, 13].
5. CONCLUSIONThe purpose of this study is to perform the physical and chemical analyses of the water samples taken from the determined three stations in the Galyan River. In this study, physical and chemical analyses of the water samples taken from the determined three stations at the Galyan River which will feed the Atasu Dam which is under the construction in order to supply the drinking and using water necessity of Trabzon province were performed. We consider exergy as the confluence of energy, environment and sustainable development. The basis for this treatment is the interdisciplinary character of exergy and its relation to each of these disciplines. The short, middle and long distance protection zones of Atasu Dam environment must be declared and this area must be protected. In this area, the controlled agriculture and settlement must be permitted. Chemical exergy can be calculated from the appropriate value of the Gibbs function of formation and the values of the chemical exergy of the constituent chemical elements. Reference species dissolved in the river-water should be preferred in the calculation of standard chemical exergy, because they give a relatively high accuracy for the calculations. The reference reaction can be formulated for every compound if the reference species selects. Reference reactions with ionic reference species comprise an additional reference species.
REFERENCES[1] Dincer I. and Rosen M.A., “Exergy: Energy, Environment and Sustainable Development”, Elsevier, Oxford, UK, 2007.[2] Bulut V., “Investigation of Water Quality and Modelling of the Galyan River in Maçka”, Msc Thesis, Karadeniz Technical University, Trabzon, Turkey, 2005.[3] Rosen M.A., “Exergy as the Confluence of Energy, Environment and Sustainable development”, Exergy, Int J, Vol.1, pp.3-13, 2001.[4] Brown M.T., Odum, H.T. and Jørgensen, S.E., “Energy Hierarchy and Transformity in the Universe”, Ecol Model, Vol.178, pp.17-28, 2004.[5] Jørgensen S.E. and Nielsen S.N., “Application of Exergy as Thermodynamic Indicator in Ecology”, Energy, Vol.32, pp.673-685, 2007.[6] Bilgen S. and Kaygusuz K., “The Calculation of the Chemical Exergies of Coal-Based Fuels by Using the Higher Heating Values”, Applied Energy, Vol.85, pp.776-785, 2008.[7] Rivero R. and Garfias M., “Standard Chemical Exergy of Elements Updated”, Energy, Vol.31, pp.3310-3326, 2006.[8] Chen G.Q. and Ji X., “Chemical Exergy Based Evaluation of Water Quality”, Egological Modelling, Vol.200, pp.259- 268, 2007.[9] Bilgen S., “Calculation and Interpretation of the Standard Chemical Exergies of Elements Using the Chemical Reference Species”, Acta Phys. - Chim. Sin., Vol.25, pp.1645-1649, 2009.
Table 1. Variation of Temperature, pH, and Concentrations of Some Elements Found in Galyan River in 2004
Table 2. Parameters To Calculate The Standard Chemical Exergies of Some Elements Having Reference Species Dissolved In The River-Water
Table 3. Calculated Values of The Standard Chemical Exergies For Some Elements (kJ/mol)

150
ICCI 2015 - Bildiriler Kitabı / Proceedings Book
[10] Kaygusuz K. and Bilgen S., “Thermodynamic Aspects of Renewable and Sustainable Development”, Energy Sources, Part A, Vol.31, pp.287-298, 2009.[11] Bilgen S., Kaygusuz K. and Sarı A., “Thermodynamic Aspects of Energy Systems and Sustainable Development”, Energy Sources, Part A, Vol.30, pp.325- 333, 2008.[12] Bilgen S., “Calculation of exergy values of some chemical processes”, PhD thesis, Karadeniz Technical University, Trabzon, Turkey, 2006.[13] Bilgen S. and Bulut V.N., “Investigation of the Chemical Exergy and Water Quality of the Galyan River, Trabzon, Turkey”, Energy Sources, Part A, Vol.36, pp.2595-2602, 2014.
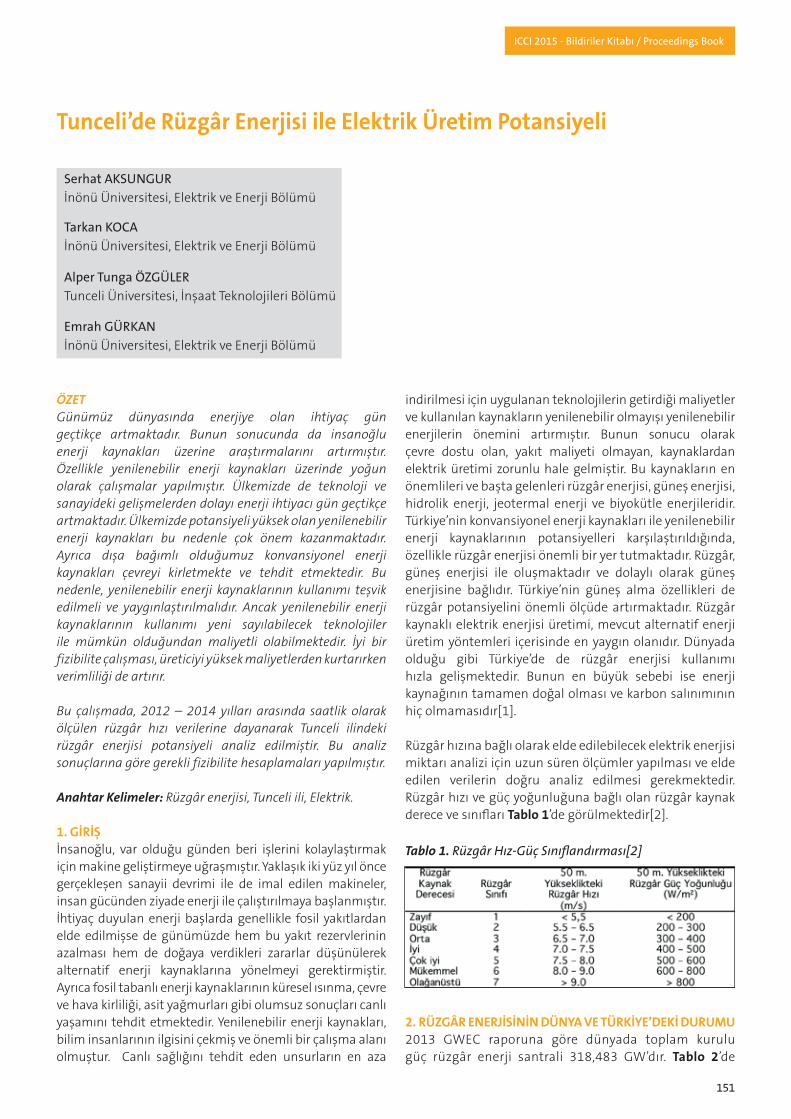
151
ICCI 2015 - Bildiriler Kitabı / Proceedings Book
Tablo 1. Rüzgâr Hız-Güç Sınıflandırması[2]
ÖZETGünümüz dünyasında enerjiye olan ihtiyaç gün geçtikçe artmaktadır. Bunun sonucunda da insanoğlu enerji kaynakları üzerine araştırmalarını artırmıştır. Özellikle yenilenebilir enerji kaynakları üzerinde yoğun olarak çalışmalar yapılmıştır. Ülkemizde de teknoloji ve sanayideki gelişmelerden dolayı enerji ihtiyacı gün geçtikçe artmaktadır. Ülkemizde potansiyeli yüksek olan yenilenebilir enerji kaynakları bu nedenle çok önem kazanmaktadır. Ayrıca dışa bağımlı olduğumuz konvansiyonel enerji kaynakları çevreyi kirletmekte ve tehdit etmektedir. Bu nedenle, yenilenebilir enerji kaynaklarının kullanımı teşvik edilmeli ve yaygınlaştırılmalıdır. Ancak yenilenebilir enerji kaynaklarının kullanımı yeni sayılabilecek teknolojiler ile mümkün olduğundan maliyetli olabilmektedir. İyi bir fizibilite çalışması, üreticiyi yüksek maliyetlerden kurtarırken verimliliği de artırır.
Bu çalışmada, 2012 – 2014 yılları arasında saatlik olarak ölçülen rüzgâr hızı verilerine dayanarak Tunceli ilindeki rüzgâr enerjisi potansiyeli analiz edilmiştir. Bu analiz sonuçlarına göre gerekli fizibilite hesaplamaları yapılmıştır.
Anahtar Kelimeler: Rüzgâr enerjisi, Tunceli ili, Elektrik.
1. GİRİŞİnsanoğlu, var olduğu günden beri işlerini kolaylaştırmak için makine geliştirmeye uğraşmıştır. Yaklaşık iki yüz yıl önce gerçekleşen sanayii devrimi ile de imal edilen makineler, insan gücünden ziyade enerji ile çalıştırılmaya başlanmıştır. İhtiyaç duyulan enerji başlarda genellikle fosil yakıtlardan elde edilmişse de günümüzde hem bu yakıt rezervlerinin azalması hem de doğaya verdikleri zararlar düşünülerek alternatif enerji kaynaklarına yönelmeyi gerektirmiştir. Ayrıca fosil tabanlı enerji kaynaklarının küresel ısınma, çevre ve hava kirliliği, asit yağmurları gibi olumsuz sonuçları canlı yaşamını tehdit etmektedir. Yenilenebilir enerji kaynakları, bilim insanlarının ilgisini çekmiş ve önemli bir çalışma alanı olmuştur. Canlı sağlığını tehdit eden unsurların en aza
indirilmesi için uygulanan teknolojilerin getirdiği maliyetler ve kullanılan kaynakların yenilenebilir olmayışı yenilenebilir enerjilerin önemini artırmıştır. Bunun sonucu olarak çevre dostu olan, yakıt maliyeti olmayan, kaynaklardan elektrik üretimi zorunlu hale gelmiştir. Bu kaynakların en önemlileri ve başta gelenleri rüzgâr enerjisi, güneş enerjisi, hidrolik enerji, jeotermal enerji ve biyokütle enerjileridir. Türkiye’nin konvansiyonel enerji kaynakları ile yenilenebilir enerji kaynaklarının potansiyelleri karşılaştırıldığında, özellikle rüzgâr enerjisi önemli bir yer tutmaktadır. Rüzgâr, güneş enerjisi ile oluşmaktadır ve dolaylı olarak güneş enerjisine bağlıdır. Türkiye’nin güneş alma özellikleri de rüzgâr potansiyelini önemli ölçüde artırmaktadır. Rüzgâr kaynaklı elektrik enerjisi üretimi, mevcut alternatif enerji üretim yöntemleri içerisinde en yaygın olanıdır. Dünyada olduğu gibi Türkiye’de de rüzgâr enerjisi kullanımı hızla gelişmektedir. Bunun en büyük sebebi ise enerji kaynağının tamamen doğal olması ve karbon salınımının hiç olmamasıdır[1].
Rüzgâr hızına bağlı olarak elde edilebilecek elektrik enerjisi miktarı analizi için uzun süren ölçümler yapılması ve elde edilen verilerin doğru analiz edilmesi gerekmektedir. Rüzgâr hızı ve güç yoğunluğuna bağlı olan rüzgâr kaynak derece ve sınıfları Tablo 1’de görülmektedir[2].
2. RÜZGÂR ENERJİSİNİN DÜNYA VE TÜRKİYE’DEKİ DURUMU2013 GWEC raporuna göre dünyada toplam kurulu güç rüzgâr enerji santrali 318,483 GW’dır. Tablo 2’de
Tunceli’de Rüzgâr Enerjisi ile Elektrik Üretim Potansiyeli
SerhatAKSUNGURİnönü Üniversitesi, Elektrik ve Enerji Bölümü
TarkanKOCAİnönü Üniversitesi, Elektrik ve Enerji Bölümü
EmrahGÜRKANİnönü Üniversitesi, Elektrik ve Enerji Bölümü
AlperTungaÖZGÜLERTunceli Üniversitesi, İnşaat Teknolojileri Bölümü
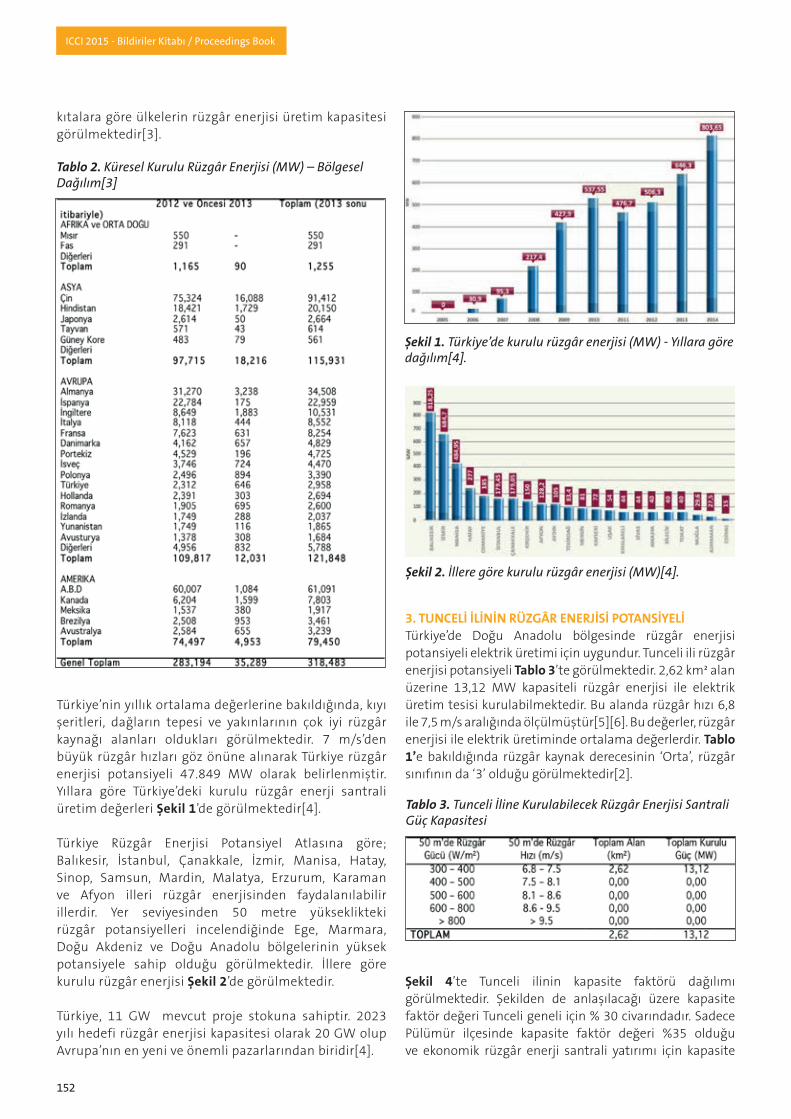
152
ICCI 2015 - Bildiriler Kitabı / Proceedings Book
kıtalara göre ülkelerin rüzgâr enerjisi üretim kapasitesi görülmektedir[3].
Türkiye’nin yıllık ortalama değerlerine bakıldığında, kıyı şeritleri, dağların tepesi ve yakınlarının çok iyi rüzgâr kaynağı alanları oldukları görülmektedir. 7 m/s’den büyük rüzgâr hızları göz önüne alınarak Türkiye rüzgâr enerjisi potansiyeli 47.849 MW olarak belirlenmiştir. Yıllara göre Türkiye’deki kurulu rüzgâr enerji santrali üretim değerleri Şekil 1’de görülmektedir[4].
Türkiye Rüzgâr Enerjisi Potansiyel Atlasına göre; Balıkesir, İstanbul, Çanakkale, İzmir, Manisa, Hatay, Sinop, Samsun, Mardin, Malatya, Erzurum, Karaman ve Afyon illeri rüzgâr enerjisinden faydalanılabilir illerdir. Yer seviyesinden 50 metre yükseklikteki rüzgâr potansiyelleri incelendiğinde Ege, Marmara, Doğu Akdeniz ve Doğu Anadolu bölgelerinin yüksek potansiyele sahip olduğu görülmektedir. İllere göre kurulu rüzgâr enerjisi Şekil 2’de görülmektedir.
Türkiye, 11 GW mevcut proje stokuna sahiptir. 2023 yılı hedefi rüzgâr enerjisi kapasitesi olarak 20 GW olup Avrupa’nın en yeni ve önemli pazarlarından biridir[4].
3. TUNCELİ İLİNİN RÜZGÂR ENERJİSİ POTANSİYELİTürkiye’de Doğu Anadolu bölgesinde rüzgâr enerjisi potansiyeli elektrik üretimi için uygundur. Tunceli ili rüzgâr enerjisi potansiyeli Tablo 3’te görülmektedir. 2,62 km² alan üzerine 13,12 MW kapasiteli rüzgâr enerjisi ile elektrik üretim tesisi kurulabilmektedir. Bu alanda rüzgâr hızı 6,8 ile 7,5 m/s aralığında ölçülmüştür[5][6]. Bu değerler, rüzgâr enerjisi ile elektrik üretiminde ortalama değerlerdir. Tablo 1’e bakıldığında rüzgâr kaynak derecesinin ‘Orta’, rüzgâr sınıfının da ‘3’ olduğu görülmektedir[2].
Şekil 4’te Tunceli ilinin kapasite faktörü dağılımı görülmektedir. Şekilden de anlaşılacağı üzere kapasite faktör değeri Tunceli geneli için % 30 civarındadır. Sadece Pülümür ilçesinde kapasite faktör değeri %35 olduğu ve ekonomik rüzgâr enerji santrali yatırımı için kapasite
Tablo 2. Küresel Kurulu Rüzgâr Enerjisi (MW) – Bölgesel Dağılım[3]
Şekil 1. Türkiye’de kurulu rüzgâr enerjisi (MW) - Yıllara göre dağılım[4].
Şekil 2. İllere göre kurulu rüzgâr enerjisi (MW)[4].
Tablo 3. Tunceli İline Kurulabilecek Rüzgâr Enerjisi Santrali Güç Kapasitesi
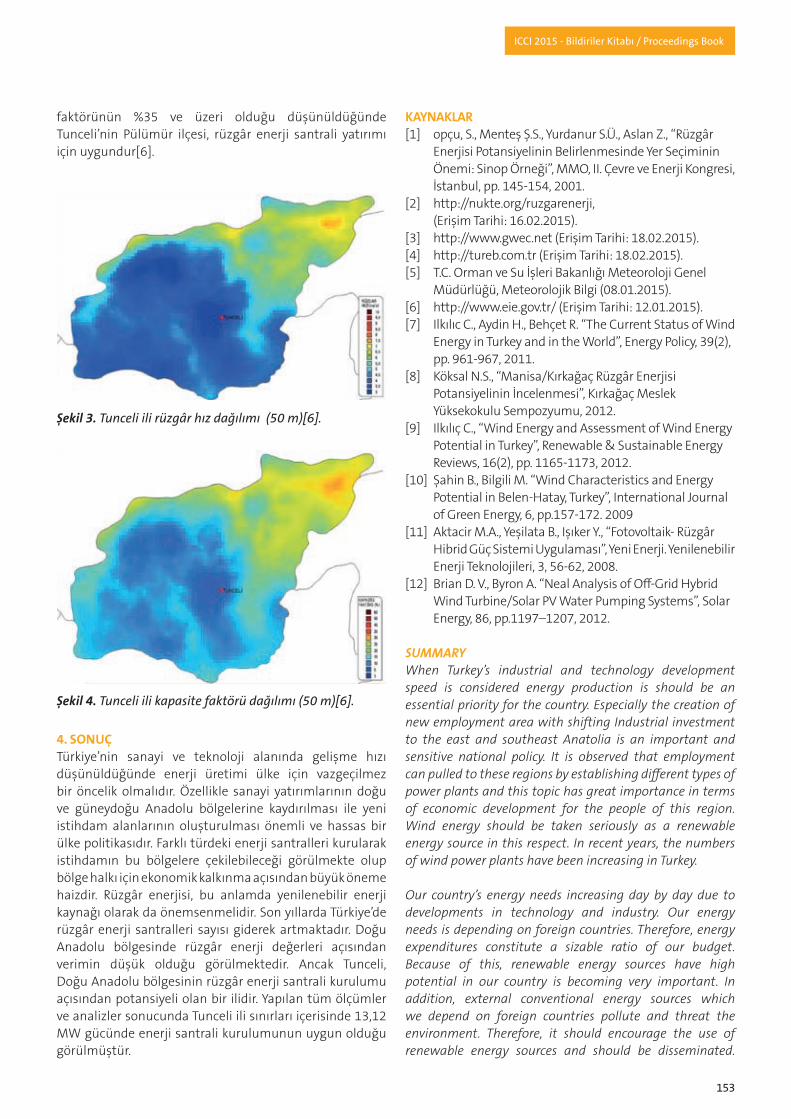
153
ICCI 2015 - Bildiriler Kitabı / Proceedings Book
faktörünün %35 ve üzeri olduğu düşünüldüğünde Tunceli’nin Pülümür ilçesi, rüzgâr enerji santrali yatırımı için uygundur[6].
4. SONUÇTürkiye’nin sanayi ve teknoloji alanında gelişme hızı düşünüldüğünde enerji üretimi ülke için vazgeçilmez bir öncelik olmalıdır. Özellikle sanayi yatırımlarının doğu ve güneydoğu Anadolu bölgelerine kaydırılması ile yeni istihdam alanlarının oluşturulması önemli ve hassas bir ülke politikasıdır. Farklı türdeki enerji santralleri kurularak istihdamın bu bölgelere çekilebileceği görülmekte olup bölge halkı için ekonomik kalkınma açısından büyük öneme haizdir. Rüzgâr enerjisi, bu anlamda yenilenebilir enerji kaynağı olarak da önemsenmelidir. Son yıllarda Türkiye’de rüzgâr enerji santralleri sayısı giderek artmaktadır. Doğu Anadolu bölgesinde rüzgâr enerji değerleri açısından verimin düşük olduğu görülmektedir. Ancak Tunceli, Doğu Anadolu bölgesinin rüzgâr enerji santrali kurulumu açısından potansiyeli olan bir ilidir. Yapılan tüm ölçümler ve analizler sonucunda Tunceli ili sınırları içerisinde 13,12 MW gücünde enerji santrali kurulumunun uygun olduğu görülmüştür.
KAYNAKLAR[1] opçu, S., Menteş Ş.S., Yurdanur S.Ü., Aslan Z., “Rüzgâr Enerjisi Potansiyelinin Belirlenmesinde Yer Seçiminin Önemi: Sinop Örneği”, MMO, II. Çevre ve Enerji Kongresi, İstanbul, pp. 145-154, 2001.[2] http://nukte.org/ruzgarenerji, (Erişim Tarihi: 16.02.2015).[3] http://www.gwec.net (Erişim Tarihi: 18.02.2015).[4] http://tureb.com.tr (Erişim Tarihi: 18.02.2015).[5] T.C. Orman ve Su İşleri Bakanlığı Meteoroloji Genel Müdürlüğü, Meteorolojik Bilgi (08.01.2015).[6] http://www.eie.gov.tr/ (Erişim Tarihi: 12.01.2015).[7] Ilkılıc C., Aydin H., Behçet R. “The Current Status of Wind Energy in Turkey and in the World”, Energy Policy, 39(2), pp. 961-967, 2011.[8] Köksal N.S., “Manisa/Kırkağaç Rüzgâr Enerjisi Potansiyelinin İncelenmesi”, Kırkağaç Meslek Yüksekokulu Sempozyumu, 2012. [9] Ilkılıç C., “Wind Energy and Assessment of Wind Energy Potential in Turkey”, Renewable & Sustainable Energy Reviews, 16(2), pp. 1165-1173, 2012.[10] Şahin B., Bilgili M. “Wind Characteristics and Energy Potential in Belen-Hatay, Turkey”, International Journal of Green Energy, 6, pp.157-172. 2009[11] Aktacir M.A., Yeşilata B., Işıker Y., “Fotovoltaik- Rüzgâr Hibrid Güç Sistemi Uygulaması”, Yeni Enerji. Yenilenebilir Enerji Teknolojileri, 3, 56-62, 2008.[12] Brian D. V., Byron A. “Neal Analysis of Off-Grid Hybrid Wind Turbine/Solar PV Water Pumping Systems”, Solar Energy, 86, pp.1197–1207, 2012.
SUMMARYWhen Turkey’s industrial and technology development speed is considered energy production is should be an essential priority for the country. Especially the creation of new employment area with shifting Industrial investment to the east and southeast Anatolia is an important and sensitive national policy. It is observed that employment can pulled to these regions by establishing different types of power plants and this topic has great importance in terms of economic development for the people of this region. Wind energy should be taken seriously as a renewable energy source in this respect. In recent years, the numbers of wind power plants have been increasing in Turkey.
Our country’s energy needs increasing day by day due to developments in technology and industry. Our energy needs is depending on foreign countries. Therefore, energy expenditures constitute a sizable ratio of our budget. Because of this, renewable energy sources have high potential in our country is becoming very important. In addition, external conventional energy sources which we depend on foreign countries pollute and threat the environment. Therefore, it should encourage the use of renewable energy sources and should be disseminated.
Şekil 3. Tunceli ili rüzgâr hız dağılımı (50 m)[6].
Şekil 4. Tunceli ili kapasite faktörü dağılımı (50 m)[6].

154
ICCI 2015 - Bildiriler Kitabı / Proceedings Book
However, using the renewable energy sources possible by could be considered new technologies, can be costly. A good feasibility study, redeem the manufacturer from high costs and increases the efficiency.
Considered to be Turkey is a developing country, day by day need for energy will be increased. This need can be met by establishing different types of power plants. To reduce dependence on foreign it must pass the condition as energy-producing country. Wind energy must be taken seriously cause of a renewable energy source. In recent years, the number of wind power plants has been increasing in Turkey. In the Eastern Anatolia region seems to be lower than the yield in terms of wind energy values.
Wind energy potential in Eastern Anatolia in Turkey is suitable for electricity generation. Wind energy potential of Tunceli province is seen in Table 3. 13.12 MW power generation plant with wind energy can be established on 2.62 km² areas. Wind speed was measured at intervals 6.8 to 7.5 m/s in the area. These values are average values of power generation by wind power. In Table 1, it is observed that the degree of wind resources is ‘medium’, class of wind is ‘3’.
In the East Anatolia region, it can be seen that the yield lower in terms of wind energy values. However, Tunceli is a city with potential, in terms of wind power plant installation in eastern Anatolia. As a result of all measurements and analyzes, 13.12 MW power plant installations is appropriate were seen in Tunceli province.
Keywords: Wind energy, Tunceli district, Electric

155
ICCI 2015 - Bildiriler Kitabı / Proceedings Book
ÖZETBu bildiride, Gaz Transfer Membranları (GTM) ile proses sularından CO2 ve O2 giderimine yönelik uygulama örnekleri incelenecek olup, bu teknoloji ve CO2 degazörünün işletme maliyetleri, özellikle kimyasal tüketimi kapsamında karşılaştırılacaktır. GTM kullanımı ile kimyasal tüketim ihtiyacı ortadan kalkmakta veya sınırlandırılmaktadır. Dolayısı ile aynı zamanda yeşil bir teknolojidir. GTM’ler konvansiyonel gaz giderim teknolojileri ile karşılaştırıldığında, aynı şartlar altında çok daha az yer kaplamakta, kapalı bir sistem olduğundan sıvıların tekrar basınçlandırılmasına gerek duyulmamakta, kimyasal tüketimini ortadan kaldırmakta ve çok daha düşük CO2 ve O2 değerleri sağlamaktadır. Böylece GTM ile özellikle enerji santrallerinde yatırım ve işletme maliyetleri önemli ölçüde düşürülebilmektedir.
1. GİRİŞ1990’lı yılların ortalarında gaz transferi uygulamaları için mikroporlu membran kontaktörü tasarımında oldukça hızlı gelişmeler yaşandı. Bu teknoloji daha önce sadece 1 ila 2m3/h kapasiteli laboratuvar ölçekli küçük cihazlarda uygulanırken yeni tasarlanan membran kontaktörleri ile su arıtma sistemleri için 225 ila 450 m3/h kapasiteli endüstriyel cihazları gerçekleştirme imkanı ortaya çıktı.
2. ARKA PLANMembran kontaktörlerinde bir gaz fazı ile bir likit faz doğrudan temas etmektedirler. Buradaki amaç bir fazın diğeri içinde dağılımı olmadan fazlar arasında kütle transferini gerçekleştirmektir. Bu teknolojinin tipik bir kullanımı, sularda çözünmüş gazların giderimi veya gazların sularda çözünmesidir.
Membranları kullanarak iki fazı birbiriyle temasa geçirmek aslında yeni değildir. Fakat kontaktörlerin tasarımındaki yeni gelişmelerle verimlerinde ve kapasitelerinde çok önemli artışlar sağlanmış bulunmaktadır. Bu gelişmeler membran kontaktörlerini laboratuvarlardan çıkarıp, orta ve büyük endüstriyel ölçekli uygulamalar için de ekonomik hale getirmeye başlamıştır. Sulu bir akımdan çözünmüş gazların giderimi için membran kontaktörlerinin işletilmesi sırasında, sulu akım hidrofobik bir membranın bir tarafından geçirilirken membranın diğer tarafından da bir “süpürücü” gaz geçirilir veya o tarafa bir vakum uygulanır. Mikroporlu membran hidrofobik olduğu için membran, likit suyun diğer taraftaki gaz fazına geçmesine izin vermez. Membran, gaz ve likit faz arasında porlarda bir arayüze izin veren bir destek görevi görür. Su ile temasta olan gazın kısmi basıncı ayarlanarak gazlar çözünmüş oldukları su içinden seçimli bir şekilde uzaklaştırılırlar veya suda çözünürler.
3. İŞLEMİN PRENSİPLERİKontaktörün sudan çözünmüş gazları giderme yeteneğini açıklayabilmek için kütle transferi için etkili olan gücü tartışmak gerekir. Henry Kanunu, denge halinde suda çözünecek gaz miktarının su ile temasta bulunan buhar fazındaki kısmi basıncı ile doğru orantılı olduğunu belirtmektedir.
P = H.x P = Gazın kısmi basıncıH = Henry sabiti (sıcaklığa bağlı bir değerdir)X = Denge halinde çözünmüş olanın konsantrasyonu
1 atmosfer basınç altında ve 25oC’de suda yaklaşık olarak 8,5 ppm oksijen, 14,5 ppm azot, eser miktarda CO2 ve eser miktarda da atmosferdeki diğer gazlar çözünmüş halde bulunur. Su ile temasta bulunan gazın kısmi basıncı azaltılırsa buna bağlı olarak aynı gazın suda çözünmüş miktarı da azalır. Gazın kısmi basıncı iki şekilde azaltılabilir. Gaz fazının toplam basıncı azaltılır ya da gaz fazındaki gazın konsantrasyonu değiştirilir. Gazın toplam basıncını azaltmak için membranın gaz tarafına vakum uygulanabilir. Degazör olarak kullanılan alternatif yöntemlerden vakum kulesinde de aynı prensipler geçerlidir. Su ile temasta bulunan gazın
Enerji Santrallerinde “Gaz Transfer Membranı” Uygulamaları ile İşletme ve Yatırım Maliyetlerinin Düşürülmesi
ŞebnemAybigeŞENERÖkotek Çevre Teknolojisi ve Kimya Sanayi Ltd. Şti.
BurcuKaleliÖZTÜRKÖkotek Çevre Teknolojisi ve Kimya Sanayi Ltd. Şti.
Tablo 1. Membran Kontaktörlerinde Kullanılan Genel Terimler
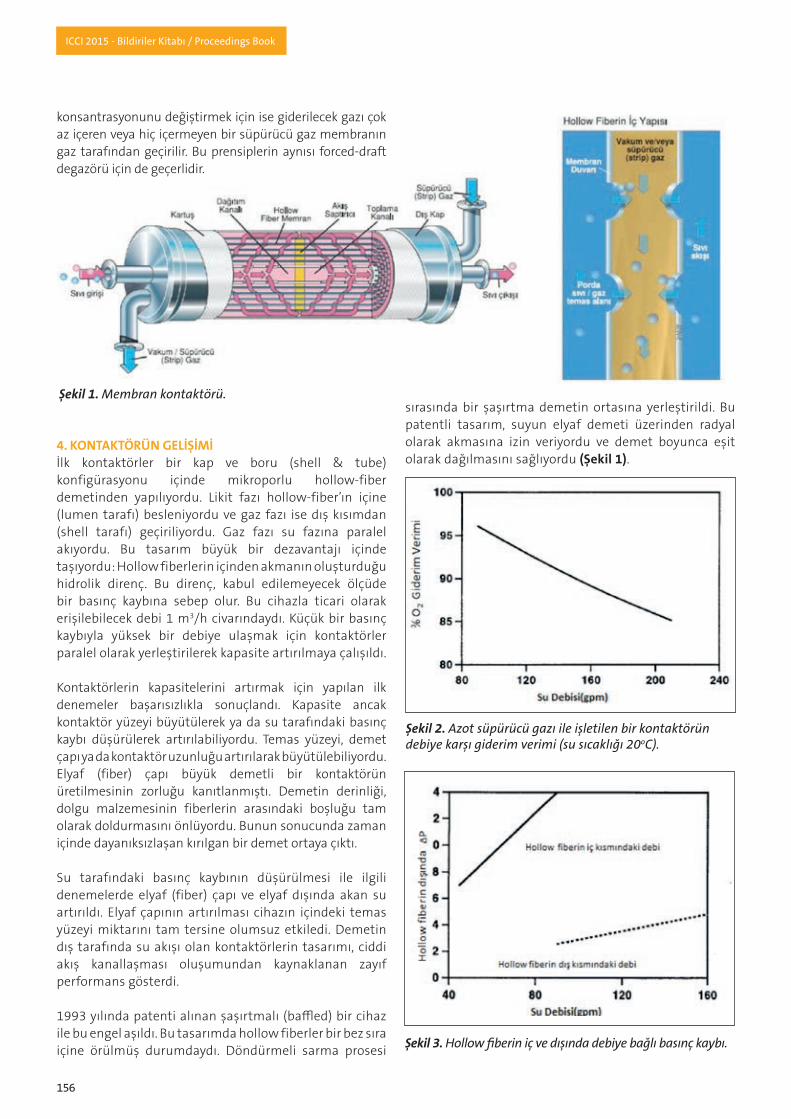
156
ICCI 2015 - Bildiriler Kitabı / Proceedings Book
konsantrasyonunu değiştirmek için ise giderilecek gazı çok az içeren veya hiç içermeyen bir süpürücü gaz membranın gaz tarafından geçirilir. Bu prensiplerin aynısı forced-draft degazörü için de geçerlidir.
4. KONTAKTÖRÜN GELİŞİMİİlk kontaktörler bir kap ve boru (shell & tube) konfigürasyonu içinde mikroporlu hollow-fiber demetinden yapılıyordu. Likit fazı hollow-fiber’ın içine (lumen tarafı) besleniyordu ve gaz fazı ise dış kısımdan (shell tarafı) geçiriliyordu. Gaz fazı su fazına paralel akıyordu. Bu tasarım büyük bir dezavantajı içinde taşıyordu: Hollow fiberlerin içinden akmanın oluşturduğu hidrolik direnç. Bu direnç, kabul edilemeyecek ölçüde bir basınç kaybına sebep olur. Bu cihazla ticari olarak erişilebilecek debi 1 m3/h civarındaydı. Küçük bir basınç kaybıyla yüksek bir debiye ulaşmak için kontaktörler paralel olarak yerleştirilerek kapasite artırılmaya çalışıldı.
Kontaktörlerin kapasitelerini artırmak için yapılan ilk denemeler başarısızlıkla sonuçlandı. Kapasite ancak kontaktör yüzeyi büyütülerek ya da su tarafındaki basınç kaybı düşürülerek artırılabiliyordu. Temas yüzeyi, demet çapı ya da kontaktör uzunluğu artırılarak büyütülebiliyordu. Elyaf (fiber) çapı büyük demetli bir kontaktörün üretilmesinin zorluğu kanıtlanmıştı. Demetin derinliği, dolgu malzemesinin fiberlerin arasındaki boşluğu tam olarak doldurmasını önlüyordu. Bunun sonucunda zaman içinde dayanıksızlaşan kırılgan bir demet ortaya çıktı.
Su tarafındaki basınç kaybının düşürülmesi ile ilgili denemelerde elyaf (fiber) çapı ve elyaf dışında akan su artırıldı. Elyaf çapının artırılması cihazın içindeki temas yüzeyi miktarını tam tersine olumsuz etkiledi. Demetin dış tarafında su akışı olan kontaktörlerin tasarımı, ciddi akış kanallaşması oluşumundan kaynaklanan zayıf performans gösterdi.
1993 yılında patenti alınan şaşırtmalı (baffled) bir cihaz ile bu engel aşıldı. Bu tasarımda hollow fiberler bir bez sıra içine örülmüş durumdaydı. Döndürmeli sarma prosesi
sırasında bir şaşırtma demetin ortasına yerleştirildi. Bu patentli tasarım, suyun elyaf demeti üzerinden radyal olarak akmasına izin veriyordu ve demet boyunca eşit olarak dağılmasını sağlıyordu (Şekil 1).
Şekil 1. Membran kontaktörü.
Şekil 2. Azot süpürücü gazı ile işletilen bir kontaktörün debiye karşı giderim verimi (su sıcaklığı 20oC).
Şekil 3. Hollow fiberin iç ve dışında debiye bağlı basınç kaybı.

157
ICCI 2015 - Bildiriler Kitabı / Proceedings Book
Bu tasarım, su tarafındaki basınç kaybını kontaktör sayesinde düşürüyor ve tek bir cihaza katılmış olan ek membran alanına izin veriyordu. Şekil 3, kontaktördeki basınç kaybının debinin bir fonksiyonu olduğunu göstermektedir. Hollow fiber içine akış olan kontaktördeki basınç kaybı, hollow fiberin dış tarafında akışlı olan kontaktöre göre daha büyüktür.
Basınç kaybındaki bu azalmanın önemi çok büyüktür. Basınç kaybı azaldığında iki veya üç kontaktör seri olarak yerleştirilebilir. Kontaktörler seri olarak yerleştirildiğinde bir kontaktör dizisinin toplam giderim verimi, artan sıvı hızı sayesinde önemli ölçüde iyileşir.
Giderimin yüzdesi, seri haldeki bir kontaktör için “giriş konsantrasyonu – çıkış konsantrasyonu/ giriş konsantrasyonu” ile tanımlanır. Serideki ikinci kontaktör teorik olarak aynı giderim verimine sahiptir. Örneğin 23 m3/h (100 gpm) debi için serideki ilk kontaktör yaklaşık olarak % 95 oksijen giderir. Serideki ikinci kontaktör geriye kalan oksijenin yine %95’ini giderir ve toplam giderim %99,75 olur. Grafikten de görüldüğü gibi, seri haldeki iki kontaktörden geçen debi, aynı giderim verimi sağlanarak 46 m3/h (200 gpm) değerinin üstüne bile çıkarılabilir.
Kütle transfer katsayısının gerçek değeri, kontaktörün performansının ölçülmesi ve k kütle transfer katsayısı için çözümü sayesinde elde edilir. Likit faz fiberin dışında olduğunda, verilen bir fiber için kütle transfer katsayısının daha yüksek olması ilginçtir. Gelişmiş kütle transferi, membrandan geçen debi ile ilişkili ek türbülansa dayandırılmaktadır.
5. KONVANSİYONEL MEMBRAN FİLTRASYONU İLEKARŞILAŞTIRMAMembran kontaktörlerinde membranların kullanımı, likit filtrasyonunda kullanılan membranlardan oldukça farklıdır. Filtrasyon cihazları, partikülleri ve suda çözünmüş olan katıları uzaklaştırmak için kullanılırlar. Su membrandan geçer gider. Su böylece, partikül ve katıların boyutlarına göre belirlenmiş olan membrandan geçerken partiküllerden ve çözünmüş katılardan arıtılmış olur. Suyu membrana doğru hareket ettiren itici güç olarak su basıncı kullanılır ve membrandan geçme sırasında porlar partikülleri tutarlar. Ters osmoz, ultrafiltrasyon ve mikrofiltrasyon çözünmüş gazları giderme kapasitesine sahip değillerdir.
Faz-temas amaçlı kullanılan membranlarda, membran içinde konvektif akış yoktur. Bir fazdan diğer faza difüzyon yoluyla kütle transferini kolaylaştırmak için bir kısmi basınç düşümü (gradient) kullanılır.
Su ile temasta olan gazın kısmi basıncının düşürülmesi, çözünmüş gazın giderilmesine veya çözünmesine izin
verir. Likit su hidrofobik membranı geçemez; membran sadece iki faza destek olarak kullanılır ve birinin diğerine temasta olmasına izin verir.
Filtrasyon membranları, tipik olarak membranın giderebileceği partikül veya çözünmüş madde boyutunun yüzdesi ile sınıflandırılırlar. Membran kontaktörleri esas olarak kütle transferi amacıyla iki fazı birbiriyle temasa getiren cihazlar oldukları için performansları tipik olarak giriş-çözünmüş-gaz konsantrasyonunun çıkış-çözünmüş-gaz-konsantrasyonuna oranı sayesinde ölçülürler.
Membran kontaktörlerine en yakından ilgili olan membran teknolojileri pervaporasyon ve gaz separasyonudur. Bu her iki teknoloji de gazların belirli türlerinin seçimli bir şekilde membrandan geçmesine izin veren porsuz membranları kullanırlar. Aksine, membran kontaktörleri mikroporlu membranları içerirler. Membran kontaktörleri seçimli değillerdir ve tüm gazların geçmelerine izin verirler.
Şekil 4. Azot süpürücü gazı ile işletilen bir ve seri bağlı iki kontaktörün debiye karşı giderim verimi.
Şekil 5. Fiberin dışında, fibere dik ve fiberin içindeki debi için birim yüzey alanına karşı kütle transfer katsayısı.
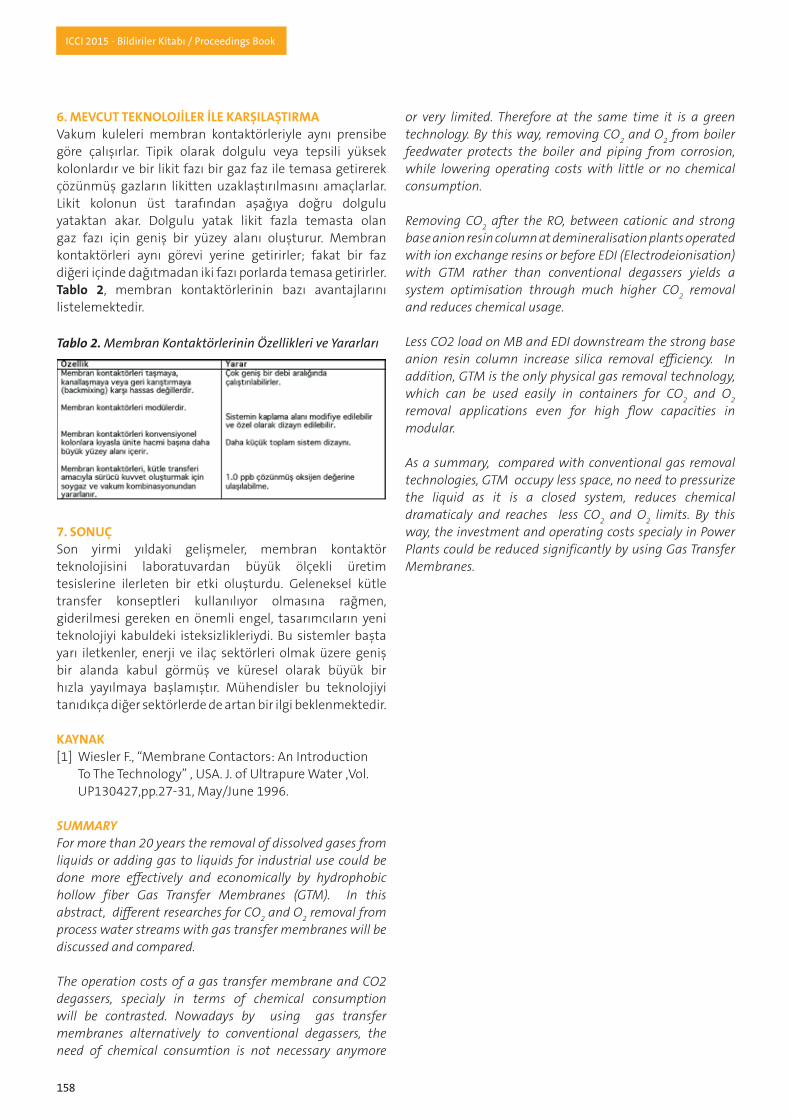
158
ICCI 2015 - Bildiriler Kitabı / Proceedings Book
6. MEVCUT TEKNOLOJİLER İLE KARŞILAŞTIRMAVakum kuleleri membran kontaktörleriyle aynı prensibe göre çalışırlar. Tipik olarak dolgulu veya tepsili yüksek kolonlardır ve bir likit fazı bir gaz faz ile temasa getirerek çözünmüş gazların likitten uzaklaştırılmasını amaçlarlar. Likit kolonun üst tarafından aşağıya doğru dolgulu yataktan akar. Dolgulu yatak likit fazla temasta olan gaz fazı için geniş bir yüzey alanı oluşturur. Membran kontaktörleri aynı görevi yerine getirirler; fakat bir faz diğeri içinde dağıtmadan iki fazı porlarda temasa getirirler. Tablo 2, membran kontaktörlerinin bazı avantajlarını listelemektedir.
7. SONUÇSon yirmi yıldaki gelişmeler, membran kontaktör teknolojisini laboratuvardan büyük ölçekli üretim tesislerine ilerleten bir etki oluşturdu. Geleneksel kütle transfer konseptleri kullanılıyor olmasına rağmen, giderilmesi gereken en önemli engel, tasarımcıların yeni teknolojiyi kabuldeki isteksizlikleriydi. Bu sistemler başta yarı iletkenler, enerji ve ilaç sektörleri olmak üzere geniş bir alanda kabul görmüş ve küresel olarak büyük bir hızla yayılmaya başlamıştır. Mühendisler bu teknolojiyi tanıdıkça diğer sektörlerde de artan bir ilgi beklenmektedir.
KAYNAK[1] Wiesler F., “Membrane Contactors: An Introduction To The Technology” , USA. J. of Ultrapure Water ,Vol. UP130427,pp.27-31, May/June 1996.
SUMMARYFor more than 20 years the removal of dissolved gases from liquids or adding gas to liquids for industrial use could be done more effectively and economically by hydrophobic hollow fiber Gas Transfer Membranes (GTM). In this abstract, different researches for CO2 and O2 removal from process water streams with gas transfer membranes will be discussed and compared.
The operation costs of a gas transfer membrane and CO2 degassers, specialy in terms of chemical consumption will be contrasted. Nowadays by using gas transfer membranes alternatively to conventional degassers, the need of chemical consumtion is not necessary anymore
or very limited. Therefore at the same time it is a green technology. By this way, removing CO2 and O2 from boiler feedwater protects the boiler and piping from corrosion, while lowering operating costs with little or no chemical consumption.
Removing CO2 after the RO, between cationic and strong base anion resin column at demineralisation plants operated with ion exchange resins or before EDI (Electrodeionisation) with GTM rather than conventional degassers yields a system optimisation through much higher CO2 removal and reduces chemical usage.
Less CO2 load on MB and EDI downstream the strong base anion resin column increase silica removal efficiency. In addition, GTM is the only physical gas removal technology, which can be used easily in containers for CO2 and O2 removal applications even for high flow capacities in modular.
As a summary, compared with conventional gas removal technologies, GTM occupy less space, no need to pressurize the liquid as it is a closed system, reduces chemical dramaticaly and reaches less CO2 and O2 limits. By this way, the investment and operating costs specialy in Power Plants could be reduced significantly by using Gas Transfer Membranes.
Tablo 2. Membran Kontaktörlerinin Özellikleri ve Yararları

159
ICCI 2015 - Bildiriler Kitabı / Proceedings Book
Tablo 1. Rüzgâr Hız - Güç Sınıflandırması[2]
ÖZETÜlkemizde teknoloji ve sanayideki gelişmelerden dolayı enerji ihtiyacı gün geçtikçe artmaktadır. Enerji kullanımı bakımından dışa bağımlı olduğumuzdan, enerji giderleri bütçemizde oldukça büyük bir oran oluşturmaktadır. Ülkemizde potansiyeli yüksek olan yenilenebilir enerji kaynakları bu nedenle çok önem kazanmaktadır. Ayrıca dışa bağımlı olduğumuz konvansiyonel enerji kaynakları çevreyi kirletmekte ve tehdit etmektedir. Bu nedenle, yenilenebilir enerji kaynaklarının kullanımı teşvik edilmeli ve yaygınlaştırılmalıdır. Ancak yenilenebilir enerji kaynaklarının kullanımı yeni sayılabilecek teknolojiler ile mümkün olduğundan maliyetli olabilmektedir. İyi bir fizibilite çalışması, üreticiyi yüksek maliyetlerden kurtarırken verimliliği de artırır.
Bu çalışmada, 2011-2014 yılları arasında saatlik olarak ölçülen rüzgâr hızı verilerine dayanarak Malatya ili Arapgir İlçesi’ndeki rüzgâr enerjisi potansiyeli analiz edilmiştir. Bu analiz sonuçlarına göre gerekli fizibilite hesaplamaları yapılmıştır.
Anahtar Kelimeler: Rüzgâr enerjisi, Arapgir bölgesi, Elektrik
1. GİRİŞİnsanoğlunun diğer canlılardan ayrılan en önemli özelliklerinden biri, doğal ortam ile etkileşiminde kendisine avantaj sağlayan enerji kaynaklarından yararlanabilmesidir. Enerjinin her alanda kullanılabilir olması, önemli bilimsel ve teknolojik gelişmelerin altyapısını oluşturmaktadır. Ülkemizde ve dünyada gün geçtikçe enerjiye olan ihtiyaç artmaktadır. Bu da insanoğlunu yeni enerji kaynakları bulmaya yönlendirmiştir. Özellikle yenilenebilir enerji kaynakları birçok avantajından dolayı bilim insanlarının ilgisini çekmiştir. Mevcut tükenebilir enerji kaynaklarındaki azalmalar, ki bunlar; kömür, petrol, doğal gaz gibi fosil yakıtlardır, ayrıca fosil tabanlı enerji kaynaklarının küresel ısınma, çevre ve hava kirliliği, asit yağmurları gibi olumsuz sonuçları canlı yaşamını tehdit etmektedir. Bu problemlerden dolayı artan
hassasiyet bu zararları en aza indirgemeyi gerektirmektedir. Canlı sağlığını tehdit eden unsurların en aza indirilmesi için uygulanan teknolojilerin getirdiği maliyetler ve kullanılan kaynakların yenilenebilir olmayışı, yenilenebilir enerjilerin önemini artırmıştır. Bunun sonucu olarak çevre dostu olan, yakıt maliyeti olmayan kaynaklardan elektrik üretimi zorunlu hale gelmiştir. Bu kaynakların en önemlileri ve başta gelenleri rüzgâr enerjisi, güneş enerjisi, hidrolik enerji, jeotermal enerji ve biyokütle enerjileridir. Türkiye’nin konvansiyonel enerji kaynakları ile yenilenebilir enerji kaynaklarının potansiyelleri karşılaştırıldığında, özellikle rüzgâr enerjisi büyük bir önem arz etmektedir. Rüzgâr enerjisi, güneş enerjisinin dolaylı bir şeklidir. Rüzgâr kaynaklı elektrik enerjisi üretimi, yenilenebilir enerji kaynakları içinde en gelişmişidir. Dünyada olduğu gibi Türkiye’de de rüzgâr enerjisinin hızlı bir şekilde gelişmesinin birçok nedeni vardır. Bunlar, rüzgârın atmosferde doğal olarak oluşması, yakıt maliyetinin sıfır olması, kurulum sürecinin kolay olması ve maliyetinin de gün geçtikçe azalıyor olmasıdır. Rüzgâr enerjisine temiz enerji denilmesinin en önemli nedeni, rüzgâr enerjisinden elektrik üretim sürecinin karbon bağımsız olmasıdır. Neticesinde de çevre kirliliğine neden olmamaktadır[1].
Rüzgâr hızına bağlı olarak elde edilebilecek elektrik enerjisi miktarı iyi analiz edilmelidir. Rüzgâr hızı ve güç yoğunluğuna bağlı olan rüzgâr kaynak derece ve sınıfları Tablo 1’de görülmektedir[2].
Rüzgâr Enerjisi ile Elektrik Üretim Potansiyeli; Malatya İli Arapgir İlçesi Örneği
TarkanKOCAİnönü Üniversitesi, Elektrik ve Enerji Bölümü
SerhatAKSUNGURİnönü Üniversitesi, Elektrik ve Enerji Bölümü
EmrahGÜRKANİnönü Üniversitesi, Elektrik ve Enerji Bölümü
AlperTungaÖZGÜLERTunceli Üniversitesi, İnşaat Teknolojileri Bölümü

160
ICCI 2015 - Bildiriler Kitabı / Proceedings Book
2. RÜZGÂR ENERJİSİNİN DÜNYA VE TÜRKİYE’DEKİ DURUMU2013 GWEC raporuna göre, dünyada toplam kurulu güç rüzgâr enerji santrali 318,483 GW değerine ulaşmıştır. Tablo 2’de kıtalara göre ülkelerin rüzgâr enerjisi üretim kapasitesi görülmektedir[3].
Türkiye rüzgâr kaynakları açısından oldukça zengindir. Yıllık olarak ortalama değerler baz alındığında, Türkiye’nin en iyi rüzgâr kaynağı alanları kıyı şeritleri, yüksek bayırlar ile dağların tepesi ve yakınlarında bulunmaktadır. 7 m/s’den büyük rüzgâr hızları göz önüne alınarak Türkiye rüzgâr enerjisi potansiyeli 47.849 MW olarak belirlenmiştir. Yıllara göre Türkiye’deki kurulu rüzgâr enerji santrali üretim değerleri Şekil 1’de görülmektedir[4].
Türkiye Rüzgâr Enerjisi Potansiyel Atlası’na göre; Balıkesir, İstanbul, Çanakkale, İzmir, Manisa, Hatay, Sinop, Samsun, Mardin, Malatya, Erzurum, Karaman ve Afyon illeri rüzgâr enerjisinden faydalanılabilir illerdir. Yer seviyesinden 50 metre yükseklikteki rüzgâr potansiyelleri incelendiğinde Ege, Marmara, Doğu Akdeniz ve Doğu Anadolu bölgelerinin yüksek potansiyele sahip olduğu görülmektedir. İllere göre kurulu rüzgâr enerjisi Şekil 2’de görülmektedir[4].
Günümüzde Türkiye, 11 GW mevcut proje stoku ve ulusal hedefi 2023 yıllında 20 GW olan rüzgâr enerjisi kapasitesi ile Avrupa’daki en önemli rüzgâr pazarıdır. Türkiye’nin kendi bölgesinde bir enerji üssü haline gelmiş olması, Türkiye’de yatırım fırsatları oluşturmaktadır.
Rüzgâr enerjisi santralleri dışa bağımlı olmadığından ekonomik özgürlük de sağlamaktadır. Rüzgâr enerjisi ile üretilen elektrik enerjisi, yenilenebilir enerji grubu içerisinde yer alarak Kyoto Protokolü uyarınca elektrik enerjisi ihracına ortam yaratmıştır[4].
3. MALATYA İLİ ARAPGİR İLÇESİNİN RÜZGÂR ENERJİSİPOTANSİYELİ Türkiye’de Doğu Anadolu bölgesinde rüzgâr enerjisi potansiyeli elektrik üretimi için uygundur. Özellikle Malatya, Sivas, Tunceli ve Elazığ’a sınırı olan ve şehir merkezi rakımı yaklaşık 1300 metre olan Arapgir ilçesi rüzgâr enerjisi potansiyeli bakımından ilgi çeken bir ilçe konumundadır. 2014 yılı itibari ile farklı üç noktada gerekli ölçümler yaklaşık dört yıl boyunca yapılmış ve rüzgâr enerjisi santral kurulumu için oldukça uygun şartların mevcut olduğu görülmüştür. Özellikle Sivas sınırı bölgesinde yapılan ölçümlerde ortalama rüzgâr hızının 7 ~ 8 m/s olduğu tespit edilmiştir[5]. Bu değerler, rüzgâr enerjisi ile elektrik üretiminde ortalamanın üzerindeki değerlerdir. Tablo 1’e bakıldığında, rüzgâr kaynak derecesinin ‘Çok İyi’, rüzgâr sınıfının da ‘5’ olduğu görülmektedir[2].
Şekil 3’te, Malatya ilinde 50m yükseklikte ölçülen rüzgâr hızı değerleri görülmektedir. Şekilden de anlaşıldığı üzere, rüzgâr hızın en yüksek değerleri Arapgir ilçesinde
Tablo 2. Küresel Kurulu Rüzgâr Enerjisi (MW) – Bölgesel Dağılım[3]
Şekil 1. Türkiye’de kurulu rüzgâr enerjisi (MW) - Yıllara göre dağılım[4].
Şekil 2. İllere göre kurulu rüzgâr enerjisi (MW)[4].
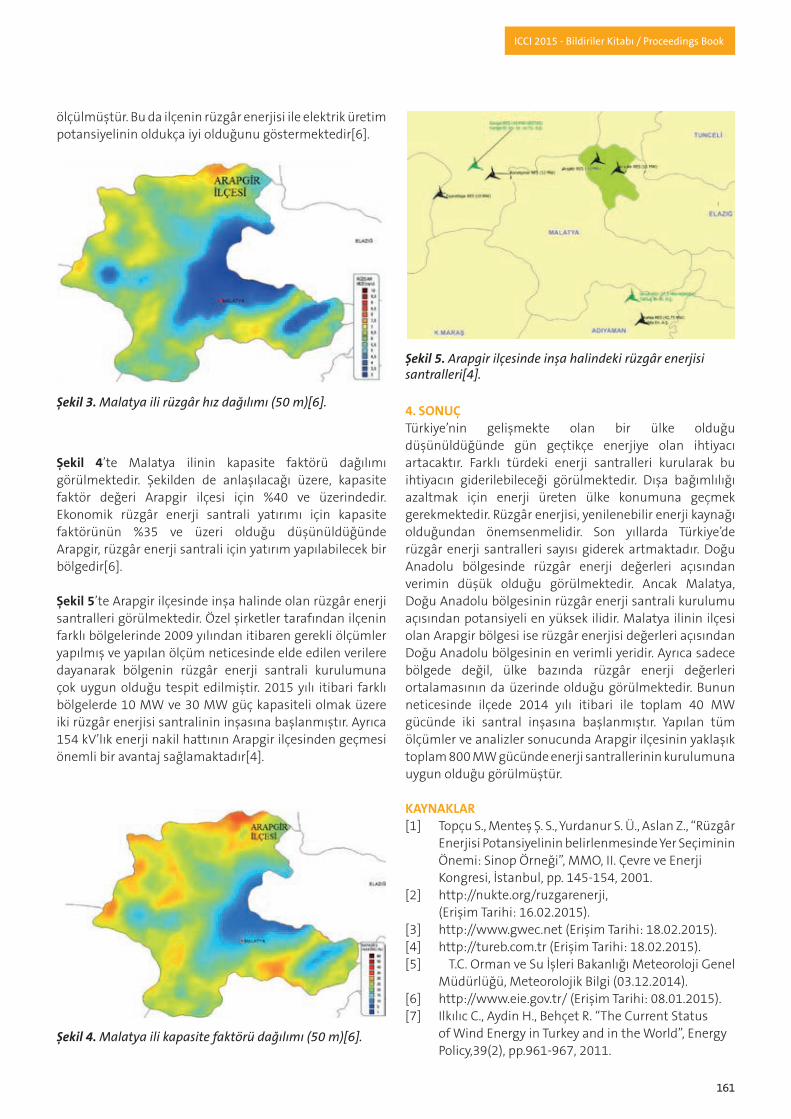
161
ICCI 2015 - Bildiriler Kitabı / Proceedings Book
ölçülmüştür. Bu da ilçenin rüzgâr enerjisi ile elektrik üretim potansiyelinin oldukça iyi olduğunu göstermektedir[6].
Şekil 4’te Malatya ilinin kapasite faktörü dağılımı görülmektedir. Şekilden de anlaşılacağı üzere, kapasite faktör değeri Arapgir ilçesi için %40 ve üzerindedir. Ekonomik rüzgâr enerji santrali yatırımı için kapasite faktörünün %35 ve üzeri olduğu düşünüldüğünde Arapgir, rüzgâr enerji santrali için yatırım yapılabilecek bir bölgedir[6].
Şekil 5’te Arapgir ilçesinde inşa halinde olan rüzgâr enerji santralleri görülmektedir. Özel şirketler tarafından ilçenin farklı bölgelerinde 2009 yılından itibaren gerekli ölçümler yapılmış ve yapılan ölçüm neticesinde elde edilen verilere dayanarak bölgenin rüzgâr enerji santrali kurulumuna çok uygun olduğu tespit edilmiştir. 2015 yılı itibari farklı bölgelerde 10 MW ve 30 MW güç kapasiteli olmak üzere iki rüzgâr enerjisi santralinin inşasına başlanmıştır. Ayrıca 154 kV’lık enerji nakil hattının Arapgir ilçesinden geçmesi önemli bir avantaj sağlamaktadır[4].
4. SONUÇTürkiye’nin gelişmekte olan bir ülke olduğu düşünüldüğünde gün geçtikçe enerjiye olan ihtiyacı artacaktır. Farklı türdeki enerji santralleri kurularak bu ihtiyacın giderilebileceği görülmektedir. Dışa bağımlılığı azaltmak için enerji üreten ülke konumuna geçmek gerekmektedir. Rüzgâr enerjisi, yenilenebilir enerji kaynağı olduğundan önemsenmelidir. Son yıllarda Türkiye’de rüzgâr enerji santralleri sayısı giderek artmaktadır. Doğu Anadolu bölgesinde rüzgâr enerji değerleri açısından verimin düşük olduğu görülmektedir. Ancak Malatya, Doğu Anadolu bölgesinin rüzgâr enerji santrali kurulumu açısından potansiyeli en yüksek ilidir. Malatya ilinin ilçesi olan Arapgir bölgesi ise rüzgâr enerjisi değerleri açısından Doğu Anadolu bölgesinin en verimli yeridir. Ayrıca sadece bölgede değil, ülke bazında rüzgâr enerji değerleri ortalamasının da üzerinde olduğu görülmektedir. Bunun neticesinde ilçede 2014 yılı itibari ile toplam 40 MW gücünde iki santral inşasına başlanmıştır. Yapılan tüm ölçümler ve analizler sonucunda Arapgir ilçesinin yaklaşık toplam 800 MW gücünde enerji santrallerinin kurulumuna uygun olduğu görülmüştür.
KAYNAKLAR[1] Topçu S., Menteş Ş. S., Yurdanur S. Ü., Aslan Z., “Rüzgâr Enerjisi Potansiyelinin belirlenmesinde Yer Seçiminin Önemi: Sinop Örneği”, MMO, II. Çevre ve Enerji Kongresi, İstanbul, pp. 145-154, 2001.[2] http://nukte.org/ruzgarenerji, (Erişim Tarihi: 16.02.2015).[3] http://www.gwec.net (Erişim Tarihi: 18.02.2015).[4] http://tureb.com.tr (Erişim Tarihi: 18.02.2015).[5] T.C. Orman ve Su İşleri Bakanlığı Meteoroloji Genel Müdürlüğü, Meteorolojik Bilgi (03.12.2014).[6] http://www.eie.gov.tr/ (Erişim Tarihi: 08.01.2015).[7] Ilkılıc C., Aydin H., Behçet R. “The Current Status of Wind Energy in Turkey and in the World”, Energy Policy,39(2), pp.961-967, 2011.
Şekil 3. Malatya ili rüzgâr hız dağılımı (50 m)[6].
Şekil 4. Malatya ili kapasite faktörü dağılımı (50 m)[6].
Şekil 5. Arapgir ilçesinde inşa halindeki rüzgâr enerjisi santralleri[4].
162
ICCI 2015 - Bildiriler Kitabı / Proceedings Book
[8] Köksal N. S. “Manisa/Kırkağaç Rüzgar Enerjisi Potansiyelinin İncelenmesi”, Kırkağaç Meslek Yüksekokulu Sempozyumu, 2012. [9] Ilkılıç C. “Wind Energy and Assessment of Wind Energy Potential in Turkey”, Renewable & Sustainable Energy Reviews, 16(2), pp. 1165-1173, 2012.[10] Şahin B., Bilgili M. “Wind Characteristics and Energy Potential in Belen-Hatay, Turkey”, International Journal of Green Energy, 6, pp.157-172. 2009[11] Aktacir M.A., Yeşilata B., Işıker Y. “Fotovoltaik- Rüzgâr Hibrid Güç Sistemi Uygulaması”, Yeni Enerji. Yenilenebilir Enerji Teknolojileri, 3, 56-62,2008[12] Brian D.V., Byron A. “Neal Analysis of Off-Grid Hybrid Wind Turbine/Solar PV Water Pumping Systems”, Solar Energy, 86, pp.1197–1207, 2012.
SUMMARYOur country’s energy needs increasing day by day due to developments in technology and industry. Our energy needs is depending on foreign countries. Therefore, energy expenditures constitute a sizable ratio of our budget. Because of this, renewable energy sources have high potential in our country is becoming very important. In addition, external conventional energy sources which we depend on foreign countries pollute and threat the environment. Therefore, it should encourage the use of renewable energy sources and should be disseminated. However, using the renewable energy sources possible by could be considered new technologies, can be costly. A good feasibility study, redeem the manufacturer from high costs and increases the efficiency.
Considered to be Turkey is a developing country, day by day need for energy will be increased. This need can be met by establishing different types of power plants. To reduce dependence on foreign it must pass the condition as energy-producing country. Wind energy must be taken seriously cause of a renewable energy source. In recent years, the number of wind power plants has been increasing in Turkey. In the Eastern Anatolia region seems to be lower than the yield in terms of wind energy values. However, Malatya, potential for wind power plant installation of the eastern Anatolia region is the highest province.
Wind energy potential of Eastern Anatolia in Turkey is suitable for product electricity. Especially, Arapgir district which has border of Malatya, Sivas, Tunceli and Elazığ and city center has altitude of about 1300 meters, is a district of interest in terms of wind energy potential. Necessary measurements were made at three different points since 2009 and has been seen to be quite favorable conditions for wind energy power plant installation. Especially the measurements made in Sivas border, have been identified that the average wind speed in 7 ~ 8 m/s. These values are over the average values for generation of electricity by wind power.
In this study, wind energy potential of Arapgir district of Malatya province were analyzed based on data from the wind speed and power measured on an hourly basis between the years 2009-2014. Necessary feasibility calculations were made according to the results of this analysis.
As of 2015, has started the construction of two wind power plants in different regions, which have 10 MW and 30 MW capasity. Also, the 154 kV power transmission line go through in Arapgir district, is an important advantage.
Keywords: Wind energy, Arapgir district, Electric

163
ICCI 2015 - Bildiriler Kitabı / Proceedings Book
ÖZETDünyada ve ülkemizde teknolojinin gün geçtikçe gelişmesi ve buna bağlı olarak sanayideki gelişmeler enerji ihtiyacını gün geçtikçe artırmaktadır. Enerji kullanımı açısından Türkiye dışa bağımlı bir ülke konumunda bulunmaktadır. Bu nedenle enerji giderleri ülke bütçesinde önemli bir yer tutmaktadır. Bu giderleri asgari seviyelere indirmek için enerji üreten bir ülke konumuna geçmek gerekmektedir. Özellikle Türkiye’de potansiyeli yüksek olan yenilenebilir enerji kaynakları bu nedenle çok önem kazanmaktadır. Dışa bağımlı olduğumuz konvansiyonel enerji kaynakları çevreyi kirletmekte ve her geçen gün çevreyi ve insan sağlığını daha fazla tehdit etmektedir. Bu nedenle, yenilenebilir enerji kaynaklarının kullanımı teşvik edilmeli, özendirilmeli ve yaygınlaştırılmalıdır. İyi bir fizibilite analizi, üreticiyi yüksek maliyetlerden kurtarırken verimliliği de artırır. Bu çalışmada, 2012-2014 yıllarında saatlik olarak ölçülen güneşli gün-sıcaklık ve geliş açısı verilerine dayanarak Malatya ili Arapgir İlçesi’ndeki güneş enerjisi potansiyeli analiz edilmiştir.
Anahtar Kelimeler: Güneş enerjisi, Arapgir bölgesi, Elektrik
1. GİRİŞDünyada gün geçtikçe enerjiye olan ihtiyaç artmaktadır. Enerji kaynaklarının günümüz itibariyle büyük bir kısmını fosil tabanlı kaynaklar oluşturmaktadır. Fosil tabanlı enerji kaynaklarının rezervlerinin sınırlı olması ve çevreye verdiği zararlar bilim insanlarını farklı enerji kaynaklarını araştırmaya yönlendirmiştir. Böylelikle alternatif enerji kaynakları üzerinde çalışmalar gün geçtikçe hızlanmış ve çoğalmıştır. Bu kaynakların en önemli ve kullanılabilir olanları güneş, rüzgâr, su, jeotermal ve biyokütle enerjileridir. Aslında dünyanın ve Türkiye’nin sahip olduğu enerji kaynaklarının potansiyelleri düşünüldüğünde rüzgâr enerjisi en başta gelmektedir. Konvansiyonel enerji kaynaklarına oranla yenilenebilir enerji kaynakları önemli bir potansiyele sahiptir. Son yıllarda rüzgâr
enerjisi yenilenebilir enerji kaynakları içerisinde en önemli enerji kaynağı olmasına rağmen, güneş enerjisi ile ilgili çalışmalar da oldukça önem kazanmıştır.
Güneş enerjisi, güneşin çekirdeğinde yer alan füzyon süreci ile (hidrojen gazının helyuma dönüşmesi) açığa çıkan ışıma enerjisidir. Dünya atmosferinin dışında güneş enerjisinin şiddeti, yaklaşık olarak 1370 W/m² değerindedir, ancak yeryüzüne ulaşan miktarı atmosferden dolayı 0-1100 W/m² değerleri arasında değişim gösterir. Bu enerjinin dünyaya gelen küçük bir bölümü dahi, insanlığın mevcut enerji tüketiminden kat kat fazladır. Güneş enerjisinden yararlanma konusundaki çalışmalar özellikle 1970’lerden sonra hız kazanmış, güneş enerjisi sistemleri teknolojik olarak ilerleme ve maliyet bakımından düşme göstermiş, çevresel olarak temiz bir enerji kaynağı olarak kendini kabul ettirmiştir. Dünya ile güneş arasındaki mesafe 150 milyon km’dir. Dünyaya güneşten gelen enerji, dünyada bir yılda kullanılan enerjinin 20 bin katıdır. Güneş ışınımının tamamı yer yüzeyine ulaşamaz, %30 kadarı atmosfer tarafından geriye yansıtılır. Güneş ışınımının %50’si atmosferi geçerek dünya yüzeyine ulaşır. Bu enerji ile dünyanın sıcaklığı yükselir ve yeryüzünde yaşam mümkün olur. Rüzgâr hareketlerine ve okyanus dalgalanmalarına da bu ısınma neden olur. Güneşten gelen ışınımının %20’si atmosfer ve bulutlarda tutulur. Yer yüzeyine gelen güneş ışınımının %1’den azı bitkiler tarafından fotosentez olayında kullanılır. Bitkiler, fotosentez sırasında güneş ışığıyla birlikte karbondioksit ve su kullanarak, oksijen ve şeker üretirler. Fotosentez, yeryüzünde bitkisel yaşamın kaynağıdır. Güneş, nükleer enerji dışındaki bütün enerjilerin dolaylı veya direkt kaynağıdır[1].
2. GÜNEŞ ENERJİSİNİN TARİHSEL GELİŞİMİ VE KULLANIM POTANSİYELİDünyada güneş tüm enerji kaynaklarının türediği önemli bir unsurdur. Enerji kaynaklarının başında
Güneş Enerjisi ile Elektrik Üretim Potansiyeli; Malatya İli Arapgir İlçesi Örneği
TarkanKOCAİnönü Üniversitesi, Elektrik ve Enerji Bölümü
SerhatAKSUNGURİnönü Üniversitesi, Elektrik ve Enerji Bölümü
EmrahGÜRKANİnönü Üniversitesi, Elektrik ve Enerji Bölümü
AlperTungaÖZGÜLERTunceli Üniversitesi, İnşaat Teknolojileri Bölümü
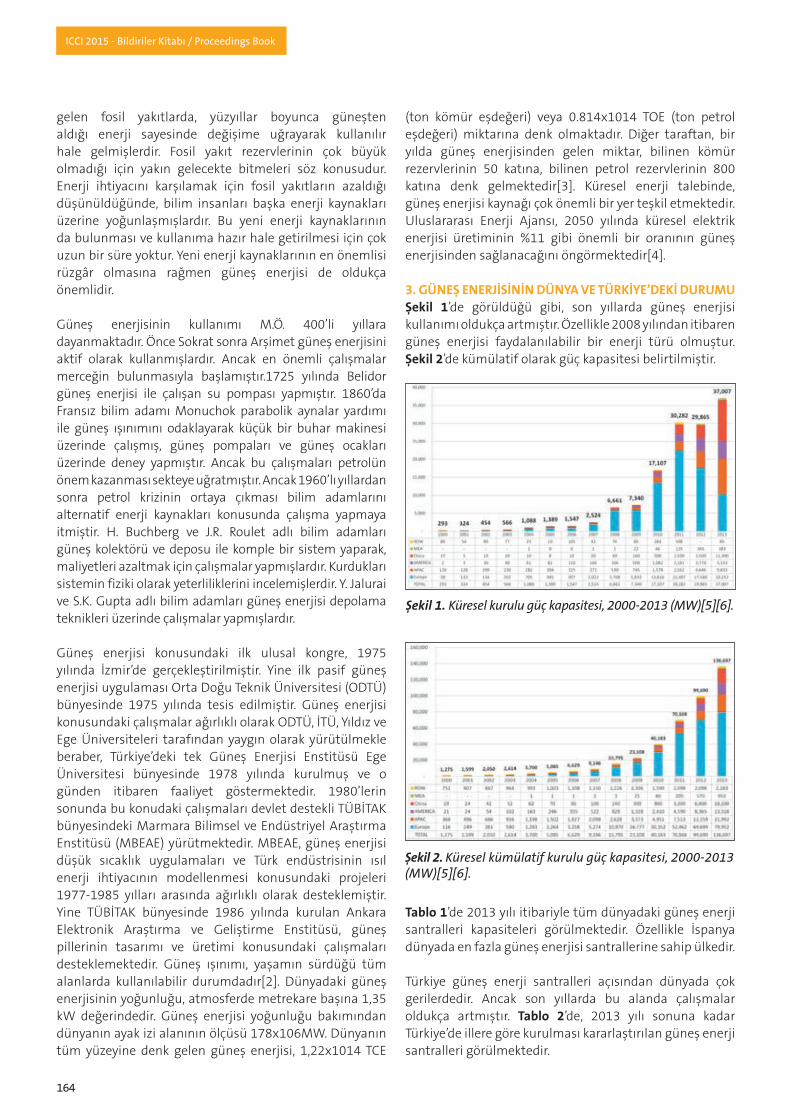
164
ICCI 2015 - Bildiriler Kitabı / Proceedings Book
gelen fosil yakıtlarda, yüzyıllar boyunca güneşten aldığı enerji sayesinde değişime uğrayarak kullanılır hale gelmişlerdir. Fosil yakıt rezervlerinin çok büyük olmadığı için yakın gelecekte bitmeleri söz konusudur. Enerji ihtiyacını karşılamak için fosil yakıtların azaldığı düşünüldüğünde, bilim insanları başka enerji kaynakları üzerine yoğunlaşmışlardır. Bu yeni enerji kaynaklarının da bulunması ve kullanıma hazır hale getirilmesi için çok uzun bir süre yoktur. Yeni enerji kaynaklarının en önemlisi rüzgâr olmasına rağmen güneş enerjisi de oldukça önemlidir. Güneş enerjisinin kullanımı M.Ö. 400’li yıllara dayanmaktadır. Önce Sokrat sonra Arşimet güneş enerjisini aktif olarak kullanmışlardır. Ancak en önemli çalışmalar merceğin bulunmasıyla başlamıştır.1725 yılında Belidor güneş enerjisi ile çalışan su pompası yapmıştır. 1860’da Fransız bilim adamı Monuchok parabolik aynalar yardımı ile güneş ışınımını odaklayarak küçük bir buhar makinesi üzerinde çalışmış, güneş pompaları ve güneş ocakları üzerinde deney yapmıştır. Ancak bu çalışmaları petrolün önem kazanması sekteye uğratmıştır. Ancak 1960’lı yıllardan sonra petrol krizinin ortaya çıkması bilim adamlarını alternatif enerji kaynakları konusunda çalışma yapmaya itmiştir. H. Buchberg ve J.R. Roulet adlı bilim adamları güneş kolektörü ve deposu ile komple bir sistem yaparak, maliyetleri azaltmak için çalışmalar yapmışlardır. Kurdukları sistemin fiziki olarak yeterliliklerini incelemişlerdir. Y. Jalurai ve S.K. Gupta adlı bilim adamları güneş enerjisi depolama teknikleri üzerinde çalışmalar yapmışlardır.
Güneş enerjisi konusundaki ilk ulusal kongre, 1975 yılında İzmir’de gerçekleştirilmiştir. Yine ilk pasif güneş enerjisi uygulaması Orta Doğu Teknik Üniversitesi (ODTÜ) bünyesinde 1975 yılında tesis edilmiştir. Güneş enerjisi konusundaki çalışmalar ağırlıklı olarak ODTÜ, İTÜ, Yıldız ve Ege Üniversiteleri tarafından yaygın olarak yürütülmekle beraber, Türkiye’deki tek Güneş Enerjisi Enstitüsü Ege Üniversitesi bünyesinde 1978 yılında kurulmuş ve o günden itibaren faaliyet göstermektedir. 1980’lerin sonunda bu konudaki çalışmaları devlet destekli TÜBİTAK bünyesindeki Marmara Bilimsel ve Endüstriyel Araştırma Enstitüsü (MBEAE) yürütmektedir. MBEAE, güneş enerjisi düşük sıcaklık uygulamaları ve Türk endüstrisinin ısıl enerji ihtiyacının modellenmesi konusundaki projeleri 1977-1985 yılları arasında ağırlıklı olarak desteklemiştir. Yine TÜBİTAK bünyesinde 1986 yılında kurulan Ankara Elektronik Araştırma ve Geliştirme Enstitüsü, güneş pillerinin tasarımı ve üretimi konusundaki çalışmaları desteklemektedir. Güneş ışınımı, yaşamın sürdüğü tüm alanlarda kullanılabilir durumdadır[2]. Dünyadaki güneş enerjisinin yoğunluğu, atmosferde metrekare başına 1,35 kW değerindedir. Güneş enerjisi yoğunluğu bakımından dünyanın ayak izi alanının ölçüsü 178x106MW. Dünyanın tüm yüzeyine denk gelen güneş enerjisi, 1,22x10¹⁴ TCE
(ton kömür eşdeğeri) veya 0.814x10¹⁴ TOE (ton petrol eşdeğeri) miktarına denk olmaktadır. Diğer taraftan, bir yılda güneş enerjisinden gelen miktar, bilinen kömür rezervlerinin 50 katına, bilinen petrol rezervlerinin 800 katına denk gelmektedir[3]. Küresel enerji talebinde, güneş enerjisi kaynağı çok önemli bir yer teşkil etmektedir. Uluslararası Enerji Ajansı, 2050 yılında küresel elektrik enerjisi üretiminin %11 gibi önemli bir oranının güneş enerjisinden sağlanacağını öngörmektedir[4].
3. GÜNEŞ ENERJİSİNİN DÜNYA VE TÜRKİYE’DEKİ DURUMUŞekil 1’de görüldüğü gibi, son yıllarda güneş enerjisi kullanımı oldukça artmıştır. Özellikle 2008 yılından itibaren güneş enerjisi faydalanılabilir bir enerji türü olmuştur. Şekil 2’de kümülatif olarak güç kapasitesi belirtilmiştir.
Tablo 1’de 2013 yılı itibariyle tüm dünyadaki güneş enerji santralleri kapasiteleri görülmektedir. Özellikle İspanya dünyada en fazla güneş enerjisi santrallerine sahip ülkedir.
Türkiye güneş enerji santralleri açısından dünyada çok gerilerdedir. Ancak son yıllarda bu alanda çalışmalar oldukça artmıştır. Tablo 2’de, 2013 yılı sonuna kadar Türkiye’de illere göre kurulması kararlaştırılan güneş enerji santralleri görülmektedir.
Şekil 1. Küresel kurulu güç kapasitesi, 2000-2013 (MW)[5][6].
Şekil 2. Küresel kümülatif kurulu güç kapasitesi, 2000-2013 (MW)[5][6].

165
ICCI 2015 - Bildiriler Kitabı / Proceedings Book
Şekil 3 ve Tablo 3’te, Türkiye coğrafi bölgelerinin enerji potansiyeli ve güneşlenme süresi değerleri görülmektedir.
Türkiye, coğrafi konumu itibariyle sahip olduğu güneş enerjisi potansiyeli açısından çoğu ülkeye göre oldukça iyi durumdadır. Türkiye’nin en fazla güneş enerjisi alan bölgesi Güney Doğu Anadolu Bölgesi ve Akdeniz bölgesi olup bunu Doğu Anadolu bölgesi takip etmektedir [9].
4. MALATYA İLİ ARAPGİR İLÇESİNİN GÜNEŞ ENERJİSİPOTANSİYELİŞekil 3 incelendiğinde, Doğu Anadolu bölgesinin güneş enerji potansiyelinin, diğer bölgelere oranla oldukça iyi seviyede olduğu görülebilir. Doğu Anadolu bölgesi, Akdeniz bölgesi ve Güneydoğu Anadolu bölgesinden sonra güneş enerjisi ile elektrik üretimi açısından en uygun bölgedir. Tablo 2’de görüldüğü gibi, Malatya iline kurulması kararlaştırılan güneş enerji santrallerinin gücü önemli bir değere sahiptir. Özellikle Arapgir ilçesi Şekil 4’te de görüldüğü gibi güneş enerjisi açısından önemli bir ilçedir.
5. SONUÇTürkiye’nin gün geçtikçe gelişen bir ülke olduğu düşünüldüğünde enerji ihtiyacının devamlı artacak olması kaçınılmazdır. Özellikle güneş enerjisi bakımından ülkemiz diğer ülkelere oranla yüksek güneş enerjisi potansiyeline sahiptir. Ancak güneş enerjisi potansiyeli Türkiye’den daha düşük olan gelişmiş Avrupa Birliği ülkeleri güneş enerjisinden daha fazla faydalanmaktadır.
Değişik türlerde enerji santralleri kurularak ülkenin enerji ihtiyacı karşılanmalı ve dışa bağımlılık asgariye indirilmelidir. Özellikle rüzgâr ve güneş enerjisi santralleri bir an önce kurulmalı ve elektrik üretimi miktarı artırılmalıdır. Rüzgâr enerjisi santrallerinin gelişimi çok hızlı olmaktadır ama güneş enerjisi santrallerinin gelişimi oldukça yavaş ilerlemektedir. Malatya Meteoroloji Genel Müdürlüğü’nden 03.12.2014 tarihinde alınan meteorolojik bilgilere göre, Arapgir ilçesinin güneş enerjisi potansiyeli bu bölgeye yatırım için uygundur. Yine aynı verilere göre güneşlenme şiddeti ve günlük sıcaklık değeri güneş enerji santralleri kurulumu için ortalamanın üstündedir. Şekil 3’te görüldüğü gibi Malatya ilinin güneş enerjisi potansiyeli yıllık 1700 kWh/m2’dir. Bu değerin önemli bir kısmı Arapgir ilçesine aittir.
Tablo 1. 2013 Yılı İtibari ile Güneş Enerjisi Santrali Kapasiteleri[7]
Tablo 2. 2013 Yılı Sonuna Kadar Kurulumuna Karar Verilen Güneş Enerjisi Santrali Kapasitesi - İllere Göre Dağılımı[8, 10]
Şekil 4. Malatya ili Arapgir ilçesi ve çevre bölgeler güneş radyasyon haritası.
Şekil 3. Türkiye’nin yıllık güneş enerjisi potansiyeli haritası[1].
Tablo 3. Türkiye Güneş Enerji Potansiyeli ve Güneşlenme Süresi Değerleri (Bölgelere Göre)[1]
166
ICCI 2015 - Bildiriler Kitabı / Proceedings Book
KAYNAKLAR[1] http://www.eie.gov.tr (Erişim Tarihi : 16.02.2015)[2] Akpınar A., Kömürcü M. İ., Kankal M., Özölçer İ.H., Kaygusuz K., “Energy situation and renewables in Turkey and environmental effects of energy use”, Renewable and Sustainable Energy Reviews, 12, (8), pp. 2013-2039, October 2008.[3] Özgöçmen A., “Electricity Generation Using Solar Cells”, Gazi University in Turkey, MSc Thesis, May 2007.[4] Research and Development on Renewable Energies: “A Global Report on Photovoltaic and Wind Energy”, International Science Panel on Renewable Energies, ISPRE (2009), Paris.[5] PVPS Report Snapshot of Global PV 1992-2013 Preliminary Trends Information from the IEA PVPS Programme, 2013.[6] http://www.epia.org/home (Erişim Tarihi: 14.02.2015).[7] Global Renewable Energy Report, 2014.[8] 6094 sayılı YEK kanun ve bu kanun çerçevesinde yayımlanan 28022 sayı ve 11 Ağustos 2011 tarihli Bakanlık tebliği, Ankara, 2011.[9] Demircan N., Alakavuk Z., Fotovoltaik Prensibiyle Güneş Enerjisinden Elektrik Üretimi, VII. Ulusal Temiz Enerji Sempozyumu, 17-19 Aralık 2008, İstanbul, UTES’ 2008.[10] Altuntop, N., Erdemir, D., “Dünyada ve Türkiye’de Güneş Enerjisi ile İlgili Gelişmeler,” Mühendis ve Makina, cilt 54, sayı 639, s. 69-77, 2013.
SUMMARYEnergy necessity increases depending on the development of technology. Our energy needs is depending on foreign countries. Therefore, energy expenditures constitute a sizable ratio of our budget. Because of this, renewable energy sources have high potential in our country is becoming very important. In addition, external conventional energy sources which we depend on foreign countries pollute and threat the environment. Therefore, it should encourage the use of renewable energy sources and should be disseminated. However, using the renewable energy sources possible by could be considered new technologies, can be costly. A good feasibility study, redeem the manufacturer from high costs and increases the efficiency. Considered to be Turkey is a developing country, day by day need for energy will be increased. This need can be met by establishing different types of power plants. To reduce dependence on foreign it must pass the condition as energy-producing country. Wind energy and solar energy must be taken seriously cause of a renewable energy source. In recent years, the number of solar field has been increasing in Turkey.
Turkey, owned by its geographical location has very good condition compared to most countries in terms of solar
energy potential. The most solar energy field of Turkey is South East Anatolia region and the Mediterranean region and eastern Anatolia region followed. When examined Figure 3, Solar energy potential of Eastern Anatolia is a very good level compared to other regions of Turkey. After the Mediterranean region and the Southeast Anatolia region, Eastern Anatolia region is the most suitable in terms of electricity generation with solar energy. As can be seen in Table 2, the power of solar panel fields has an important value, which agreed to establish in Malatya province. Especially Arapgir district is an important district in terms of solar energy, as seen in Figure 4. Given that Turkey is a developing country day by day, it is inevitable that the energy needed to increase continuously. Especially in terms of solar energy, our country has a high solar energy potential compared to other countries. However, developed European Union countries which have less potential of solar energy from Turkey, benefit from solar energy more than Turkey.
According to the meteorological information received from Malatya Meteorological office when the date 03.12.2014, solar energy potential of Arapgir district is suitable for investment in this area. Again according to the same data, solar radiation and daily temperature values are above average for the installation of solar power plants. As can be seen in figure 3, the solar energy potential of Malatya is 1700 kWh / m² per year. An important part of this value belongs to the Arapgir district.
Keywords: Solar energy, Arapgir district, Electric

167
ICCI 2015 - Bildiriler Kitabı / Proceedings Book
ABSTRACTBiomass gasification can be used to effectively convert a very heterogeneous material into a consistent gaseous fuel intermediate that can be used reliably for heating, industrial process applications. Syngas cleanup is a general term for removing the unwanted impurities from biomass gasification product gas and generally involves an integrated, multistep approach that depends on the and use of product gas. Gas-phase impurities in syngas include NH3, HCN, other nitrogen-containing gases, H2S, other sulfur gases, HCI, alkali metals, organic hydrocarbons (including tar) and particulates.
1. INTRODUCTIONBiomass gasification can be used to effectively convert a very heterogeneous material into a consistent gaseous fuel intermediate that can be used reliably for heating, industrial process applications, electricity generation, and liquid fuels production. Biomass gasification is a complex thermochemical process that consists of a number of elementary chemical reactions, beginning with the thermal decomposition of a lignocellulosic fuel, followed by partial oxidation of the fuel with a gasifying agent, usually air, oxygen, or steam[1]. The volatile matter that is released as the biomass fuel is heated partially oxidizes to yield the combustion products H2O and CO2, plus to heat to continue the endothermic gasification process. Water vaporizes and biomass pyrolysis continues as the fuel is heated. Thermal decomposition and partial oxidation of the pyrolysis vapors occur at high temperatures and yield a product gas composed of CO, CO2, H2O, H2, CH4, other gaseous hydrocarbons (including oxygenated hydrocarbons from some process), tars, char, volatile inorganic constituents, and ash. A generalized reaction describing biomass gasification is as follows:
The actual amount of CO2, CO, H2O, H2, tars and hydrocarbons depends on the partial oxidation of the volatile products:
The char yield in a gasificatin process can be optimized to maximize carbon conversion, or the char can be thermally oxidized to provide heat for the process. Char is partially oxidized or gasified according to the following reactions:
The gasification product gas composition, particularly the H2/CO ratio, can be further adjusted by reforming and shift chemistry. Additional hydrogen is formed when CO reacts with excess water vapor according to the water-gas shift (WGS) reaction:
Reforming the light hydrocarbons and tars formed during biomass gasification also produces hydrogen. Steam reforming and so-called ‘’dry’’ or CO2 reforming ocur according to the following reactions anda re usually promoted by the use of catalysts:
The actual composition of the biomass gasification product gas depends heavily on te gasification process, the gasifying agent, and the feedstock composition[2][3].
2. SYNGAS CLEANUP AND CONDITIONINGContaminants removed from syngas generally include particulate matter, condensable hydrocarbons (i.e. tars), sulfur compounds, nitrogen compounds, alkali metals (primarily potassium and sodium), and hydrogen chloride (HCl). Carbon dioxide (CO2) is also removed in various industrial applications concerned with acid gases or carbon sequestration, but it is not considered in this
Syngas Cleanup
TurgayKARDepartment of ChemistryKaradeniz Technical University
SedatKELEŞDepartment of ChemistryKaradeniz Technical University
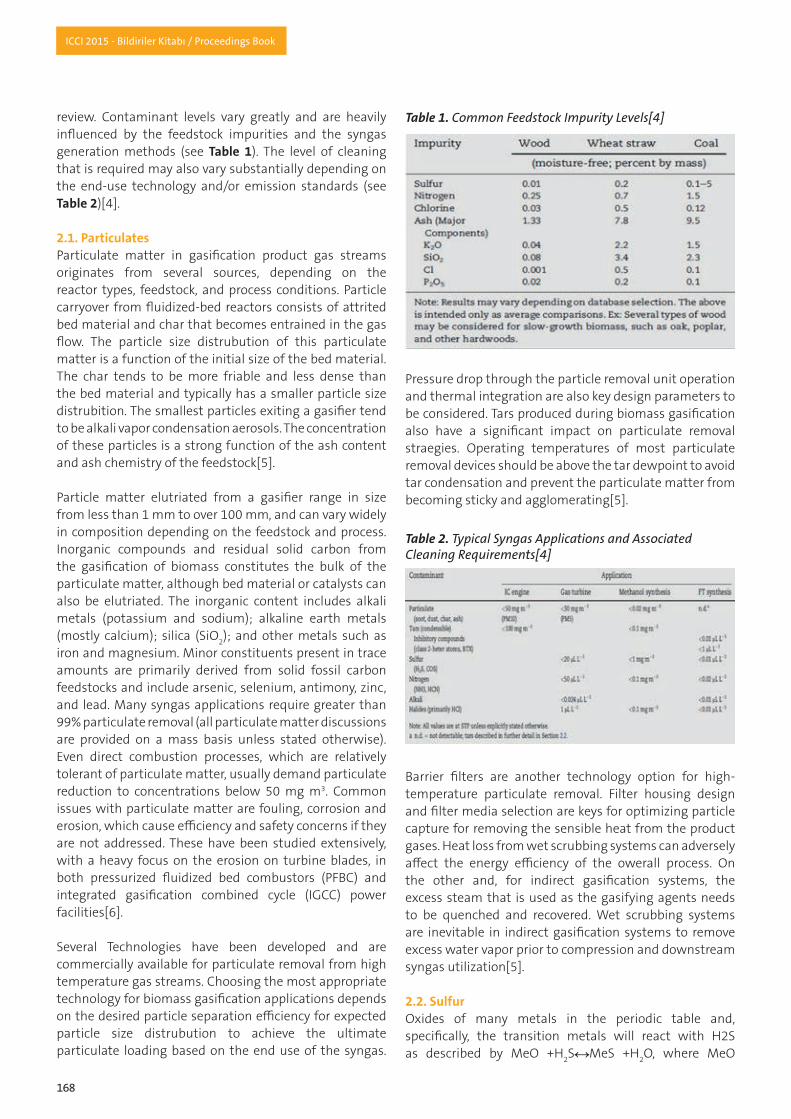
168
ICCI 2015 - Bildiriler Kitabı / Proceedings Book
review. Contaminant levels vary greatly and are heavily influenced by the feedstock impurities and the syngas generation methods (see Table 1). The level of cleaning that is required may also vary substantially depending on the end-use technology and/or emission standards (see Table 2)[4].
2.1. Particulates Particulate matter in gasification product gas streams originates from several sources, depending on the reactor types, feedstock, and process conditions. Particle carryover from fluidized-bed reactors consists of attrited bed material and char that becomes entrained in the gas flow. The particle size distrubution of this particulate matter is a function of the initial size of the bed material. The char tends to be more friable and less dense than the bed material and typically has a smaller particle size distrubition. The smallest particles exiting a gasifier tend to be alkali vapor condensation aerosols. The concentration of these particles is a strong function of the ash content and ash chemistry of the feedstock[5].
Particle matter elutriated from a gasifier range in size from less than 1 mm to over 100 mm, and can vary widely in composition depending on the feedstock and process. Inorganic compounds and residual solid carbon from the gasification of biomass constitutes the bulk of the particulate matter, although bed material or catalysts can also be elutriated. The inorganic content includes alkali metals (potassium and sodium); alkaline earth metals (mostly calcium); silica (SiO2); and other metals such as iron and magnesium. Minor constituents present in trace amounts are primarily derived from solid fossil carbon feedstocks and include arsenic, selenium, antimony, zinc, and lead. Many syngas applications require greater than 99% particulate removal (all particulate matter discussions are provided on a mass basis unless stated otherwise). Even direct combustion processes, which are relatively tolerant of particulate matter, usually demand particulate reduction to concentrations below 50 mg m3. Common issues with particulate matter are fouling, corrosion and erosion, which cause efficiency and safety concerns if they are not addressed. These have been studied extensively, with a heavy focus on the erosion on turbine blades, in both pressurized fluidized bed combustors (PFBC) and integrated gasification combined cycle (IGCC) power facilities[6].
Several Technologies have been developed and are commercially available for particulate removal from high temperature gas streams. Choosing the most appropriate technology for biomass gasification applications depends on the desired particle separation efficiency for expected particle size distrubution to achieve the ultimate particulate loading based on the end use of the syngas.
Pressure drop through the particle removal unit operation and thermal integration are also key design parameters to be considered. Tars produced during biomass gasification also have a significant impact on particulate removal straegies. Operating temperatures of most particulate removal devices should be above the tar dewpoint to avoid tar condensation and prevent the particulate matter from becoming sticky and agglomerating[5].
Barrier filters are another technology option for high-temperature particulate removal. Filter housing design and filter media selection are keys for optimizing particle capture for removing the sensible heat from the product gases. Heat loss from wet scrubbing systems can adversely affect the energy efficiency of the owerall process. On the other and, for indirect gasification systems, the excess steam that is used as the gasifying agents needs to be quenched and recovered. Wet scrubbing systems are inevitable in indirect gasification systems to remove excess water vapor prior to compression and downstream syngas utilization[5].
2.2. SulfurOxides of many metals in the periodic table and, specifically, the transition metals will react with H2S as described by MeO +H2S MeS +H2O, where MeO
Table 1. Common Feedstock Impurity Levels[4]
Table 2. Typical Syngas Applications and Associated Cleaning Requirements[4]

169
ICCI 2015 - Bildiriler Kitabı / Proceedings Book
represents a metal oxide and MeS represents a metal sulfide, effectively reducing the H2S concentrations in the syngas[6]. The minimum H2S concentration in the treated syngas is determined by the equilibrium concentration based on the syngas composition and metal oxide. Reaction kinetics determine how rapidly the H2S reacts to reach this equilibrium concentration ZnO possesses one of the highest thermodynamic efficiencies for H2S removal and the most favorable reaction kinetics off all the active oxide materials withi the 149 to 371 0C temperature range.
ZnO-based materials are typically regenerated using oxygen and nitrogen mixtures according to the reaction ZnS + 1,5 O2 ZnO+SO2. The concentration of the SO2in the regeneration off-gas depends on the sorbent and reactor configuration. The possible SO2 concentration ranges from about 1 to %14 by volume, depending upon the O2 concentration used in regeneration inlet gas. This SO2 off-gas must be further treated to produce a sulfiric acid product in either a Claus plant or in RTI’s direct sulfur recovery process.
Sulfur contaminants occur mostly as hydrogen sulfide (H2S) with lesser amounts of carbonyl sulfide (COS). Sulfur contaminants like H2S may range in concentration from 0.1 mL L-1 to more than 30 mL L L-1 depending on the feedstock[7]. Biomass has significantly less sulfur than coal. It usually contains only 0.1 g kg-1 to 0.5 g kg-1 sulfur compared to as much as 50 g kg-1 sulfur compounds for some coal-derived syngas[8]. Sulfur compounds corrode metal surfaces[9]. If syngas is burned, sulfur contaminants are oxidized to sulfur dioxide (SO2), a regulated pollutant. Even small amounts of sulfur can eventually poison catalysts used to clean or upgrade syngas[10]. Sulfur removal to parts per billion levels is often requiredin order to avoid these kinds of detrimental effects (as noted in Table 2). More than 30 gas cleanup technologies have been developed for removing sulfur compounds and other so called acid gases (including CO2)[9]. These include both dry and liquidbased processes that cover a temperature range from sub-zero to several hundred degrees Celsius. Physical and chemical removal processes exist, many of which can yield elemental sulfur or sulfuric acid as a useful byproduct. Recent hot gas removal research focuses on the use of dry sorbents.
2.3. Ammonia Decomposition and HCN Removal A wide variety of metals and metal oxides/carbides/nitrides can catalyze the decomposition of ammonia.
Group VIII metals seem to be active mainly in the metalic state[5]. Even though reaction is noted for oxides of group VIII metals, in a reducing athmosphere of gases containing H2 or CO, the metal oxide is likely reduced, creating a metallic surface. Activity for ammonia decomposition on smooth metal surfaces has been reported to fall in the following order: Co>Ni>Cu>Zr[5]. Most nitrogen (N) contaminants in syngas occur as ammonia (NH3) with smaller amounts of hydrogen cyanide (HCN). The pyrolysis stage of gasification and combustion releases nitrogen from protein structures or heterocyclic aromatic compounds in the feedstock[11]. The amount of NH3 and HCN released is heavily dependent on intrinsic properties (N content, functionalities) and physical properties (particle size) as well as process conditions. Ammonia is typically the dominant form of nitrogen contaminants by at least an order of magnitude. It can be formed directly from biomass in primary reactions or from HCN in secondary gas phase reactions. As the temperature increases from feedstock conversion, secondary reactions increase HCN concentration as well as NH3. However increased availability of H2 and residence time will convert the HCN to NH3. Given sufficient temperature and time, N2 is the predominant equilibrium product, but this is rarely attained in practice[4].
2.4. Alkails and Heavy MetalsCompared with sulfur, chlorine, ammonia, and particulate matter, Technologies for removing mercury, arsenic, selenium, and cadmium from coal-derived syngas are not advanced. Avalaible commercial Technologies for removing trace metals are limited to mercury and arsenic. Mercury control Technologies for the natural gas industry were developed to limit metallurgical failures resulting from the formation of amalgams with aliminium and other metals during gas processing[5]. Alkali in feedstock is both reactive and volatile. Some reactions of alkali with other ash components of biomass yield non-volatile compounds that remain as bottom ash in the gasifier. However, some alkali compounds melt or even vaporize above 600 °C and can leave the reactor as aerosols and vapors, respectively. Alkali compounds transportedout of the reactor, usually in the form of chlorides, hydroxides, and sulfates, can cause substantial fouling and corrosion in downstream processes. Biomass is not the only source of alkali metal contaminants in gasification-based systems. Some catalysts used to remove syngas contaminants or alter the syngas composition incorporate alkali-based catalysts and transition metal promoters, such as cobalt, molybdenum, rubidium, cesium, and lithium. Along with potassium and sodium from the biomass, these metals vaporize in high temperature sections of the system and condense in cooler sections where they can cause corrosion or ash fouling. Removing alkali metal contaminants is important to avoid sintering
Table 3. Various ZnO-Based Desulfurization Sorbents Available Commercially[5]
170
ICCI 2015 - Bildiriler Kitabı / Proceedings Book
and slagging of ash in boilers and hot corrosion in gasification power systems. Catalysts are also extremely sensitive to alkali contents and can be easily poisoned by the alkali levels found in biomass. Alkali must sometimes be reduced from as high as a few grams per kilogram to as little as a few micrograms per kilogram[4].
2.5. ChloridesFor bulk removal of HCI vapor, different sorbent materials and processes have been studied and different Technologies are being developd. In the two-stage Ultra Clean Process, different sorbents, like synthetic dawsonite, nahcolite and trona have been tested. The HCI exit concenration from their stage 1 polishing at 449 0C was below 3 ppm. Trona was to be the best sorbent for HCI[5]. Evaluated several alkali minerals for removal of HCI from hot syngas atmospheric pressure in the temperature range 550-650 0C. All of the sorbents reacted rapidly with the HCI and reduced its concentration to about 1 ppm. Raw syngas may contain up to several milliliters of chloride for every liter of syngas. Despite its relatively low concentration compared to other contaminants, it can create serious materials problems. Chlorine levels as low as 20 mL L-1 will cause performance loss in nickel anodes of molten carbonate and solid oxide fuel cells[12]. Substantial hot corrosion of gas turbine blades can occur with concentrations of chlorine and alkali as low as 0.024 µL L-1 [13][14]. Reactions can also occur between HCl and other contaminant species in the gas phase, which creates more compounds such as ammonium chloride (NH4Cl) and sodium chloride (NaCl). These compounds can cause fouling and create deposits when they condense in cooler downstream piping and equipment. Chlorides have also caused poisoning of catalysts used for ammonia, methanol and other chemical syntheses.
2.6. TarsTar removal, conversion, or destruction is seen as one of the greatest technical challenges to overcome for the successful development of commercial advanced biomass gasification Technologies[15]. Tars can condense in exit pipes and on particulate filters, leading to blockages and clogged filters. Tars also have varied impacts on other downstream processes. Tars can clog fuel lines and injectors in internal combustion engines. Luminous cmbustion and erosion from soot formation can ocur in pressrized combined-cycle systems where the product gases are burned in a gas turbine. The product gas from an atmospheric –pressure gasification process needs to be compressed before it is burned in a gas turbine, and tars can condense in the compressor or in the trasfer lines as the product gas cools[5]. Chemical equilibrium predicts the absence of tarry compounds under conditions of gasification. In practice however, there is always some tar (condensable organic compounds) in the product gas, which decreases
as gasification temperature increases[16]. However, even at relatively modest gasification temperatures, tar is not expected if chemical equilibrium was attained. Thermal cracking, catalytic cracking, and non-thermal plasmas attempt to more closely approach chemical equilibrium by increasing reaction rates of tar decomposition. Physical separation of tars, on the other hand, cools the product gas to condense vapors as liquids, which are then removed by purely physical means. These methods are applied in both primary (in-situ) and secondary (post-gasifier) environments for tar removal, depending on the type of gasifier and the intended application of the product gas. Primary cleanup measures are limited to thermal and catalytic cracking, and use approaches such as high temperatures, oxygen feed in lieu of air, or different bed materials. Gasifiers using these methods may achieve tar concentrations as low as 50 mg m3, which is sufficient for robust applications like direct combustion[17][18]. Secondary cleanup downstream of the gasifier employ one of four basic methods. These methods are capable of removing tar to undetectable levels, which is necessary for more stringent application such as fuel cells or catalytic conversion processes. The end-use of the gas stream is also an important consideration when deciding which cleanup method to utilize. Applications such as combustion may benefit from methods that convert tar to other compounds rather than remove them from the gas stream. Converting tars may only provide moderate tar reduction, but it maintains the heating value of the gas stream by retaining the carbon and hydrogen compounds. Applications such as synthetic fuel production may require more stringent removal than may be feasible with conversion. Conversion methods may also alter the gas composition (such as increased carbon dioxide), which can also negatively affect fuel synthesis applications. These applications may therefore favor physical removal methods that sacrifice tars in favor of gas stream purity[4]. 3. CONCLUSIONThe technical challenges that need to be overcome to enable the commercial deployment of biomass gasification Technologies for power, fuels and chemical production. The high costs of biomass conversion Technologies also makes economic feasibility a significant challenge for commercial deployment.
Syngas contains a variety of contaminants produced from impurities present in the feed material gasified. Syngas produced from biomass contains acid gases including HCl, HCN, and H2S. It also contains NH3 and COS. All of these components must be removed to avoid poisoning of catalysts used in downstream upgrading processes.
Syngas made from biomass contains much larger amounts of CO2 than syngas derived from natural gas or other high heating value feedstock. The CO2 content
171
ICCI 2015 - Bildiriler Kitabı / Proceedings Book
of the syngas produced from biomass depends on the thermal efficiency and operating conditions of the gasifier and can be as much as 40 vol%. As CO2 content increases, so does the COS content of the syngas produced due to equilibrium of the reaction:
HS + CO2 COS + H2O
High CO2 content makes it more difficult and costly to remove other contaminants. Acid gases are typically removed contacting with water. Carbon dioxide is also removed by this process. The extent of removal depends on the pH of the water and the relative amount of water and syngas.
Physical absorption methods are also effective means to remove CO2, COS, and H2S from syngas. These systems use amines or methanol as the absorbent. The choice depends on the availability or cost of process steam compared to refrigeration, respectively. These systems are parasitic in nature, and comprise the bulk of the cost associated with syngas cleanup. The high CO2 content of syngas produced from biomass further increases the demand on these systems.
Syngas produced from biomass can also contain significant amounts of tar and soot, especially when produced at low gasifier temperatures (ca. <650 C). Syngas from these systems also contains considerable amounts of light hydrocarbons, including aromatic species. The aromatic components must be removed to prevent poisoning of downstream adsorbents in guard beds used to protect catalysts in the upgrading processes.
SynGas Technology’s gasifier technology has been developed to maximize CO selectivity and minimize CO2 yield. Our proprietary gasifier design also reduces the amount of tar and soot in syngas derived from biomass. These benefits of syngas process technology over competing technology reduce the cost of syngas cleanup and contribute improvement of overall bio refinery economics.
REFERENCES[1] Tabatabaieraissi A. and Trezek G.J., (1987), Parameters governing biomass gasification. İndustrial & Engineering Chemistry Research, 26 (2), 221-228.[2] Beenackers A.A.C.M. and Van Swaaij W.P.M., (1984), Gasification of biomass, a state of theart review, in Thermochemical Proccessing of Biomass, (ed. A.V Bridgewater), Butterworths, London, pp. 91-136.[3] Hos J.J. and Groeneveld M.J., (1987), Biomass gasification, in Biomass, (eds D. O. Hall and R. P. Overend), John Wiley & Sons, Ltd, Chichester, pp. 237-255.[4] Patrick J. Woolcock, Brown, Robert C., A review of cleaning technologies for biomass-derived syngas. Biomass and Bioenergy 52 (2013) 54 -84
[5] Brown, Robert C. (2011). Thermochemical Processing of Biomass Conversion into Fuels, Chemicals and Power. USA: Wiley A John Wiley and Sons, Ltd, Publication.[6] Gangwal S.K., Harkins S.M., Woods M.C. et al., (1989), Bench-scale testing of high temperature desulfurization sorbents. Environmental Progress, 8 (4), 265-269.[7] Gupta R.P., Turk B.S., Portzer, J.W., and Cicero D.C. (2001) Desulfurization of syngas in a transport reactor. Environmental Progress, 20, (3), 187-195.[8] Stevens D., Hot gas conditioning: recent progress with larger-scale biomass systems. NREL subcontractor report; 2001, 103 pp. Report No.: NREL/SR-510- 29952. [9] Lovell R., Dylewski S., Peterson C., Control of sulfur emissions from oil shale retorts. Cincinnati Ohio 1981. 190 pp. Report No.: EPA 600/7-82-016.[10] Dou B.L., Zhang M.C., Gao J.S., Shen W.Q., Sha X.Z., Hightemperature removal of NH3, organic sulfur, HCl, and tar component from coal-derived gas, Ind Eng Chem R 2002; 41(17): 4195e200.[11] Hansson K.M., Samuelsson J., Tullin C., Amand L.E., Formation of HNCO, HCN, and NH3 from the pyrolysis of bark and nitrogen-containing model compounds, Combust Flame 2004; 137(3): 265e77. [12] Trembly J.P., Gemmen R.S., Bayless D.J., The effect of coal syngas containing HCl on the performance of solid oxide fuel cells: investigations into the effect of operational temperature and HCl concentration, J Power Sourc 2007; 169(2): 347e54.[13] Dou B.L., Pan W.G., Ren J.X., Chen B.B., Hwang J.H., Yu T.U., Single and combined removal of HCl and alkali metal vapor from high-temperature gas by solid sorbents, Energy Fuel 2007; 21(2): 1019e23.[14] Turn S.Q., Chemical equilibrium prediction of potassium, sodium, and chlorine concentrations in the product gas from biomass gasification, Ind Eng Chem Res 2007; 46(26): 8928e37.[15] Milne T.A., Abatzoglou N., and Evans R.J., (1998), Biomass gasifier tars: their natüre, formation, and conversion, National Renewable Energy Laboratory, Golden, CO, p. 202.[16] Higman C., Burgt Mvd., Gasification, 2nd ed., vol. xvi. Amsterdam, Boston: Gulf Professional Pub./ Elsevier Science; 2008. 435 pp.[17] Ahrenfeldt J., Henriksen U., Jensen T.K., Gobel B., Wiese L., Kather A., et al. Validation of a continuous combined heat and power (CHP) operation of a two- stage biomass gasifier, Energy Fuel 2006; 20(6): 2672e80. [18] Brandt P., Larsen E., Henriksen U., High tar reduction in a two-stage gasifier, Energy Fuel 2000; 14(4): 816e9.
172
ICCI 2015 - Bildiriler Kitabı / Proceedings Book
ABSTRACTPyrolysis is a thermochemical technique that converts biomass solid, liquid and gaseous fractions at moderate temperature and in absence of oxygen. During the 1980s, research was focused on the development of special reactors, such as the bubbling fluid-bed reactor and circulating fluid-bed reactor. In bubbling fluid bed reactor gas is injected vertically upward through a bed of granular material, such as sand, at sufficient velocity to cause a violent mixing of gas and solid into an emulsion that resembles a fluid. Fluidized beds are characterized by high heat and mass transfer rates between gas and particles and objects immersed in the bed. Circulating fluidized beds differ from bubbling fluidized beds in the amount of gas used to fludize the bed. İn circulating beds this gas flow is intentionally set high enough to transport particles out of the bed which are recovered by gas cyclones and returned to the fluidized bed.
1. INTRODUCTIONBiomass is widely considered to be a major potential and renewable energy for the future. As a renewable energy source, biomass can either be used directly through combustion to produce heat or indirectly after converting it to various forms of biofuel. Utilizing the food-based resource for fuel production aggravates food shortage problem[1]. Conversion of biomass into biofuel can be achieved by different methods which are broadly classified into thermal, chemical and biochemical methods. In particular, fast pyrolysis method becomes a promising option for the thermo-chemical conversion of lignocellulosic biomass into liquid fuels[2], because this method can increase the yield of condensable gases and liquid oil quality comparing with other conversion techniques[3]. Pyrolysis is the simplest technique to convert lignocellulosic materials into another class of chemicals. Pyrolysis technique has received interest sine the process conditions can be optimized to maximize the yield. The proportions of liquid, char and gas
depend greatly on the pyrolysis techniques. Depending on the operating conditions, the pyrolysis process can be divided into three sub classes: conventional slow pyrolysis, fast pyrolysis and flash pyrolysis. Slow pyrolysis processes are performed at a low heating rate and at long residence time. The longer residence time of biomass feed can cause secondary cracking of the primary products reducing yield and will affect the bio-oil properties. At present, the preferred technology for production of oily products from wastes is fast or flash pyrolysis at high temperatures with very short residence time[4]. The conversion of biomass into bio-oil involves a fast pyrolysis process. Fast pyrolysis is a high temperature process in which biomass is rapidly heated in the temperature range of around 400–550°C under the anoxia condition where the biomass decomposes instantly to generate vapors, aerosols and some charcoal-like char[5]. The bio-oil is then obtained from the pyrolysis process and can be further processed to high-grade carbon powders for industry applications[6]. With continuous development of pyrolysis technology, a number of reactor designs have been explored to optimize the pyrolysis performance and to produce high-quality bio oil. The fixed bed pyrolysis consists of a reactor with a gas cooling and cleaning system. The technology is simple, reliable and proven for fuels[7], but tar removal is the major problem. Municipal solid wastes were pyrolysed for bio oil and 54 % of oil was obtained on fixed bed[8]. Fluidized bed technology is one of the most efficient and economic methods of actualizing flash pyrolysis of lignocellulosic biomass as they offer rapid heat transfer, good control and suitable vapor residence time. The higher contact surface area achieved between fluid and solid per unit bed volume enhance good thermal transport inside the system yields higher liquid products[9]. Circulating fluidized bed reactors is more suitable to achieve higher yield of bio-oil and it is more suitable for very large throughputs, even though the hydrodynamics are more complex[10].
Bubbling Fluidized Bed and Circulating Fluidized Bed (CFB)
TurgayKARDepartment of Chemistry, Karadeniz Technical University
SedatKELEŞDepartment of Chemistry, Karadeniz Technical University
KamilKAYGUSUZDepartment of Chemistry, Karadeniz Technical University
AliBAHADIRVocational School, Gumushane University

173
ICCI 2015 - Bildiriler Kitabı / Proceedings Book
2. TYPES OF FLUIDIZED BEDSSo far, fluidized beds have found limited applications in coal gasification because of their low carbon conversion efficiency which is resulted from their relatively low bed temperatures (800–1000 °C)[11]. However, fluidized beds are promising for lignocellulosic biomass due to their lower gasification temperature compared to that of coal. Also, most of problems involved in fixed beds and updraft moving bed gasifiers have been obviated in fluidized beds. Therefore, lots of current development activities on large scale biomass gasification have been devoted to fluidized bed technologies. Various types of fluidized bed have been explored in the biomass gasification process. Bubbling fluidized beds (BFB) and circulating fluidized beds (CFB) are two major types implemented for this purpose[11][12].
2.1. Bubling Fluidized BedBubbling fluidized bed gasification is the simplest and probably the most cost-effective concept for continuous biomass gasification. BFBs are flexible to a wide variety of biomass with various particle sizes including pulverized biomass. They provide a high rate of heat transfer between bed materials and fuel and exhibit a nearly uniform temperature distribution throughout the reactor. They are also able to generate a uniform producer gas with low content of tar and unconverted carbon [13][14]. BFBs have been extensively applied for biomass gasification and various researches have been conducted in this field.
Involvement with fluid-bed technology began in the 1950s with the first combustor at its state-of-the-art research center in Alliance, Ohio. Now, with an experience base of more than 30 BFB units, these facilities are helping the world realize the promise of clean energy from a wide variety of fuels. Bubbling fluidized-bed boilers can burn a wide range of low-cost opportunity fuels. The ability to utilize various fuel sources and types provides owners with the flexibility to take advantage of changing cost and availability BFB boiler is designed with a very large operating window to allow a wide range of fuels to be burned, separately or in combination. This is necessary because fuel properties vary widely. For example, biomass fuels have a wide range of moisture and heating values depending upon their source and the time of year. Some BFB boilers are designed with a high degree of flexibility to facilitate air movement between the bubbling bed and the overfire air system, to vary the gas recirculation volumes, and to adjust the fuel delivery to the bed. This operational flexibility allows owners to burn cheaper opportunity fuels and control fuel costs.
Significant environmental benefits are achieved with BFB technology:
NOX
Due to the low temperature sub-stoichiometric combustion processes that occur in the bubbling bed, the generation of nitrogen oxides (NOX) is inherently lower than that of a stoker-fired boiler. Because of good carbon burnout, a selective catalytic reduction (SCR) system can cost-effectively be located before dust removal equipment to further reduce NOX.
CO and VOCs Due to the intimate contact between the bed material and the fuel, improved fuel burnout occurs. This results in very low carbon monoxide (CO) and volatile organic compound (VOC) emissions.
ParticulateDue to improved carbon burnout compared with a stoker boiler, the potential for fires in back-end environmental equipment is significantly reduced. This allows for the use of a baghouse to meet lower particulate requirements.
2.2. Circulating Fluidized BedCirculating fluidized beds (CFBs) differ from bubbling fluidized beds in the amount of gas used to fluidize the bed. In circulating beds this gas flow is intentionally set high enough to transport particles out of the bed, which are recovered by gas cyclones and returned to the fluidized bed. Altough this allows implementation of directly heating the fluidization media, the system is
Figure 1. Principle of Bubbling Fluidize-Bed Pyrolysis.

174
ICCI 2015 - Bildiriler Kitabı / Proceedings Book
more complicated to design and operate than a bubbling fluidized-bed reactor.
The first CFB process was developed at the University of Western Ontario in thelate 1970s and early 1980s. Biomass could be converted to bio-oil yields over 70 wt%. Biomass is screwed into the riser section of the CFB reactor, where rapid mixing of bed material (sand) and biomass takes place. Both char and sand are entrained in the gas flow, with heat transfer and pyrolysis occuring in the rising gas flow. At the exit of the riser, a gas cyclone seperates the char and sand from the gas flow. The particulate matter enters a combustion chamber where the char is burned in air, heating the bed media, which is returned to the bottom of the riser. The gas flow passes to an oil recovery system, which ses a combination of devices to remove pyrolysis vapors and aerosols from the noncondensable gases.
The Canadian Company Ensyn Technologies Inc(ETI) developed industrial applications for their rapid thermal processing (RTP) technology. Commercialization was enabled through the granting in 1990 of an exclusive license to Red Arrow Food Products Company Ltd of Wisconsin for production of liquid smoke and browning agents for thefood industry. By 1996, there were four RTPTM plants in commercial operation. In 2001, an RTPTM biomass refining plant was built and commissioned to produce annually over 1800 tons of natural resin products from the existing bio-oil plants. In 2002, Ensyn increased its total capacity to 100 tons/day by taking into operation another RTPTM plant. A sixth commercial RTPTM biomass plant, designed to produce specialty chemical products was built and put into service in 2003. Ensyn’s largest RTPTM biomass refinery is established in Renfrew, Ontario, converting up to 200 tons of wood per day into natural
resin products, co polymers, other chemicals, liquid fuel, and green electricity. A photograph of an Ensyn plant is found in Freel[15]. Ensyn recently went into a joint venture with UOP, under the name Envergent Technologies LCC, to commercialize the pyrolysis technology for fuel substition and electricity generation [16].Another joint venture has been established by Finnish companies Metso and UPM to develop bio-oil production in combination with (existing) CFB biomass combustion units. The technology is based on the integration of conventional biomass-based fluidized-bed boilers with a (nondisclosed) pyrolysis reactor (in cooperation with VTT). The pyrolsis unit utilizes the circulating hot sand from the boiler as a heat source. The first prduction was accomplished at Metso’s test unit in Tampere (Finland) in 2010. Like bubbling fluidized beds CFB technology is relatively well developed[17], but a number of opreational problems remain. These include erosion of reactor internals and relatively complicated operation, especially the movement of hot solids from one reactor to another. These problems have been solved by the chemical industry in the development of fluid catalytic cracking, which employs a similar circulating solids system. The challenge for fast pyrolysis is sufficiently cleaning the noncondensable gases from fast pyrolysis to allow them to be reheated and compressed. Finally, for realizing the rather low solids hold up in riser systems at solid fluxes of 100-200 kg/(m2s), the gas flow rate in the riser should be high, in order of 1000 m3/h(tons/h biomass).
The circulating fluidized bed have some advantage and limitations:Wet flue gas desulfurization (Wet FGD) has typically been used to capture the pollutants gas. However, this machinery is expensive, hard to maintained and takes a lot of space in power plant. Wet FGD uses lot of water, however only marginal metals like mercury and acid gases such as HCl, HF, SO2 and SO3 can be captured[18]. The new technology of circulating fluidized bed scrubber (CFBS) was introduced circa 1984. The turbulator wall design will ensure a perfect mixing and the ability to capture various pollutants. The used of alloy metals had been replaced with a carbon steel design, reducing the installation cost. It also comes in a compact size thus the capital costs could be reduced. The water usage can also be reduced with the design of plug-free water spray nozzles[19]. The CFBS can undergo a self-cleaning process, reducing the cost of maintenance. The operating temperature is lower thus the production of the nitrogen oxides, a contributor to smog, is lower[20]. Despite of all the advantages, the CFBS is limited to 400 MW per unit. The limestone used in the CFBS is expensive and must be kept either in a concrete or steel silo rather than a pile[20]. Besides that, this machinery also produces a by-product, for instance CaCl that do not have many uses due to its properties[20]. Another type of CFB is circulating fluidized bed gasification (CFBG), which is more preferable compared to other type of gasifiers. CFBG has a
Figure 2. Principle of Circulating Fluidize-Bed Pyrolysis.

175
ICCI 2015 - Bildiriler Kitabı / Proceedings Book
high mass and heat transfer rate as well as high efficient gas-solid contacting. At low operating temperature of CFBG, a longer residence time of solid can be achieved leading to a higher gasification yield.CFBG process is more energy efficient as it is an endothermic process. Only the required heat will be generated to maintain the process at the optimum temperature.Practically, all the heat produced will be utilized throughout all the processes, as it is an adiabatic and isothermal process[21]. Even though, the CFBG process is able to manage huge range of fuels, high gasification yield cannot be achieved for the fuels that are less reactive such as anthracite and pet coke because of the low operating temperature. The flow is also multiphase complex and every distinct particles need to be scaled-up in a different way[22].
3. CONCLUSIONSBiofuels and waste (RDF) are two of the fuel groups ideally suited for our CFB technology. Our units can be designed to fire 100% renewable energy fuels.
Concern about global warming is a key factor for developing and implementing energy solutions today. CFBs can also divert waste headed for land-fills and instead convert this waste into valuable steam and electricity to support our growing energy needs.
The features of circulating fluidized-bed boilers are described below. 1) Compatibility with wide range of fuels. Conventional boilers for power generation can use only fossil fuels, such as high-grade coal, oil, and gas. The CFBC is also capable of using low-grade coal, biomass, sludge, waste plastics, and waste tires as fuel. 2) Low polluting NOxand SOx emissions are significantly decreased without special environmental modifications. In the case of fluidized-bed boilers, desulfurization is carried out intrafurnace, using mainly limestone as the fluidizing material. For denitration, PC boilers operate at combustion temperatures from 1,400oC to 1,500oC, whereas circulating fluidized-bed boilers operate at lower temperatures, ranging from 850oC to 900oC, thereby suppressing thermal NOx emissions as the generation of NOx is dependent upon the combustion temperature. In addition, the operation of circulating fluidized-bed boilers involves a two-stage combustion process: the reducing combustion at the fluidized-bed section, and the oxidizing combustion at the freeboard section. Next, the unburned carbon is collected by a high-temperature cyclone located at the boiler exit to recycle to the boiler, thus increasing the denitration efficiency. 3) High combustion efficiency Improved combustion efficiency is attained through the use of a circulating fluidization-mode combustion mechanism.
4) Space-saving, ease of maintenance Space saving is attained because there is no need for separate desulfurization, denitration, and fine-fuel crushing units. Accordingly, trouble-spots are minimized, and maintenance is simplified.
REFERENCES[1] Martin M.A., (2010), First generation biofuels compete, New Biotechnol 27:596–608. [2] Brammer J.G., Lauer M., Bridgwater A.V., (2006), Opportunities for biomass-derived “Biooil” in European heat and power markets, Energy Policy 34:2871–2880.[3] Meier D., Faix O., (1999), State of the art of applied fast pyrolysis of lignocellulosic materials-a review, Bioresour Technol 68:71–77.[4] Raja S.A., Kennedy Z.R., Pillai BC., Lindon Robert Lee C., (2010), Flash pyrolysis of jatropha oil cake in electrically heated fluidized bed reactor, Energy 35:2819–2823.[5] Onay O., Kockar O.M., (2003), Slow fast and flash pyrolysis of rapeseed, Renew Energy 28:2417–2433.[6] Park H.J., Park Y-K., Kim J.S., (2008), Influence of reaction condition and the char separation system on the production of bio-oil from radiata pine sawdust by fast pyrolysis, Fuel Process Technol 89:797–802[7] Chopra S., Jain A.K., (2007), A Review of fixed bed gasification systems for biomass, Agric Eng Int 5:1–23[8] Nurul Islam M., Rafiqul Alam Beg M., Rofiqul Islam M., (2005), Pyrolytic oil from fixed bed pyrolysis of municipal solid waste and its characterization, Renew Energy 30:413–420.[9] Lv PM., Xiong ZH., Chang J., Wu CZ., Chen Y., Zhu JX., (2004), An experimental study on biomass air- steam gasification in a fluidized bed, Bioresour Technol 95:95–101.[10] Hamelinck C.N., van Hooijdonk G., Faaij APC., (2005), Ethanol from lignocellulosic biomass: techno- economic performance in short-, middle- and long- term, Biomass Bioenergy 28:384 410.[11] Basu P., Combustion and gasification in fluidized beds, CRC Press; 2006.[12] Bain R.L., An overview of biomass gasification, In: 2004 AIChE spring national meeting, conference proceedings, 2004. p. 547–52.[13] Ciferno J., Marano J., Benchmarking biomass gasification technologies for fuels, chemicals and hydrogen production, US Dept of Energy; 2002.[14] Bohlig J.W., Castella DR., Hobgood J., System and method for integrated waste storage; 2009.[15] Freel, B., (2002), Ensyn announces commissioning of new biomass facility, PyNe Newstler 14.[16] Kalnes T., Hopkins G., Renu M., and Shonnard D., (2009), Envergent presentation at the International

176
ICCI 2015 - Bildiriler Kitabı / Proceedings Book
Conference on Thermochemical Conversion Science (TC Biomass 2009 Chicago).[17] Bridgwater A.V. (ed) (1999) Fast pyrolysis of Biomass: A Handbook, volume 1, CPL Press, Newbury (ISBN 1-872691-07-02)
[18] Hack H., Giglio R., and Garf R., 2013, Application of Circulating Fluidized Bed Scrubbing Technology for Multi-Pollutant Removal, pg 1-11.[19] Usman M., Circulating Fluidized Bed, University of Engineering & Technology, Lahore.[20] Flue Gas Desulfurization Technology Evaluation Dry Lime vs Wet Limestone FGD, Sargent and Lundy, 2007, Flue Gas Desulfurization Technology Evaluation Dry Lime vs Wet Limestone FGD, pg. 1-57.[21] Giglio R. and Seshamani M., 2011, The Importance of Fluidized Bed Gasification Technology, pg. 1-9.[22] Pugsley T. and Mahinpey N., 2010, A Review of Fluidized Bed Gasification Tecnhology, pg. 1-24.

177
ICCI 2015 - Bildiriler Kitabı / Proceedings Book
ABSTRACTHeating and drying is the first step of gasification, transforming biomass moisture content from 20-50 wt% to bone dry matter at about 300 ºC. As the biomass is heated, moisture contained in the biomass is converted to steam, which can react with biomass and volatiles released during combustion given sufficient time and temperature. The process of heating and drying begins on the outside surface of a biomass particle and then progresses toward the center. Rapid thermal decomposition of biomass in the absence of oxygen is known as pyrolysis. Pyrolysis is followed by the gas-solid reactions between the residual char and the oxygen and steam admitted to the gasifier and gases and vapors released during pyrolysis. The water –gas shift gas reaction is important in increasing H2 content of syngas while the methanation reaction can strongly influence the CH4 content of syngas.
1. INTRODUCTIONRapid development of technology and industrialization has faced mankind with two major concerns: depletion of fossil energy resources and deterioration of the environment. Fossil fuels are the most common energy sources used in the world. It has been reported that over 80% of the energy consumption counts for fossil fuels[1]. However, there are some crucial problems associated with such fuel sources. Fossil fuels emit significant amount of pollutants such as CO2, NOx and SOx into the atmosphere[2]. Combustion of fossil fuels produces large amount of CO2 which is considered for its greenhouse effect and promotion of global warming[1]. Besides, energy consumption has increased 17-fold in the last century and with the present rate of energy consumption, it is estimated that the world’s oil reservoir will be diminished by 2050. Meanwhile, the cost of fossil fuel is globally increasing [2][3]. These issues remind us the need to find alternative fuel resources which are renewable, sustainable and count for eco-friendly fuels Biomass is a renewable, storable and transportable energy source.
Biomass energy is neutral with respect to CO2 emission, and can significantly alleviate the greenhouse effect caused by fossil fuel consumption[4]. Biomass fuels and residues can be converted to energy with some physical and biological processes. In the thermochemical conversion technologies, biomass gasification has attracted the highest interest as it offers the best combination of efficiency, product versatility and emission compared to combustion and pyrolysis. Circulating fluidized bed biomass gasifiers (CFBBGs) have been used for converting biomass materials into energy because of enhanced gasesolid contact, better temperature control, large heat storage capacity, good degree of turbulence, etc. Although CFB gasification is now undergoing rapid commercialization for biomass [5][6], fundamental and pilot studies are, nevertheless, still required for scale-up, as well as for filling the gaps in better understanding the underlying principles.
2. BIOMASS GASIFICATIONGasification is partial thermal oxidation, which results in a high proportion of gaseous products (CO2, water, carbon monoxide, hydrogen and gaseous hydrocarbons), small quantities of char (solid product), ash, and condensable compounds (tars and oils). Steam, air or oxygen is supplied to the reaction as an oxidising agent. The gas produced can be standardised in its quality and is easier and more versatile to use than the original biomass (e.g. it can be used to power gas engines and gas turbines or as a chemical feedstock for the production of liquid fuels). Gasification adds value to low- or negative-value feedstock by converting it into marketable fuels and products[7].
The chemistry of biomass gasification is quite complex. Broadly speaking, the gasification process consists of the following stages[8,11]:• Drying. In this stage, the moisture content of the biomass is reduced. Typically, the moisture content of
Fundamentals of Gasification
TurgayKARDepartment of ChemistryKaradeniz Technical University
SedatKELEŞDepartment of ChemistryKaradeniz Technical University
KamilKAYGUSUZDepartment of ChemistryKaradeniz Technical University

178
ICCI 2015 - Bildiriler Kitabı / Proceedings Book
biomass ranges from 5% to 35%. Drying occurs at about 100–200 ºC with a reduction in the moisture content of the biomass of <5%.• Devolatilisation (pyrolysis). This is essentially the thermal decomposition of the biomass in the absence of oxygen or air. In this process, the volatile matter in the biomass is reduced. This results in the release of hydrocarbon gases from the biomass, due to which the biomass is reduced to solid charcoal. The hydrocarbon gases can condense at a sufficiently low temperature to generate liquid tars.• Oxidation. This is a reaction between solid carbonized biomass and oxygen in the air, resulting in formation of CO2. Hydrogen present in the biomass is also oxidised to generate water. A large amount of heat is released with the oxidation of carbon and hydrogen. If oxygen is present in substoichiometric quantities, partial oxidation of carbon may occur, resulting in the generation of carbon monoxide.• Reduction. In the absence (or substoichiometric presence) of oxygen, several reduction reactions occur in the 800–1000 ºC temperature range. These reactions are mostly endothermic. The main reactions in this category are as follows:
• Water–gas reaction:
• Bounded reaction:
• Shift reaction:
• Methane reaction:
Gasification reactor designs have been researched for more than a century, which has resulted in the availability of several designs at the small and large scales. They can be classified several ways[12]:
• By gasification agent: Air-blown gasifiers, oxygen gasifiers and steam gasifiers.• By heat source: Auto-thermal or direct gasifiers (heat is provided by partial combustion of biomass) and allothermal or indirect gasifiers (heat is supplied by an external source via a heat exchanger or an indirect process).• By gasifier pressure: Atmospheric or pressurised.• By reactor design:• Fixed-bed (updraft, downdraft, cross-draft and open- core): The fixed-bed gasifier has a bed of solid fuel particles through which the gasifying media and gas
either move up (updraft), move down (downdraft) or are introduced from one side of the reactor and are released from the other side on the same horizontal level (cross- draft). It is the simplest type of gasifier, usually consisting of a cylindrical space for fuel and gasifying media with a fuel-feeding unit, an ash-removal unit and a gas exit. In the fixed-bed gasifier, the fuel bed moves slowly down the reactor as the gasification occurs. Fixed-bed gasifiers are simple to construct and generally operate with high carbon conversion, long solid residence time, low gas velocity and low ash carry-over [13][14].• Fluidised-bed (bubbling, circulating and twin-bed): The gasifying agent is blown through a bed of solid particles at a sufficient velocity to keep the particles in a state of suspension. Fuel particles are introduced at the bottom of the reactor, are very quickly mixed with the bed material, and almost instantaneously are heated up to the bed temperature. As a result of this treatment, the fuel is pyrolysed very fast, resulting in a component mix with a relatively large amount of gaseous materials. Further gasification and tar-conversion reactions occur in the gas phase. Twin-bed gasification uses two fluidised-bed reactors. The biomass enters the first reactor, where it is gasified with steam, and the remaining char is transported to the second reactor, where it is burnt with air to produce heat. The heat is transported to the gasification reactor by the bed material, normally sand. The flue gas and the product gas have two separate exits.• Entrained-flow: These gasifiers are commonly used for coal because they can be slurry-fed in direct gasification mode, which makes solid fuel feeding at high pressures in expensive. These gasifiers are characterised by short residence time, high temperatures, high pressures and large capacities[15].• Stage gasification with physical separation of pyrolysis, oxidation and/or reduction zones.
Table 1 compares various types of biomass gasifiers. A review of gasifier manufacturers in Europe, the United States and Canada[16] identified 50 manufacturers offering commercial gasification plants, of which 75% were of the fixed-bed downdraft type, 20% were fluidised-bed systems, 2.5% were of the updraft type, and 2.5% were of various other designs.
The performance of biomass gasifiers could be characterised by several parameters. Here, we will review two such parameters: producer-gas composition, which directly influences the heating value of the gas, and gasification efficiency. The composition of the gas obtained from a gasifier depends ona number of parameters, such as fuel composition, gasifying medium, operating pressure, temperature, moisture content of the fuels, mode of bringing the reactants into contact inside

179
ICCI 2015 - Bildiriler Kitabı / Proceedings Book
the gasifier (gasifier design), etc., and this is why it is very difficult to predict the exact composition of the gas from a gasifier[17]. By way of example, Table 2 shows typical gas composition data as obtained from commercial wood downdraft gasifiers operated on low- to medium-moisture-content fuels[18] and Table 3 shows typical producer-gas composition and operating conditions for atmospheric bubbling fluidised-bed gasifiers[19]. The oxidant or gasifying agents can be air, pure O2, steam, CO2 or mixtures thereof. Air, while a cheap and widely used gasifying agent, contains a large amount of nitrogen, which lowers the heating value of the syngas produced. If pure O2 is used as the gasifying agent, the heating value of syngas will increase but the operating costs will also increase due to the O2 production costs. Partial combustion of biomass with air or O2 can provide heat for drying the biomass, raising the biomass temperature and driving the endothermic gasification reactions, and generate water and CO2 for further reduction reactions[20]. The heating value and H2 content of the syngas can be increased if steam is used as the gasifying agent, in which case the heating value of the product gas is about 10–15 MJ/Nm3 [21][22], compared with 3–6 MJ/Nm3 for air gasification of biomass [23][24]. The use of CO2 as the gasifying agent is promising because of its presence in the syngas. CO2 with a catalyst such as Ni/Al can transform char, tar and CH4 into H2 and/ or CO, thus increasing H2 and CO contents [25]. Pure steam or CO2 requires an indirect or external heat supply for endothermic gasification reactions [26–29]. Alternatively, a mixture of steam or CO2 and air or O2 can be used as the gasifying agent, and the partial combustion of biomass with air/O2 provides the heat required for gasification [21][30-32].
3. CONCLUSIONSResearching alternative energy resources is so important. Recently, considerable attentions have been paid to biomass gasification technologies due to their potential to convert biomass waste to bioenergy and biofuels. So far, numerous researches have been conducted on
Table1. Salient Features And Comparative Evaluation Of Different Designs Of Biomass Gasifiers[33][34][35]
Table 3.Typical Producer-Gas Composition and Operating Conditions For Atmospheric Bubbling Fluidised-Bed Gasifiers[19]
Table 2.Typical Producer-Gas Composition From Commercial Wood For Downdraft Gasifiers Operated On Low- To Medium-Moisture-Content Fuels[18]
180
ICCI 2015 - Bildiriler Kitabı / Proceedings Book
gasification of lignocellulosic biomass using various operation parameters have been investigated to improve the effectiveness of the gasification plants.
REFERENCES[1] Escobar J., Lora E., Venturini O., Yanez E., Castillo E., Almazan O. Biofuels: environment, technology and food security. Renew Sust Energy Rev 2009; 13:1275–87. [2] Demirbas A., Progress and recent trends in biofuels, Prog Energy Combust Sci 2007;33:1–18.[3] Saxena R., Adhikari D., Goyal H., Biomass-based energy fuel through biochemical routes: a review, Renew Sust. Energy Rev. 2009;13:167–78.[4] Chen P., Zhao ZL., Wu CZ., Zhu J., Chen Y., Biomass gasification in circulating fluidized bed, In: Circulating fluidized bed technology VIII, proceedings of the international conference on circulating fluidized beds, 8th, Hangzhou, China;2005. p. 507e14. [5] Yin X-L., Wu C-Z., Zheng S-P., Chen Y., Design and operation of a CFB gasification and power generation system for rice husk, Biomass Bioenerg 2002; 23:181e7. [6] Wu C., Yin X., Ma L., Zhou Z., Chen H., Design and operation of a 5.5 MWe biomass integrated gasification combined cycle demonstration plant, Energy Fuel 2008;22:4259-64.[7] Puig M., Carles Bruno J., Coronas A., Review and analysis of biomass gasification models, Renewable and Sustainable Energy Reviews 14 (2010) 2841–2851.[8] McKendry P., Energy production from biomass (part 1): overview of biomass, Bioresour Technol 2002;83:37–46.[9] McKendry P., Energy production from biomass (part 3): gasification technologies, Bioresour Technol 2002;83:55–63. [10] Li X., Biomass gasification in circulating fluidized bed, PhD dissertation. Vancouver, Canada: University of British Columbia;2002. [11] Kishore VVN, editor, Renewable energy engineering & technology: a knowledge compendium, New Delhi: TERI Press; 2008.[12] Rauch R., Biomass gasification to produce synthesis gas for fuels and chemicals, report made for IEA Bioenergy Agreement, Task 33: Thermal Gasification of Biomass; 2003.[13] Carlos L., High temperature air/steam gasification of biomass in an updraft fixed bed type gasifier, PhD thesis, Stockholm, Sweden: Royal Institute of Technology, Energy Furnace and Technology;2005. [14] Reed TB., Das A., Handbook of biomass downdraft gasifier engine systems, Colorado: Solar Energy Research Institute; 1988. [15] Knoef HAM., Handbook biomass gasification, Meppel, The Nederlands: BTG Biomass Technology Group B.V.; 2005.
[16] Knoef HAM., Inventory of biomass gasifier manufacturers and installations, Final Report to European, Commission, Contract DIS/1734/98-NL, Biomass Technology Group BV, University of Twente, Enschede; 2000. [17] Basu P., Combustion and gasification in fluidized beds, London: Taylor & Francis Group/CRC Press; 2006.[18] Stassen HEM., Knoef HAM., Small scale gasification systems, The Netherlands: Biomass Technology Group, University of Twente; 1993.[19] Gil J., Corella J., Aznar MP., Caballero MA., Biomass gasification in atmospheric and bubbling fluidized bed: effect of the type of gasifying agent on the product distribution, Biomass Bioenergy 1999;17: 389–403.[20] Basu P., Combustion and gasification in fluidized beds, London: Taylor & Francis Group/CRC Press; 2006.[21] Gil J., Corella J., Aznar MP., Caballero MA., Biomass gasification in atmospheric and bubbling fluidized bed: effect of the type of gasifying agent on the product distribution, Biomass Bioenergy 1999;17:389–403.[22] Rapagna S,, Jand N,, Kiennemann A,, Foscolo PU., Steam gasification of biomassin a fluidised-bed of olivine particles, Biomass Bioenergy 2000;19:187–97.[23] Gabra M., Pettersson E., Backman R., Kjellstrom B., Evaluation of cyclone gasifier performance for gasification of sugar cane residue - part 1: gasification of bagasse, Biomass Bioenergy 2001;21:351–69.[24] Zainal ZA., Rifau A., Quadir GA., Seetharamu KN., Experimental investigation of a downdraft biomass gasifier, Biomass Bioenergy 2002;23:283–9.[25] Ollero P., Serrera A., Arjona R., Alcantarilla S., The CO2 gasification kinetics of olive residue, Biomass Bioenergy 2003;24:151–61.[26] Hofbauer H., Fleck T., Veronik G., Rauch R., Mackinger H., Fercher E., The FICFB gasification process. In: Bridgwater AV, Boocock DGB, editors, Developments in thermochemical biomass conversion. London: Blackie; 1997, p. 1016–25.[27] Pletka R., Brown RC., Smeenk J., Indirectly heated biomass gasification using a latent heat ballast - part 1: experimental evaluations, Biomass Bioenergy 2001;20:297–305.[28] Pletka R., Brown RC., Smeenk J., Indirectly heated biomass gasification using a latent heat ballast - part 2: modeling, Biomass Bioenergy 2001;20:307–15.[29] Cummera K., Brown RC., Indirectly heated biomass gasification using a latentheat ballast - part 3: refinement of the heat transfer model, Biomass Bioenergy 2005;28:321–30.[30] Hanaoka T., Inoue S., Uno S., Ogi T., Minowa T., Effect of woody biomass components on air–steam gasification, Biomass Bioenergy 2005;28:69–76.

181
ICCI 2015 - Bildiriler Kitabı / Proceedings Book
[31] Lv PM., Xiong ZH., Chang J., Wu CZ., Chen Y., Zhu JX., An experimental study on biomass air–steam gasification in a fluidized bed, Bioresour Technol 2004;95:95–101.[32] Lucas C., Szewczyk D., Blasiak W., Mochida S., High- temperature air and steam gasification of densified biofuels, Biomass Bioenergy 2004; 27: 563–75.[33] Kishore VVN., editor, Renewable energy engineering & technology: a knowledge compendium, New Delhi: TERI Press; 2008.[34] Bridgwater AV., The technical and economic feasibility of biomass gasification for power generation, Fuel 1995;74:631–53.[35] Beenackers AACM., Biomass gasification in moving beds, A review of European technologies, Renew Energy 1999;16:1180–6.
182
ICCI 2015 - Bildiriler Kitabı / Proceedings Book
ÖZET“Compressed Naturel Gas” yani “Sıkıştırılmış Doğal Gaz” diye adlandırılan CNG, doğal gazın yüksek basınçlarda sıkıştırılmış halidir. CNG’nin araçlarda kullanımı, doğal gazın 200 – 220 bar’a sıkıştırılarak depolama kapasitesini artırmak ve yüksek basınçlı gazın dispenserler vasıtasıyla araçlara dolumu yapılması suretiyle gerçekleştirilmektedir.
Sıkıştırılmış doğal gaz, düşük emisyon değerleri ve neredeyse sıfır düzeyinde olan partikül miktarı ile çevre dostu bir yakıt olarak kalıcı bir pazar payı elde ederek gelişimini artırmaktadır. Başta Kyoto Protokolü’ne imza atan ülkeler olmak üzere birçok ülke ve yerel yönetimler CNG’li araçların kullanımını emisyon ve partikül değerlerinden en çok zarar gören şehir halkının sağlığını korumak için teşvik etmiş, hatta zorunlu kılmışlardır.
Bu çalışmada, CNG ve motorinin çevresel emisyon faktörlerine yer verilerek İETT İşletmeleri Genel Müdürlüğü’nün araçlarında kullandığı doğal gazın çevreye etkisi analiz edilmiş, benzer otobüslerin motorinli olması durumunda oluşacak sera gazı emisyonları ile kıyaslama yapılarak, CNG kullanımının çevresel boyutu üzerine dünya örnekleri ele alınmıştır.
1. GİRİŞDünyada kullanılan enerjinin çoğu fosil yakıtlardan sağlanır. Fosil yakıtların yanması sera gazları ve kirletici emisyonlar üretir. Fosil yakıtlar içinde doğal gaz bu açıdan en uygun yakıttır. Buna karşın doğal gaz, mobil kullanım amaçları için depolama ve doldurma tesisleri açısından problemlere sahiptir. Ancak sıkıştırılmış doğal gaz (CNG), kısıtlı bir seyir bölgesine sahip olan toplu taşıma otobüslerin içten yanmalı motorları için ideal yakıt olabilir[1].
Doğal gaz, hidrokarbon bileşiklerinin karışımıdır ve çoğunlukla metandan oluşur. İçerdiği enerji yoğunluğu ve dizel yakıtına kıyasla tüm dünyada genel olarak sahip olduğu düşük fiyat gerçeği doğal gazı diğer yakıt tiplerinin önüne geçirir. Diğer yakıt türlerine kıyasla ucuz ve ulaşılabilir olması sonucu tüm dünyada doğal gazı içten yanmalı motorlarda uygulamaya yönelik çalışmalar artmıştır ve araç üreticileri ve araç sahipleri doğal gazı kullanmaya yönelmişlerdir. Avrupa’da 2003 yılında 500 bin
CNG yakıtlı araç varken bugün bu sayı 2 milyonu geçmiştir. Tüm dünyada ise doğal gazlı araç sayısı 16 milyonu geçmiştir[2].
Avrupa Birliği politikaları CNG yakıtlı araçların sayılarının artırılması yönünde eğilim göstermekte ve bu konuda hükümetleri teşvikler vermeye yöneltmektedir. Avrupa Birliği’nin 2009/28/EC direktifinde 2020 yılında tüm enerji ihtiyacının %20’nin yenilenebilir enerji kaynaklarından ve tüm toplu taşımada kullanılan araç filosunun enerji ihtiyacının da %10’unun yenilenebilir enerji ve alternatif yakıtlı enerji kaynaklarından elde edilmesi Avrupa ülkelerine hedef olarak koyulmuştur [3].
CNG yakıtlı otobüs sayısı özellikle 2007 yılından sonra toplu taşıma amacıyla sıklıkla tercih edilir duruma gelmiştir. Türkiye’de bazı belediyeler ve toplu taşıma şirketleri, yakıt maliyetlerini azaltmak ve daha temiz bir enerji kaynağı kullanarak çevreye saygılı araç filosu oluşturmak maksadıyla CNG yakıtlı otobüsleri tercih etmiştir. İstanbul Büyükşehir Belediyesi (İETT ve diğer toplu taşıma şirketleri), Ankara Büyük Şehir Belediyesi (EGO), Kayseri, Kocaeli, Konya, Gaziantep, Bolu, Düzce, Afyon gibi şehirlerde şu an itibariyle kullanılan 2607 adet CNG yakıtlı otobüs bulunmaktadır. İETT bünyesinde bulunan 3059 araçtan 360 adedi CNG yakıtlıdır. Oran olarak İETT araç filosunun yaklaşık %12’si alternatif yakıtlıdır. Bunların 240 adedi fabrika üretimi CNG yakıtlı araç olup kalan 120 adedi ise dizel motordan CNG yakıtlı motora dönüştürülmüş araçlardır. İstanbul’da İETT’ye ait bu 360 adet CNG yakıtlı otobüsten başka 242 adet daha CNG yakıtlı otobüs çalışmaktadır [2].
2. CNG KULLANIMININ ÇEVRESEL BOYUTUUlaştırma teknolojisinde enerji verimliliği yönünde gerçekleştirilecek yatırımlar sayesinde, otomobilden kaynaklanan emisyonların kısa dönemde %20-25, uzun dönemde ise %35-55 düzeyinde azaltılması potansiyeli bulunmaktadır[4]. Bu çerçevede; fosil yakıtlı taşıtları, sürdürülebilir karbonsuz ulaşıma kaydıracak yeni teknolojiler geliştirilmekte ve ulaşımda enerji korunumunu sağlamak amacıyla; taşıtlarda kullanılan
Toplu Taşımada Sıkıştırılmış Doğal Gaz (CNG) Kullanımının Sera Gazı Emisyonlarına Etkisi
YavuzYALÇINİETT İşletmeleri Genel Müdürlüğü
ŞenayAKCANİETT İşletmeleri Genel Müdürlüğü

183
ICCI 2015 - Bildiriler Kitabı / Proceedings Book
yakıtların değiştirilmesi, geleneksel biyo yakıtlar, elektrik, hidrojen, sıvılaştırılmış petrol gazı (LPG), sıkılaştırılmış doğal gaz (CNG) gibi birçok alternatif yakıt önerilmektedir. Alternatif yakıtlı taşıtlar, dizel, LPG, metanol, etanol, hidrojen ve elektrikli taşıtlar olarak sınıflandırılmakta ve bu taşıtlarla sağlanan enerji korunumu ile iklim değişikliğine neden olan emisyonlarda %10’a kadar azaltım sağlanabilmektedir[5]. Avrupa Birliği Komisyonu tarafından[6] da sayılan alternatif yakıtlar ise; Elektrik, Hidrojen ve Biyo Yakıtlar; Sıkıştırılmış Doğal Gaz (CNG), Sıvılaştırılmış Doğal Gaz (LNG) ya da Gazdan Sıvı (GTL) ile Sıvılaştırılmış Petrol Gazı (LPG) olarak sınıflandırılmaktadır. Hibrid taşıtlar, diğer geleneksel taşıtlara oranla %20 daha fazla enerji korunumu ve emisyon azaltımı sağlamaktadır. Ayrıca, diğer geleneksel taşıtlarla karşılaştırıldığında, %20 enerji korunumu ve emisyon azaltımı sağlamaktadır[7].
CNG yakıt ile diğer emisyon sınıfları karşılaştırıldığında, CNG yakıttan çıkan salınımın emisyon limitlerinin en altında olduğu görülmektedir. Yapılan araştırmalar, kilometre başına gr CO2 salınımı açısından değerlendirildiğinde benzin kullanan araçların 164 gr, dizel kullanan araçların 156, CNG kullanan araçların 124 gr salınım gerçekleştirildiğini ortaya koymaktadır[8].
Amerika Çevre Koruma Ajansı EPA’ya gore, geleneksel araçlara kıyasla, sıkıştırılmış doğal gaz ile çalışan araçlar; %25 CO2, %90-97 CO emisyonlarında; % 35-60 N2O, % 50-75 metan hidrokarbon emisyonlarında azaltım sağlamaktadırlar. Doğal gazlı araçlarda partikül madde yok denecek kadar azdır ve daha az toksik ve kanserojen madde içermektedirler.
3. CNG KULLANIMININ AVANTAJLARI
CNG kullanımının avantajları aşağıdaki gibi sıralanabilir[9].• CNG yakıt olarak 650°C’de yanan bir gaz olup havadan hafif olduğu için patlama tehlikesi çok düşük bir orandadır. Bu suretle yapılan araştırmalar dâhilinde benzin ve LPG’den daha güvenli olduğu tespit edilmiştir.
• Karbonmonoksit (CO) oranı %0 olduğu için çevreye dost bir alternatif yakıttır. • CNG; benzinle çalışan araçlarda %60-70 oranında, LPG ile çalışan araçlarda ise %30 daha tasarrufludur.• İstasyonlarda depolama yapılma imkânı mevcuttur.• Motora hiçbir zararı olmayan CNG kullanımında ortalama 35.000-40.000km’de bir yağ değişimi yapılmakta olup motor ömrünü uzatmaktadır. • Oktan sayısının yüksek olmasından dolayı daha temiz yanma karakterine ve daha yüksek ısı verimliliğine sahiptir.• Motora direkt gaz girdiğinden soğuk havalarda aracı çalıştırma problemi olmamaktadır.
4. CNG KULLANIMININ KARBON AYAK İZİ Çalışmanın bu bölümünde, İETT İşletmeleri Genel Müdürlüğü’nün araçlarında kullandığı doğal gazın çevreye etkisi analiz edilerek benzer otobüslerin motorinli olması durumunda oluşacak sera gazı emisyonları ile kıyaslama yapılacaktır.
The Green House Gas Protocol Initiative hesaplama modülüne göre yapılan hesaplamalarda, 1 m3 doğal gazın yanmasından 0,002 ton CO2 atmosfere salınırken, 1 lt dizelin yanmasından 0,003 ton CO2 salımı gerçekleşmektedir.
Çalışma dahilinde İETT Kağıthane Garajı’nda faaliyette olan 240 adet CNG’li otobüsün 2014 yılı içerisinde kullanmış oldukları doğal gaz miktarı ve kat ettikleri kilometre verilerinden yararlanılmıştır. Kıyaslama verisi olarak da, normal dizel yakıt kullanan bir otobüsün ortalama 0,55 lt/km yakıt tüketiminde bulunduğu kabul edilmiştir.
CNG’li otobüslerin ortalama yakıt tüketimi ve kilometre verileri incelendiğinde yıl içerisinde ortalama 0,68 m3/km değerinin yakalandığı, özellikle klima kullanımının arttığı yaz aylarında bu değerin 0,72 m3/km değerine kadar yükseldiği gözlemlenmiştir.
Şekil 1. Motor türlerine göre emisyon değerleri.
Tablo 1. 2014 Yılı km ve Doğal Gaz Tüketim Değerleri
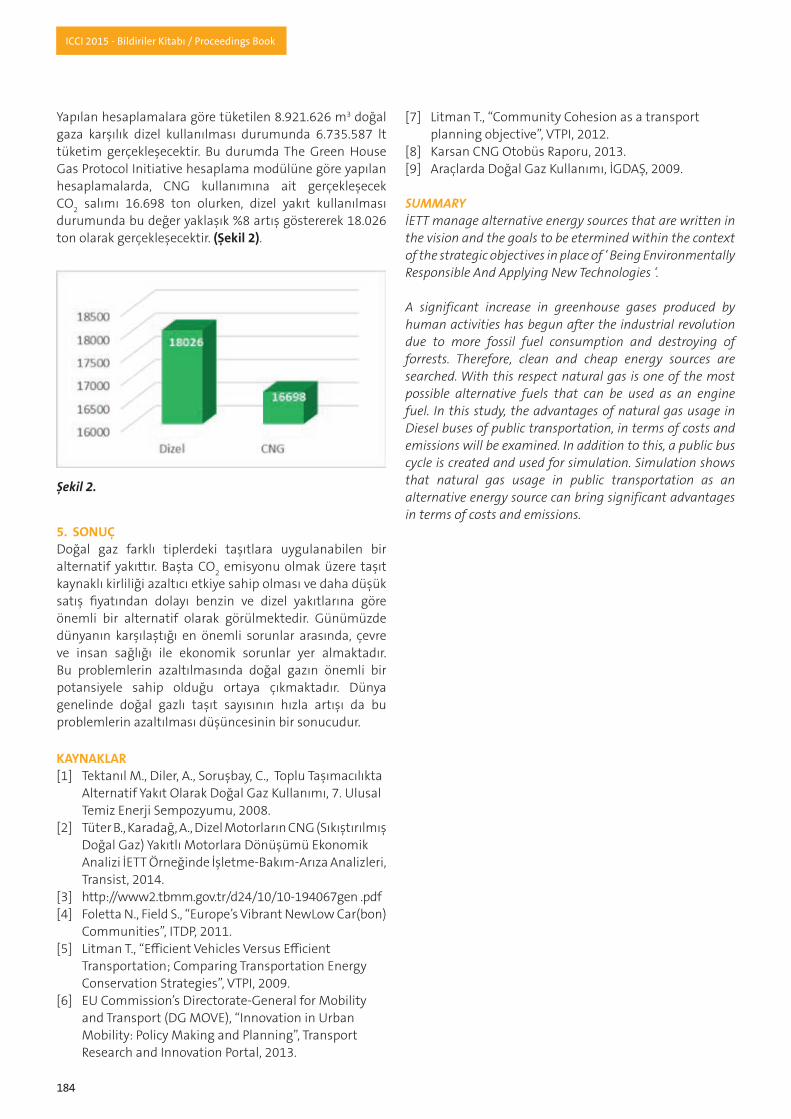
184
ICCI 2015 - Bildiriler Kitabı / Proceedings Book
Yapılan hesaplamalara göre tüketilen 8.921.626 m3 doğal gaza karşılık dizel kullanılması durumunda 6.735.587 lt tüketim gerçekleşecektir. Bu durumda The Green House Gas Protocol Initiative hesaplama modülüne göre yapılan hesaplamalarda, CNG kullanımına ait gerçekleşecek CO2 salımı 16.698 ton olurken, dizel yakıt kullanılması durumunda bu değer yaklaşık %8 artış göstererek 18.026 ton olarak gerçekleşecektir. (Şekil 2).
5. SONUÇDoğal gaz farklı tiplerdeki taşıtlara uygulanabilen bir alternatif yakıttır. Başta CO2 emisyonu olmak üzere taşıt kaynaklı kirliliği azaltıcı etkiye sahip olması ve daha düşük satış fiyatından dolayı benzin ve dizel yakıtlarına göre önemli bir alternatif olarak görülmektedir. Günümüzde dünyanın karşılaştığı en önemli sorunlar arasında, çevre ve insan sağlığı ile ekonomik sorunlar yer almaktadır. Bu problemlerin azaltılmasında doğal gazın önemli bir potansiyele sahip olduğu ortaya çıkmaktadır. Dünya genelinde doğal gazlı taşıt sayısının hızla artışı da bu problemlerin azaltılması düşüncesinin bir sonucudur.
KAYNAKLAR[1] Tektanıl M., Diler, A., Soruşbay, C., Toplu Taşımacılıkta Alternatif Yakıt Olarak Doğal Gaz Kullanımı, 7. Ulusal Temiz Enerji Sempozyumu, 2008.[2] Tüter B., Karadağ, A., Dizel Motorların CNG (Sıkıştırılmış Doğal Gaz) Yakıtlı Motorlara Dönüşümü Ekonomik Analizi İETT Örneğinde İşletme-Bakım-Arıza Analizleri, Transist, 2014.[3] http://www2.tbmm.gov.tr/d24/10/10-194067gen .pdf[4] Foletta N., Field S., “Europe’s Vibrant NewLow Car(bon) Communities”, ITDP, 2011.[5] Litman T., “Efficient Vehicles Versus Efficient Transportation; Comparing Transportation Energy Conservation Strategies”, VTPI, 2009.[6] EU Commission’s Directorate-General for Mobility and Transport (DG MOVE), “Innovation in Urban Mobility: Policy Making and Planning”, Transport Research and Innovation Portal, 2013.
[7] Litman T., “Community Cohesion as a transport planning objective”, VTPI, 2012.[8] Karsan CNG Otobüs Raporu, 2013.[9] Araçlarda Doğal Gaz Kullanımı, İGDAŞ, 2009.
SUMMARYİETT manage alternative energy sources that are written in the vision and the goals to be etermined within the context of the strategic objectives in place of ‘ Being Environmentally Responsible And Applying New Technologies ‘.
A significant increase in greenhouse gases produced by human activities has begun after the industrial revolution due to more fossil fuel consumption and destroying of forrests. Therefore, clean and cheap energy sources are searched. With this respect natural gas is one of the most possible alternative fuels that can be used as an engine fuel. In this study, the advantages of natural gas usage in Diesel buses of public transportation, in terms of costs and emissions will be examined. In addition to this, a public bus cycle is created and used for simulation. Simulation shows that natural gas usage in public transportation as an alternative energy source can bring significant advantages in terms of costs and emissions.
Şekil 2.
ICCI 2015
ENERJİ ÖDÜLLERİ ENERGY AWARDS
Eylül / September 2015 Ankara
www.enerjiodulleri.com
Energy Events Worldwide Dünya Çapında Enerji Etkinlikleri
Türkiye / Turkey İstanbul 17 - 20.03.2016İstanbul 27 - 29.04.2016
Almanya/ Germany Hannover 26 - 29.04.2016ABD / USA Rosemont 18 - 21.04.2016Kanada / Canada Toronto 5 - 7.10.2015
Toronto 7 - 8.12.2015Çin / China Shanghai 27 - 30.10.2015
www.hannovermesse.de/worldwide
Leading Trade Fair Network for Renewable and Conventional PowerGeneration, Power Supply, Transmission, Distribution and StorageYenilenebilir ve Konvansiyel Enerji Üretimi, Temini, Dağıtımı veDepolanması Alanında Lider Ticaret Fuarları Ağı