Embed Size (px)
Citation preview

TECHNICAL NOTE
Key Words Calibration, KED, mass accuracy, mass stability
Introduction Mass stability with quadrupole ICP-MS instruments is very important for accurate and reliable analytical measurements. When making ICP-MS measurements there are generally two approaches – scanning and peak jumping. Scanning involves taking number of measurements across a number of channels over the peak profile whereas peak jumping measures a single point which is usually the peak maximum.
In routine ICP-MS measurements when the lowest detection limits are required the typical approach is to use single point peak jumping at the peak maximum and not waste valuable analytical time on the sides of the peak where the signal to noise is poorer. To carry out peak jumping at a single point it is essential that the mass stability of the quadrupole is good enough to reproducibly go to the same mass point each time. The best detection limits for a given integration time will always be achieved if good mass stability can be guaranteed.
One of the main factors that will affect mass stability in ICP-MS is temperature. Thermal stability of the quadrupole power supply is a factor and relates directly to the laboratory environment where the ICP-MS instrument is installed. The Thermo Scientific™ iCAP™ RQ ICP-MS is designed to operate at laboratory temperatures of 15 to 35 oC with an optimum operation temperature of 18 to 21 oC.
Thermo Scientific iCAP RQ ICP-MS – Mass Stability
TN
43400
Many standardised analytical methods including US FDA and US EPA require that the ICP-MS instrument is checked for mass calibration and resolution to make sure that the peaks are in the correct position and of the correct width. US EPA methods state that specific criteria should be met prior to any analytical samples being measured. These criteria include the mass calibration not differing by more than 0.1 amu from the true value and that the resolution must be verified to less than 0.9 amu full width at 10% peak height.
This document details how the iCAP RQ ICP-MS meets the specifications for mass calibration stability and how the Thermo Scientific Qtegra Intelligent Scientific Data Solution (ISDS) Software allows for these mass calibration tests to be performed automatically within a performance report to ensure the system is suitable for method compliant measurements.
Sample AnalysisAll data acquisition was acquired with an iCAP RQ ICP-MS with default sample introduction system and interface. Performance reports are supplied with Qtegra ISDS Software and are automatically associated to the measurement mode being used for data acquisition. For this work, performance reports were acquired in standard mode, no gas (STD) and He mode with kinetic energy discrimination (KED) using the default 1 ppb tune solution that contains Ba, Bi, Ce, Co, In, Li and U in 2% HNO3 and 0.5% HCl.
Mass stability data was acquired by running consecutive performance reports over a period of 48 hrs and compiling the data from the reports into a time based excel plot.
ResultsPerformance reports acquired using iCAP RQ ICP-MS instruments run a series of tests to validate the instrument performance prior to acquiring analytical data.
Figure 1. Mass calibration test from the Qtegra ISDS Software performance report.
The measurement protocol includes a mass calibration check, sensitivity and background checks alongside oxide and doubly charged ion formation checks. The short term stability over a series of measurements is also monitored and reported.
A typical mass calibration test is shown in Figure 1 below measured at 4 masses across the mass range acquired using the standard performance report within Qtegra ISDS Software. The peak offset is recorded and the full width at 10% peak height to comply with current legislative methods.
It is shown in the tables that the measured offset is significantly below the 0.1 amu set out in EPA standards and that the peak width is below 0.9 amu across the mass range.
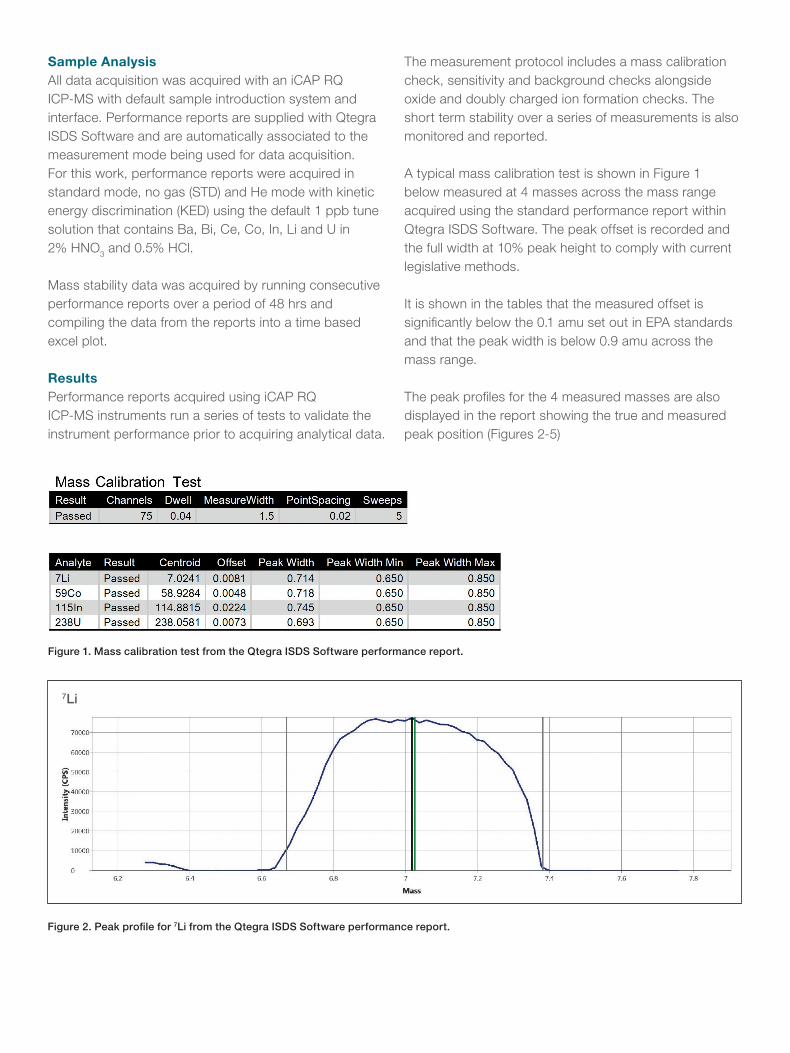
The peak profiles for the 4 measured masses are also displayed in the report showing the true and measured peak position (Figures 2-5)
Figure 2. Peak profile for 7Li from the Qtegra ISDS Software performance report.
7Li
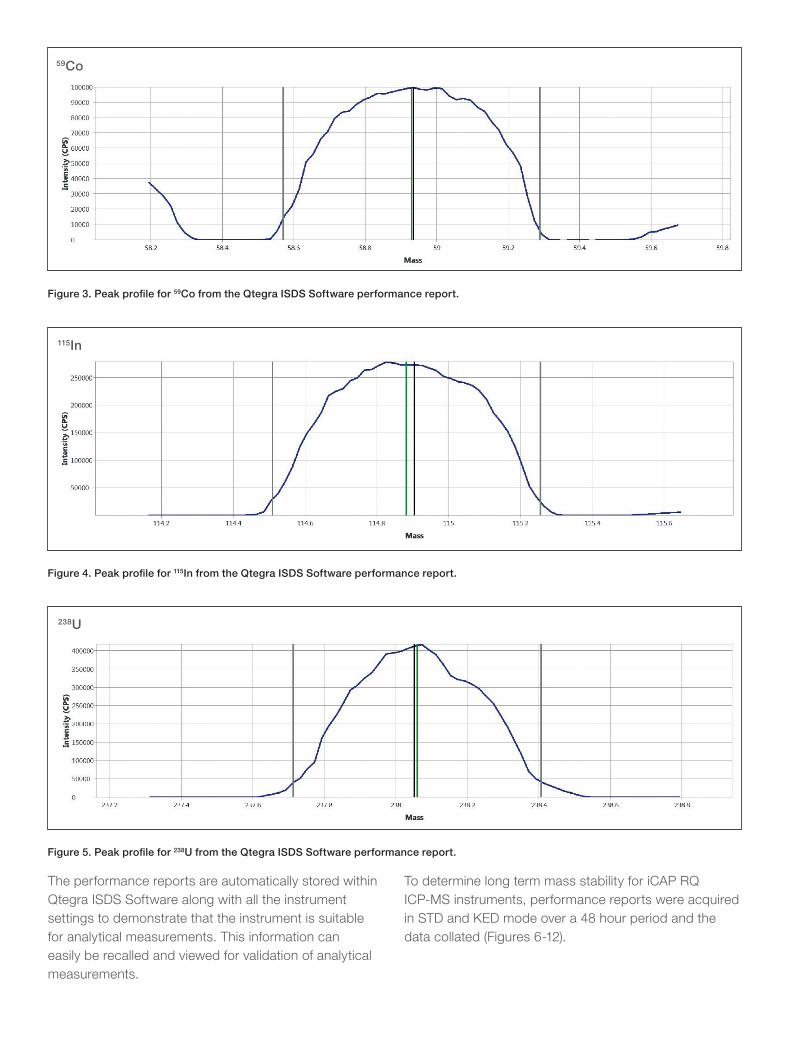
Figure 3. Peak profile for 59Co from the Qtegra ISDS Software performance report.
Figure 4. Peak profile for 115In from the Qtegra ISDS Software performance report.
Figure 5. Peak profile for 238U from the Qtegra ISDS Software performance report.
59Co
115In
238U
The performance reports are automatically stored within Qtegra ISDS Software along with all the instrument settings to demonstrate that the instrument is suitable for analytical measurements. This information can easily be recalled and viewed for validation of analytical measurements.
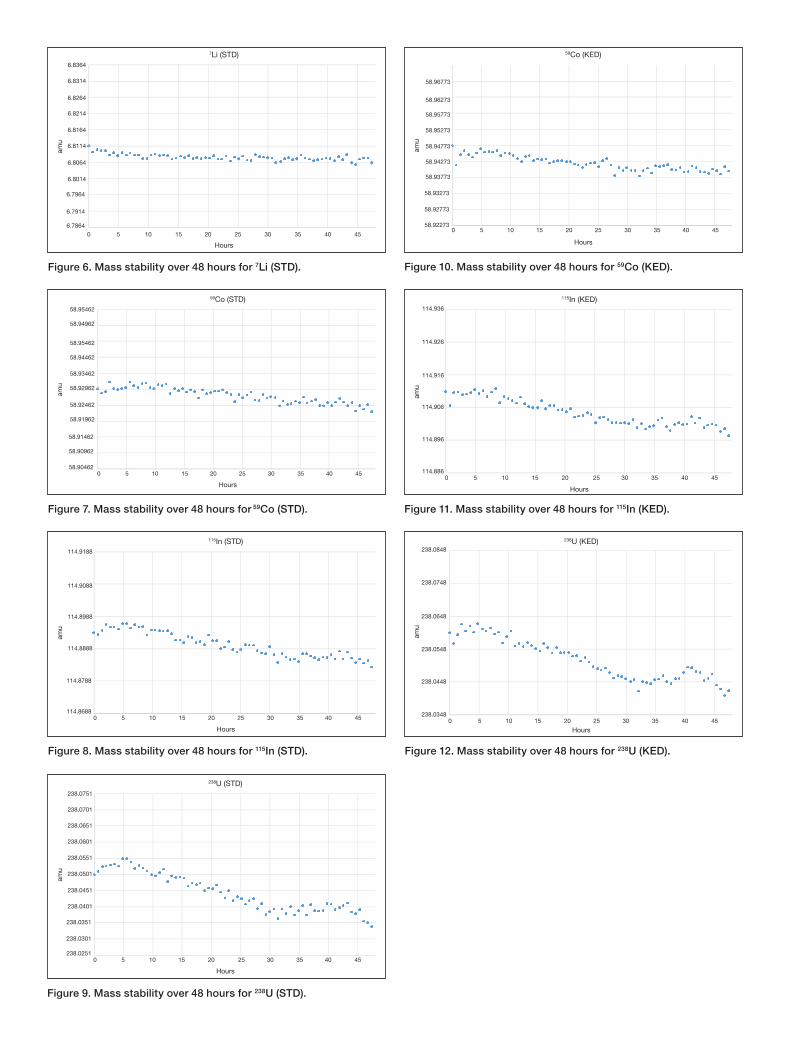
To determine long term mass stability for iCAP RQ ICP-MS instruments, performance reports were acquired in STD and KED mode over a 48 hour period and the data collated (Figures 6-12).
6.7864
6.7964
6.8064
6.8164
6.8264
6.8364
6.7914
6.8014
6.8114
6.8214
6.8314
35 40 4520 25 3050 10 15
7Li (STD)am
u
Hours
58.92273
58.93273
58.93773
58.94773
58.95773
58.92773
58.94273
58.95273
58.96273
58.96773
35 40 4520 25 3050 10 15
59Co (KED)
amu
Hours
58.90462
58.91462
58.92462
58.93462
58.95462
58.95462
58.90962
58.91962
58.92962
58.94462
58.94962
35 40 4520 25 3050 10 15
59Co (STD)
amu
Hours
114.886
114.896
114.906
114.916
114.926
114.936
35 40 4520 25 3050 10 15
115In (KED)
amu
Hours
114.8688
114.8788
114.8888
114.8988
114.9088
114.9188
35 40 4520 25 3050 10 15
115In (STD)
amu
Hours
238.0348
238.0448
238.0548
238.0648
238.0748
238.0848
35 40 4520 25 3050 10 15
238U (KED)
amu
Hours
238.0251
238.0351
238.0401
238.0501
238.0601
238.0301
238.0451
238.0551
238.0651
238.0701
238.0751
35 40 4520 25 3050 10 15
238U (STD)
amu
Hours
Figure 6. Mass stability over 48 hours for 7Li (STD).
Figure 7. Mass stability over 48 hours for 59Co (STD).
Figure 8. Mass stability over 48 hours for 115In (STD). Figure 12. Mass stability over 48 hours for 238U (KED).
Figure 9. Mass stability over 48 hours for 238U (STD).
Figure 10. Mass stability over 48 hours for 59Co (KED).
Figure 11. Mass stability over 48 hours for 115In (KED).
Find out more at thermofisher.com/ICP-MS
For Research Use Only. Not for use in diagnostic procedures. © 2016 Thermo Fisher Scientific Inc. All rights reserved. All trademarks are the property of Thermo Fisher Scientific and its subsidiaries unless otherwise specified. TN43400-EN 1216
The vertical axis of each of the graphs has been scaled to the specification limit of the iCAP RQ ICP-MS at +/-0.025 amu per 24 hr and these show clearly that in both STD and KED modes of operation all of the masses fall well inside of the required stability limits over a period of 48 hr. This demonstrates the excellent mass stability of the iCAP RQ ICP-MS over extended time periods.
ConclusionMass stability is extremely important when making ICP-MS measurements particularly when operating in routine single point peak jumping mode to acquire data. The iCAP RQ ICP-MS has a mass stability specification of +/-0.025 amu per 24 hours. The mass stability shown in this document for both STD and KED modes over a 48 hour period across the mass range shows the instrument exceeds this requirement. The performance reports that can be acquired automatically within Qtegra ISDS Software assist the user in monitoring and validating the mass calibration for routine use. Excellent mass stability equates to good long term analytical performance and compliance to legislative methods.