Embed Size (px)
Citation preview
IBM Power Systems Performance
IBM i on Power Performance FAQ Page 1 of 98
IBM i on Power - Performance FAQ
October 9, 2018
IBM Corporation
IBM Power Systems Performance
IBM i on Power Performance FAQ Page 2 of 98
Table of Contents
INTRODUCTION ........................................................................................................................................................ 11
1.1 PURPOSE OF THIS DOCUMENT ............................................................................................................................................. 11 1.2 OVERVIEW ...................................................................................................................................................................... 11 1.3 WHAT’S NEW IN THE LATEST VERSION? ................................................................................................................................. 11 1.4 DOCUMENT RESPONSIBILITIES ............................................................................................................................................. 11
WHAT IS PERFORMANCE? ........................................................................................................................................ 12
2.1 INTRODUCTION ................................................................................................................................................................ 12 2.2 PERFORMANCE ................................................................................................................................................................ 12 2.3 RESPONSE TIME ............................................................................................................................................................... 12 2.4 THROUGHPUT .................................................................................................................................................................. 12 2.5 THROUGHPUT VERSUS RESPONSE TIME ................................................................................................................................. 12 2.6 COMPONENTS OF RESPONSE TIME ....................................................................................................................................... 13
Transaction Characteristics ................................................................................................................................ 14 IBM i Wait Buckets ............................................................................................................................................. 15 Holders and Waiters .......................................................................................................................................... 16 Call Stacks .......................................................................................................................................................... 16 Collecting and Analyzing the Data ..................................................................................................................... 17
2.7 ACCEPTABLE PERFORMANCE ............................................................................................................................................... 17
PERFORMANCE BENCHMARKS ................................................................................................................................. 18
3.1 INTRODUCTION ................................................................................................................................................................ 18 3.2 WHAT ARE PERFORMANCE BENCHMARKS? ........................................................................................................................... 18 3.3 HOW ARE IBM I SYSTEMS RATED FOR PERFORMANCE? ............................................................................................................ 18 3.4 WHAT IS THE CPW RATING OF A SYSTEM? ............................................................................................................................ 18
CPW Rating vs. Public Benchmarks .................................................................................................................... 18 3.5 COMPARING BENCHMARK RESULTS ..................................................................................................................................... 19 3.6 CUSTOM BENCHMARKS AND PROOF OF CONCEPTS (POC) ........................................................................................................ 19
Considerations ................................................................................................................................................... 20 Common Pitfalls for Custom Benchmarks .......................................................................................................... 20 IBM i Performance & Scalability Services Center ............................................................................................... 20
SIZING A SYSTEM ...................................................................................................................................................... 21
4.1 INTRODUCTION ................................................................................................................................................................ 21 4.2 SYSTEM SIZING TOOLS ....................................................................................................................................................... 21
IBM Systems Workload Estimator (WLE) ........................................................................................................... 21 IBM i Batch Model .............................................................................................................................................. 22
CAPACITY PLANNING ................................................................................................................................................ 26
5.1 IBM PERFORMANCE MANAGEMENT FOR POWER SYSTEMS ...................................................................................................... 26
PROACTIVE PERFORMANCE MONITORING ............................................................................................................... 27
6.1 INTRODUCTION ................................................................................................................................................................ 27 6.2 PERFORMANCE MONITORING BEFORE A PROBLEM OCCURS ....................................................................................................... 27
Real-time Interactive Monitoring ....................................................................................................................... 27 Dashboard .......................................................................................................................................................... 27 Automated Monitoring ...................................................................................................................................... 29 Watching for messages ...................................................................................................................................... 31
6.3 DEFINING A PERFORMANCE PROBLEM (WHAT IS SLOW?) ......................................................................................................... 31 6.4 PREPARING PERFORMANCE DATA COLLECTION....................................................................................................................... 32
IBM Power Systems Performance
IBM i on Power Performance FAQ Page 3 of 98
PERFORMANCE DATA COLLECTORS AND ANALYSIS TOOLS ....................................................................................... 33
7.1 INTRODUCTION ................................................................................................................................................................ 33 7.2 MANAGING PERFORMANCE ON IBM I .................................................................................................................................. 33 7.3 PERFORMANCE DATA COLLECTORS ...................................................................................................................................... 33
Collection Services .............................................................................................................................................. 33 IBM i Disk Watcher ............................................................................................................................................. 34 IBM i Job Watcher .............................................................................................................................................. 35 Performance Explorer (PEX) ............................................................................................................................... 35 SQL Plan Cache ................................................................................................................................................... 36
7.4 ANALYSIS TOOLS .............................................................................................................................................................. 36 Overview ............................................................................................................................................................ 36 Performance Tools for i ...................................................................................................................................... 37 IBM Navigator .................................................................................................................................................... 37 Performance Data Investigator .......................................................................................................................... 38 IBM iDoctor for IBM i ......................................................................................................................................... 40 Tools Matrix ....................................................................................................................................................... 42
FREQUENTLY ASKED QUESTIONS .............................................................................................................................. 43
8.1 INTRODUCTION ................................................................................................................................................................ 43 8.2 GENERAL QUESTIONS ........................................................................................................................................................ 43
What are the general performance tuning recommendations for best IBM i performance? ............................ 43 I heard that... something on the internet said… should I change...? .................................................................. 43 My <CPU, disk, memory> usage is high, should I add more resource? .............................................................. 43 Why didn’t the performance of my partition improve after I added <CPU, memory, disk arms, SSDs>? .......... 43 Should I update PTFs before undertaking a performance analysis project? ...................................................... 43 How can I find out which jobs are consuming the most temporary storage on my partition? .......................... 44 There are two graphical interfaces for IBM i performance data – the Performance Data Investigator (PDI) and
iDoctor. Which should I use? ........................................................................................................................................... 44 What is the job QDBFSTCCOL running on my partition and why is it taking resources? .................................... 45
8.3 CPU QUESTIONS .............................................................................................................................................................. 46 How can I reduce CPU usage on the partition? .................................................................................................. 46 What can I do if I can’t reduce my CPU consumption? ...................................................................................... 46 Why does my partition’s CPU utilization show a value greater than 100%? ..................................................... 46 Why doesn’t the System CPU utilization equal the sum of the CPU utilization of the individual jobs in
WRKACTJOB? .................................................................................................................................................................... 47 How can I keep certain workloads from impacting my whole partition? .......................................................... 47 The performance of my system is inconsistent. What could cause that? ......................................................... 47 Why do I see CPU queuing time when my CPU utilization is not excessive? ...................................................... 48
8.4 MEMORY QUESTIONS ....................................................................................................................................................... 48 How should I configure my partition’s memory pools? ...................................................................................... 48 Should I turn on the Performance Adjuster (QPFRADJ)? .................................................................................... 48 How can I tell what is in my partition’s memory pools? .................................................................................... 49 When should I add more memory to my partition? ........................................................................................... 49 What are the "Memory page fault guidelines"? ................................................................................................ 49
8.5 I/O QUESTIONS ............................................................................................................................................................... 49 What are some common disk subsystem configuration changes that can hurt performance? ......................... 49 How can I analyze I/O subsystem performance? ............................................................................................... 49 I can’t modify my applications. What can I do to improve my I/O performance? ............................................ 49 How do I virtualize IBM Serial-Attached SCSI (SAS) adapters for the best performance? .................................. 50 How can I tell if my applications will benefit from SSDs? ................................................................................... 50 How many and what type of storage I/O products will meet performance requirements for an upgrade or new
system or workload? ........................................................................................................................................................ 50
IBM Power Systems Performance
IBM i on Power Performance FAQ Page 4 of 98
How can I tell if a FlashSystem solution is the best storage configuration for my environment? ...................... 50 How do I analyze I/O performance if I’m using external storage? ..................................................................... 51 What are the IBM i performance effects of using 4096 byte sector drives? ...................................................... 52
8.6 HOW DO I TUNE IBM I DATABASE PERFORMANCE? ................................................................................................................. 52 8.7 HOW CAN I IMPROVE BACKUP AND RECOVERY TIMES? ............................................................................................................. 52 8.8 HOW CAN I IMPROVE IPL TIME? .......................................................................................................................................... 52 8.9 WHAT ARE CONSIDERATIONS FOR MAIN STORE DUMP (MSD) IPL PERFORMANCE? ...................................................................... 53 8.10 HOW DO I TUNE JOURNAL AND RECOVERY PERFORMANCE? .................................................................................................. 53 8.11 HOW DO I TUNE ACCESS PATH RECOVERY PERFORMANCE? ................................................................................................... 53 8.12 HOW DO I TUNE NETWORK PERFORMANCE?...................................................................................................................... 54 8.13 HOW CAN I IMPROVE THE PERFORMANCE OF JAVA AND/OR WEBSPHERE APPLICATION SERVER APPLICATIONS? ............................. 55 8.14 HOW DO I TUNE RPG/COBOL APPLICATION PERFORMANCE AND NATIVE I/O FILE ACCESS?....................................................... 55 8.15 CAN SECURITY SETTINGS AFFECT PERFORMANCE? ............................................................................................................... 56 8.16 WHAT ARE SOME INEFFICIENT APPLICATION ISSUES I CAN IDENTIFY AT A SYSTEM LEVEL? ............................................................. 56
Look for high rates of database full opens .................................................................................................... 56 Look for high rates of activation group creates/destroys ............................................................................. 57
8.17 WHAT IS THE LARGEST NUMBER OF CORES THAT CAN BE ASSIGNED TO AN IBM I PARTITION? ...................................................... 57 8.18 HOW CAN I IMPROVE THE SCALABILITY OF MY LARGE IBM I PARTITION? ................................................................................. 58 8.19 WHERE CAN I FIND MORE INFORMATION ON PERFORMANCE TUNING? ................................................................................... 59 8.20 IBM LAB SERVICES AND TRAINING .................................................................................................................................. 59
DATABASE PERFORMANCE ....................................................................................................................................... 60
9.1 SQL PERFORMANCE TIPS ................................................................................................................................................... 60 9.2 IMPROVING THE PERFORMANCE OF PROGRAMS THAT UTILIZE NATIVE DATABASE ACCESS ................................................................. 60 9.3 TAKE ADVANTAGE OF PERFORMANCE IMPROVEMENTS IN DB2 FOR I ........................................................................................... 60 9.4 MORE INFORMATION ABOUT THE LATEST DB2 FOR I PERFORMANCE IMPROVEMENTS ..................................................................... 60 9.5 LEVERAGE DATABASE PERFORMANCE TOOLS ......................................................................................................................... 60 9.6 MORE INFORMATION ON DB2 FOR I PERFORMANCE AND SUPPORT ............................................................................................. 66
IBM I SERVICES ......................................................................................................................................................... 67
10.1 INTRODUCTION ........................................................................................................................................................... 67 10.2 IBM I SERVICES CURRENTLY AVAILABLE............................................................................................................................. 67 10.3 DB2 FOR I SERVICES CURRENTLY AVAILABLE....................................................................................................................... 68 10.4 IBM I ACCESS CLIENT SOLUTIONS ................................................................................................................................... 68 10.5 FOR MORE INFORMATION: ............................................................................................................................................. 70
RPG/COBOL AND NATIVE I/O ................................................................................................................................... 71
11.1 INTRODUCTION ........................................................................................................................................................... 71 11.2 CPU PERFORMANCE TIPS .............................................................................................................................................. 71
Compiler Options ........................................................................................................................................... 71 Profiling ......................................................................................................................................................... 71
11.3 IO PERFORMANCE TIPS ................................................................................................................................................. 72 General tips ................................................................................................................................................... 72 Database modernization ............................................................................................................................... 72
C PROGRAM COMPILER OPTIMIZATION ................................................................................................................... 73
12.1 IBM I ARCHITECTURE – MI INTERFACE ............................................................................................................................ 73 12.2 IBM I PROGRAM CREATION ........................................................................................................................................... 74 12.3 COMPILER OPTION - OPTIMIZE ..................................................................................................................................... 74 12.4 PROGRAM PROFILING ................................................................................................................................................... 75 12.5 ADVANCED ARGUMENT OPTIMIZATION ............................................................................................................................ 76 12.6 INTERPROCEDURAL ANALYSIS (IPA) ................................................................................................................................. 76
IBM Power Systems Performance
IBM i on Power Performance FAQ Page 5 of 98
JAVA AND WEBSPHERE ............................................................................................................................................. 78
13.1 INTRODUCTION ........................................................................................................................................................... 78 13.2 DOES IT MATTER IF I USE THE 32-BIT VERSUS 64-BIT JVM? ................................................................................................. 78 13.3 I’M USING AN OLD JDK LEVEL AND AM BEHIND ON PTFS, IS THAT OKAY? ................................................................................ 78 13.4 SHOULD I RUN MY JVMS IN A SEPARATE MEMORY POOL? .................................................................................................... 78 13.5 HOW DO I DETERMINE THE PROPER GC SETTINGS (HEAP SIZES, COLLECTION POLICY, ETC.) FOR MY APPLICATION? ........................... 78 13.6 HOW DO I ANALYZE JVM DUMPS AND VERBOSE GC OUTPUT? .............................................................................................. 79 13.7 HOW DO I TUNE JAVA CODE? ......................................................................................................................................... 79 13.8 WHERE CAN I GET MORE INFORMATION ON JAVA TUNING AND DEBUGGING? .......................................................................... 79 13.9 CAN I USE JOB WATCHER TO COLLECT JAVA INFORMATION? ................................................................................................. 79 13.10 HOW CAN I IMPROVE THE PERFORMANCE OF WEBSPHERE APPLICATION SERVER RUNNING ON IBM I? ......................................... 79 13.11 HOW DO I TUNE IBM TOOLBOX FOR JAVA PERFORMANCE? ................................................................................................. 79 13.12 WHERE CAN I FIND ADDITIONAL INFORMATION? ................................................................................................................ 79
POWER SYSTEMS ...................................................................................................................................................... 80
14.1 INTRODUCTION ........................................................................................................................................................... 80 14.2 SIMULTANEOUS MULTITHREADING (SMT) AND INTELLIGENT THREADS .................................................................................. 80
Single thread (ST) versus SMT2/SMT4/SMT8 ................................................................................................ 80 Intelligent Threads Technology ..................................................................................................................... 80
14.3 FLEXIBLE SMT CONTROLS ............................................................................................................................................. 81 Processor Compatibility Mode ...................................................................................................................... 81 QPRCMLTTSK System Value .......................................................................................................................... 82 QWCCHGPR API ............................................................................................................................................. 83
14.4 MEMORY CONSIDERATIONS ........................................................................................................................................... 84 14.5 POWER7 TURBOCORE ................................................................................................................................................ 84 14.6 POWER SAVINGS MODE ................................................................................................................................................ 84 14.7 ADAPTER PLACEMENT .................................................................................................................................................. 85 14.8 AFFINITIZED PARTITIONS ............................................................................................................................................... 85 14.9 SYSTEM AFFINITY SETTINGS ........................................................................................................................................... 86 14.10 IBM POWERVP VIRTUALIZATION PERFORMANCE .............................................................................................................. 86 14.11 COLLECTING AND VIEWING PERFORMANCE DATA FOR ENTIRE PHYSICAL SYSTEM ..................................................................... 87
Viewing Performance Data for Multiple Systems - Nagios ........................................................................... 89 14.12 POWER8 REDBOOKS .................................................................................................................................................. 90
VIRTUALIZATION ...................................................................................................................................................... 91
15.1 VIRTUALIZATION BEST PRACTICES ................................................................................................................................... 91 15.2 DYNAMIC PLATFORM OPTIMIZER (DPO) .......................................................................................................................... 91 15.3 VIOS ADVISOR ........................................................................................................................................................... 91 15.4 IDOCTOR POWER CONNECTIONS – VIOS INVESTIGATOR ..................................................................................................... 92
REPORTING A PERFORMANCE PROBLEM .................................................................................................................. 93
16.1 INTRODUCTION ........................................................................................................................................................... 93 16.2 DEFINE THE PERFORMANCE PROBLEM ............................................................................................................................. 93 16.3 QUESTIONS THAT HELP IBM DIAGNOSE THE PROBLEM ........................................................................................................ 93
REFERENCES ............................................................................................................................................................. 95
17.1 BLOGS ON PERFORMANCE TOPICS ................................................................................................................................... 95 17.2 EDUCATION AND TRAINING ............................................................................................................................................ 95 17.3 REDBOOKS AND REDPAPERS ........................................................................................................................................... 95 17.4 ADDITIONAL PERFORMANCE RELATED INFORMATION .......................................................................................................... 96 17.5 DATABASE PERFORMANCE ARTICLES................................................................................................................................ 96 17.6 KEY PERFORMANCE RESOURCES ..................................................................................................................................... 97
IBM Power Systems Performance
IBM i on Power Performance FAQ Page 6 of 98
17.7 PERFORMANCE CAPABILITIES REFERENCE NOTE ................................................................................................................. 97
IBM Power Systems Performance
IBM i on Power Performance FAQ Page 7 of 98
Table of Figures
Figure 1 - Batch model ............................................................................................................................. 23 Figure 2 - Measured Resource Utilization ................................................................................................ 23 Figure 3 - Modeled Resource Utilization.................................................................................................. 24
Figure 4 - Batch Model Result .................................................................................................................. 24 Figure 5 - IBM Navigator for i Dashboard Menu ..................................................................................... 28 Figure 6 - IBM Navigator for i Dashboard ............................................................................................... 28 Figure 7 - IBM Navigator for i Dashboard Details ................................................................................... 29 Figure 8 - IBM Navigator for i System Monitors ..................................................................................... 30
Figure 9 - Visualize Monitor Data ............................................................................................................ 30 Figure 10 - Collector data characteristics ................................................................................................. 36
Figure 11 - Performance Data Investigator ............................................................................................... 38
Figure 12 - Performance Data Investigator example ................................................................................ 39 Figure 13 - Graph History example .......................................................................................................... 40 Figure 14 - iDoctor components ............................................................................................................... 41 Figure 15 - iDoctor example ..................................................................................................................... 41
Figure 16 - Relationship between collector and major functions / interfaces ........................................... 42 Figure 17 - Temporary Storage Used........................................................................................................ 44
Figure 18 – PDI and iDoctor feature comparison ..................................................................................... 45 Figure 19 - Network Link Aggregation .................................................................................................... 55 Figure 20 - Full Opens in iDoctor Collection Services Investigator ........................................................ 56
Figure 21 - Activation Groups Created in iDoctor Collection Services Investigator ............................... 57 Figure 22 - Maximum Cores in Partition .................................................................................................. 58
Figure 23 - SQL Performance Center ....................................................................................................... 61 Figure 24 - SQL Plan Cache ..................................................................................................................... 61
Figure 25 - SQL Database Monitor .......................................................................................................... 62 Figure 26 - Index Advisor ......................................................................................................................... 62
Figure 27 - Database Analysis – Visual Explain ...................................................................................... 63 Figure 28 - PDI Database Menu ............................................................................................................... 64 Figure 29 - PDI Physical Database I/O by Job or Task ............................................................................ 64
Figure 30 - PDI - Collection Services Menu ............................................................................................ 65 Figure 31 - Collection Services - Query Opens Chart .............................................................................. 65 Figure 32 - IBM i Access Client Solutions - IBM i Services Examples ................................................... 69
Figure 33 - IBM i Access Client Solutions – Active Job Info .................................................................. 70 Figure 34 - IBM i Architecture – MI Interface ......................................................................................... 73
Figure 35 - IBM i Program Creation......................................................................................................... 74 Figure 36- Processor Compatibility Mode – HMC Classic GUI .............................................................. 82 Figure 37 - Partition Placement ................................................................................................................ 85 Figure 38 - PowerVP ................................................................................................................................ 87 Figure 39 - Partition Properties – HMC Classic GUI ............................................................................... 88
Figure 40 - PDI Physical System Menu .................................................................................................... 88 Figure 41 - Logical Partitions Overview .................................................................................................. 89 Figure 42 - iDoctor System Graphs .......................................................................................................... 89
IBM Power Systems Performance
IBM i on Power Performance FAQ Page 8 of 98
Preface
This document is intended to address most frequently asked questions concerning IBM i performance on
Power Systems, and provide best practice guidelines for most commonly seen performance issues.
The following is a list of key IBM® reference and documents. The References section contains
additional references.
• The End to End Performance Management on IBM i Redbook provides a comprehensive set of
performance tips and guidance with focus on monitoring and managing IBM i system performance:
End to End Performance Management on IBM i Redbook
• The POWER7 Virtualization Best Practice Guide, available on developerWorks, provides detailed
best practices for POWER7 virtualization:
POWER7 Virtualization Best Practice Guide
• The Performance Optimization and Tuning Techniques for IBM Power Systems Processors
Including IBM POWER8 Redbook provides performance information including specific tuning for
POWER8.
Perf Optimization & Tuning Techniques Including IBM POWER8 Redbook
• Knowledge Center has a section on performance:
https://www.ibm.com/support/knowledgecenter/ssw_ibm_i_73/rzahx/rzahx1.htm
• As well as this subsection on Managing System Performance: https://www.ibm.com/support/knowledgecenter/ssw_ibm_i_73/rzahx/rzahxmngparent.htm
• IBM developerWorks provides a wide variety of information on topics for IBM i including
performance:
http://www.ibm.com/developerworks/ibmi/
• You can also use the IBM developerWorks resource to provide information on IBM i performance
tools topics:
developerWorks - Performance Tools
IBM Power Systems Performance
IBM i on Power Performance FAQ Page 9 of 98
Acknowledgements
We would like to thank the many people who made invaluable contributions to this document.
Contributions included authoring, insights, ideas, reviews, critiques and reference documents
Our special thanks to key contributors from IBM Power Systems Performance:
Clark Anderson – I/O Performance
Allan Johnson – IBM i Performance
Dirk Michel – Linux Performance
Rick Peterson – IBM i Performance
Our special thanks to key contributors from IBM i Development Support:
Scott Forstie – IBM i Development
Chris Francois – IBM i Development
Lora Powell – IBM i Development
Shauna Rollings – IBM i Development
Our special thanks to key contributors from IBM i Global Support Center:
Brad Menges – IBM i Performance
Our special thanks to key contributors from IBM Lab Services Power Systems Delivery Practice:
Eric Barsness – IBM i Performance
Stacy Benfield – IBM i Performance
Terry Ford – IBM i Security
Dawn May – IBM i Performance
Cindy Mestad – PaSS Center
IBM Power Systems Performance
IBM i on Power Performance FAQ Page 10 of 98
Disclaimer – Performance FAQ
Copyright © 2018 by International Business Machines Corporation.
No part of this document may be reproduced or transmitted in any form without written permission from IBM Corporation.
Product data has been reviewed for accuracy as of the date of initial publication. Product data is subject to change without notice. This information may include technical inaccuracies or typographical errors. IBM may make improvements and/or changes in the product(s) and/or programs(s) at any time without notice. References in this document to IBM products, programs, or services does not imply that IBM intends to make such products, programs or services available in all countries in which IBM operates or does business. THE INFORMATION PROVIDED IN THIS DOCUMENT IS DISTRIBUTED "AS IS" WITHOUT ANY WARRANTY, EITHER EXPRESS OR IMPLIED. IBM EXPRESSLY DISCLAIMS ANY WARRANTIES OF MERCHANTABILITY, FITNESS FOR A PARTICULAR PURPOSE OR NON-INFRINGEMENT. IBM shall have no responsibility to update this information. IBM products are warranted according to the terms and conditions of the agreements (e.g., IBM Customer Agreement, Statement of Limited Warranty, International Program License Agreement, etc.) under which they are provided. IBM is not responsible for the performance or interoperability of any non-IBM products discussed herein.
The performance data contained herein was obtained in a controlled, isolated environment. Actual results that may be obtained in other operating environments may vary significantly. While IBM has reviewed each item for accuracy in a specific situation, there is no guarantee that the same or similar results will be obtained elsewhere. Statements regarding IBM’s future direction and intent are subject to change or withdrawal without notice, and represent goals and objectives only. The provision of the information contained herein is not intended to, and does not, grant any right or license under any IBM patents or copyrights. Inquiries regarding patent or copyright licenses should be made, in writing, to:
IBM Director of Licensing IBM Corporation North Castle Drive Armonk, NY 10504-1785 U.S.A.
IBM Power Systems Performance
IBM i on Power Performance FAQ Page 11 of 98
Introduction
1.1 Purpose of this document The purpose of this document is to provide a basic understanding of IBM i on Power Systems
performance concepts, workloads and benchmarks on Power Systems, capacity planning, performance
monitoring and analysis, frequently asked questions and guidelines addressing common performance
issues.
This document is not intended to replace performance management documentation or performance white
papers.
1.2 Overview This document covers a variety of Power Systems performance including:
• What Is Performance?
• Performance Benchmarks
• Sizing a System and Capacity Planning
• Performance Tools
• Performance Analysis and Tuning
• Frequently Asked Questions
• POWER8 and Virtualization Performance
• Reporting a Performance Problem
1.3 What’s new in the latest version? Several new sections were added or changed in this version:
1. Frequently Asked Questions updates
2. Links refreshed
1.4 Document Responsibilities The IBM STG Power Systems Performance organization is responsible for editing and maintaining the
IBM i on Power - Performance FAQ document. Any contributions or suggestions for additions or edits
should be forwarded to Stacy Benfield, [email protected].
IBM Power Systems Performance
IBM i on Power Performance FAQ Page 12 of 98
What Is Performance?
2.1 Introduction The purpose of this chapter is to explain what exactly computer performance is.
2.2 Performance Computer performance is largely determined by a combination of response time and throughput. Other
aspects associated with computer performance are availability of computer systems and their power
efficiency.
2.3 Response Time The response time of a computer system is the elapsed time between the end of a transaction inquiry or
demand and the beginning of a response to that transaction. For interactive users, the response time is
the time from when the user hits the <enter> button to seeing the result displayed. The response time
often is seen as a critical aspect of performance because of its potential visibility to end users or
customers.
Let’s take the example of a computer system that is running a web server with an online store. The
response time here is the elapsed time between pressing the submit button to place an order and the
beginning of receiving the order confirmation.
2.4 Throughput The throughput of a computer system is a measure of the amount of work performed by a computer
system over the period of time. Examples for throughput are megabytes per second read from a disk,
database transactions per minute, megabytes transmitted per second through a network adapter.
Let’s go back to the previous example with the online store. The computer system on which the online
store is running might be one out of many computers that are all connected to the same database server.
While response time of the database server is an important factor, its throughput may be more important
because it processes many requests from the web servers in parallel.
2.5 Throughput versus Response Time Throughput and response time are related. As system resources (processors, memory, disk, etc.) are
used by multiple, simultaneous transactions, there may be delays to individual transactions due to the
fact that other transactions are using those particular resources when they are demanded and the request
for processing is temporarily delayed. System resources that are shared can cause transactions that rely
on these resources to incur a response time increase due to this queuing.
However, POWER systems are designed for high performance sharing. As transaction load increases on
the system, throughput increases. It follows that, as resource queuing increases, response time will
increase too. Therefore, high throughput may come at the cost of slower response times.
Let’s assume you load a truck with 10,000 1TB disks, drive the truck 30 miles and unload the disks
within one hour. The throughput would be 2.8TB per second but at the cost of the response time which
would be an hour.
IBM Power Systems Performance
IBM i on Power Performance FAQ Page 13 of 98
Now take a sports car instead of a truck. It’s unlikely that 10,000 disks would fit into a small car, so let’s
assume we can load 100 1TB disks, drive the sports car 30 miles and unload the disks within 20
minutes. The response time now is three times better compared to the truck, however, the throughput
reduced to 0.083TB per second.
2.6 Components of Response Time Wait Accounting is the patented technology built into the IBM® i operating system that tells you what a
thread or task is doing when it appears that it is not doing anything. When a thread or task is not
executing, it is waiting. Wait accounting, a concept exclusive to IBM i, is a very powerful capability for
detailed performance analysis. The following information is going to focus on waiting, why threads
wait, and how you can use wait accounting to troubleshoot performance problems or to simply improve
the performance of your applications.
A job is the basic mechanism through which work is done. Every job has at least one thread and may
have multiple threads. Every thread is represented by a licensed internal code (LIC) task, but tasks also
exist without the IBM i thread-level structures. LIC tasks are generally not visible externally except
through the IBM i Performance or Service Tools. Wait accounting concepts apply to both threads and
tasks, thus, the terms thread and task are used when referring to an executable piece of work.
A thread or task has two basic states it can be in:
• Executing on the processor. This is the "running" state.
• Waiting
There are three key wait conditions:
• Ready to run, waiting for the processor. This is a special wait state and is generally referred to
as "CPU Queuing.” This means the thread or task is queued and is waiting to run on the CPU.
There are a few different reasons that CPU queuing can occur. An example could be if the
partition is overloaded and there is more work than the partition can accommodate, then work
can be queued to wait for the CPU. This can be compared to a highway that has ramp meters;
when the highway is congested, the ramp meters have a red signal so that the cars have to stop
and wait before they can enter traffic. Logical partitioning and simultaneous multithreading can
also result in CPU queuing.
• Idle waits. Idle waits are a normal and expected wait condition. Idle waits occur when the thread
is waiting for external input. This input may come from a user, the network, or another
application. Until that input is received, there is no work to be done.
• Blocked waits. Blocked waits are a result of serialization mechanisms to synchronize access to
shared resources. Blocked waits may be normal and expected. Examples include serialized
access to updating a row in a table, disk I/O operations, or communications I/O operations.
However, blocked waits may not be normal and it is these unexpected block points that are
situations where wait accounting can be used to analyze the wait conditions.
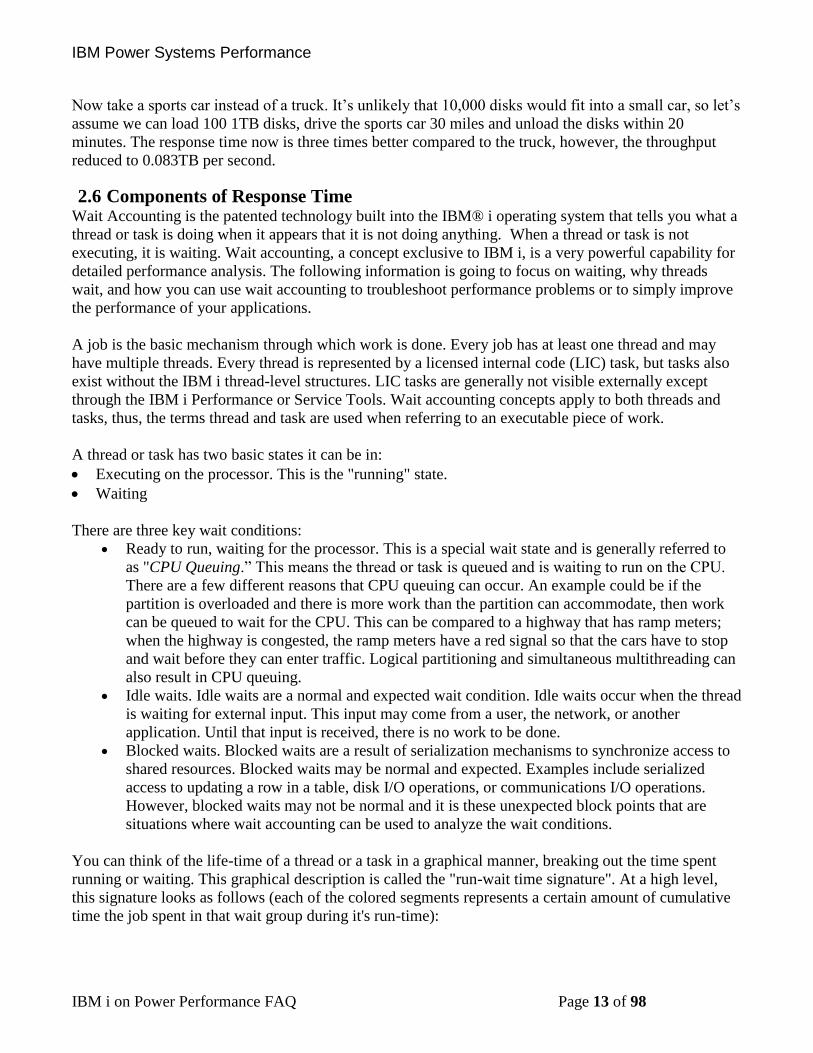
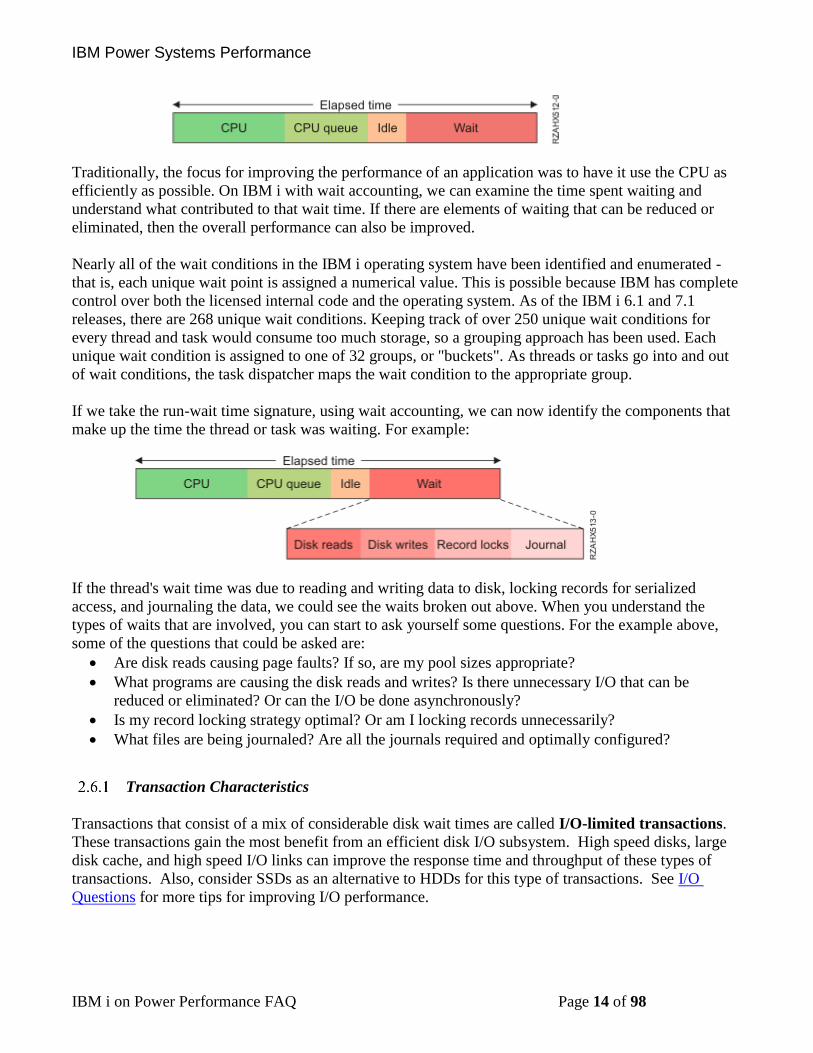
You can think of the life-time of a thread or a task in a graphical manner, breaking out the time spent
running or waiting. This graphical description is called the "run-wait time signature". At a high level,
this signature looks as follows (each of the colored segments represents a certain amount of cumulative
time the job spent in that wait group during it's run-time):
IBM Power Systems Performance
IBM i on Power Performance FAQ Page 14 of 98
Traditionally, the focus for improving the performance of an application was to have it use the CPU as
efficiently as possible. On IBM i with wait accounting, we can examine the time spent waiting and
understand what contributed to that wait time. If there are elements of waiting that can be reduced or
eliminated, then the overall performance can also be improved.
Nearly all of the wait conditions in the IBM i operating system have been identified and enumerated -
that is, each unique wait point is assigned a numerical value. This is possible because IBM has complete
control over both the licensed internal code and the operating system. As of the IBM i 6.1 and 7.1
releases, there are 268 unique wait conditions. Keeping track of over 250 unique wait conditions for
every thread and task would consume too much storage, so a grouping approach has been used. Each
unique wait condition is assigned to one of 32 groups, or "buckets". As threads or tasks go into and out
of wait conditions, the task dispatcher maps the wait condition to the appropriate group.
If we take the run-wait time signature, using wait accounting, we can now identify the components that
make up the time the thread or task was waiting. For example:
If the thread's wait time was due to reading and writing data to disk, locking records for serialized
access, and journaling the data, we could see the waits broken out above. When you understand the
types of waits that are involved, you can start to ask yourself some questions. For the example above,
some of the questions that could be asked are:
• Are disk reads causing page faults? If so, are my pool sizes appropriate?
• What programs are causing the disk reads and writes? Is there unnecessary I/O that can be
reduced or eliminated? Or can the I/O be done asynchronously?
• Is my record locking strategy optimal? Or am I locking records unnecessarily?
• What files are being journaled? Are all the journals required and optimally configured?
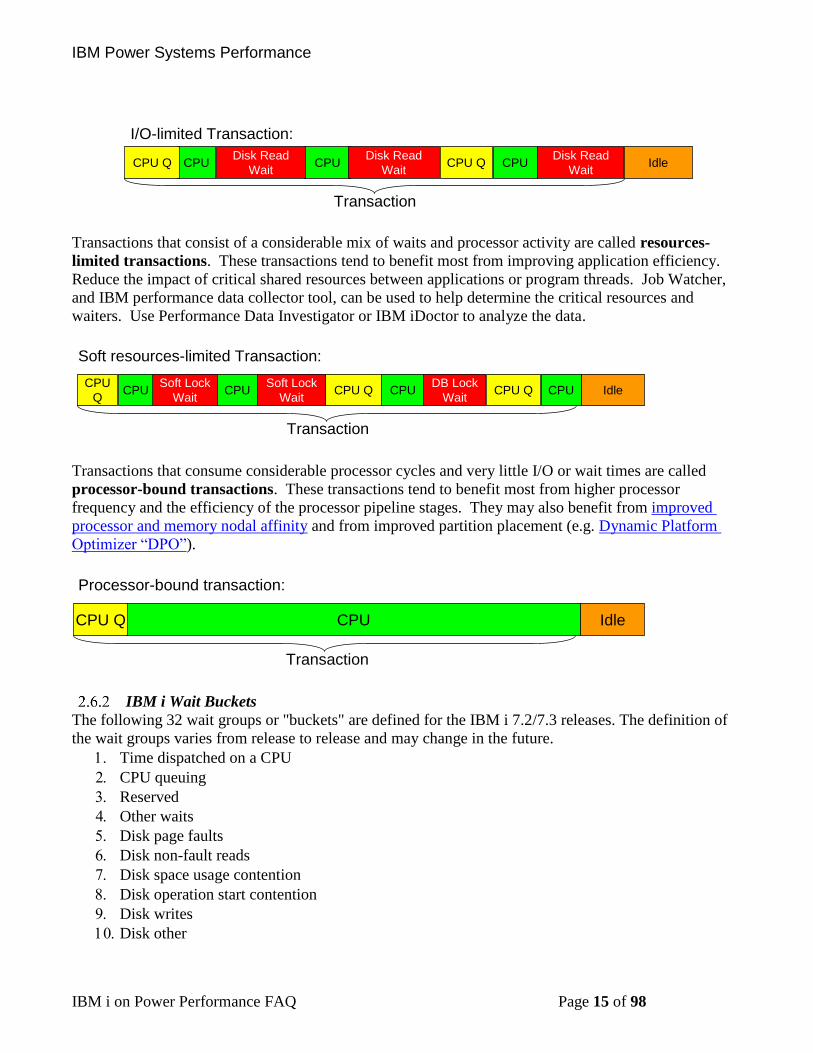
Transaction Characteristics
Transactions that consist of a mix of considerable disk wait times are called I/O-limited transactions.
These transactions gain the most benefit from an efficient disk I/O subsystem. High speed disks, large
disk cache, and high speed I/O links can improve the response time and throughput of these types of
transactions. Also, consider SSDs as an alternative to HDDs for this type of transactions. See I/O
Questions for more tips for improving I/O performance.
IBM Power Systems Performance
IBM i on Power Performance FAQ Page 15 of 98
Transactions that consist of a considerable mix of waits and processor activity are called resources-
limited transactions. These transactions tend to benefit most from improving application efficiency.
Reduce the impact of critical shared resources between applications or program threads. Job Watcher,
and IBM performance data collector tool, can be used to help determine the critical resources and
waiters. Use Performance Data Investigator or IBM iDoctor to analyze the data.
Transactions that consume considerable processor cycles and very little I/O or wait times are called
processor-bound transactions. These transactions tend to benefit most from higher processor
frequency and the efficiency of the processor pipeline stages. They may also benefit from improved
processor and memory nodal affinity and from improved partition placement (e.g. Dynamic Platform
Optimizer “DPO”).
IBM i Wait Buckets
The following 32 wait groups or "buckets" are defined for the IBM i 7.2/7.3 releases. The definition of
the wait groups varies from release to release and may change in the future.
Time dispatched on a CPU
CPU queuing
Reserved
Other waits
Disk page faults
Disk non-fault reads
Disk space usage contention
Disk operation start contention
Disk writes
Disk other
Processor-bound transaction:
CPUCPU Q Idle
Transaction
Soft Lock
WaitCPU
CPU
QCPU CPU Idle
Transaction
CPU Q CPUCPU QSoft Lock
Wait
DB Lock
Wait
Soft resources-limited Transaction:
CPUCPU Q CPU CPUDisk Read
WaitIdle
Transaction
CPU QDisk Read
Wait
Disk Read
Wait
I/O-limited Transaction:
IBM Power Systems Performance
IBM i on Power Performance FAQ Page 16 of 98
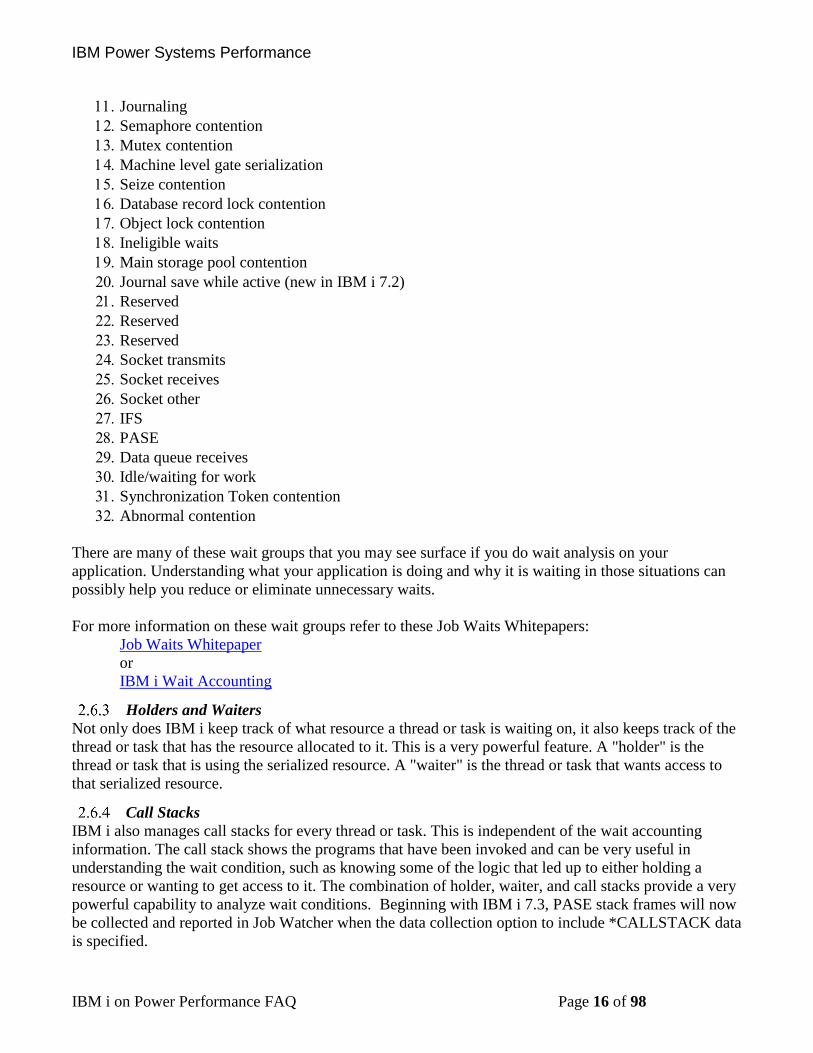
Journaling
Semaphore contention
Mutex contention
Machine level gate serialization
Seize contention
Database record lock contention
Object lock contention
Ineligible waits
Main storage pool contention
Journal save while active (new in IBM i 7.2)
Reserved
Reserved
Reserved
Socket transmits
Socket receives
Socket other
IFS
PASE
Data queue receives
Idle/waiting for work
Synchronization Token contention
Abnormal contention
There are many of these wait groups that you may see surface if you do wait analysis on your
application. Understanding what your application is doing and why it is waiting in those situations can
possibly help you reduce or eliminate unnecessary waits.
For more information on these wait groups refer to these Job Waits Whitepapers:
Job Waits Whitepaper
or
IBM i Wait Accounting
Holders and Waiters
Not only does IBM i keep track of what resource a thread or task is waiting on, it also keeps track of the
thread or task that has the resource allocated to it. This is a very powerful feature. A "holder" is the
thread or task that is using the serialized resource. A "waiter" is the thread or task that wants access to
that serialized resource.
Call Stacks
IBM i also manages call stacks for every thread or task. This is independent of the wait accounting
information. The call stack shows the programs that have been invoked and can be very useful in
understanding the wait condition, such as knowing some of the logic that led up to either holding a
resource or wanting to get access to it. The combination of holder, waiter, and call stacks provide a very
powerful capability to analyze wait conditions. Beginning with IBM i 7.3, PASE stack frames will now
be collected and reported in Job Watcher when the data collection option to include *CALLSTACK data
is specified.
IBM Power Systems Performance
IBM i on Power Performance FAQ Page 17 of 98
Collecting and Analyzing the Data
Collection Services and Job Watcher are two performance data collection mechanisms on IBM i that
collect the wait accounting information. Job Watcher also collects holder and waiter information, as well
as call stacks. Once the performance data has been collected, you can graphically analyze the data. The
iDoctor product has a Windows® client for graphically viewing performance data. And in IBM i 6.1 and
later releases, IBM Navigator for i (previously known as IBM Systems Director Navigator for i) web
console has the Performance Data Investigator feature to graphically view performance data through a
web browser interface.
2.7 Acceptable Performance It is best to evaluate performance of a system through objective measurements, for example through
application log files, or batch job run times. Acceptable performance is based on customer
expectations. Expectations can be based on benchmarks, modeling, or experience. But if the actual users
of the system feel that the response time or throughput is unacceptable, this is a key indication of a
problem. Incorrect assumptions when architecting a system may create a situation where acceptable
performance cannot be attained.
IBM Power Systems Performance
IBM i on Power Performance FAQ Page 18 of 98
Performance Benchmarks
3.1 Introduction This chapter covers the performance benchmarks and how they should be used to compare system
performance.
3.2 What Are Performance Benchmarks? Performance benchmarks are well defined tests that serve as a basis to evaluate and compare the
performance of computer systems. Performance benchmark tests use representative sets of programs and
data designed to evaluate the performance of computer hardware and software in a given configuration.
3.3 How are IBM i systems rated for performance? IBM publishes Commercial Processing Workload (CPW) ratings for all IBM i systems to help
customers compare the relative throughput capacity of systems.
3.4 What is the CPW rating of a system? The CPW rating of a system is generated using measurements of a specific workload that is maintained
internally within the IBM i Systems Performance group. The CPW rating is designed to evaluate a
computer system and associated software in the commercial environment. It is rigidly defined as a
relative capacity metric for rough model comparisons and relative CPU consumption. It is NOT
representative of any specific environment, but it is generally applicable to the commercial computing
environment.
What the CPW rating is:
• Test of a range of database applications, including various complexity updates and various
complexity queries with commitment control and journaling
• Test of concurrent data access by users running a single group of programs.
• Reasonable approximation of a steady-state, database oriented commercial application’s
relative performance.
What the CPW rating is not:
• An indication of the performance capabilities of a system for any specific customer situation
• A test of “ad-hoc” (query) database performance
• A test of single-threaded (batch) application throughput (e.g. batch processing steps per
minute)
• A test of single-threaded (batch) application run time or “batch window” (e.g. job completes
in 4 hour batch window)
When to use the CPW rating results:
• Approximate product positioning between different systems running IBM i where the
primary application is expected to be oriented to traditional commercial business uses (order
entry, payroll, billing, etc.).
• The CPW metric should be used in terms of the system capacity potential (throughput) and
not in terms of response time of a transaction, batch job, or query.
CPW Rating vs. Public Benchmarks
Specific choices were made in creating the CPW rating to try to best represent the relative positioning of
IBM Power Systems Performance
IBM i on Power Performance FAQ Page 19 of 98
IBM i systems. Some of the differences between the CPW rating and public benchmarks are:
• The code base for public benchmarks is constantly changing to try to obtain the best possible results,
while an attempt is made to keep the base for the CPW rating as constant as possible to better
represent relative improvements from release to release and system to system.
• Public benchmarks typically do not require full security, but since IBM customers tend to run on
secure systems, Security Level 50 is specified for the CPW rating.
• Public benchmarks are optimized to obtain the best possible results for that specific benchmark,
whereas for the CPW rating we tend to use more of the system defaults to better represent the way
the system is shipped to our customers.
• Public benchmarks can use different applications for different sized systems and take advantage of
all of the resources available on a particular system, while the CPW rating has been designed to run
as the same application at all levels with approximately the same disk and memory resources per
simulated user on all systems
• Public benchmarks require extensive, sophisticated driver and middle tier configurations. In order to
simplify the environment and add a small computational component into the workload, all the
required components to drive the CPW rating have been included as a part of the overall workload.
The net result is that the CPW rating is an application model that IBM believes provides an excellent
indicator of multi-user transaction processing performance capacity when comparing between members
of the IBM i system families. As indicated above, the CPW rating is not intended to be a guarantee of
performance, but can be viewed as a good indicator for multi-user transaction processing workloads
3.5 Comparing Benchmark Results When comparing performance benchmark results it is important to compare “apples-to-apples” by
comparing the results of the same performance benchmark test(s). The result of one benchmark test
often does not represent the performance of a computer system for another workload.
For example, the result of a floating point intensive benchmark test doesn’t provide any information
about the performance of the same computer running an integer intensive benchmark or an OLTP
workload and vice versa.
A common pitfall in setting the wrong performance expectations is to look at the results of one
performance benchmark and apply it to another workload. For example, if the performance of an OLTP
workload improved by 50% when upgrading from Machine A to Machine B, it would be invalid to
assume that a Compute Intensive workload would see the same improvement. Likewise, it would be
invalid to assume that a single threaded workload improvement would necessarily translate into the
same OLTP workload improvement.
3.6 Custom Benchmarks and Proof of Concepts (PoC) Custom benchmarks are often used when a customer needs to confirm the sizing requirements of a
specific application on specific hardware configurations. This may be the case when sizing tools do not
provide the level of confidence needed to make purchase decisions. Many times this involves testing
application scalability on multiple hardware configurations.
Custom benchmarks can range in complexity. They can be as simple as a test of end-of-day batch
processing, or as complex as simulating thousands of online users accessing a multi-tiered web
application.
When a custom benchmark is performed to measure the performance of a computer system for a
customer production workload it is important that the benchmark test represents the real workload to get
meaningful data.

IBM Power Systems Performance
IBM i on Power Performance FAQ Page 20 of 98
For example, running a single database job at a time on an otherwise idle database server provides good
information about the performance of the database server under best possible conditions. However, it
does not provide any information about the performance of this database job when the server is under
medium or heavy production workload.
Considerations
When doing a custom benchmark or Proof of Concept (PoC) it is important that the test be constructed
to simulate the production environment. This is especially true as the hardware continues to evolve into
the multi-core era and more time is being invested in the cache/memory hierarchy.
Common Pitfalls for Custom Benchmarks
The most common pitfall when running a custom benchmark or a proof of concept is that the benchmark
test does not simulate the real production environment and the benchmark result does not represent the
performance the system will achieve in the production environment. The achieved benchmark result
might be much better for the benchmark test than for the real production workload which most likely
would lead to performance problems later on when running the real workload. It also could be the other
way around potentially causing delays or failure of the PoC.
IBM i Performance & Scalability Services Center
The IBM i Performance & Scalability Services Center in Rochester, MN can provide facilities, hardware
and technical expertise to assist you with a custom benchmark or Proof of Concept.
Following are some examples of the types of testing that is done at the Performance & Scalability
Services Center:
• Proofs of Concept (e.g. HA alternatives, SSD analysis, external storage, etc.)
• Stress test specific hardware configuration
• Evaluate application scalability
• Performance optimization and tuning
• Assess application performance when migrating to a new release of IBM i
• Determine impact of application changes
• Virtualization, consolidation, migration services
• Capacity planning
To request a custom benchmark or Proof of Concept, submit a request using the following link:
Contact IBM Systems Lab Services
IBM Power Systems Performance
IBM i on Power Performance FAQ Page 21 of 98
Sizing a system
4.1 Introduction Sizing a system, and all its various components, so that it is capable of adequately supporting a
production environment can be quite complex. It requires a good knowledge of the characteristics of the
workload(s) to be run, and the load that they will place on the system components.
Some questions to consider before beginning the sizing exercise:
What are the primary metrics, e.g., throughput, latency, that will be used to validate that the system
is meeting performance requirements?
Does the workload run at a fairly steady state, or is it bursty, thereby causing spikes in load on
certain system components? Are there specific criteria, e.g., maximum response time that must be
met during the peak loads?
What are the average and maximum loads that need to be supported on the various system
components, e.g., CPU, memory, network, storage?
4.2 System Sizing Tools
IBM Systems Workload Estimator (WLE)
The IBM Systems Workload Estimator (WLE) is a web-based sizing tool for IBM Power Systems and
IBM z Systems. WLE is available at: wle.mybluemix.net/wle/EstimatorServlet.
You can use this tool to size a new system, to size an upgrade to an existing system, or to size a
consolidation of several systems. WLE will characterize your projected workload either with customer
measurement data or by using one of the many workload plug-ins (a.k.a., sizing guides). Virtualization
can be reflected in the sizing to yield a more robust solution by using various types of partitioning and
virtual I/O. WLE will provide current and growth recommendations for processor, memory, and disk
(either internal or SAN) that satisfy the overall customer performance requirements.
WLE can support sizings dealing with multiple systems, multiple partitions, multiple operating systems,
and multiple sizing intervals. These features can be coordinated by using the functions on the Workload
Selection screen.
WLE will recommend the system model, processor, memory, and disk requirements that are necessary
to handle the overall workload with reasonable performance expectations. To use WLE, you select one
or more workloads and answer a few questions about each workload. Based on the answers, WLE
generates a recommendation and shows the predicted CPU utilization of the recommended system in
graphical format. The results can be viewed and saved as a PDF. The visualize solution function can be
used to better understand the recommendation in terms of time intervals and virtualization. For many
systems, WLE can also provide an energy consumption estimate to help with your "go green" initiatives.
There is an optional integration point with planning tools (System Planning Tool, and the IBM Pre-sales
Advisor Tool) so that the configuration planning and validation may continue.
The WLE recommendation is based on processing capacity, which assumes that the system can handle
the aggregate transaction rate and that the application can fully scale on the system. Although WLE does
not model response times specifically, it abides by the best practice utilization guidelines to help
minimize potential negative impacts to response time. Beyond what is recommended here, additional
IBM Power Systems Performance
IBM i on Power Performance FAQ Page 22 of 98
system resources may be required for additional workloads not sized here, growth resulting from
workload changes, version/release changes not already considered, minimum memory to support I/O or
virtualization configurations, minimum disk to support multiple ASP or RAID configurations, and all
other resources beyond the scope of WLE (CPU, memory, disk).
The WLE recommendation assumes that your system is well-tuned in terms of performance (including
the system hardware configuration, operating system settings, virtualization configuration and settings,
and the application). The WLE scaling algorithms assume that the sized applications are multi-thread
capable and are able to exploit and scale with multiple cores and SMT; otherwise, the sizing is invalid.
So, do not use WLE to size single-threaded applications or for single-threaded time critical batch jobs.
For these, it is important to also consider the performance per thread and per core, as well as GHz.
Sizing tool input starts with well-defined, realistic, consistent workloads and not with industry
benchmarks (that many times avoid customer-like functions like logging and random non-cached
accesses). WLE workload requirements come from performance data from existing customer systems or
from WLE workload plug-ins. In the case of existing systems, it is important to consider peak data to
fully support your business along with a growth trend. For plug-ins, it is important to answer the
questionnaires with responses to adequately cover your peak requirements.
As with every performance estimate (whether a rule of thumb or a sophisticated model), you always
need to treat it as an estimate. This is particularly true with a robust IBM Systems that offer so many
different capabilities where each installation will have unique performance characteristics and demands.
The typical disclaimers that go with any performance estimate ("your experience might vary...") are
especially true. We provide these sizing estimates as general guidelines, but can't guarantee their
accuracy in all circumstances.
You are able to transfer Collection Services data from your existing system for sizing using Performance
Data Investigator (PDI), iDoctor, or PM for Power Systems. PDI and iDoctor allow you to select a
specific interval, launch WLE on the web, and push that data into a sizing session. PM is more robust as
it additionally provides a set of weekly peak usage points that can be used with WLE to determine
resource requirements including trends and growth rates.
4.2.1.1 How can I get the IBM Workload Estimator?
IBM Workload Estimator can be found at:
Estimator
4.2.1.2 How can I get assistance in sizing a system?
Please utilize the IBM Workload Estimator or contact your IBM Business Partner or IBM Sales. IBM
Post Sales Support is not able to assist with sizing questions.
Workload Estimator Community
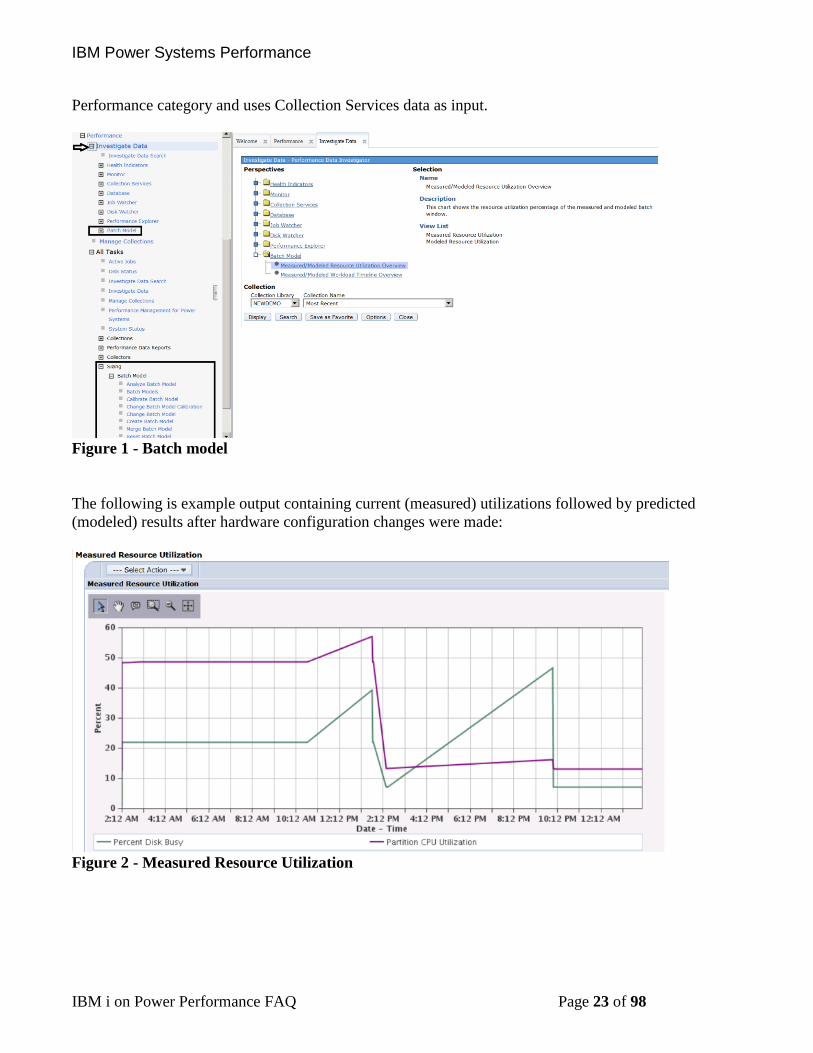
IBM i Batch Model
Batch model was introduced in IBM i 7.2. The purpose of this new function is to help you analyze batch
job performance characteristics as well as predict batch workload run times after changes are made to
disk, processor, or workload volumes. This new function is found in IBM Navigator for i under the
IBM Power Systems Performance
IBM i on Power Performance FAQ Page 23 of 98
Performance category and uses Collection Services data as input.
Figure 1 - Batch model
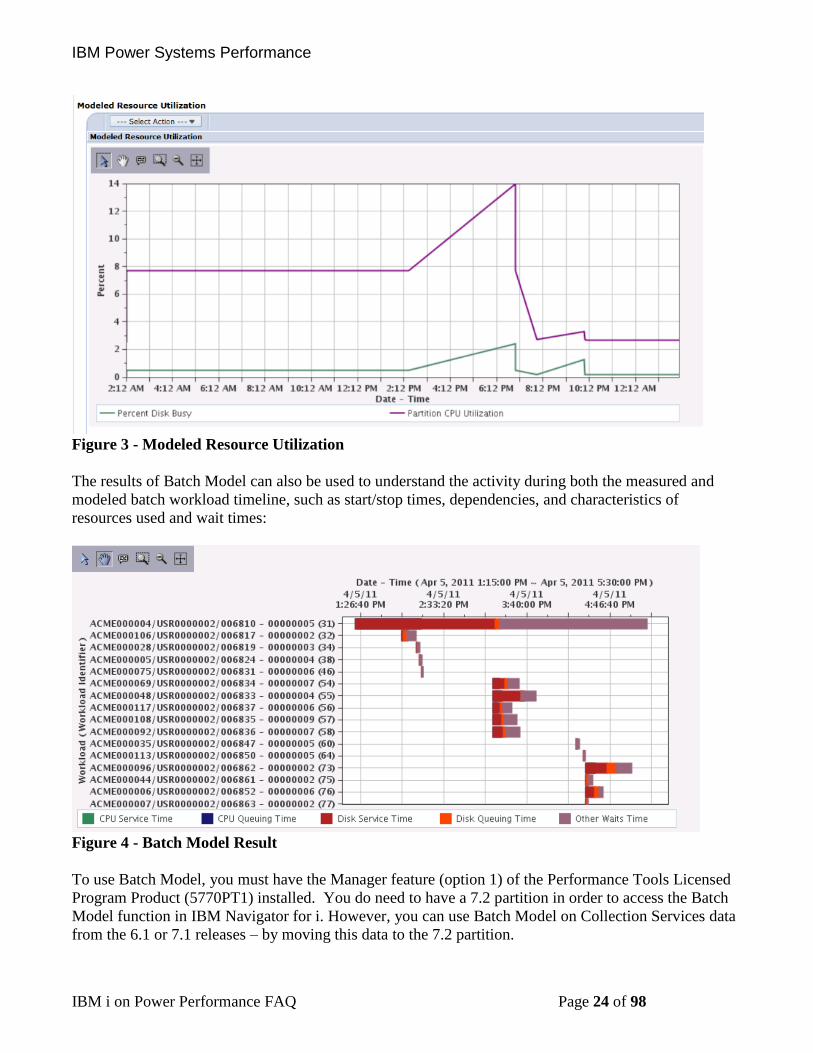
The following is example output containing current (measured) utilizations followed by predicted
(modeled) results after hardware configuration changes were made:
Figure 2 - Measured Resource Utilization
IBM Power Systems Performance
IBM i on Power Performance FAQ Page 24 of 98
Figure 3 - Modeled Resource Utilization
The results of Batch Model can also be used to understand the activity during both the measured and
modeled batch workload timeline, such as start/stop times, dependencies, and characteristics of
resources used and wait times:
Figure 4 - Batch Model Result
To use Batch Model, you must have the Manager feature (option 1) of the Performance Tools Licensed
Program Product (5770PT1) installed. You do need to have a 7.2 partition in order to access the Batch
Model function in IBM Navigator for i. However, you can use Batch Model on Collection Services data
from the 6.1 or 7.1 releases – by moving this data to the 7.2 partition.
IBM Power Systems Performance
IBM i on Power Performance FAQ Page 25 of 98
Add SI54715 and SI54462 for POWER8 systems support in the Batch Model. After applying the PTFs,
you need to restart the HTTP server to activate the function of P8 support:
ENDSBS SBS(QHTTPSVR) OPTION(*IMMED)
STRTCPSVR SERVER(*HTTP) HTTPSVR(*ADMIN)
For information about PTFs that are required for Batch model:
Batch Model Enhancements
Additional usage information can be found here:
developerWorks - How to use the Batch Model Performance Tool
IBM Knowledge Center - Batch Model

IBM Power Systems Performance
IBM i on Power Performance FAQ Page 26 of 98
Capacity Planning
5.1 IBM Performance Management for Power Systems The IBM® Performance Management for Power Systems™ (PM for Power Systems) in support of IBM
i offering automates the collection, archival, and analysis of system performance data and returns reports
to help you manage system resources and capacity.
The PM for Power Systems offering includes the Performance Management Agent (PM Agent). The PM
Agent is a function of the operating system that provides automated collection of nonproprietary
Collection Services data, reduces the data, and sends the data to IBM. When you send your data to IBM,
you eliminate the need to store all the trending data yourself. IBM stores the data for you and provides
you with a series of reports and graphs that show your server's growth and performance. You can access
your reports electronically using a traditional browser.
This offering, when used with the IBM Systems Workload Estimator, allows you to better understand
how your business trends relate to the timing of required hardware upgrades, such as central processing
unit (CPU) or disk. The IBM Systems Workload Estimator can size a systems consolidation or evaluate
upgrading a system with logical partitions, by having PM Agent send the data for multiple systems or
partitions to the IBM Systems Workload Estimator.
PM for Power Systems is available in both ‘no additional charge’ and ‘nominal charge’ options
depending on the level of detail you wish to see on a routine basis.
The PM Agent is a part of the operating system and you must activate it to use its collecting capabilities.
You must start PM Agent to take advantage of its data collecting capabilities:
Activating PM Agent
For additional information see:
IBM Performance Management for Power Systems - support for IBM i
IBM Power Systems Performance
IBM i on Power Performance FAQ Page 27 of 98
Proactive Performance Monitoring
6.1 Introduction This chapter covers proactive performance monitoring process from a high level point of view. Its
purpose is to provide a guideline and best practice on how to address performance problems using a top
down approach.
6.2 Performance monitoring before a problem occurs Application performance should be recorded using log files, batch run times or other objective
measurements. General system performance should be recorded, and should include as many
components of the environment as possible.
Performance statistics should be collected based on the typical period of activity in your environment.
The minimum period should be considered one week in an interactive system, as typical performance
may vary based upon the day of the week. A batch processing system that typically runs large end of
month reports should consider a month as the minimum period. Data should be collected and stored over
multiple periods to allow for comparison.
Performance monitoring of the environment provides many benefits. The application performance will
provide a useful method of quantifying the performance change. A history of acceptable system
performance will focus analysis on changed components. Also, continual review of performance
monitoring will show trends in performance and capacity before they become system wide problems.
Real-time Interactive Monitoring
Basic system commands provide a real-time view of data and can help you identify potential problems
early. The most common are:
WRKACTJOB -- shows all jobs with key system resources used (including CPU %, response time,
and I/O information and, in IBM i 7.2, the temporary storage used by each job.)
WRKSYSSTS -- shows system utilization and pool usage
WRKDSKSTS -- shows statistics for all disk units
WRKSYSACT -- shows tasks, primary threads and secondary threads that have consumed CPU in
the refresh period. Also shows temporary storage used.
Equivalent GUI versions of these commands are available in System i Navigator and IBM Navigator for
i.
Dashboard
Dashboard is a new way in 7.2/7.3 to get a quick, real-time view of key information about the health of
your IBM i partition. Dashboard is available in IBM Navigator for i.
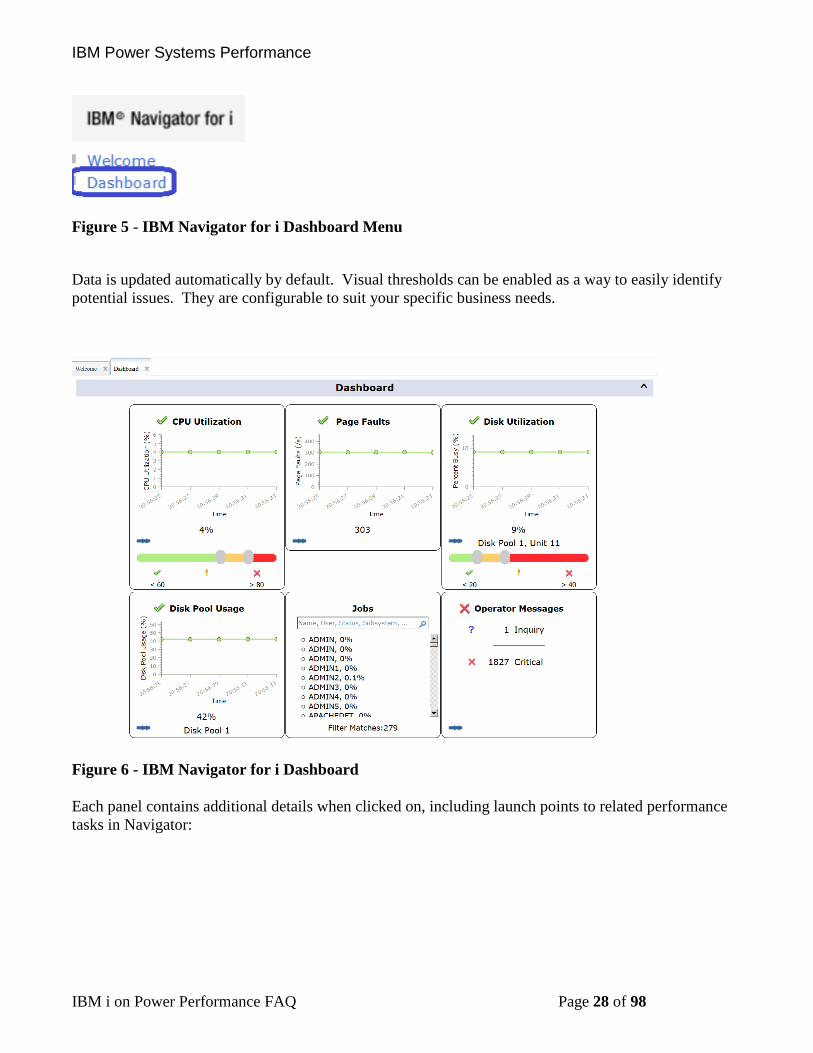
IBM Power Systems Performance
IBM i on Power Performance FAQ Page 28 of 98
Figure 5 - IBM Navigator for i Dashboard Menu
Data is updated automatically by default. Visual thresholds can be enabled as a way to easily identify
potential issues. They are configurable to suit your specific business needs.
Figure 6 - IBM Navigator for i Dashboard
Each panel contains additional details when clicked on, including launch points to related performance
tasks in Navigator:
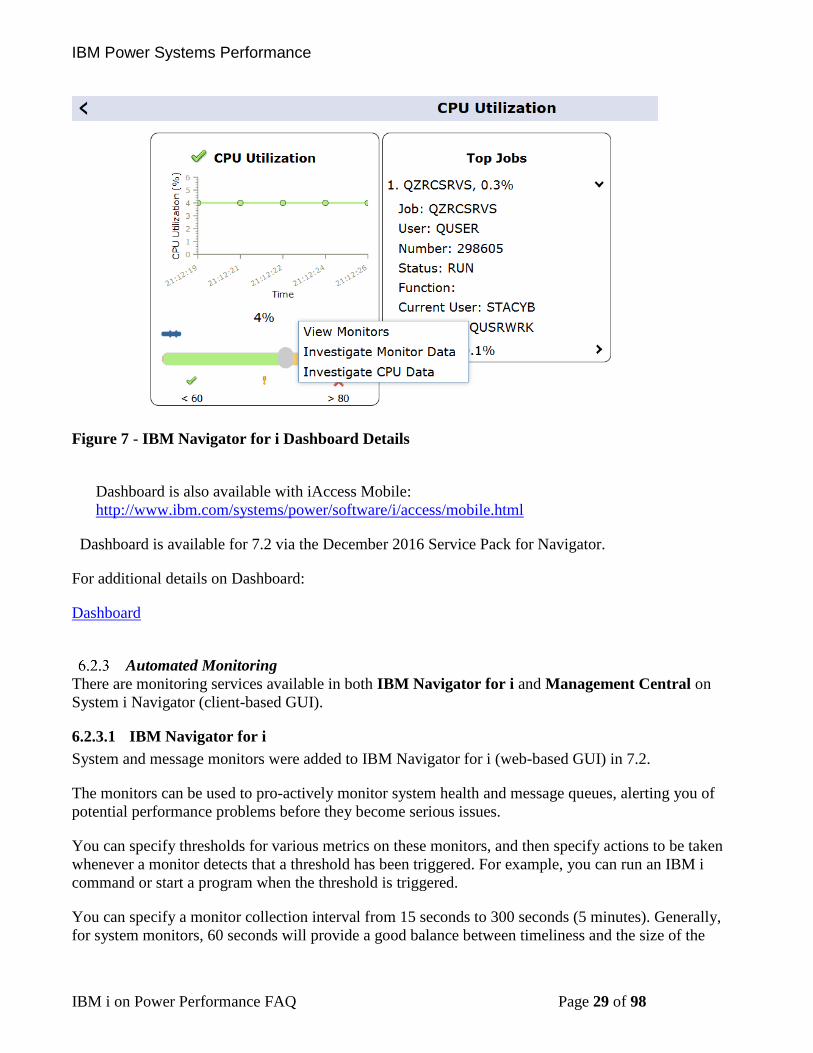
IBM Power Systems Performance
IBM i on Power Performance FAQ Page 29 of 98
Figure 7 - IBM Navigator for i Dashboard Details
Dashboard is also available with iAccess Mobile:
http://www.ibm.com/systems/power/software/i/access/mobile.html
Dashboard is available for 7.2 via the December 2016 Service Pack for Navigator.
For additional details on Dashboard:
Dashboard
Automated Monitoring
There are monitoring services available in both IBM Navigator for i and Management Central on
System i Navigator (client-based GUI).
6.2.3.1 IBM Navigator for i
System and message monitors were added to IBM Navigator for i (web-based GUI) in 7.2.
The monitors can be used to pro-actively monitor system health and message queues, alerting you of
potential performance problems before they become serious issues.
You can specify thresholds for various metrics on these monitors, and then specify actions to be taken
whenever a monitor detects that a threshold has been triggered. For example, you can run an IBM i
command or start a program when the threshold is triggered.
You can specify a monitor collection interval from 15 seconds to 300 seconds (5 minutes). Generally,
for system monitors, 60 seconds will provide a good balance between timeliness and the size of the
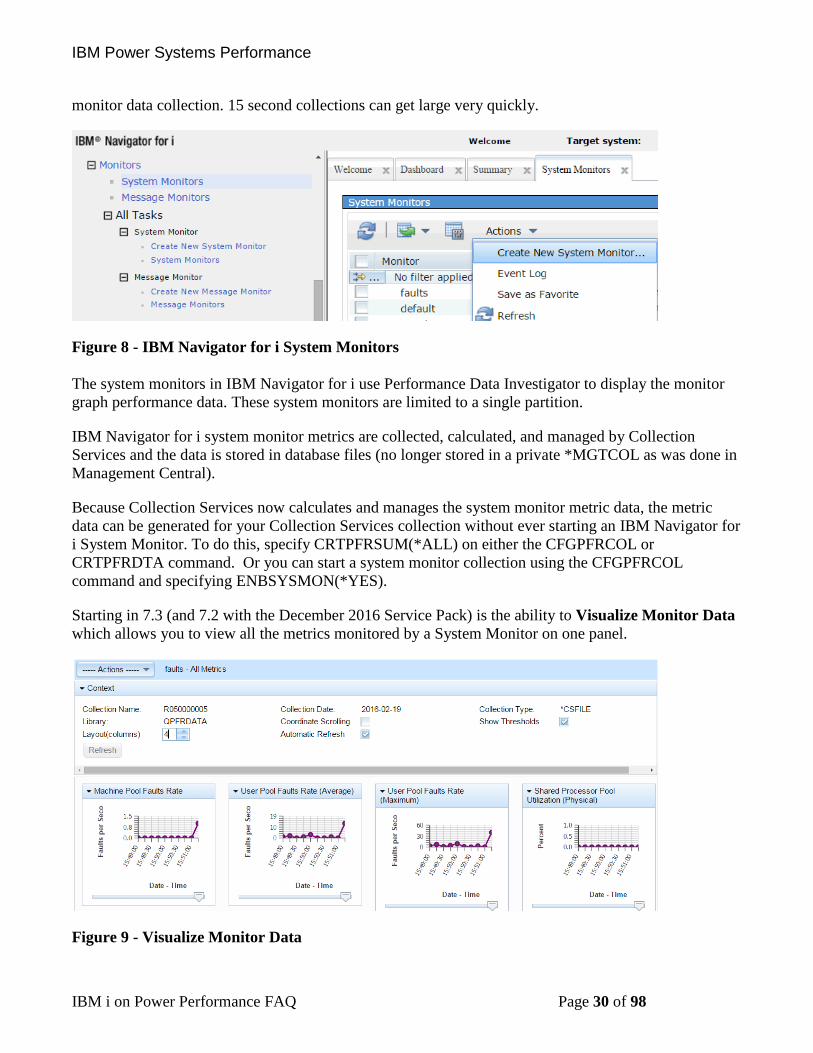
IBM Power Systems Performance
IBM i on Power Performance FAQ Page 30 of 98
monitor data collection. 15 second collections can get large very quickly.
Figure 8 - IBM Navigator for i System Monitors
The system monitors in IBM Navigator for i use Performance Data Investigator to display the monitor
graph performance data. These system monitors are limited to a single partition.
IBM Navigator for i system monitor metrics are collected, calculated, and managed by Collection
Services and the data is stored in database files (no longer stored in a private *MGTCOL as was done in
Management Central).
Because Collection Services now calculates and manages the system monitor metric data, the metric
data can be generated for your Collection Services collection without ever starting an IBM Navigator for
i System Monitor. To do this, specify CRTPFRSUM(*ALL) on either the CFGPFRCOL or
CRTPFRDTA command. Or you can start a system monitor collection using the CFGPFRCOL
command and specifying ENBSYSMON(*YES).
Starting in 7.3 (and 7.2 with the December 2016 Service Pack) is the ability to Visualize Monitor Data
which allows you to view all the metrics monitored by a System Monitor on one panel.
Figure 9 - Visualize Monitor Data
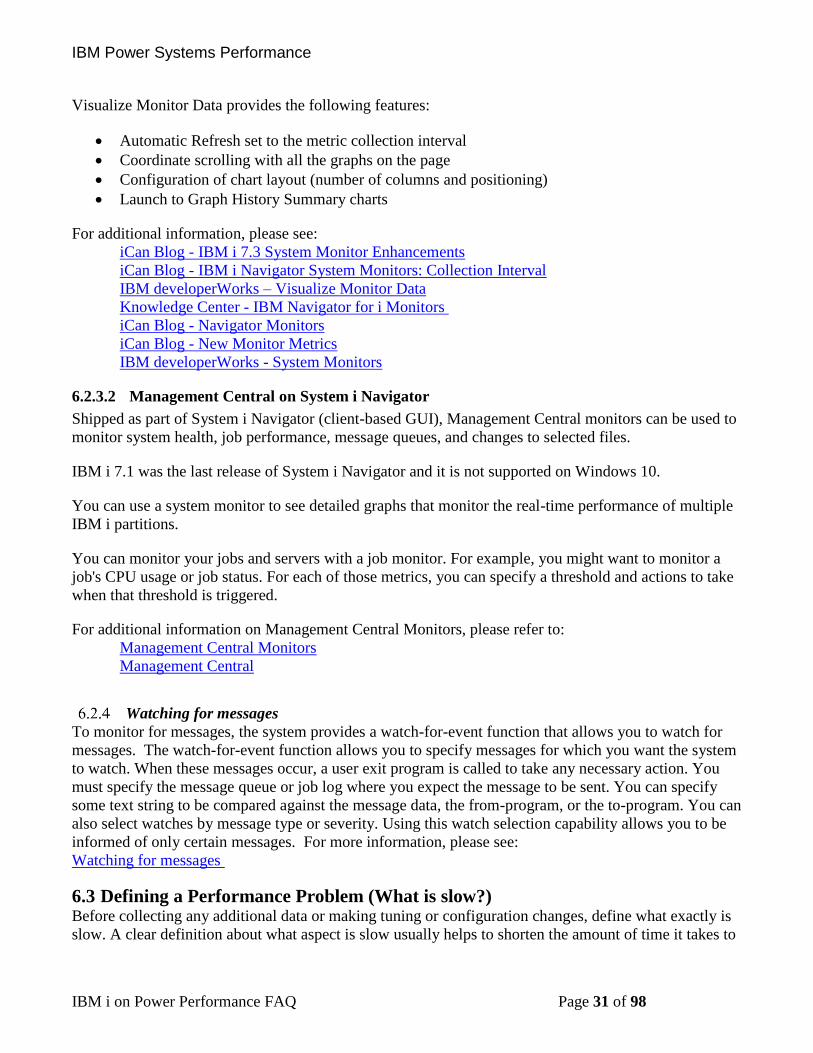
IBM Power Systems Performance
IBM i on Power Performance FAQ Page 31 of 98
Visualize Monitor Data provides the following features:
• Automatic Refresh set to the metric collection interval
• Coordinate scrolling with all the graphs on the page
• Configuration of chart layout (number of columns and positioning)
• Launch to Graph History Summary charts
For additional information, please see:
iCan Blog - IBM i 7.3 System Monitor Enhancements
iCan Blog - IBM i Navigator System Monitors: Collection Interval
IBM developerWorks – Visualize Monitor Data
Knowledge Center - IBM Navigator for i Monitors
iCan Blog - Navigator Monitors
iCan Blog - New Monitor Metrics
IBM developerWorks - System Monitors
6.2.3.2 Management Central on System i Navigator
Shipped as part of System i Navigator (client-based GUI), Management Central monitors can be used to
monitor system health, job performance, message queues, and changes to selected files.
IBM i 7.1 was the last release of System i Navigator and it is not supported on Windows 10.
You can use a system monitor to see detailed graphs that monitor the real-time performance of multiple
IBM i partitions.
You can monitor your jobs and servers with a job monitor. For example, you might want to monitor a
job's CPU usage or job status. For each of those metrics, you can specify a threshold and actions to take
when that threshold is triggered.
For additional information on Management Central Monitors, please refer to:
Management Central Monitors
Management Central
Watching for messages
To monitor for messages, the system provides a watch-for-event function that allows you to watch for
messages. The watch-for-event function allows you to specify messages for which you want the system
to watch. When these messages occur, a user exit program is called to take any necessary action. You
must specify the message queue or job log where you expect the message to be sent. You can specify
some text string to be compared against the message data, the from-program, or the to-program. You can
also select watches by message type or severity. Using this watch selection capability allows you to be
informed of only certain messages. For more information, please see:
Watching for messages
6.3 Defining a Performance Problem (What is slow?) Before collecting any additional data or making tuning or configuration changes, define what exactly is
slow. A clear definition about what aspect is slow usually helps to shorten the amount of time it takes to
IBM Power Systems Performance
IBM i on Power Performance FAQ Page 32 of 98
resolve a performance problem and gives a performance analyst a better understanding of what data to
collect and what to look for in the data.
A good way to define a performance problem is to answer questions like:
• Is everything slow or just a specific task?
• What application log file demonstrates the performance problem?
• Is it only slow when initiated remotely but runs fast locally?
• Is it slow for everyone or just for a single user?
• Etc.
6.4 Preparing Performance Data Collection An IBM Systems Magazine article, How to Be Proactive With Performance Problems in IBM i, explains
how to configure the performance collectors for proactive performance monitoring.
IBM Power Systems Performance
IBM i on Power Performance FAQ Page 33 of 98
Performance Data Collectors and Analysis Tools
7.1 Introduction This chapter is intended to provide information on which tools are available to collect data on IBM i
systems and the toolsets available to visualize the data, allowing you to more easily interpret and
analyze the data.
7.2 Managing performance on IBM i Managing performance requires the use of a variety of specialized applications. Each of these
applications offers a specific insight into system performance. Some applications collect the data, while
others are used to display, analyze, monitor or manage the data collected.
For more information, see the following links:
http://www-03.ibm.com/systems/power/software/i/management/#tab2
Knowledge Center: IBM i Performance
7.3 Performance Data Collectors In the area of performance management, a key strength of IBM i is having collection technologies built
into the operating system. The rich metric instrumentation provided can then be used by toolsets to aid
in data analysis.
The primary data collectors include:
• Collection Services
• Disk Watcher
• Job Watcher
• Performance Explorer
• SQL plan cache
Each collector has a unique value-add and properties, including the type of data it collects - typically
sample data or trace data. Sample data refers to metrics that are collected at some time interval. Trace
data refers to data that is captured as system or application trace points are hit. Trace data records
everything that happened while sample data shows what took place during the sample interval.
See Dawn May’s blog posting, Performance Data Collectors in IBM i, for more information on
performance data collection tools.
Recommendations for configuring the performance data collectors are included in the sections below.
For more detail about those recommendations, read the article: How to Be Proactive with Performance
Problems in IBM i.
Collection Services
Collection Services provides for the collection of system and job level performance data. It is the
primary collector of system data and IBM recommends you always run with Collection Services active.
Collection Services collects data from many system resources such as:
• CPU
• Memory pools
IBM Power Systems Performance
IBM i on Power Performance FAQ Page 34 of 98
• Disk (internal and external)
• Communications
• Collection Services samples system and job level performance data with low overhead. It can
collect data at regular intervals from 15 seconds to 1 hour (default is 15 minutes).
Often times, Collection Services is the first analysis tool used to:
• monitor how your system is running
• investigate a reported problem
• look for improvement candidates
Use Collection Services to understand resource usage, what is or is not being used, how did it change,
when did it happen and what is affected.
Best practices for Collection Services:
• Collect using 5 minute intervals
• Keep at least 1 week of data
• Keep historical collections for comparison
• Enable cross partition performance collection on the HMC (see Collecting and Viewing
Performance Data for Entire Physical System)
Collection Services can be configured and managed through the IBM Navigator for i Performance
interface, System i Navigator, IBM iDoctor for i, or CL commands. For more information, see:
Knowledge Center: Collection Services
IBM i Disk Watcher
IBM® i Disk Watcher provides for the collection of disk performance data to diagnose disk related
performance problems.
IBM i Disk Watcher allows you to obtain data concerning I/O operations to disk units, along with
frequently needed run-time data to determine which objects, files, processes, threads, and tasks are being
accessed. This tool surfaces data beyond what is provided by such tools as WRKDSKSTS,
WRKSYSSTS, and WRKSYSACT. Disk Watcher provides a mechanism to use short and longer
duration traces to collect disk I/O data along with the associated task and object name.
The Disk Watcher performance data collector was added to the IBM i operating system with the 6.1
release.
Some potential uses of this tool are:
• Evaluating the performance of I/O operations on multi-path disk units
• Evaluating the performance of I/O queuing
• Determining how performance may be improved by re-spreading data across units
• Determining the optimal placement of devices, IOAs, or buses
IBM i Disk Watcher can be configured and managed through the IBM Navigator for i Performance
interface, IBM iDoctor for IBM i, or CL commands.
For more information, see the following documents:
• Knowledge Center: IBM i Disk Watcher
• IBM i Disk Watcher Can Do More
IBM Power Systems Performance
IBM i on Power Performance FAQ Page 35 of 98
• Additional Capabilities of IBM i Disk Watcher
IBM i Job Watcher
IBM® i Job Watcher provides for the collection of job data for any or all jobs, threads, and tasks on the
system. It provides call stacks, SQL statements, objects being waited on, Java™ JVM statistics, wait
statistics and more which are used to diagnose job related performance problems.
IBM i Job Watcher is similar in sampling function to the CL commands WRKACTJOB and
WRKSYSACT in that each refresh computes delta information for the ending interval. The data
collected from the jobs, threads, or tasks being watched is done so in a non-intrusive manner. The Job
Watcher performance data collector was added to the IBM i operating system with the 6.1 release.
Best practices for Job Watcher:
• Consider running Job Watcher continuously
o QMGTOOLS: Job Watcher Monitor Function
o iDoctor Monitors Guide
• Use a definition with 5 or 10 second intervals, collect SQL information, and collect call stacks
(Q10SECSQL for example)
• Keep historical collections for comparison
IBM i Job Watcher can be configured and managed through the IBM Navigator for i Performance
interface, IBM iDoctor for IBM i, QMGTOOLS, or CL commands.
For more information, see the following: Knowledge Center: IBM i Job Watcher
Performance Explorer (PEX)
Performance Explorer collects more detailed information about a specific application, program or
system resource, and provides detailed insight into a specific performance problem. This includes the
capability both to perform several types and levels of traces and to run detailed reports.
Performance Explorer is a data collection tool that helps the user identify the causes of performance
problems that cannot be identified by collecting data using Collection Services, Job Watcher or by doing
general trend analysis. Two reasons to use Performance Explorer include:
• Isolating performance problems to the system resource, application, program, procedure, or method
that is causing the problem
• Analyzing the performance of applications
As your computer environment grows both in size and in complexity, it is reasonable for your
performance analysis to gain in complexity as well. Performance Explorer addresses this growth in
complexity by gathering data on complex performance problems.
Note: Performance Explorer is the tool you need to use after you have tried the other tools. It gathers
specific forms of data that can more easily isolate the factors involved in a performance problem;
however, when you collect this data, you may significantly affect the performance of your system –
especially if you collect this data improperly.
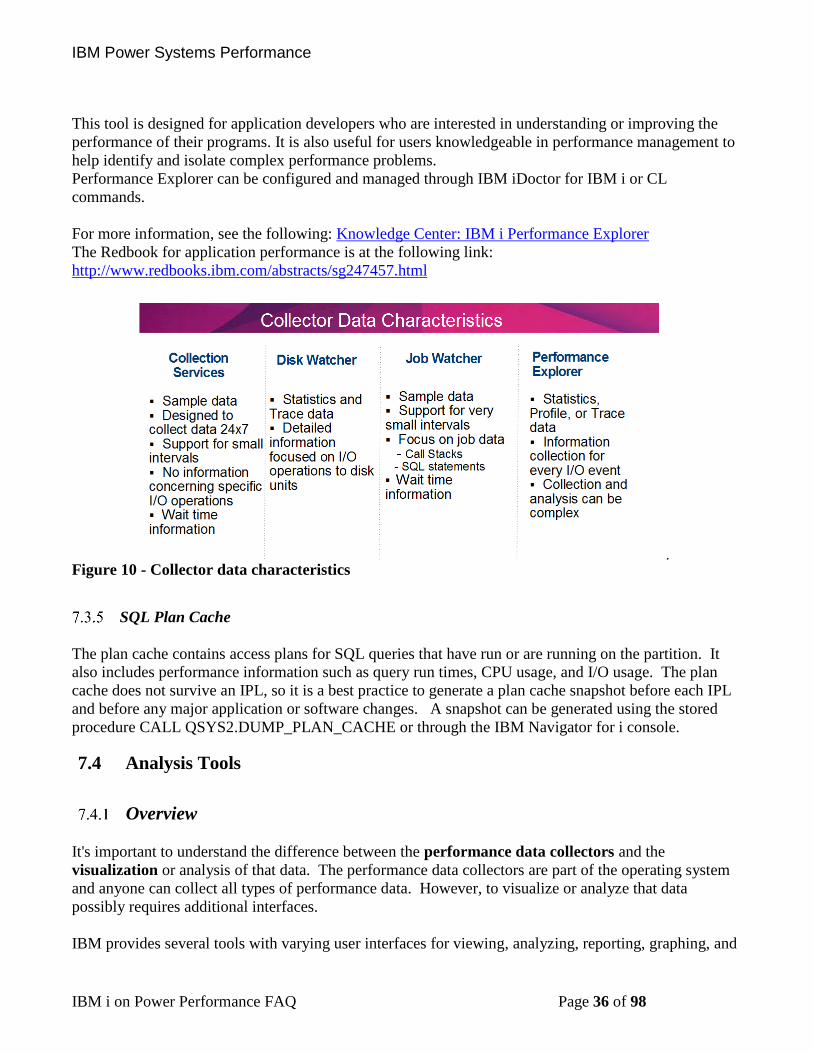
IBM Power Systems Performance
IBM i on Power Performance FAQ Page 36 of 98
This tool is designed for application developers who are interested in understanding or improving the
performance of their programs. It is also useful for users knowledgeable in performance management to
help identify and isolate complex performance problems.
Performance Explorer can be configured and managed through IBM iDoctor for IBM i or CL
commands.
For more information, see the following: Knowledge Center: IBM i Performance Explorer
The Redbook for application performance is at the following link:
http://www.redbooks.ibm.com/abstracts/sg247457.html
Figure 10 - Collector data characteristics
SQL Plan Cache
The plan cache contains access plans for SQL queries that have run or are running on the partition. It
also includes performance information such as query run times, CPU usage, and I/O usage. The plan
cache does not survive an IPL, so it is a best practice to generate a plan cache snapshot before each IPL
and before any major application or software changes. A snapshot can be generated using the stored
procedure CALL QSYS2.DUMP_PLAN_CACHE or through the IBM Navigator for i console.
7.4 Analysis Tools
Overview
It's important to understand the difference between the performance data collectors and the
visualization or analysis of that data. The performance data collectors are part of the operating system
and anyone can collect all types of performance data. However, to visualize or analyze that data
possibly requires additional interfaces.
IBM provides several tools with varying user interfaces for viewing, analyzing, reporting, graphing, and
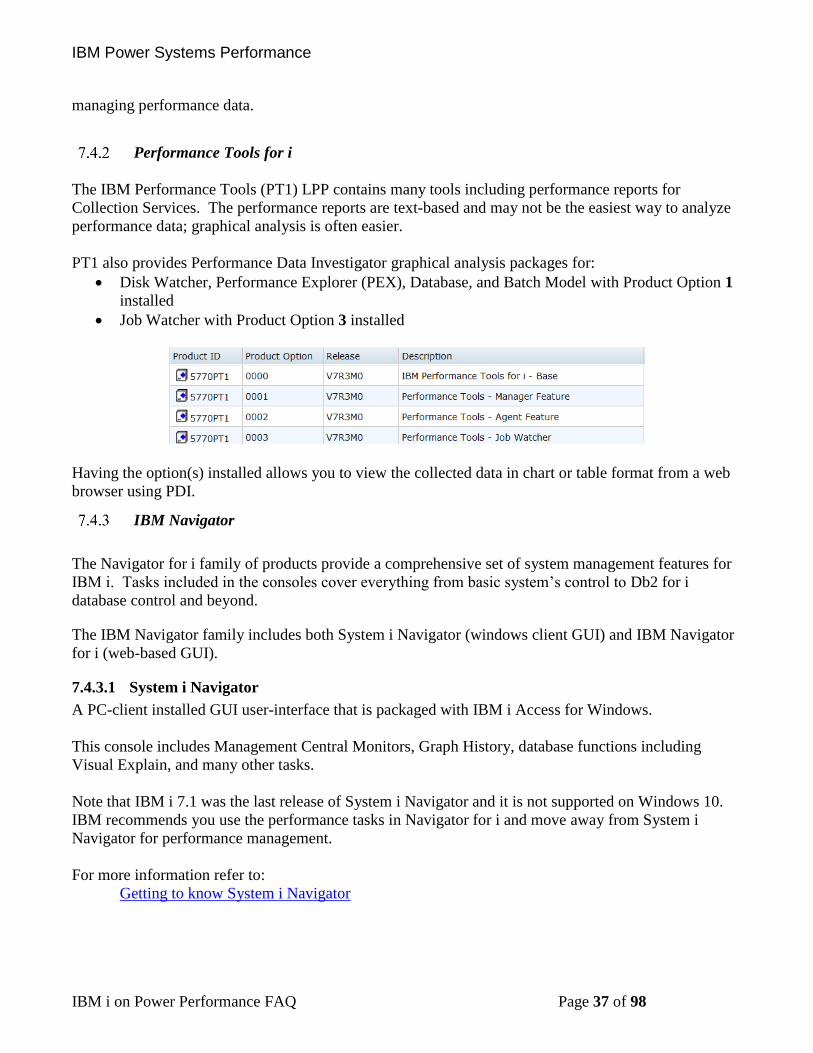
IBM Power Systems Performance
IBM i on Power Performance FAQ Page 37 of 98
managing performance data.
Performance Tools for i
The IBM Performance Tools (PT1) LPP contains many tools including performance reports for
Collection Services. The performance reports are text-based and may not be the easiest way to analyze
performance data; graphical analysis is often easier.
PT1 also provides Performance Data Investigator graphical analysis packages for:
• Disk Watcher, Performance Explorer (PEX), Database, and Batch Model with Product Option 1
installed
• Job Watcher with Product Option 3 installed
Having the option(s) installed allows you to view the collected data in chart or table format from a web
browser using PDI.
IBM Navigator
The Navigator for i family of products provide a comprehensive set of system management features for
IBM i. Tasks included in the consoles cover everything from basic system’s control to Db2 for i
database control and beyond.
The IBM Navigator family includes both System i Navigator (windows client GUI) and IBM Navigator
for i (web-based GUI).
7.4.3.1 System i Navigator
A PC-client installed GUI user-interface that is packaged with IBM i Access for Windows.
This console includes Management Central Monitors, Graph History, database functions including
Visual Explain, and many other tasks.
Note that IBM i 7.1 was the last release of System i Navigator and it is not supported on Windows 10.
IBM recommends you use the performance tasks in Navigator for i and move away from System i
Navigator for performance management.
For more information refer to:
Getting to know System i Navigator
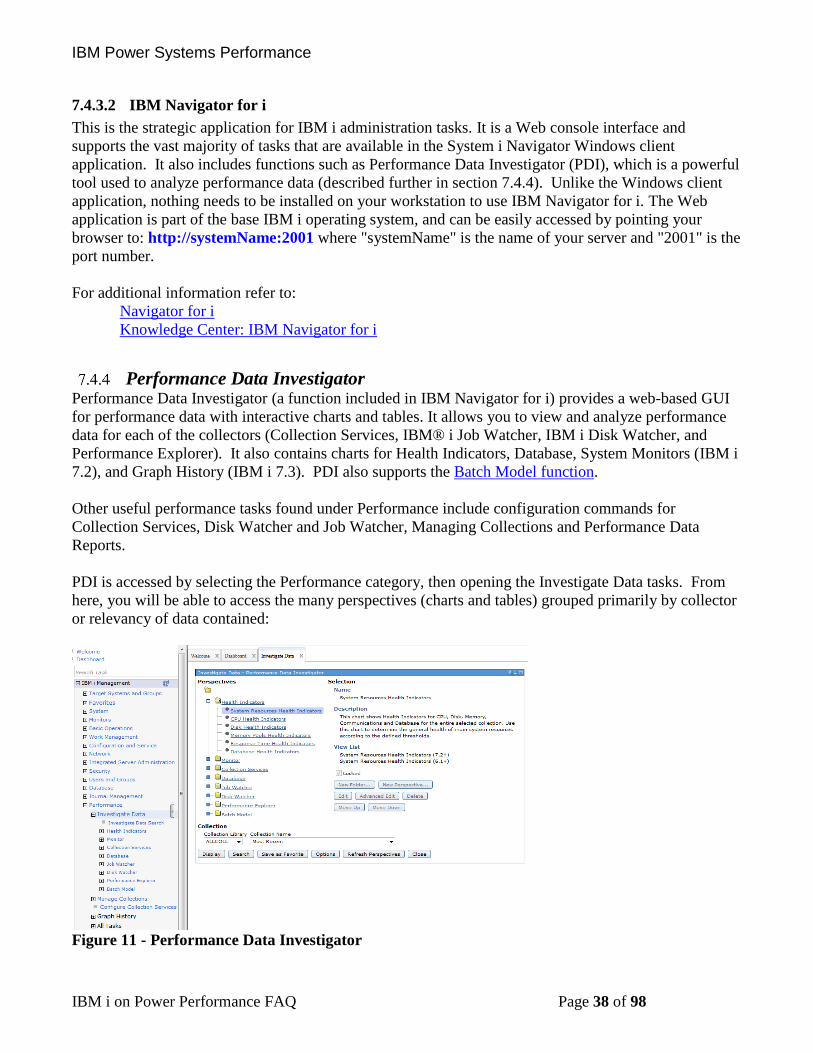
IBM Power Systems Performance
IBM i on Power Performance FAQ Page 38 of 98
7.4.3.2 IBM Navigator for i
This is the strategic application for IBM i administration tasks. It is a Web console interface and
supports the vast majority of tasks that are available in the System i Navigator Windows client
application. It also includes functions such as Performance Data Investigator (PDI), which is a powerful
tool used to analyze performance data (described further in section 7.4.4). Unlike the Windows client
application, nothing needs to be installed on your workstation to use IBM Navigator for i. The Web
application is part of the base IBM i operating system, and can be easily accessed by pointing your
browser to: http://systemName:2001 where "systemName" is the name of your server and "2001" is the
port number.
For additional information refer to:
Navigator for i
Knowledge Center: IBM Navigator for i
Performance Data Investigator
Performance Data Investigator (a function included in IBM Navigator for i) provides a web-based GUI
for performance data with interactive charts and tables. It allows you to view and analyze performance
data for each of the collectors (Collection Services, IBM® i Job Watcher, IBM i Disk Watcher, and
Performance Explorer). It also contains charts for Health Indicators, Database, System Monitors (IBM i
7.2), and Graph History (IBM i 7.3). PDI also supports the Batch Model function.
Other useful performance tasks found under Performance include configuration commands for
Collection Services, Disk Watcher and Job Watcher, Managing Collections and Performance Data
Reports.
PDI is accessed by selecting the Performance category, then opening the Investigate Data tasks. From
here, you will be able to access the many perspectives (charts and tables) grouped primarily by collector
or relevancy of data contained:
Figure 11 - Performance Data Investigator
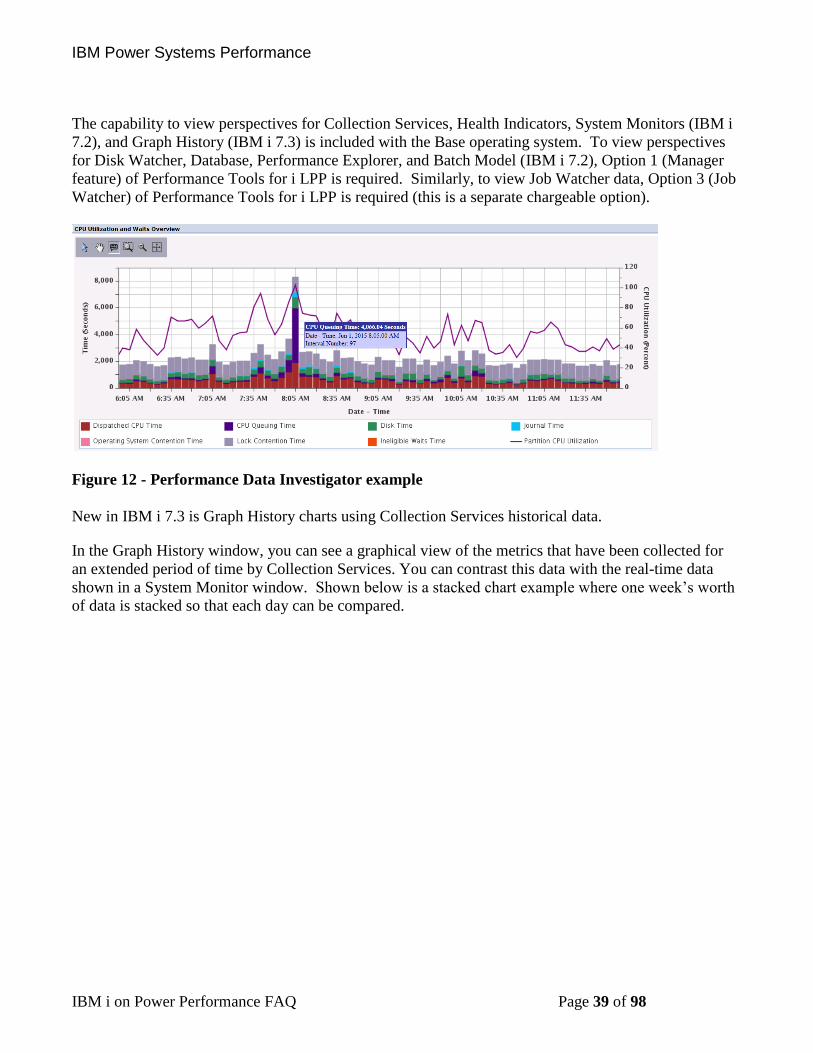
IBM Power Systems Performance
IBM i on Power Performance FAQ Page 39 of 98
The capability to view perspectives for Collection Services, Health Indicators, System Monitors (IBM i
7.2), and Graph History (IBM i 7.3) is included with the Base operating system. To view perspectives
for Disk Watcher, Database, Performance Explorer, and Batch Model (IBM i 7.2), Option 1 (Manager
feature) of Performance Tools for i LPP is required. Similarly, to view Job Watcher data, Option 3 (Job
Watcher) of Performance Tools for i LPP is required (this is a separate chargeable option).
Figure 12 - Performance Data Investigator example
New in IBM i 7.3 is Graph History charts using Collection Services historical data.
In the Graph History window, you can see a graphical view of the metrics that have been collected for
an extended period of time by Collection Services. You can contrast this data with the real-time data
shown in a System Monitor window. Shown below is a stacked chart example where one week’s worth
of data is stacked so that each day can be compared.
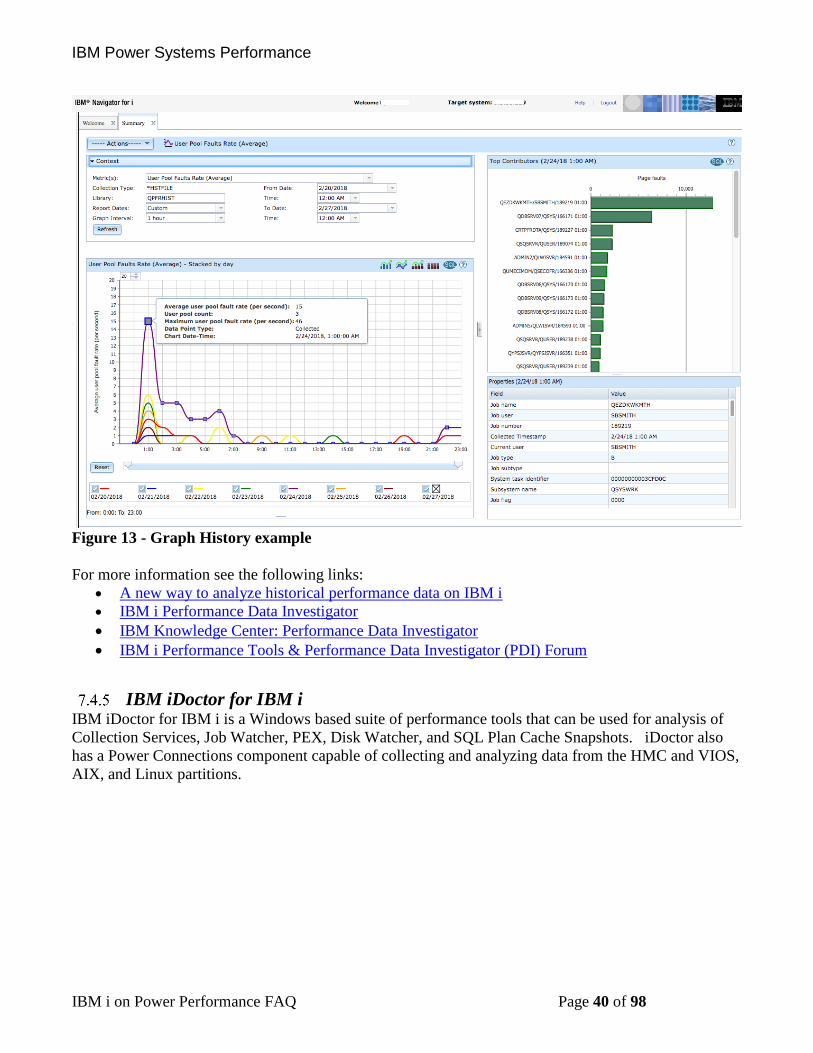
IBM Power Systems Performance
IBM i on Power Performance FAQ Page 40 of 98
Figure 13 - Graph History example
For more information see the following links:
• A new way to analyze historical performance data on IBM i
• IBM i Performance Data Investigator
• IBM Knowledge Center: Performance Data Investigator
• IBM i Performance Tools & Performance Data Investigator (PDI) Forum
IBM iDoctor for IBM i IBM iDoctor for IBM i is a Windows based suite of performance tools that can be used for analysis of
Collection Services, Job Watcher, PEX, Disk Watcher, and SQL Plan Cache Snapshots. iDoctor also
has a Power Connections component capable of collecting and analyzing data from the HMC and VIOS,
AIX, and Linux partitions.
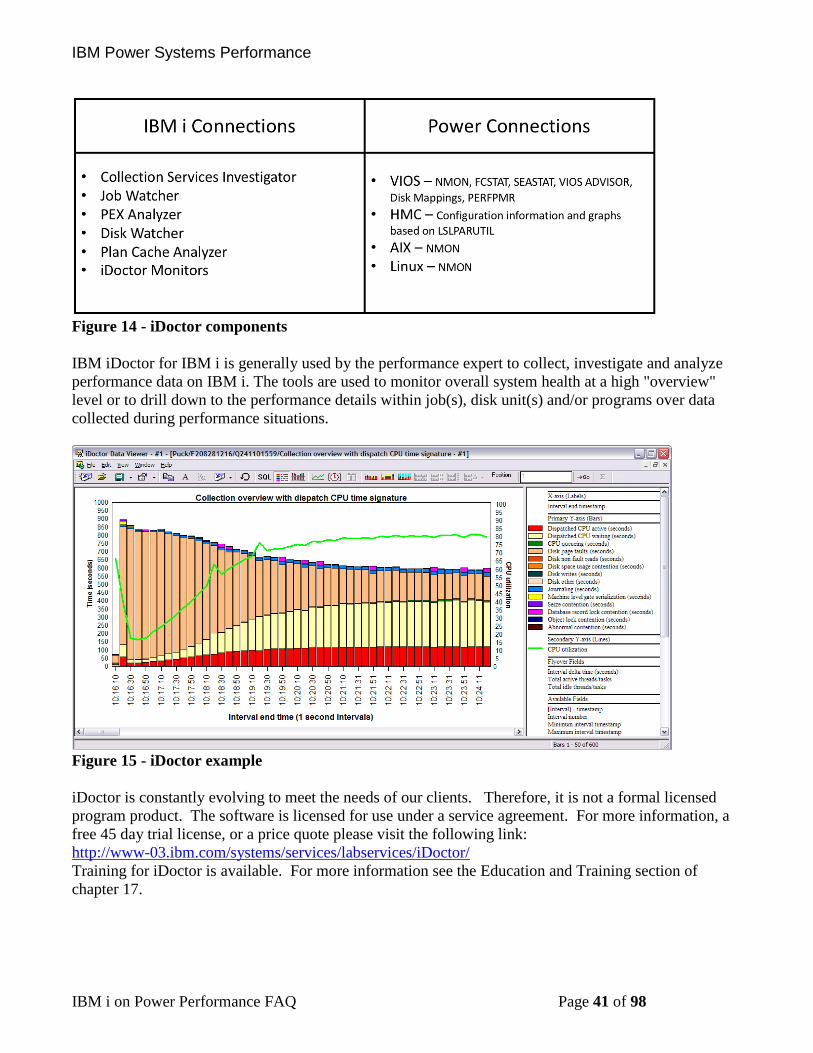
IBM Power Systems Performance
IBM i on Power Performance FAQ Page 41 of 98
Figure 14 - iDoctor components
IBM iDoctor for IBM i is generally used by the performance expert to collect, investigate and analyze
performance data on IBM i. The tools are used to monitor overall system health at a high "overview"
level or to drill down to the performance details within job(s), disk unit(s) and/or programs over data
collected during performance situations.
Figure 15 - iDoctor example
iDoctor is constantly evolving to meet the needs of our clients. Therefore, it is not a formal licensed
program product. The software is licensed for use under a service agreement. For more information, a
free 45 day trial license, or a price quote please visit the following link:
http://www-03.ibm.com/systems/services/labservices/iDoctor/
Training for iDoctor is available. For more information see the Education and Training section of
chapter 17.
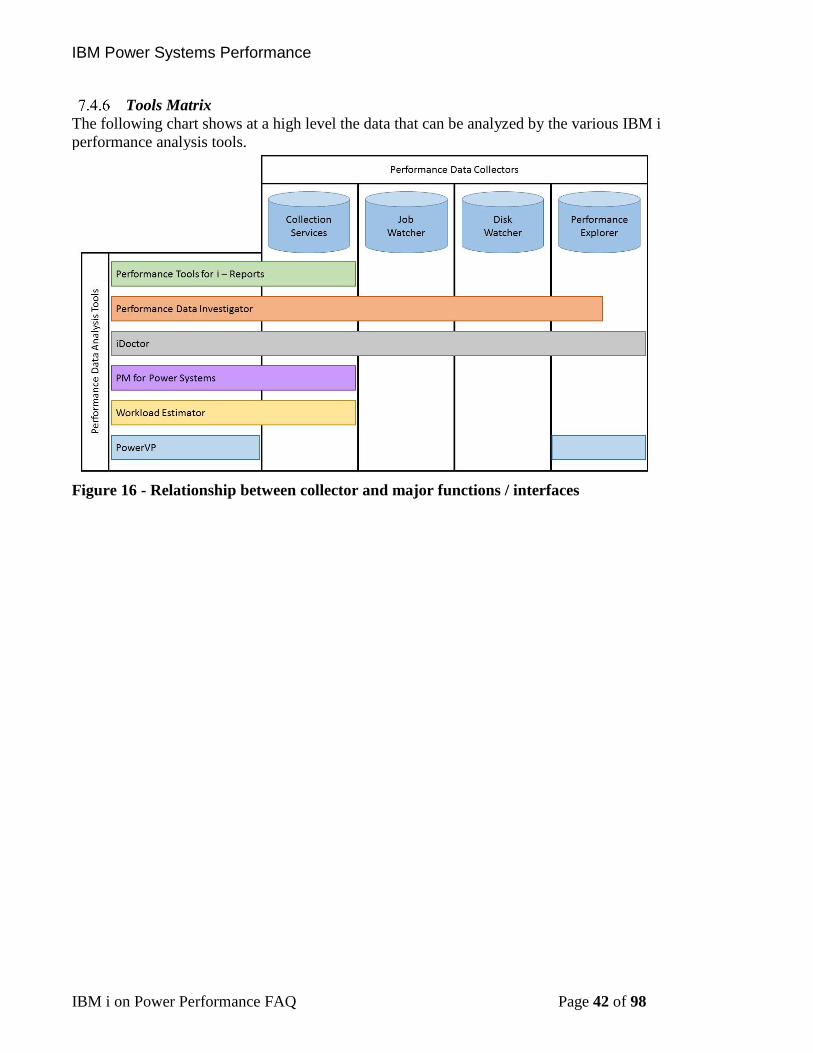
IBM Power Systems Performance
IBM i on Power Performance FAQ Page 42 of 98
Tools Matrix
The following chart shows at a high level the data that can be analyzed by the various IBM i
performance analysis tools.
Figure 16 - Relationship between collector and major functions / interfaces
IBM Power Systems Performance
IBM i on Power Performance FAQ Page 43 of 98
Frequently Asked Questions
8.1 Introduction This chapter covers frequently asked questions.
8.2 General Questions
What are the general performance tuning recommendations for best IBM i performance?
There is no such thing as a general performance tuning recommendation.
I heard that... something on the internet said… should I change...?
No, never apply any tuning changes based on information from unofficial channels and always consider
the author or source of that information. Make sure the advice applies to IBM i, especially when related
to Java and Db2. Configuration and application changes should be done based on performance analysis
and tested before being made in production.
My <CPU, disk, memory> usage is high, should I add more resource?
Before adding more hardware, ensure the resources you have are being utilized efficiently. System
tuning, database and application analysis often can result in significant improvements in performance.
Why didn’t the performance of my partition improve after I added <CPU, memory, disk
arms, SSDs>?
The bottleneck may not have been related to the resource you added (CPU, disk, memory). Proper wait
time analysis should be done to identify the bottleneck and how to best resolve it. See the Components
of Response Time section earlier in this document.
Should I update PTFs before undertaking a performance analysis project?
Yes! There are often PTFs that resolve performance problems you may be experiencing. You should
install the latest cumulative and group PTFs and technology refresh (TR) levels.
IBM i Technology Updates
Some PTFs are required before certain performance data can be collected. In addition to the latest
performance tools group PTFs ( SF99145 for 7.1, SF99714 for 7.2, and SF99723 for 7.3), the following
lists should be checked for addition PTFs:
For 7.3
Job Watcher, Performance Explorer (PEX), and Disk Watcher PTFs for IBM i 7.3
for 7.2
Job Watcher, Performance Explorer (PEX), and Disk Watcher PTFs for IBM i 7.2
for 7.1
Job Watcher, Performance Explorer (PEX), and Disk Watcher PTFs for IBM i 7.1
You can find information on the latest Db2 for IBM i fixes and enhancements at the following link.
IBM recommends staying current on fixpacks, which can include performance enhancements.
Db2 for i - Technology Updates
You should also keep the firmware level current as this can also affect overall system performance.
Additionally, certain performance data will only be collected if you are at a minimum firmware level.
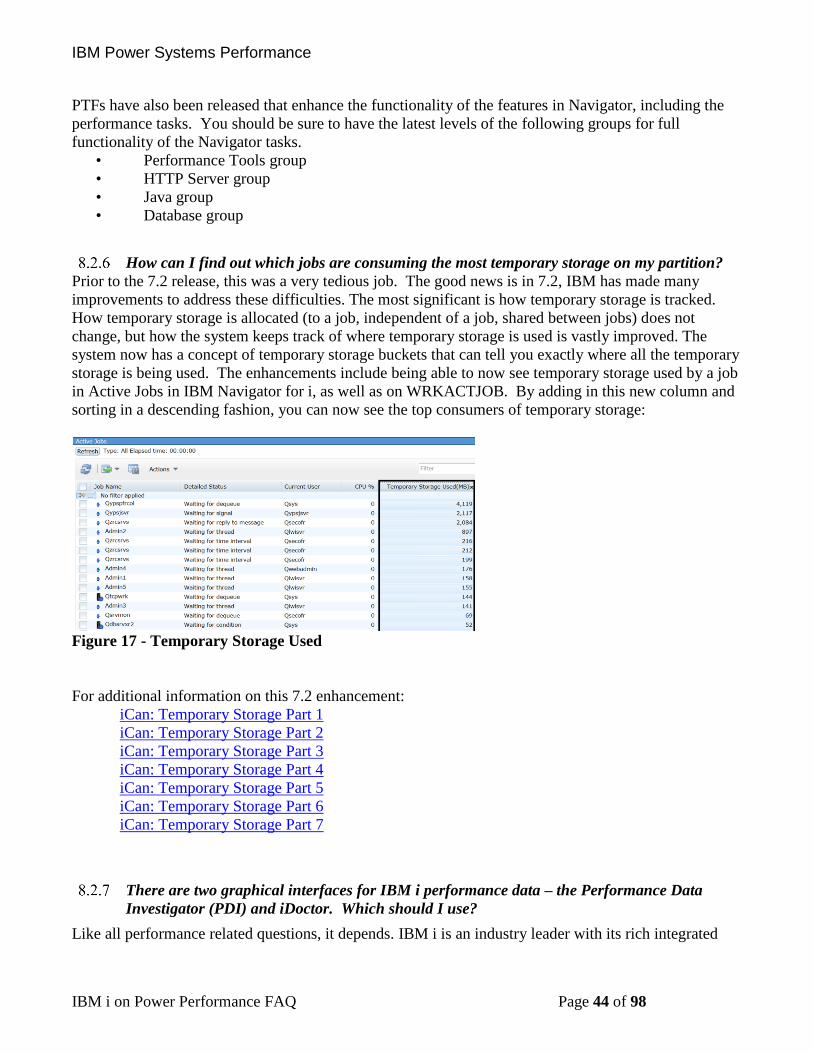
IBM Power Systems Performance
IBM i on Power Performance FAQ Page 44 of 98
PTFs have also been released that enhance the functionality of the features in Navigator, including the
performance tasks. You should be sure to have the latest levels of the following groups for full
functionality of the Navigator tasks.
• Performance Tools group
• HTTP Server group
• Java group
• Database group
How can I find out which jobs are consuming the most temporary storage on my partition?
Prior to the 7.2 release, this was a very tedious job. The good news is in 7.2, IBM has made many
improvements to address these difficulties. The most significant is how temporary storage is tracked.
How temporary storage is allocated (to a job, independent of a job, shared between jobs) does not
change, but how the system keeps track of where temporary storage is used is vastly improved. The
system now has a concept of temporary storage buckets that can tell you exactly where all the temporary
storage is being used. The enhancements include being able to now see temporary storage used by a job
in Active Jobs in IBM Navigator for i, as well as on WRKACTJOB. By adding in this new column and
sorting in a descending fashion, you can now see the top consumers of temporary storage:
Figure 17 - Temporary Storage Used
For additional information on this 7.2 enhancement:
iCan: Temporary Storage Part 1
iCan: Temporary Storage Part 2
iCan: Temporary Storage Part 3
iCan: Temporary Storage Part 4
iCan: Temporary Storage Part 5
iCan: Temporary Storage Part 6
iCan: Temporary Storage Part 7
There are two graphical interfaces for IBM i performance data – the Performance Data
Investigator (PDI) and iDoctor. Which should I use?
Like all performance related questions, it depends. IBM i is an industry leader with its rich integrated
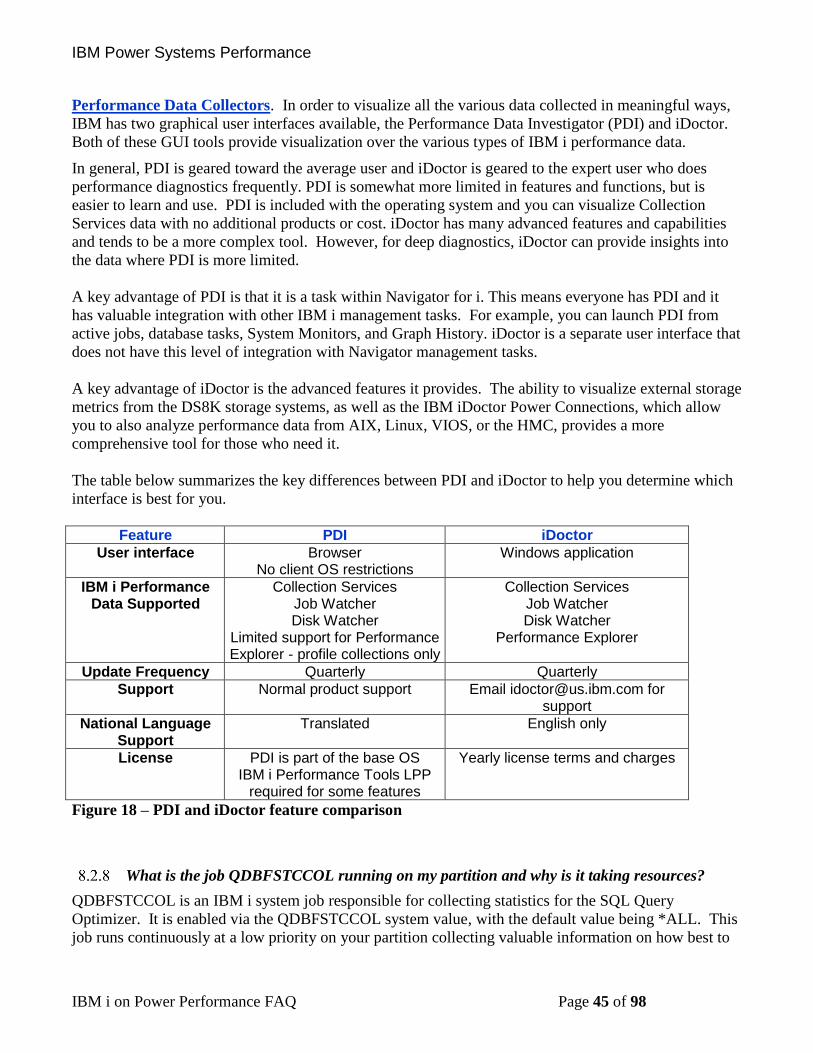
IBM Power Systems Performance
IBM i on Power Performance FAQ Page 45 of 98
Performance Data Collectors. In order to visualize all the various data collected in meaningful ways,
IBM has two graphical user interfaces available, the Performance Data Investigator (PDI) and iDoctor.
Both of these GUI tools provide visualization over the various types of IBM i performance data.
In general, PDI is geared toward the average user and iDoctor is geared to the expert user who does
performance diagnostics frequently. PDI is somewhat more limited in features and functions, but is
easier to learn and use. PDI is included with the operating system and you can visualize Collection
Services data with no additional products or cost. iDoctor has many advanced features and capabilities
and tends to be a more complex tool. However, for deep diagnostics, iDoctor can provide insights into
the data where PDI is more limited.
A key advantage of PDI is that it is a task within Navigator for i. This means everyone has PDI and it
has valuable integration with other IBM i management tasks. For example, you can launch PDI from
active jobs, database tasks, System Monitors, and Graph History. iDoctor is a separate user interface that
does not have this level of integration with Navigator management tasks.
A key advantage of iDoctor is the advanced features it provides. The ability to visualize external storage
metrics from the DS8K storage systems, as well as the IBM iDoctor Power Connections, which allow
you to also analyze performance data from AIX, Linux, VIOS, or the HMC, provides a more
comprehensive tool for those who need it.
The table below summarizes the key differences between PDI and iDoctor to help you determine which
interface is best for you.
Feature PDI iDoctor
User interface Browser No client OS restrictions
Windows application
IBM i Performance Data Supported
Collection Services Job Watcher Disk Watcher
Limited support for Performance Explorer - profile collections only
Collection Services Job Watcher Disk Watcher
Performance Explorer
Update Frequency Quarterly Quarterly
Support Normal product support Email [email protected] for support
National Language Support
Translated English only
License PDI is part of the base OS IBM i Performance Tools LPP
required for some features
Yearly license terms and charges
Figure 18 – PDI and iDoctor feature comparison
What is the job QDBFSTCCOL running on my partition and why is it taking resources?
QDBFSTCCOL is an IBM i system job responsible for collecting statistics for the SQL Query
Optimizer. It is enabled via the QDBFSTCCOL system value, with the default value being *ALL. This
job runs continuously at a low priority on your partition collecting valuable information on how best to
IBM Power Systems Performance
IBM i on Power Performance FAQ Page 46 of 98
implement your queries. In general, IBM does not recommend that you turn this off (a value of *NONE
can degrade query performance). There are times when you may notice this job taking more CPU than
usual. There are several reasons for this, including:
1) A new file being introduced to the partition
2) Existing file statistics have become inaccurate due to records being added or changed
3) Running a new set of queries on the partition
Viewing the job log for the QDBFSTCCOL job can provide clues on activity.
For additional information: Why is the QDBFSTCCOL Taking CPU?
8.3 CPU Questions
How can I reduce CPU usage on the partition?
Typically, this requires collecting and analyzing performance data from running jobs. Sometimes you
can shift scheduled jobs to run during periods of lower CPU utilization. The best approach will depend
on which workloads or applications are dominating system performance. See the following sections for
tuning specific application types:
Tune SQL performance (see SQL performance section).
Tune RPG/COBOL application performance (see section on RPG/COBOL performance).
Tune Java/WebSphere application performance (see Java/WAS section).
What can I do if I can’t reduce my CPU consumption?
• Change shared processor partitions to be uncapped and set virtual processors (VPs) higher than
number of configured processing units.
• Don’t exceed your software licenses.
• Don't configure more VPs than are needed for uncapping and workload demand (from spare
capacity).
• Don’t set the number of VPs higher than the number of licensed processors in the machine (or
processors in the shared pool if dedicated processor partitions are not donating unused cycles).
• Add more processing capacity if system, database, and application tuning has not reduced CPU
usage sufficiently.
• Use powerful performance tools to understand processor utilization and logical partitioning
effects (e.g. CPU queuing, latencies, and shared processor behavior). The iDoctor tool is a
valuable tool to understand these effects.
For detailed logical partition tuning tips, see:
Under the Hood: POWER7 Logical Partitions
Why does my partition’s CPU utilization show a value greater than 100%?
Normally a partition’s CPU utilization ranges from 0% to 100%. There are several reasons why the
CPU utilization would be reported to be greater than 100%:
1. If the partition is configured as shared and uncapped, the CPU utilization can exceed 100%. The
amount the partition can exceed 100% is dependent on multiple settings including the number of
physical and virtual processors, the size of the shared processor pool, and the partition’s
IBM Power Systems Performance
IBM i on Power Performance FAQ Page 47 of 98
uncapped weight.
2. If performance data is refreshed rapidly, performance tools such as WRKACTJOB may not have
enough time to gather all the required counter values and the resulting CPU utilization may
inaccurate. As a result, CPU can be incorrectly reported as more than 100%. To improve
accuracy, allow some time before refreshing the performance counters.
3. The IBM i operating system provides “helper threads” to assist with functions such as database.
If these helper threads consume considerable CPU, there may be intervals in which the
partition’s CPU utilization is reported as greater than 100%.
Why doesn’t the System CPU utilization equal the sum of the CPU utilization of the
individual jobs in WRKACTJOB?
The CPU utilization information for individual jobs is tracked differently than the overall system CPU
utilization. Each process has counters associated with that process to track a wide array of statistics,
including CPU. The system utilization comes from counters that do not keep track of each individual
process. Each value should only be used to compare to itself - - System CPU in one period to System
CPU in another; Job CPU to either the CPU of another job or the job CPU of another period.
Keep in mind that IBM i system tasks are not included in WRKACTJOB command output. They are
included in the WRKSYSACT command output.
How can I keep certain workloads from impacting my whole partition?
Configure Workload Groups to limit the amount of CPU being used.
Workload Groups
• Reduce the priority of the jobs and increase the priority of other jobs.
• Put the jobs in their own subsystem to control the amount of memory they can consume.
Then configure the shared pool settings properly to limit how large (and small) each memory
pool can become.
• Consider limiting which jobs utilize the parallel processing capabilities of Db2 SMP
(5770SS1 Product option 26 Db2 Symmetric Multiprocessing), especially for long running
SQL queries such as ad-hoc queries or reporting.
• Collection Services collects data for workload groups. Performance Data Investigator and
iDoctor can be used for visualization/analysis of workload groups.
The performance of my system is inconsistent. What could cause that?
One of the first things to check is your system’s energy management settings. IBM Power systems can
be managed by an HMC. These tools allow users to implement power-capping or power-saving modes.
When you use power-capping or power-savings modes and these technologies are in effect, the
frequency of the processor may change.
For more information on EnergyScale see:
IBM EnergyScale for POWER8 Processor-Based Systems
and
IBM EnergyScale for POWER9 Processor-Based Systems
If the processor is slowed down in order to save energy, that's something that can be important to be
aware of if you're concerned about performance. The scaled CPU time allows you to know whether the
energy-management features have taken effect on that partition.
IBM Power Systems Performance
IBM i on Power Performance FAQ Page 48 of 98
For additional information, see:
http://ibmsystemsmag.com/Blogs/i-can/Archive/i-can-understand-scaled-cpu-time/
Why do I see CPU queuing time when my CPU utilization is not excessive?
CPU queuing occurs when more jobs, threads, or tasks want to be dispatched to the CPUs in a partition
than there are CPUs currently available to run on. Generally, we see CPU queuing time when CPU
utilization is fairly high, and it is often times a sign that there is more work than what the partition
processing resources can accommodate.
However, CPU queuing time can occur when CPU utilization is low for other reasons. One reason is
that the workload is “bursty”. Each job, threads, or task may not use much processing time, but they are
still all attempting to run at the same time, and thus some of them have to wait for a CPU to become
available. This causes CPU queueing time.
Another reason CPU queuing can occur at low utilizations is when the workload has a lot of very short
requests for CPU. This leads to threads constantly switching in and out of the processor. Every switch
into the processor has at least some small amount of CPU queuing time, so if there is a high rate of
switching in and out of the processor, this will show up as CPU queuing time.Collection Services reports
the average CPU utilization for the entire collection interval, typically set to 5 or 15 minutes. This can
mask short bursts of high CPU activity that result in CPU queueing. Using a smaller Collection Services
interval, or collecting Job Watcher data, can allow you to better see bursts of high CPU.
Also, if Workload Groups have been implemented, any dispatch latency time that may be introduced by
limiting the work to a particular number of cores is reflected as CPU queuing time. Both PDI and
iDoctor have graphs available to better understand the latency effects.
8.4 Memory Questions
How should I configure my partition’s memory pools?
Every partition is different, but here are some general guidelines:
• In general, enable Expert Cache on most user pools (i.e. *CALC). Read more here:
Expert Cache - How It Works
• Add memory to the machine pool if the fault rate of that pool is more than 10 faults per second
and the amount of memory used in the pool is high.
• Set the maximum activity level high enough to avoid transitions to ineligible, but not higher
than necessary (especially for pools running SQL).
Should I turn on the Performance Adjuster (QPFRADJ)?
Most customers can benefit from using the performance adjuster. The following experience report is
helpful for understanding QPFRADJ: Performance Adjuster.
Make sure you configure the shared pool settings properly to limit how large (and small) each memory
pool can become. If you chose not to use QPFRADJ, make sure the max activity level is high enough to
avoid transitions to ineligible. Java applications have special considerations when it comes to
QPFRADJ. See the Java chapter for details.
IBM Power Systems Performance
IBM i on Power Performance FAQ Page 49 of 98
How can I tell what is in my partition’s memory pools?
The DMPMEMINF command can provide this information.
This command is described in the IBM i Knowledge Center:
Dump Main Memory Information (DMPMEMINF)
When should I add more memory to my partition?
As a general guideline you should limit the amount of time spent waiting on disk faults to 25% of the
runtime of an average job on the system. If application optimization cannot reduce jobs below this
level, consider adding more memory.
Also check the performance of the I/O subsystem to ensure disk requests are being completed with good
response times.
What are the "Memory page fault guidelines"?
With the wide variety of applications that now run on IBM i it is not possible to come up with guidelines
that would satisfy every scenario. As a result, IBM no longer publishes general faulting guidelines for
user pools.
8.5 I/O Questions Many of the approaches that reduce CPU usage can also reduce the number of I/O operations,
especially those related to improving database and SQL performance. There are also opportunities to
improve the performance of the I/O subsystem.
What are some common disk subsystem configuration changes that can hurt performance?
• Mixing drive sizes in the same ASP.
• Having some IOAs with more disk drives than other IOAs.
• Having too many disk units on the same IOA.
• Having a single parity set when utilizing paired (or dual) SAS disk IOAs.
• Maintaining consistency in drive size will help keep disk performance consistent. Do not
include new drives in existing arrays if your adapter supports this. Instead stop protection and
start protection so all drives contain parity data. This avoids configuring drives with more
capacity which leads to increased IO requests and the potential to be hot.
• Adding new drives to an ASP without using the “Add and Balance” option.
• Reducing the number of disk arms when migrating to a new storage solution.
• Implementing a high availability replication solution without a properly sized link between
source and target disk subsystems.
• Introducing Real-time Compression to an SVC, Storwize, or FlashSystem V840/V9000 storage
system. See Hints and Tips for implementing Storwize V7000
How can I analyze I/O subsystem performance?
• Use Collection Services and Disk Watcher to collect and analyze disk performance.
• Use the SQL Plan Cache and Visual Explain to identify SQL causing a large number of I/Os.
Read the RPG/COBOL and Native I/O section for more tips.
I can’t modify my applications. What can I do to improve my I/O performance?
• Install more memory or disk drives.
• Install Solid State Drives (SSDs) and move hot objects to them.
IBM Power Systems Performance
IBM i on Power Performance FAQ Page 50 of 98
• Use the Workload Estimator or contact an IBM Business Partner or Sales Representative to size
for a storage solution that will deliver faster performance. See section 8.5.6.
How do I virtualize IBM Serial-Attached SCSI (SAS) adapters for the best performance?
For the best performance, consider using IBM i as the storage host over using a Virtual I/O Server
(VIOS).
Section 3.9 titled “VIOS vSCSI disks and IBM i client partitions” of the “IBM Power Systems RAID
Solutions Introduction and Technical Overview” Redbook found at:
IBM Power Systems RAID Solutions Introduction and Technical Overview
The following link has even more details on the documentation on the requirements and setup of the
performance boost:
SAS Adapter Performance Boost with VIOS
How can I tell if my applications will benefit from SSDs?
• iDoctor SSDs Improvement Estimator and Collection Services Investigator: IBM iDoctor for
IBM i 7.1
How many and what type of storage I/O products will meet performance requirements for an
upgrade or new system or workload?
White papers located on the Performance management on IBM i Resources website are available for
general performance knowledge, already documented comparisons and tuning suggestions.
IBM i storage performance white papers are available at:
IBM i Storage Solutions
If SAN attached storage servers are required you can use either WLE or Disk Magic, or feed WLE
output into Disk Magic via a .dmc file for comparing and estimating speed.
There are also several Redbooks available specific to SAN with IBM i and other information on the
following websites:
http://www-03.ibm.com/systems/storage/
https://www-03.ibm.com/support/techdocs/atsmastr.nsf/Web/Techdocs
For particular direct attached storage products:
• Historical information can be seen in versions of the IBM i Performance Capabilities Reference
previous to the April 2014 version, located at:
Performance Capabilities Reference – February 2013
• The most recent comparison of SAS adapter technology can be found at:
Performance Study of 2nd Generation IBM Power Systems SAS RAID Adapters Designed for
Solid State Storage
How can I tell if a FlashSystem solution is the best storage configuration for my
IBM Power Systems Performance
IBM i on Power Performance FAQ Page 51 of 98
environment?
There are many websites out there that explain the performance, functionality, and cost advantages of an
IBM FlashSystem over both hard disk drives (HDD) and solid state drives (SSD). The following website
answers many of these questions:
https://www.ibm.com/us-en/marketplace/flash-storage/details#product-header-top
Nevertheless, there can still be conditions that prevent your environment from getting the expected
performance improvements when moving to a FlashSystem solution (which can include average disk
read response times as low as .5 milliseconds per I/O). One of the most common reasons is that the
current IBM Power System configuration is experiencing some other resource constraint, or wait
condition, unrelated to the I/O subsystem. The results of a faster FlashSystem solution could be masked
by these conditions, and might even make the response times worse if they push more work to drive
additional thrashing. It is also possible that write intensive workloads could become slower. Even
though Flash has acceptable write response times, nothing can compare to the speed of writing to cache
in an IOA. Internal HDDs are typically configured to IOA’s with very large write cache allowing most
write IOP’s to be asynchronous (or appear to be so due to fast response times).
To help customers identify situations that could prevent the expected response times, and also to help
project the run time improvements of the most I/O intensive jobs, IBM Systems Lab Services offers an
“IBMi Workload Assessment for FlashSystem Solution”. For more information, complete this form:
Lab Services Contact Form
Also note that the SSIC (System Storage Interoperability Center) states the following regarding 4096
sector size used for natively attached Flash Systems. Please also reference section 8.5.9 regarding the
performance implications of 4096 sector drives on IBM i.
Certain unique workloads show lower than expected performance for IBM i hosts when attached to IBM
FlashSystem 840/900 storage without SAN Volume Controller (SVC). It is recommended these
opportunities be vetted with a POC to ensure the clients’ workload does not encounter this performance
issue. In addition, IBM i is maintaining a list of recommended PTFs for any clients running in a 4096
sector size configuration which is required with an attached FlashSystem 840/900. This list can be
found here:
http://www-01.ibm.com/support/docview.wss?uid=nas8N1020957
How do I analyze I/O performance if I’m using external storage?
There are many components to consider when external storage is being used. Latency can be added in
the virtualization layer (VIOS and Power Hypervisor) and SAN which are located between the IBM i
and storage. A good strategy is to compare the IBM i disk service times with the response times
measured on the storage. If the service times and response times are close to the same, then the problem
is likely in the storage. If the IBM i service time is higher than the storage, then latency is likely being
added in the SAN or virtualization layer. Collection Services can be used to measure the service times
on the IBM i. There are several ways to measure the response times on the storage depending on what is
being used.
The Storage Monitoring feature in IBM Spectrum Control (formerly known as IBM Tivoli Storage
Productivity Centre (TPC)) can be used to analyze performance of most IBM Storage Systems. More
information can be found at this link:
IBM Power Systems Performance
IBM i on Power Performance FAQ Page 52 of 98
IBM Spectrum Control
IBM iDoctor for i – Collection Services Investigator can be used to analyze data that is automatically
collected from attached DS8000 Storage systems. More information can be found at this link:
iDoctor Documentation
What are the IBM i performance effects of using 4096 byte sector drives?
There are options for 4096 byte formatted internal HDDs and SSDs both natively and virtualized
through VSCSI from VIOS or an iHost. Flash Systems external storage are also formatted for 4096
byte sectors. Ensure the latest relevant PTFs are applied prior to implementation. The list can be found
here:
PTF listing for 4096 disk sector support
If implementing 4096 byte sectors there will be additional overhead associated with storage
management cleanup tasks. In order to lessen the impact, review the workload for inefficient
application issues, specifically high rates of database full opens and high rates of activation group
creates and destroys. These are discussed in section 8.16. Consider engaging IBM Lab Services for
assistance in reducing open rates prior to implementing 4096 byte sectors. Additionally, review the
following document regarding the SMFSCLEAN* tasks.
SMFSCLEAN* tasks and machine level gating in SMFREESPACEMAP4K
8.6 How do I tune IBM i database performance?
See chapter 9 for details on database performance tuning.
8.7 How can I improve backup and recovery times? See the following information to understand how to improve backup and recovery performance:
Backup and recovery frequently asked questions
For improved IFS SAV performance information:
Achieve faster IFS save times using SAV with ASYNCBRING
8.8 How can I improve IPL time? Although IPL duration is highly dependent on hardware and software configuration, there are tasks that
can be performed to reduce the amount of time required for the system to perform an IPL. The
Experience Report: Reducing System IPL Time report contains many suggestions for reducing IPL time.
Some more recent suggestions to consider are:
• IBM i 7.3 includes a design change to the IPL process to help reduce IPL time for partitions with
very large amounts of memory. This improvement is not available for earlier releases.
IBM Power Systems Performance
IBM i on Power Performance FAQ Page 53 of 98
• The performance of the I/O subsystem can be an important component of IPL time. Customers
who have upgraded their storage from HDDs to SSDs or Flash storage have seen substantial
improvements to IPL time. However, not all systems will see improved IPL times through I/O
upgrades due to other factors.
• Internal measurements have shown that moving only the load source from an HDD to SDD does
not significantly improve IPL time.
For additional information on how to improve IPL performance, refer to:
• IBM i operating system Basic System Operation, Administration, and Problem Handling (SC41-
5206)
• The "Current PTFs for IPL / vary on IASP steps” document has the latest fixes and
enhancements for Abnormal IPL recovery time or vary on of IASPs: Current PTFs for IPL /
vary on IASP steps.
8.9 What are considerations for Main Store Dump (MSD) IPL performance? The “Best Practices for Managing Time Needed for Main Storage Dump (MSD)” Technote has the
latest recommendations, enhancements, and PTFs to help manage and reduce time required for MSD:
Best Practices for Managing Time Needed for Main Storage Dump (MSD)
8.10 How do I tune journal and recovery performance?
At IBM i releases prior to 7.1 make sure that the journal threshold for all user journals is at least 6.4GB.
As of IBM i 7.1 this is no longer necessary.
The journal receiver size option (RCVSIZOPT) should preferably specify at least *MAXOPT2 and
*RMVINTENT.
The Journal Management guide has more details on these commands:
Journal Management Guide
8.11 How do I tune access path recovery performance? System-Managed Access Path Protection (SMAPP) offers system monitoring of potential access path
rebuild time and automatically starts and stops journaling of system selected access paths. In the
unlikely event of an abnormal IPL, this allows for faster access path recovery time.
An estimation of how long access path recovery will take is provided by SMAPP, and SMAPP provides
a setting for the acceptable length of recovery. For most customers, the default value will minimize the
performance impact, while at the same time provide a reasonable and predictable recovery time and
protection for critical access paths. But the overhead of SMAPP will vary from system to system and
application to application.
As the target access path recovery time is lowered, the performance impact from SMAPP will increase
as the SMAPP background tasks have to work harder to meet this target. There is a balance of recovery
time requirements vs. the system resources required by SMAPP. The access path recovery time should
not be set to *NONE or *OFF.
IBM Power Systems Performance
IBM i on Power Performance FAQ Page 54 of 98
Although SMAPP may start journaling access paths, it is recommended that the most
important/large/critical/performance sensitive access paths be journaled explicitly with STRJRNAP.
This eliminates the extra overhead of SMAPP evaluating these access paths and implicitly starting
journaling for the same access path day after day.
There are 3 sets of tasks which do the SMAPP work. These tasks work in the background at low priority
to minimize the impact of SMAPP on system performance. The tasks are as follows:
• JO-EVALUATE-TSKn (where n is 0 or 1) - Evaluates indexes, estimates rebuild time for an
index, and may start or stop implicit journaling of an index.
• JO-TUNING-TASK - Periodically wakes up to consider where the user recovery threshold is set
and manages which indexes should be implicitly journaled.
• JO-RECRA-Dx-xx-x and JORECRA-USR-xxx tasks are the worker tasks which sweep aged
journal pages from main memory to minimize the amount of recovery needed during IPL.
Here are guidelines for lowering the amount of work for each of these tasks:
• If the JO-TUNING-TASK seems busy, you may want to increase SMAPP recovery target time.
• If the JO-EVALUATE task seems busy, explicitly journaling the largest access paths may help
or looks for jobs that are opening/closing files repeatedly.
• If the JORECRA tasks seem busy, you may want to increase journal recovery ratio.
• Also, if the target recovery time is not being met there may be SMAPP ineligible access paths.
These should be modified so as to become SMAPP eligible.
To monitor the performance impacts of SMAPP there are Performance Explorer trace points and a
substantial set of Collection Services counters which provide information on the SMAPP work.
For more information on reducing access path recovery time see the IBM Knowledge Center entry at:
Reducing time in access path recovery
8.12 How do I tune network performance? The network adaptors being used will determine the maximum speed which could be reached, e.g. 1Gb,
10Gb, etc (at least in theory). However the protocol being used, the networking parameters set and the
quality of the connections as well as other systems in the same subnet in the network will determine the
actual performance in terms of network throughput and speed. Performance Collection Services collect
vital data from the use of networking resources and can be used to determine the actual speed and
throughput numbers of the network.
• Consider increasing the TCP/IP buffer for send and receive operations via the CHGTCPA
command to a value greater than the default of 64KB. This can significantly reduce the network
traffic.
• Ensure the parameters for current line speed is reflecting what the adapter is being capable of,
e.g. 1Gb, 10Gb, etc. A single device with a lower line speed capability will force the whole
subnet in the network to run at the lower speed and can severely degrade network performance.
• Ensure the current DUPLEX parameter is set to *FULL so the connection can be used for send
and receive at the same time.
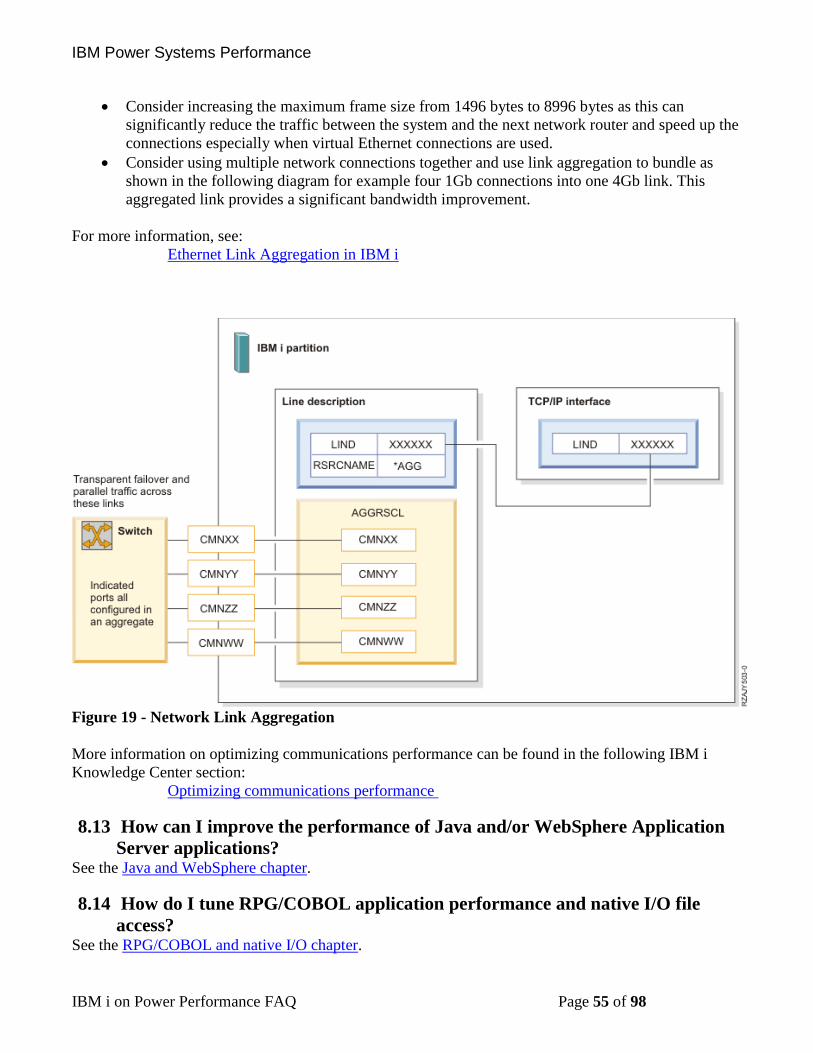
IBM Power Systems Performance
IBM i on Power Performance FAQ Page 55 of 98
• Consider increasing the maximum frame size from 1496 bytes to 8996 bytes as this can
significantly reduce the traffic between the system and the next network router and speed up the
connections especially when virtual Ethernet connections are used.
• Consider using multiple network connections together and use link aggregation to bundle as
shown in the following diagram for example four 1Gb connections into one 4Gb link. This
aggregated link provides a significant bandwidth improvement.
For more information, see:
Ethernet Link Aggregation in IBM i
Figure 19 - Network Link Aggregation
More information on optimizing communications performance can be found in the following IBM i
Knowledge Center section:
Optimizing communications performance
8.13 How can I improve the performance of Java and/or WebSphere Application
Server applications? See the Java and WebSphere chapter.
8.14 How do I tune RPG/COBOL application performance and native I/O file
access?
See the RPG/COBOL and native I/O chapter.
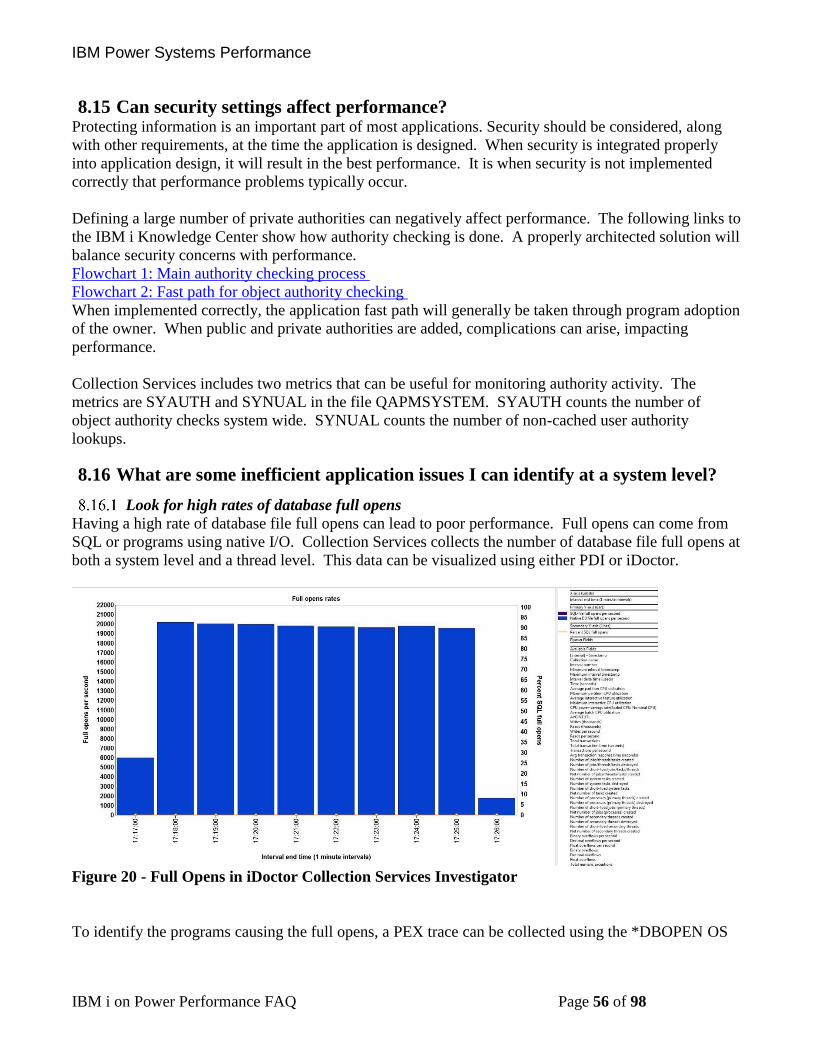
IBM Power Systems Performance
IBM i on Power Performance FAQ Page 56 of 98
8.15 Can security settings affect performance? Protecting information is an important part of most applications. Security should be considered, along
with other requirements, at the time the application is designed. When security is integrated properly
into application design, it will result in the best performance. It is when security is not implemented
correctly that performance problems typically occur.
Defining a large number of private authorities can negatively affect performance. The following links to
the IBM i Knowledge Center show how authority checking is done. A properly architected solution will
balance security concerns with performance.
Flowchart 1: Main authority checking process
Flowchart 2: Fast path for object authority checking
When implemented correctly, the application fast path will generally be taken through program adoption
of the owner. When public and private authorities are added, complications can arise, impacting
performance.
Collection Services includes two metrics that can be useful for monitoring authority activity. The
metrics are SYAUTH and SYNUAL in the file QAPMSYSTEM. SYAUTH counts the number of
object authority checks system wide. SYNUAL counts the number of non-cached user authority
lookups.
8.16 What are some inefficient application issues I can identify at a system level?
Look for high rates of database full opens
Having a high rate of database file full opens can lead to poor performance. Full opens can come from
SQL or programs using native I/O. Collection Services collects the number of database file full opens at
both a system level and a thread level. This data can be visualized using either PDI or iDoctor.
Figure 20 - Full Opens in iDoctor Collection Services Investigator
To identify the programs causing the full opens, a PEX trace can be collected using the *DBOPEN OS
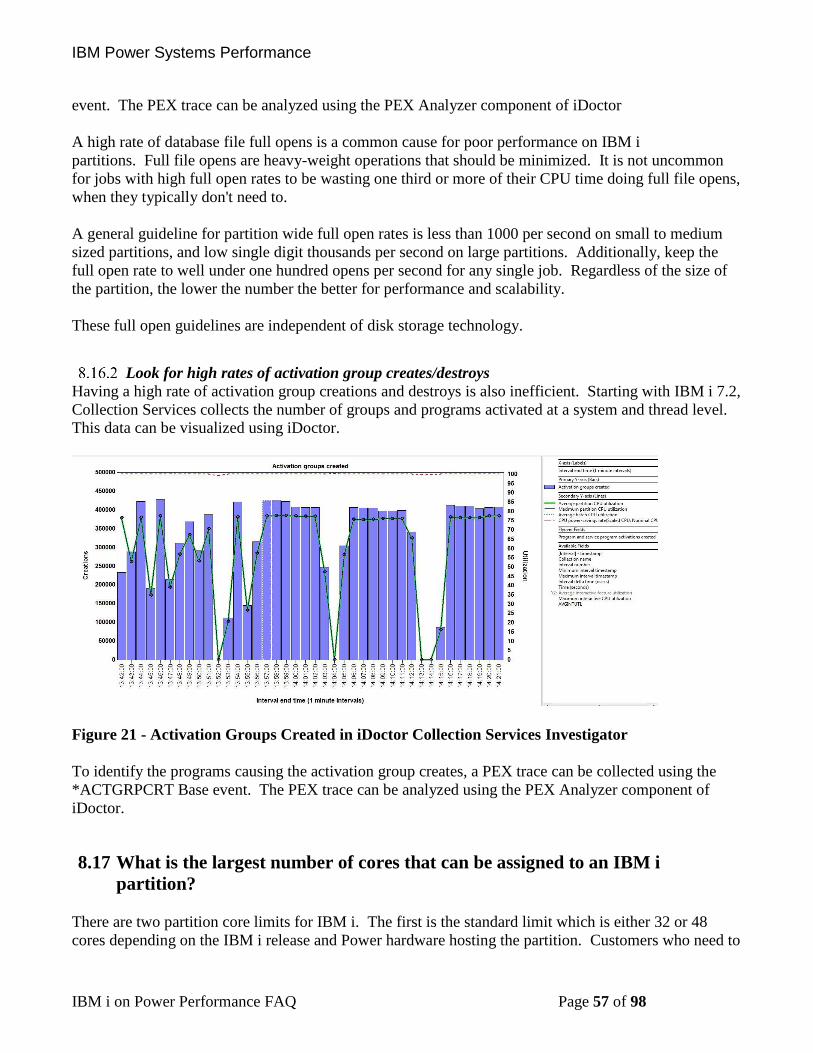
IBM Power Systems Performance
IBM i on Power Performance FAQ Page 57 of 98
event. The PEX trace can be analyzed using the PEX Analyzer component of iDoctor
A high rate of database file full opens is a common cause for poor performance on IBM i
partitions. Full file opens are heavy-weight operations that should be minimized. It is not uncommon
for jobs with high full open rates to be wasting one third or more of their CPU time doing full file opens,
when they typically don't need to.
A general guideline for partition wide full open rates is less than 1000 per second on small to medium
sized partitions, and low single digit thousands per second on large partitions. Additionally, keep the
full open rate to well under one hundred opens per second for any single job. Regardless of the size of
the partition, the lower the number the better for performance and scalability.
These full open guidelines are independent of disk storage technology.
Look for high rates of activation group creates/destroys
Having a high rate of activation group creations and destroys is also inefficient. Starting with IBM i 7.2,
Collection Services collects the number of groups and programs activated at a system and thread level.
This data can be visualized using iDoctor.
Figure 21 - Activation Groups Created in iDoctor Collection Services Investigator
To identify the programs causing the activation group creates, a PEX trace can be collected using the
*ACTGRPCRT Base event. The PEX trace can be analyzed using the PEX Analyzer component of
iDoctor.
8.17 What is the largest number of cores that can be assigned to an IBM i
partition?
There are two partition core limits for IBM i. The first is the standard limit which is either 32 or 48
cores depending on the IBM i release and Power hardware hosting the partition. Customers who need to
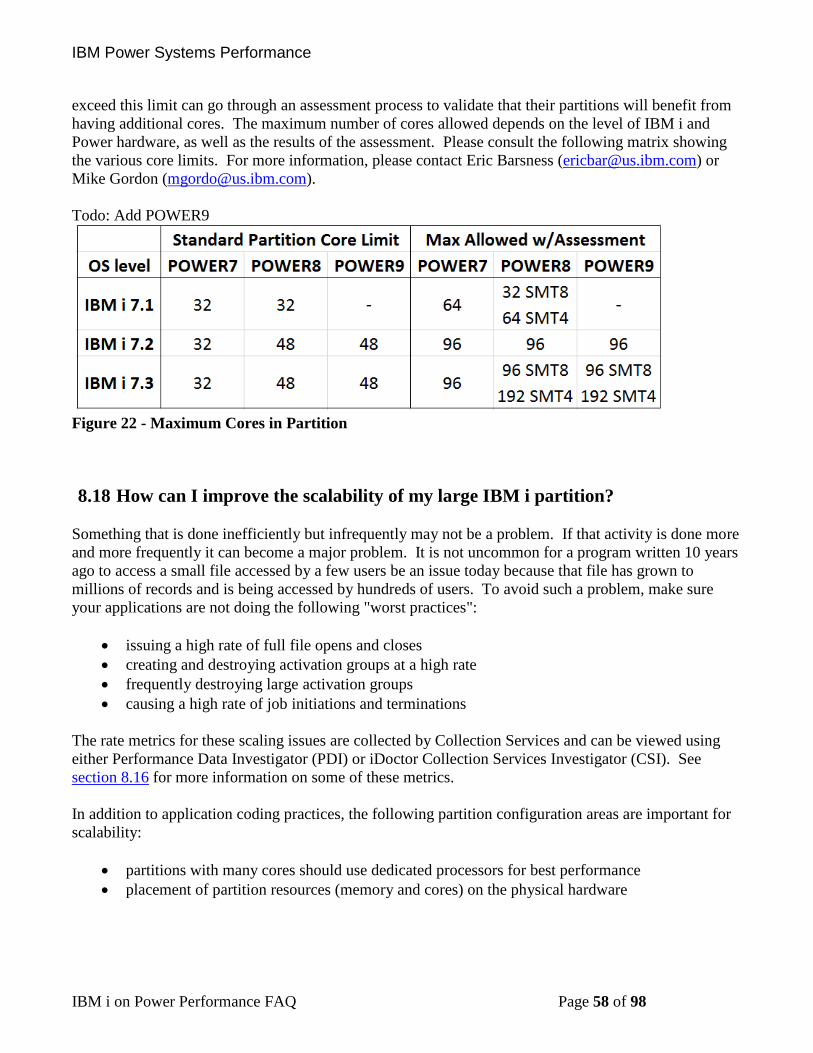
IBM Power Systems Performance
IBM i on Power Performance FAQ Page 58 of 98
exceed this limit can go through an assessment process to validate that their partitions will benefit from
having additional cores. The maximum number of cores allowed depends on the level of IBM i and
Power hardware, as well as the results of the assessment. Please consult the following matrix showing
the various core limits. For more information, please contact Eric Barsness ([email protected]) or
Mike Gordon ([email protected]).
Todo: Add POWER9
Figure 22 - Maximum Cores in Partition
8.18 How can I improve the scalability of my large IBM i partition?
Something that is done inefficiently but infrequently may not be a problem. If that activity is done more
and more frequently it can become a major problem. It is not uncommon for a program written 10 years
ago to access a small file accessed by a few users be an issue today because that file has grown to
millions of records and is being accessed by hundreds of users. To avoid such a problem, make sure
your applications are not doing the following "worst practices":
• issuing a high rate of full file opens and closes
• creating and destroying activation groups at a high rate
• frequently destroying large activation groups
• causing a high rate of job initiations and terminations
The rate metrics for these scaling issues are collected by Collection Services and can be viewed using
either Performance Data Investigator (PDI) or iDoctor Collection Services Investigator (CSI). See
section 8.16 for more information on some of these metrics.
In addition to application coding practices, the following partition configuration areas are important for
scalability:
• partitions with many cores should use dedicated processors for best performance
• placement of partition resources (memory and cores) on the physical hardware
IBM Power Systems Performance
IBM i on Power Performance FAQ Page 59 of 98
8.19 Where can I find more information on performance tuning? The IBM i Knowledge Center is a great resource for learning about performance tuning. The top level
link for tuning system performance is:
Monitoring and Managing Performance
The References chapter has many more links related to performance.
8.20 IBM Lab Services and Training
The IBM Systems Lab Services and Training organization
http://www-03.ibm.com/systems/services/labservices/
is available to assist customers with resolving system, application, and database performance problems.
Formal and informal training opportunities are also available where customers learn how to use the
performance tools and resolve performance problems on their own. The IBM i performance team can be
contacted via e-mail to Eric Barsness at [email protected].
The IBM Db2 Center of Excellence team in Lab Services is also available to help clients in all areas of
Db2 on i including Business Intelligence (BI), Analytics, Db2 Web Query, database modernization,
Very Large Database (VLDB) design, performance, and more. Contact Mike Cain at
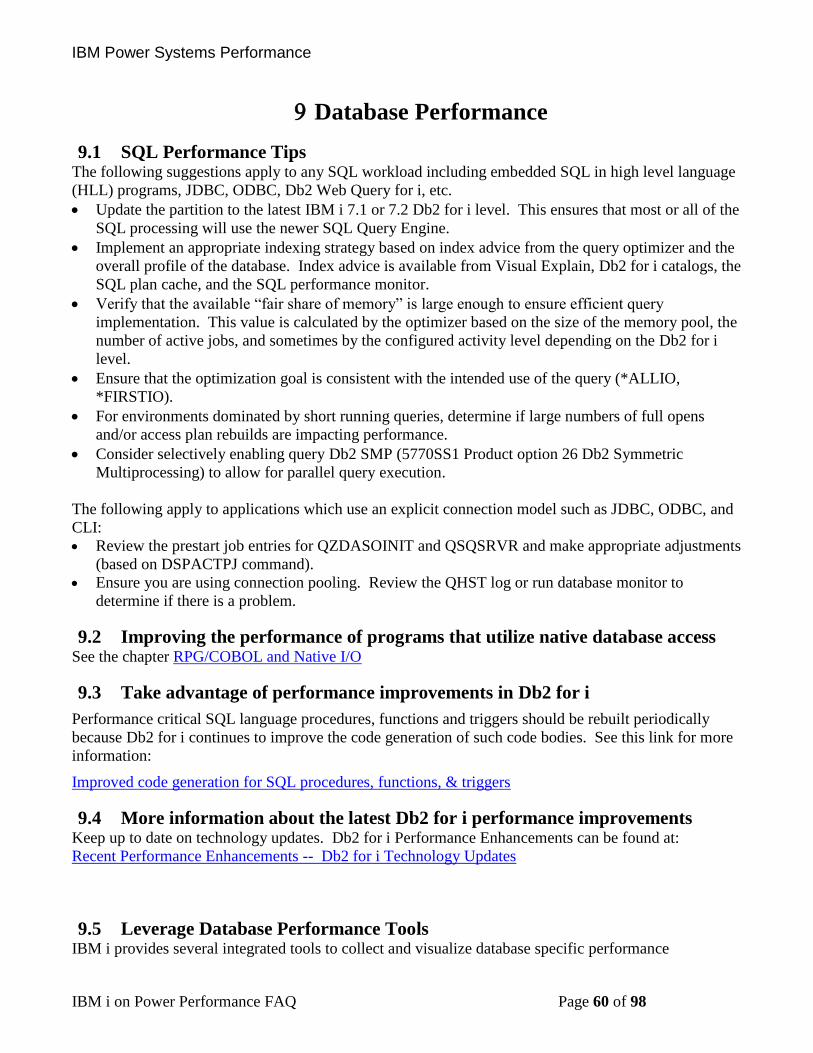
IBM Power Systems Performance
IBM i on Power Performance FAQ Page 60 of 98
Database Performance
9.1 SQL Performance Tips The following suggestions apply to any SQL workload including embedded SQL in high level language
(HLL) programs, JDBC, ODBC, Db2 Web Query for i, etc.
• Update the partition to the latest IBM i 7.1 or 7.2 Db2 for i level. This ensures that most or all of the
SQL processing will use the newer SQL Query Engine.
• Implement an appropriate indexing strategy based on index advice from the query optimizer and the
overall profile of the database. Index advice is available from Visual Explain, Db2 for i catalogs, the
SQL plan cache, and the SQL performance monitor.
• Verify that the available “fair share of memory” is large enough to ensure efficient query
implementation. This value is calculated by the optimizer based on the size of the memory pool, the
number of active jobs, and sometimes by the configured activity level depending on the Db2 for i
level.
• Ensure that the optimization goal is consistent with the intended use of the query (*ALLIO,
*FIRSTIO).
• For environments dominated by short running queries, determine if large numbers of full opens
and/or access plan rebuilds are impacting performance.
• Consider selectively enabling query Db2 SMP (5770SS1 Product option 26 Db2 Symmetric
Multiprocessing) to allow for parallel query execution.
The following apply to applications which use an explicit connection model such as JDBC, ODBC, and
CLI:
• Review the prestart job entries for QZDASOINIT and QSQSRVR and make appropriate adjustments
(based on DSPACTPJ command).
• Ensure you are using connection pooling. Review the QHST log or run database monitor to
determine if there is a problem.
9.2 Improving the performance of programs that utilize native database access See the chapter RPG/COBOL and Native I/O
9.3 Take advantage of performance improvements in Db2 for i
Performance critical SQL language procedures, functions and triggers should be rebuilt periodically
because Db2 for i continues to improve the code generation of such code bodies. See this link for more
information:
Improved code generation for SQL procedures, functions, & triggers
9.4 More information about the latest Db2 for i performance improvements Keep up to date on technology updates. Db2 for i Performance Enhancements can be found at:
Recent Performance Enhancements -- Db2 for i Technology Updates
9.5 Leverage Database Performance Tools IBM i provides several integrated tools to collect and visualize database specific performance
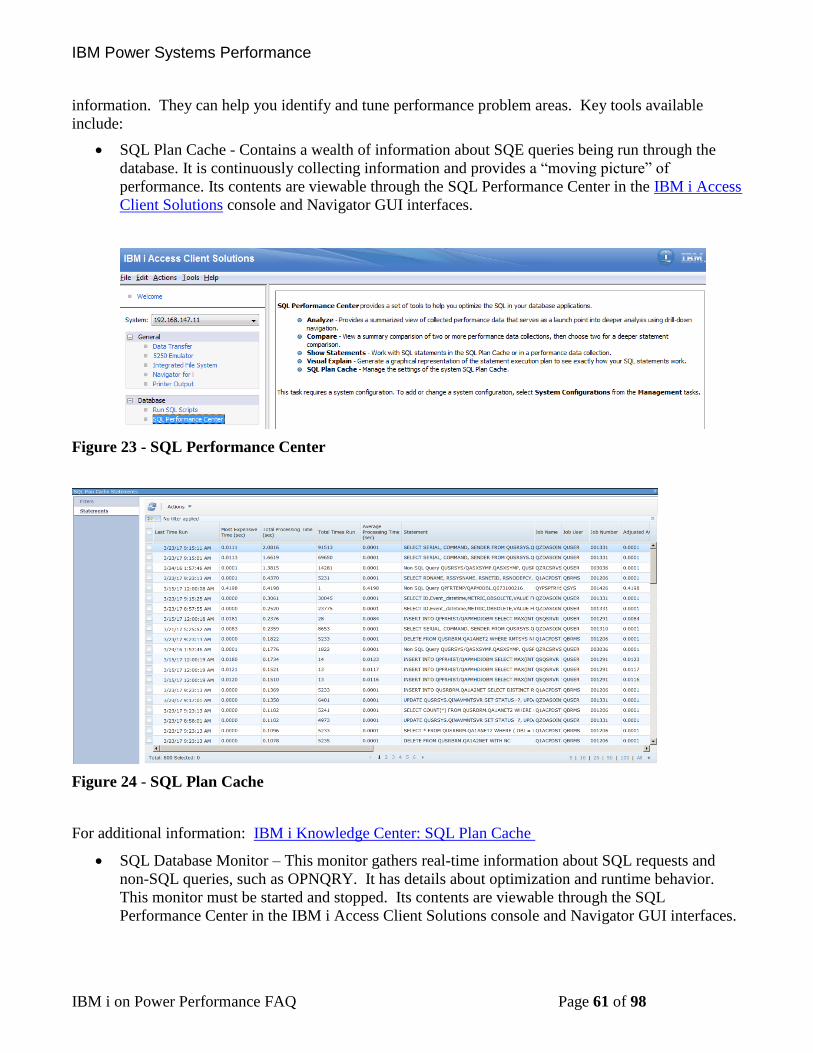
IBM Power Systems Performance
IBM i on Power Performance FAQ Page 61 of 98
information. They can help you identify and tune performance problem areas. Key tools available
include:
• SQL Plan Cache - Contains a wealth of information about SQE queries being run through the
database. It is continuously collecting information and provides a “moving picture” of
performance. Its contents are viewable through the SQL Performance Center in the IBM i Access
Client Solutions console and Navigator GUI interfaces.
Figure 23 - SQL Performance Center
Figure 24 - SQL Plan Cache
For additional information: IBM i Knowledge Center: SQL Plan Cache
• SQL Database Monitor – This monitor gathers real-time information about SQL requests and
non-SQL queries, such as OPNQRY. It has details about optimization and runtime behavior.
This monitor must be started and stopped. Its contents are viewable through the SQL
Performance Center in the IBM i Access Client Solutions console and Navigator GUI interfaces.
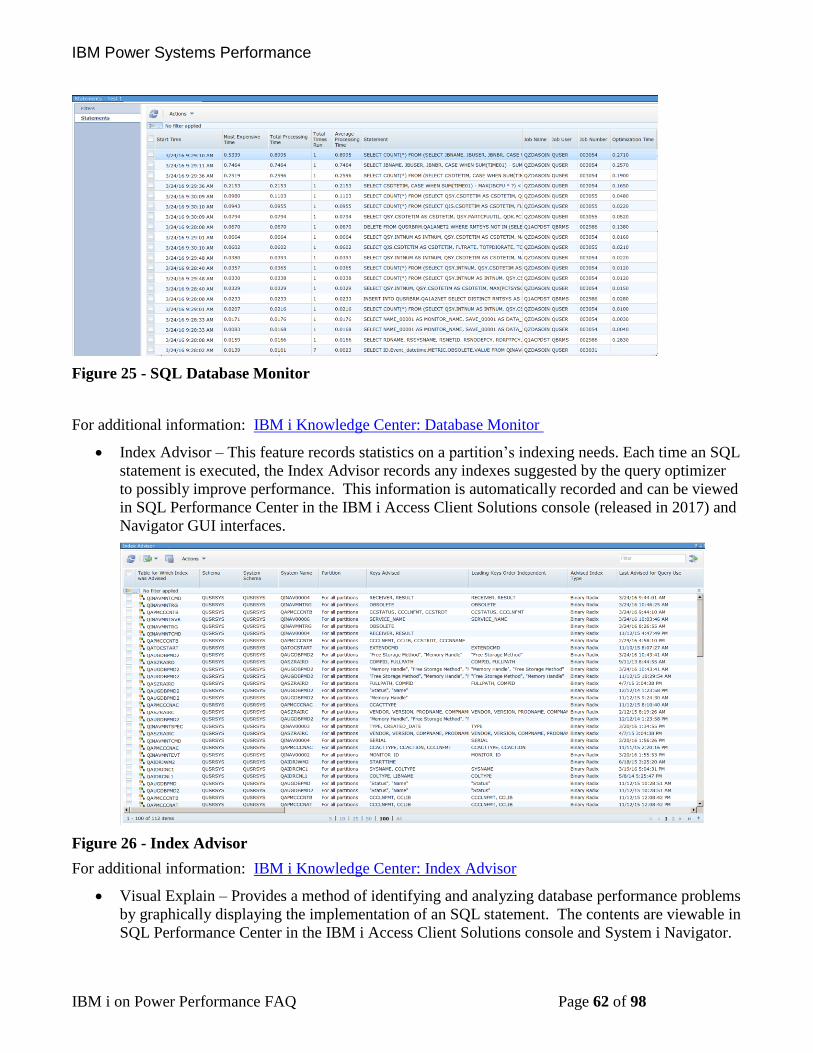
IBM Power Systems Performance
IBM i on Power Performance FAQ Page 62 of 98
Figure 25 - SQL Database Monitor
For additional information: IBM i Knowledge Center: Database Monitor
• Index Advisor – This feature records statistics on a partition’s indexing needs. Each time an SQL
statement is executed, the Index Advisor records any indexes suggested by the query optimizer
to possibly improve performance. This information is automatically recorded and can be viewed
in SQL Performance Center in the IBM i Access Client Solutions console (released in 2017) and
Navigator GUI interfaces.
Figure 26 - Index Advisor
For additional information: IBM i Knowledge Center: Index Advisor
• Visual Explain – Provides a method of identifying and analyzing database performance problems
by graphically displaying the implementation of an SQL statement. The contents are viewable in
SQL Performance Center in the IBM i Access Client Solutions console and System i Navigator.
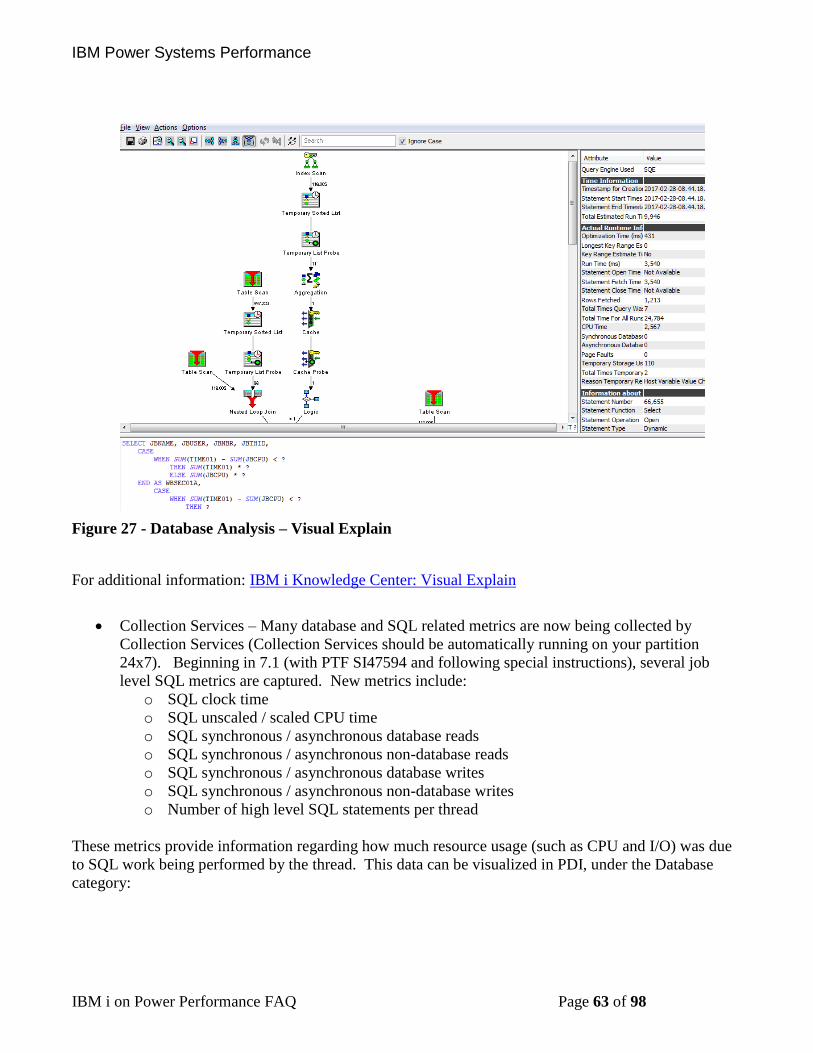
IBM Power Systems Performance
IBM i on Power Performance FAQ Page 63 of 98
Figure 27 - Database Analysis – Visual Explain
For additional information: IBM i Knowledge Center: Visual Explain
• Collection Services – Many database and SQL related metrics are now being collected by
Collection Services (Collection Services should be automatically running on your partition
24x7). Beginning in 7.1 (with PTF SI47594 and following special instructions), several job
level SQL metrics are captured. New metrics include:
o SQL clock time
o SQL unscaled / scaled CPU time
o SQL synchronous / asynchronous database reads
o SQL synchronous / asynchronous non-database reads
o SQL synchronous / asynchronous database writes
o SQL synchronous / asynchronous non-database writes
o Number of high level SQL statements per thread
These metrics provide information regarding how much resource usage (such as CPU and I/O) was due
to SQL work being performed by the thread. This data can be visualized in PDI, under the Database
category:
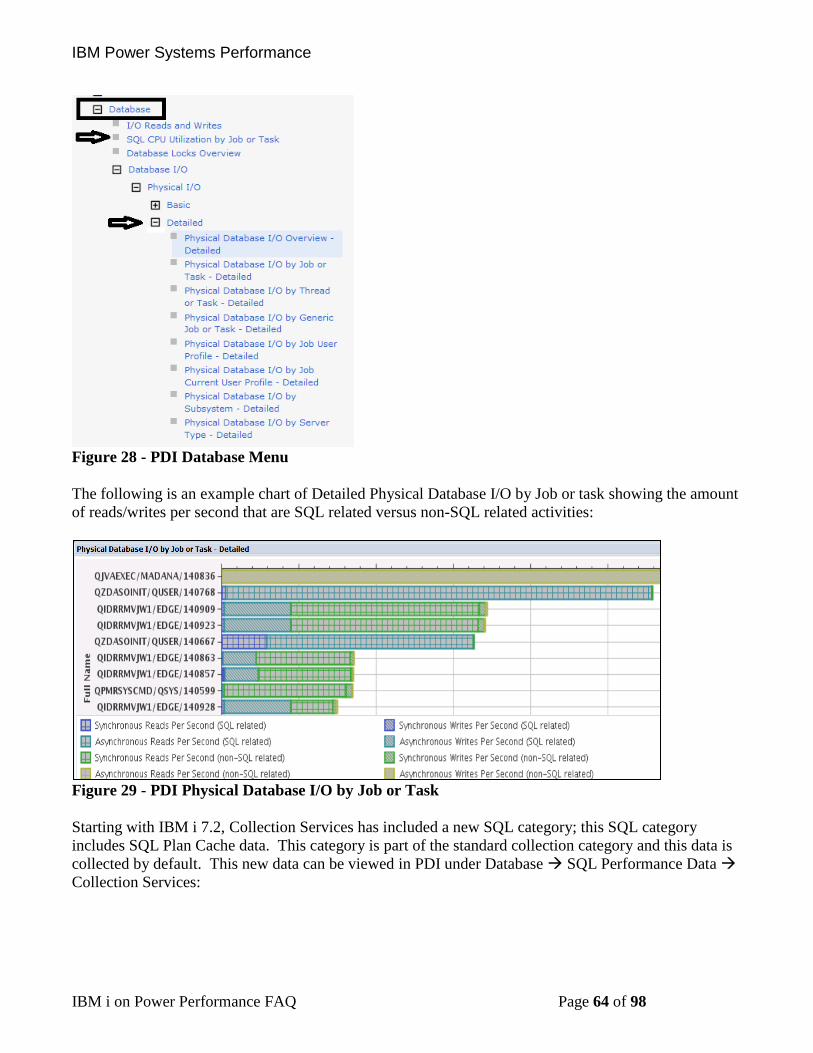
IBM Power Systems Performance
IBM i on Power Performance FAQ Page 64 of 98
Figure 28 - PDI Database Menu
The following is an example chart of Detailed Physical Database I/O by Job or task showing the amount
of reads/writes per second that are SQL related versus non-SQL related activities:
Figure 29 - PDI Physical Database I/O by Job or Task
Starting with IBM i 7.2, Collection Services has included a new SQL category; this SQL category
includes SQL Plan Cache data. This category is part of the standard collection category and this data is
collected by default. This new data can be viewed in PDI under Database → SQL Performance Data →
Collection Services:
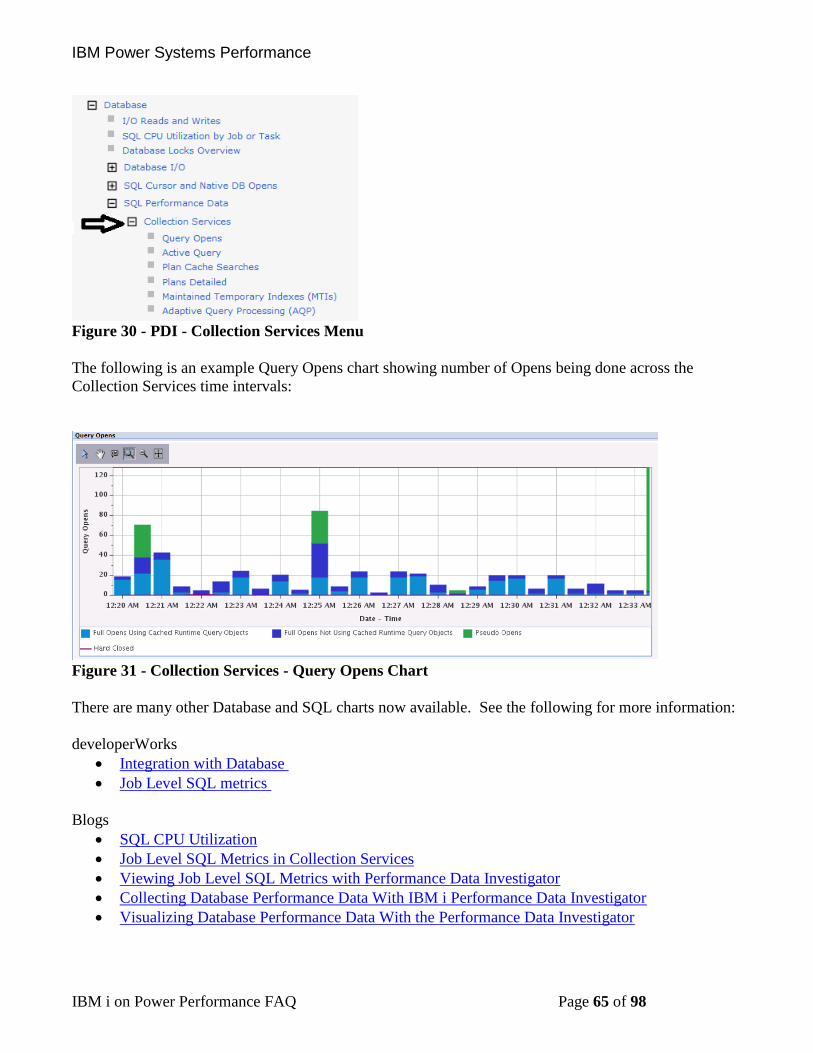
IBM Power Systems Performance
IBM i on Power Performance FAQ Page 65 of 98
Figure 30 - PDI - Collection Services Menu
The following is an example Query Opens chart showing number of Opens being done across the
Collection Services time intervals:
Figure 31 - Collection Services - Query Opens Chart
There are many other Database and SQL charts now available. See the following for more information:
developerWorks
• Integration with Database
• Job Level SQL metrics
Blogs
• SQL CPU Utilization
• Job Level SQL Metrics in Collection Services
• Viewing Job Level SQL Metrics with Performance Data Investigator
• Collecting Database Performance Data With IBM i Performance Data Investigator
• Visualizing Database Performance Data With the Performance Data Investigator
IBM Power Systems Performance
IBM i on Power Performance FAQ Page 66 of 98
9.6 More information on Db2 for i performance and support The Db2 for i homepage can be found at:
IBM Db2 for i
The IBM i Knowledge Center has a section on SQL performance:
SQL Performance
There are more links related to database performance in the References chapter.
IBM Power Systems Performance
IBM i on Power Performance FAQ Page 67 of 98
IBM i Services
10.1 Introduction
There are many system services that can be accessed through system-provided SQL views, procedures,
and functions. These provide an SQL interface to access, transform, order, and subset the information
without needing to code to a system API.
In order to take advantage of the IBM i Services, you need a basic understanding of SQL. The Db2 for i
SQL Reference is a good place for getting started with SQL as well as a great reference for those who
are experts.
Certainly some of the IBM i Services just provide another way to get at information you can already
access via commands or APIs. But there are some services that provide access to information that
otherwise might be difficult to get. A few examples are:
• System Health Services provide the capability to programmatically get at system limit
information. Are you near the system limits for files or jobs or journals (or many other limits)?
How do you know? System health services can help you answer that question.
• System temporary storage (SYSTMPSTG) service provides a programmatic interface to identify
where the temporary storage allocations have been made. (This is 7.2 only.)
• PTF Group Currency service provides a capability to check your installed PTF groups with the
levels that are available on Fix Central
10.2 IBM i services currently available • Application Services
These procedures and views provide interfaces that can be used in applications.
• Communication Services
These views and procedure provide communication information.
• Java Services
This view and procedure provide Java information and JVM management options.
• Journal Services
This function and view provide journal information.
• Librarian Services
These services provide object and library list information.
• Message Handling Services
These views provide system message information.
• Product Services
These services provide information about licensed products.
• PTF Services
These views provide PTF information.
• Security Services
These views, procedures, and functions provide security information.
• Spool Services
This view and function provide information about spooled files.
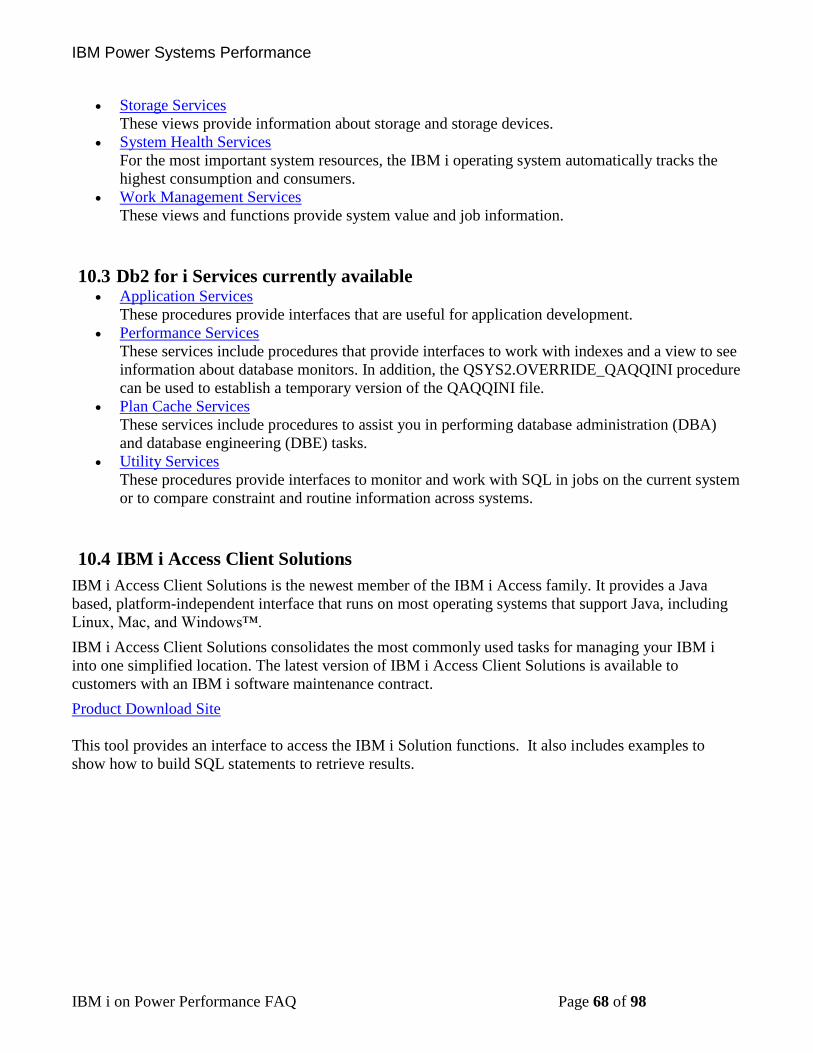
IBM Power Systems Performance
IBM i on Power Performance FAQ Page 68 of 98
• Storage Services
These views provide information about storage and storage devices.
• System Health Services
For the most important system resources, the IBM i operating system automatically tracks the
highest consumption and consumers.
• Work Management Services
These views and functions provide system value and job information.
10.3 Db2 for i Services currently available • Application Services
These procedures provide interfaces that are useful for application development.
• Performance Services
These services include procedures that provide interfaces to work with indexes and a view to see
information about database monitors. In addition, the QSYS2.OVERRIDE_QAQQINI procedure
can be used to establish a temporary version of the QAQQINI file.
• Plan Cache Services
These services include procedures to assist you in performing database administration (DBA)
and database engineering (DBE) tasks.
• Utility Services
These procedures provide interfaces to monitor and work with SQL in jobs on the current system
or to compare constraint and routine information across systems.
10.4 IBM i Access Client Solutions
IBM i Access Client Solutions is the newest member of the IBM i Access family. It provides a Java
based, platform-independent interface that runs on most operating systems that support Java, including
Linux, Mac, and Windows™.
IBM i Access Client Solutions consolidates the most commonly used tasks for managing your IBM i
into one simplified location. The latest version of IBM i Access Client Solutions is available to
customers with an IBM i software maintenance contract.
Product Download Site
This tool provides an interface to access the IBM i Solution functions. It also includes examples to
show how to build SQL statements to retrieve results.
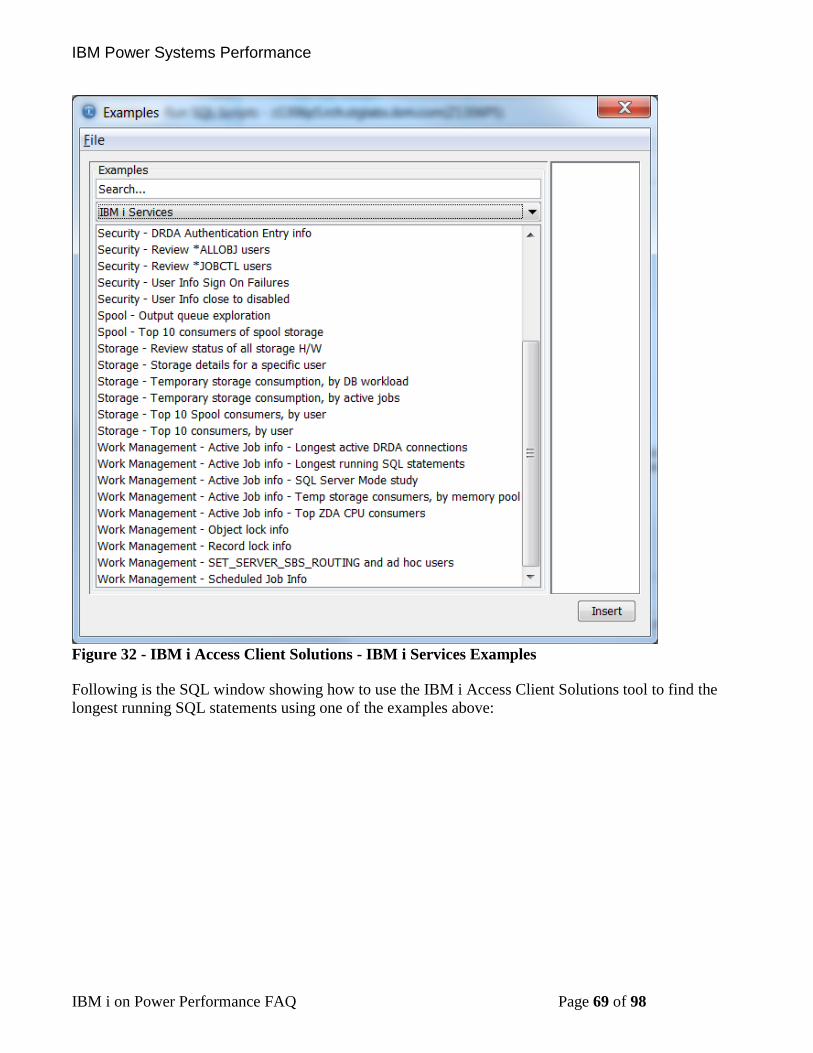
IBM Power Systems Performance
IBM i on Power Performance FAQ Page 69 of 98
Figure 32 - IBM i Access Client Solutions - IBM i Services Examples
Following is the SQL window showing how to use the IBM i Access Client Solutions tool to find the
longest running SQL statements using one of the examples above:
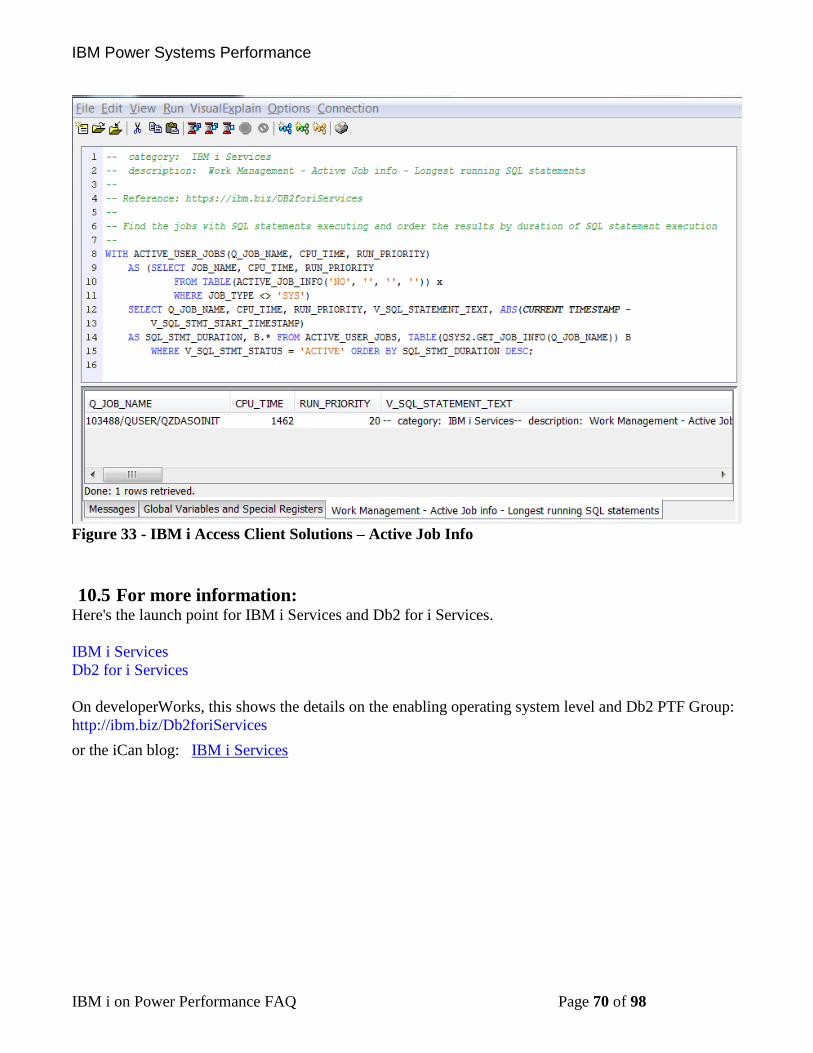
IBM Power Systems Performance
IBM i on Power Performance FAQ Page 70 of 98
Figure 33 - IBM i Access Client Solutions – Active Job Info
10.5 For more information: Here's the launch point for IBM i Services and Db2 for i Services.
IBM i Services
Db2 for i Services
On developerWorks, this shows the details on the enabling operating system level and Db2 PTF Group:
http://ibm.biz/Db2foriServices
or the iCan blog: IBM i Services
IBM Power Systems Performance
IBM i on Power Performance FAQ Page 71 of 98
RPG/COBOL and Native I/O
11.1 Introduction This section discusses methods for improving the performance of applications written in RPG or
COBOL and those programs that are accessing data using native IO operations.
11.2 CPU performance tips RPG and COBOL programs are optimized to run on IBM i with every release and will adopt the latest
processor enhancements when compiled or when re-translated as required, for example when moving
from IBM i 5.4 to 6.1 or 7.1.
However, additional optimization can be done over and above what the compilers and the translator
provide in order to improve performance in terms of runtime or CPU. Some of the following
optimization techniques will trade off better optimization with the capability to debug the code, so be
aware when deciding to use program optimization. It is generally good practice to select a few highly
used programs with intense use of CPU cycles and perform optimization and when debugging is not
required any longer. Some of these performance optimization techniques can be very significant and
worth the effort for highly used programs in the interactive or batch environment.
Compiler Options
Optimize the use of processors by specifying the OPTIMIZE parameter on the CRTRPGMOD and
CRTBNDRPG command, e.g. OPTIMIZE(*BASIC or *FULL). You can also use the commands
CHGMOD, CHGPGM or CHGSRVPGM and the parameter OPTIMIZE(*YES) to optimize instructions
being executed within your program. For more information see:
Create Bound RPG Program
Optimize the use of program arguments by using the parameter ARGOPT(*YES) on the CRTPGM and
CRTSRVPGM commands. For more information see:
Improve Performance with Argument Optimization
Control program activation by the activation keyword (*DEFER) with the bind service program
parameter on the CRTPGM, CRTSRVPGM, UPDPGM and UPDSRVPGM commands. For more
information see:
Activate Your Programs On Demand
Profiling
Optimize your ILE RPG or COBOL programs by profiling and collecting procedure execution
information and applying them to optimize the program structures and instruction flows. For more
information read:
Find Hot Spots Using Program Profiling
Identifying hot programs (programs which use most of the resources) within your application with
Performance Explorer and the PEX definition *STATS. For more information read:
Using Performance Explorers *STATS and *PROFILE/PGM Functions
Identifying hot statements of programs (actual statements of programs which use most of the resources)
within your application with Performance Explorer and the PEX definition *PROFILE. For more
IBM Power Systems Performance
IBM i on Power Performance FAQ Page 72 of 98
information read:
Using Performance Explorers *STATS and *PROFILE/PGM Functions
11.3 IO performance tips
General tips
Use higher blocking for input/output only operations – SEQONLY((*YES #rcds)) >= 128KB. More
information on increasing logical page size in DB operations can be found here:
Sequential-only processing of database files
Avoid open/close of files, use RETRN vs SETON *LR in RPG
Tips: Run and call IBM i procedures
Eliminate FRCRATIO(1) to prevent every update/write to be forced out to disk
FRCRATIO parameter
The number of physical I/Os can be significantly reduced by using the SETOBJACC command and
pinning a database file or index into a private memory pool which is not used by anything else. Read
more at:
SETOBJACC/CLRPOOL Commands
Database modernization
For applications which are dominated by database processing, performance can often be improved by
converting existing high level language programs from native IO (record level access) to SQL set base
processing. IBM has a well-established process for this kind of database modernization which takes
advantage of the SQL query optimizer’s advanced capabilities while minimizing the impacts to existing
programs.
See the IBM Db2 for i education website for more information on classes and resources for database
processing.
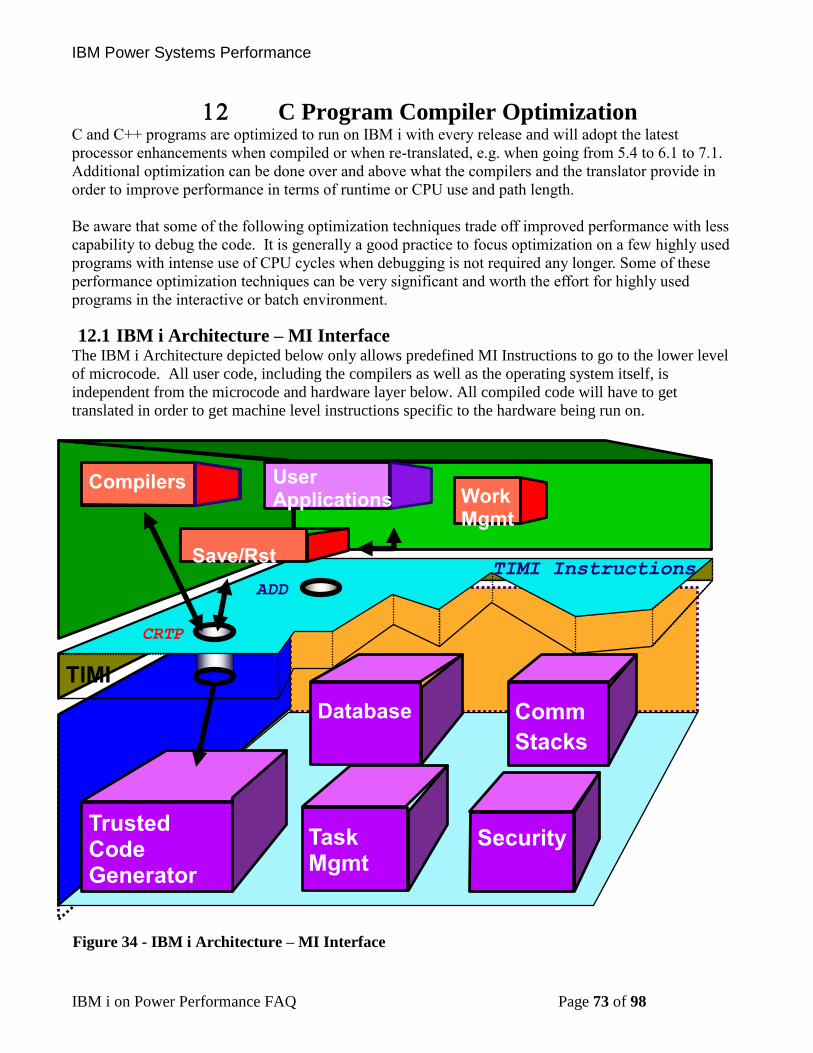
IBM Power Systems Performance
IBM i on Power Performance FAQ Page 73 of 98
C Program Compiler Optimization C and C++ programs are optimized to run on IBM i with every release and will adopt the latest
processor enhancements when compiled or when re-translated, e.g. when going from 5.4 to 6.1 to 7.1.
Additional optimization can be done over and above what the compilers and the translator provide in
order to improve performance in terms of runtime or CPU use and path length.
Be aware that some of the following optimization techniques trade off improved performance with less
capability to debug the code. It is generally a good practice to focus optimization on a few highly used
programs with intense use of CPU cycles when debugging is not required any longer. Some of these
performance optimization techniques can be very significant and worth the effort for highly used
programs in the interactive or batch environment.
12.1 IBM i Architecture – MI Interface The IBM i Architecture depicted below only allows predefined MI Instructions to go to the lower level
of microcode. All user code, including the compilers as well as the operating system itself, is
independent from the microcode and hardware layer below. All compiled code will have to get
translated in order to get machine level instructions specific to the hardware being run on.
Trusted Code Generator
Database Comm
Stacks
Security Task Mgmt
Compilers
TIMI
ADD
N
CRTP
G
TIMI Instructions
Compilers User Applications Work
Mgmt
Save/Rst
Figure 34 - IBM i Architecture – MI Interface
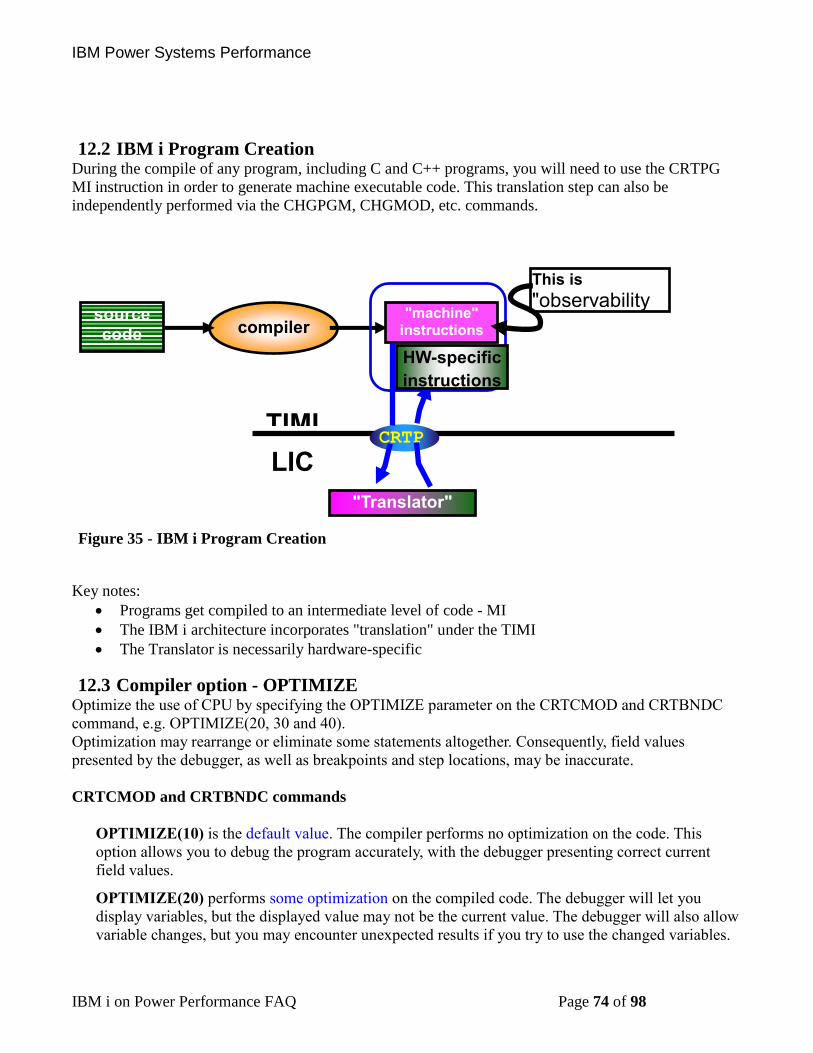
IBM Power Systems Performance
IBM i on Power Performance FAQ Page 74 of 98
12.2 IBM i Program Creation During the compile of any program, including C and C++ programs, you will need to use the CRTPG
MI instruction in order to generate machine executable code. This translation step can also be
independently performed via the CHGPGM, CHGMOD, etc. commands.
Key notes:
• Programs get compiled to an intermediate level of code - MI
• The IBM i architecture incorporates "translation" under the TIMI
• The Translator is necessarily hardware-specific
12.3 Compiler option - OPTIMIZE Optimize the use of CPU by specifying the OPTIMIZE parameter on the CRTCMOD and CRTBNDC
command, e.g. OPTIMIZE(20, 30 and 40). Optimization may rearrange or eliminate some statements altogether. Consequently, field values
presented by the debugger, as well as breakpoints and step locations, may be inaccurate.
CRTCMOD and CRTBNDC commands
OPTIMIZE(10) is the default value. The compiler performs no optimization on the code. This
option allows you to debug the program accurately, with the debugger presenting correct current
field values.
OPTIMIZE(20) performs some optimization on the compiled code. The debugger will let you
display variables, but the displayed value may not be the current value. The debugger will also allow
variable changes, but you may encounter unexpected results if you try to use the changed variables.
source code compiler
"machine" instructions
Thing
TIMI CRTP
G
HW-specific
instructions
"Translator"
LIC
This is "observability"
Figure 35 - IBM i Program Creation
IBM Power Systems Performance
IBM i on Power Performance FAQ Page 75 of 98
OPTIMIZE(30) generates more efficient code than level 20. More optimizations are performed in
addition to those performed at level 20, and the compile process takes longer. The debugger will let
you see (but not change) field values, but the debugger may not show you the correct current field
values.
OPTIMIZE(40) generates the most efficient code. All optimizations done at level 30 are performed
on the generated code. In addition, code is eliminated from procedure prologue and epilogue routines
that enable instruction trace and call trace system functions. Eliminating this code enables the
creation of leaf procedures. A leaf procedure is a procedure that does not require an invocation
frame to be stacked. Procedure call performance to a leaf procedure is significantly faster than to a
normal procedure.
CHGMOD, CHGPGM or CHGSRVPGM commands
You can also use the commands CHGMOD, CHGPGM or CHGSRVPGM and the parameter
OPTIMIZE(*YES) to optimize instructions being executed within your program. The DSPMOD,
DSPPGM, and DSPSRVPGM commands will show you the current level of optimization for an object.
You can change optimization levels with the CHGMOD, CHGPGM, or CHGSRVPGM commands;
these commands support the levels already discussed, but also add other options:
OPTIMIZE(*NONE|*NO|10) -- These options are equivalent, and are discussed above.
OPTIMIZE(*NO) is used only by the CHGPGM command.
OPTIMIZE(*BASIC|20) -- These options are equivalent, and are discussed above.
OPTIMIZE(*FULL|30) -- These options are equivalent, and are discussed above.
OPTIMIZE(*YES|40) -- This is the highest possible optimization level. In addition to all level
30 optimization, level 40 performs optimization that reduces the capability to provide extensive
call and instruction tracing.
OPTIMIZE(*YES) is used only by the CHGPGM command.
More Information how to use the CRTBNDC command:
Create Bound C Program (CRTBNDC)
12.4 Program profiling Optimize your ILE C programs by profiling and collecting procedure execution information and
applying that information to optimize the program structures and instruction flows. This is an advanced
optimization technique that reorders procedures, or code within procedures, in ILE programs and service
programs based on statistical data gathered while running the program. This reordering can improve
instruction cache utilization and reduce paging required by the program, thereby improving
performance.
Note: The semantic behavior of the program is not affected by program profiling.
The performance improvement realized by program profiling depends on the type of application and you
can expect more improvement from programs that spend the majority of time in the application code
itself, rather than spending time in the operating system or doing input/output processing.
The performance of program code produced when applying profile data depends upon the optimizing
translator correctly identifying the most important portions of the program during typical use.
IBM Power Systems Performance
IBM i on Power Performance FAQ Page 76 of 98
Therefore, it is important to gather profile data while performing the tasks that will be performed by end
users, and using input data that is similar to that expected in the environment in which the program will
be run.
Note: Program profiling is available only for ILE programs and service programs that are compiled
using optimization level 30 or 40. Because of the optimization requirements, you should fully debug
your programs before using program profiling.
To enable the program to collect profiling data:
• Compile your ILE program(s) using the PRFDTA(*COL) option.
• Start the program profiling collection on the system with the Start Program Profiling
(STRPGMPRF) command.
• Collect profiling data by running the program through its high-use code paths. Because program
profiling uses statistical data gathered while running the program to perform these optimizations, it
is critical that this data be collected over typical uses of your application.
• End the program profiling collection on the system with the End Program Profiling (ENDPGMPRF)
command.
• Apply the collected profiling data to the program by requesting that code be reordered for optimal
performance based on the collected profiling data using the PRFDTA(*APYALL) option.
More Information how to find program hot spots can be found here:
Find Hot Spots Using Program Profiling
12.5 Advanced Argument Optimization Advanced argument optimization is a cross-module optimization that is used to improve the
performance of programs that contain frequently run procedure calls, including C++ applications that
make mostly non-virtual method calls. Improved runtime performance is achieved by enabling the
translator and binder to use the most efficient mechanisms to pass parameters and return results between
procedures that are called within a program or service program.
The Argument optimization (ARGOPT) parameter, with *YES and *NO as possible values, is available
on the CRTPGM and CRTSRVPGM commands to support advanced argument optimization. Specifying
ARGOPT(*YES) causes the program or service program to be created with advanced argument
optimization. The default is *NO.
Note: For programs that consist of hundreds or thousands of modules, creation time can be
significantly longer using this option.
More Information how to perform argument optimization, please read the following article:
Improve Performance with Argument Optimization
12.6 Interprocedural analysis (IPA) At compile time, the optimizing translator performs both intraprocedural and interprocedural analysis.
Intraprocedural analysis is a mechanism for performing optimization for each function within a
compilation unit, using only the information available for that function and compilation unit.
IBM Power Systems Performance
IBM i on Power Performance FAQ Page 77 of 98
Interprocedural analysis is a mechanism for performing optimization across function boundaries. The
optimizing translator performs interprocedural analysis, but only within a compilation unit.
Interprocedural analysis that is performed by the IPA compiler option improves on the limited
interprocedural analysis described above. When you run interprocedural analysis through the IPA option,
IPA performs optimizations across the entire program. It also performs optimizations not otherwise
available at compile time with the optimizing translator.
In order to optimize your program or service program with the Inter Procedural Analysis function, make
sure that:
• all modules have the parameter MODCRTOPT(*KEEPILDATA) specified and are compiled with
an optimization level of 20 or higher
• and the parameter IPA(*YES) is specified on the CRTPGM or CRTSRVPGM command
More information on additional optimization with IPA can be found in the IBM Knowledge Center at:
Interprocedural analysis (IPA)
IBM Power Systems Performance
IBM i on Power Performance FAQ Page 78 of 98
Java and WebSphere
13.1 Introduction This chapter covers best practices for Java and WebSphere Application Server performance. Most of the
Java questions apply to WebSphere applications.
13.2 Does it matter if I use the 32-bit versus 64-bit JVM? For best performance, use the 32-bit JVM unless the memory requirement of the application requires the
larger heap sizes supported by the 64-bit environment. When using the 64 bit JVM, compressed
references (-Xcompressedrefs) can be used to reduce memory requirements.
13.3 I’m using an old JDK level and am behind on PTFs, is that okay? No, for best performance use the most current JDK level you can and apply the latest PTFs.
13.4 Should I run my JVMs in a separate memory pool? Yes, JVMs should run in a memory pool configured with enough memory to hold all JVMs at their
maximum heap size. WRKSHRPOOL can be used to set the minimum pool size in percent to ensure the
pool does not shrink too much if QPFRADJ is on. If there is not enough memory in the pool, the JVMs
may become unresponsive due to high page faulting.
13.5 How do I determine the proper GC settings (heap sizes, collection policy, etc.)
for my application? For most customers, the GENCON policy results in the best performance. Other policies and how to set
the minimum and maximum size are discussed in this document:
Best Practices for Sizing and Tuning the Java Heap
Collection Services collects JVM information by default. Use Performance Data Investigator or iDoctor
to visualize Java heap usage system wide and by job. This might be a good starting point to find the
job(s) which are consuming the most Java heap.
Take care not to overcommit the number of garbage collection (GC) threads for your JVM. The default
number of GC threads depends on the number of cores in the partition. It is calculated by the number of
dedicated processors, or virtual processors (VPs) for shared processor partitions, multiplied by the
maximum SMT level minus 1. So a POWER7 partition with 20 VPs would have 79 helper threads per
JVM by default. Each of these threads are concurrently active during garbage collection, which can lead
to CPU queueing, and can limit the amount of CPU available for other work on the partition.
You can control the number of GC helper threads via the –Xgcthreads## setting. This sets the number
of helper threads you want to be used during garbage collection. If you want to use 8 threads, then use –
Xgcthreads08, which will result in one controlling thread and 7 GC helper threads.
Keep in mind that IBM i and the JVM determine the values for Java system properties by using the
following order of precedence:
1) Command line or JNI invocation API
2) QIBM_JAVA_PROPERTIES_FILE environment variable
IBM Power Systems Performance
IBM i on Power Performance FAQ Page 79 of 98
3) user.home SystemDefault.properties file
4) /QIBM/UserData/Java400/SystemDefault.properties
5) Default system property values
Read more in the Knowledge Center:
http://www-01.ibm.com/support/knowledgecenter/ssw_ibm_i_72/rzaha/sysprop.htm?lang=en
13.6 How do I analyze JVM dumps and verbose GC output? Download and install the IBM Support Assistant and install the IBM Monitoring and Diagnostic Tools
for Java toolset. http://www-01.ibm.com/software/support/isa/
13.7 How do I tune Java code? The Java and WebSphere Performance on IBM eServer iSeries Servers Redbook still is a good resource
even though it is from 2002. The recommendations specific to the JVM mostly do not apply anymore,
but the coding tips and techniques are still valid.
http://www.redbooks.ibm.com/abstracts/sg246256.html?Open
13.8 Where can I get more information on Java tuning and debugging? The IBM developer kit Knowledge Center collections have a wealth of information.
https://developer.ibm.com/javasdk/documentation/
13.9 Can I use Job Watcher to collect Java information? By default, Job Watcher does not collect the call stacks of Java threads. The “IBM Technology for
Java” data collection tab in iDoctor can be used to enable the collection of JVM statistics and Java
thread call stacks. IBM supplied definitions ending in “J” include the collection of this additional
information.
13.10 How can I improve the performance of WebSphere Application Server
running on IBM i? - Use the most recent version of WebSphere available.
- Turn off JSP reloading in production environments.
- Use the Fast Response Cache Accelerator (FRCA) for HTTP Server for caching static and dynamic
content. Use the Apache HTTP server cache for secure (SSL) static content.
Fast Response Cache Accelerator (FRCA) for HTTP Server
The WebSphere Application Server Knowledge Center contains information on tuning WebSphere:
Tuning the application serving environment
13.11 How do I tune IBM Toolbox for Java performance?
See the IBM i Knowledge Center section on this topic: IBM Toolbox for Java Performance
13.12 Where can I find additional information?
In the IBM i Knowledge Center Java Performance section: Java Performance for IBM i
IBM Power Systems Performance
IBM i on Power Performance FAQ Page 80 of 98
POWER Systems
14.1 Introduction This chapter covers best practices for POWER Systems performance.
14.2 Simultaneous Multithreading (SMT) and Intelligent Threads POWER8 supports Simultaneous Multithreading (SMT) with eight hardware threads, which provides
more transaction processing capacity per core. Power hardware has had SMT support for many years.
Initially, it was two hardware threads of execution on a processor core. With POWER7, the number of
hardware threads was increased to four. With POWER8, the number of hardware threads was increased
to eight.
Single thread (ST) versus SMT2/SMT4/SMT8
Although it is not generally recommended for most customers, applications that are single process and
single threaded may gain some benefit from running in ST mode. Multithreaded and/or multi process
applications typically benefit more running in higher SMT modes. ST mode may also be beneficial in
the case of applications where the number of application threads is smaller than the number of cores
assigned to the partition. Applications that do not scale with a larger number of CPUs may also benefit
from running in SMT2 or ST mode instead of SMT4 or SMT8 since lower number of SMT threads
means lower number of logical CPUs. This is a partition-wide setting and overall transaction processing
capacity may be reduced by changing from the default mode.
The default mode on POWER7 systems is SMT4. The default mode on POWER8 systems running IBM
i 7.1 TR8 is SMT4 and POWER8 systems running IBM i 7.2 is SMT8. The default mode on POWER9
systems is SMT8.
For detailed information refer to:
Under the Hood: Simultaneous Multi-Threading on POWER7 Processors
and
IBM i 7.2 and IBM POWER8/
Intelligent Threads Technology
POWER9, like POWER8 and POWER7 before it, uses Intelligent Threads technology to maximize
workload performance regardless of the processor's threading context. For POWER9, the technology
has been enhanced to adapt more quickly and with greater efficiency to changes in the workload. If the
POWER9 processor is under-committed, meaning fewer hardware threads are dispatched than are
available, the core performance is roughly the same independent of threading context. So for example,
if one thread is dispatched, performance will be similar in ST, SMT2, SMT4, and SMT8 contexts; if two
threads are dispatched, performance will be similar in SMT2, SMT4, and SMT8 contexts; if three or
four threads are dispatched, performance will be similar in SMT4 and SMT8 contexts.
From a usability standpoint, Intelligent Threads means that system-level processor threading context
adjustments typically aren't necessary in order to maximize workload performance. Highly multi-
threaded workloads can benefit from the additional throughput offered by SMT8 technology, but multi-
threading isn't necessary for a workload to achieve high performance. It just works!
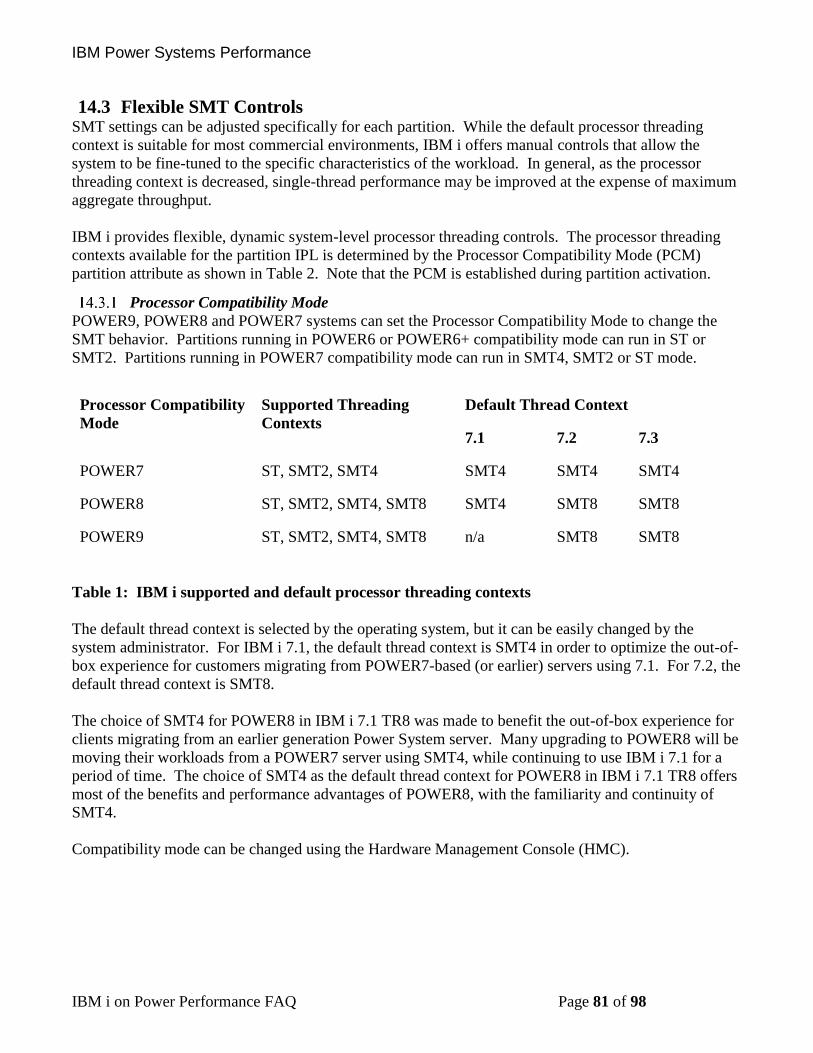
IBM Power Systems Performance
IBM i on Power Performance FAQ Page 81 of 98
14.3 Flexible SMT Controls SMT settings can be adjusted specifically for each partition. While the default processor threading
context is suitable for most commercial environments, IBM i offers manual controls that allow the
system to be fine-tuned to the specific characteristics of the workload. In general, as the processor
threading context is decreased, single-thread performance may be improved at the expense of maximum
aggregate throughput.
IBM i provides flexible, dynamic system-level processor threading controls. The processor threading
contexts available for the partition IPL is determined by the Processor Compatibility Mode (PCM)
partition attribute as shown in Table 2. Note that the PCM is established during partition activation.
Processor Compatibility Mode
POWER9, POWER8 and POWER7 systems can set the Processor Compatibility Mode to change the
SMT behavior. Partitions running in POWER6 or POWER6+ compatibility mode can run in ST or
SMT2. Partitions running in POWER7 compatibility mode can run in SMT4, SMT2 or ST mode.
Processor Compatibility
Mode
Supported Threading
Contexts
Default Thread Context
7.1 7.2 7.3
POWER7 ST, SMT2, SMT4 SMT4 SMT4 SMT4
POWER8 ST, SMT2, SMT4, SMT8 SMT4 SMT8 SMT8
POWER9 ST, SMT2, SMT4, SMT8 n/a SMT8 SMT8
Table 1: IBM i supported and default processor threading contexts
The default thread context is selected by the operating system, but it can be easily changed by the
system administrator. For IBM i 7.1, the default thread context is SMT4 in order to optimize the out-of-
box experience for customers migrating from POWER7-based (or earlier) servers using 7.1. For 7.2, the
default thread context is SMT8.
The choice of SMT4 for POWER8 in IBM i 7.1 TR8 was made to benefit the out-of-box experience for
clients migrating from an earlier generation Power System server. Many upgrading to POWER8 will be
moving their workloads from a POWER7 server using SMT4, while continuing to use IBM i 7.1 for a
period of time. The choice of SMT4 as the default thread context for POWER8 in IBM i 7.1 TR8 offers
most of the benefits and performance advantages of POWER8, with the familiarity and continuity of
SMT4.
Compatibility mode can be changed using the Hardware Management Console (HMC).
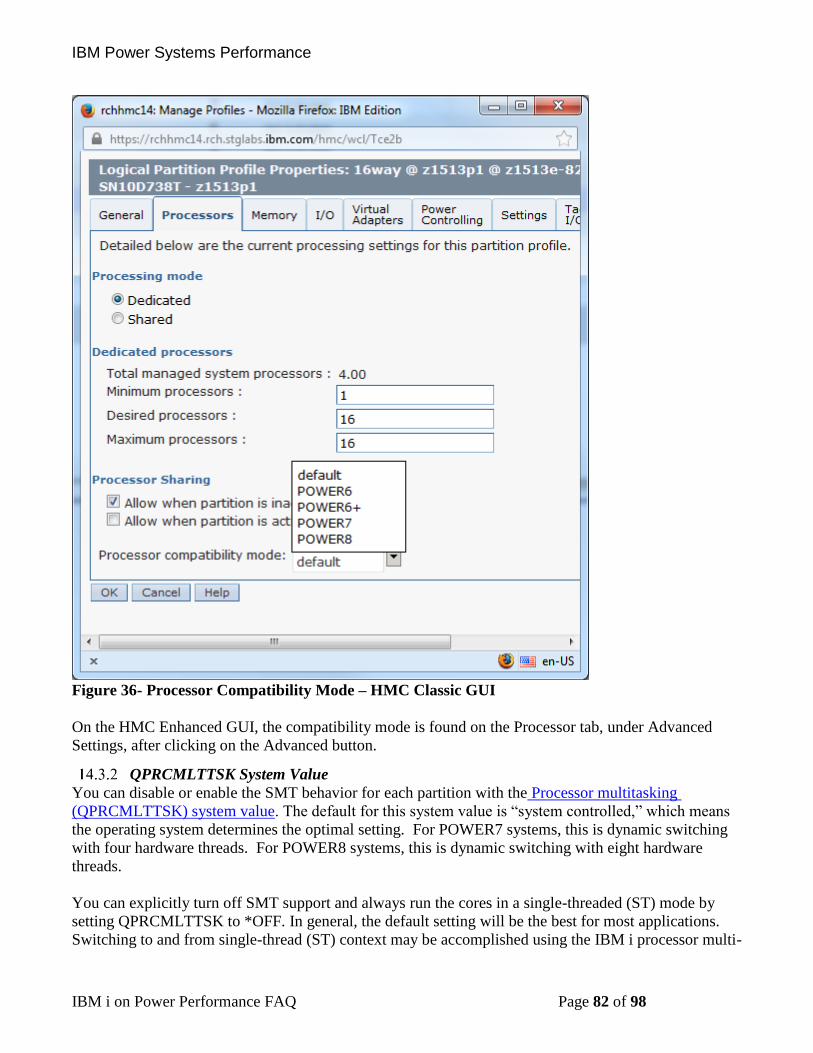
IBM Power Systems Performance
IBM i on Power Performance FAQ Page 82 of 98
Figure 36- Processor Compatibility Mode – HMC Classic GUI
On the HMC Enhanced GUI, the compatibility mode is found on the Processor tab, under Advanced
Settings, after clicking on the Advanced button.
QPRCMLTTSK System Value
You can disable or enable the SMT behavior for each partition with the Processor multitasking
(QPRCMLTTSK) system value. The default for this system value is “system controlled,” which means
the operating system determines the optimal setting. For POWER7 systems, this is dynamic switching
with four hardware threads. For POWER8 systems, this is dynamic switching with eight hardware
threads.
You can explicitly turn off SMT support and always run the cores in a single-threaded (ST) mode by
setting QPRCMLTTSK to *OFF. In general, the default setting will be the best for most applications.
Switching to and from single-thread (ST) context may be accomplished using the IBM i processor multi-
IBM Power Systems Performance
IBM i on Power Performance FAQ Page 83 of 98
tasking mode system value, QPRCMLTTSK. QPRCMLTTSK changes are effective immediately and
persist across system IPL.
Supported QPRCMLTTSK values are as follows:
0 - Processor multi-tasking is disabled. This value corresponds to ST context.
1 - Processor multi-tasking is enabled. This value corresponds to SMT2 context if the partition's
Processor Compatibility Mode is POWER6 or POWER6+. Otherwise, the thread context is
determined by the maximum SMT level control.
2 - Processor multi-tasking is system controlled. This is the default value. For POWER7, POWER8
and POWER9, the implementation is identical to '1', processor multi-tasking enabled.
Examples:
DSPSYSVAL SYSVAL(QPRCMLTTSK)
CHGSYSVAL SYSVAL(QPRCMLTTSK) VALUE('0') /* ST context */
CHGSYSVAL SYSVAL(QPRCMLTTSK) VALUE('1') /* SMTn context */
CHGSYSVAL SYSVAL(QPRCMLTTSK) VALUE('2') /* SMTn context */
QWCCHGPR API
The QWCCHGPR API is available starting in current IBM i 7.1 to switch between the various SMT
settings without rebooting the partition. When processor multi-tasking is enabled, switching among the
thread contexts available for the partition IPL may be accomplished using the change processor
multitasking information API, QWCCHGPR. QWCCHGPR API changes are effective immediately and
persist across system IPL. The QWCCHGPR API takes a single parameter, the maximum number of
secondary threads per processor:
0 – No maximum is selected. The system uses the default number of secondary threads as
determined by the operating system.
1-255 – The system may use up to the number of secondary threads specified.
The QWCCHGPR API may be called from a command line.
Note that setting the maximum number of secondary threads does not establish the processor threading
context directly. The maximum value will be accepted regardless of the processor threading contexts
supported by the underlying hardware, and the OS will apply the configured maximum to the system.
On a POWER9 or a POWER8-based system, if a maximum value is specified by the QWCCHGPR API,
the OS will try to establish the maximum thread context supported as shown in Table 1, subject to the
limit specified.
Examples:
CALL PGM(QWCCHGPR) PARM(X'00000000') /* No maximum */
CALL PGM(QWCCHGPR) PARM(X'00000001') /* SMT2 context */
CALL PGM(QWCCHGPR) PARM(X'00000003') /* SMT4 context */
CALL PGM(QWCCHGPR) PARM(X'00000007') /* SMT8 context */
IBM Power Systems Performance
IBM i on Power Performance FAQ Page 84 of 98
The maximum number of secondary threads can be obtained from the retrieve processor multi-tasking
information API (QWCRTVPR).
POWER8 systems running IBM i 7.1 can be configured to run in SMT8 mode using this function.
For more details, see the following link:
Change Processor Multitasking Information (QWCCHGPR) API
14.4 Memory Considerations Some workloads have memory per core requirements that exceed the amount of memory that a
POWER7 system supports. The following options are available for workloads that require more memory
per core:
• Lower number of cores per socket
• POWER7 TurboCore™
14.5 POWER7 TurboCore You can select to run POWER7 in TurboCore(TM) mode to gain higher processor speeds and twice the
cache per core but utilize fewer cores per chip. This also saves on software costs for those applications
that are licensed per core, like databases and some application servers. If the client has workloads that
require many simultaneous tasks that benefit from being all run in parallel, then POWER7 can be run in
MaxCore mode providing up to 8 cores and up to 32 threads per socket or chip.
Turbo-core mode is only available on the selected models. Turbo-core mode allows the server to
“switch” from normal operating mode of 8 cores active to 4 cores active. This switch can only occur
after an IPL. In Turbo-core mode the 4 cores active achieve higher performance because these active
cores can utilize the extra cache made available from the 4 inactive cores.
For detailed information refer to:
Under the Hood: NUMA on POWER7 in IBM i
14.6 Power Savings Mode Many customers can achieve cost savings by tuning their systems for energy management. By doing
this tuning, system performance may be affected. On the positive side, tuning the energy setting allows
some systems to be able to boost their processor frequency dynamically when running at lower
processor utilization. On the other hand, tuning the energy setting can result in slower system
performance at high utilization due to slower dynamic processor frequency changes.
Nominal energy settings provide the most consistent processor frequency behavior and allow consistent
response time and throughput results. Because of this, use nominal settings if energy tuning is not
required.
POWER Systems include Intelligent Energy features that help to dynamically optimize energy usage
and performance so that the best possible balance is maintained. Intelligent Energy features like
EnergyScale(TM) dynamically optimizes processor speed based on thermal conditions and system
utilization. If the system's environment is favorable, the system can speed up processor cores to a
frequency up to 10% higher than the normal rated speed to better handle demanding workloads. When
utilization is lighter, or if environmental conditions are less favorable, the system can slow processor
cores by as much as 50% to save energy. Users can select whether Intelligent Energy Optimization
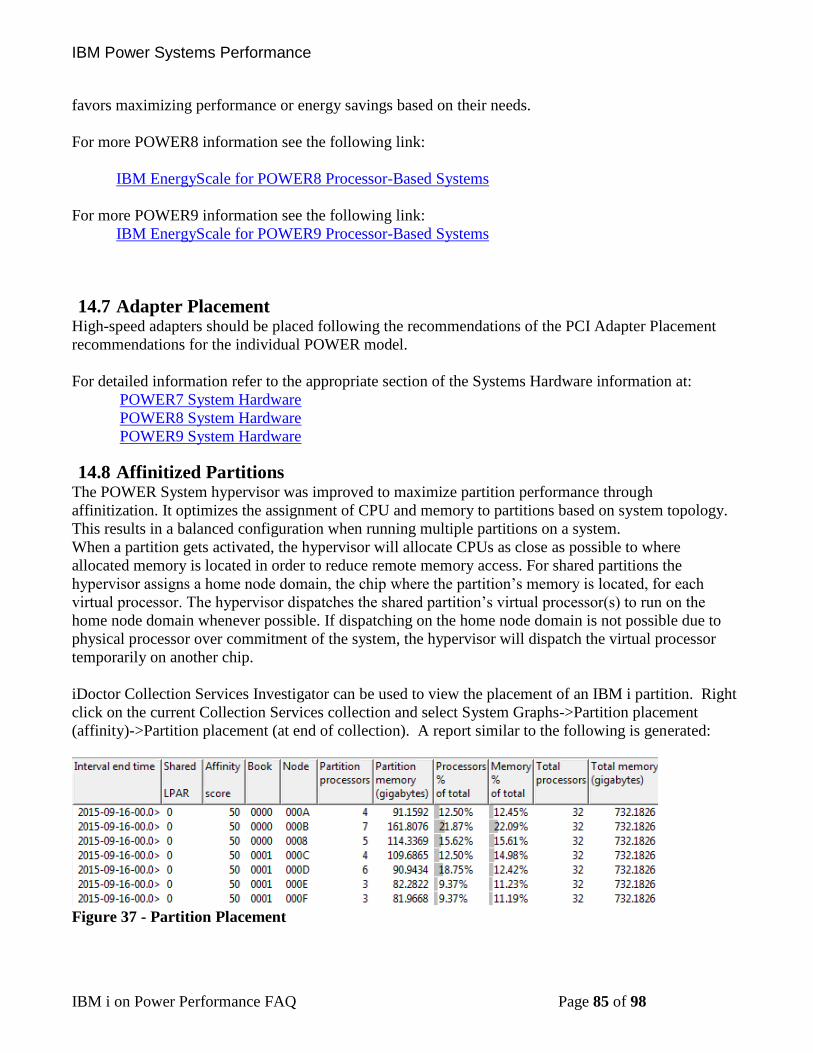
IBM Power Systems Performance
IBM i on Power Performance FAQ Page 85 of 98
favors maximizing performance or energy savings based on their needs.
For more POWER8 information see the following link:
IBM EnergyScale for POWER8 Processor-Based Systems
For more POWER9 information see the following link:
IBM EnergyScale for POWER9 Processor-Based Systems
14.7 Adapter Placement High-speed adapters should be placed following the recommendations of the PCI Adapter Placement
recommendations for the individual POWER model.
For detailed information refer to the appropriate section of the Systems Hardware information at:
POWER7 System Hardware
POWER8 System Hardware
POWER9 System Hardware
14.8 Affinitized Partitions The POWER System hypervisor was improved to maximize partition performance through
affinitization. It optimizes the assignment of CPU and memory to partitions based on system topology.
This results in a balanced configuration when running multiple partitions on a system.
When a partition gets activated, the hypervisor will allocate CPUs as close as possible to where
allocated memory is located in order to reduce remote memory access. For shared partitions the
hypervisor assigns a home node domain, the chip where the partition’s memory is located, for each
virtual processor. The hypervisor dispatches the shared partition’s virtual processor(s) to run on the
home node domain whenever possible. If dispatching on the home node domain is not possible due to
physical processor over commitment of the system, the hypervisor will dispatch the virtual processor
temporarily on another chip.
iDoctor Collection Services Investigator can be used to view the placement of an IBM i partition. Right
click on the current Collection Services collection and select System Graphs->Partition placement
(affinity)->Partition placement (at end of collection). A report similar to the following is generated:
Figure 37 - Partition Placement
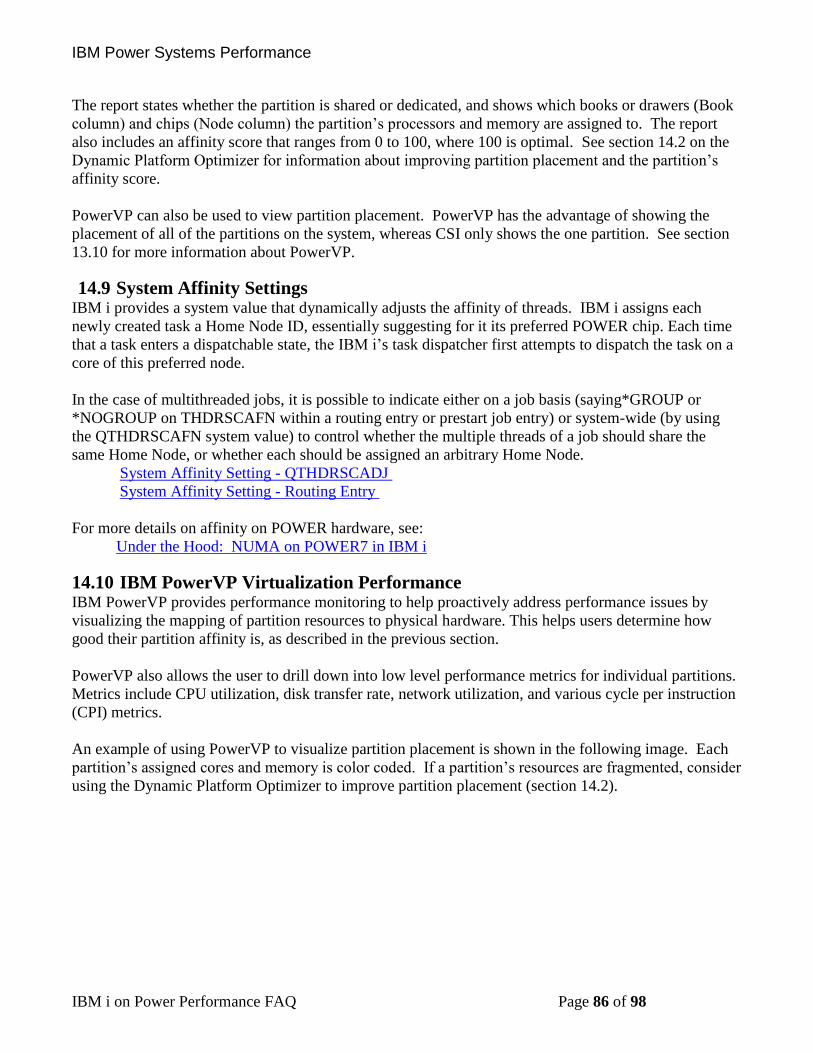
IBM Power Systems Performance
IBM i on Power Performance FAQ Page 86 of 98
The report states whether the partition is shared or dedicated, and shows which books or drawers (Book
column) and chips (Node column) the partition’s processors and memory are assigned to. The report
also includes an affinity score that ranges from 0 to 100, where 100 is optimal. See section 14.2 on the
Dynamic Platform Optimizer for information about improving partition placement and the partition’s
affinity score.
PowerVP can also be used to view partition placement. PowerVP has the advantage of showing the
placement of all of the partitions on the system, whereas CSI only shows the one partition. See section
13.10 for more information about PowerVP.
14.9 System Affinity Settings IBM i provides a system value that dynamically adjusts the affinity of threads. IBM i assigns each
newly created task a Home Node ID, essentially suggesting for it its preferred POWER chip. Each time
that a task enters a dispatchable state, the IBM i’s task dispatcher first attempts to dispatch the task on a
core of this preferred node.
In the case of multithreaded jobs, it is possible to indicate either on a job basis (saying*GROUP or
*NOGROUP on THDRSCAFN within a routing entry or prestart job entry) or system-wide (by using
the QTHDRSCAFN system value) to control whether the multiple threads of a job should share the
same Home Node, or whether each should be assigned an arbitrary Home Node.
System Affinity Setting - QTHDRSCADJ
System Affinity Setting - Routing Entry
For more details on affinity on POWER hardware, see:
Under the Hood: NUMA on POWER7 in IBM i
14.10 IBM PowerVP Virtualization Performance IBM PowerVP provides performance monitoring to help proactively address performance issues by
visualizing the mapping of partition resources to physical hardware. This helps users determine how
good their partition affinity is, as described in the previous section.
PowerVP also allows the user to drill down into low level performance metrics for individual partitions.
Metrics include CPU utilization, disk transfer rate, network utilization, and various cycle per instruction
(CPI) metrics.
An example of using PowerVP to visualize partition placement is shown in the following image. Each
partition’s assigned cores and memory is color coded. If a partition’s resources are fragmented, consider
using the Dynamic Platform Optimizer to improve partition placement (section 14.2).
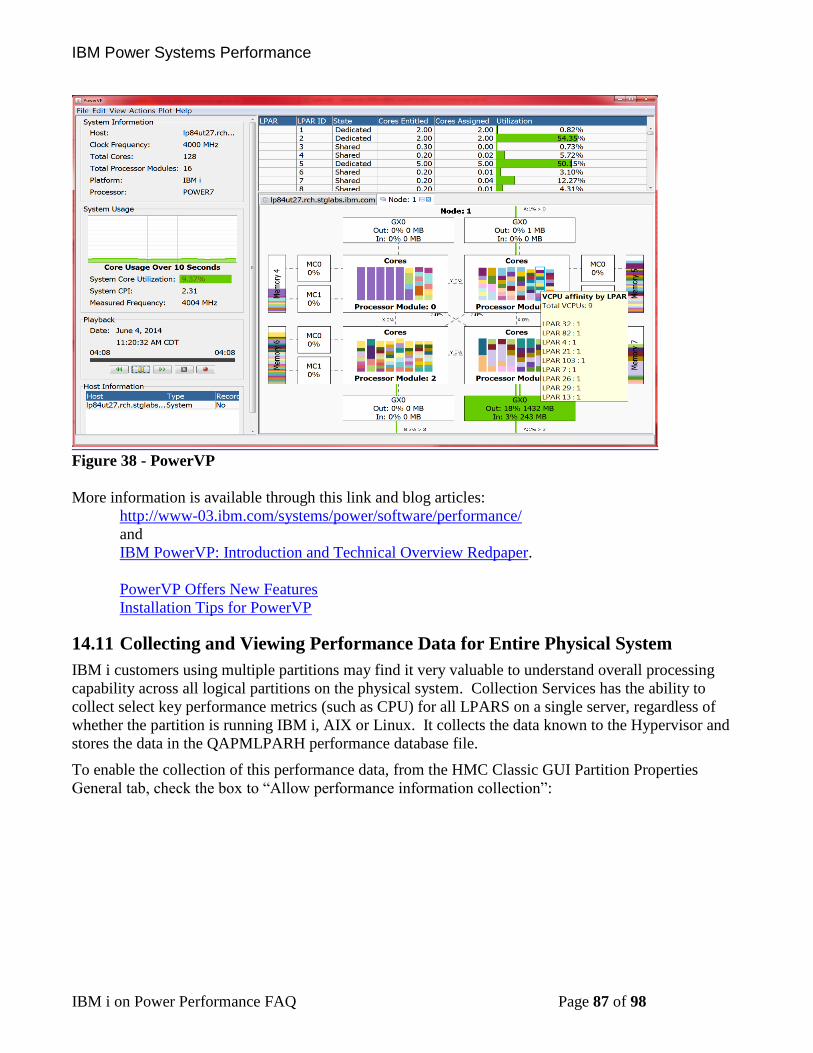
IBM Power Systems Performance
IBM i on Power Performance FAQ Page 87 of 98
Figure 38 - PowerVP
More information is available through this link and blog articles:
http://www-03.ibm.com/systems/power/software/performance/
and
IBM PowerVP: Introduction and Technical Overview Redpaper.
PowerVP Offers New Features
Installation Tips for PowerVP
14.11 Collecting and Viewing Performance Data for Entire Physical System
IBM i customers using multiple partitions may find it very valuable to understand overall processing
capability across all logical partitions on the physical system. Collection Services has the ability to
collect select key performance metrics (such as CPU) for all LPARS on a single server, regardless of
whether the partition is running IBM i, AIX or Linux. It collects the data known to the Hypervisor and
stores the data in the QAPMLPARH performance database file.
To enable the collection of this performance data, from the HMC Classic GUI Partition Properties
General tab, check the box to “Allow performance information collection”:
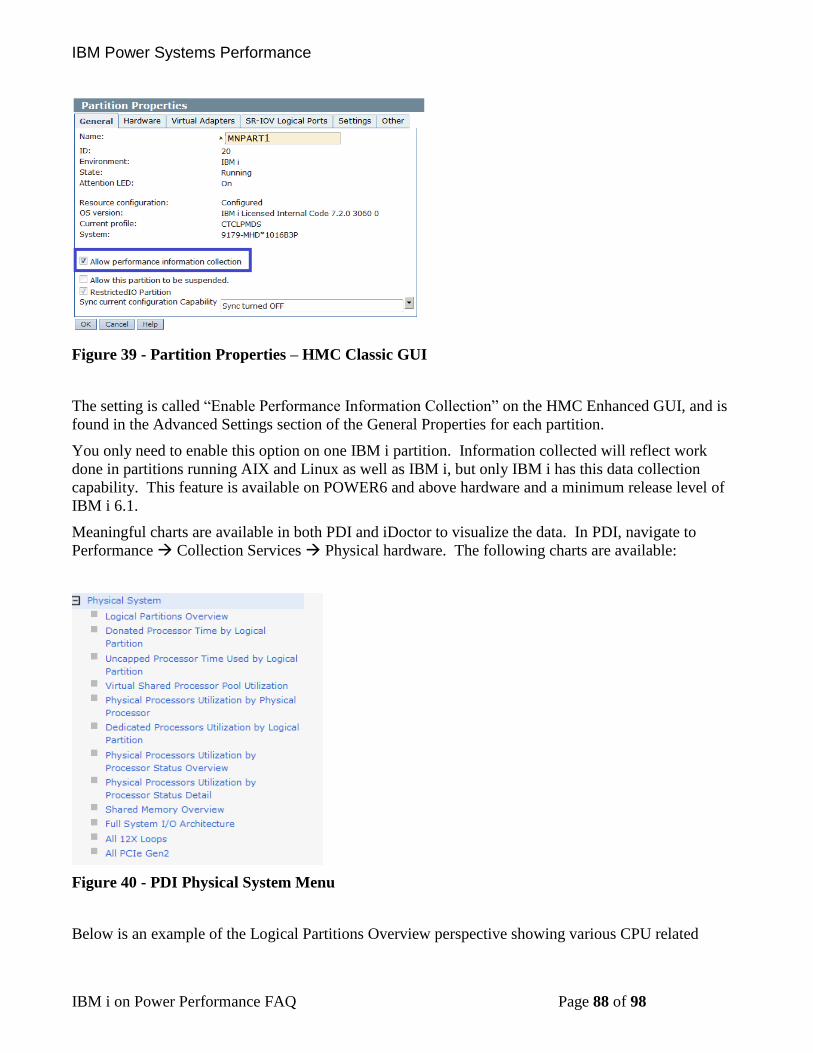
IBM Power Systems Performance
IBM i on Power Performance FAQ Page 88 of 98
Figure 39 - Partition Properties – HMC Classic GUI
The setting is called “Enable Performance Information Collection” on the HMC Enhanced GUI, and is
found in the Advanced Settings section of the General Properties for each partition.
You only need to enable this option on one IBM i partition. Information collected will reflect work
done in partitions running AIX and Linux as well as IBM i, but only IBM i has this data collection
capability. This feature is available on POWER6 and above hardware and a minimum release level of
IBM i 6.1.
Meaningful charts are available in both PDI and iDoctor to visualize the data. In PDI, navigate to
Performance → Collection Services → Physical hardware. The following charts are available:
Figure 40 - PDI Physical System Menu
Below is an example of the Logical Partitions Overview perspective showing various CPU related
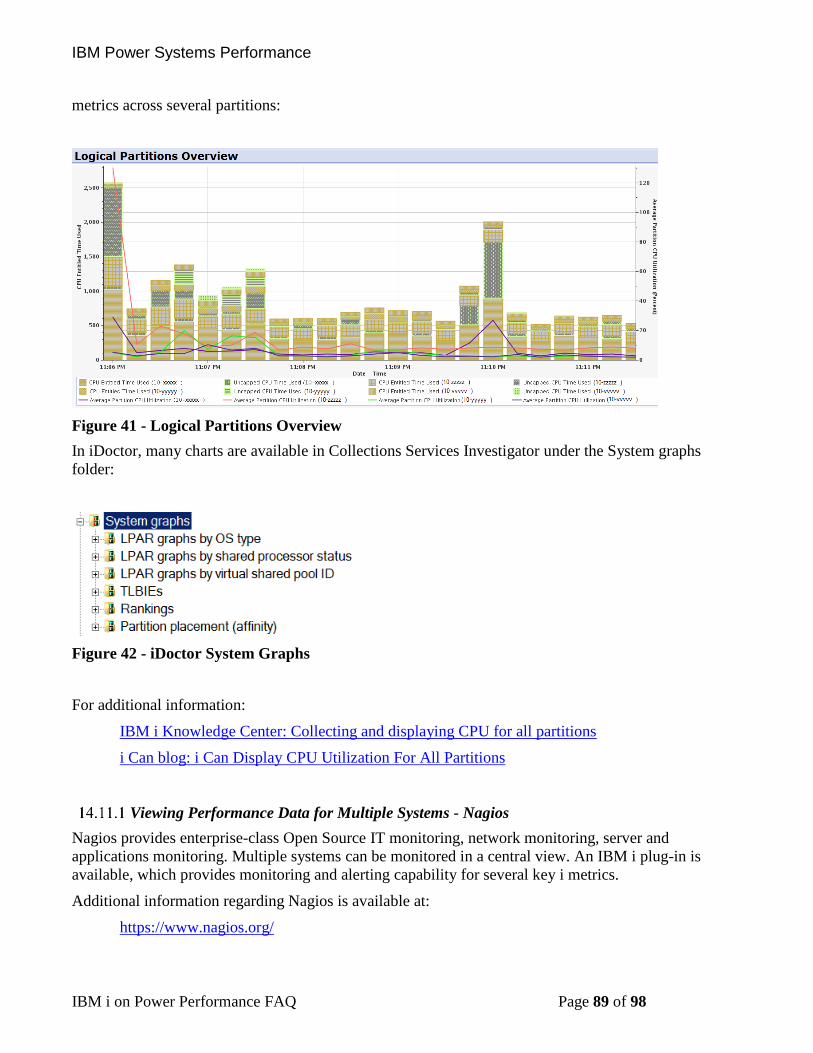
IBM Power Systems Performance
IBM i on Power Performance FAQ Page 89 of 98
metrics across several partitions:
Figure 41 - Logical Partitions Overview
In iDoctor, many charts are available in Collections Services Investigator under the System graphs
folder:
Figure 42 - iDoctor System Graphs
For additional information:
IBM i Knowledge Center: Collecting and displaying CPU for all partitions
i Can blog: i Can Display CPU Utilization For All Partitions
Viewing Performance Data for Multiple Systems - Nagios
Nagios provides enterprise-class Open Source IT monitoring, network monitoring, server and
applications monitoring. Multiple systems can be monitored in a central view. An IBM i plug-in is
available, which provides monitoring and alerting capability for several key i metrics.
Additional information regarding Nagios is available at:
https://www.nagios.org/
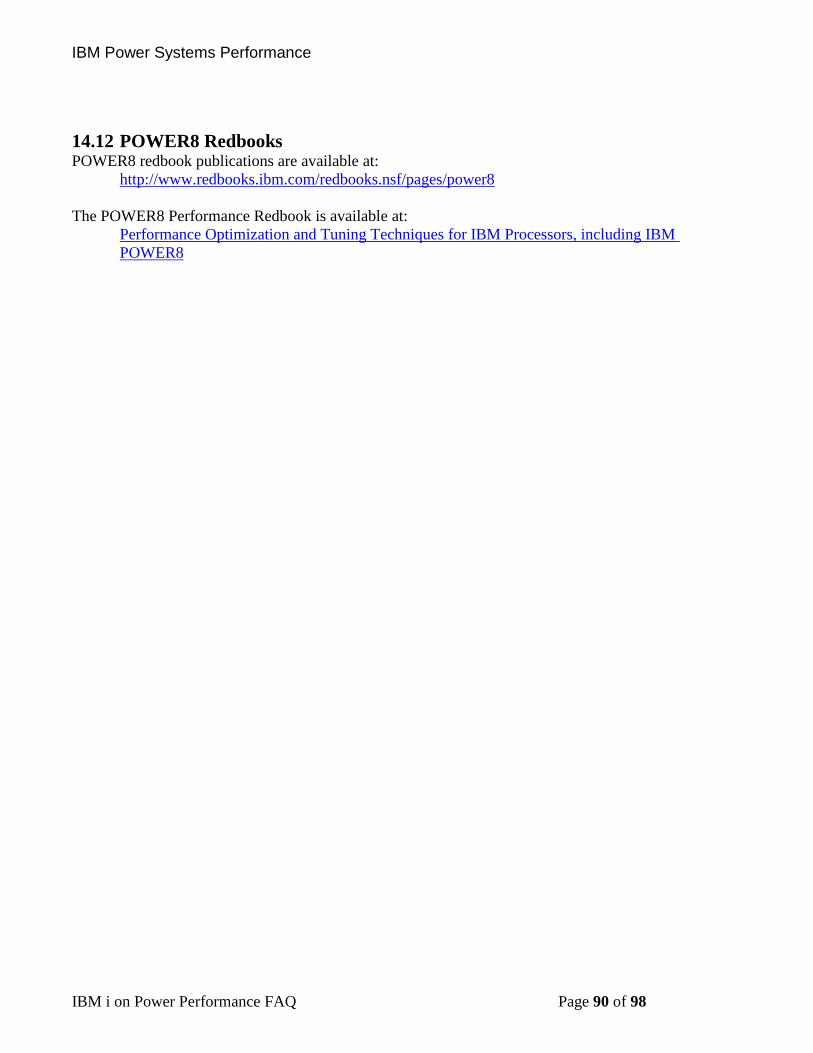
IBM Power Systems Performance
IBM i on Power Performance FAQ Page 90 of 98
14.12 POWER8 Redbooks POWER8 redbook publications are available at:
http://www.redbooks.ibm.com/redbooks.nsf/pages/power8
The POWER8 Performance Redbook is available at:
Performance Optimization and Tuning Techniques for IBM Processors, including IBM
POWER8
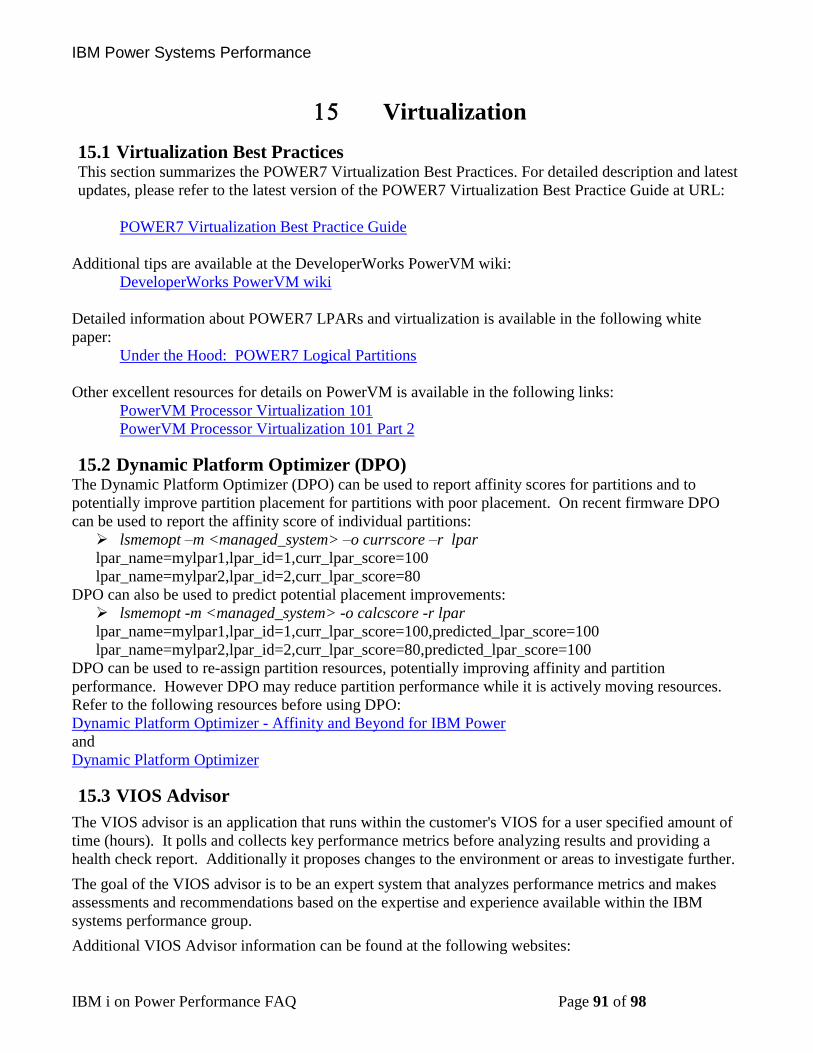
IBM Power Systems Performance
IBM i on Power Performance FAQ Page 91 of 98
Virtualization
15.1 Virtualization Best Practices This section summarizes the POWER7 Virtualization Best Practices. For detailed description and latest
updates, please refer to the latest version of the POWER7 Virtualization Best Practice Guide at URL:
POWER7 Virtualization Best Practice Guide
Additional tips are available at the DeveloperWorks PowerVM wiki:
DeveloperWorks PowerVM wiki
Detailed information about POWER7 LPARs and virtualization is available in the following white
paper:
Under the Hood: POWER7 Logical Partitions
Other excellent resources for details on PowerVM is available in the following links:
PowerVM Processor Virtualization 101
PowerVM Processor Virtualization 101 Part 2
15.2 Dynamic Platform Optimizer (DPO) The Dynamic Platform Optimizer (DPO) can be used to report affinity scores for partitions and to
potentially improve partition placement for partitions with poor placement. On recent firmware DPO
can be used to report the affinity score of individual partitions:
➢ lsmemopt –m <managed_system> –o currscore –r lpar
lpar_name=mylpar1,lpar_id=1,curr_lpar_score=100
lpar_name=mylpar2,lpar_id=2,curr_lpar_score=80
DPO can also be used to predict potential placement improvements:
➢ lsmemopt -m <managed_system> -o calcscore -r lpar
lpar_name=mylpar1,lpar_id=1,curr_lpar_score=100,predicted_lpar_score=100
lpar_name=mylpar2,lpar_id=2,curr_lpar_score=80,predicted_lpar_score=100
DPO can be used to re-assign partition resources, potentially improving affinity and partition
performance. However DPO may reduce partition performance while it is actively moving resources.
Refer to the following resources before using DPO:
Dynamic Platform Optimizer - Affinity and Beyond for IBM Power
and
Dynamic Platform Optimizer
15.3 VIOS Advisor
The VIOS advisor is an application that runs within the customer's VIOS for a user specified amount of
time (hours). It polls and collects key performance metrics before analyzing results and providing a
health check report. Additionally it proposes changes to the environment or areas to investigate further.
The goal of the VIOS advisor is to be an expert system that analyzes performance metrics and makes
assessments and recommendations based on the expertise and experience available within the IBM
systems performance group.
Additional VIOS Advisor information can be found at the following websites:
IBM Power Systems Performance
IBM i on Power Performance FAQ Page 92 of 98
VIOS Advisor
and
VIOS performance advisor
15.4 iDoctor Power Connections – VIOS Investigator iDoctor Power Connections allows the ability to collect and analyze performance related data from a
VIOS partition. The data can be imported into Db2 SQL tables on an IBM i partition or a PC into an
SQLite database for viewing with iDoctor. There is also a VIOS Monitor that can be setup to stream
data from multiple VIOS partitions to a location in the IFS on one or more IBM i partitions where the
data is then automatically imported for analysis within iDoctor for i. The types of data that can be
collected and analyzed are as follows.
NMON: Allows looking at overall performance of the VIOS partition including metrics for CPU,
memory, disk, processes, and fiber channel.
NPIV: This is an iDoctor collection mechanism which uses FCSTAT to collect snapshots over a
specified amount of time. The resulting data can be graphed to show the number of IOs per second,
Megabytes per second, and errors on physical and virtual fiber channel adapters.
SEA: This is an iDoctor collection mechanism which uses SEASTAT to collect snapshots over a
specified amount of time. The resulting data can be graphed to show the number of packets and
megabytes being sent and received on SEA adapters and which client partitions are utilizing the adapters
the most.
VIOS Advisor: iDoctor has the ability to collect VIOS Advisor data and transfer it to the local PC to be
unzipped and displayed in a web browser. There are no iDoctor graphs available over the VIOS Advisor
data.
Disk Mapping: The disk mapping option creates a table by connecting to the HMC to create a mapping
from IBM i disk unit to VSCSI HDISK or Virtual Fiber Channel VFCHOST and FCS adapter on the
VIOS.
PERFPMR: This is a data collection tool used by the VIOS/AIX Support team. The iDoctor client has
the ability to collect this from the VIOS partition and download it to the PC for upload to a support
PMR.
Additional VIOS Investigator information can be found at the following website:
http://public.dhe.ibm.com/services/us/igsc/idoctor/html/documentation.html
IBM Power Systems Performance
IBM i on Power Performance FAQ Page 93 of 98
Reporting a Performance Problem
16.1 Introduction The focus on this chapter is on what information and data should be provided when reporting a
performance problem to post-sales support. However, the information provided in this chapter also
applies when reporting performance problems to pre-sales and service organizations.
16.2 Define the Performance Problem The first question support will ask when a performance problem is reported is “What is slow?” A good
understanding about what exactly is slow helps the performance analyst concentrate the analysis on the
component(s) that is most likely causing the performance problem.
As a general rule, the better the description of the performance problem the more likely there will be a
quick identification of the root cause and potential resolution.
The IBM i Global Support Center (iGSC) has provided several Must Gather documents with detailed
instructions for gathering the data required to analyze performance problems.
Master Document List for Performance
Over the last several years the iGSC has worked on automating the majority of the Must Gather
Documents into a suite of tools known as QMGTOOLS. Many of the Must Gather Documents have
been updated to point at QMGTOOLS functions. When working with support you will likely be asked
to use QMGTOOLS in order to automate the collection of data needed to assist in debug. As a proactive
measure, it is recommended to ensure the QMGTOOLS library is installed on your system and is
periodically updated. Instructions are available here: How To Obtain and Install QMGTOOLS
You may also be referred to the iDoctor website in order to utilize iDoctor. If iDoctor is needed by
support to assist with a PMR, then a temporary license key will be provided.
http://public.dhe.ibm.com/services/us/igsc/idoctor/html/downloadOptions.html
16.3 Questions that help IBM diagnose the problem The following is a list of questions that help to define a performance problem:
• Can you append more detail on the simplest, repeatable example of the problem?
• Can the problem be demonstrated with the execution of a specific command or sequence of
events?
• Were any new IBM PTFs or groups applied just prior to the problem starting?
• Does the problem impact interactive users, batch jobs, or both?
• What cumulative PTF package is installed on the system?
• What is the level of the hiper, database, java, tech refresh, and other applicable group PTFs?
• Were any application changes or vendor fixes applied recently?
• Has the CPU utilization changed since the problem started? Is it higher or lower than it was
before?
• How has the disk utilization changed since the problem started?
• If the problem impacts a specific job, user, or subset of jobs, please describe these in the greatest
detail possible.
IBM Power Systems Performance
IBM i on Power Performance FAQ Page 94 of 98
• When do any problem jobs or problem workloads run?
• Does the performance problem involve SQL access to the database? If so, has a specific
statement or type of SQL statement been identified? Has the SQL been analyzed with Visual
Explain and indexed properly?
• Were there any hardware upgrades or changes since the problem happened?
• Is there any performance data available from before the problem started? If not, is there any
previous data that can be retrieved from tape?
IBM Power Systems Performance
IBM i on Power Performance FAQ Page 95 of 98
References
The following sections provide links to various types of on-line resource information and documentation
for IBM i:
17.1 Blogs on Performance Topics
Here are two key IBM blogs on Performance Topics:
• i Can (Technical Tips for i)
http://www.ibmsystemsmag.com/Blogs/i-Can/
• Db2 for i (often discusses performance topics)
http://Db2fori.blogspot.com/
17.2 Education and Training
IBM i Performance Analysis Workshop is a 3 to 4 day workshop on IBM i performance analysis
methodology and problem solving.
IBM i Performance Tuning - II: Advanced Analysis and Capacity Tuning is a 4 day class on IBM i
performance concepts and performance tools.
IBM iDoctor for i Workshops provide training on how to use the suite of iDoctor tools.
Additionally, the IBM i Lab Services Power Systems performance team can do customized formal or
informal education or skills transfer on any IBM i performance related topic. Contact the IBM i
performance team leader, Eric Barsness, at [email protected] for more information. For knowledge
and skills transfer sessions that cover Db2 for i, SQL, and data centric application performance /
scalability monitoring, analysis and tuning contact Mike Cain at [email protected].
17.3 Redbooks and Redpapers The following are selected Redbooks related to IBM i Performance Tools:
• End to End Performance Management on IBM i
http://www.redbooks.ibm.com/abstracts/sg247808.html
• IBM eServer iSeries Performance Management Tools
http://www.redbooks.ibm.com/Redbooks.nsf/RedbookAbstracts/redp4026.html?Open
• IBM Systems Director Navigator for i
http://www.redbooks.ibm.com/Abstracts/sg247789.html?Open
• IBM i 7.1 Technical Overview Technology Refresh Updates
http://www.redbooks.ibm.com/abstracts/sg247858.html
• IBM PowerVP Introduction and Technical Overview
IBM PowerVP Introduction and Technical Overview
While the following Redbooks were written in the V5R4 timeframe, the majority of their technical
content is still applicable:
• Application and Program Performance Analysis Using PEX Statistics on IBM i5/OS
IBM Power Systems Performance
IBM i on Power Performance FAQ Page 96 of 98
• IBM iDoctor iSeries Job Watcher: Advanced Performance Tool
• Best Practices for Managing IBM i Jobs
• i5/OS Diagnostic Tools for System Administrators: An A to Z Reference for Problem
Determination
The following are selected Redbooks related to IBM Power Performance and Virtualization:
• IBM PowerVM Virtualization Introduction and Configuration
http://www.redbooks.ibm.com/abstracts/sg247940.html
• IBM PowerVM Best Practices
http://www.redbooks.ibm.com/abstracts/sg248062.html
• IBM PowerVM Virtualization Managing and Monitoring
http://www.redbooks.ibm.com/abstracts/sg247590.html
17.4 Additional Performance related information An internet search is a common and valid way of searching for IBM i information, and there is plenty of
it out there. The following are selected performance related links to key topics:
• Performance Management for Power Systems: PM for Power Systems
• IBM Workload Estimator: WLE
• IBM i Performance Tools: developerWorks Performance Tools
• IBM i Performance Data Investigator: developerWorks PDI
• IBM iDoctor for IBM i: iDoctor
• IBM i Wait Accounting information:
• Job Waits Whitepaper
• KnowledgeCenter: The basics of Wait Accounting
• developerWorks: IBM i Wait Accounting
• Best Practices for Managing IBM i Jobs and Output: Jobs Redpaper
• IBM Tivoli Monitoring: Tivoli Monitoring
• IBM Tivoli Monitoring Agent for i5/OS: Tivoli Monitoring Agent
iDoctor:
Top 10 Hidden iDoctor Gems
SSD references:
• iCan: Planning for Solid State Drives
• iCan: Moving Data to Solid State Drives
• IBM Systems: Moving Data to Solid State Drives
• Customer use of SSDs
Customer Use of SSD (Solid State Drives)
17.5 Database Performance Articles
• DeveloperWorks - Database Performance:
IBM Db2 for i tips and techniques
• Db2 for i– “Database performance and query optimization”
Database Performance and Query Optimization
• DDS and SQL - The Winning Combination for Db2 for i: Business and technical benefits of a
IBM Power Systems Performance
IBM i on Power Performance FAQ Page 97 of 98
modern Db2 for i database
DDS and SQL - The Winning Combination for Db2 for i
• Preparing for and Tuning the SQL Query Engine on Db2 for i5/OS. This Redbook is still valuable as
a reference but targets V5R4 so does not reflect the many enhancements available in IBM i 6.1 and
IBM i 7.1.
http://www.redbooks.ibm.com/abstracts/sg246598.html?Open
• 5 Essential Ways to Use iSeries Navigator – SQL Plan Cache
5 Essential Ways to Use iSeries Navigator - SQL Plan Cache
• Gauge SQE use in Db2 for i 6.1
Gauge SQE use in Db2 for i 6.1
• Get Your System Humming: 7 Great Tips for Tuning Db2 for i
Get Your System Humming: 7 Great Tips for Tuning Db2 for i
• The Effect of Max Active on Db2 for i Query Performance. This article provides good information
even though the latest IBM i 7.1 PTF’s eliminate max active from the optimizer’s calculation of the
fair share of memory.
http://www.ibm.com/developerworks/ibmi/library/i-maxactive/index.html
• Process your Db2 for i indexes in parallel
http://www.ibm.com/developerworks/data/library/techarticle/0301milligan/0301milligan.html
17.6 Key Performance Resources The following are valuable resources to use as starting points when researching performance related
topics:
• IBM 7.3 Knowledge Center:
7.3 Knowledge Center: Performance Topic
• IBM 7.2 Knowledge Center:
7.2 Knowledge Center: Performance Topic
• IBM 7.1 Knowledge Center:
7.1 Knowledge Center: Performance Topic
• IBM Systems Hardware (IBM Knowledge Center):
POWER8
POWER9
• IBM i Performance:
Monitoring & Managing Performance for IBM i
• iDeveloperWorks:
http://www.ibm.com/developerworks/ibmi/
• IBM Support Software Knowledge Base:
Software Knowledge Base
17.7 Performance Capabilities Reference Note The Performance Capabilities Reference Manual (PCRM) was formerly the reference manual for all
things related to IBM i performance considerations. Beginning in 2014, the PCRM only covers CPW
rating information. This includes updates for new hardware models and CPW ratings. Older versions
are still available for download. For detailed IBM i performance information use the links referenced
above.
IBM Power Systems Performance
IBM i on Power Performance FAQ Page 98 of 98
The Power Architecture and Power.org wordmarks and the Power and Power.org logos and related marks are trademarks and service marks licensed by Power.org. UNIX is a registered trademark of The Open Group in the United States, other countries or both. Java and all Java-based trademarks and logos are trademarks of Sun Microsystems, Inc. In the United States and/or other countries. TPC-C and TPC-H are trademarks of the Transaction Performance Processing Council (TPPC). SPECint, SPECfp, SPECjbb, SPECweb, SPECjAppServer, SPEC OMP, SPECviewperf, SPECapc, SPEChpc, SPECjvm, SPECmail, SPECimap and SPECsfs are trademarks of the Standard Performance Evaluation Corporation (SPEC). InfiniBand, InfiniBand Trade Association and the InfiniBand design marks are trademarks and/or service marks of the InfiniBand Trade Association.
© IBM Corporation 2018 IBM Corporation Systems and Technology Group Route 100 Somers, New York 10589
Produced in the United States of America October 2014 All Rights Reserved This document was developed for products and/or services offered in the United States. IBM may not offer the products, features, or services discussed in this document in other countries. The information may be subject to change without notice. Consult your local IBM business contact for information on the products, features and services available in your area. All statements regarding IBM future directions and intent are subject to change or withdrawal without notice and represent goals and objectives only. IBM, the IBM logo, ibm.com, AIX, Power Systems, POWER7, POWER7+, POWER8, POWER9, TurboCore and Active Memory are trademarks or registered trademarks of International Business Machines Corporation in the United States, other countries, or both. If these and other IBM trademarked terms are marked on their first occurrence in this information with a trademark symbol (® or ™), these symbols indicate U.S. registered or common law trademarks owned by IBM at the time this information was published. Such trademarks may also be registered or common law trademarks in other countries. A current list of IBM trademarks is available on the Web at "Copyright and trademark information" at www.ibm.com/legal/copytrade.shtml Other company, product, and service names may be trademarks or service marks of others. IBM hardware products are manufactured from new parts, or new and used parts. In some cases, the hardware product may not be new and may have been previously installed. Regardless, our warranty terms apply. Photographs show engineering and design models. Changes may be incorporated in production models. Copying or downloading the images contained in this document is expressly prohibited without the written consent of IBM. This equipment is subject to FCC rules. It will comply with the appropriate FCC rules before final delivery to the buyer. Information concerning non-IBM products was obtained from the suppliers of these products or other public sources. Questions on the capabilities of the non-IBM products should be addressed with those suppliers. All performance information was determined in a controlled environment. Actual results may vary. Performance information is provided “AS IS” and no warranties or guarantees are expressed or implied by IBM. Buyers should consult other sources of information, including system benchmarks, to evaluate the performance of a system they are considering buying. When referring to storage capacity, 1 TB equals total GB divided by 1000; accessible capacity may be less. The IBM home page on the Internet can be found at: http://www.ibm.com. A full list of U.S. trademarks owned by IBM may be found at:
http://www.ibm.com/legal/copytrade.shtml. The IBM Power Systems home page on the Internet can be found at: http://www.ibm.com/systems/power/ POW03102-USEN-12