Embed Size (px)
Citation preview
SIA v. EPA, (D.C. Cir. No. 1024) Privileged and Confidential, For Settlement Purposes Only
IBM 300mm Fab Stack Test Report Mar 15, 2012
1.0 Introduction................................................................................................................... 1
1.1 Summary of the Test Program .................................................................................. 1 1.2 Key Personnel ........................................................................................................... 3 1.3 Organization of this Report....................................................................................... 4
2.0 Plant and Sampling Location Description .................................................................... 4 2.1 Process Equipment.................................................................................................... 4 2.2 Control Equipment.................................................................................................... 8 2.3 Stack Sampling Locations....................................................................................... 10
3.0 Summary and Discussion of Results........................................................................... 10 3.1 Objectives and Test Matrix..................................................................................... 10 3.2 Pre-Test Evaluation of the FTIR Performance ....................................................... 11 3.3 FTIR Field Spiking & Detection Limit Determination........................................... 13 3.4 Acid Stack FTIR Validation Results....................................................................... 15 3.5 Base Stack FTIR Validation Results....................................................................... 18 3.6 FGHG and N2O Emissions..................................................................................... 19
4.0 Sampling and Analytical Procedures .......................................................................... 22 4.1 Analytical Test Methods ......................................................................................... 22
4.1.1 Summary of the FTIR Analytical Method....................................................... 22 4.1.2 FTIR Stack Sampling and Analysis Apparatus .............................................. 23
4.2 Stack Flow Measurement Method .......................................................................... 24 4.3 Gas Usage Measurement Method ........................................................................... 24
5.0 QA/QC Activities........................................................................................................ 25 5.1 EPA Method 320 Deviations .................................................................................. 25
1.0 Introduction
1.1 Summary of the Test Program
This report describes the results of emission stack testing conducted at IBM’s 300mm semiconductor manufacturing facility in Hopewell Junction, New York, in October 2011. International Business Machines Corporation (“IBM”) is collaborating with the Semiconductor Industry Association (“SIA”), SEMATECH/ISMI, and the U.S. Environmental Protection Agency (“EPA”) to develop a stack emissions test and measurement protocol for process green house gases that are subject of the Mandatory Reporting Rule, Subpart I of 40 CFR Part 98. The purpose of the testing described here is to further the development of a method to estimate the emissions of fluorinated greenhouse gases (“FGHG”) and N2O from the stacks of semiconductor
IBM300mmStackTestOct2011ResultsDESpeedMar152012LL.doc Page 1 of 25
SIA v. EPA, (D.C. Cir. No. 1024) Privileged and Confidential, For Settlement Purposes Only
manufacturing facilities (“fabs”), which can be included as an option for satisfying the reporting requirement under a revised Subpart I to 40 CFR Part 98. IBM has coordinated the emissions measurement activities with the EPA Climate Change Division, the EPA OAQPS, Matheson Inc., Columbia Analytical, and Sanborn Head Engineering. FTIR (Fourier Transform Infrared Spectroscopy) testing was performed by Matheson. Gas usage data were collected by Sanborn Head Engineering and IBM personnel. Stack flow and moisture measurements were performed by personnel from Columbia Analytical and IBM. Kirsten Cappel from the EPA and Deborah Harris, of ICF, an EPA contractor, observed the testing. During the testing, a teleconference was conducted to describe the test activities to Deborah Ottinger of the EPA Climate Change Division, and to Drs. Ray Merrill and Dennis Mikel of the EPA Office of Air Quality Planning and Standards (OAQPS). This document is patterned after EPA GD-043 guidance for reporting the results of stack testing. The principal goals of this work have been to develop, validate, and report the results from an enhanced FTIR measurement method that was setup to quantify greenhouse gas emissions at low-ppbv to ppmv concentration levels from semiconductor fab stacks. Pursuant to those goals, IBM has:
1. Measured the emissions of designated fluorinated greenhouse gases (FGHGs) and N2O in the Acid and Base emission stacks at the IBM 300mm fab using EPA FTIR Method 320;
2. Contemporaneously measured the flow rate, temperature and moisture content of the stack emissions using EPA Methods 1, 2 and 3;
3. Collected process gas usage data during the sampling period to relate the activity and emissions on the day of the testing to the emissions.
The Acid and Base exhaust gas stack systems were measured at IBM’s B323 300mm wafer size production Fab, in Hopewell Junction, New York. The acid and base gas exhaust systems collect abated exhaust gas from CVD chamber clean, and plasma etch processes, along with the exhaust from other semiconductor processing tools (equipment). Every FGHG using manufacturing tool at IBM’s 300mm Fab is abated with a point of use (POU) abatement system, that is designed specifically for fluorinated gas abatement. The POU abatement units consist of a high temperature thermal abatement module and a wet scrubber module. Additionally, both the acid and base gas exhaust systems are fitted with a “house” wet scrubber system which scrubs acid and base components from the exhaust systems, respectively. In total, three emission points were measured; two acid exhaust stacks that are manifolded together, and a base exhaust stack; all of which are located on IBM’s building B323 Fab. The measured emissions points constitute all of the acid and base gas exhausts from the B323 Fab, and are estimated to represent greater than 70 % of the process FGHG and N2O emissions from the B323 Fab. An additional 11 stacks on B323 are connected to what is referred to the “general” exhaust system, which was not sampled during this test program. Due to the fact that; a) only a portion of the B323 Fab GHG emissions were sampled during the test; and b) the gas usage was not apportioned to a specific stack system, emissions factors could not be calculated for this test. Details regarding the emission points, including both schematic and mechanical drawings, are described in the appendix.
IBM300mmStackTestOct2011ResultsDESpeedMar152012LL.doc Page 2 of 25
SIA v. EPA, (D.C. Cir. No. 1024) Privileged and Confidential, For Settlement Purposes Only
Table 1-1 lists the key analytes for which reporting under Subpart I of the MRR is required, and which are used at IBM’s 300mm fab. These analytes are the subject of this test report, and with the exception of N2O, are referred to collectively throughout this report as FGHG. Table 1-1. FGHGs Tested in the IBM 300MM Fab Exhaust Stack.
Formula Name CAS #
CF4 Carbon Tetrafluoride/Perfluoromethane 75-73-0
CHF3 Trifluoromethane 75-46-7
NF3 Nitrogen trifluoride 7783-54-2
SF6 Sulfur hexafluoride 2551-62-4
N2O Nitrous oxide 10024-97-2
c-C4F8 Octafluorocyclobutane 115-25-3
C2F6 Hexafluoroethane/ Perfluoroethane 76-16-4 The IBM 300mm fab is located in Hopewell Junction, New York, and is representative of an advanced logic manufacturing and development facility. The testing was conducted from October 3 through October 6, 2011.
1.2 Key Personnel
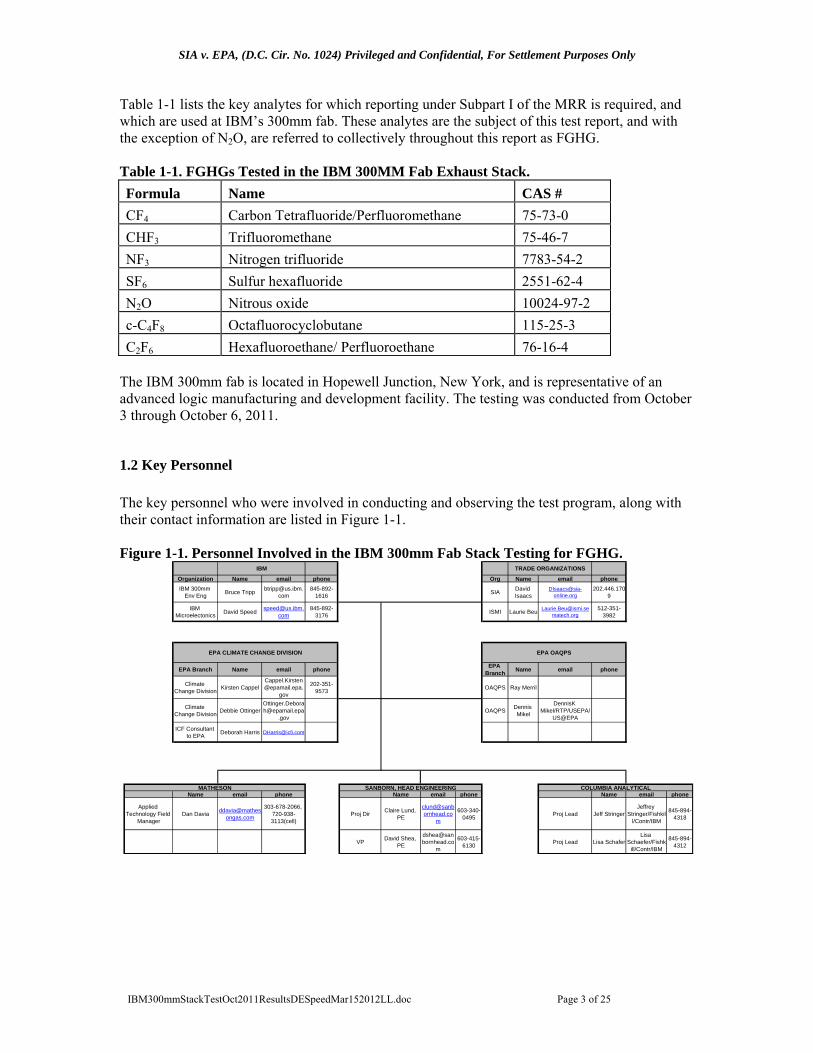
The key personnel who were involved in conducting and observing the test program, along with their contact information are listed in Figure 1-1. Figure 1-1. Personnel Involved in the IBM 300mm Fab Stack Testing for FGHG.
Organization Name email phone Org Name email phone
IBM 300mm Env Eng
Bruce [email protected].
com845-892-
1616SIA
David Isaacs
202.446.1709
IBM Microelectonics
David [email protected].
com845-892-
3176ISMI Laurie Beu
512-351-3982
EPA Branch Name email phoneEPA
BranchName email phone
Climate Change Division
Kirsten [email protected].
gov
202-351-9573
OAQPS Ray Merril
Climate Change Division
Debbie [email protected]
.govOAQPS
Dennis Mikel
DennisK Mikel/RTP/USEPA/
US@EPA
ICF Consultant to EPA
Deborah Harris [email protected]
Name email phone Name email phone Name email phone
Applied Technology Field
ManagerDan Davia
303-678-2066, 720-938-3113(cell)
Proj DirClaire Lund,
PE
m
603-340-0495
Proj Lead Jeff StringerJeffrey
Stringer/Fishkill/Contr/IBM
845-894-4318
VPDavid Shea,
PE
m
603-415-6130
Proj Lead Lisa SchaferLisa
Schaefer/Fishkill/Contr/IBM
845-894-4312
EPA CLIMATE CHANGE DIVISION EPA OAQPS
TRADE ORGANIZATIONSIBM
SANBORN, HEAD ENGINEERINGMATHESON COLUMBIA ANALYTICAL
IBM300mmStackTestOct2011ResultsDESpeedMar152012LL.doc Page 3 of 25
SIA v. EPA, (D.C. Cir. No. 1024) Privileged and Confidential, For Settlement Purposes Only
1.3 Organization of this Report
This report follows the format recommended by EPA GD 043. Section 2 of the report provides background information on the facility, its manufacturing
processes, and exhaust stack systems. Section 3 describes the results of the testing. Section 4 describes the methods used to perform the testing. Section 5 notes some specific QC/QA observations.
2.0 Plant and Sampling Location Description
2.1 Process Equipment
IBM’s 300mm fab uses the subject FGHGs in two basic types of wafer fabrication equipment, known as “tools”: CVD tools; and Plasma etch tools.
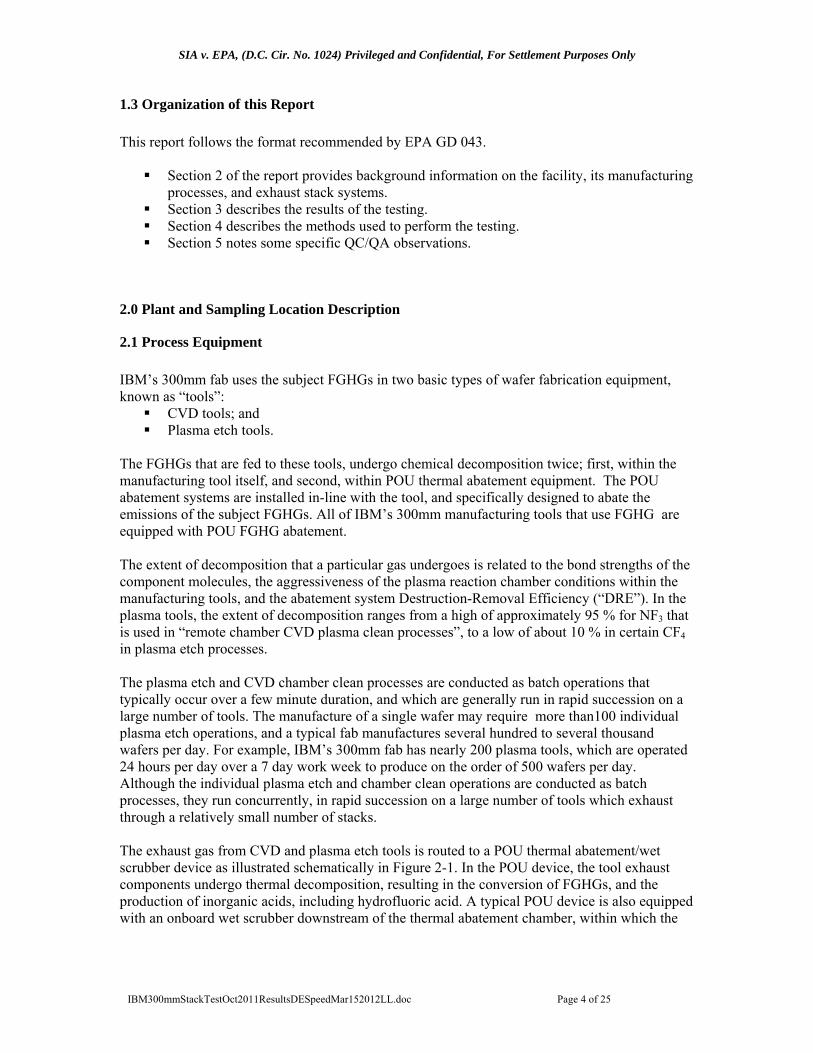
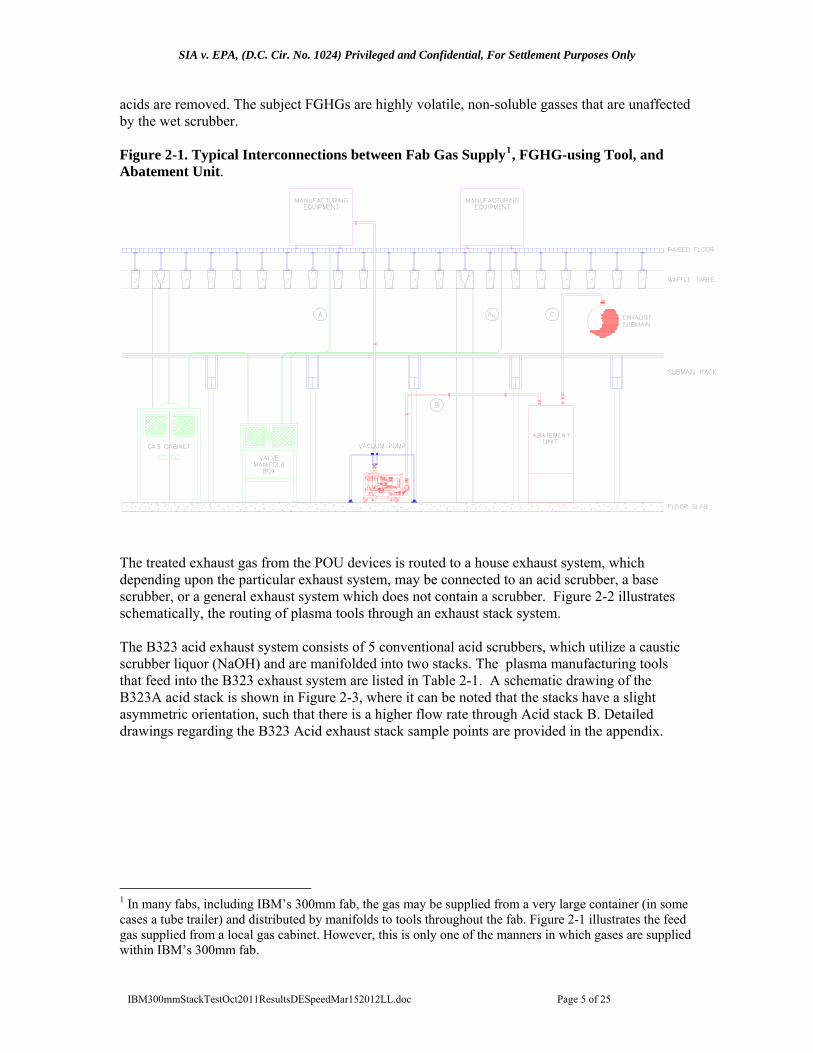
The FGHGs that are fed to these tools, undergo chemical decomposition twice; first, within the manufacturing tool itself, and second, within POU thermal abatement equipment. The POU abatement systems are installed in-line with the tool, and specifically designed to abate the emissions of the subject FGHGs. All of IBM’s 300mm manufacturing tools that use FGHG are equipped with POU FGHG abatement. The extent of decomposition that a particular gas undergoes is related to the bond strengths of the component molecules, the aggressiveness of the plasma reaction chamber conditions within the manufacturing tools, and the abatement system Destruction-Removal Efficiency (“DRE”). In the plasma tools, the extent of decomposition ranges from a high of approximately 95 % for NF3 that is used in “remote chamber CVD plasma clean processes”, to a low of about 10 % in certain CF4 in plasma etch processes. The plasma etch and CVD chamber clean processes are conducted as batch operations that typically occur over a few minute duration, and which are generally run in rapid succession on a large number of tools. The manufacture of a single wafer may require more than100 individual plasma etch operations, and a typical fab manufactures several hundred to several thousand wafers per day. For example, IBM’s 300mm fab has nearly 200 plasma tools, which are operated 24 hours per day over a 7 day work week to produce on the order of 500 wafers per day. Although the individual plasma etch and chamber clean operations are conducted as batch processes, they run concurrently, in rapid succession on a large number of tools which exhaust through a relatively small number of stacks. The exhaust gas from CVD and plasma etch tools is routed to a POU thermal abatement/wet scrubber device as illustrated schematically in Figure 2-1. In the POU device, the tool exhaust components undergo thermal decomposition, resulting in the conversion of FGHGs, and the production of inorganic acids, including hydrofluoric acid. A typical POU device is also equipped with an onboard wet scrubber downstream of the thermal abatement chamber, within which the
IBM300mmStackTestOct2011ResultsDESpeedMar152012LL.doc Page 4 of 25
SIA v. EPA, (D.C. Cir. No. 1024) Privileged and Confidential, For Settlement Purposes Only
acids are removed. The subject FGHGs are highly volatile, non-soluble gasses that are unaffected by the wet scrubber. Figure 2-1. Typical Interconnections between Fab Gas Supply1, FGHG-using Tool, and Abatement Unit.
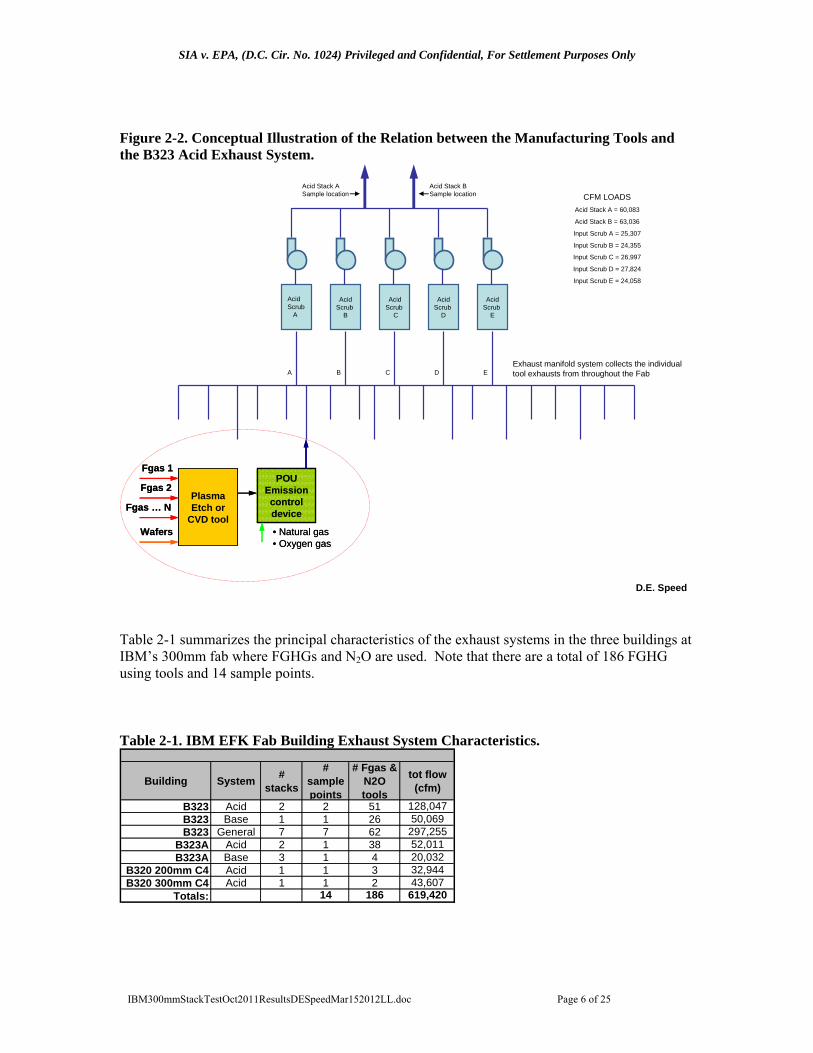
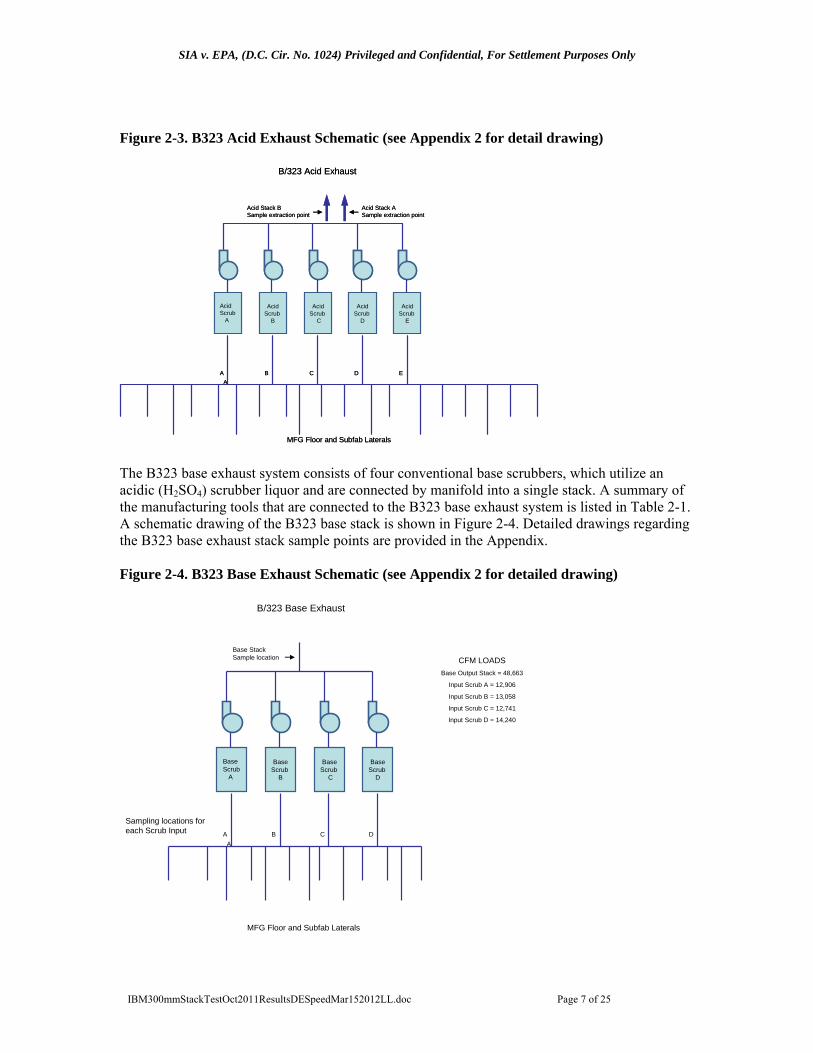
The treated exhaust gas from the POU devices is routed to a house exhaust system, which depending upon the particular exhaust system, may be connected to an acid scrubber, a base scrubber, or a general exhaust system which does not contain a scrubber. Figure 2-2 illustrates schematically, the routing of plasma tools through an exhaust stack system. The B323 acid exhaust system consists of 5 conventional acid scrubbers, which utilize a caustic scrubber liquor (NaOH) and are manifolded into two stacks. The plasma manufacturing tools that feed into the B323 exhaust system are listed in Table 2-1. A schematic drawing of the B323A acid stack is shown in Figure 2-3, where it can be noted that the stacks have a slight asymmetric orientation, such that there is a higher flow rate through Acid stack B. Detailed drawings regarding the B323 Acid exhaust stack sample points are provided in the appendix.
1 In many fabs, including IBM’s 300mm fab, the gas may be supplied from a very large container (in some cases a tube trailer) and distributed by manifolds to tools throughout the fab. Figure 2-1 illustrates the feed gas supplied from a local gas cabinet. However, this is only one of the manners in which gases are supplied within IBM’s 300mm fab.
IBM300mmStackTestOct2011ResultsDESpeedMar152012LL.doc Page 5 of 25
SIA v. EPA, (D.C. Cir. No. 1024) Privileged and Confidential, For Settlement Purposes Only
Figure 2-2. Conceptual Illustration of the Relation between the Manufacturing Tools and the B323 Acid Exhaust System.
CFM LOADS
Acid Stack A = 60,083
Acid Stack B = 63,036
Input Scrub A = 25,307
Input Scrub B = 24,355
Input Scrub C = 26,997
Input Scrub D = 27,824
Input Scrub E = 24,058
AcidScrub
B
AcidScrub
C
AcidScrub
D
AcidScrub
E
AcidScrub
A
Acid Stack BSample location
Acid Stack ASample location
A B C D E
• Natural gas• Oxygen gas
Fgas … N
Fgas 2
Wafers
POU Emission control device
Plasma Etch or
CVD tool
Fgas 1
• Natural gas• Oxygen gas
Fgas … N
Fgas 2
Wafers
POU Emission control device
Plasma Etch or
CVD tool
Fgas 1
D.E. Speed
Exhaust manifold system collects the individual tool exhausts from throughout the Fab
Table 2-1 summarizes the principal characteristics of the exhaust systems in the three buildings at IBM’s 300mm fab where FGHGs and N2O are used. Note that there are a total of 186 FGHG using tools and 14 sample points. Table 2-1. IBM EFK Fab Building Exhaust System Characteristics.
Building System#
stacks
# sample points
# Fgas & N2O tools
tot flow (cfm)
B323 Acid 2 2 51 128,047B323 Base 1 1 26 50,069B323 General 7 7 62 297,255
B323A Acid 2 1 38 52,011B323A Base 3 1 4 20,032
B320 200mm C4 Acid 1 1 3 32,944B320 300mm C4 Acid 1 1 2 43,607
Totals: 14 186 619,420
IBM300mmStackTestOct2011ResultsDESpeedMar152012LL.doc Page 6 of 25
SIA v. EPA, (D.C. Cir. No. 1024) Privileged and Confidential, For Settlement Purposes Only
Figure 2-3. B323 Acid Exhaust Schematic (see Appendix 2 for detail drawing)
AcidScrub
B
AcidScrub
C
AcidScrub
D
AcidScrub
E
AcidScrub
A
Acid Stack ASample extraction point
Acid Stack BSample extraction point
MFG Floor and Subfab Laterals
A
A B C D E
B/323 Acid Exhaust
AcidScrub
B
AcidScrub
C
AcidScrub
D
AcidScrub
E
AcidScrub
A
Acid Stack ASample extraction point
Acid Stack BSample extraction point
MFG Floor and Subfab Laterals
A
A B C D E
B/323 Acid Exhaust
The B323 base exhaust system consists of four conventional base scrubbers, which utilize an acidic (H2SO4) scrubber liquor and are connected by manifold into a single stack. A summary of the manufacturing tools that are connected to the B323 base exhaust system is listed in Table 2-1. A schematic drawing of the B323 base stack is shown in Figure 2-4. Detailed drawings regarding the B323 base exhaust stack sample points are provided in the Appendix. Figure 2-4. B323 Base Exhaust Schematic (see Appendix 2 for detailed drawing)
BaseScrub
B
BaseScrub
C
BaseScrub
D
BaseScrub
A
Base Stack Sample location
Sampling locations for each Scrub Input
CFM LOADS
Base Output Stack = 48,663
Input Scrub A = 12,906
Input Scrub B = 13,058
Input Scrub C = 12,741
Input Scrub D = 14,240
A
A B C D
MFG Floor and Subfab Laterals
B/323 Base Exhaust
IBM300mmStackTestOct2011ResultsDESpeedMar152012LL.doc Page 7 of 25
SIA v. EPA, (D.C. Cir. No. 1024) Privileged and Confidential, For Settlement Purposes Only
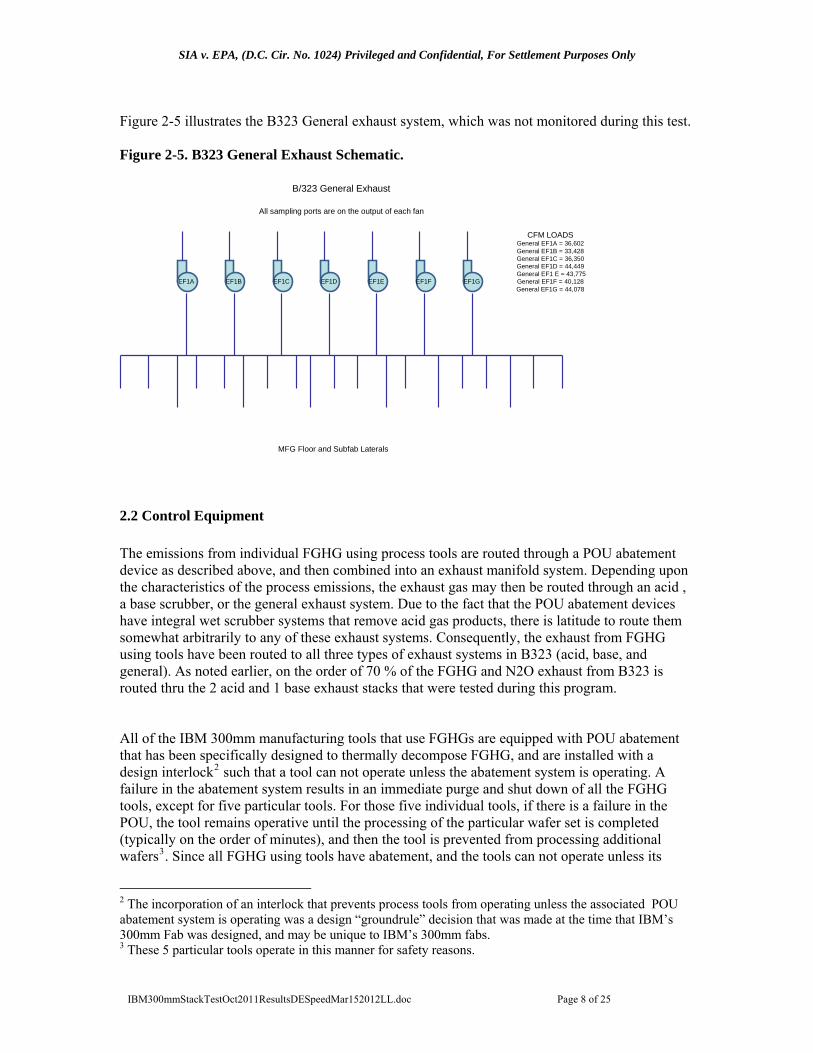
Figure 2-5 illustrates the B323 General exhaust system, which was not monitored during this test. Figure 2-5. B323 General Exhaust Schematic.
EF1A EF1B EF1C EF1D EF1E EF1F EF1G
MFG Floor and Subfab Laterals
B/323 General Exhaust
All sampling ports are on the output of each fan
CFM LOADSGeneral EF1A = 36,602General EF1B = 33,428General EF1C = 36,350General EF1D = 44,449General EF1 E = 43,775General EF1F = 40,128General EF1G = 44,078
2.2 Control Equipment
The emissions from individual FGHG using process tools are routed through a POU abatement device as described above, and then combined into an exhaust manifold system. Depending upon the characteristics of the process emissions, the exhaust gas may then be routed through an acid , a base scrubber, or the general exhaust system. Due to the fact that the POU abatement devices have integral wet scrubber systems that remove acid gas products, there is latitude to route them somewhat arbitrarily to any of these exhaust systems. Consequently, the exhaust from FGHG using tools have been routed to all three types of exhaust systems in B323 (acid, base, and general). As noted earlier, on the order of 70 % of the FGHG and N2O exhaust from B323 is routed thru the 2 acid and 1 base exhaust stacks that were tested during this program. All of the IBM 300mm manufacturing tools that use FGHGs are equipped with POU abatement that has been specifically designed to thermally decompose FGHG, and are installed with a design interlock2 such that a tool can not operate unless the abatement system is operating. A failure in the abatement system results in an immediate purge and shut down of all the FGHG tools, except for five particular tools. For those five individual tools, if there is a failure in the POU, the tool remains operative until the processing of the particular wafer set is completed (typically on the order of minutes), and then the tool is prevented from processing additional wafers3. Since all FGHG using tools have abatement, and the tools can not operate unless its
2 The incorporation of an interlock that prevents process tools from operating unless the associated POU abatement system is operating was a design “groundrule” decision that was made at the time that IBM’s 300mm Fab was designed, and may be unique to IBM’s 300mm fabs. 3 These 5 particular tools operate in this manner for safety reasons.
IBM300mmStackTestOct2011ResultsDESpeedMar152012LL.doc Page 8 of 25
SIA v. EPA, (D.C. Cir. No. 1024) Privileged and Confidential, For Settlement Purposes Only
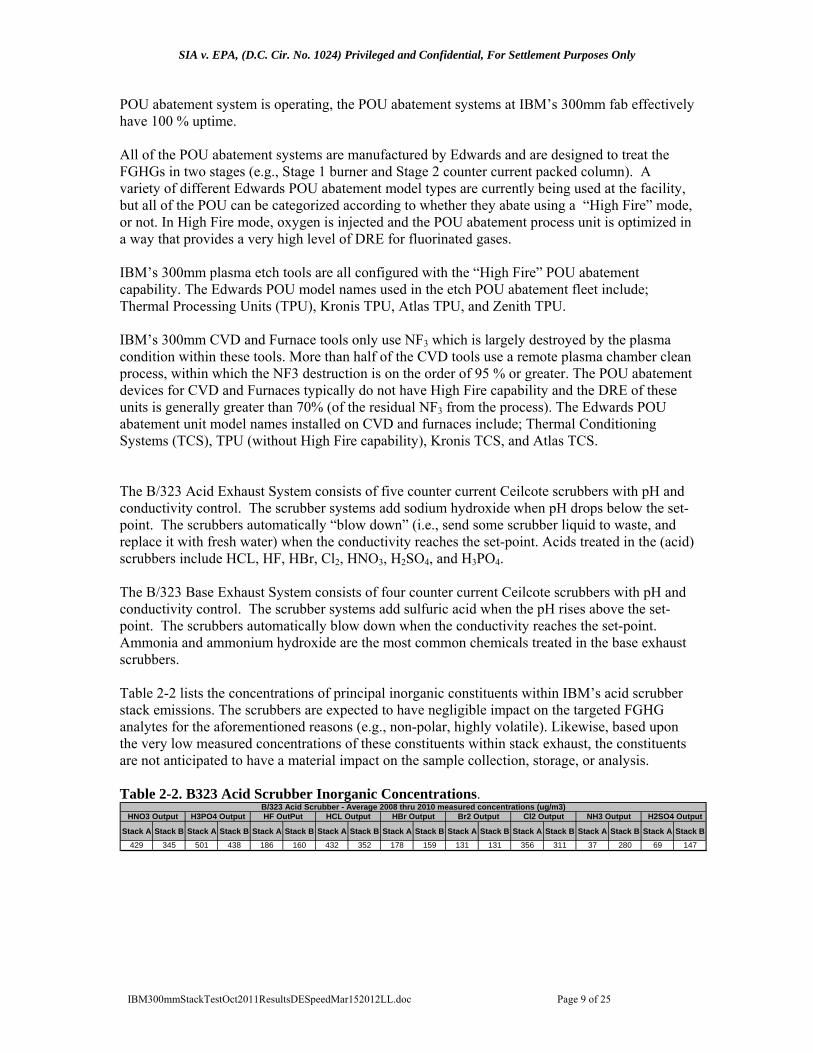
POU abatement system is operating, the POU abatement systems at IBM’s 300mm fab effectively have 100 % uptime. All of the POU abatement systems are manufactured by Edwards and are designed to treat the FGHGs in two stages (e.g., Stage 1 burner and Stage 2 counter current packed column). A variety of different Edwards POU abatement model types are currently being used at the facility, but all of the POU can be categorized according to whether they abate using a “High Fire” mode, or not. In High Fire mode, oxygen is injected and the POU abatement process unit is optimized in a way that provides a very high level of DRE for fluorinated gases. IBM’s 300mm plasma etch tools are all configured with the “High Fire” POU abatement capability. The Edwards POU model names used in the etch POU abatement fleet include; Thermal Processing Units (TPU), Kronis TPU, Atlas TPU, and Zenith TPU. IBM’s 300mm CVD and Furnace tools only use NF3 which is largely destroyed by the plasma condition within these tools. More than half of the CVD tools use a remote plasma chamber clean process, within which the NF3 destruction is on the order of 95 % or greater. The POU abatement devices for CVD and Furnaces typically do not have High Fire capability and the DRE of these units is generally greater than 70% (of the residual NF3 from the process). The Edwards POU abatement unit model names installed on CVD and furnaces include; Thermal Conditioning Systems (TCS), TPU (without High Fire capability), Kronis TCS, and Atlas TCS. The B/323 Acid Exhaust System consists of five counter current Ceilcote scrubbers with pH and conductivity control. The scrubber systems add sodium hydroxide when pH drops below the set-point. The scrubbers automatically “blow down” (i.e., send some scrubber liquid to waste, and replace it with fresh water) when the conductivity reaches the set-point. Acids treated in the (acid) scrubbers include HCL, HF, HBr, Cl2, HNO3, H2SO4, and H3PO4. The B/323 Base Exhaust System consists of four counter current Ceilcote scrubbers with pH and conductivity control. The scrubber systems add sulfuric acid when the pH rises above the set-point. The scrubbers automatically blow down when the conductivity reaches the set-point. Ammonia and ammonium hydroxide are the most common chemicals treated in the base exhaust scrubbers. Table 2-2 lists the concentrations of principal inorganic constituents within IBM’s acid scrubber stack emissions. The scrubbers are expected to have negligible impact on the targeted FGHG analytes for the aforementioned reasons (e.g., non-polar, highly volatile). Likewise, based upon the very low measured concentrations of these constituents within stack exhaust, the constituents are not anticipated to have a material impact on the sample collection, storage, or analysis. Table 2-2. B323 Acid Scrubber Inorganic Concentrations.
Stack A Stack B Stack A Stack B Stack A Stack B Stack A Stack B Stack A Stack B Stack A Stack B Stack A Stack B Stack A Stack B Stack A Stack B
429 345 501 438 186 160 432 352 178 159 131 131 356 311 37 280 69 147
B/323 Acid Scrubber - Average 2008 thru 2010 measured concentrations (ug/m3)HNO3 Output H3PO4 Output HF OutPut HCL Output HBr Output Br2 Output Cl2 Output NH3 Output H2SO4 Output
IBM300mmStackTestOct2011ResultsDESpeedMar152012LL.doc Page 9 of 25
SIA v. EPA, (D.C. Cir. No. 1024) Privileged and Confidential, For Settlement Purposes Only
2.3 Stack Sampling Locations
The sample locations were described qualitatively in Section 2. The Appendix contains detailed diagrams and other pertinent information regarding the sampling locations. The stack sampling locations meet EPA Method 1 sample point criteria.
3.0 Summary and Discussion of Results
3.1 Objectives and Test Matrix
The purpose of the testing described in this report is to further the development of a method for measuring the emissions of fluorinated greenhouse gases (FGHGs) and N2O from the stacks of semiconductor manufacturing facilities (Fabs), which can be included as an option for satisfying the reporting requirement under a revised Subpart I to 40 CFR Part 98. Specific objectives of the testing were to:
Perform FTIR method validation using EPA Method 320 Establish the FTIR Field detection limits Measure the Fgas and N2O concentrations at the B323 Acid and Base stacks using FTIR Measure the stack flow rates at the B323 Acid and Base stacks during the FTIR testing Measure the average gas usage rate for the corresponding test periods Estimate emissions based upon the measures stack flow rates and concentrations.
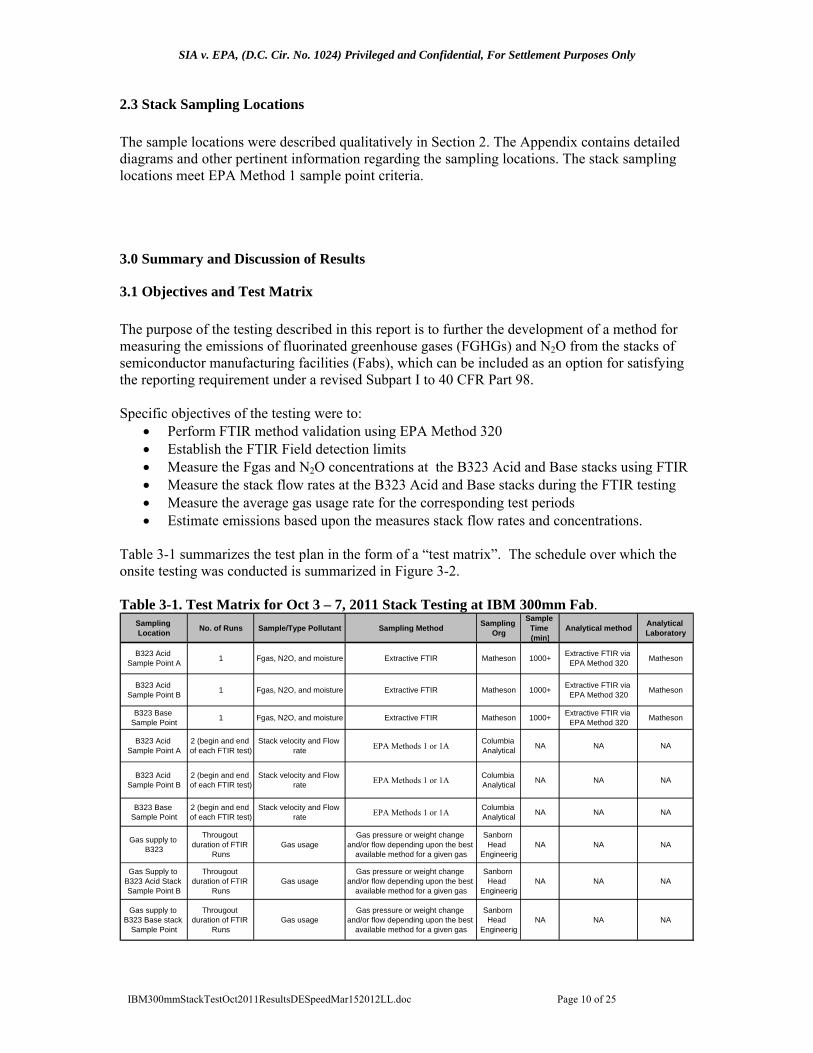
Table 3-1 summarizes the test plan in the form of a “test matrix”. The schedule over which the onsite testing was conducted is summarized in Figure 3-2. Table 3-1. Test Matrix for Oct 3 – 7, 2011 Stack Testing at IBM 300mm Fab.
Sampling Location
No. of Runs Sample/Type Pollutant Sampling MethodSampling
Org
Sample Time (min)
Analytical methodAnalytical Laboratory
B323 Acid Sample Point A
1 Fgas, N2O, and moisture Extractive FTIR Matheson 1000+Extractive FTIR via
EPA Method 320Matheson
B323 Acid Sample Point B
1 Fgas, N2O, and moisture Extractive FTIR Matheson 1000+Extractive FTIR via
EPA Method 320Matheson
B323 Base Sample Point
1 Fgas, N2O, and moisture Extractive FTIR Matheson 1000+Extractive FTIR via
EPA Method 320Matheson
B323 Acid Sample Point A
2 (begin and end of each FTIR test)
Stack velocity and Flow rate
EPA Methods 1 or 1AColumbia Analytical
NA NA NA
B323 Acid Sample Point B
2 (begin and end of each FTIR test)
Stack velocity and Flow rate
EPA Methods 1 or 1AColumbia Analytical
NA NA NA
B323 Base Sample Point
2 (begin and end of each FTIR test)
Stack velocity and Flow rate
EPA Methods 1 or 1AColumbia Analytical
NA NA NA
Gas supply to B323
Througout duration of FTIR
RunsGas usage
Gas pressure or weight change and/or flow depending upon the best
available method for a given gas
Sanborn Head
Engineerig NA NA NA
Gas Supply to B323 Acid Stack Sample Point B
Througout duration of FTIR
RunsGas usage
Gas pressure or weight change and/or flow depending upon the best
available method for a given gas
Sanborn Head
Engineerig NA NA NA
Gas supply to B323 Base stack
Sample Point
Througout duration of FTIR
RunsGas usage
Gas pressure or weight change and/or flow depending upon the best
available method for a given gas
Sanborn Head
Engineerig NA NA NA
IBM300mmStackTestOct2011ResultsDESpeedMar152012LL.doc Page 10 of 25
SIA v. EPA, (D.C. Cir. No. 1024) Privileged and Confidential, For Settlement Purposes Only
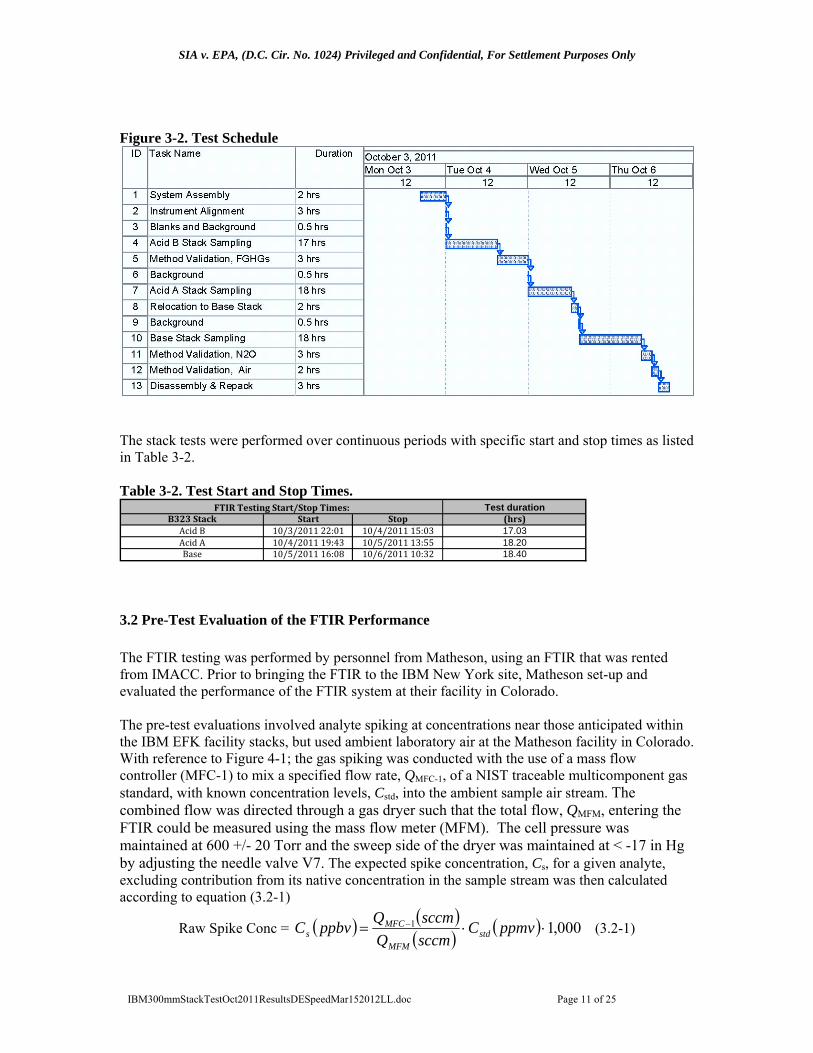
Figure 3-2. Test Schedule
The stack tests were performed over continuous periods with specific start and stop times as listed in Table 3-2. Table 3-2. Test Start and Stop Times.
Test durationB323 Stack Start Stop (hrs)Acid B 10/3/2011 22:01 10/4/2011 15:03 17.03Acid A 10/4/2011 19:43 10/5/2011 13:55 18.20Base 10/5/2011 16:08 10/6/2011 10:32 18.40
FTIR Testing Start/Stop Times:
3.2 Pre-Test Evaluation of the FTIR Performance
The FTIR testing was performed by personnel from Matheson, using an FTIR that was rented from IMACC. Prior to bringing the FTIR to the IBM New York site, Matheson set-up and evaluated the performance of the FTIR system at their facility in Colorado. The pre-test evaluations involved analyte spiking at concentrations near those anticipated within the IBM EFK facility stacks, but used ambient laboratory air at the Matheson facility in Colorado. With reference to Figure 4-1; the gas spiking was conducted with the use of a mass flow controller (MFC-1) to mix a specified flow rate, QMFC-1, of a NIST traceable multicomponent gas standard, with known concentration levels, Cstd, into the ambient sample air stream. The combined flow was directed through a gas dryer such that the total flow, QMFM, entering the FTIR could be measured using the mass flow meter (MFM). The cell pressure was maintained at 600 +/- 20 Torr and the sweep side of the dryer was maintained at < -17 in Hg by adjusting the needle valve V7. The expected spike concentration, Cs, for a given analyte, excluding contribution from its native concentration in the sample stream was then calculated according to equation (3.2-1)
Raw Spike Conc = 000,11 ppmvCsccmQsccmQppbvC std
MFM
MFCs (3.2-1)
IBM300mmStackTestOct2011ResultsDESpeedMar152012LL.doc Page 11 of 25
SIA v. EPA, (D.C. Cir. No. 1024) Privileged and Confidential, For Settlement Purposes Only
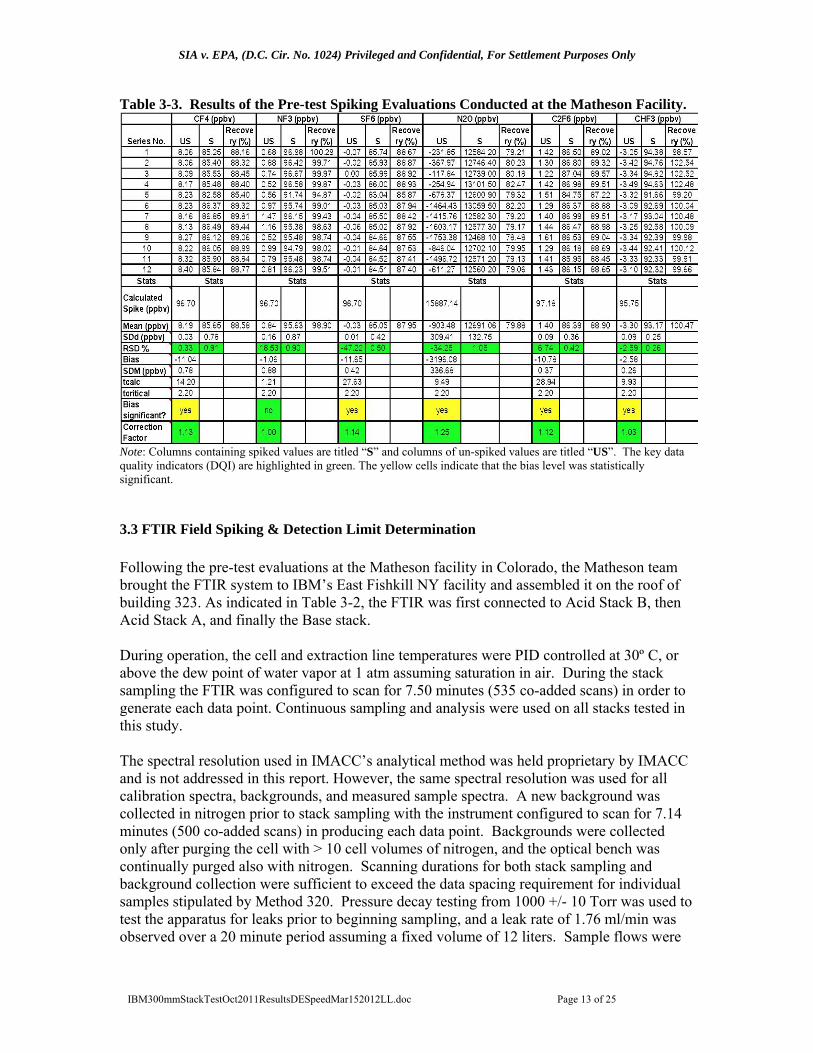
The results of the pretest spiking evaluation are reported in Table 3-3; which lists the relative standard deviation for both unspiked and spiked values, bias, and correction factor; which have been identified by EPA Method 301 (section 6.3) as the key data quality indicators (DQI) for the method. It can be noted that the unspiked concentrations values for SF6, N2O, and CHF3 all contain one or more negative concentration values. Although the relative standard deviation (RSD) values for some of the unspiked concentration values are relatively large, the EPA Method 301 DQIs were all met; and the relative standard deviations for the spiked concentration values are all well within acceptable parameters. Overall, the pre-test evaluation results demonstrate that the analytical method has high precision for the spiked analytes. Statistically significant bias levels did exist for several of the components. Although we do not know the true cause for the small but statistically significant bias, it is conceivable that it is the result of a difference between the gas standards that were used to build the instrument calibrations and the separate set of gas standards tht were used for the spiking exercise4. However, the biases found in the pre-test evaluation were not applied to the final data. At the time of the field testing, the spiking procedure was repeated and only those biases that were established as significant during the on-site field testing were applied to the final reported concentration values that were used for Fab emissions determinations.
4 We have no evidence of this, but it is not an uncommon experience.
IBM300mmStackTestOct2011ResultsDESpeedMar152012LL.doc Page 12 of 25
SIA v. EPA, (D.C. Cir. No. 1024) Privileged and Confidential, For Settlement Purposes Only
Table 3-3. Results of the Pre-test Spiking Evaluations Conducted at the Matheson Facility.
Note: Columns containing spiked values are titled “S” and columns of un-spiked values are titled “US”. The key data quality indicators (DQI) are highlighted in green. The yellow cells indicate that the bias level was statistically significant.
3.3 FTIR Field Spiking & Detection Limit Determination
Following the pre-test evaluations at the Matheson facility in Colorado, the Matheson team brought the FTIR system to IBM’s East Fishkill NY facility and assembled it on the roof of building 323. As indicated in Table 3-2, the FTIR was first connected to Acid Stack B, then Acid Stack A, and finally the Base stack. During operation, the cell and extraction line temperatures were PID controlled at 30º C, or above the dew point of water vapor at 1 atm assuming saturation in air. During the stack sampling the FTIR was configured to scan for 7.50 minutes (535 co-added scans) in order to generate each data point. Continuous sampling and analysis were used on all stacks tested in this study. The spectral resolution used in IMACC’s analytical method was held proprietary by IMACC and is not addressed in this report. However, the same spectral resolution was used for all calibration spectra, backgrounds, and measured sample spectra. A new background was collected in nitrogen prior to stack sampling with the instrument configured to scan for 7.14 minutes (500 co-added scans) in producing each data point. Backgrounds were collected only after purging the cell with > 10 cell volumes of nitrogen, and the optical bench was continually purged also with nitrogen. Scanning durations for both stack sampling and background collection were sufficient to exceed the data spacing requirement for individual samples stipulated by Method 320. Pressure decay testing from 1000 +/- 10 Torr was used to test the apparatus for leaks prior to beginning sampling, and a leak rate of 1.76 ml/min was observed over a 20 minute period assuming a fixed volume of 12 liters. Sample flows were
IBM300mmStackTestOct2011ResultsDESpeedMar152012LL.doc Page 13 of 25
SIA v. EPA, (D.C. Cir. No. 1024) Privileged and Confidential, For Settlement Purposes Only
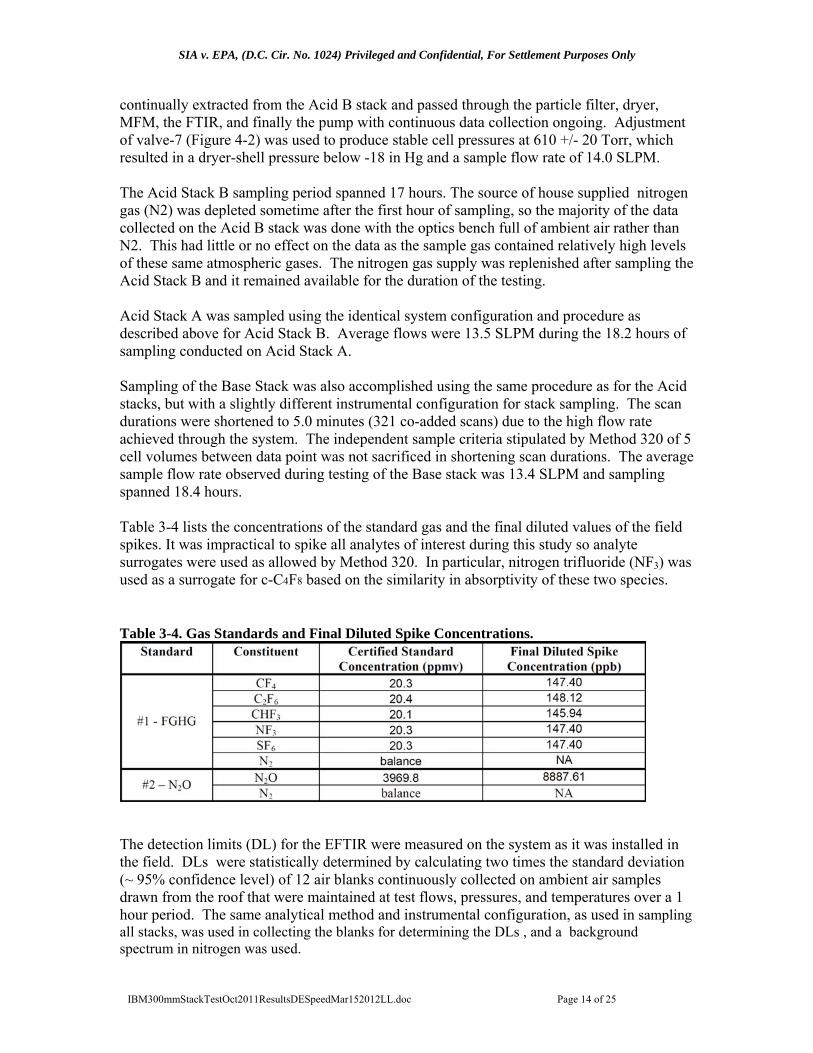
continually extracted from the Acid B stack and passed through the particle filter, dryer, MFM, the FTIR, and finally the pump with continuous data collection ongoing. Adjustment of valve-7 (Figure 4-2) was used to produce stable cell pressures at 610 +/- 20 Torr, which resulted in a dryer-shell pressure below -18 in Hg and a sample flow rate of 14.0 SLPM. The Acid Stack B sampling period spanned 17 hours. The source of house supplied nitrogen gas (N2) was depleted sometime after the first hour of sampling, so the majority of the data collected on the Acid B stack was done with the optics bench full of ambient air rather than N2. This had little or no effect on the data as the sample gas contained relatively high levels of these same atmospheric gases. The nitrogen gas supply was replenished after sampling the Acid Stack B and it remained available for the duration of the testing. Acid Stack A was sampled using the identical system configuration and procedure as described above for Acid Stack B. Average flows were 13.5 SLPM during the 18.2 hours of sampling conducted on Acid Stack A. Sampling of the Base Stack was also accomplished using the same procedure as for the Acid stacks, but with a slightly different instrumental configuration for stack sampling. The scan durations were shortened to 5.0 minutes (321 co-added scans) due to the high flow rate achieved through the system. The independent sample criteria stipulated by Method 320 of 5 cell volumes between data point was not sacrificed in shortening scan durations. The average sample flow rate observed during testing of the Base stack was 13.4 SLPM and sampling spanned 18.4 hours. Table 3-4 lists the concentrations of the standard gas and the final diluted values of the field spikes. It was impractical to spike all analytes of interest during this study so analyte surrogates were used as allowed by Method 320. In particular, nitrogen trifluoride (NF3) was used as a surrogate for c-C4F8 based on the similarity in absorptivity of these two species. Table 3-4. Gas Standards and Final Diluted Spike Concentrations.
The detection limits (DL) for the EFTIR were measured on the system as it was installed in the field. DLs were statistically determined by calculating two times the standard deviation (~ 95% confidence level) of 12 air blanks continuously collected on ambient air samples drawn from the roof that were maintained at test flows, pressures, and temperatures over a 1 hour period. The same analytical method and instrumental configuration, as used in sampling all stacks, was used in collecting the blanks for determining the DLs , and a background spectrum in nitrogen was used.
IBM300mmStackTestOct2011ResultsDESpeedMar152012LL.doc Page 14 of 25
SIA v. EPA, (D.C. Cir. No. 1024) Privileged and Confidential, For Settlement Purposes Only
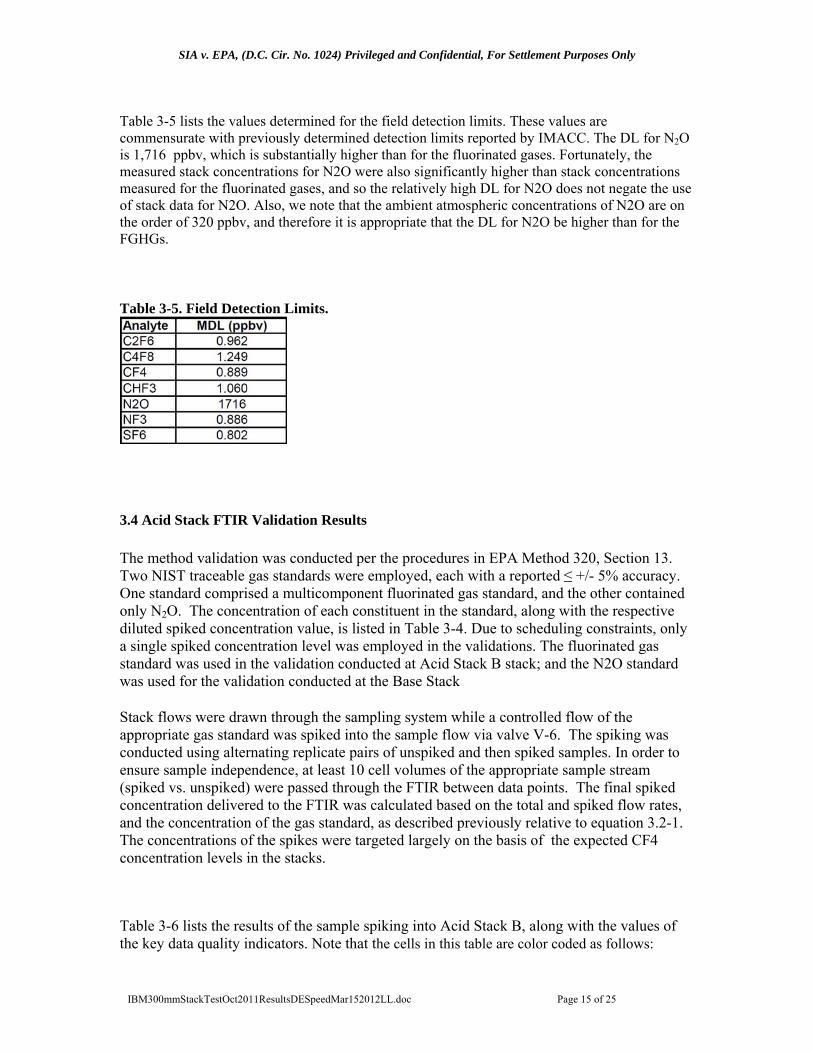
Table 3-5 lists the values determined for the field detection limits. These values are commensurate with previously determined detection limits reported by IMACC. The DL for N2O is 1,716 ppbv, which is substantially higher than for the fluorinated gases. Fortunately, the measured stack concentrations for N2O were also significantly higher than stack concentrations measured for the fluorinated gases, and so the relatively high DL for N2O does not negate the use of stack data for N2O. Also, we note that the ambient atmospheric concentrations of N2O are on the order of 320 ppbv, and therefore it is appropriate that the DL for N2O be higher than for the FGHGs. Table 3-5. Field Detection Limits.
3.4 Acid Stack FTIR Validation Results
The method validation was conducted per the procedures in EPA Method 320, Section 13. Two NIST traceable gas standards were employed, each with a reported ≤ +/- 5% accuracy. One standard comprised a multicomponent fluorinated gas standard, and the other contained only N2O. The concentration of each constituent in the standard, along with the respective diluted spiked concentration value, is listed in Table 3-4. Due to scheduling constraints, only a single spiked concentration level was employed in the validations. The fluorinated gas standard was used in the validation conducted at Acid Stack B stack; and the N2O standard was used for the validation conducted at the Base Stack Stack flows were drawn through the sampling system while a controlled flow of the appropriate gas standard was spiked into the sample flow via valve V-6. The spiking was conducted using alternating replicate pairs of unspiked and then spiked samples. In order to ensure sample independence, at least 10 cell volumes of the appropriate sample stream (spiked vs. unspiked) were passed through the FTIR between data points. The final spiked concentration delivered to the FTIR was calculated based on the total and spiked flow rates, and the concentration of the gas standard, as described previously relative to equation 3.2-1. The concentrations of the spikes were targeted largely on the basis of the expected CF4 concentration levels in the stacks. Table 3-6 lists the results of the sample spiking into Acid Stack B, along with the values of the key data quality indicators. Note that the cells in this table are color coded as follows:
IBM300mmStackTestOct2011ResultsDESpeedMar152012LL.doc Page 15 of 25
SIA v. EPA, (D.C. Cir. No. 1024) Privileged and Confidential, For Settlement Purposes Only
green cells indicate satisfactory achievement of the validation criteria yellow cells indicate that a bias correction was warranted, and employed red cells indicate a species that has failed one of the method validation requirements
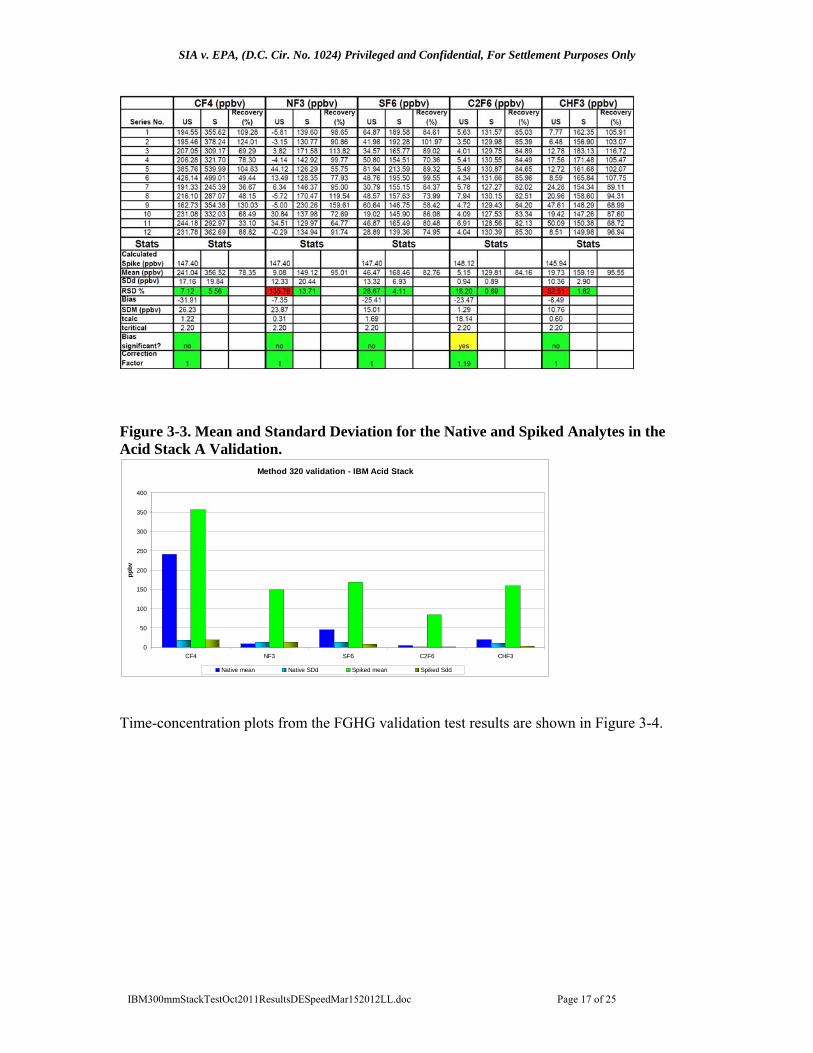
It can be noted that the unspiked NF3 method validation data contain a mix of negative and positive concentration values, and that the relative standard deviation for the unspiked NF3 data is 135.8 %, which is high, and fails the Method 301 data quality thresholds. However, the average recover of the corresponding spiked levels of NF3 is 95%, and the relative standard deviation of the spiked NF3 is 13.7 %. Thus, whereas NF3 fails the Method 301 data quality objectives because of variability in the low unspiked levels; the spiked concentration values are well behaved. The root cause of the negative values determined for the unspiked NF3 concentrations is unknown; however, we believe that refinement of the spectral region used to quantify NF3 may reduce or remove the cause of the negative returns seen for this species. CHF3 likewise failed the Method 301 validation criteria because of variability in the low level of unspiked concentrations (RSD = 52.5 %) and not because of the spike performance. The average recovery of the CHF3 spikes is 95.6 %, and the relative standard deviation of the spiked CHF3 levels is only 1.82 %. The other spiked analytes in Acid Stack B: CF4, SF6, and C2F6 all pass the method validation criteria. C2F6 does have a significant low bias, but it falls within the acceptable range (0.7 ≤ CF≤ 1.3) for application of a bias correction factor. Accordingly, a bias correction factor of 1.19 as indicated in Table 3-6 have been applied to the field data collected at both the Acid and Base stacks. c-C4F8 absorbs in a similar spectral region and with similar intensity as NF3 , and therefore NF3 was used as a surrogate for c-C4F8 The team believes that there are a number of relatively simple options for achieving successful validations for all of the components in the stacks. These might include the use of spikes at multiple concentration values, utilizing spectrally generated backgrounds and/or simple tuning of instrument parameters based upon the results reported here. Table 3-6. Method 320 Validation Data for FGHGs at Acid Stack B ( Table 5)
IBM300mmStackTestOct2011ResultsDESpeedMar152012LL.doc Page 16 of 25
SIA v. EPA, (D.C. Cir. No. 1024) Privileged and Confidential, For Settlement Purposes Only
Figure 3-3. Mean and Standard Deviation for the Native and Spiked Analytes in the Acid Stack A Validation.
Method 320 validation - IBM Acid Stack
0
50
100
150
200
250
300
350
400
CF4 NF3 SF6 C2F6 CHF3
pp
bv
Native mean Native SDd Spiked mean Spiked Sdd Time-concentration plots from the FGHG validation test results are shown in Figure 3-4.
IBM300mmStackTestOct2011ResultsDESpeedMar152012LL.doc Page 17 of 25
SIA v. EPA, (D.C. Cir. No. 1024) Privileged and Confidential, For Settlement Purposes Only
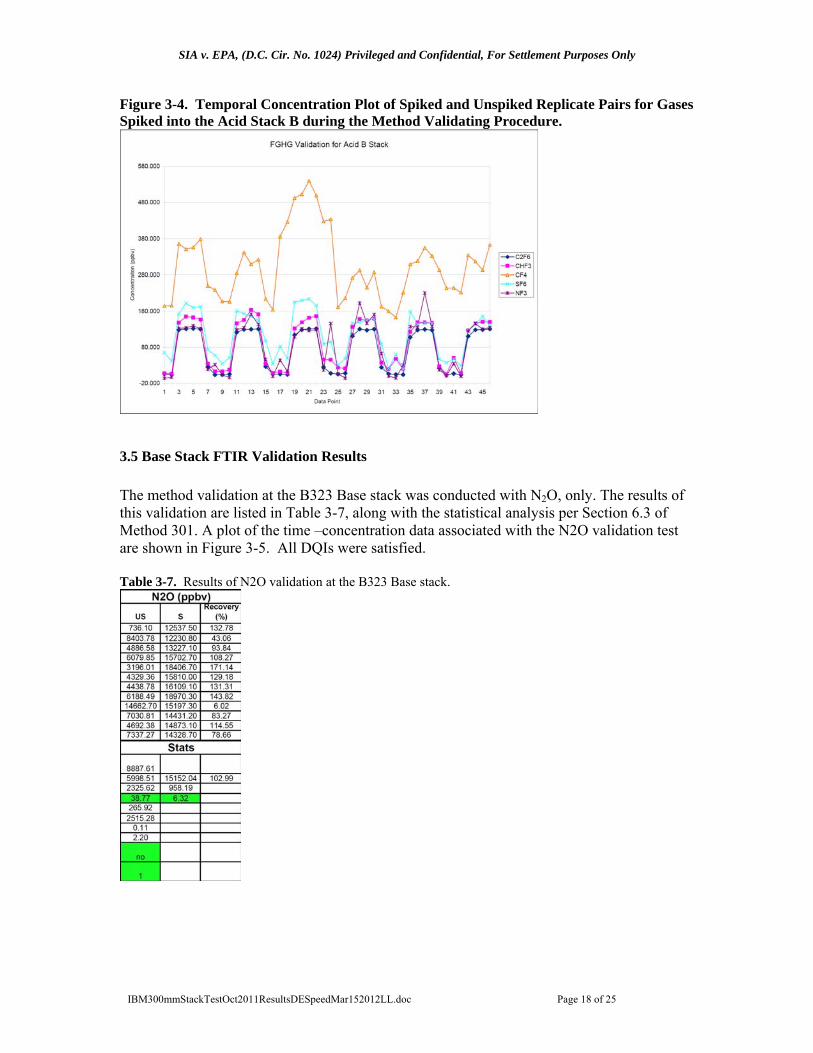
Figure 3-4. Temporal Concentration Plot of Spiked and Unspiked Replicate Pairs for Gases Spiked into the Acid Stack B during the Method Validating Procedure.
3.5 Base Stack FTIR Validation Results
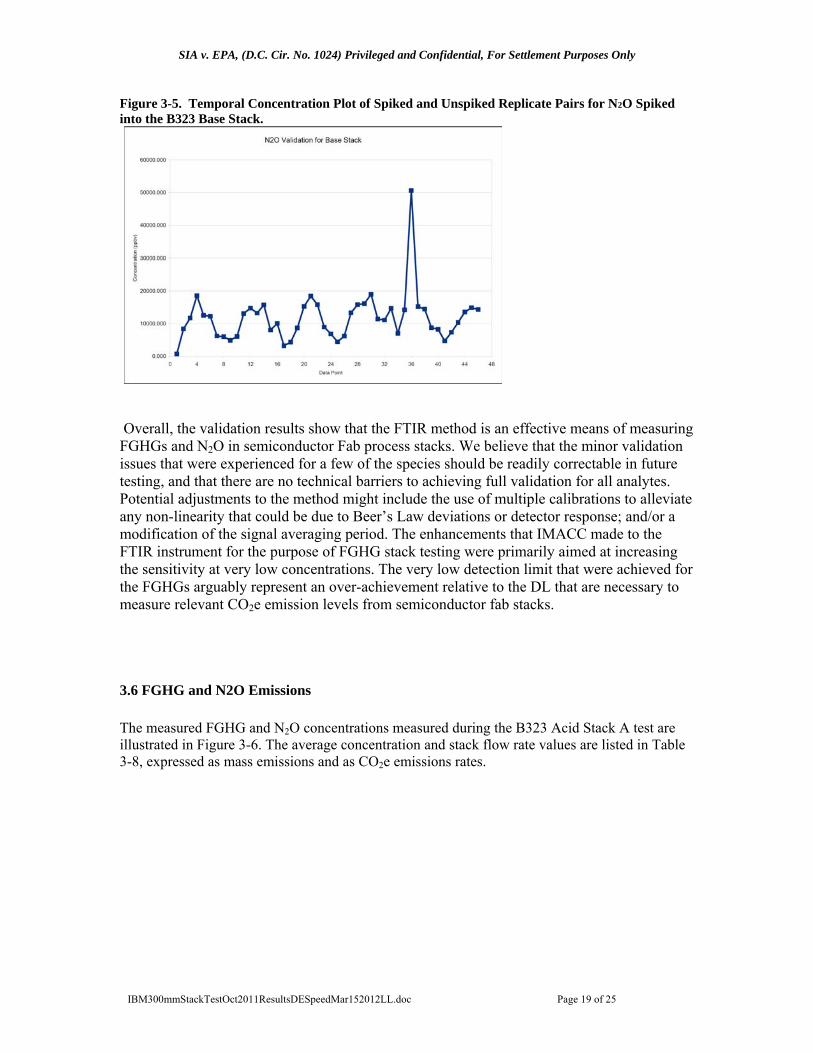
The method validation at the B323 Base stack was conducted with N2O, only. The results of this validation are listed in Table 3-7, along with the statistical analysis per Section 6.3 of Method 301. A plot of the time –concentration data associated with the N2O validation test are shown in Figure 3-5. All DQIs were satisfied. Table 3-7. Results of N2O validation at the B323 Base stack.
IBM300mmStackTestOct2011ResultsDESpeedMar152012LL.doc Page 18 of 25
SIA v. EPA, (D.C. Cir. No. 1024) Privileged and Confidential, For Settlement Purposes Only
Figure 3-5. Temporal Concentration Plot of Spiked and Unspiked Replicate Pairs for N2O Spiked into the B323 Base Stack.
Overall, the validation results show that the FTIR method is an effective means of measuring FGHGs and N2O in semiconductor Fab process stacks. We believe that the minor validation issues that were experienced for a few of the species should be readily correctable in future testing, and that there are no technical barriers to achieving full validation for all analytes. Potential adjustments to the method might include the use of multiple calibrations to alleviate any non-linearity that could be due to Beer’s Law deviations or detector response; and/or a modification of the signal averaging period. The enhancements that IMACC made to the FTIR instrument for the purpose of FGHG stack testing were primarily aimed at increasing the sensitivity at very low concentrations. The very low detection limit that were achieved for the FGHGs arguably represent an over-achievement relative to the DL that are necessary to measure relevant CO2e emission levels from semiconductor fab stacks.
3.6 FGHG and N2O Emissions
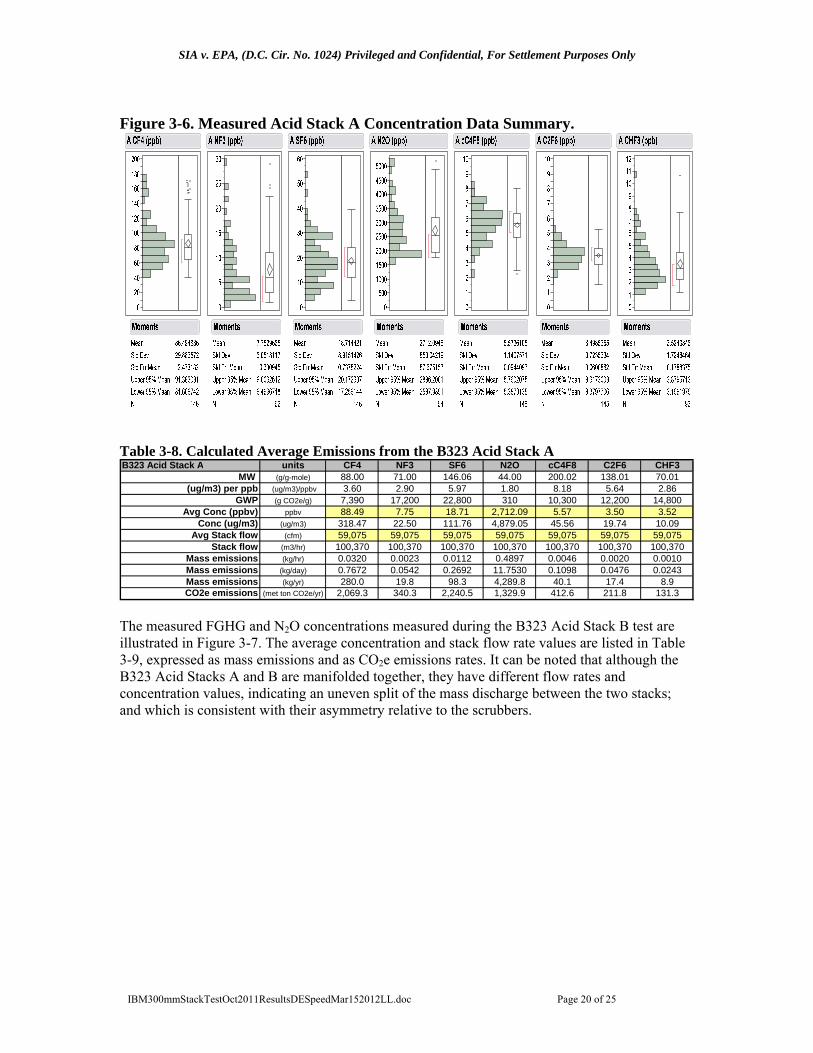
The measured FGHG and N2O concentrations measured during the B323 Acid Stack A test are illustrated in Figure 3-6. The average concentration and stack flow rate values are listed in Table 3-8, expressed as mass emissions and as CO2e emissions rates.
IBM300mmStackTestOct2011ResultsDESpeedMar152012LL.doc Page 19 of 25
SIA v. EPA, (D.C. Cir. No. 1024) Privileged and Confidential, For Settlement Purposes Only
Figure 3-6. Measured Acid Stack A Concentration Data Summary.
Table 3-8. Calculated Average Emissions from the B323 Acid Stack A B323 Acid Stack A units CF4 NF3 SF6 N2O cC4F8 C2F6 CHF3
MW (g/g-mole) 88.00 71.00 146.06 44.00 200.02 138.01 70.01(ug/m3) per ppb (ug/m3)/ppbv 3.60 2.90 5.97 1.80 8.18 5.64 2.86
GWP (g CO2e/g) 7,390 17,200 22,800 310 10,300 12,200 14,800Avg Conc (ppbv) ppbv 88.49 7.75 18.71 2,712.09 5.57 3.50 3.52
Conc (ug/m3) (ug/m3) 318.47 22.50 111.76 4,879.05 45.56 19.74 10.09Avg Stack flow (cfm) 59,075 59,075 59,075 59,075 59,075 59,075 59,075
Stack flow (m3/hr) 100,370 100,370 100,370 100,370 100,370 100,370 100,370Mass emissions (kg/hr) 0.0320 0.0023 0.0112 0.4897 0.0046 0.0020 0.0010Mass emissions (kg/day) 0.7672 0.0542 0.2692 11.7530 0.1098 0.0476 0.0243Mass emissions (kg/yr) 280.0 19.8 98.3 4,289.8 40.1 17.4 8.9CO2e emissions (met ton CO2e/yr) 2,069.3 340.3 2,240.5 1,329.9 412.6 211.8 131.3
The measured FGHG and N2O concentrations measured during the B323 Acid Stack B test are illustrated in Figure 3-7. The average concentration and stack flow rate values are listed in Table 3-9, expressed as mass emissions and as CO2e emissions rates. It can be noted that although the B323 Acid Stacks A and B are manifolded together, they have different flow rates and concentration values, indicating an uneven split of the mass discharge between the two stacks; and which is consistent with their asymmetry relative to the scrubbers.
IBM300mmStackTestOct2011ResultsDESpeedMar152012LL.doc Page 20 of 25
SIA v. EPA, (D.C. Cir. No. 1024) Privileged and Confidential, For Settlement Purposes Only
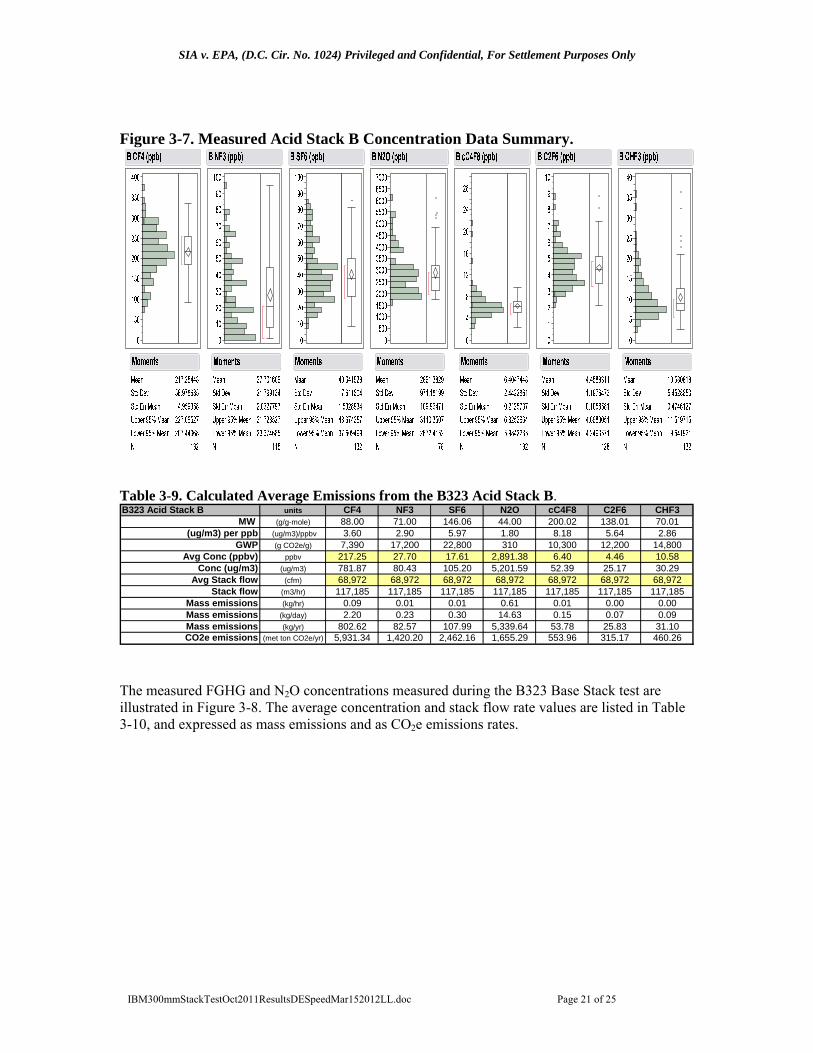
Figure 3-7. Measured Acid Stack B Concentration Data Summary.
Table 3-9. Calculated Average Emissions from the B323 Acid Stack B. B323 Acid Stack B units CF4 NF3 SF6 N2O cC4F8 C2F6 CHF3
MW (g/g-mole) 88.00 71.00 146.06 44.00 200.02 138.01 70.01(ug/m3) per ppb (ug/m3)/ppbv 3.60 2.90 5.97 1.80 8.18 5.64 2.86
GWP (g CO2e/g) 7,390 17,200 22,800 310 10,300 12,200 14,800Avg Conc (ppbv) ppbv 217.25 27.70 17.61 2,891.38 6.40 4.46 10.58
Conc (ug/m3) (ug/m3) 781.87 80.43 105.20 5,201.59 52.39 25.17 30.29Avg Stack flow (cfm) 68,972 68,972 68,972 68,972 68,972 68,972 68,972
Stack flow (m3/hr) 117,185 117,185 117,185 117,185 117,185 117,185 117,185Mass emissions (kg/hr) 0.09 0.01 0.01 0.61 0.01 0.00 0.00Mass emissions (kg/day) 2.20 0.23 0.30 14.63 0.15 0.07 0.09Mass emissions (kg/yr) 802.62 82.57 107.99 5,339.64 53.78 25.83 31.10CO2e emissions (met ton CO2e/yr) 5,931.34 1,420.20 2,462.16 1,655.29 553.96 315.17 460.26
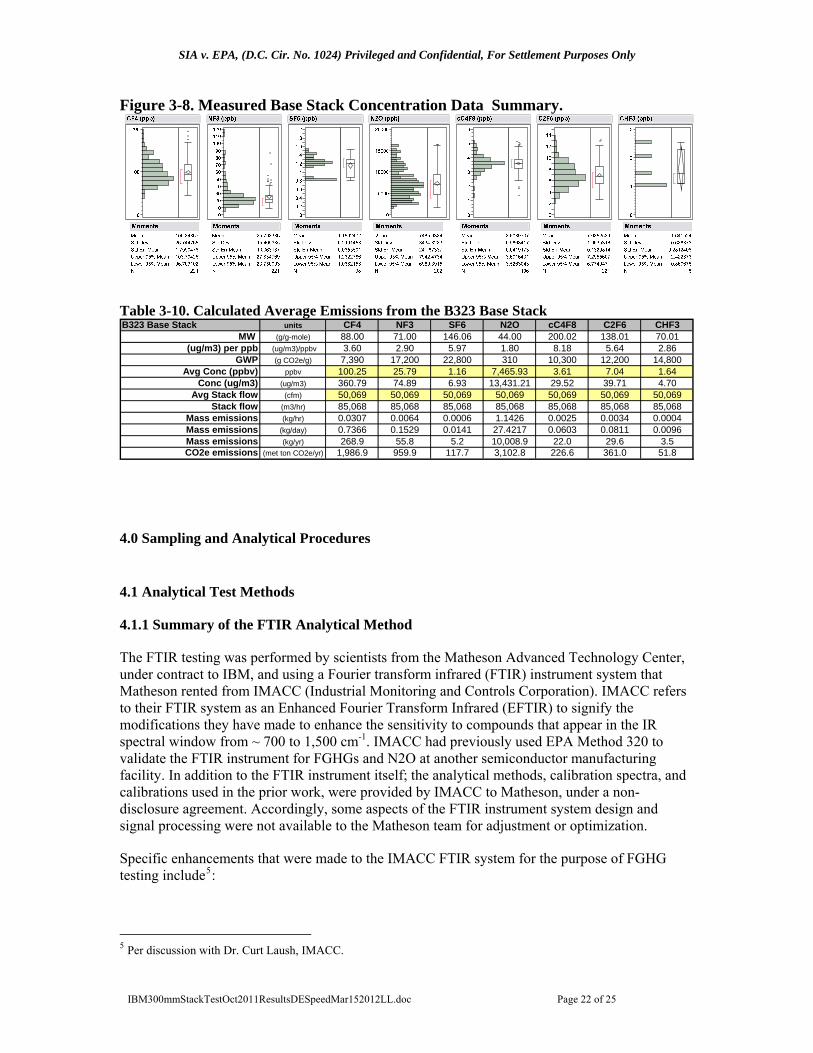
The measured FGHG and N2O concentrations measured during the B323 Base Stack test are illustrated in Figure 3-8. The average concentration and stack flow rate values are listed in Table 3-10, and expressed as mass emissions and as CO2e emissions rates.
IBM300mmStackTestOct2011ResultsDESpeedMar152012LL.doc Page 21 of 25
SIA v. EPA, (D.C. Cir. No. 1024) Privileged and Confidential, For Settlement Purposes Only
Figure 3-8. Measured Base Stack Concentration Data Summary.
Table 3-10. Calculated Average Emissions from the B323 Base Stack B323 Base Stack units CF4 NF3 SF6 N2O cC4F8 C2F6 CHF3
MW (g/g-mole) 88.00 71.00 146.06 44.00 200.02 138.01 70.01(ug/m3) per ppb (ug/m3)/ppbv 3.60 2.90 5.97 1.80 8.18 5.64 2.86
GWP (g CO2e/g) 7,390 17,200 22,800 310 10,300 12,200 14,800Avg Conc (ppbv) ppbv 100.25 25.79 1.16 7,465.93 3.61 7.04 1.64
Conc (ug/m3) (ug/m3) 360.79 74.89 6.93 13,431.21 29.52 39.71 4.70Avg Stack flow (cfm) 50,069 50,069 50,069 50,069 50,069 50,069 50,069
Stack flow (m3/hr) 85,068 85,068 85,068 85,068 85,068 85,068 85,068Mass emissions (kg/hr) 0.0307 0.0064 0.0006 1.1426 0.0025 0.0034 0.0004Mass emissions (kg/day) 0.7366 0.1529 0.0141 27.4217 0.0603 0.0811 0.0096Mass emissions (kg/yr) 268.9 55.8 5.2 10,008.9 22.0 29.6 3.5CO2e emissions (met ton CO2e/yr) 1,986.9 959.9 117.7 3,102.8 226.6 361.0 51.8
4.0 Sampling and Analytical Procedures
4.1 Analytical Test Methods
4.1.1 Summary of the FTIR Analytical Method
The FTIR testing was performed by scientists from the Matheson Advanced Technology Center, under contract to IBM, and using a Fourier transform infrared (FTIR) instrument system that Matheson rented from IMACC (Industrial Monitoring and Controls Corporation). IMACC refers to their FTIR system as an Enhanced Fourier Transform Infrared (EFTIR) to signify the modifications they have made to enhance the sensitivity to compounds that appear in the IR spectral window from ~ 700 to 1,500 cm-1. IMACC had previously used EPA Method 320 to validate the FTIR instrument for FGHGs and N2O at another semiconductor manufacturing facility. In addition to the FTIR instrument itself; the analytical methods, calibration spectra, and calibrations used in the prior work, were provided by IMACC to Matheson, under a non-disclosure agreement. Accordingly, some aspects of the FTIR instrument system design and signal processing were not available to the Matheson team for adjustment or optimization.
Specific enhancements that were made to the IMACC FTIR system for the purpose of FGHG testing include5:
5 Per discussion with Dr. Curt Laush, IMACC.
IBM300mmStackTestOct2011ResultsDESpeedMar152012LL.doc Page 22 of 25
SIA v. EPA, (D.C. Cir. No. 1024) Privileged and Confidential, For Settlement Purposes Only
A high temperature infrared source that operates several hundred degrees higher than a conventional globar blackbody source. This provides more energy in the mid-IR region, and helps increases the signal to noise ratio.
A custom IR detector with a more sensitive response and a lower dark current in the spectral regions where the majority of the FGHGs absorb.
Use of spectral regions that are optimized specifically for the FGHGs. A multi-pass cell with an IR path length of 69 meters and an internal volume of 11 liters.
Under Beer’s Law, the intensity of absorption is proportional to the product of the concentration and path length. Thus, increasing the path length provides a means of compensating for lower concentrations.
Operation of the interferometer at customized scanning parameters to achieve a higher signal to noise ratio.
Water (interferent) removal from the stack samples using a Nafion dryer.
4.1.2 FTIR Stack Sampling and Analysis Apparatus
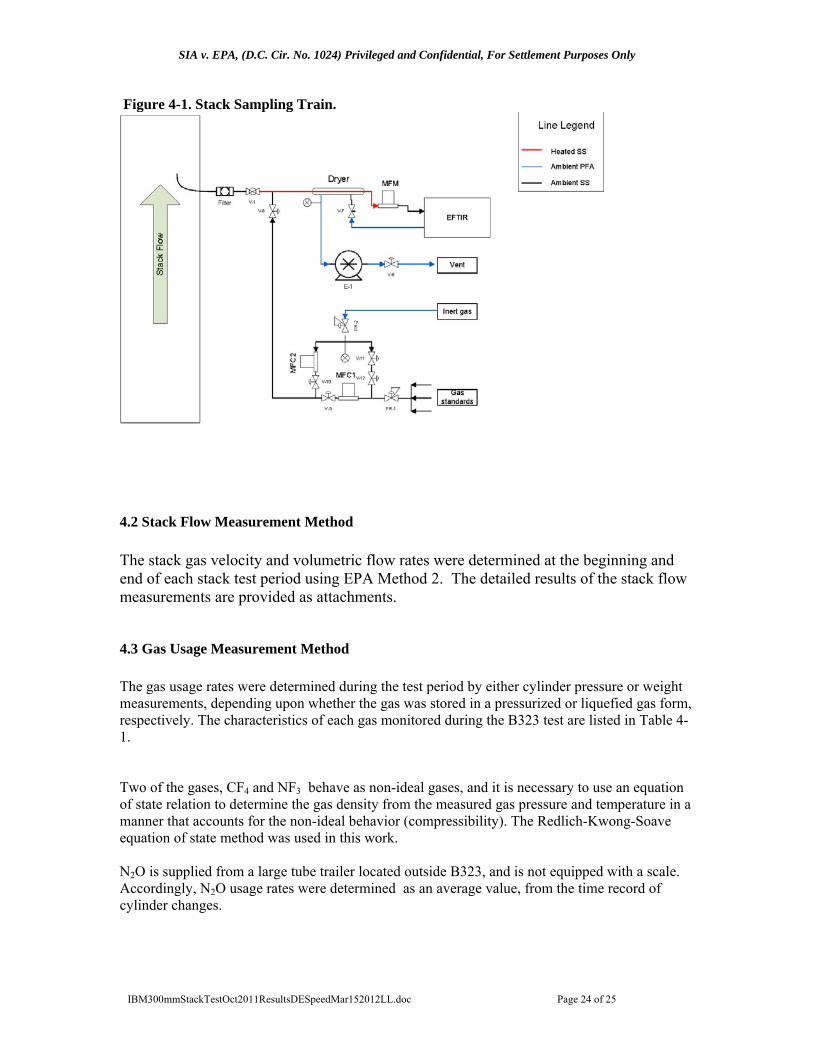
The sampling and analysis apparatus for the FTIR system was designed to meet the equipment criteria detailed in section 6.0 of Method 320; and is illustrated schematically in Figure 4-1. The principal components of the sampling system, as illustrated in the figure, are: a sample probe, particle filter (>99% efficiency above 0.1 micron), heated 50’ stainless steel sample extraction line, stainless steel gas distribution and dilution manifold, calibrated mass flow controllers (MFC), a mass flow meter (MFM) for flow control and measurement, a Nafion dryer for water vapor control. The sample probe was fabricated to extend into the emission duct by 1/3 of the duct diameter and was curved in the direction of flow to reduce particulate ingress into the sample stream. The dryer consists of a bundle of Nafion hollow fiber tubes contained within a stainless steel housing. It is operated by sending the pre-analysis sample stream through the inside of the tubes (tube side) at the cell pressure and by flowing the post-analysis sample stream over the outside of the tubes (shell side) under a vacuum of -15 to -20 in Hg. Water permeates from the tube side to the shell side thus lowering the moisture concentration in the pre-analysis sample. The instrument supplier reported that the dryer does not remove FGHGs or N2O from air-based sample streams, which is consistent with information regarding Nafion dryers as reported in Miller6 et al (2008).
6 Miller, B., R. Weiss, P. Salameh, T. Tanhua, B. Greally, J. Muhle, and P. Simmonds (2008). Medusa: A sample preconcentration and GC/MS detector system for insitu measurements of atmospheric trace halocarbons, hydrocarbons, and sulfur compounds. Analytical Chemistry. Vol. 80. p.1536-1545.
IBM300mmStackTestOct2011ResultsDESpeedMar152012LL.doc Page 23 of 25
SIA v. EPA, (D.C. Cir. No. 1024) Privileged and Confidential, For Settlement Purposes Only
Figure 4-1. Stack Sampling Train.
4.2 Stack Flow Measurement Method
The stack gas velocity and volumetric flow rates were determined at the beginning and end of each stack test period using EPA Method 2. The detailed results of the stack flow measurements are provided as attachments.
4.3 Gas Usage Measurement Method
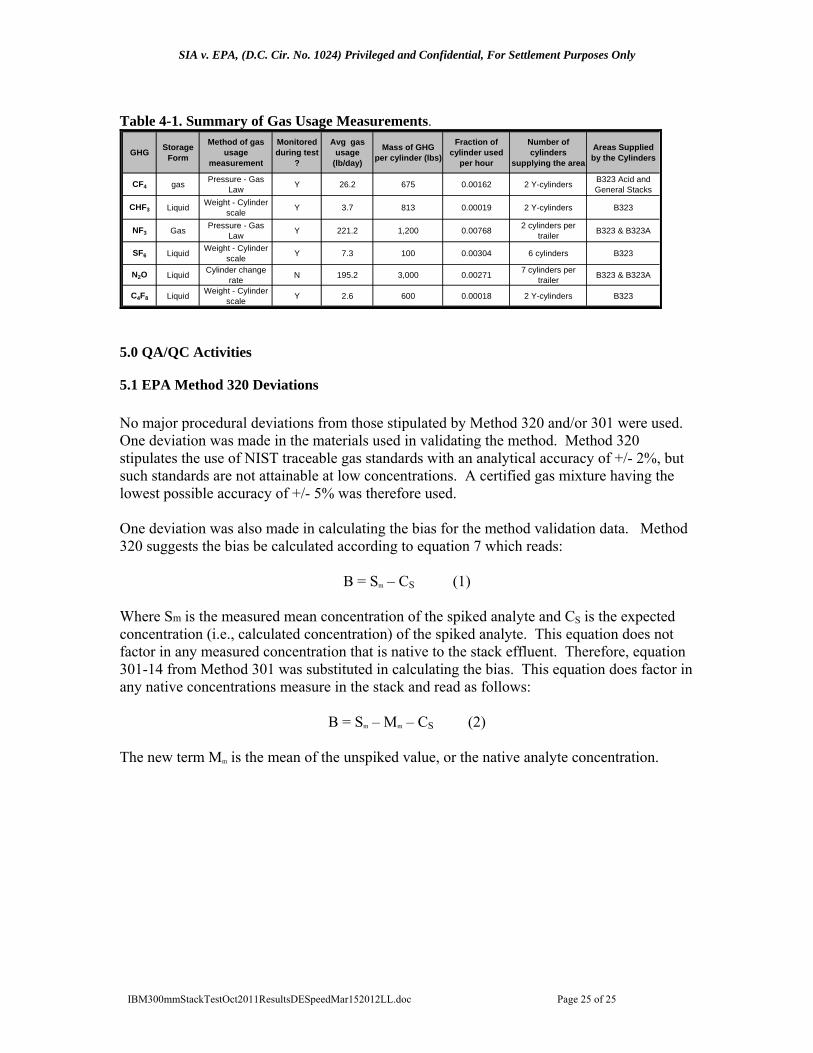
The gas usage rates were determined during the test period by either cylinder pressure or weight measurements, depending upon whether the gas was stored in a pressurized or liquefied gas form, respectively. The characteristics of each gas monitored during the B323 test are listed in Table 4-1. Two of the gases, CF4 and NF3 behave as non-ideal gases, and it is necessary to use an equation of state relation to determine the gas density from the measured gas pressure and temperature in a manner that accounts for the non-ideal behavior (compressibility). The Redlich-Kwong-Soave equation of state method was used in this work. N2O is supplied from a large tube trailer located outside B323, and is not equipped with a scale. Accordingly, N2O usage rates were determined as an average value, from the time record of cylinder changes.
IBM300mmStackTestOct2011ResultsDESpeedMar152012LL.doc Page 24 of 25
SIA v. EPA, (D.C. Cir. No. 1024) Privileged and Confidential, For Settlement Purposes Only
IBM300mmStackTestOct2011ResultsDESpeedMar152012LL.doc Page 25 of 25
Table 4-1. Summary of Gas Usage Measurements.
GHGStorage
Form
Method of gas usage
measurement
Monitored during test
?
Avg gas usage
(lb/day)
Mass of GHG per cylinder (lbs)
Fraction of cylinder used
per hour
Number of cylinders
supplying the area
Areas Supplied by the Cylinders
CF4 gasPressure - Gas
LawY 26.2 675 0.00162 2 Y-cylinders
B323 Acid and General Stacks
CHF3 LiquidWeight - Cylinder
scaleY 3.7 813 0.00019 2 Y-cylinders B323
NF3 GasPressure - Gas
LawY 221.2 1,200 0.00768
2 cylinders per trailer
B323 & B323A
SF6 LiquidWeight - Cylinder
scaleY 7.3 100 0.00304 6 cylinders B323
N2O LiquidCylinder change
rateN 195.2 3,000 0.00271
7 cylinders per trailer
B323 & B323A
C4F8 LiquidWeight - Cylinder
scaleY 2.6 600 0.00018 2 Y-cylinders B323
5.0 QA/QC Activities
5.1 EPA Method 320 Deviations
No major procedural deviations from those stipulated by Method 320 and/or 301 were used. One deviation was made in the materials used in validating the method. Method 320 stipulates the use of NIST traceable gas standards with an analytical accuracy of +/- 2%, but such standards are not attainable at low concentrations. A certified gas mixture having the lowest possible accuracy of +/- 5% was therefore used. One deviation was also made in calculating the bias for the method validation data. Method 320 suggests the bias be calculated according to equation 7 which reads:
B = Sm – CS (1) Where Sm is the measured mean concentration of the spiked analyte and CS is the expected concentration (i.e., calculated concentration) of the spiked analyte. This equation does not factor in any measured concentration that is native to the stack effluent. Therefore, equation 301-14 from Method 301 was substituted in calculating the bias. This equation does factor in any native concentrations measure in the stack and read as follows:
B = Sm – Mm – CS (2) The new term Mm is the mean of the unspiked value, or the native analyte concentration.