Embed Size (px)
Citation preview
IBI-ROOS report EuroGOOS Annual meeting,
BELSPO, Brussels20th to 21st November 2013
Glenn Nolan, Sylvie Pouliquen, Sylvain Cailleau, Marc Sourisseau, Rodrigo Fernandes, Marta de Alfonso, Kieran Lyons, Vicente Perez-Munuzuri
http://www.ibi-roos.eu
Real Time access to In situ observing systems
in the IBI-ROOS region in 2009
- 12 partners cooperated for the provision of
operational Oceanography services
- Maily Drifters, Argo and some Tidal
gauges/Moorings were shared
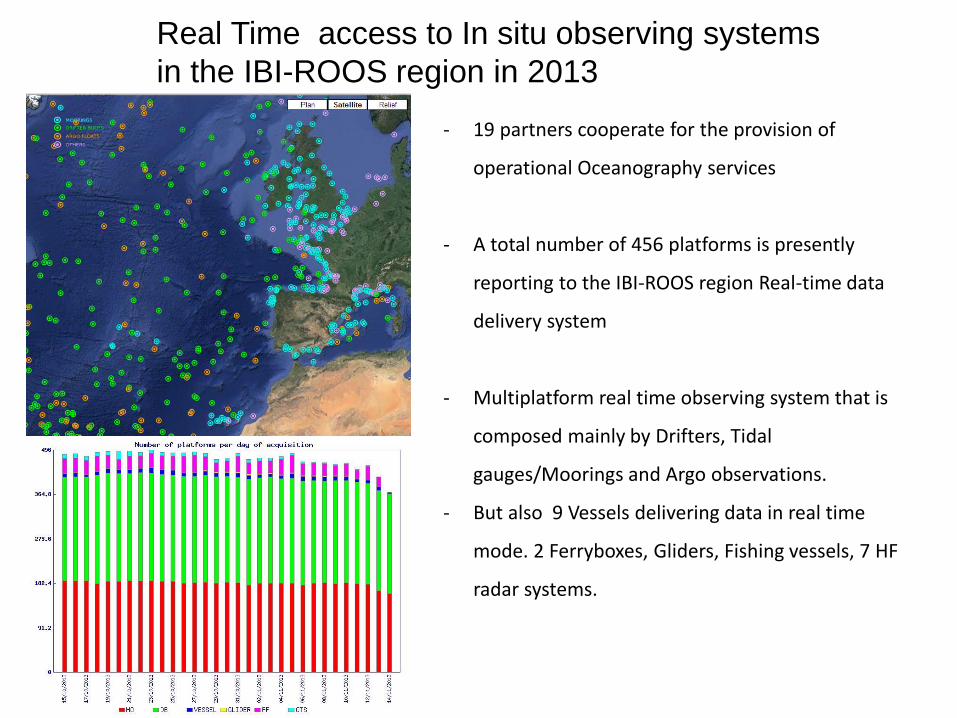
Real Time access to In situ observing systems
in the IBI-ROOS region in 2013
- 19 partners cooperate for the provision of
operational Oceanography services
- A total number of 456 platforms is presently
reporting to the IBI-ROOS region Real-time data
delivery system
- Multiplatform real time observing system that is
composed mainly by Drifters, Tidal
gauges/Moorings and Argo observations.
- But also 9 Vessels delivering data in real time
mode. 2 Ferryboxes, Gliders, Fishing vessels, 7 HF
radar systems.
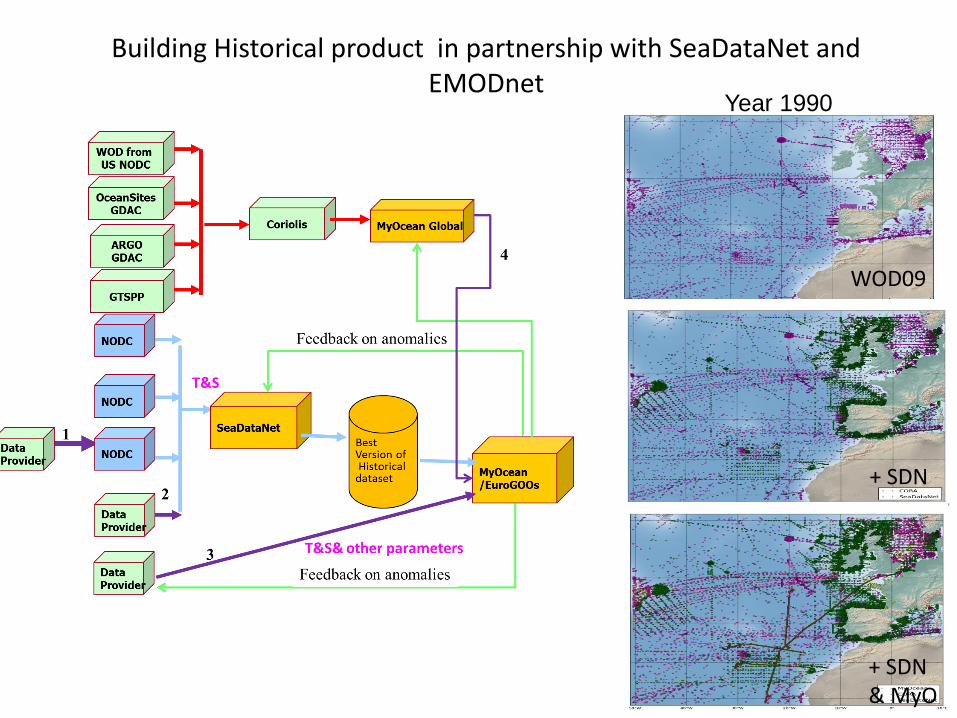
Building Historical product in partnership with SeaDataNet and EMODnet
Year 1990
WOD09
+ SDN
+ SDN & MyO
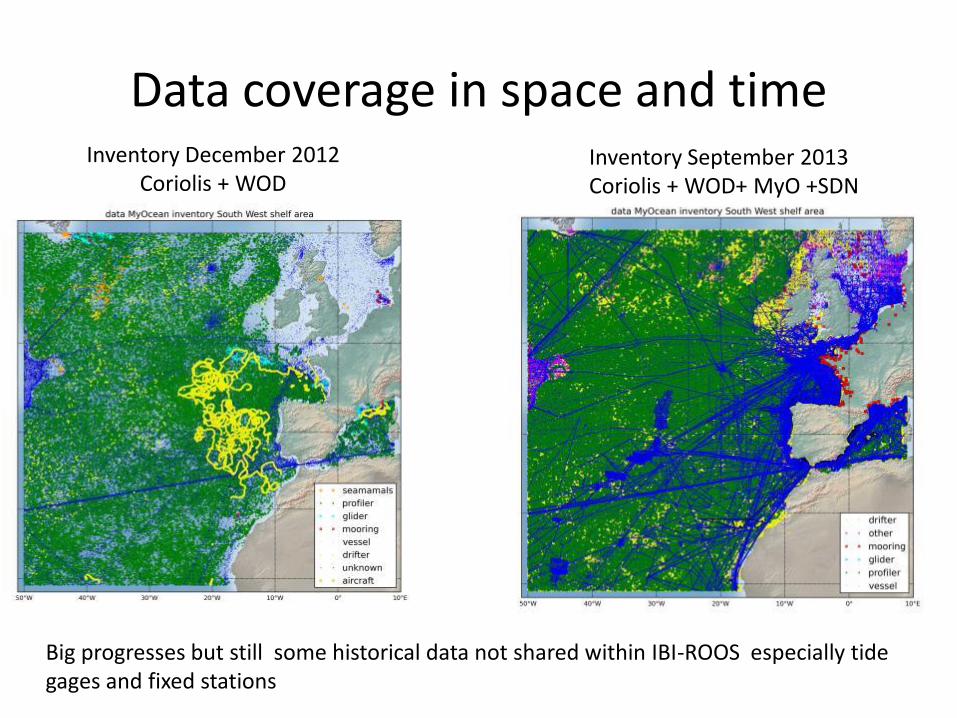
Data coverage in space and timeInventory December 2012
Coriolis + WODInventory September 2013Coriolis + WOD+ MyO +SDN
Big progresses but still some historical data not shared within IBI-ROOS especially tide gages and fixed stations
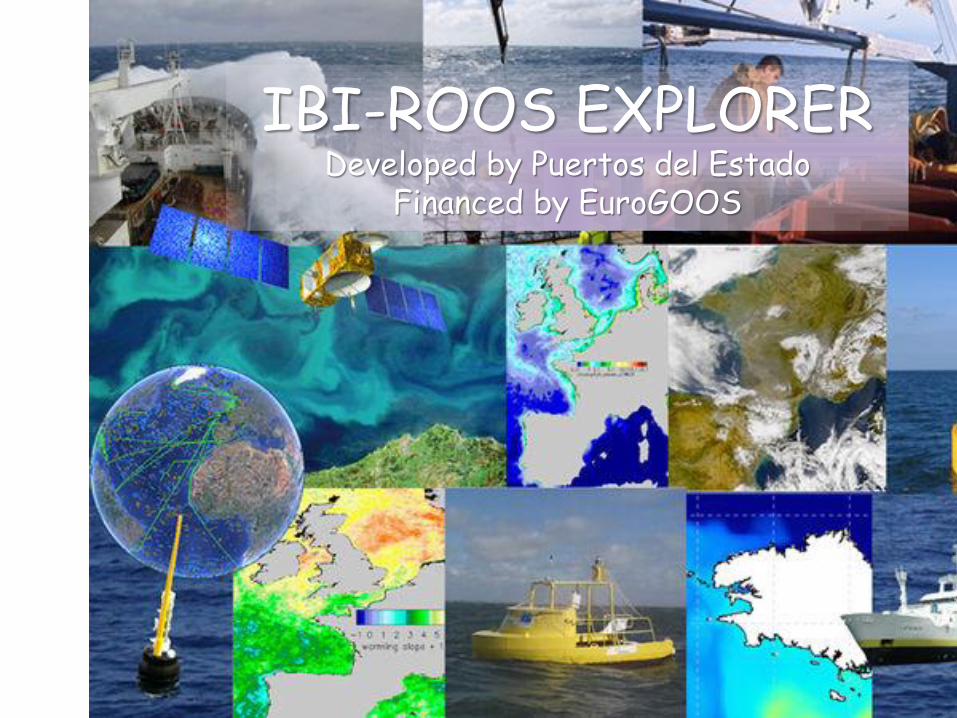
IBI-ROOS EXPLORERDeveloped by Puertos del Estado
Financed by EuroGOOS
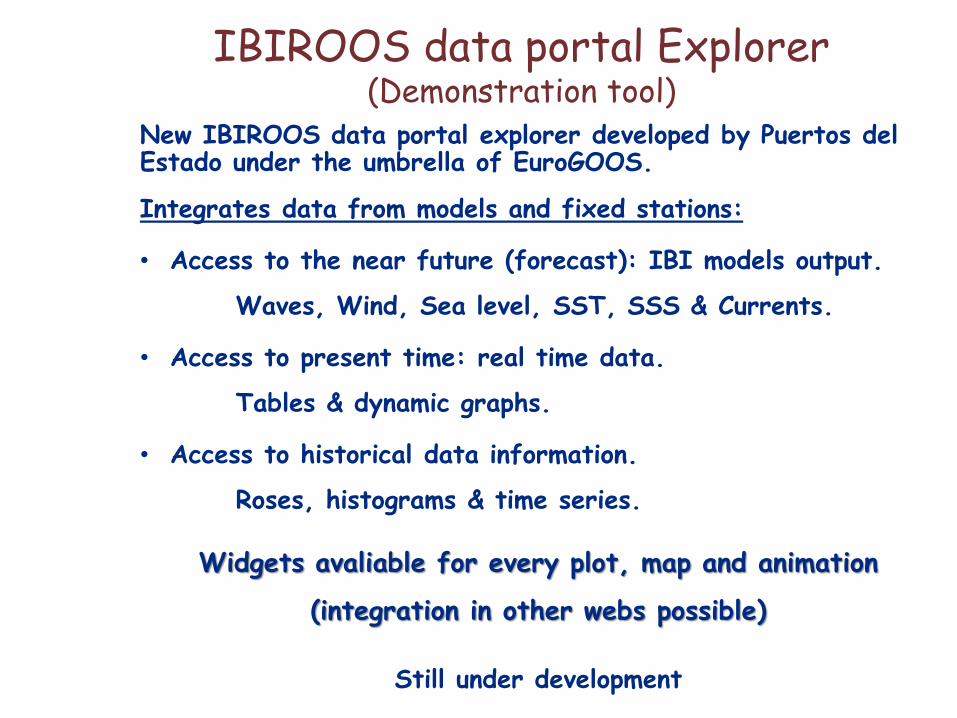
IBIROOS data portal Explorer(Demonstration tool)
New IBIROOS data portal explorer developed by Puertos del Estado under the umbrella of EuroGOOS.
Integrates data from models and fixed stations:
• Access to the near future (forecast): IBI models output.
Waves, Wind, Sea level, SST, SSS & Currents.
• Access to present time: real time data.
Tables & dynamic graphs.
• Access to historical data information.
Roses, histograms & time series.
Widgets avaliable for every plot, map and animation
(integration in other webs possible)
Still under development
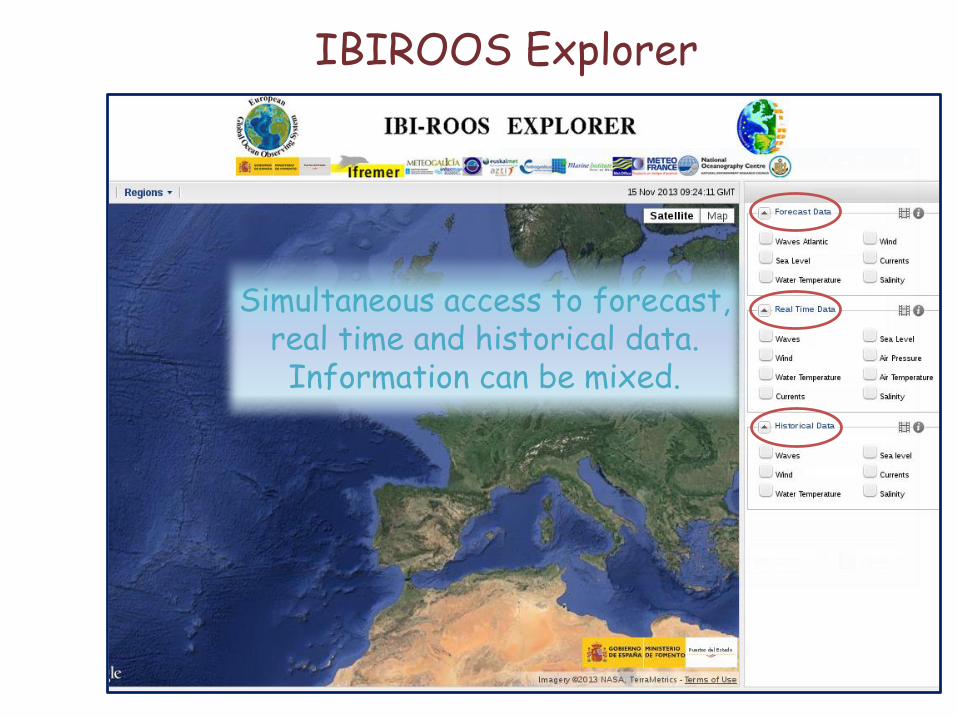
IBIROOS Explorer
Simultaneous access to forecast, real time and historical data. Information can be mixed.
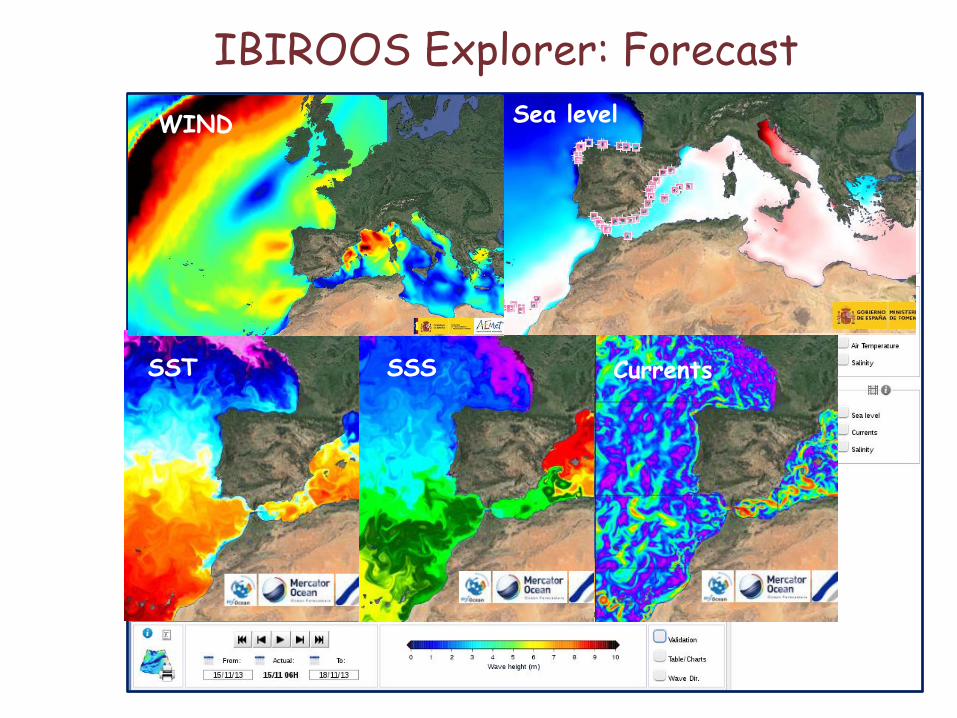
IBIROOS Explorer: Forecast
WAVES
SST SSS Currents
Sea levelWIND
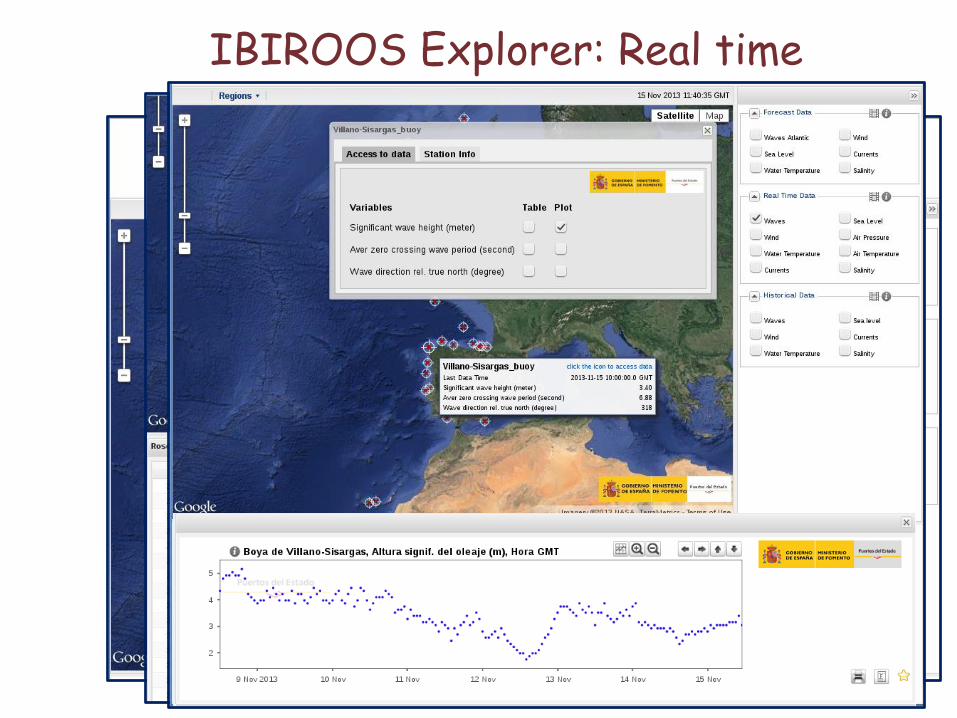
IBIROOS Explorer: Real time
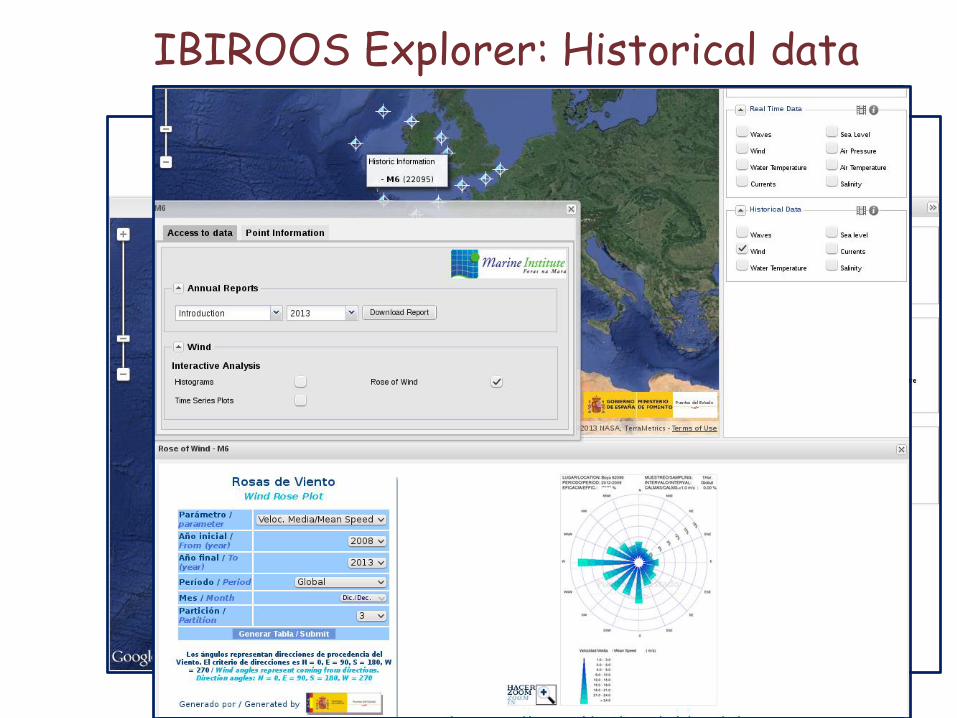
IBIROOS Explorer: Historical data
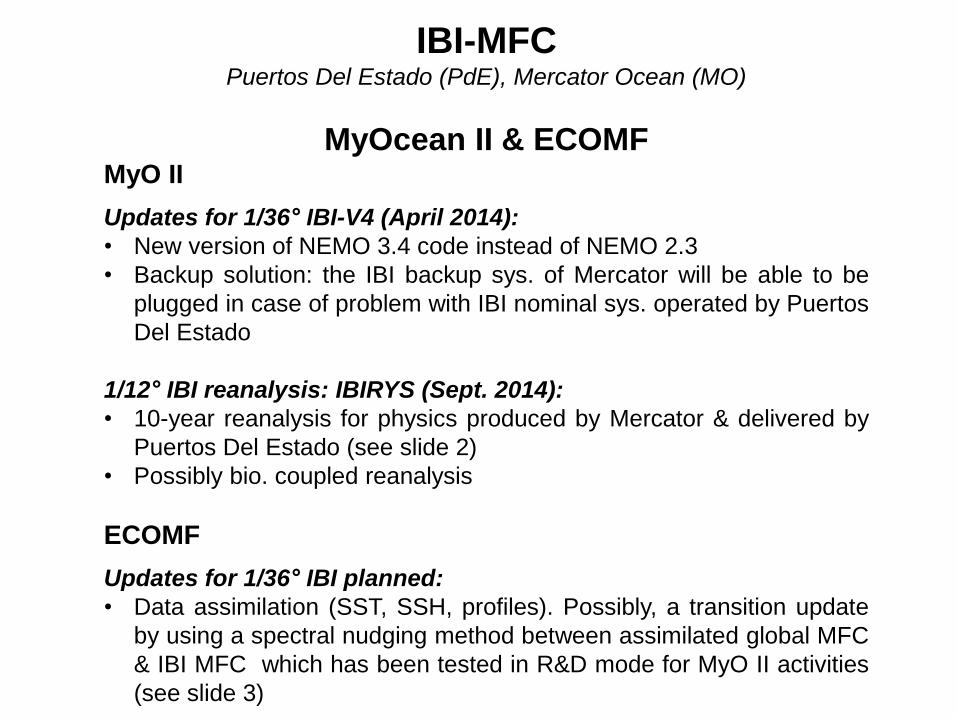
IBI-MFCPuertos Del Estado (PdE), Mercator Ocean (MO)
MyOcean II & ECOMF MyO II
Updates for 1/36° IBI-V4 (April 2014):
• New version of NEMO 3.4 code instead of NEMO 2.3
• Backup solution: the IBI backup sys. of Mercator will be able to be
plugged in case of problem with IBI nominal sys. operated by Puertos
Del Estado
1/12° IBI reanalysis: IBIRYS (Sept. 2014):
• 10-year reanalysis for physics produced by Mercator & delivered by
Puertos Del Estado (see slide 2)
• Possibly bio. coupled reanalysis
ECOMF
Updates for 1/36° IBI planned:
• Data assimilation (SST, SSH, profiles). Possibly, a transition update
by using a spectral nudging method between assimilated global MFC
& IBI MFC which has been tested in R&D mode for MyO II activities
(see slide 3)
ASSIMILATION
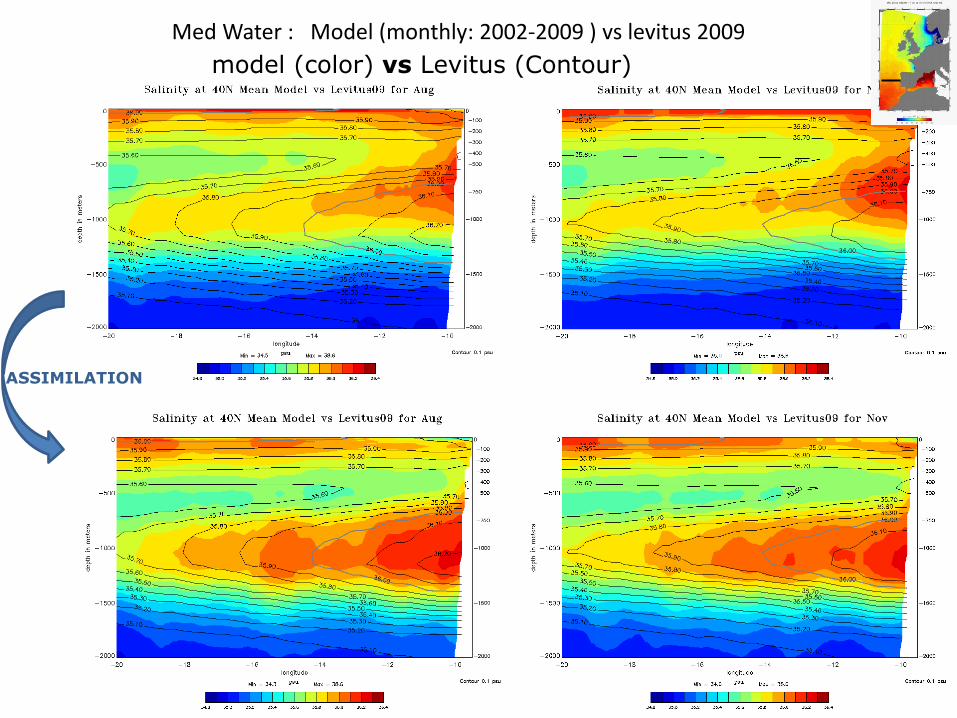
Med Water : Model (monthly: 2002-2009 ) vs levitus 2009
model (color) vs Levitus (Contour)
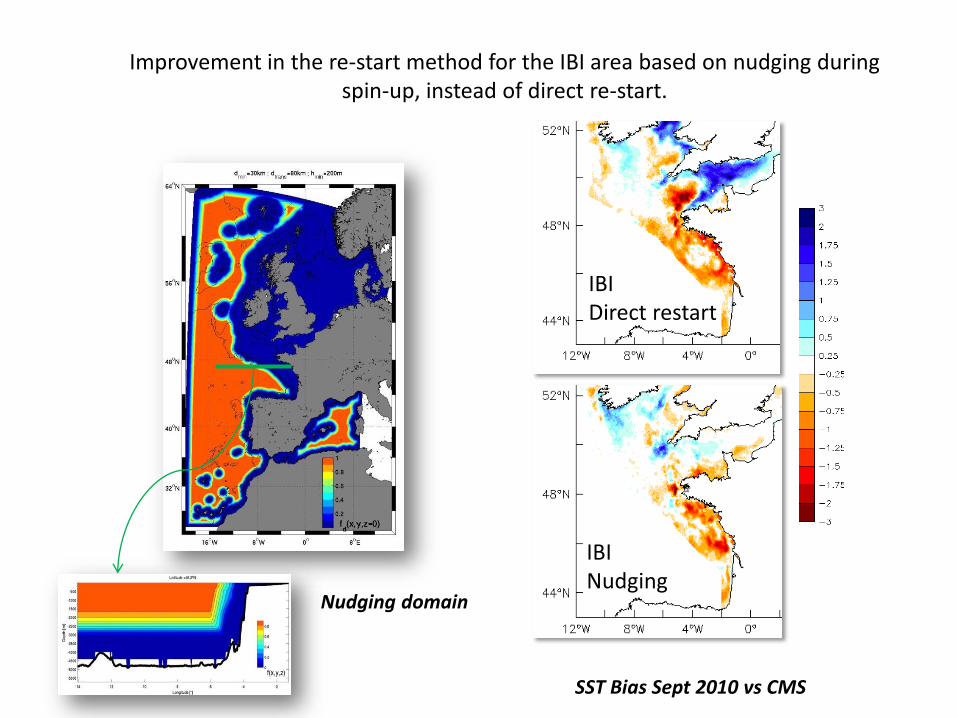
Improvement in the re-start method for the IBI area based on nudging duringspin-up, instead of direct re-start.
IBINudging
IBIDirect restart
SST Bias Sept 2010 vs CMS
Nudging domain
IBI-MFCPuertos Del Estado (PdE), Mercator Ocean (MO)
Link with coastal applicationsMyCoast
PdE (consortium) & MO (associated partner) are mainly involved in this
project in the WP4: « From Regional to Coastal Scale »
Improvement of the downscaling from IBI-MFC to coastal systems
French coastal MFC R&D projects involving MO:
• AMICO* belongs to « Programme GMES-MEDDE** Côtier »
Ensemblist downscaling in coastal models
Improvement in downscaling in coastal coupled phys./bio.
models
• Projet en Partenariat Renforcé ENIGME***
Comparison of several regional reanalysis in the area of the
Bay of Biscay (such as IBIRYS)
*AMICO : Action toward an integrated coastal operational modeling
**MEDDE : French Environment Ministery
*** ENIGME : Evolution of interannual dynamics in the Bay of Biscay & English Channel
IBI-MFCPuertos Del Estado (PdE), Mercator Ocean (MO)
Link with coastal applications
Promotion of IBI-MFC products for coastal users (motivated
by PdE )
• Marine GMES Spanish User Forum (Dec. 2012): a total of 22 pers.
from 11 institutions
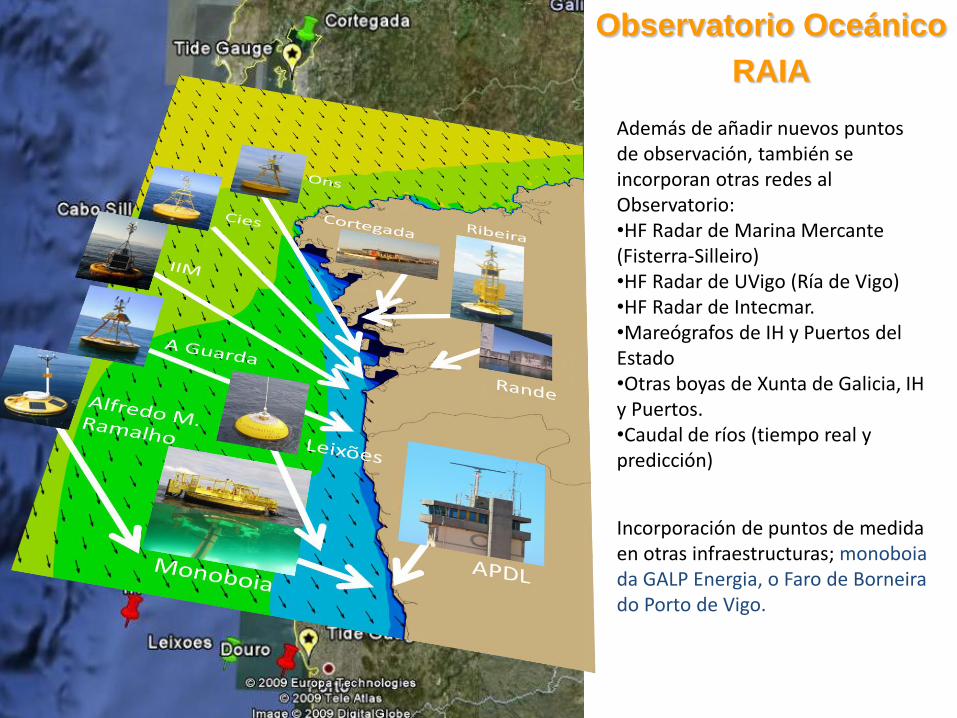
Observatorio Oceánico
RAIA
Además de añadir nuevos puntos de observación, también se incorporan otras redes al Observatorio:•HF Radar de Marina Mercante (Fisterra-Silleiro)•HF Radar de UVigo (Ría de Vigo)•HF Radar de Intecmar.•Mareógrafos de IH y Puertos del Estado•Otras boyas de Xunta de Galicia, IH y Puertos.•Caudal de ríos (tiempo real y predicción)
Incorporación de puntos de medidaen otras infraestructuras; monoboia da GALP Energia, o Faro de Borneira do Porto de Vigo.
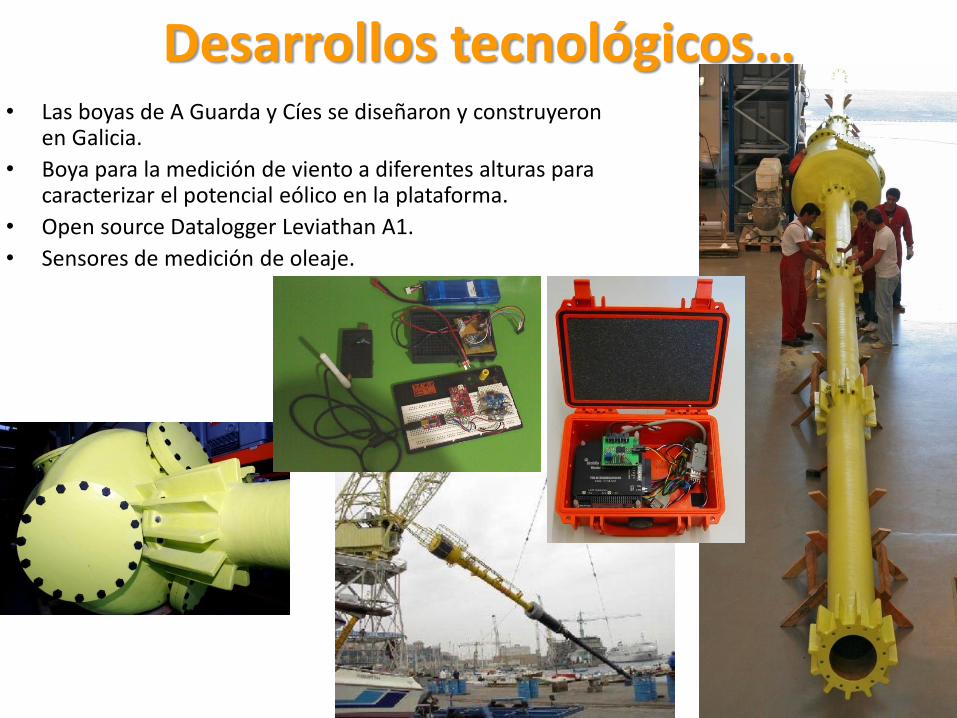
Desarrollos tecnológicos…• Las boyas de A Guarda y Cíes se diseñaron y construyeron
en Galicia.
• Boya para la medición de viento a diferentes alturas para caracterizar el potencial eólico en la plataforma.
• Open source Datalogger Leviathan A1.
• Sensores de medición de oleaje.
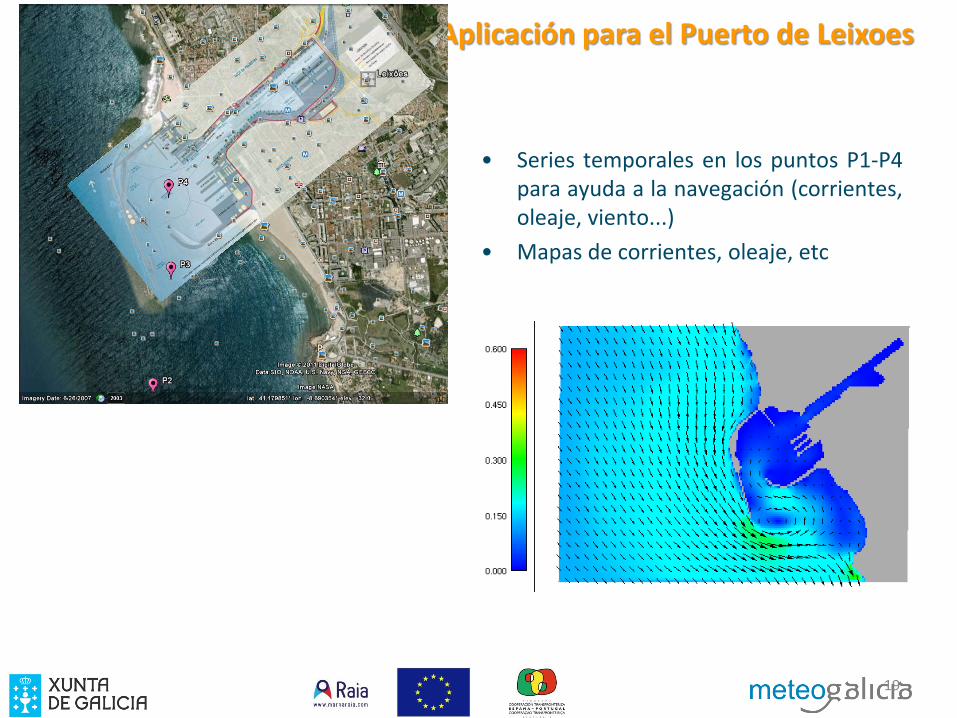
• Series temporales en los puntos P1-P4para ayuda a la navegación (corrientes,oleaje, viento...)
• Mapas de corrientes, oleaje, etc
Aplicación para el Puerto de Leixoes
19
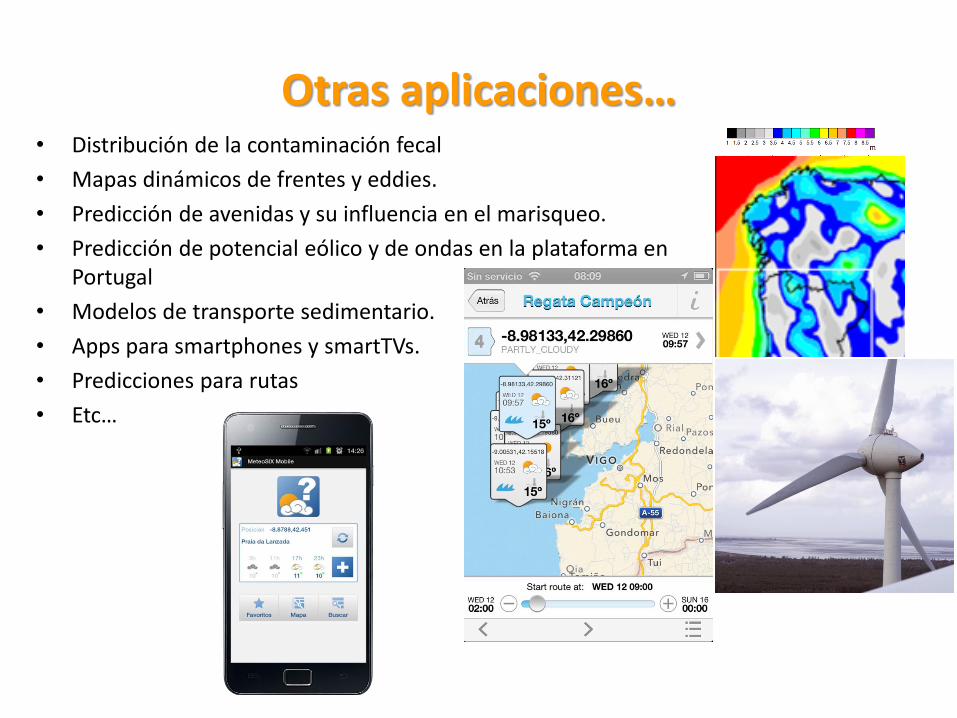
Otras aplicaciones…• Distribución de la contaminación fecal
• Mapas dinámicos de frentes y eddies.
• Predicción de avenidas y su influencia en el marisqueo.
• Predicción de potencial eólico y de ondas en la plataforma en Portugal
• Modelos de transporte sedimentario.
• Apps para smartphones y smartTVs.
• Predicciones para rutas
• Etc…
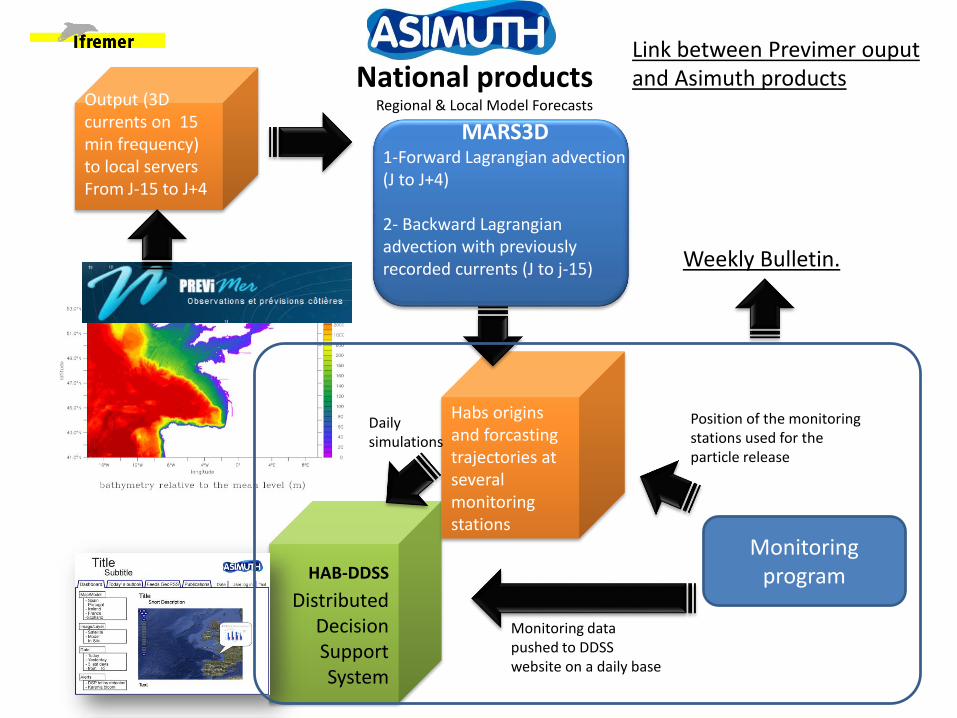
HAB-DDSS
Distributed Decision Support System
Output (3D currents on 15 min frequency) to local serversFrom J-15 to J+4
National productsRegional & Local Model Forecasts
MARS3D 1-Forward Lagrangian advection (J to J+4)
2- Backward Lagrangianadvection with previously recorded currents (J to j-15)
Habs origins and forcastingtrajectories at several monitoring stations
Monitoring program
Link between Previmer ouputand Asimuth products
Monitoring data pushed to DDSS website on a daily base
Position of the monitoring stations used for the particle release
Daily simulations
Weekly Bulletin.
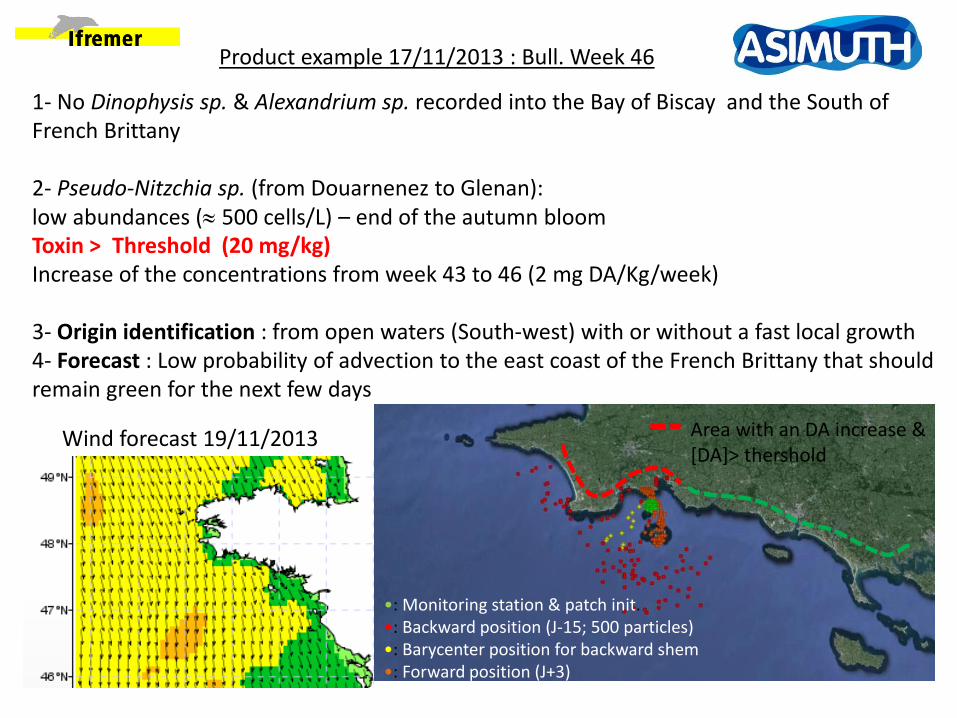
Product example 17/11/2013 : Bull. Week 46
1- No Dinophysis sp. & Alexandrium sp. recorded into the Bay of Biscay and the South of French Brittany
2- Pseudo-Nitzchia sp. (from Douarnenez to Glenan): low abundances ( 500 cells/L) – end of the autumn bloomToxin > Threshold (20 mg/kg) Increase of the concentrations from week 43 to 46 (2 mg DA/Kg/week)
3- Origin identification : from open waters (South-west) with or without a fast local growth4- Forecast : Low probability of advection to the east coast of the French Brittany that should remain green for the next few days
•: Monitoring station & patch init.•: Backward position (J-15; 500 particles)•: Barycenter position for backward shem•: Forward position (J+3)
Area with an DA increase & [DA]> thershold
Wind forecast 19/11/2013

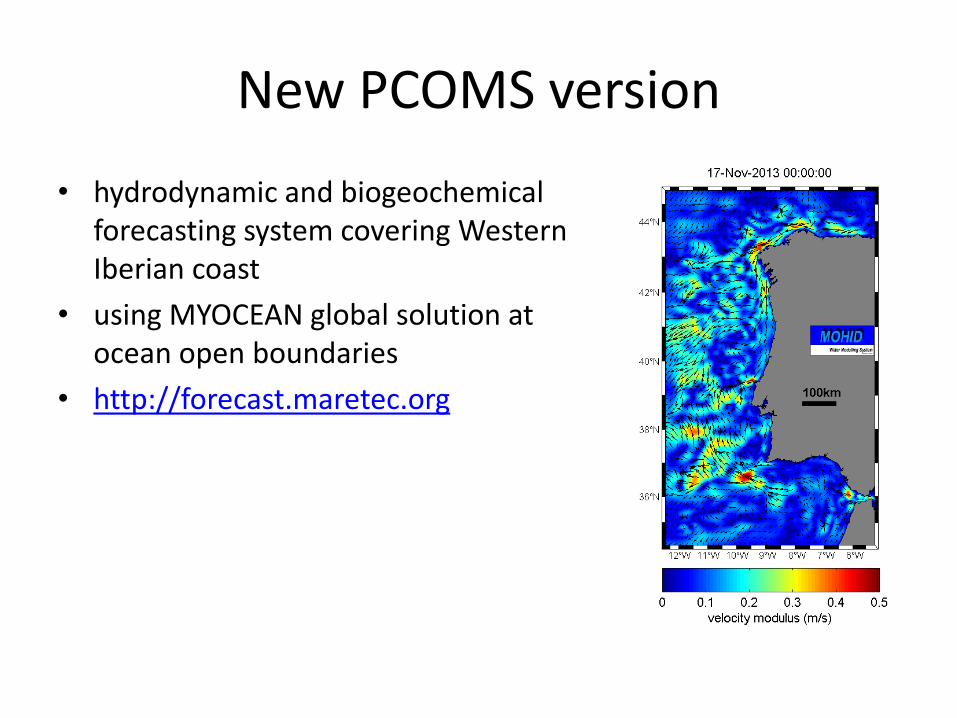
New PCOMS version
• hydrodynamic and biogeochemical forecasting system covering Western Iberian coast
• using MYOCEAN global solution at ocean open boundaries
• http://forecast.maretec.org
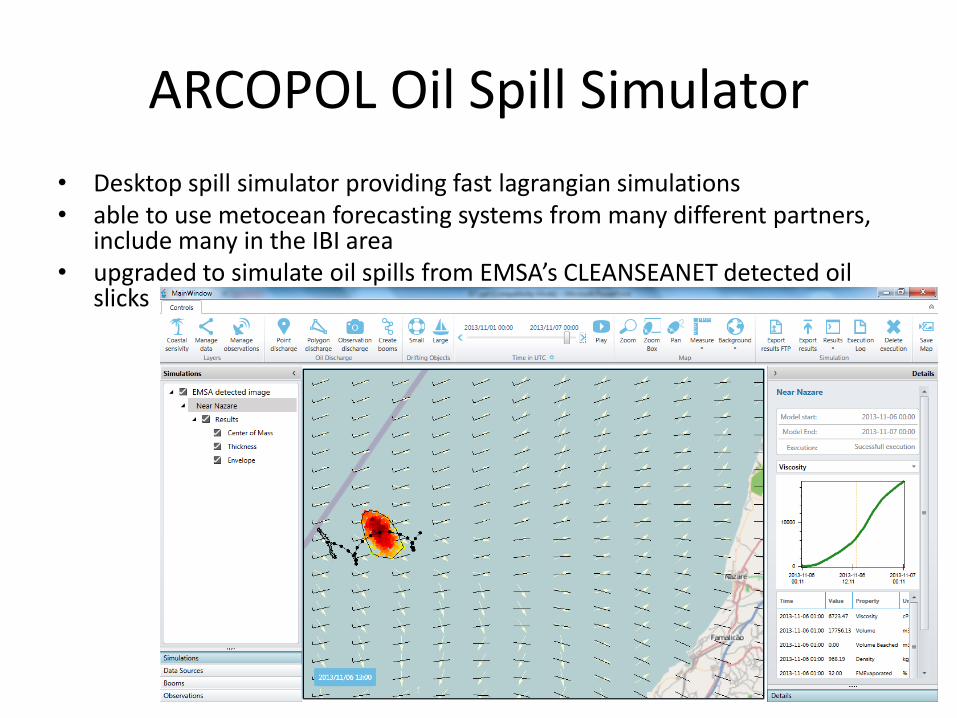
ARCOPOL Oil Spill Simulator
• Desktop spill simulator providing fast lagrangian simulations• able to use metocean forecasting systems from many different partners,
include many in the IBI area• upgraded to simulate oil spills from EMSA’s CLEANSEANET detected oil
slicks
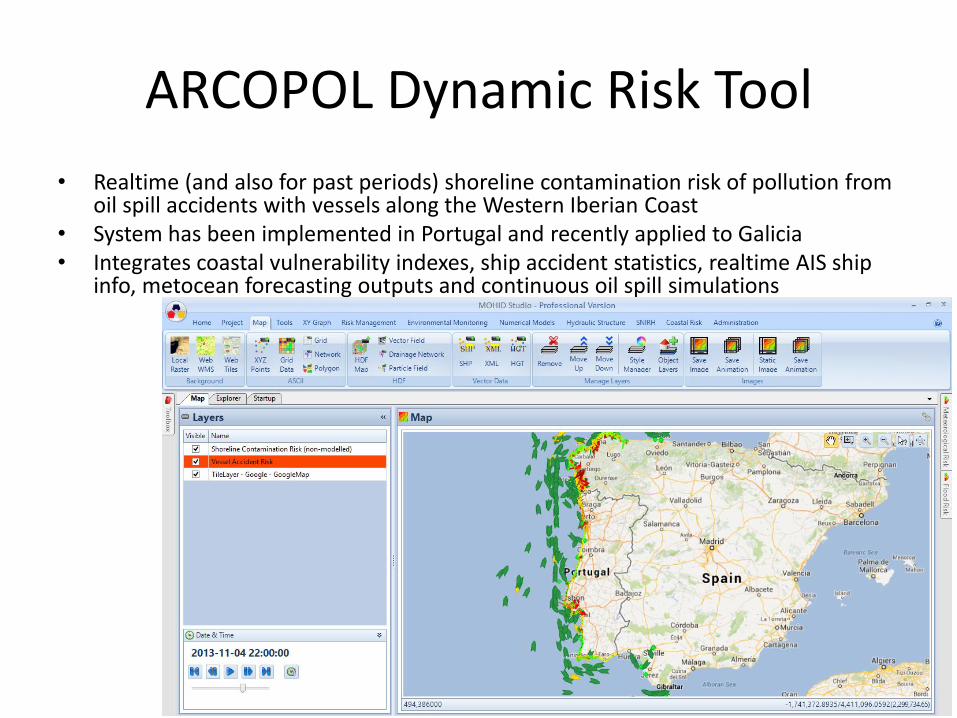
ARCOPOL Dynamic Risk Tool
• Realtime (and also for past periods) shoreline contamination risk of pollution from oil spill accidents with vessels along the Western Iberian Coast
• System has been implemented in Portugal and recently applied to Galicia• Integrates coastal vulnerability indexes, ship accident statistics, realtime AIS ship
info, metocean forecasting outputs and continuous oil spill simulations
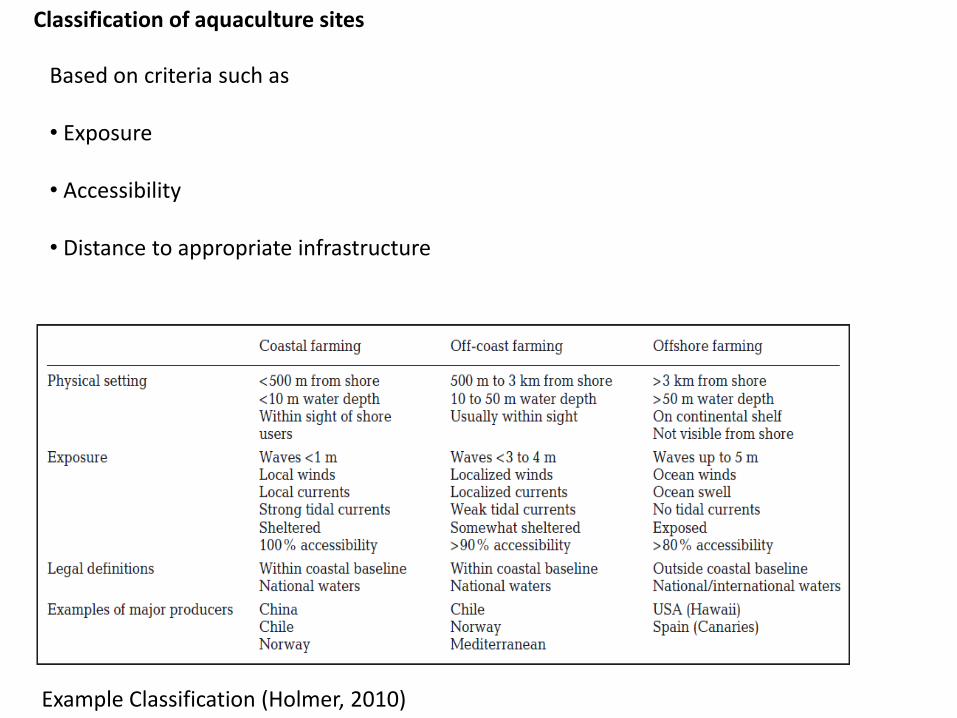
Classification of aquaculture sites
Example Classification (Holmer, 2010)
Based on criteria such as
• Exposure
• Accessibility
• Distance to appropriate infrastructure
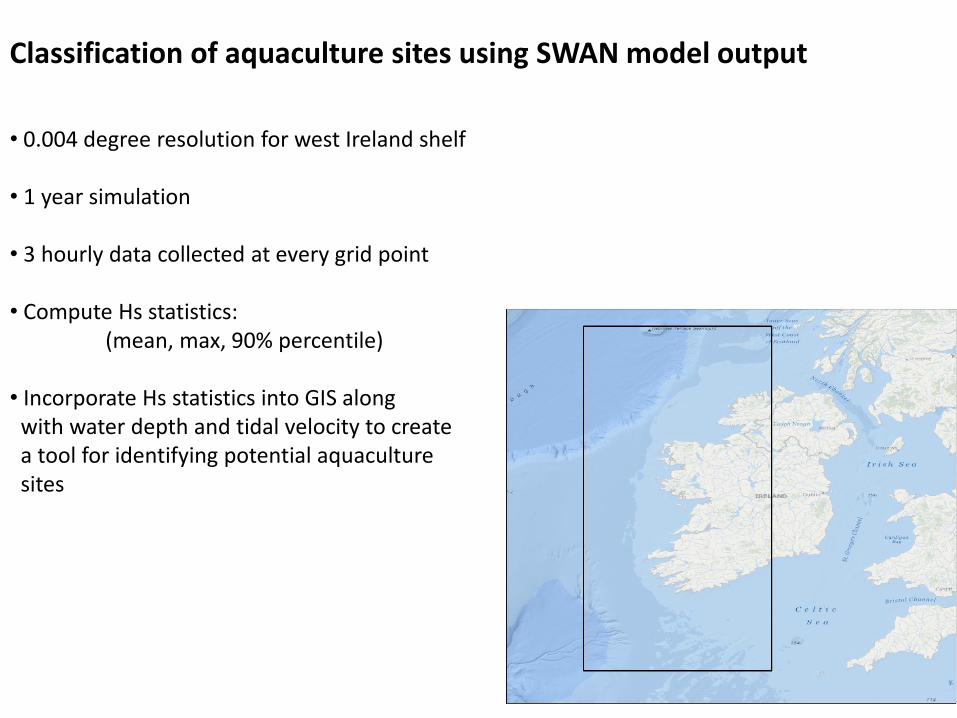
Classification of aquaculture sites using SWAN model output
• 0.004 degree resolution for west Ireland shelf
• 1 year simulation
• 3 hourly data collected at every grid point
• Compute Hs statistics:(mean, max, 90% percentile)
• Incorporate Hs statistics into GIS alongwith water depth and tidal velocity to createa tool for identifying potential aquaculturesites
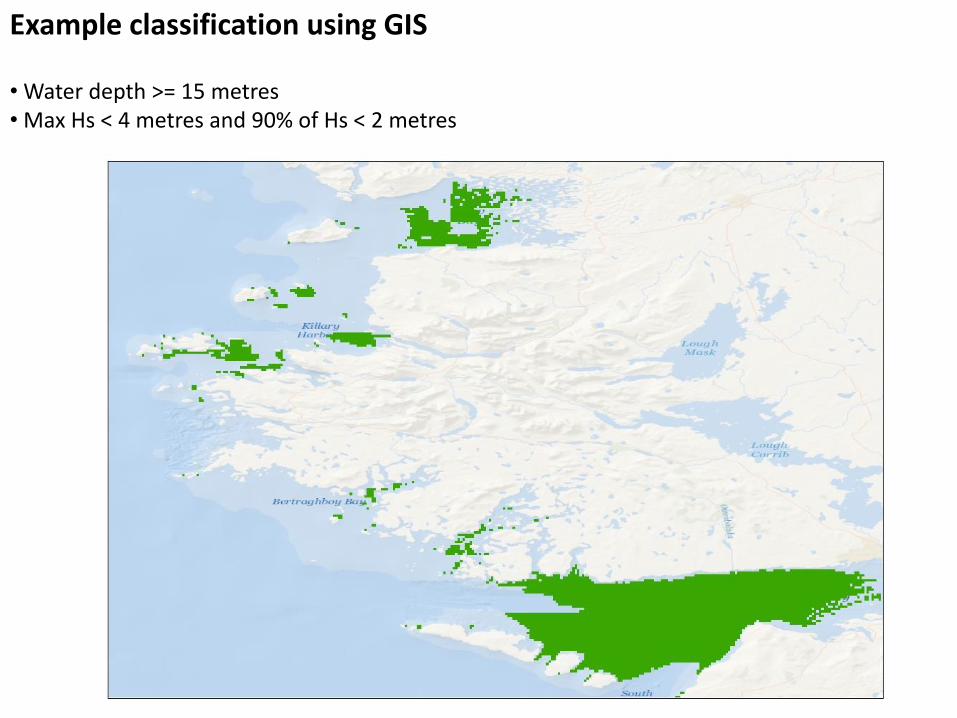
Example classification using GIS
• Water depth >= 15 metres• Max Hs < 4 metres and 90% of Hs < 2 metres
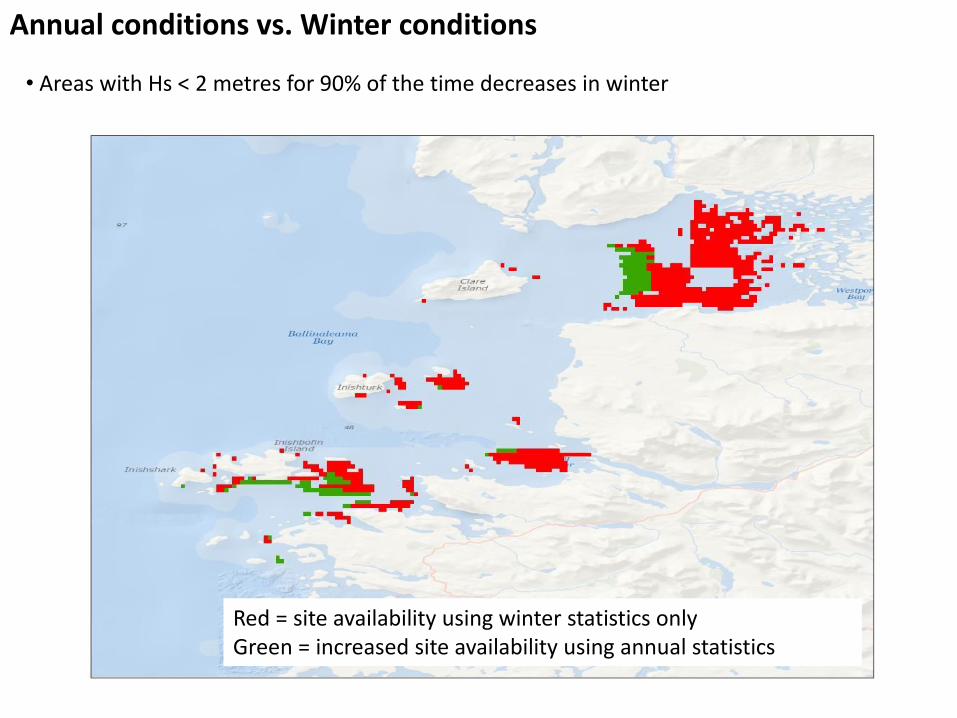
Annual conditions vs. Winter conditions
• Areas with Hs < 2 metres for 90% of the time decreases in winter
Red = site availability using winter statistics onlyGreen = increased site availability using annual statistics
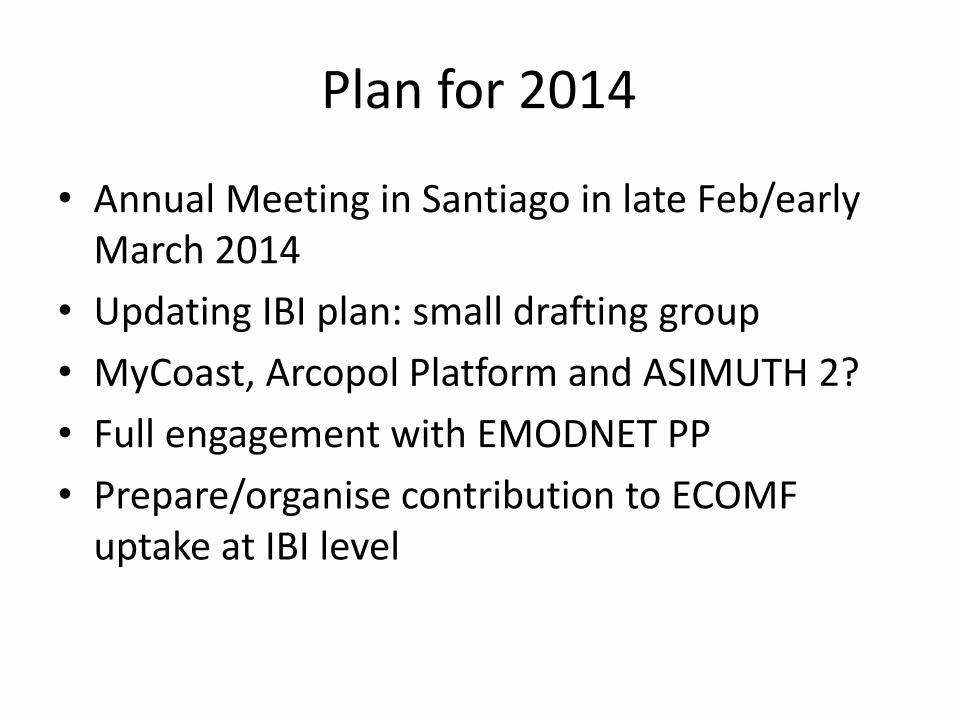
Plan for 2014
• Annual Meeting in Santiago in late Feb/early March 2014
• Updating IBI plan: small drafting group
• MyCoast, Arcopol Platform and ASIMUTH 2?
• Full engagement with EMODNET PP
• Prepare/organise contribution to ECOMF uptake at IBI level


![Tatiana Tender - final report of BELSPO post-doctoral project ] · 2017-09-05 · OleksiyGumovsky – Final report of BELSPO post-doctoral project “Afrotropical genera of Entedoninae](https://img.pdfslide.us/doc/110x75/5f4c5f935fd7fd315c0edf56/tatiana-tender-final-report-of-belspo-post-doctoral-project-2017-09-05-oleksiygumovsky.jpg)