Embed Size (px)
Citation preview
Sales Update
IATA Maintenance Cost ConferenceBangkok, September 14th 2016
The Impact of Increased OEM Influence on Cost and Residual Value in the Engine Aftermarket
Richard Hough – EVP Technical
Engine Lease Finance Corporation
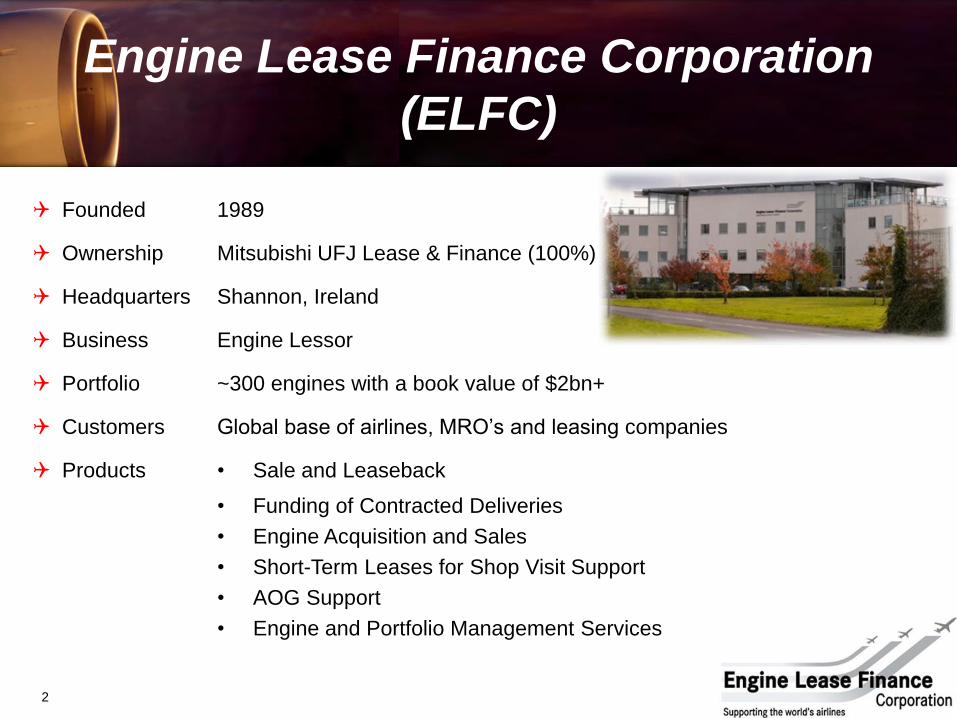
Engine Lease Finance Corporation
(ELFC)
Founded
Ownership
Headquarters
Business
Portfolio
Customers
Products
1989
Mitsubishi UFJ Lease & Finance (100%)
Shannon, Ireland
Engine Lessor
~300 engines with a book value of $2bn+
Global base of airlines, MRO’s and leasing companies
• Sale and Leaseback
• Funding of Contracted Deliveries
• Engine Acquisition and Sales
• Short-Term Leases for Shop Visit Support
• AOG Support
• Engine and Portfolio Management Services
2
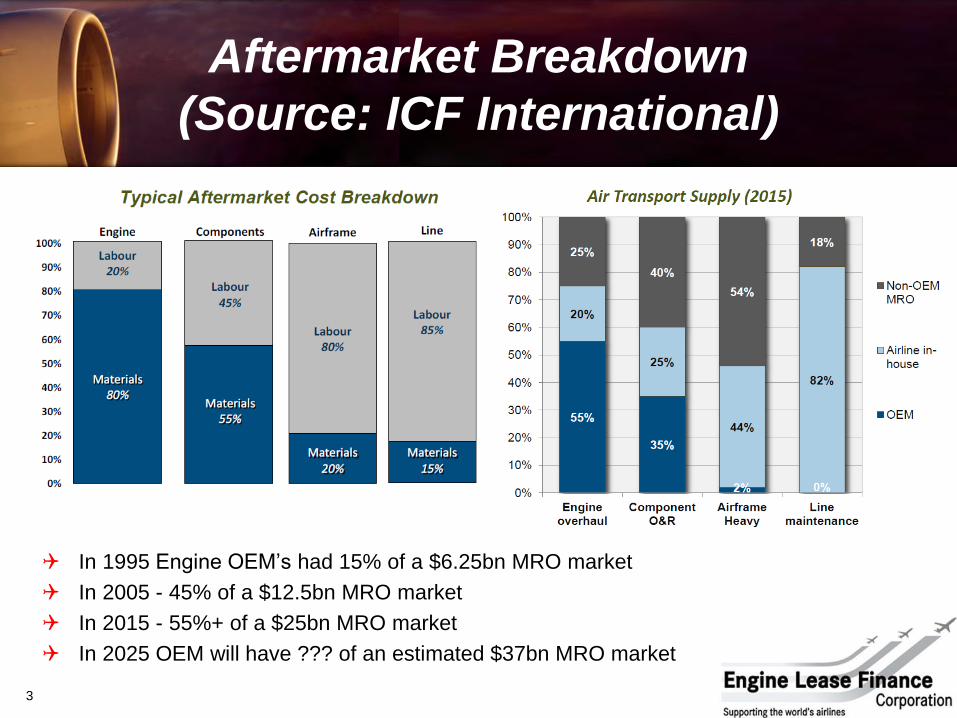
In 1995 Engine OEM’s had 15% of a $6.25bn MRO market
In 2005 - 45% of a $12.5bn MRO market
In 2015 - 55%+ of a $25bn MRO market
In 2025 OEM will have ??? of an estimated $37bn MRO market
3
Aftermarket Breakdown
(Source: ICF International)
4
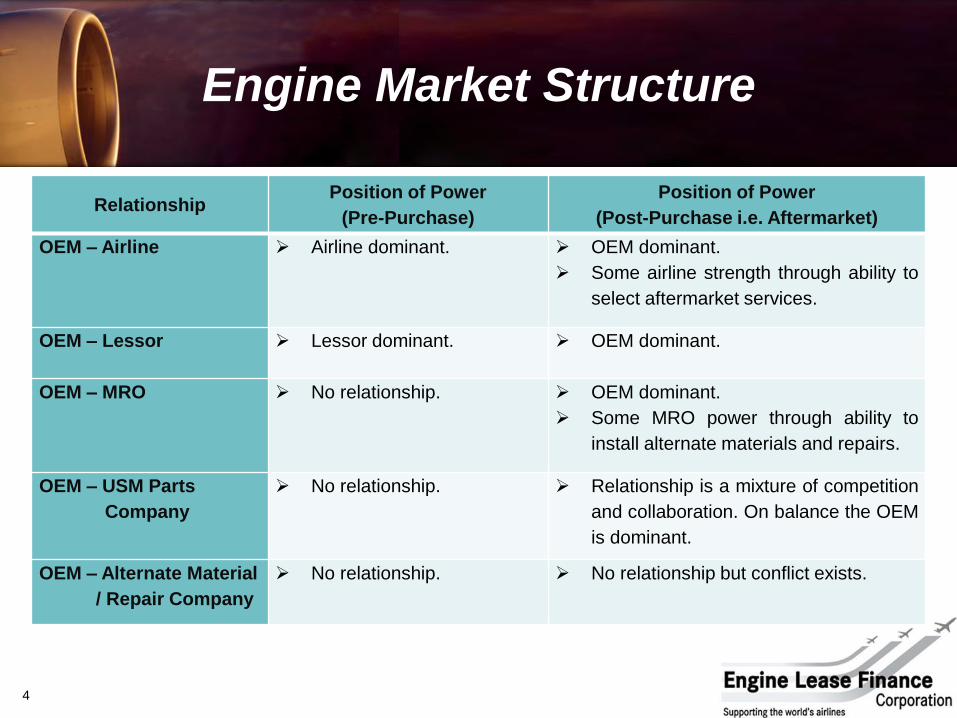
RelationshipPosition of Power
(Pre-Purchase)
Position of Power
(Post-Purchase i.e. Aftermarket)
OEM – Airline Airline dominant. OEM dominant.
Some airline strength through ability to
select aftermarket services.
OEM – Lessor Lessor dominant. OEM dominant.
OEM – MRO No relationship. OEM dominant.
Some MRO power through ability to
install alternate materials and repairs.
OEM – USM Parts
Company
No relationship. Relationship is a mixture of competition
and collaboration. On balance the OEM
is dominant.
OEM – Alternate Material
/ Repair Company
No relationship. No relationship but conflict exists.
Engine Market Structure
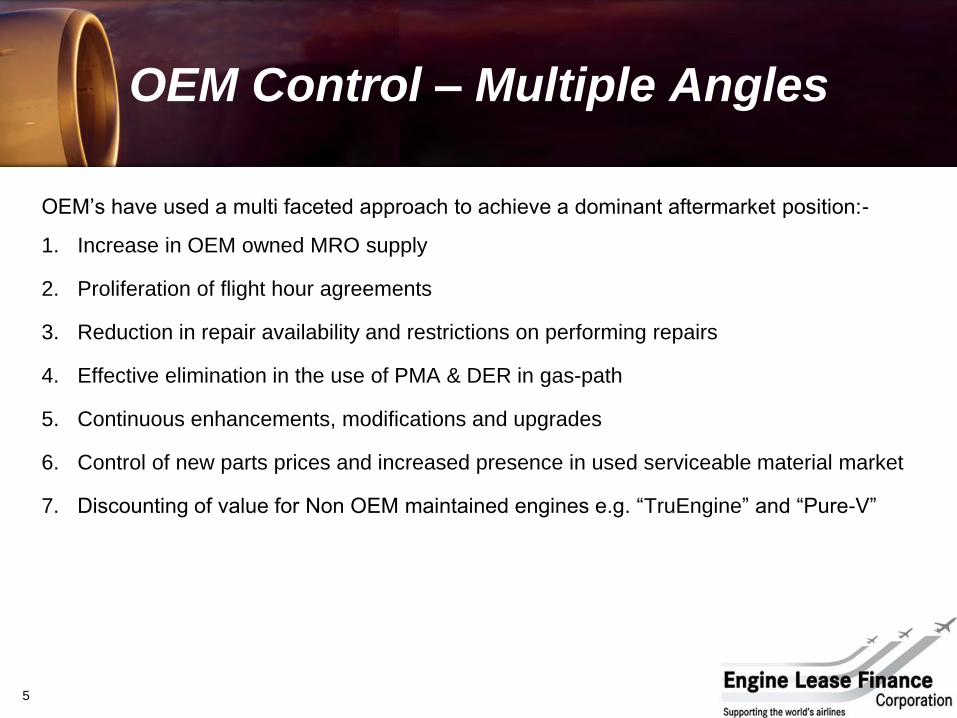
OEM’s have used a multi faceted approach to achieve a dominant aftermarket position:-
1. Increase in OEM owned MRO supply
2. Proliferation of flight hour agreements
3. Reduction in repair availability and restrictions on performing repairs
4. Effective elimination in the use of PMA & DER in gas-path
5. Continuous enhancements, modifications and upgrades
6. Control of new parts prices and increased presence in used serviceable material market
7. Discounting of value for Non OEM maintained engines e.g. “TruEngine” and “Pure-V”
5
OEM Control – Multiple Angles
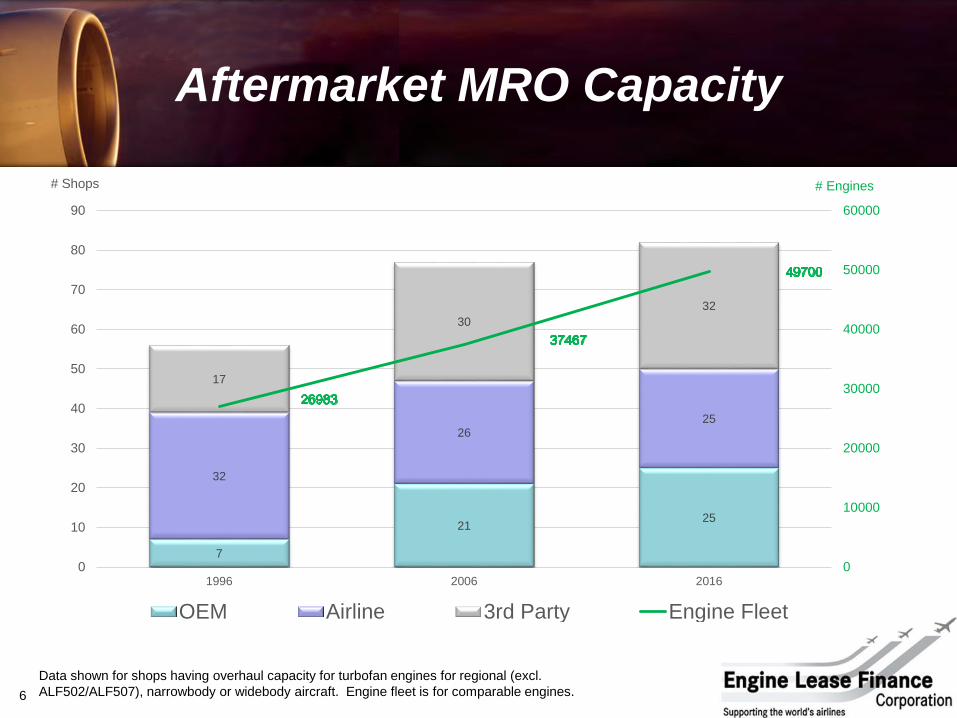
7
2125
32
2625
17
30
32
0
10000
20000
30000
40000
50000
60000
0
10
20
30
40
50
60
70
80
90
1996 2006 2016
# Engines# Shops
OEM Airline 3rd Party Engine Fleet
Data shown for shops having overhaul capacity for turbofan engines for regional (excl.
ALF502/ALF507), narrowbody or widebody aircraft. Engine fleet is for comparable engines. 6
Aftermarket MRO Capacity
7
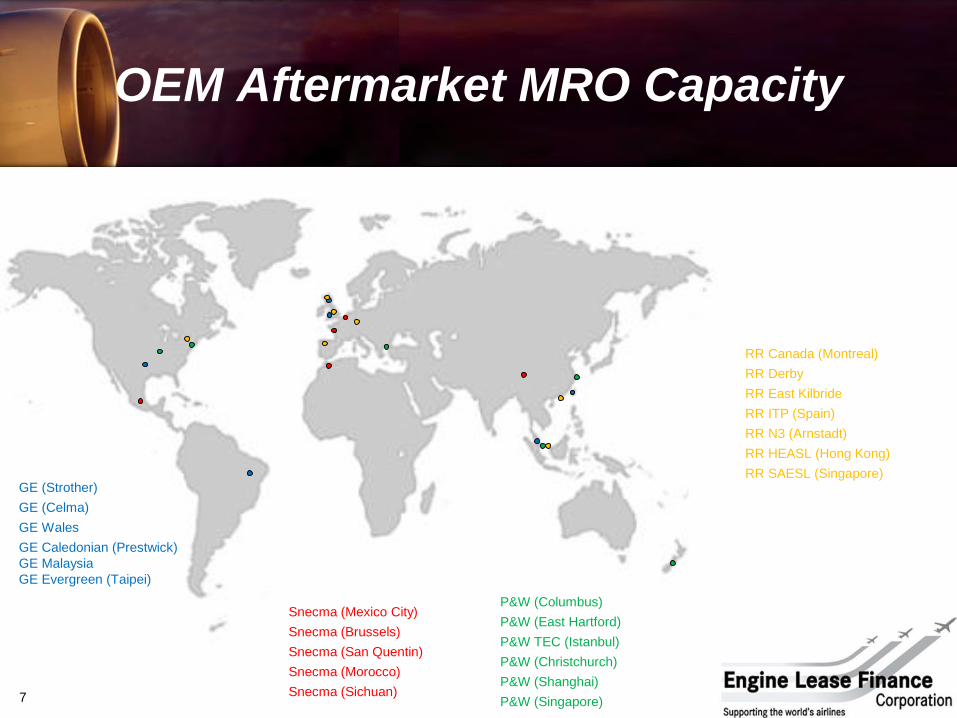
OEM Aftermarket MRO Capacity
GE (Strother)
GE (Celma)
GE Wales
GE Caledonian (Prestwick)
GE Malaysia
GE Evergreen (Taipei)
P&W (Columbus)
P&W (East Hartford)
P&W TEC (Istanbul)
P&W (Christchurch)
P&W (Shanghai)
P&W (Singapore)
Snecma (Mexico City)
Snecma (Brussels)
Snecma (San Quentin)
Snecma (Morocco)
Snecma (Sichuan)
RR Canada (Montreal)
RR Derby
RR East Kilbride
RR ITP (Spain)
RR N3 (Arnstadt)
RR HEASL (Hong Kong)
RR SAESL (Singapore)
• “Over 90% of Rolls-Royce large engine fleet is covered by our TotalCare service
agreements.” – RR.plc 2015 Annual Report
• “Today nearly 60 percent of the installed V2500 engine fleet and over 80 percent of
future deliveries are backed by a V-Services agreement.” – IAE Website
• Today, with a mature and large maintenance network for the CFM56, these contracts
represent less than half of the total. We expect strongly more than half for Leap.” –
CFMI President 2015 Paris Airshow
• “Pratt & Whitney expects more migration to long-term aftermarket support contracts
with OEMs. The OEM claims 50% market penetration on such agreements covering
the PW2000, PW4000 and V2500” - Vice President Aftermarket Operations (Inside
MRO – May 2014).
8
Proliferation of Flight Hour
Maintenance Agreements
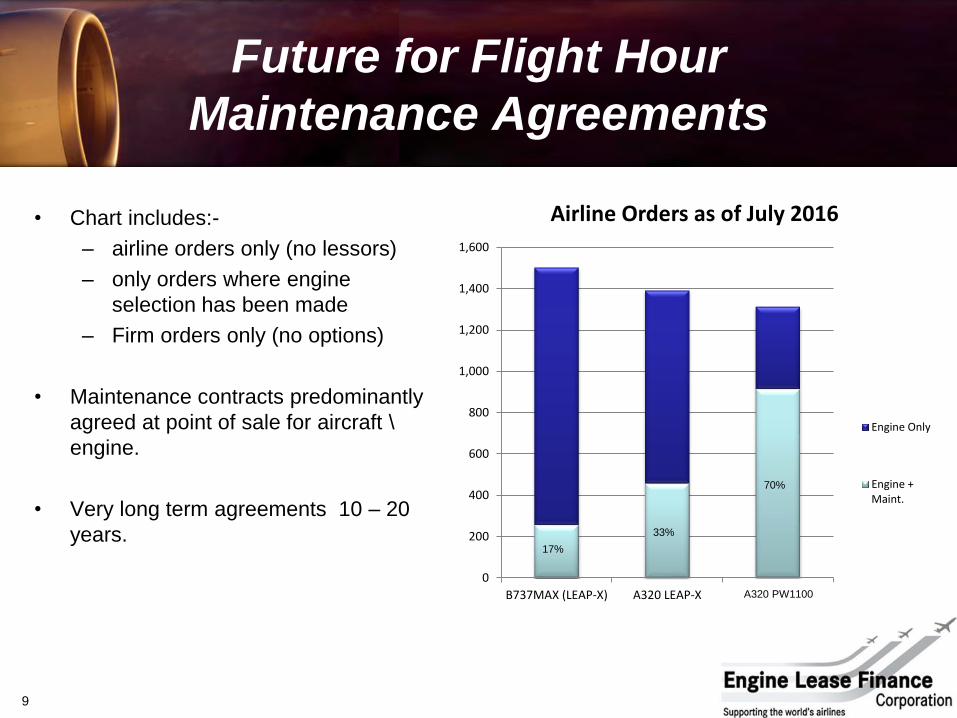
• Chart includes:-
– airline orders only (no lessors)
– only orders where engine
selection has been made
– Firm orders only (no options)
• Maintenance contracts predominantly
agreed at point of sale for aircraft \
engine.
• Very long term agreements 10 – 20
years.
9
Future for Flight Hour
Maintenance Agreements
0
200
400
600
800
1,000
1,200
1,400
1,600
B737MAX (LEAP-X) A320 LEAP-X A320 PW1000
Airline Orders as of July 2016
Engine Only
Engine +Maint.
17%
33%
70%
A320 PW1100
1. Restrictions on Intellectual Property
• Information contained in maintenance and repair manuals has decreased
=> more difficult for non OEM MROs to repair parts without advice from the OEMs.
• Repairs developed by the OEMs are being provided to MRO’s who sign up for licence
agreements……. At a cost !
2. Limitations on Repairability
• Highly complex airfoils are less likely to be repairable economically
• Are new materials e.g. Ceramic Matrix Composites and new manufacturing
processes e.g. additive manufacturing open to repair ?
10
Repair Restrictions & Limitations
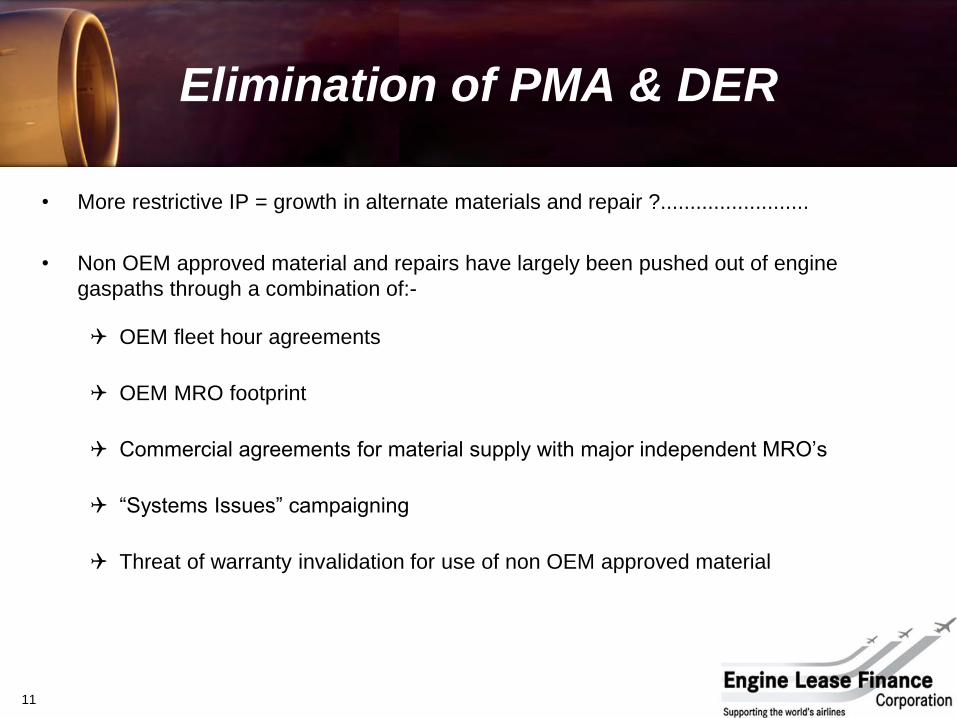
• More restrictive IP = growth in alternate materials and repair ?.........................
• Non OEM approved material and repairs have largely been pushed out of engine
gaspaths through a combination of:-
OEM fleet hour agreements
OEM MRO footprint
Commercial agreements for material supply with major independent MRO’s
“Systems Issues” campaigning
Threat of warranty invalidation for use of non OEM approved material
11
Elimination of PMA & DER
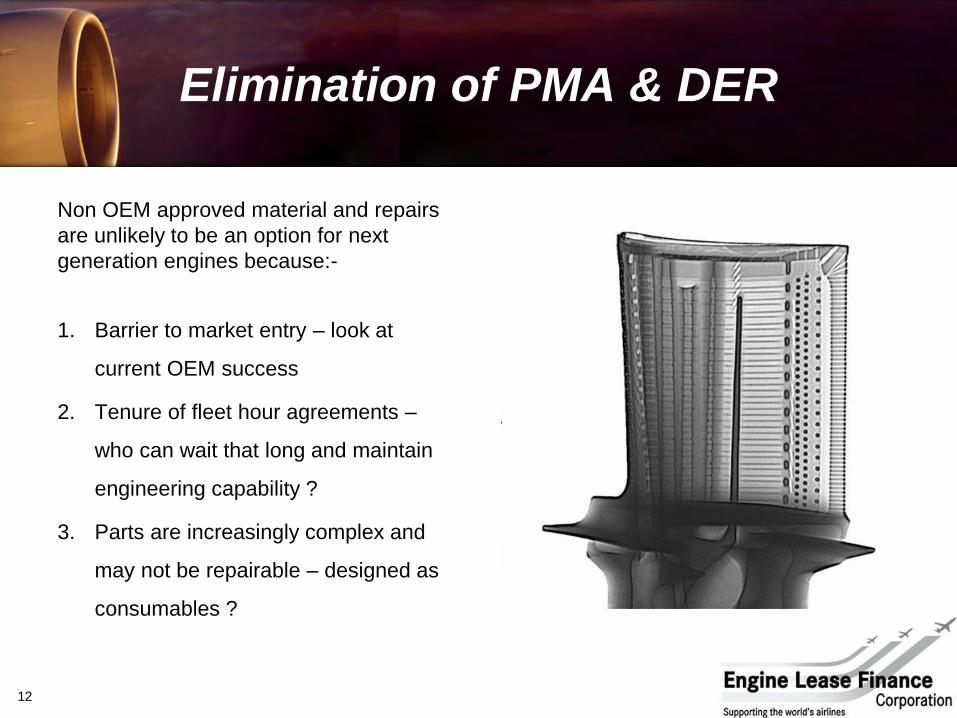
Non OEM approved material and repairs
are unlikely to be an option for next
generation engines because:-
1. Barrier to market entry – look at
current OEM success
2. Tenure of fleet hour agreements –
who can wait that long and maintain
engineering capability ?
3. Parts are increasingly complex and
may not be repairable – designed as
consumables ?
12
Elimination of PMA & DER
• How many engine models have had significant mid life performance upgrades ?
– CFM56 /3 and E
– V2500 S1 and S2
– PW4000-100 “Advantage”
– Trent 700EP and EP2
– LEAP Upgrade to Low Px Compressor in 2017
– PW1000-JM Improvements to blade profiling & contours by 2019
• Primary objective of these upgrades is fuel burn, but all come at a maintenance cost
due to hardware replacement and workscope enhancement
• Engine models are being stratified into sub models each with distinctive hardware
differences
– Reduces size of market for repairs
– Natural barrier to entry for repair development
13
Performance Upgrades
and Enhancements
14
New Material
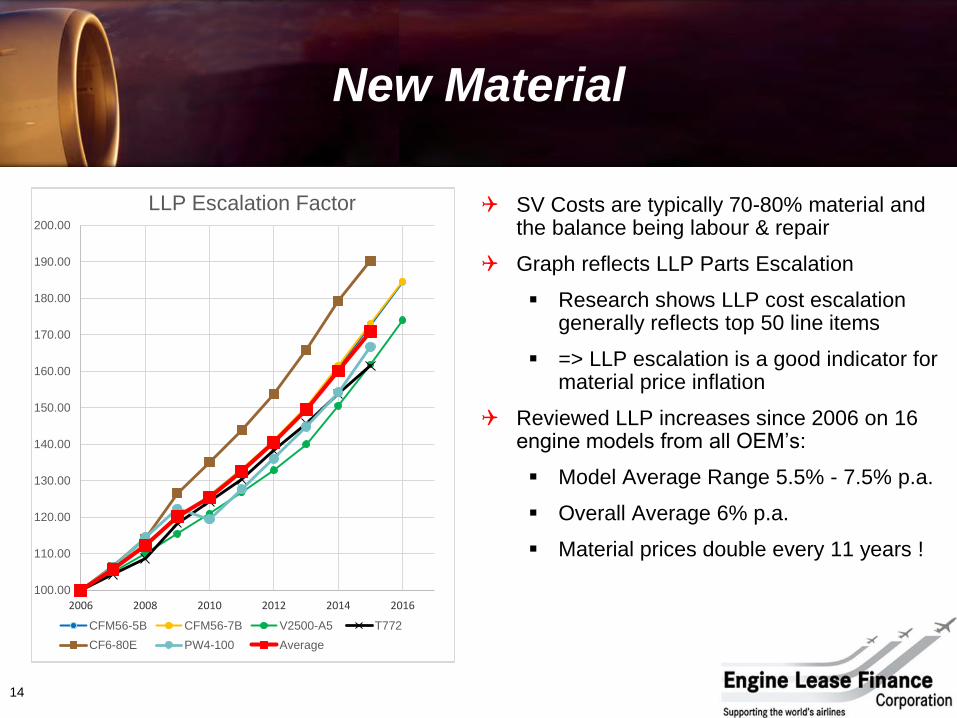
SV Costs are typically 70-80% material and the balance being labour & repair
Graph reflects LLP Parts Escalation
Research shows LLP cost escalation generally reflects top 50 line items
=> LLP escalation is a good indicator for material price inflation
Reviewed LLP increases since 2006 on 16 engine models from all OEM’s:
Model Average Range 5.5% - 7.5% p.a.
Overall Average 6% p.a.
Material prices double every 11 years !
100.00
120.00
140.00
160.00
180.00
200.00
220.00
240.00
260.00
280.00
2000 2002 2004 2006 2008 2010 2012 2014 2016
LLP Escalation Factor
CFM56-5B CFM56-7B V2500-A5
100.00
110.00
120.00
130.00
140.00
150.00
160.00
170.00
180.00
190.00
2006 2008 2010 2012 2014 2016
LLP Escalation Factor
CFM56-5B CFM56-7B V2500-A5
100.00
110.00
120.00
130.00
140.00
150.00
160.00
170.00
180.00
190.00
200.00
2006 2008 2010 2012 2014 2016
LLP Escalation Factor
CFM56-5B CFM56-7B V2500-A5
T772 CF6-80E PW4-100
100.00
110.00
120.00
130.00
140.00
150.00
160.00
170.00
180.00
190.00
200.00
2006 2008 2010 2012 2014 2016
LLP Escalation Factor
CFM56-5B CFM56-7B V2500-A5 T772
CF6-80E PW4-100 Average
• Broad market of 70-80 players but OEM
entities \ divisions are now major players
• Aligned with OEM shops as natural
customers
• Have ability to determine market price
and paperwork requirements
• Strong market presence combined with
paperwork demand requirements drive a
lot of used material into scrap
Surplus Materials Management
Organisation
GE Aviation Materials LP
15
Used Material
OEM market position drives previously usable material towards scrap
• Branding such as CFMI & GE’s TRUEngine™ and IAE’s Pure-V™ seek to create value
distinction between OEM v non-OEM maintenance
– Enticements include “enhanced” warranty and customer support
– Self Declaration but no OEM liability for errors
• Management of “Critical Influencing Parts” – much more targeted anti PMA\DER attack
– Focuses on Life Limited Parts
– Increased trace paperwork - SB’s issued with stated requirements
– Applied retrospectively back to birth
• Very aggressive tactic to eliminate the use of significant PMA\DER
• Rules created by the OEM and have changed regularly
• Significant mis-information and spin regarding market demand
16
Discounting the Value of
Non OEM maintained engines
17
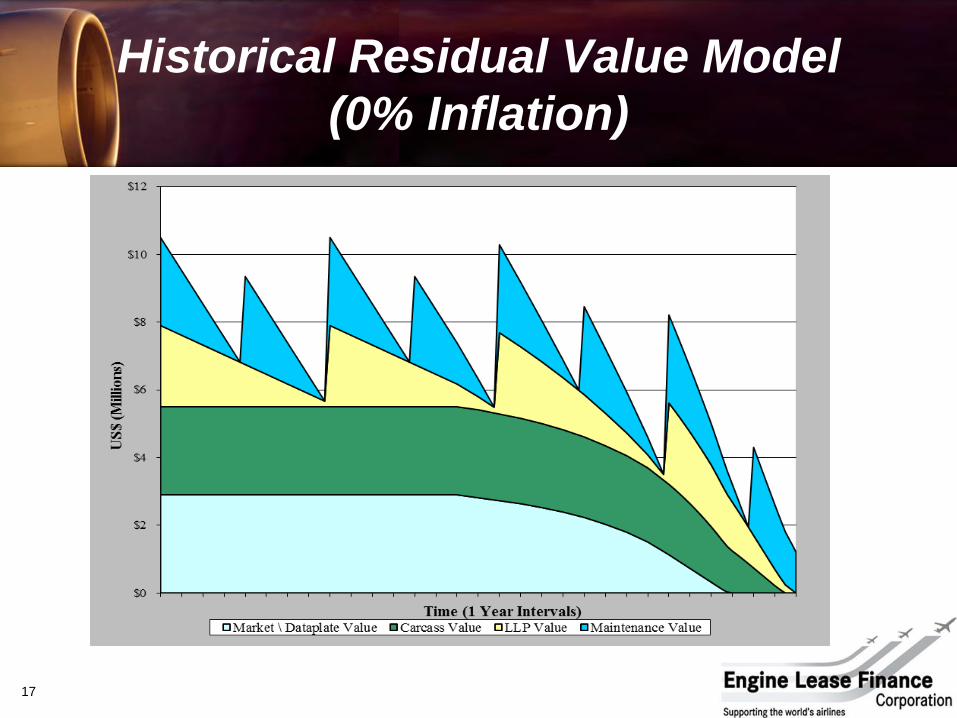
Historical Residual Value Model
(0% Inflation)
How the OEM has significant influence over the cost of ownership:-
Controlling the price of replacement spare parts (OEM is the sole reseller)
Increasing monopoly on the MRO aftermarket (FHA’s and facility network)
Actively trying to eliminate the availability of non OEM approved parts
Actively trying to control the repairs that can be developed
Seeking to dictate the trace paperwork required for used serviceable material
(beyond regulatory requirements)
Seeking to dominate the availability of surplus used serviceable material
18
Summary
OEM Influence on Cost
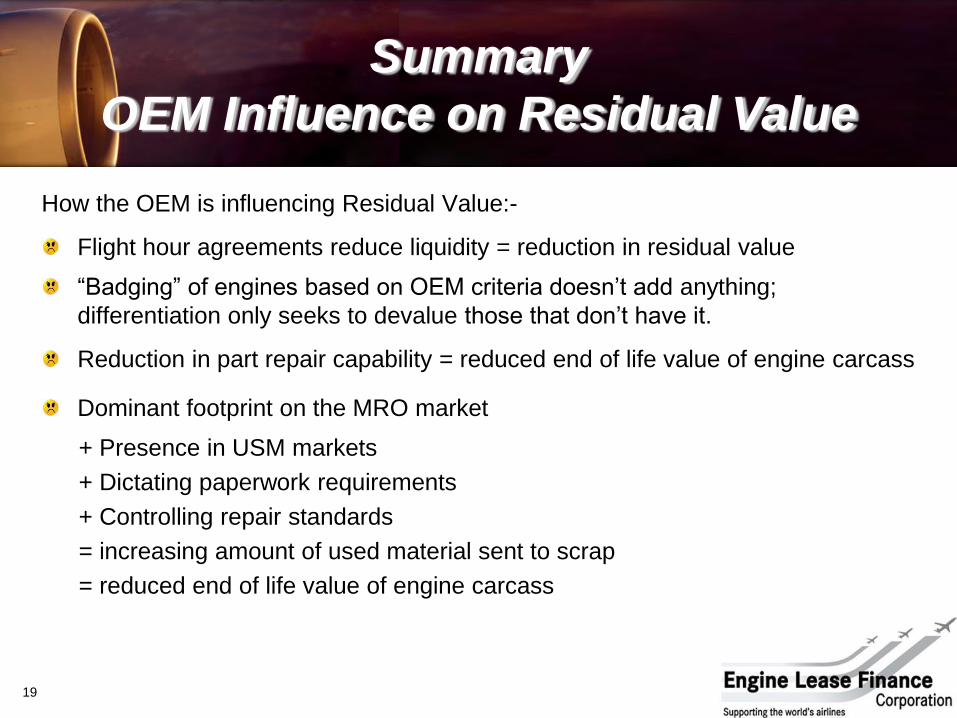
How the OEM is influencing Residual Value:-
Flight hour agreements reduce liquidity = reduction in residual value
“Badging” of engines based on OEM criteria doesn’t add anything;
differentiation only seeks to devalue those that don’t have it.
Reduction in part repair capability = reduced end of life value of engine carcass
Dominant footprint on the MRO market
+ Presence in USM markets
+ Dictating paperwork requirements
+ Controlling repair standards
= increasing amount of used material sent to scrap
= reduced end of life value of engine carcass
19
Summary
OEM Influence on Residual Value
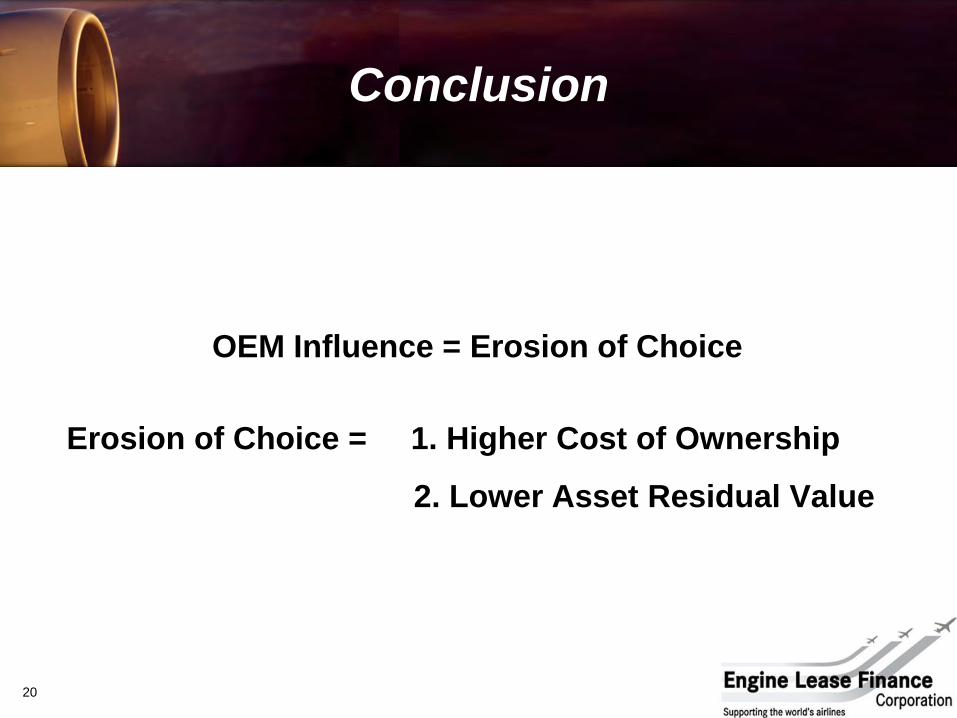
OEM Influence = Erosion of Choice
Erosion of Choice = 1. Higher Cost of Ownership
2. Lower Asset Residual Value
20
Conclusion
Thank you for your attention.
Questions ?
21
ENGINE LEASE FINANCE
CORPORATION
The World’s leading Independent Lessor of spare commercial turbofan engines.