Embed Size (px)
Citation preview

i


i
THE IMPACTS OF LAND USE / LAND COVER CHANGES ON THE TROPICAL
MARITIME CLIMATE OF PUERTO RICO
A Dissertation
Submitted to the Faculty
of
Purdue University
by
Angel R. Torres-Valcárcel
In Partial Fulfillment of the
Requirements for the Degree
of
Doctor of Philosophy
August 2013
Purdue University
West Lafayette, Indiana

All rights reserved
INFORMATION TO ALL USERSThe quality of this reproduction is dependent upon the quality of the copy submitted.
In the unlikely event that the author did not send a complete manuscriptand there are missing pages, these will be noted. Also, if material had to be removed,
a note will indicate the deletion.
Microform Edition © ProQuest LLC.All rights reserved. This work is protected against
unauthorized copying under Title 17, United States Code
ProQuest LLC.789 East Eisenhower Parkway
P.O. Box 1346Ann Arbor, MI 48106 - 1346
UMI 3605159Published by ProQuest LLC (2013). Copyright in the Dissertation held by the Author.
UMI Number: 3605159

ii
En primer lugar dedico este trabajo al creador por regalarme las destrezas que
poseo y he logrado desarrollar para realizar este proyecto tan importante en mi vida.
También le dedico este trabajo a mi mamá, Angela L. Valcárcel De León quién con
mucha razón me obligó a ir a la escuela todos los días y me enseñó a ser responsable, una
cualidad que parece haberse perdido en nuestra sociedad. Le dedico este trabajo a Puerto
Rico, “Borinquen Bella” mi única amada tierra por la cual trabajo y trabajaré todos los
días de mi vida para que sea un mejor país lleno de paz, armonía y prosperidad. Le
dedico este trabajo además a mi Alma Mater “Universidad de Puerto Rico” (UPR) donde
comenzó mi carrera universitaria y mis sueños profesionales en 1988 como todo prepa
que ahora culmina alcanzando el máximo grado académico existente. Más del 80% de
mis actuales conocimientos y destrezas los adquirí a lo largo de los cursos y experiencias
obtenidas durante el bachillerato y las dos maestrías en el sistema UPR.
En especial dedico este trabajo a la memoria de Ana Colón-Ortiz, mi querida
abuela quién me dio todo su amor durante mi niñez y adolescencia, a Joyce Collins (Titi
Joyce) quien siempre representó alegría y diversión durante mi niñez y adolescencia.
Finalmente, dedico este triunfo a la memoria de mi adorado primo, hermano y amigo
Alexis Valcárcel-Nemerosky a quién nunca olvidaré por todas las amenas experiencias
vividas en mis mejores momentos y por el profundo vacío que su partida ha dejado en mi
vida….descansen todos en paz, NUNCA LOS OLVIDARÉ…

iii
ACKNOWLEDGMENTS
I first thank Dr. Elvia Meléndez-Ackerman for opening the door to science
graduate school in 2004, for what she taught me during my first science graduate school
course, for believing in me and for her continued support from coming back to science all
the way through my PhD defense. Dr. Meléndez-Ackerman got me the first GIS student
copy to keep my work on track, guided me to data and technical sources and is by far the
most influential science graduate professor I have ever had. I also thank Dr. Jon Harbor
for recruiting me back in 2004 to begin my PhD journey, for all his support, trust and
believing in me from the very first day through my defense. Both Dr. Melendez-
Ackerman and Dr. Harbor stood shoulder to shoulder with me through the most difficult
and challenging times during my PhD journey, that I will never forget.
I also thank Dr. Dev Niyogi for supporting me to continue to pursue my PhD
since 2007, Souleymane Fall for his GIS start up help and support, Lei Ming for the
RAMS start up work and Paul Schmid for the final phase of the RAMS. Thanks to Dr.
Gilbert Rochon for staying on my committee despite leaving Purdue and to Dr. Laura
Bowling for giving me a chance to continue my PhD journey by accepting to be on my
committee. My observational analysis was carefully and meticulously done to meet Dr.
Bowling’s high technical expectations.

iv
I also thank Dr. Williams and Dr. Vose from NOAA for providing up to date
weather station data for 1900-2007; Olga Ramos from the Institute of Tropical Forestry
in for providing GIS data and Sigfredo Torres-González from the USGS Caribbean Water
Center office for his support and providing rain gage data. Thanks also to Dr. Chris Daly
for providing PRISM GIS data and professors Larry Theller and Larry Bielh for their GIS
technical support.
Special thanks to my beloved sister Ana L. Torres-Valcárcel and Cesar J.
González-Aviles from COSUAM for believing in this work and for all of the statistical
analysis help and technical support. Having Ana and Cesar on my side was special as I
felt extremely confident and technically supported about data management and statistical
analyses; they truly worked as hard as I did to get all analyses done flawlessly. I thank
Dave and Dianne Williard and all of their family for their help including special moral
and physical support that made my life a bit easier in West Lafayette. Thanks to my
lovely wife Nilda Ortiz-Mercado for her love and close support and for being there
during the most difficult times. Last but not least, I thank all my relatives, former sports
teammates and close friends that helped me with prayers and good wishes encouraging
me to keep going regardless of the challenges and difficult times to finally honor them by
finishing this PhD, the first one in my family, in the name of you all…..I DID IT

v
TABLE OF CONTENTS
Page
CHAPTER 1 INTRODUCTION .........................................................................................1
1.1 Research Questions, Objectives and Hypotheses .......................................................6
1.1.1 Driving Questions .................................................................................................6
1.2 Specific Objectives .....................................................................................................6
1.2.1 Temperature and Precipitation ............................................................................. 6
1.2.2 Storm Event Simulations ..................................................................................... 6
1.2.3 Specific Hypotheses ............................................................................................. 7
1.3 Dissertation Outline ....................................................................................................7
CHAPTER 2 THE IMPACTS OF LAND USE / LAND COVER CHANGES ON
TEMPERATURE PATTERNS IN PUERTO RICO ....................................................... 8
2.1 Abstract .......................................................................................................................8
2.2 Introduction .................................................................................................................9
2.2.1 Global and Regional Synoptic Influences ..........................................................11
2.2.2 Puerto Rico’s Local Climate and Meteorological Conditions ............................12
2.3. Data and Methods ....................................................................................................14
2.4 Temperature Analysis Results and Discussion .........................................................20
2.4.1 Puerto Rico’s Intraregional Climate Variation ...................................................20
2.4.2 HELZ Regional Statistical Analysis ...................................................................22
2.4.5 Land Use / Land Cover (LULC) .........................................................................24

vi
Page
2.4.5.1 ANOVA of Station Temperature Data ............................................................24
2.4.5.2 PCA/EOF Analysis Results .............................................................................26
2.4.5.3 Station Temperature Trends ............................................................................27
2.4.5.4 Temporal and Spatial Frequency Analysis ...................................................29
2.4.5.5 Observation Minus Reanalysis (OMR) ........................................................30
2.4.5.6 Spatial Analysis of Temperatures .................................................................32
2.5 Findings and Conclusions .........................................................................................34
2.5.1 Future Suggestions ..............................................................................................38
2.5.2 Acknowledgements .............................................................................................39
2.6 References .................................................................................................................39
CHAPTER 3 THE IMPACTS OF LAND USE / LAND COVER CHANGES ON
PRECIPITATION PATTERNS IN PUERTO RICO .................................................... 43
3.1 Abstract .....................................................................................................................43
3.2 Introduction ...............................................................................................................44
3.2.1 Study Area ..........................................................................................................46
3.2.2 Previous Precipitation Studies in Puerto Rico ....................................................48
3.2.2.1 Precipitation Studies Related to LULC in Puerto Rico ................................49
3.2.2.2 Rainfall Mapping and Regionalization Studies ............................................50
3.2.2.3 Subregional Precipitation Zones and the Impacts of ENSO and NAO on
Precipitation .......................................................................................................... 51
3.3 Data and Methods .....................................................................................................52
3.3.1 Precipitation and Land Use / Land Cover Data ..................................................52
3.3.2 Puerto Rico Holdridge Ecological Lifezones Data .............................................53
3.3.3 Statistical Methods ..............................................................................................53
3.3.4 GIS Methods ...................................................................................................... 55

vii
Page
3.4 Results and Discussion .............................................................................................57
3.4.1 ANOVA Results .................................................................................................61
3.4.2 Precipitation Trends ............................................................................................62
3.4.3 GIS Interpolated Maps Analysis .........................................................................62
3.5 Conclusions ...............................................................................................................64
3.5.1 Acknowledgments ..............................................................................................66
3.6 References .................................................................................................................66
CHAPTER 4: ASSESSING THE IMPACTS OF LAND USE AND LAND COVER
CHANGES ON PUERTO RICO’S PRECIPITATION USING REGIONAL
ATMOSPHERIC MODELING SYSTEM (RAMS) SIMULATIONS ......................... 70
4.1 Abstract .....................................................................................................................70
4.2 Introduction ...............................................................................................................71
4.2.1 Previous Mesoscale Studies and RAMS Work in Puerto Rico ..........................73
4.3 Methods ....................................................................................................................75
4.3.1 Summary .............................................................................................................75
4.3.2 Numerical Model ................................................................................................76
4.3.2.1 Atmospheric Model: RAMS .........................................................................76
4.3.2.2 Land surface Model: LEAF-3 .......................................................................77
4.3.3 Input Data ...........................................................................................................78
4.3.4 Experimental Design ..........................................................................................79
4.3.4.1 Case Study ....................................................................................................79
4.3.4.2 Land-Surface Scenarios ................................................................................79
4.3.4.3 Control Results and Verification ..................................................................80
4.4 Data ...........................................................................................................................81
4.5 Results and Discussion .............................................................................................82

viii
Page
4.5.1 Precipitation Changes .........................................................................................82
4.5.1.1 Urban Scenarios (UI-A) ................................................................................82
4.5.1.2 Urban Expansion Scenarios (UI-B) ..............................................................83
4.5.1.3 Rain Forest Reserve (RF) .............................................................................84
4.5.1.4 Regenerated Wet Forest (RWF) ...................................................................84
4.6 Conclusions ...............................................................................................................87
4.6.1 Recommendations for Future Work ...................................................................91
4.7 References .................................................................................................................92
CHAPTER 5 CONCLUSIONS .........................................................................................94
5.1 Temperature Findings ...............................................................................................95
5.2 Precipitation Findings ...............................................................................................96
5.3 RAMS Findings ........................................................................................................98
5.4 Synthesis ...................................................................................................................99
5.5 Study Contributions ................................................................................................100
5.6 Study Limitations ....................................................................................................101
5.7 Future Directions ....................................................................................................104
Chapter 2 Temperature Tables .........................................................................................105
Table 2.1. Holdridge Ecological Life Zone (HELZ) relative coverage and number of
temperature stations for Puerto Rico......................................................................... 105
Table 2.2. Characteristics of Major Regions Used in this Study. .................................106
Table 2.3. Seasonal and Annual Temperature statistics for HELZ, Moist Forest Urban
Land Use Areas and Non-Urban, and areas of Regenerated and Unregenerated Forest
1900-2007. ................................................................................................................ 107
Table 2.4. HELZ Temperature Ratios and Differences ................................................108
Table 2.5. Significance of temperature differences between HELZ (ANOVA) ..........109
Table 2.6. Temperatures Variation Explained by HELZ (R2) ....................................110

ix
Page
Table 2.7 Urban versus Non Urban One Way ANOVA ..............................................111
Table 2.8. EOF Modes for all Temperatures ...............................................................112
Table 2.9 Main Locations Top 10% Temperature Stations Summary .........................113
Table 2.10 Main Locations Bottom 10% Temperature Stations Summary ..................114
Table 2.11. Puerto Rico’s Average and Median period trends for all temperatures ....115
Table 2.12. Main Locations Top 10% Temperature Stations Summary .....................116
Table 2.13 Main Locations Bottom 10% Temperature Stations Summary ..................117
Table 2.14. Ranked OMR for Average Temperature Trends of Selected Stations ......118
Table 2.15. Results of the statistical analysis for century average temperature values for
each HELZ from GIS generated maps and each evaluated data base. ......................119
Table 2.16. Difference in Urban versus Non Urban average century or period
temperatures magnitudes from GIS generated maps for each HELZ and data set. .. 120
Table 2.17. Results of the statistical analysis for century average temperature values of
each urban versus non urban evaluated data bases. .................................................. 121
Chapter 3 Precipitation Tables .........................................................................................122
Table 3.1 Summary of previous precipitation research and articles in Puerto Rico .... 122
Table 3.2. Annual effects of ENSO and NAO on Puerto Rico’s Precipitation ........... 124
Table 3.3. Number of stations by Selection Type and Analyzed HELZ and Land Cover
for 1992 Puerto Rico Land Cover Map..................................................................... 125
Table 3.4. Number of stations by Selection Type and Analyzed HELZ and Land Cover
for 2004 Puerto Rico Gap Map . ............................................................................... 126
Table 3.5. Holdridge Ecological Life Zones Distributions and Descriptive Statistics 127
Table 3.6. 1992 LULC Average Monthly Precipitation Ratio 1900-2007 .................. 128
Table 3.7. 2004 LULC Average Monthly Precipitation Ratio 1900-2007 ................. 129
Table 3.8 Yearly Average Total Precipitation for each period and its corresponding
Urban versus Non urban T-test significance values ................................................. 130
Table 3.9 Yearly Average Total Precipitation for each period and its corresponding
Urban versus Non urban T-test significance values. ................................................ 131

x
Page
Table 3.10 270 meter Grid Cell Yearly Average Total Precipitation Trends for each
period and its corresponding Urban versus Non urban T test significance values ... 132
Table 3.11 100 meter Grid Cell Yearly Average Total Precipitation Trends for each
period and its corresponding Urban versus Non urban T test significance values ... 133
Chapter 4 RAMS Tables ..................................................................................................134
Table 4.1 Summary of previous RAMS work about Puerto Rico ............................... 135
Table 4.2. Study objectives, research questions and hypothesis.................................. 137
Table 4.3. Locations of Interest, HELZ and Land Cover ............................................ 138
Table 4.4. Selected Land Cover substitutions for RAMS Simulations........................ 139
Table 4.5. Variables of interest and associated mesoscale rainfall triggering
mechanisms ............................................................................................................... 140
Table 4.6: Table indicating model parameters for each of the three nested grids. ...... 141
Table 4.7. Table of parameters used to define vegetative land-use types in LEAF-3.
( Walko and Tremback 2005) .................................................................................... 142
Table 4.8: Details of land-surface changes for each scenario. ..................................... 143
Chapter 2 Temperature Figures .......................................................................................144
Figure 2.1 Puerto Rico and Global Ocean 1900-2007 Average Temperature Anomalies.
Global data from NOAAA, Puerto Rico data from FILNET 2. ................................ 144
Figure 2.2 Puerto Rico and Global Land 1900-2007 Average Temperature Anomalies.
Global Data from NOAA, Puerto Rico data from FILNENT 2 ................................ 145
Figure 2.3. Puerto Rico 1992 Land Cover Map from Helmer et al, 2002 ................... 146
Figure 2.4. Puerto Rico GAP 2004 Land Cover Map from Gould et al, 2007 ........... 147
Figure 2.5. Puerto Rico Holdridge Ecological Lifezones (HELZ), urban areas and
weather stations. HELZ data from US Forest Service, urban areas data from Puerto
Rico GAP 20014, weather stations data from NOAA Historical Climate Network . 148
Figure 2.6. Distribution of years registering normal (80% frequency), above normal
(>10% frequency) and below normal (<10% frequency) minimum temperature at
each HELZ ................................................................................................................ 149

xi
Page
Figure 2.7 Distribution of years registering normal (80% frequency), above normal
(>10% frequency) and below normal (<10% frequency) average temperatures at each
HELZ ........................................................................................................................ 150
Figure 2.8. Distribution of years registering normal (80% frequency), above normal
(>10% frequency) and below normal (<10% frequency) maximum temperature at
each HELZ ................................................................................................................ 151
Figure 2.9. Puerto Rico’s SPLINE interpolated Century Maximum Temperature EOF
................................................................................................................................... 152
Figure 2.10. Puerto Rico’s SPLINE interpolated Century Average Temperature EOF
................................................................................................................................... 153
Figure 2.11. Puerto Rico’s SPLINE interpolated Century Minimum Temperature EOF
................................................................................................................................... 154
Figure 2.12. Puerto Rico’s 1900-2007 Maximum Temperature Station Trends ......... 155
Figure 2.13. Puerto Rico’s 1900-2007 Average Temperature Station Trends ............ 156
Figure 2.14. Puerto Rico’s 1900-2007 Minimum Temperature Station Trends .......... 157
Figure 2.15. Puerto Rico’s 1900-2007 Maximum Temperature station trend frequency
distribution ................................................................................................................ 158
Figure 2.16. Puerto Rico’s 1900-2007 Average Temperature station trend frequency
distribution ................................................................................................................ 159
Figure 2.17. Puerto Rico’s 1900-2007 Minimum Temperature station trend frequency
distribution ................................................................................................................ 160
Figure 2.18. Puerto Rico’s Urban 1900-2007 Average Temperature years frequency
distribution ................................................................................................................ 161
Figure 2.19. Puerto Rico’s HELZ 1963-1995 Average Temperature year frequency
distribution ................................................................................................................ 162
Figure 2.20 FILNET GIS interpolated data urban minus non-urban temperature
differences by type of temperature ........................................................................... 163
Figure 2.21 PRISM data urban minus non-urban temperature differences by type of
temperature ............................................................................................................... 164

xii
Page
Figure 2.22. FILNET urban minus non-urban temperatures differences by HELZ .... 165
Figure 2.23. PRISM urban minus non-urban temperatures differences by HELZ ...... 166
Chapter 3 Precipitation Figures .......................................................................................167
Figure 3.1. Puerto Rico’s Holdridge Ecological Lifezones, Areas of Interest & Weather
stations. HELZ data from US Forest Service, urban areas data from Puerto Rico GAP
20014, weather stations data from NOAA Historical Climate Network .................. 167
Figure 3.2 1900-2007 Average and Median Monthly Precipitation for Puerto Rico’s
Holdridge Ecological Lifezones ............................................................................... 168
Figure 3.3. Puerto Rico’s Holdridge Ecological Lifezones Average and Median
Monthly Precipitation through the decades .............................................................. 169
Figure 3.4. Puerto Rico 1992 Land Cover Map from Helmer et al, 2002 ................... 170
Figure 3.5. Puerto Rico GAP 2004 Land Cover Map from Gould et al, 2007 ........... 171
Figure 3.6. Monthly Average and Median Precipitation for Urban stations by HELZ
................................................................................................................................... 172
Figure 3.7. Average & Median Urban versus Non Urban Monthly Precipitation for Wet
Forest selections ........................................................................................................ 173
Figure 3.8. Monthly Average and Median Precipitation for the Moist Forest Urban A
and Non-Urban Selections ........................................................................................ 174
Figure 3.9. Monthly Average and Median Precipitation for the Moist Forest Urban B
and Non-Urban Selections ........................................................................................ 175
Figure 3.10. Average Monthly Precipitation for the Dry Forest Urban 1992 A and Non-
Urban Selections ....................................................................................................... 176
Figure 3.11. Median Monthly Precipitation for the Dry Forest Urban 1992 A and Non-
Urban Selections ....................................................................................................... 177
Figure 3.12. Average Monthly Precipitation for Dry Forest 2004 Urban versus Non-
Urban Selections ....................................................................................................... 178
Figure 3.13. Median Monthly Precipitation for Dry Forest 2004 Urban versus Non-
Urban Selections ....................................................................................................... 179
Figure 3.14. Puerto Rico Annual Cycle Monthly Precipitation by Periods (cm) ...... 180
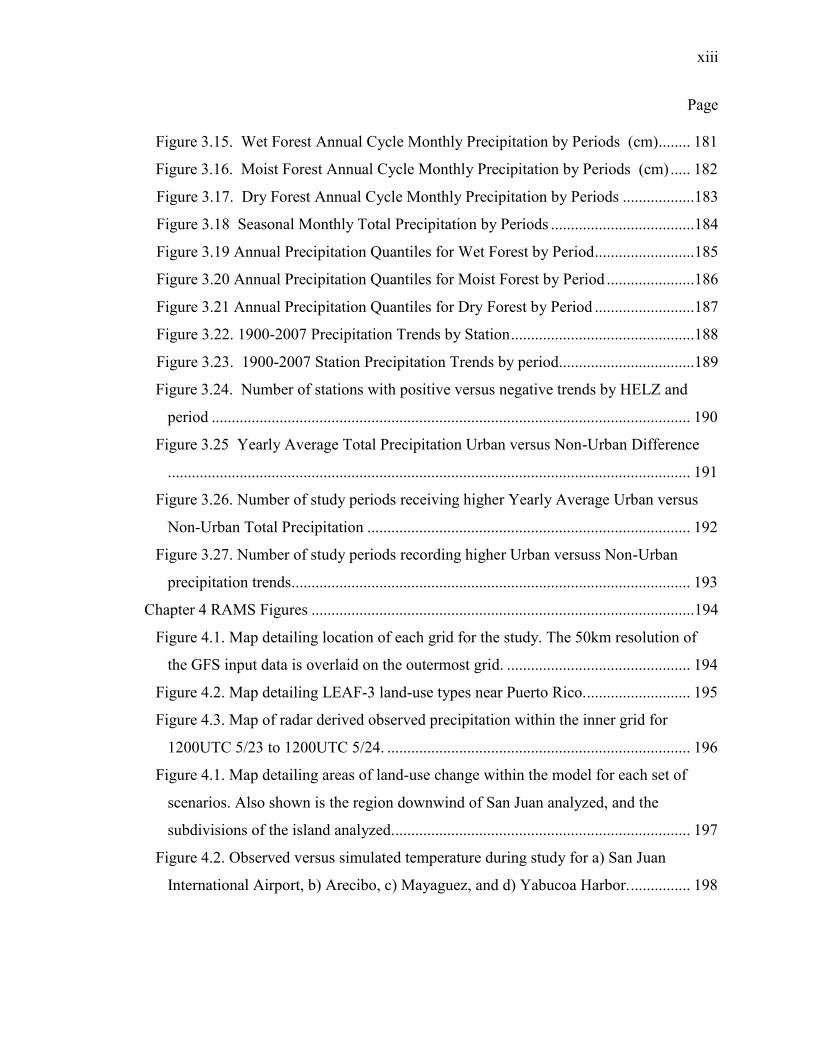
xiii
Page
Figure 3.15. Wet Forest Annual Cycle Monthly Precipitation by Periods (cm)........ 181
Figure 3.16. Moist Forest Annual Cycle Monthly Precipitation by Periods (cm) ..... 182
Figure 3.17. Dry Forest Annual Cycle Monthly Precipitation by Periods ..................183
Figure 3.18 Seasonal Monthly Total Precipitation by Periods ....................................184
Figure 3.19 Annual Precipitation Quantiles for Wet Forest by Period .........................185
Figure 3.20 Annual Precipitation Quantiles for Moist Forest by Period ......................186
Figure 3.21 Annual Precipitation Quantiles for Dry Forest by Period .........................187
Figure 3.22. 1900-2007 Precipitation Trends by Station ..............................................188
Figure 3.23. 1900-2007 Station Precipitation Trends by period..................................189
Figure 3.24. Number of stations with positive versus negative trends by HELZ and
period ........................................................................................................................ 190
Figure 3.25 Yearly Average Total Precipitation Urban versus Non-Urban Difference
................................................................................................................................... 191
Figure 3.26. Number of study periods receiving higher Yearly Average Urban versus
Non-Urban Total Precipitation ................................................................................. 192
Figure 3.27. Number of study periods recording higher Urban versuss Non-Urban
precipitation trends.................................................................................................... 193
Chapter 4 RAMS Figures ................................................................................................194
Figure 4.1. Map detailing location of each grid for the study. The 50km resolution of
the GFS input data is overlaid on the outermost grid. .............................................. 194
Figure 4.2. Map detailing LEAF-3 land-use types near Puerto Rico. .......................... 195
Figure 4.3. Map of radar derived observed precipitation within the inner grid for
1200UTC 5/23 to 1200UTC 5/24. ............................................................................ 196
Figure 4.1. Map detailing areas of land-use change within the model for each set of
scenarios. Also shown is the region downwind of San Juan analyzed, and the
subdivisions of the island analyzed........................................................................... 197
Figure 4.2. Observed versus simulated temperature during study for a) San Juan
International Airport, b) Arecibo, c) Mayaguez, and d) Yabucoa Harbor. ............... 198

xiv
Page
Figure 4.3. Total simulated precipitation for the inner grid, shown on the same scale as
radar derived precipitation in Figure ........................................................................ 199
Figure 4.4. Changes in sensible and latent heat fluxes at 18UTC 5/23/10 showing an
increase in both gradients.......................................................................................... 200
Figure 4.5. Total accumulated precipitation as a ratio to control for the entire island. 201
Figure 4.6. Total accumulated precipitation as a ratio to control for the western part of
the island. .................................................................................................................. 202
Figure 4.7. Total accumulated precipitation as a ratio to control for the central part of
the island. .................................................................................................................. 203
Figure 4.8: Total accumulated precipitation as a ratio to control for the eastern part of
the island. .................................................................................................................. 204
Figure 4.9. Total accumulated precipitation as a ratio to control for the region
downwind of San Juan. ............................................................................................. 205
Figure 4.10. Total accumulated precipitation as a ratio to control for individual areas of
changed land surface for each scenario. ................................................................... 206
Figure 4.11. Comparison of the change in precipitation between the a) UI5A scenario
and b) UI5B scenario. In UI5A, the surface is changed to forest, reducing the urban
gradient and reducing upwind precipitation. In UI5B, the expanded urban envelope
changes the location of the mesoscale circulation, changing the location of upwind
precipitation. ............................................................................................................. 207
Figure 4.12. Precipitation difference between control and RF1 scenario. Resulting
precipitation represents the combined effects of the changed land surface from forest
to bare soil interacting with the unchanged urban area to the west. ......................... 208
Figure 4.13. Map of precipitation difference between control and a) RWF4 scenario and
b) RWF5 scenario. ................................................................................................... 209
Figure 4.17. Control 6 hour Average Precipitation Time Series ................................. 210
Figure 4.18. Percentage of resulting scenarios with increased versus decreased
precipitation .............................................................................................................. 211

xv
Page
Figure 4.19. Percentage of Increase versus Decrease Precipitation Results by Scenario
................................................................................................................................... 212
Figure 4.20. Precipitation Response ratio for each scenario at each region relative to
control ....................................................................................................................... 213
APPENDICES
Appendix A Figures ......................................................................................................214
Figure A.1. Ecozones Decadal Average Temperature Dry Season Standardized
Anomalies .............................................................................................................. 214
Figure A.2. Ecozones Decadal Average Temperature Wet Season Standardized
Anomalies .............................................................................................................. 215
Figure A.3 Puerto Rico Seasonal Temperature Standardized Anomalies by Decade
................................................................................................................................ 216
Figure A.4 Dry Forest Percentage Decadal Temperature changes ........................... 217
Figure A.5 Moist Forest Percentage Decadal Temperature changes ........................ 218
Figure A.6 Wet Forest Percentage Decadal Temperature changes........................... 219
Figure A.7 1992 A Urban minus Non-Urban Decadal Temperature Difference ...... 220
Figure A.8 1992 B Urban minus Non-Urban Decadal Temperature Difference ...... 221
Figure A.9. 2004 A Urban minus Non-Urban Decadal Temperature Difference ..... 222
Figure A.10. 2004 B Urban minus Non-Urban Decadal Temperature Difference ... 223
Figure A.11 Urban 2004 A versus Urban 2004 B Average Monthly Temperature .. 224
Figure A.12 Urban Stations Minimum Temperature 1900-2007 Trends Distribution
................................................................................................................................ 225
Figure A.13. Urban Stations Average Temperature 1900-2007 Trends Distribution226
Figure A.14 Urban Stations Maximum Temperature 1900-2007 Trends Distribution
................................................................................................................................ 227
Figure A.15 Station Monthly Minimum Temperature by HELZ ............................. 228
Figure A.16 Station Monthly Average Temperature by HELZ ................................ 229
Figure A.17 Station Monthly Average Temperature by HELZ ................................ 230
Figure A.18 Number of Precipitation Stations in Service per year 1900-2007 ........ 231

xvi
Page
Figure A.19 Percentage of Stations Registering Usual versus Extreme Yearly
Average Precipitation for 1900-2007 (Precipitation Station Frequency Distribution)
................................................................................................................................ 232
Figure A.20. Percentage of Decades Registering Usual versus Extreme Yearly
Average Precipitation by HELZ (Decadal Frequency Distribution) ..................... 233
Figure A.21. Percentage of Decades Registering Usual versus Extreme Yearly
Average Precipitation in the Wet Forest by U/NU Land Cover (Decadal Frequency
Distribution) ........................................................................................................... 234
Figure A.22. Percentage of Decades Registering Usual versus Extreme Yearly
Average Precipitation in the Moist Forest by U/NU Land Cover (Decadal
Frequency Distribution) ......................................................................................... 235
Figure A.23 Percentage of Decades Registering Usual versus Extreme Yearly
Average Precipitation in the Dry Forest by U/NU Land Cover (Decadal Frequency
Distribution) ........................................................................................................... 236
Figure A.24. 1963-1995 Average Annual Temperature map generated from PRISM
Annual Maximum and Minimum Temperature maps ........................................... 237
Figure A. 25. Holdridge Ecological Lifezones, Temperature Stations and 2004 High
Density and Low Density Urban Areas ................................................................. 238
Figure A.26. 1979-2005 Anomalies Trends from Selected FILNET data stations map
................................................................................................................................ 239
Figure A. 27. 1979-2005 North America Regional Reanalysis Anomalies trends map
................................................................................................................................ 240
Figure A.28. 1979-2005 FILNET selected stations observations anomalies minus
North America Regional Reanalysis trends map ................................................... 241
Figure A. 29. FILNET 1900-2007 Monthly Maximum Temperatures map. ............ 242
Figure A.30. FILNET 1900-2007 Monthly Average Temperatures map ................. 243
Figure A.31. FILNET 1900-2007 Monthly Minimum Temperatures map .............. 244
Figure A.32. 1900-1929 Yearly Average Total Precipitation in centimeters at 100
meter resolution ..................................................................................................... 245

xvii
Page
Figure A.33. 1930-1959 Yearly Average Total Precipitation in centimeters at 100
meter resolution ..................................................................................................... 246
Figure A.34. 1960-1989 Yearly Average Total Precipitation in centimeters at 100
meter resolution ..................................................................................................... 247
Figure A.35. 1990-2007 Yearly Average Total Precipitation in centimeters at 100
meter resolution ..................................................................................................... 248
Figure A.36. 1963-1995 Yearly Average Total Precipitation in centimeters at 100
meter resolution. .................................................................................................... 249
Figure A.37. 1979-2005 Yearly Average Total Precipitation in centimeters at 100
meter resolution ..................................................................................................... 250
Figure A.38. 1900-1929 Average Total Precipitation Trends at 100 meter resolution
................................................................................................................................ 251
Figure A. 39. 1930-1959 Average Total Precipitation Trends at 100 meter resolution
................................................................................................................................ 252
Figure A. 40. 1960-1989 Average Total Precipitation Trends at 100 meter resolution
................................................................................................................................ 253
Figure A.41. 1990-2007 Average Total Precipitation Trends at 100 meter resolution
................................................................................................................................ 254
Figure A. 42. 1963-1995 Average Total Precipitation Trends at 100 meter resolution
................................................................................................................................ 255
Figure A. 43. 1979-2005 Average Total Precipitation Trends at 100 meter resolution
................................................................................................................................ 256
Appendix B Tables .......................................................................................................257
Table B.1. 1992 LULC Century Average Precipitation Trends (Yearly versus Region)
................................................................................................................................ 257
Table B.2. 1992 LULC PRISM Period Average Precipitation Trends (1963-1995
versus Region) ....................................................................................................... 258
Table B.3. 1992 LULC NARR Period Average Precipitation Trends (1979-2005
versus Region) ....................................................................................................... 259

xviii
Page
Table B.4. 2004 LULC Century Average Precipitation Trends (Yearly versus Region)
................................................................................................................................ 260
Table B.5. 2004 LULC Average Precipitation PRISM Trends (1963-1995 versus
Region) ................................................................................................................... 261
Table B.6. 2004 LULC Average Precipitation OMR Trends (1979-2005 versus
Region) ................................................................................................................... 262
Table B.7. Six Hour Average grid cell precipitation in centimeters for each study
region of the island. The region Downwind of San Juan also includes precipitation
over the ocean. ....................................................................................................... 263
Table B.8. Percentage differences in total precipitation over the modeled period for
each scenario as ratio of the control. Relative changes in precipitation comparing
each scenario to the control by study region. ......................................................... 264
VITA .............................................................................................................................265

xix
ABSTRACT
Torres-Valcárcel, Angel R. Ph.D., Purdue University, August 2013. The Impact of Land
Use / Land Cover Changes on the Tropical Maritime Climate of Puerto Rico. Major
Professors: Jon Harbor and Dev Niyogi.
Previous studies of the influences of Land Use / Land Cover Changes (LULCC) on the
climate of continental areas have provided a basis for our current understanding of
LULCC impacts. However continental climates may not provide complete explanations
or answer specific scientific questions for other regions, such as small tropical-maritime
dominated islands. Here we provide a detailed analysis of century-scale climate change
for Puerto Rico, and assess the degree to which some of this change might be related to
LULCC. We used long-term data, Geographic Information Systems (GIS), statistical
analysis and Regional Atmospheric Modeling Systems (RAMS) to detect and assess the
impact of local urban development on temperature and precipitation. We found strong
evidence of a relationship linking temperature and precipitation magnitudes to local
urban development. Findings for maximum, average and minimum temperature are
robust showing that urbanization has increased local temperatures and levels of impact
found here represent minimum estimates since they were based on data that had some
prior adjustment intended to control for urban signals. Strong evidence of this
relationship was also found in the precipitation data analysis, but no clear correlation was
found in the direction, magnitude, period and location of rain with urban development
implying that other factors dominate or are playing some role in this relationship. RAMS
numerical modeling results were inconclusive suggesting that further tuning of settings
and parameters are needed before model results can be used to guide decision-making.

1
CHAPTER 1 INTRODUCTION
Although weather and climate are complementary concepts, weather refers to the
conditions of the atmosphere at a given time and place, including winds, humidity,
precipitation and temperature, whereas climate refers to the predominant long term
statistics of weather that characterize a given region at a particular time period (Arya,
2001) from decades to geological periods. Understanding the drivers of changes in
climate at a range of scales has emerged as an extremely important scientific goal, given
the impacts of climate changes on human activity and anthropogenic feedbacks on the
atmosphere. The subfield of microclimatology is concerned with atmospheric
phenomena and driving processes within the Planetary Boundary Layer (PBL) and, as
with other scientific disciplines, more processes have been progressively incorporated
into our understanding of the PBL as our research into weather and climate has advanced.
It is well known that surface processes such as radiative energy balance, atmospheric
chemistry and heat fluxes from natural and anthropogenic sources at the surface can alter
local climates (e.g., Chase et al., 2000; Pielke et al., 2002, Kalnay and Cai, 2003; Niyogi
et al., 2004; Vose et al., 2004; Feddema et al., 2005; Christy et al., 2006; Mahmood et al.,
2006; Ezber et al., 2007; Pielke et al., 2007; Hale et al., 2008, Bonan, 2008; Findell et
al.,2009; Pitman et al., 2009; Comarazamy et al., 2010). Microclimatologists are
interested in identifying, understanding and predicting the long term patterns of surface

2
drivers of the atmosphere and the response of local climate to both natural and
anthropogenic drivers, including how changes in surface feedbacks and the intensity of
human activities impact the climate system in the PBL.
Understanding natural surface processes such as evapotranspiration, infiltration,
runoff, erosion, albedo, convection, convergence, advection, heat transfer and energy
fluxes, as well as their magnitudes, is critical for assessing the nature and extent of
anthropogenic impacts on the environment, the atmosphere and climate responses. The
heterogeneous nature of natural surfaces requires that researchers investigate how aquatic
surfaces are different from land surfaces, and how processes vary with land cover and
land use types. The Land Cover concept refers to the physical features that exist on a
surface at a given time, while the Land Use concept adds the anthropogenic realm as it
considers human activity at a given surface covered by a given Land Cover.
Just as natural surface processes are heterogeneous, there are many different
human activities that have particular effects on the climate system by changing the actual
Land Cover and the type and intensity of Land Use. Urbanization and deforestation can
be considered the two most dramatic land cover changes that humans can induce on a
land surface. Deforestation entails the physical removal of the vegetated cover and often
also involves a loss of organic soil, and frequently results in temperature increases,
changes in albedo, reduction of humidity and changing the presence and composition of
organic aerosols. Meanwhile urbanization, often preceded by deforestation, adds
artificial physical features to the land that further alter natural land processes by
decreasing the infiltration, and increasing the heat capacity and thermal conductivity of
natural surfaces.

3
Urbanization is known to increase temperatures but may either increase or
decrease rainfall (Comarazamy et al., 2010; Han et al., 2012). Increased convection,
surface roughness and the presence of some inorganic aerosols in urban areas may
increase rainfall, whereas increased air pollution and inorganic aerosols, as well as
decreased humidity and fragmented latent heat in urban areas may decrease rainfall (Han
et al., 2012). Deforestation and urbanization are dramatic anthropogenic activities that
impact atmospheric conditions.
The modification of surface properties and characteristics through changes in the
Land Use and/or Land Cover are known as Land Use/Land Cover Changes (LULCC).
In some cases, the land use and land cover share the same properties and so one implies
the other; for example, forests, crops and water. However, a region may be defined as
“urban” by its socioeconomic characteristics (Land Use) or by its physical, chemical or
biological properties (Land Cover). Consequently, the type and magnitude of impacts
from these LULCC vary geographically and maybe socially, suggesting that there is
considerable complexity in understanding their impacts on the climate system.
Most studies and models of LULCC impacts on climate have been developed for
continental climates (Comarazamy et al., 2010), such as the continental United States,
where Polar, Continental and Maritime air masses constantly interact. While this may be
representative of conditions in continental climates around the world, and while this work
has advanced basic scientific knowledge about climate and models to predict weather and
long-term patterns, this work has focused on only part of the pool of existing climates.
We cannot assume that it provides adequate explanations or predictions for tropical
climates, maritime climates or combined tropical-maritime climates. Although

4
continental conditions may provide a theoretical basis to understand, project and predict
atmospheric responses and climate conditions at other locations, scientific rigor requires
us to treat these findings as hypotheses for other settings that must be tested in different
environments. Unfortunately, climate studies from diverse regions, including small
tropical islands, are scarce because of the lack of long-term data, high-resolution maps
and the low density of climate stations in many of these regions (Fall et al., 2006).
Puerto Rico provides a valuable opportunity to test if findings, theories, and
methods developed in continental areas hold in a tropical maritime environment. Puerto
Rico is a small tropical island located in the Caribbean basin and has a maritime climate.
The island has considerable macro and micro climatic variability, and has undergone
dramatic LULCC over the past century (Chinea & Helmer, 2003; Grau et al., 2003).
Fortunately for climate studies, Puerto Rico has an extensive, high-density network of
weather stations with long term data for temperature and precipitation, as well as high
resolution Land Use / Land Cover (LULC) digital maps. Climate variability in Puerto
Rico ranges from a Rain Forest with cool temperatures, high precipitation and humidity,
to Dry Forests with warm temperatures and low precipitation and humidity. Land cover
ranges from a large sprawling urban area dominated by one-story buildings with a well-
studied Urban Heat Island effect, to areas of naturally regenerated forest. The growth of
the major urban center accelerated when an agricultural economy was replaced by an
industrial economy in the mid-twentieth century, with abandonment of agricultural lands
and migration of the rural population into the capital city (Grau et al., 2003). These
conditions provide a great opportunity to study local climate extremes as well as land
cover opposites under the same subtropical maritime environment.

5
Global and Synoptic scale events such as Global Warming, sea level rise, El Niño,
The North Atlantic oscillation and tropical storms naturally have local effects in Puerto
Rico. Short-term variations in temperatures in Puerto Rico are dominated by synoptic
scale seasonality, and long-term trends follow broad global patterns of temperature
change (Chapter 2). Puerto Rico’s topography triggers orographic precipitation,
particularly in the eastern region where trade winds collide with two mountain ranges
(Daly et al., 2003). A geographical location in the path of tropical storms, hurricanes and
cold fronts from the continental United States brings additional moisture into the island at
different times during the year. Analyses of long-term rainfall records show a
predominantly decreasing trend for most stations in Puerto Rico (Chapter 3), and this
may present future challenges for water resources and may drive ecological changes on
the island. Despite strong global, regional and synoptic influences in temperature and
precipitation, smaller scale surface processes also have the potential to provide forcing
feedbacks in local climate. The main purpose of the work presented in this dissertation is
to study whether smaller scale surface processes related to land use change are important
variability factors in the dominant Tropical Maritime climate of Puerto Rico, by
identifying, measuring, and understanding land use - climate feedback responses in local
climatological records.

6
1.1 Research Questions, Objectives and Hypotheses
1.1.1 Driving Questions
Does current knowledge of the impacts of Land Use / Land Cover Changes on
climate in a continental climate hold for a tropical maritime environment?
Is it possible to detect and measure the impact of any Land Use / Land Cover
Changes in Puerto Rico?
Could any changes in long-term temperature and precipitation records in Puerto Rico
be associated with local Land Use / Land Cover Changes?
1.2 Specific Objectives
1.2.1 Temperature and Precipitation
Study long term local spatial and temporal patterns in temperature and precipitation;
Use different methods to determine if it is possible to detect and measure local
temperature or precipitation changes; and
Explain any observed links (or lack of a links) between local Land Use / Land
Cover Changes and precipitation and temperature patterns.
1.2.2 Storm Event Simulations
Examine whether simulations of individual storm events with and without land use
changes can provide insight in to the mechanisms behind any long-term patterns in
temperature and/or precipitation linked to Land Use / Land Cover Changes.
7
1.2.3 Specific Hypotheses
Urban temperatures are higher than non-urban temperatures in Puerto Rico.
Urban precipitation is different than non-urban precipitation in Puerto Rico.
Main Forested and Urban areas are altering the dynamics of weather events.
1.3 Dissertation Outline
This work is divided into two major parts. The first part (chapters 2 and 3)
consists of studies of long-term climate data observations from stations across Puerto
Rico that are designed to assess the spatial and temporal variability of temperature and
precipitation in Puerto Rico. This work reveals underlying natural patterns of magnitudes,
variability and controls that provide a benchmark for comparisons that are used to assess
anthropogenic impacts on local climate associated with Land Use / Land Cover Changes.
A particular focus in these chapters is on detecting climate impacts associated with urban
areas and formerly disturbed areas that are undergoing natural regeneration. The second
part (chapter 4) focuses on computational experiments using the Regional Atmospheric
Modeling System (RAMS) to test hypotheses based on the findings in the first part of the
thesis. By simulating different Land Use / Land Cover Change scenarios for a set of
storm events that occurred over Puerto Rico this work provides a basis for theoretical
explanations of local patterns and responses observed in the long-term data sets. In
chapter 5 the main conclusions from the total body of work are discussed, along with
suggestions for future research that would be a logical extension of this work. Chapters 2,
3, and 4 are written in manuscript format for submission to peer-reviewed scientific
journals.

8
CHAPTER 2 THE IMPACTS OF LAND USE / LAND COVER CHANGES ON
TEMPERATURE PATTERNS IN PUERTO RICO
2.1 Abstract
Land Use / Land Cover Changes (LUCC) are land processes that affect local atmospheric
phenomena and have become increasingly important for modern climate studies. Puerto
Rico has experienced major LUCC in recent decades and there is considerable scientific
and practical interest in understanding the effects this might have had on local climate.
This study provides an analysis of observational data designed to examine potential
LUCC impacts on temperature in Puerto Rico. The primary data were FILNET-adjusted
temperatures from the century-long Historical Climate Network (HCN) version 2
database, generated from climate station data across Puerto Rico, and high resolution
digitalized land use/land cover maps. Analysis of variance and trend analysis were used
to examine differences in historical climate data for sites that were grouped by Holdridge
Ecological Life Zone (HELZ) and subdivided by land use type. We also explored the use
of Empirical Orthogonal Function (EOF) analysis to examine trends in the spatial
structure of temperature patterns and the use of Observation Minus Reanalysis (OMR) to
test for local Land Use / Land Cover (LULC)-driven changes versus intraregional
changes in temperature.

9
We found that: (1) in Puerto Rico urban development has impacted maximum,
average and minimum temperatures with a statistically significant difference in all of
them between urban and non-urban areas in FILNET adjusted data that virtually
eliminated urban signals, hence, our findings represent a minimum level of impact; (2)
The highest temperatures on the island are not occurring in Urban Heat Island (UHI)
areas, including the capital city, San Juan; (3) The highest temperature trends were
detected for maximum and minimum temperatures in the locations with most dramatic
LUCC; (4) Methodologically, stratifying data using the HELZs is a useful approach for
geographic climate analysis aimed at comparing urban versus non urban or rural stations;
(5) OMR can be performed at small tropical scales but some unexpected results raised
reliability questions; (6) Statistical analysis maybe more effective in detecting geographic
differences in small scale tropical climates than OMR; (7) EOF yielded results that were
most consistent with conventional expectations about the location, magnitude, direction
and scale of local LUCC impacts; (8) GIS tools are useful and effective to infer
temperature impacts beyond station data observations; (9) The impact of urban
development on temperatures is detectable across the entire island, regardless of HELZ.
2.2 Introduction
Land Use / Land Cover Change (LULCC) reflects socioeconomic patterns of
human activity and is one way in which people can impact ecological systems and
threaten vulnerable human populations and communities. LUCC also plays a role in
climate feedbacks, particularly influencing regional and local temperatures and
precipitation (Jarengui and Ramales 1996; Kalnay and Cai, 2003; Niyogi et al., 2004;

10
Velazquez-Lozada et al., 2006; Ezber et al., 2007, Pielke et al., 2007; Ji-Young and
Jong-Jin 2008, Fall et al., 2009, Imhoff et al., 2010; Murphy et al 2011; Oleson, 2012).
However, the level of understanding of surface and atmosphere exchanges in the Tropics,
where local surface interactions are expected to dominate boundary-layer processes, is
very limited compared to the mid latitudes (Niyogi et al., 2004). Climate feedbacks could
be different at different latitudes and Pielke et al., (2011) reviewed several studies where
similar LUCC in different geographic locations led to different forcing values and in
some cases altered the sign of the forcing. To advance our understanding of LUCC
impacts on climate it is important to study a range of settings and scales, including
smaller-scale areas such as islands, especially if these sites have long term data sets and a
good distribution of observational stations (Fall et al., 2006). Climate change studies on
small islands are also particularly important because of the vulnerability of small islands
to severe natural phenomena and unique sociological challenges (IPCC WGII, 2007). In
addition, small islands have a higher degree of endemism (number of local and unique
species) that could be threatened by synoptic and global changes.
Assessing the magnitude of past impacts of LUCC, as the basis for assessing and
responding to future impacts, is critical for resource management and conservation,
vulnerability assessment and emergency planning. However, few such analyses have
been attempted to date for small tropical islands. In the work reported here we undertake
an assessment of historical temperature changes and LUCC in Puerto Rico, an island that
offers good opportunities for studying climate change and land use because of its size and
land use change history. Moreover, Puerto Rico has a high density of climate stations that

11
have a century-long record of temperature and precipitation, and high spatial resolution
digital land cover maps.
The work presented here was designed to assess changes in temperature patterns
over time in Puerto Rico’s major ecological life zones, and to assess whether temperature
records include variations related to LUCC. This work is structured as follows: in the
first section we discuss how global and regional synoptic phenomena influence Puerto
Rico’s climate. We show that despite Puerto Rico’s small size, tropical location and
maritime influences, where climate might be expected to show very limited spatial
variations, there is enough intraregional variability to require an approach that subdivides
the study area into ecological life zones. Third we analyze a century of data with different
methods to test hypotheses that, after controlling for potential variability related to
ecological life zones, there are significant differences in temperature trends between
urban and rural areas, with higher absolute values and warming trends in urban areas.
2.2.1 Global and Regional Synoptic Influences
Global land and sea-surface average temperature anomalies over the last century
(Figures 2.1 and 2.2) show three distinctive phases: decreasing negative anomalies
(warming) for about thirty years after 1910; then alternating positive and negative
anomalies around a long term average from the 1940s to the 1970s, and; a period of
notably increasing positive anomalies (warming) since the 1970’s. Puerto Rico’s average
temperature anomalies for the century follow similar trends (Figures 2.1 and 2.2),
suggesting that global drivers play a major role in the large-scale trends in Puerto Rico’s

12
temperature record. Yet the variability of the Puerto Rican data record around these
broad trends is quite large, suggesting that local influences might also be important.
Regional synoptic phenomena also influence Puerto Rico’s climate. The island is in
the path of tropical cyclones and the El Niño Southern Oscillation (ENSO) and the North
Atlantic Oscillation (NAO) are major synoptic scale atmospheric phenomena that
potentially influence climate in the Caribbean and Puerto Rico. Jury et al. (2007) found
that ENSO has no observable effects on Puerto Rico’s yearly precipitation. However,
Malmgren et al. (1998) concluded that ENSO has a positive effect on temperatures in the
southeastern Caribbean including the eastern half of Puerto Rico. Malmgren et al. (1998)
also observed that after 1970 there were increasing local average temperatures regardless
of ENSO strength. Malmgren et al. (1998) found no primary impact of the NAO on
Puerto Rico’s temperature. Thus, global climate changes and regional phenomena
influence temperature patterns over Puerto Rico.
2.2.2 Puerto Rico’s Local Climate and Meteorological Conditions
Puerto Rico is about 180 km wide from east to west, and 60 km from north to
south. The center of the island is dominated by the Cordillera Central mountain range
and there are plains to the north and south (Malmgren and Winter, 1999). Puerto Rico has
a maritime subtropical climate typical of Caribbean islands (Daly et al., 2003). The
climate is generally humid with warmer temperatures along the coastline, decreasing
temperatures with increasing elevation, and small seasonal temperature variations (Daly
et al., 2003). Trade winds blowing east—northeast from the Atlantic have a large
influence on the island’s climate but local land surface characteristics and topography

13
drive the climate on synoptically calm days (Velazquez-Lozada et al., 2006). The
mountains at the center of the island generate orographic precipitation (Malmgren et al.,
1998), shielding the southern part of the island from the Atlantic moisture of the trade
winds and causing higher precipitation and lower temperatures in the north and a dryer
and warmer climate in the south. Temperatures are higher at the coastlines and lower in
the central mountains according to topography-corrected PRISM datasets (Daly et al.,
2003). The Parameter-elevation Regressions on Independent Slopes Model (PRISM)
climate mapping system is explained in more detail in the Data and Methods section.
Average temperature anomalies for Puerto Rico computed from FILNET data for all
stations track consistently with global changes in land and ocean temperatures with an
overall increase of ~1.52 o
C in average temperature over the past century (Figs 2.1 and
2.2).
Puerto Rico has two primary seasons, a five month dry season (winter) from
December to April and a seven month wet (summer) season from May to November
(Malmgren and Winter, 1999) Temperatures begin to rise in February, are highest from
June to September, and then decline from October to January. Precipitation trends
generally resemble the temperature trend, with low precipitation in the winter and
increasing precipitation in March through May when the wet season starts. The driest
period of the wet season is during June and July, and then precipitation rises from
September to October to a peak in November before the winter dry season starts in late
December.
During the dry season, cold fronts occasionally produce orographic rain
(Malmgren and Winter, 1999) and the thermal equator is farthest south with the
14
intertropical convergence zone (ITCZ) located south of the Caribbean Sea between 00 and
50
S (Malmgren and Winter, 1999). During the wet season, the ITCZ is located over the
Caribbean Sea between 60 and 10
0 N (Etter et al., 1987). Atlantic trade winds carry
ITCZ moisture inland causing orographic rain (Malmgren and Winter, 1999) and the
island is subject to tropical systems and storms (Lopez-Marrero and Villanueva- Colón,
2006).
2.3. Data and Methods
The goal of this study was to assess changes in temperature patterns over time in
Puerto Rico’s major ecological life zones, and to assess whether temperature records
include variations related to LUCC. Temperature datasets used include: 1) National
Climatic Data Center (NCDC) FILNET adjusted maximum and minimum temperatures
from all 57 Historical Climatology Network (HCN) temperature stations in Puerto Rico;
the FILNET adjusted data are a complete set of records that include estimates for missing
values based on data from highly correlated neighboring stations controlling for
inconsistencies in measurement instruments, station placement and ground sources of
variation (Menne et al., 2009); 2) The Parameter-elevation Regressions on Independent
Slopes Model (PRISM) temperature (Daly et al., 2003); 3) The North American Regional
Reanalysis (NARR) mean temperature at a monthly time scale (Mesinger et al., 2006).
The land use and land cover datasets used in this study originate from the Institute
of Tropical Forestry of the United States Forest Service in Puerto Rico: (1) the Puerto
Rico Forest Type and Land Cover 1992 (30 meter resolution and 33 LULC classes; Fig.
2.3) from Helmer et al. (2002), and (2) the Puerto Rico Gap Analysis Project 2004 15 x
15
15 meter grid and seventy two (72) land use / land cover classes digitized map (Fig. 2.4;
Gould et al., 2007). In addition, we used a Holdridge Ecological Life Zones (HELZ)
dataset created using a vegetation mapping system based on ecological and
ecophysiological tolerance of plant communities to temperature, humidity, precipitation
and elevation (Fig. 2.5; Lugo et al., 1999). Six HELZs are found in Puerto Rico (Table
2.1) however, three HELZs cover less than 1% of the island and are mostly limited to the
Rain Forest reservation, and so were merged with the more similar HELZ in the
geographical analysis. One HELZ’s was further subdivided into Eastern (Unregenerated)
and Western (Regenerated) for comparative analysis. Code names, extension area and #
of stations for each and land cover sub regions annual and seasonal temperature statistics
for the corresponding HELZ in Puerto Rico are provided in Table 2.2 and Table 2.3.
Five geographic areas of interest were identified for particular focus in this study
because of their climatic properties or because of the large scale of historical LUCC:
- San Juan Urban Area: the most dense and extensive urban landscape in the island
and representative of urban conditions and impacts where Urban Heat Island (UHI)
effects have been detected in previous studies (Velazquez-Lozada et al., 2006)
- Rain Forest Reserve: a forest climate that has Puerto Rico’s highest rainfall totals
and coldest temperatures, and which is currently under pressure from urban
development and expansion
- Regenerated Forest: a wet mountainous region with evidence of dramatic LUCC
consisting of a transition from agriculture to forest, which is opposite to the impacts
typical of development related to human activity

16
- Unregenerated Forest: a wet mountainous region without significant LUCC that
serves as a baseline for comparison with the Regenerated Forest.
- Dry Forest: the warmest and driest HELZ or region on the island
The FILNET HCN 2 data used in this study include an adjustment using an
algorithm designed to control for urban signals in the temperature record. However, at
the time of this study this was the first time that such data were available for long-term
analysis, and so we examine here whether it is possible to detect and quantify impacts of
urbanization on local temperatures in the adjusted data set. Average temperatures were
computed directly from the FILNET monthly data by averaging monthly maximum and
minimum temperatures for the 1900 to 2007 period. Monthly temperature averages were
then computed for each region for the period 1900 to 2007. For the decadal temperature
analysis, the years were grouped by chronological decades starting with 1990 to 1909;
however the final decade in the analysis consists of only 8 years (2000 – 2007). Seasonal
temperatures were computed by averaging monthly temperatures corresponding to the
dry season from December to April and the wet season from May to November
(Malmgren and Winter, 1999).
The FILNET data were selected for sites across the different HELZ and LULC
landscapes and analyzed statistically to test for decadal, monthly and seasonal differences.
Temperature stations from HELZ and LULC regions in Puerto Rico were grouped
together in this study to examine temperature changes by region with particular focus on
urban versus non-urban LULC in each HELZ. Regional temperatures were computed by
averaging values of all stations inside each HELZ, the subdivided HELZs and the urban

17
areas from the 1992 and 2004 LULC maps. Temporal variation was analyzed on
monthly, seasonal and decadal scales for each geographical region.
Only stations located inside the main three HELZ (which account for ~99% of the
island) were considered for statistical analysis but all (56) stations were used to generate
interpolated maps. The “urban” areas were selected from the 1992 and 2004 LULC maps
based on their physical characteristics (Land Cover) as defined by each data set. The
1992 map urban area was defined as “urban and barren” while the 2004 map had two
types of urban classes, “High Density Urban” representing the most built and developed
lands and “Low Density Urban” that represented urban population based on its density
(Gould et al., 2007). The “High Density Urban” classification from the 2004 LC map
was therefore selected for study and only the stations located within this area were
selected for analysis (Figs. 2.3 and 2.4). All stations considered “urban” by our GIS
selection method are located within the Moist Forest (MF) HELZ. The two urban area
extents derived from the 1992 and the 2004 maps were coded U1992 and U2004
respectively. The MF was subdivided in to Moist Forest Overall (MFO) consisting of all
stations including those selected as “urban” for analysis purposes between the three
HELZ, and the Moist Forest Non Urban (MFNU) that excluded all urban stations from
the 1992 LULC map.
Two data sets were identified for the analysis of urban regions, reflecting different
selection strategies to control for possible definition and selection method bias of ARC
MAP 10. Method A involved selecting stations contained inside the 1992 and 2004 areas
that were classified as urban land cover. Method B included all of the stations in Method
A plus additional stations known to be in the San Juan urban area and surrounded by built

18
up areas but which were excluded from the urban classification in Method A because
they do not fall inside the urban area as derived using a default automated method based
on a traditional “Urban Land Use” definition. We were cautious about using such a
double definition of the urban landscape, but felt that it was potentially significant and
worth investigating as “urban” is both a “Land Cover” and a “Land Use” and these are
not necessarily identical. The Urban Land Cover refers to the physical environment of a
landscape (such as roads, parking lots, roofs, medians) while the Urban Land Use refers
to a set of activities (uses) that take place in association with an urban area, and may
include features such as parks within a city. Consider, for example, a weather station
located in the middle of Central Park in New York City. In Method A this weather
station would be considered non-urban because it is in a large forested and grassy area.
In Method B it would be considered urban because it is used as an integral part of the city.
Our sub-goal here was to determine if results were independent from the selection
method by testing if there was any significant difference in using these two ways to group
station sites. Urban areas from A selection were labeled 1992 A (U1992A) and 2004 A
(U2004A), urban areas from the B selection were labeled 1992 B (U1992B) and 2004 B
(U2004B). The WF was subdivided into Unregenerated Wet Forest at the east (UnWF)
and Regenerated Wet Forest in the West (RWF), to analyze the temperature patterns
between the two subdivisions separately (Table 2.2 and Table 2.3).
Analysis of Variance (ANOVA) was performed with maximum, average and
minimum temperatures to examine differences between HELZ as well as between urban
versus non urban LULC in addition to monthly, seasonal and decadal variations. One-
way ANOVA analyzes the differences of a dependent quantitative variable against one
19
independent categorical variable such as temperature against HELZs, regions, months,
seasons or decades while Two-Way ANOVA analyzes the differences of a dependent
quantitative variable against two independent categorical variables (Sincich, 1990; Daniel,
1998). When normal distribution requirements were not met but it was nearly Gaussian,
a student’s t-test was used as this test is less sensitive to deviations from normality
(Gosset, 1908, Hogg & Tanis, 1997; Daniel, 1998; Wigley et al., 2006, Montgomery &
Runger, 2010; Laerd Statistics, 2013). The significance level for all statistics was set at
the conventional 95% (α =0.05). Additional variability analysis involved computing a
coefficient of variation, (CV, standard deviation divided by mean) for each station at
monthly, seasonal and decadal time scales, as a measure of variability relative to the
magnitude of the data.
In addition we used Empirical Orthogonal Function (EOF) / Principal
Components Analysis (PCA) to examine spatial structure in the data. EOF/PCA analysis
was performed for the monthly average temperature of each station. The loadings of the
first mode (which expresses most of the variance) were interpolated to display spatial
patterns (Björnsson and Venegas, 1997; Wilks, 2006) . We also used Observation Minus
Reanalysis (OMR) to test for possible local effects in temperature trends. The main
HELZ and LULC areas of interest (urban area, regenerated forest area, unregenerated
forest area, the rain forest reserve and the dry forest HELZ) were the focus of OMR
analysis. OMR analysis uses monthly temperature anomaly trend differences between
surface observations and upper air estimates from North America regional Reanalysis
(NARR) to detect changes in land surface conditions that may affect the near-surface
climate (Kalnay and Cai, 2003; Zhou et al., 2004; Frauenfeld et al., 2005; Lim et al.,

20
2008; Kalnay et al., 2006, Pielke et al., 2007b; Uppala et al., 2007; Nuñez et al., 2008,
Fall et al., 2009).
Geographic Information Systems (GIS) tools were used to select stations from
across the island and the areas of interest for a various analyses. In addition, GIS was
used to generate maps based on interpolated station data and to extract generated map
values for areas of interest for further statistical analysis.
2.4 Temperature Analysis Results And Discussion
2.4.1 Puerto Rico’s Intraregional Climate Variation
Holdridge Ecological Life Zones (HELZ) are based on temperature, humidity,
precipitation and elevation (Lugo et al., 1999) and although there are six HELZ in Puerto
Rico, three HELZ cover 98.5% of the island (Figure 2.5). Figure 2.5 also shows the
locations of the HCN stations used in this study; the HCN is a subset of the Cooperative
Station Network and includes stations that were selected on the basis of having the most
complete, long-term temperature records (Menne et al., 2008). Given that HELZ are
defined in part based on temperature, it is not surprising that temperature ratios and
differences between HELZ are distinct (Table 2.4), but it is interesting to note that the
magnitude of differences between HELZs is on the same order as differences between
urban and rural areas in Urban Heat Island (UHI) studies in the continental United States;
yearly average changes between urban and rural areas are 2.9 oC in U.S. continental UHIs
(Imhoff et al., 2010) while in tropical locations similar to Puerto Rico changes of around

21
2.0 oC are considered sufficient to qualify as an UHI effect (Velazquez-Lozada et al.,
2006, Murphy et al., 2011). Ecological context and seasonality is also important in the
determination of UHI intensity because different biomes respond differently to
impervious surfaces (Imhoff et al., 2010). Considering that differences in magnitudes of
≥ 2.0 oC are important, it becomes evident that any accurate LUCC analysis must
consider ecological context and control for microclimate variability, and in this study we
achieve this by using HELZ as an underlying classification scheme. Table 2.4
summarizes temperature characteristics for HELZ in Puerto Rico, presented as ratios and
differences from Puerto Rico overall averages. Analysis of variance (One Way ANOVA)
for temperatures across HELZ showed statistical differences between HELZs for most
decadal, seasonal and monthly time periods (Table 2.5).
A Geographic Information System (GIS) was used to create subsets of stations
with respect to the HELZs, 1992 and 2004 LULC maps. Table 2.2 details the area and
number of stations, Table 2.3 shows and maximum, average and minimum temperatures
seasonally and annually for all of these stations from all regions under study for the
period of analysis (1900-2007).
Considering 80% of the years as usual temperatures and 20% as extreme (<10%
and >10%) for Puerto Rico as a whole, the frequency of years with usual versus extreme
temperatures during the century for maximum, average, minimum temperatures followed
a consistent 80% usual temperatures to 20% extreme temperature distribution for the
island (Figs. 2.6, 2.7 and 2.8). Breaking up the temperatures by HELZ, we found that
Moist Forest frequencies were similar across maximum, average and minimum

22
temperatures. However the Wet Forest had a higher frequency of years with minimum
extremes while the Dry Forest had a higher frequency of years with maximum extremes.
Puerto Rico has undergone dramatic LUCC, over the past century mainly
characterized by rapid urban growth and development in combination with a large decline
in agricultural activities (Grau et al., 2003; Helmer, 2004). This has resulted in the
regeneration of forest in some areas that were formerly used for agriculture (Grau et al.,
2003) and the intense development of a coastal tropical city (San Juan) (Helmer, 2004).
Given local variability and statistically distinct life zones a main question addressed here
is whether there are differences in temperature changes related to LUCC (in particular
urbanization) that are distinct from differences between HELZ or, in other words, are
impacts of urbanization on temperature observable when evaluated against temperature
changes in non urban areas in the same HELZ.
2.4.2 HELZ Regional Statistical Analysis
We hypothesized that HELZs would have significantly different temperature
statistics, meaning that differences in temperatures across Puerto Rico can be explained
by HELZ as well as LULC. We found significant differences in wet season, dry season
and decadal average temperatures as function of HELZ at a 95% significance level or
above (Table 2.6). Monthly data shows higher variability as compared to the seasonal
and decadal datasets and therefore the data need to be assessed at different temporal
scales to identify regional differences. One-way ANOVA shows that HELZs are
significantly different from each other for most temperature measures and time periods
(Table 2.5) and this validates our use of HELZ as an important organizing structure

23
within which to examine LULC impacts. The Wet Forest was different from the other
HELZs in all temperature parameters and all time periods. However this was not the case
for all HELZ and all time periods. For example, the Moist Forest and Dry Forest showed
no statistically significant variation in monthly temperature by HELZ (α =0.05) meaning
that they are not different from each other, or that all months are the same when
comparing both. All maximum temperatures for the Dry and Moist Forests are
statistically similar. Minimum and average temperatures for the three main HELZs (Wet
Forest, Moist Forest and Dry Forest) are significantly different at the 95% (α = 0.05).
Average and minimum temperatures of the three sampled HELZs are significantly
different; the Dry Forest and Moist Forest maximum temperatures were statistically
similar (not significant differences). This suggests that it is important when comparing
urban with rural stations to determine if they are in the same HELZ. If not, then
temperature differences will reflect a combination of LULC differences and HELZ
differences.
We also found that HELZs have significantly different temperature variability, as
indicated by the Coefficient of Variation, CV, across monthly, seasonal and decadal data.
The three HELZ regions all had highest average monthly temperature variability during
March (dry season) and lowest during September (wet season), and had highest decadal
variability during the 1950s and lowest decadal variability during the 1940s. The Wet
Forest had the highest average monthly temperature and decadal average variability while
the Dry Forest had the lowest monthly and decadal average variability indicating that
temperatures are more consistent in the warmest regions while the colder regions have a
wider range of temperatures.

24
2.4.5 Land Use / Land Cover (LULC)
Once the existence of HELZ variability was established we addressed the
question of whether there were temperature differences between the urban and non-urban
landscapes within each HELZ using Analysis of Variance (ANOVA) and Student’s T-test
where appropriate.
2.4.5.1 ANOVA of Station Temperature Data
We tested for significant differences between urban and non-urban sites in the
context of differences between HELZ regions and different approaches to selecting
stations that were defined as “urban”. We also compared regenerated and unregenerated
Wet Forest areas. The patterns of statistical differences in the results have the following
key features (Table 2.7):
1. Dry Season, Wet Season and Decadal minimum and maximum temperatures are
significantly different between urban and rural areas, and this holds for almost all
alternative ways of selecting urban stations.
2. Dry Season, Wet Season and Decadal average temperatures are not significantly
different between urban and rural areas, except for the case where urban areas are
selected based on the 2004B land cover selection method.
3. Minimum, maximum and average temperatures are not significantly different
between urban and rural areas in almost all cases when monthly data are used.
4. Regenerated and Unregenerated Wet Forest areas are significantly different for Dry
Season minimum, maximum and average temperatures. They are also significantly

25
different for wet season minimum temperature, and for decadal minimum and
average temperature.
Differences in minimum and maximum temperatures between urban and rural
areas are the most consistently statistically significant. This suggests that focusing on
average temperatures may not capture the most important impacts and relationships. For
example, in a case where one area has a higher minimum and a lower maximum than
another area, there are large differences in minimum and maximum, but because the
increase in the minimum offsets the decrease in the maximum, the average may have
very little change. For example urban average annual temperatures (U1992A) have a
minimum value 1.22 oC higher than comparable non-urban sites (MFNU) and a
maximum value that is 1.35 oC lower. These compensating changes help to explain why
the difference in the average temperature for the U1992A to MFNU is only 0.06 oC.
Monthly temperatures showed the least difference between urban and non-urban
sites. This is expected because of the high variability in the monthly dataset. Meanwhile
seasonal differences are significant primarily because each season groups the highest and
lowest temperatures in the yearly cycle.
The large differences between Urban 2004B and the other urban selections shows
that the method used to select which stations are “urban” and the specific stations
included in each selection can have a major influence on the results, especially when the
number of stations is small. Despite the considerable number and density of temperature
stations in Puerto Rico for its size, a maximum of 9 stations (16%) and just 4 (7%) in the
main city were defined as urban, thus the inclusion or exclusion of particular stations

26
with extreme values can have a large impact in averaged temperature computations and
so careful decision making and objective criteria for inclusion or exclusion become
important.
2.4.5.2 PCA/EOF Analysis Results
EOF is a useful tool for characterizing long weather data series by looking for
dominant modes that allows for a classification of climate patterns. EOF was used here
to examine the spatial patterns of trends in the structure of temperature datasets. The aim
was also to examine if the EOF-based spatial structures align with the land use land cover
boundaries and thus assess the control on some aspects of this structure. We assumed that
the spatial pattern of the dominant mode would match the general pattern of types and
scales of LULCC. EOF first modes results explained 60% to 77% of the temperature
variation while the second mode explained 4% to 7% of the variation (Table 2.8).
Average temperature yielded the largest first mode value followed by maximum
temperature while the lowest first modes resulted for minimum temperature first mode
with the lowest value.
The spatial pattern of the first mode (Figs. 2.9, 2.10 and 2.11) reflected results
matching the most notable spatial patterns of LUCC in Puerto Rico, such as urban heat
island effects represented by higher EOF values in the heavily urban San Juan area and
the rural land use change (forest regeneration) of the Regenerated Wet Forest. Minimum
and Average Temperature EOF maps were consistent with our expectations for Heavy
Urban to have greater warming than the Wet Forest. However, the largest warming
detected was not from the heavily urban San Juan area, and surprisingly the maximum

27
temperature EOF indicated less warming in the San Juan area than other areas around the
northwest of Puerto Rico and east of San Juan, perhaps reflecting increased development
(Figs. 2.9, 2.10 and 2.11). The stations with higher century EOF’s were evenly located
between the Regenerated Forest, the Urban Area and the Dry Forest. Tables 2.9 and 2.10
quantify the number of stations that registered the top and bottom 10% temperatures and
EOFs. Stations at the Regenerated Forest dominated the century maximum temperatures
EOF’s (Table 2.9) and lowest temperatures (Table 2.10). Urban stations unexpectedly
dominated the lowest temperatures century EOF (Table 2.10).
2.4.5.3 Station Temperature Trends
Temperature trend analysis for the places considered most important because of
their dramatic LUCC, or that represent climate opposites, provides insight into
temperature patterns related to LUCC over time. The trends analysis was useful to
indicate sites with the most rapid change in temperature, and thus the largest potential
impact of LUCC. Average and median temperatures, based on all stations in Puerto Rico,
have annual trends for minimum, average and maximum temperatures of 0.01 oC / year
between 1900 and 2007, but with the higher rates of increase in more recent time periods
(Table 2.11); The period 1970-2007 has the highest yearly temperature increases among
the selected periods. The 1900-2007 increases in temperatures were largest at Urban and
Regenerated Forest stations (Table 2.12), the locations with the biggest LUCC. The Dry
Forest has the largest number of stations with positive trends in maximum, average, and
minimum temperature values, followed by Urban then Regenerated Forest stations.
Stations from the Dry Forest HELZ had some of the largest temperature increases,

28
however this is not a location of major LUCC. Nonetheless, abandoned, irrigated
cropland dominates this location and has been frequently overlooked in local climate
studies.
Stations with the top temperature trends are found in Urban, Regenerated Forest
and Dry Forest (Table 2.12), and the highest trends were from maximum and minimum
temperatures in the locations with most dramatic LUCC. However, more urban stations
had very low yearly temperature trends than high yearly temperature trends suggesting
increased variability or an increased amplitude in temperature range at urban stations.
Most stations registered positive or increasing trends for minimum, average and
maximum temperatures for the century (Figs. 2.12, 2.13 and2.14). However, minimum
temperatures (Fig 2.14) have the highest number of stations registering negative or
decreasing yearly trends.
For the 1970 to 2007 warming period most stations yielded yearly trends an order
of magnitude higher than those for the entire century. Overall, 18%, 27% and 57% of
stations had minimum, average and maximum temperatures respectively that increased at
rates > 0.01 oC / year (0.1
oC / decade), but for the 1970 to 2007 period these increased to
95%, 100% and 95% of stations respectively. Thus during the 1970 to 2007 period
minimum, maximum and average temperatures all had higher rates of increase, and the
change was most marked for station average and minimum temperatures.

29
2.4.5.4 Temporal and Spatial Frequency Analysis
Frequency Analysis allows the identification of patterns and helps in the detection
of internal variability. Here we focus on patterns associated with 80% usual versus the
10% higher and 10% lower extreme years distribution (Figs. 2.6, 2.7 and 2.8). This
allows a relative comparison of patterns in each HELZ in terms of the frequency of usual
versus extreme temperatures or trends. Temperature magnitudes and trends were
analyzed for stations of each HELZ using number of years for the temporal analysis and
number of stations for the spatial analysis, exceeding the base usual values.
The highest maximum, average, and minimum temperatures occur in the Dry
Forest, and the Urban areas have the next highest minimum and average temperatures.
The lowest maximum, average, and minimum temperatures are found in the Regenerated
Wet Forest and Rain Forest Reserve stations, and all the lowest temperatures on the
island consistently occur in stations from the Wet Forest HELZ. The Dry Forest HELZ
dominated higher extreme temperatures (>90%) followed by the Moist Forest HELZ
while the Wet Forest HELZ dominated lower extreme temperatures (<10%) (Figs. 2.6,
2.7 and 2.8). The Wet Forest stations had the fewest extreme values while the Moist
Forest dominated with the most stations registering the largest percentage of average and
maximum temperature trends (Figs. 2.15, 2.16 and 2.17). Urban stations consistently had
a larger percentage of years registering higher extreme temperatures than the Moist
Forest HELZ where urban stations are located (Fig 2.18). This observation suggests that
Moist Forest warming maybe related to the higher extreme values that urban stations are
contributing. For the OMR period the Dry Forest registered the largest percentage of
years with higher extreme temperatures (Fig. 2.19).

30
2.4.5.5 Observation Minus Reanalysis (OMR)
We used OMR as a method to detect, evaluate and quantify the magnitude of
impact of LUCC in the tropical maritime island environment. Thirteen stations were
selected for OMR analysis representing LULC differences in Puerto Rico from urban
regions to forest; the 2004 San Juan urban area, the 1992 urban area, the Regenerated
Wet Forest and Unregenerated Wet Forest. At the time of this study there were no
reanalysis database grids available for maximum and minimum temperature, so OMR
analysis was limited to average temperatures.
The station (FILNET) average and median yearly trend (0.02 oC / year) indicates
a higher surface temperature warming trend than the average NARR trend (0.005 oC) for
the OMR selected stations. This higher rate of warming for ground observations
(FILNET) than for the high atmosphere reanalysis grids (NARR) suggests that local
influences are driving local temperatures in addition to larger-scale changes. Stations
with the higher OMR trends were from the Regenerated Wet Forest and these values
were higher values than those from stations in the San Juan Urban region where UHI
have been detected (Table 2.14). This suggests that land processes associated with forest
regeneration in the Wet Forest are causing more intense than that occurring in the urban
region.
However, the high OMR trends in the Unregenerated Wet Forest stations are
counterintuitive because no dramatic LULCC has been documented at this location.
Because the OMR method is expected to detect LULCC, we expected to get the highest
trend values at the San Juan urban area stations and the Regenerated Wet Forest where
we know LULCC has occurred. For the OMR period (1979-2005), the Wet Forest shows

31
a different pattern than other locations in Puerto Rico. During this period all evaluated
HELZ and LC, except for the Wet Forest, have a notably higher frequency of years
exceeding the 10th
percentile magnitudes for average temperature compared to the
century frequency (Figs 2.18 and2.19). However, the higher, OMR trends in the Wet
Forest maybe indicative of higher sensitivity to land change processes. Averaging and
computing the median for the selected stations for OMR, the Unregenerated Wet Forest
tops the urban area and the Regenerated Wet Forest. It should be noted that reanalysis
grids have small variability while surface stations have higher variability and trend range
so any station with high trends for the 1979-2005 period will drive OMR trends to higher
values, which seems to have happened here. However, to pinpoint the particular factors
affecting the values a more detailed analysis or additional studies are needed to determine
the source of the higher OMR trends, particularly in the virtually undisturbed
Unregenerated Wet Forest region.
Urban internal stations in San Juan yielded higher OMR trends than urban coastal
stations suggesting higher warming at the center of the city where the urban area is more
dense and a coastal urban cooling effect. This is represented by the urban station
SAN_JUAN_WSFO with the lowest FILNET trends and the only negative OMR in the
sampled stations. Another urban station (CAYEY_1_E), located far away from the San
Juan Urban area, had higher OMR values than all other more heavily urban stations.
Possible explanations for OMR scores of this urban station could be:
a) the ecological context of this particular urban station may be different than the rest
of the San Juan urban stations. Although the station in question falls in the same
Moist Forest HELZ as the other San Juan stations, it is located in a rural setting in

32
the central interior part of the island with higher elevation and more abundant forest
like vegetation than the other coastal urban stations.
b) the location of this particular urban station may have undergone more dramatic
LUCC than the other coastal urban stations which are in areas that underwent
development long ago or development rate has slowed, and thus the land use has
not undergone much change during the 1979-2005 OMR period.
c) a combination of a) and b)
Given the unexpected nature of some OMR results we are cautious about
extending them more broadly because of the small domain size, possible land sea breezes
that can affect reanalysis for the grid, and the possibilities that other factors beyond land
use may be affecting the local temperatures such as aerosols and station changes.
2.4.5.6 Spatial Analysis of Temperatures
Geographic Information System (GIS) tools were used for map generation and to
further assess urban impacts in areas where there were no local station data.
Geoprocessing tools (SPLINE) from ARC MAP 10 and 10.1 were used to interpolate
station temperature data and assess temperature patterns and changes related to urban and
non-urban areas in each HELZ. FILNET adjusted data (1900-2007) and PRISM raw data
(1963-1995) were independently processed for analysis as a baseline from an
independent method in the search for distinctive temperature patterns that may or may
not occur in both data sets.

33
FILNET maximum and minimum temperatures for the century have a wider range
than PRISM maximum and minimum temperatures ranges between 1963 and 1995 by
over 2 oC. However, while the difference between maximum temperatures in both time
periods is less than 1 oC, the difference between both minimum temperatures is over 2
oC.
This suggests that although maximum temperatures are very similar for both periods,
temperatures during 1963-1995 were warmer because of higher minimum temperatures.
PRISM maps were generated for a period of globally and locally increasing positive
temperature anomalies (warming pattern) while FILNET century data includes colder
temperatures. However FILNET and PRISM generated maps show high consistency in
several locations, particularly the warm coastlines and cooler sites at the mountainous
center of the island. Maps generated from both data sets were further processed with
GIS tools to extract temperature values from the areas of interest and to assess Urban
versus Non Urban temperatures at each HELZ. Average century data for all temperatures
from GIS generated maps for the three HELZ under study were all statistically different
(Table 2.15). In other words, the results of interpolated maps kept the expected
corresponding temperature ranges and magnitudes for each particular HELZ.
Despite the very small and scattered pattern of urban development in the Wet
Forest, this HELZ produced the highest urban to non-urban differences in temperatures
independent of the data set (FILNET or PRISM) (Table 2.16). There is a clear pattern in
the magnitude of urban to non-urban temperatures depending on the HELZ in which they
are located; the colder the HELZ the larger the magnitude of temperature differences
between urban versus non urban regions, conversely, the warmer the HELZ the smaller
the magnitude of temperature differences between urban versus non-urban. This is well

34
established for Maximum and Average temperatures, however, minimum temperatures in
the Moist Forest unexpectedly resulted with higher magnitude of temperature differences
than even the Wet Forest, suggesting an increase in temperature ranges from urban areas
in this particular HELZ (Figs. 2.20, 2.21, 2.22 and2.23).
Two tailed student’s t test from FILNET and PRISM GIS generated maps
extracted data confirms that all urban temperatures (maximum, average and minimum) in
all HELZs (Dry Forest, Moist Forest and Wet Forest) across the island are significantly
different from all non- urban temperatures at each corresponding HELZ (Table 2.17).
This indicates that urban development has increased all temperature magnitudes across
the whole island. This finding is remarkably important because it corroborated results
from two separate datasets (FILNET and PRISM) each generated by different methods
and covering differing time periods.
2.5 Findings and Conclusions
The role of land use and land use change related to urban development in
controlling temperatures in Puerto Rico was examined in several ways. Our work
showed that controlling for HELZ was important to avoid drawing erroneous conclusions
regarding temperature differences between urban and non-urban areas from stations that
might be in different regional settings represented by HELZs.
The most important findings were that, even though FILNET HCN 2 data were
adjusted in part to control for urban signals, urban versus non urban temperature
differences were detected with an ANOVA analysis of surface stations data from the
Moist Forest and t- tests of GIS interpolated data. The magnitude of the differences

35
between urban and non-urban areas are from around 0.5 oC to around 2
oC depending on
the HELZ but since they were found in adjusted data that was intended to suppress the
urban signal we expect the differences to be higher in raw data and so these represent
minimum estimates of the magnitude of urban effects. Stations in the main urban area of
San Juan (Moist Forest) had the most significant changes in maximum and minimum
temperatures while average temperature differences were not statistically different,
however, analysis of GIS generated data did yield statistically significant differences in
average temperatures between Urban and Non Urban across the island. Urban land
use/land cover changed maximum and minimum temperatures in Moist Forest stations,
and minimum temperatures were impacted the most. This is illustrated in the urban
versus non-urban maximum temperature values in Table 2.3: for the 2004 Land Cover
Map data, non-urban area values are higher than the urban area, but part of this is because
higher maximum temperature values occur in the southwest of the island where several
non urban stations are located thus increasing the average values of maximum non-urban
temperatures. However, urban average minimum temperatures in the main city of San
Juan were higher than non-urban minimum temperatures. Also, forest regeneration in
the Wet Forest had a larger impact on maximum temperatures than urbanization in the
Moist Forest. Analysis of GIS interpolated data from climate stations showed that all
temperatures (maximum, average and minimum) are impacted by urban development
across the entire island, regardless of HELZ. Also colder-wetter regions such as the Wet
Forest are more impacted by urban development than warmer dryer regions like the Dry
Forest, regardless of the extension of urban development.

36
The EOF method produced results more consistent with expectations that
locations with higher LULCC would have warmer locations and positive trends. The
trends analysis showed the highest trends were detected in maximum and minimum
temperatures from the locations with most dramatic LUCC in Puerto Rico. The OMR
method results showed highest trends for the Regenerated Wet Forest but it was also
surprising to find a very high trend in a location with no documented LULCC. Overall,
the set of techniques and methods used indicate that urban land use change does impact
local temperatures across Puerto Rico.
Over the last century temperatures in Puerto Rico increased, with rates averaged
for all stations in Puerto Rico of 0.67 oC/year in minimum temperature, 1.11
oC/year in
average temperature, and 1.51 oC/year in maximum temperature. Changes over the last
century show distinct patterns related to Puerto Rico’s HELZ, but temperatures produced
warming trends in all sampled HELZs (Dry Forest, Moist Forest and Wet Forest).
Analysis of changes in temperature stations between Urban versus Non Urban areas from
Puerto Rico’s major urban setting in San Juan found significant differences in minimum
and maximum temperatures between Urban and Non Urban, but found no significant
differences in average temperatures. Differentiating between Land Use and Land Cover
was found to be important in this study as we assessed the impact of differentiating
between remote sensing based classification and a classification that also included local
knowledge of land use. Some results were sensitive to the selection method, suggesting
that definitions of urban areas need to be considered carefully to avoid having
conclusions dependent on selection method. This becomes particularly important when
the number of stations is small.

37
Holdridge Ecological Life Zones are related to natural landscapes and can be a
useful tool in studies of LUCC impacts on climate. HELZ’s must be considered when
comparing urban to rural temperature stations because some HELZs have significantly
different temperatures and not accounting for this may lead to result misinterpretation and
spurious conclusions. The highest temperatures in Puerto Rico are in the Dry Forest
HELZ and the lowest temperatures are in the Wet Forest, but surprisingly the warming
trends in these HELZ are comparable to those in urban regions.
Limitations of this work included data accuracy for map and station locations and
climate data. As with any study that relies on a small number of data sites, the statistical
results were sensitive to the inclusion or exclusion of individual stations for the HELZ’s
and urban regions. Although Puerto Rico has a great density of temperature stations,
unfortunately only a handful (a maximum of 17% for the 1992 map) are located in urban
developed areas, making the inclusion or exclusion of stations as “urban” an important
issue.
As no urban stations from the Dry Forest and the Wet Forest were available, the
urban station analysis was limited to the Moist Forest. In addition, it is unfortunate that
no current NARR grids allow for OMR analysis for maximum and minimum
temperatures for urban and non-urban areas. At least at this stage, OMR should be
complemented with other methods such as ANOVA.
Station location and GIS selection method play a big role in determining where
the LULC categories are located and impact the results of the statistical analysis and the
conclusions. Stations that lie close to HELZ borderlines could be considered on one
HELZ or another depending on its coordinates and map accuracy. Therefore, station

38
placement historic documentation could become essential for future systematic data
adjustment.
2.5.1 Future Suggestions
The potential importance of the distinction between Land Use and Land Cover
has been highlighted here and may be important for future studies in Puerto Rico and
elsewhere. To advance the analysis further in Puerto Rico, urban stations representing
the Wet Forest and Dry Forest HELZ are needed. Varying spatial resolution and LULC
classes between maps makes explaining patterns and results problematic, so it would be
helpful to standardize LULC classes for Puerto Rico across maps in future work. More
detailed studies of Non Urban LULC temperatures may further increase understanding of
temperature patterns and impacts that may be important for land managers, and more
detailed subdivisions of urban land use into residential, industrial and commercial may
help in refining our understanding of the details of urban impacts.
Performing OMR on more stations and including maximum and minimum temperatures
is important as urban impacts are expected to be reflected in these temperatures;
unfortunately current reanalysis datasets only provide average temperatures. Future
comparison of raw data versus FILNET data is critical to assess how the use of the
algorithm may change the conclusions of this work. Also, using remote sensing images
to estimate ground temperatures may allow spatial coverage and reduce uncertainty for
data adjustment.

39
2.5.2 Acknowledgements
We thank Dr. Vose and Dr. Williams at NOAA for providing station temperature
adjusted data for 1900-2007 from 57 stations in Puerto Rico. Also thanks to Olga Ramos
from the Institute of Tropical Forestry for providing HELZ and other local GIS data and
Dr. Chris Daly for providing PRISM GIS data.
2.6 References
Arya, P. S. (2001). Introduction to micrometeorology (Vol. 79). Access Online via
Elsevier.
Björnsson, H., and S. A. Venegas, (1997): A manual for EOF and SVD analyses of
climatic data. CCGCR Rep. 97-1, 52 pp.
Chinea, J. D., & Helmer, E. H. (2003). Diversity and composition of tropical secondary
forests recovering from large-scale clearing: results from the 1990 inventory in Puerto
Rico. Forest Ecology and Management, 180(1), 227-240.
Comarazamy, D. E., González, J. E., Luvall, J. C., Rickman, D. L., & Mulero, P. J.
(2010). A land-atmospheric interaction study in the coastal tropical city of San Juan,
Puerto Rico. Earth Interactions, 14(16), 1-24.
Daly, C., E.H. Helmer, and M. Quinones. (2003). Mapping the climate of Puerto Rico,
Vieques, and Culebra. International Journal of Climatology, 23: 1359-1381.
Daniel, Wayne W. (1998). Biostatistcs: A Foundation for Analysis in the Health
Sciences. Seven Edition. Jonh Wiley and Sons, Inc.
Ezber, Yasemin, Omer Lutfi Sen, Tayfun Kindap and Mehmet Karaca. (2007). Climatic
effects of urbanization in Istanbul: a statistical and modeling analysis. Int. J. Climatol.
27: 667–679 (2007)
Fall, S., Niyogi, D., & Semazzi, F. H. (2006). Analysis of mean climate conditions in
Senegal (1971-98). Earth Interactions, 10(5), 1-40.
Fall Souleymane, Niyogi Dev, Gluhovsky Alexander, Pielke Roger A. Sr, Kalnay
Eugenia and Rochon Gilbert. (2009). Impacts of land use land cover on temperature
trends over the continental United States: assessment using the North American
Regional Reanalysis. Int. J. Climatol. (2009). DOI: 10.1002/joc.1996

40
Gosset, William S. “Student”. (1908). “The Probable Error of a Mean.” Biometrika 6
(1908): 1-25. http://www.jstor.org/stable/2331554
Gould, W., Alarcón, C., Fevold, B., Jiménez, M.E., Martinuzzi, S., Potts, G., Solórzano,
M., and Ventosa, E. (2007). Puerto Rico Gap Analysis Project – Final Report. USGS,
Moscow ID and the USDA FS International Institute of Tropical Forestry, Río Piedras,
PR. 157 pp. and 8 appendices
Grau, H. R., Aide, T. M., Zimmerman, J. K., Thomlinson, J. R., Helmer, E., & Zou, X.
(2003). The ecological consequences of socioeconomic and land-use changes in
postagriculture Puerto Rico. BioScience, 53(12), 1159-1168.
Han, J. Y., Baik, J. J., & Khain, A. P. (2012). A numerical study of urban aerosol impacts
on clouds and precipitation. Journal of the Atmospheric Sciences, 69(2), 504-520.
Helmer E. H., Ramos O., Del M. López, T., Quiñones M., And Diaz W. (2002). Mapping
the Forest Type and Land Cover of Puerto Rico, a Component of the Caribbean
Biodiversity Hotspot. Caribbean Journal of Science, Vol. 38, No. 3-4, 165–183, 2002
Helmer, E.H. (2004). Forest conservation and land development in Puerto Rico.
Landscape ecology. Vol. 19 (2004): Pages 29-40
Hogg, R.V., Tanis, E. (1997). Probability and Statistical Inference, Fifth Edition.
Prentice-Hall, Inc.
Imhoff Marc L., Zhang Ping, Wolfe Robert E. and Bounoua Lahouari. (2010). Remote
sensing of the urban heat island effect across biomes in the continental USA. Remote
Sensing of Environment 114 (2010) 504–513.
IPCC Working Group II. (2007). Fourth Assessment Report. Climate Change 2007:
Impacts, Adaptation and Vulnerability.
Jauregui Ernesto and Romales, Ernesto. (1996). Urban Effects on Convective
Precipitation In Mexico City. Atmospheric Environment Vol. 30, No. 20, pp. 3383-3389
Ji-Young Han and Jong-Jin Baik. (2008). A Theoretical and Numerical Study of Urban
Heat Island–Induced Circulation and Convection. American Meteorological Society
Vol.65 June 2008. 1859-1877.
Jury, Mark; Malmgren, Bjorn A. and Winter Amos’. (2007). Subregional precipitation
climate of the Caribbean and relationships with ENSO and NAO. Journal of
Geophysical Research, Vol. 112: 1-10.
Kalnay, E., and M. Cai, (2003): Impact of urbanization and land-use change on climate,
Nature, 423, 528– 531

41
Laerd Statistics. (2013). Independent T-Test Using Spss. [Statistics Website]. Retrieved
From Https://Statistics.Laerd.Com/Spss-Tutorials/Independent-T-Test-Using-Spss-
Statistics.Php
Lopez-Marrero and Villanueva- Colón. (2006). Atlas Ambiental de Puerto Rico.
Conservación de Recursos, Capitulo 11. p 128. Editorial de la Universidad de Puerto
Rico
Lugo, Ariel E., Sandra L. Brown, Rusty Dodson, Tom S. Smith, and Hank H. Shugart.
(1999). The Holdridge Life Zones of the conterminous United States in relation to
ecosystem mapping. Journal of Biogeography, 26:1025-1038.
Oleson, Keith. (2012). Contrasts between urban and rural climate in CCSM4 CMIP5
climate change scenarios. Journal of Climate, March 2012, Vol. 25, No. 5 : pp. 1390-
1412
Malmgren B, Winter A, Chen D. (1998). El Niño–Southern Oscillation and North
Atlantic Oscillation control of the Puerto Rico climate. Journal of Climate 11: 2713–
2717.
Malmgren B, Winter A. (1999). Climatic Zonation in Puerto Rico Based on Multivariate
Statistical Analysis and an Artificial Neural Network. Journal of Climate, 12(4): 977–
985.
Menne, M. J., Williams Jr, C. N., & Vose, R. S. (2009). The US Historical Climatology
Network monthly temperature data, version 2. Bulletin of the American Meteorological
Society, 90(7), 993-1007.
Mesinger F, DiMego G, Kalnay E, Mitchell K, Shafran PC, Ebisuzaki W, Jovic D,
Woollen J, Rogers E, Berbery EH, Ek MB, Fan Y, Grumbine R, Higgins W, Li H, Lin
Y, Manikin G, Parrish D, Shi W. 2006. North American regional reanalysis: A long-
term, consistent, high-resolution climate dataset for the North American domain, as a
major improvement upon the earlier global reanalysis datasets in both resolution and
accuracy. Bulletin of American Meteorology Society 87: 343–360.
Montgomery, D. C., & Runger, G. C. (2010). Applied statistics and probability for
engineers. Wiley. com.
Moran, J. M. (2002). Online weather studies. American Meteorological Association.
Murphy, D. J., Hall, M. H., Hall, C. A., Heisler, G. M., Stehman, S. V., &
Anselmi‐Molina, C. (2011). The relationship between land cover and the urban heat
island in northeastern Puerto Rico. International Journal of Climatology, 31(8), 1222-
1239.

42
Pielke R.A, J . Adegoke, A. Beltran N-Przekurat, C. A. Hiemstra, J . Lin, U. S. Nair, D.
Niyogi and T. E. Nobis. (2007). An overview of regional land-use and land-cover
impacts on rainfall Tellus, 59B, 587–601.
Sincich, Terry. (1990). Statistics by Example. Fourth Edition. Dellen Publishing
Company
Uppala S., A. Simmons, D. Dee, P. Kållberg and J.-N. Thépaut. (2007). Atmospheric
Reanalyses and Climate Variations. Climate Variability and Extremes during the Past
100 Years. Volume 33. 103-117
Velazquez-Lozada A, Gonzalez JE, and Winter A . (2006). Urban Heat Island Effect
Analysis for San Juan, Puerto Rico, Journal of Atmospheric Environment, 40 (9): 1731-
1741.
Wigley, T. M., Santer, B. D., andLanzante, J. R. (2006). Appendix A: Statistical issues
regarding trends. Temperature trends in the lower atmosphere: steps for understanding
and reconciling differences, 129-139.
Wilks, Daniel, S. (2006). Statistical Methods in the Atmospheric Sciences, Volume 91,
Second Edition

43
CHAPTER 3 THE IMPACTS OF LAND USE / LAND COVER CHANGES ON
PRECIPITATION PATTERNS IN PUERTO RICO
3.1 Abstract
Water is critical for life and the sustaining of natural and managed ecosystems,
and precipitation is a key component in the water cycle. To understand the controls on
long-term changes in precipitation characteristics for scientific and environmental
management applications it is necessary to examine both the impacts of global climate
change on local and regional precipitation, and whether local land use and land cover
change (LUCC) have played a significant role in changing precipitation. For the small
tropical island of Puerto Rico where maritime climate is dominant we used long-term
precipitation and land use and land cover data to assess whether there were any detectable
impacts of LUCC on precipitation over the past century. Particular focus was given to
detecting and quantifying impacts from the urban landscape on mesoscale climates across
Puerto Rico. We found no statistical evidence for differences between average monthly
precipitation from urban and non-urban areas directly from surface stations but GIS
generated maps analyzed data did produced statistical differences (α = 0.05) in yearly
average total precipitation and its corresponding trends across the island. In addition, we
found that generally precipitation in Puerto Rico has been decreasing for the entire
century because of the sharp decrease in periods (months or years) with low rain.

44
However precipitation trends at particular stations contradict synoptic-scale long-
term trends, which suggests that local land use/land cover effects are driving precipitation
at particular locations.
3.2 Introduction
As understanding and awareness of global climate changes have become more
widespread, the local context of climate change has become an increasingly important
issue for local governments, communities and institutions concerned about water supply,
extreme climate events, and the economic and social consequences of changes in
seasonal climate conditions and variability. In addition to large-scale global and regional
drivers, there is an increasing body of literature that demonstrates that land use / cover
changes (LUCC) associated with anthropogenic activities such as urbanization and
deforestation can impact local climates (Chase et al., 2000; Pielke et al., 2002, Kalnay
and Cai, 2003; Niyogi et al., 2004; Vose et al., 2004; Feddema et al., 2005; Christy et al.,
2006; Mahmood et al., 2006; Ezber et al., 2007; Pielke et al., 2007; Hale et al., 2008,
Bonan, 2008; Findell et al.,2009; Pitman et al., 2009).
The effects of urbanization on local climate were first observed in Europe
centuries ago (as cited in Velazquez-Lozada et al., 2006) leading to the recognition of
what is now known as the Urban Heat Island (UHI) effect. Although there has been
considerable interest in evaluating temperature differences between urban areas and their
rural surroundings (Jauregui and Romales 1996, Ezber et al., 2007, Oke, 2009, Imhoff et
al., 2010, Murphy et al., 2011; Chapter 2), studies of variations in precipitation due to
urbanization (Neelin et al., 2006; Niyogi et al., 2011) or other changes in LULC such as

45
deforestation / afforestation are limited (Pielke et al., 2007). Deforestation can result in
albedo increases, reduction of evapotranspiration (which changes sensible and latent heat
partitioning), and rainfall interception (van der Molen, 2002). Such changes resulting
from deforestation have been linked to reductions in cloud cover and cloud formation
height that could reduce precipitation (van der Molen, 2002, Pielke et al., 2007). On the
other hand, afforestation (the creation of forests in places where they did not previously
exist), although considered desirable in some respects, may lead to unintended results
depending on local conditions and processes (Pielke et al., 2007). This reinforces the
importance of studying climate responses to LUCC in a variety of environmental settings.
Much of the existing work examining the impacts of LUCC on local climates has
focused on mid latitude continental sites. However the complex dynamics of LUCC-
climate mechanisms vary from place to place and from land cover to land cover (Pielke et
al., 2007). Further, it is known that similar land cover changes induce different climate
feedbacks at different latitudes (Claussen et al., 2001). There is comparatively little
climate research in tropical settings and on small tropical islands (Van der Molen, 2002,
Fall et al., 2006). Such work is particularly challenging because of a typical scarcity of
long-term data and low data densities (Fall et al., 2006). Further, the traditional coarse
resolution grids designed for climate assessment in continental settings, including
generalized assumptions of similar vegetation and land cover types, are not well suited
for studying the scale and heterogeneity of small regions. Yet LUCC may be an
important component of climate change on small tropical islands, particularly given
large-scale historical vegetation changes associated with agricultural transitions and rapid
urbanization, including coastal development related to tourism. However the weather and

46
climate of tropical islands is also affected by strong maritime influences as well as
synoptic scale phenomena such as El Niño and the North Atlantic Oscillation.
Fortunately, the existence of long-term databases and a relatively high density of
observation stations in Puerto Rico may provide unique opportunities to assess climate
variations on a small tropical island and to detect and isolate any regional drivers of local
climate conditions. A variety of climate studies have been undertaken in Puerto Rico
addressing temperature regionalization (Ewel and Whitmore, 1973; Daly et al., 2003),
precipitation regionalization (Ewel and Whitmore, 1973; Carter and Elsner, 1996; Carter
and Elsner, 1997; Malmgren and Winter 1999; Daly et al., 2003; Jury et al., 2007),
rainfall classification (Pagán-Trinidad, 1984; Carter and Elsner, 1996; Ramírez Beltrán,
2007), regional synoptic influences (Malmgren et al., 1998), tropical storm patterns
(Nyberg et al., 2007), urban heat islands (Velazquez-Lozada, 2006; Murphy et al., 2011)
and using observation and numerical experiments (Velazquez-Lozada, 2006;
Comarazamy and González, 2008; Murphy et al., 2011) (Table 3.1). The work presented
here characterizes precipitation patterns in Puerto Rico and provides a first attempt to
assess in detail whether precipitation changes reflect variations related to local land use
and land cover changes. We discuss how global and regional synoptic phenomena
influence Puerto Rico’s climate and then analyze a century of data with a range of
methods to test hypotheses relating LUCC to precipitation changes and differences.
3.2.1 Study Area
Puerto Rico is the smallest of the Greater Antilles located at 18o N latitude and
66o W longitude in the eastern part of the Caribbean basin, and one of the world’s

47
biodiversity hotspots (Helmer et al., 2002). Puerto Rico is 160 km long by 50 km wide
and includes several smaller islands (Gould et al., 2007). The island has a Central
Mountain Range running east-west, the Luquillo Mountains in the northeast and karst
topography dominates in the northwest. Fifty-three percent of the island’s terrain is
mountainous, 25% are plains and 20% hills (Gould et al., 2007). Wetter regions occur on
the northern side of mountains that shield the southern drier region from Atlantic
moisture. Precipitation in Puerto Rico shows a yearly cycle with a bimodal distribution
(two maxima) peaking first in May as the wet season starts and then a second and biggest
peak in October-November, showing consistency with patterns in the Caribbean Basin
(Jury et al., 2007; Jury, 2009). Mean annual temperatures range from 22 ºC to 25 ºC.
(Gould et al., 2007). Six distinctive Holdridge Ecological Lifezones (HELZ; Holdridge,
1967) are found in Puerto Rico (HELZ are defined by humidity, annual precipitation and
potential evapotranspiration) ranging from Rain Forest (precipitation over 4000 mm/year)
to Dry Forest (precipitation below 900 mm/year) (Gould et al., 2007); however 99% of
the island is covered by Moist Forest, Dry Forest and Wet Forest HELZ (Figure 3.1).
Seasonal temperature trends and long-term trends in mean annual temperature in Puerto
Rico generally track equivalent trends in Global Land and Sea Surface Temperatures
(Chapter 2).
Pagán-Trinidad (1984) identified several major forcings for precipitation in
Puerto Rico that are a function of season and location:
• Orographic – related to mechanical uplift of air caused by mountains. Mostly
associated with persistent easterly Trade Winds in eastern Puerto Rico during
the Dry Season.

48
• Convection – caused by differential land heating, including triggering by urban
landscapes
• Tropical Systems – easterly waves and synoptic scale systems bring
precipitation for all or most of the island, especially during Hurricane season
(July- November)
• Cold fronts – westerly systems from northern latitudes dominate western Puerto
Rico during late Wet Season and Dry Season
This basic classification is useful for understanding the primary synoptic settings
for precipitation episodes that underlie the spatial and temporal variations in precipitation
discussed in this study. In addition, other land biological, chemical and physical features
or processes can affect variables such as temperature, humidity, surface roughness and
aerosols that are related to precipitation. Temperatures affect vertical velocity and
convective potential related to cloud formation and rain intensity. Aerosols affect water
droplet formation and also cloud formation potential. Surface roughness can increase
convergence and cloud formation potential inducing local precipitation. Land processes
such as evapotranspiration, energy fluxes and cloud formation can also drive local
precipitation. Evapotranspiration, water content and humidity affect the availability of
water for cloud formation.
3.2.2 Previous Precipitation Studies in Puerto Rico
Most long-term studies of Puerto Rico’s climate have used a limited number of
stations, because relatively few stations have a long-term record (Malmgren et al., 1998;
Larsen 2000), while shorter-term studies make use of the fact that more stations have

49
data available for specific shorter periods, especially since 1960 (Ray 1933; Pagán-
Trinidad 1984; Carter and Elsner, 1996, 1997; Malmgren and Winter 1999;
Comarazamy, 2001; Van der Molen, 2002; Daly et al., 2003; Harmsen et al., 2009;
Ramírez-Beltrán et al., 2007; Jury et al., 2007, Comarazamy and González, 2008; Jury
and Sanchez, 2009). Long-term studies suggest that precipitation has been decreasing in
the Caribbean since the 1970s and that droughts in Puerto Rico are periodic (Larsen,
2000). Some studies predict that global warming should result in an increase in negative
precipitation anomalies during the summer (June-August), increased dry season duration
and more frequent heavy rain events in the Caribbean (Angeles, et al., 2006; Neelin et al.,
2006; Harmsen et al., 2009). More generally, rainfall in most subtropical areas, including
the Caribbean, is projected to decline by around 20% over the next 100 years (Jury,
2009). Other studies suggest that hurricane frequency in the Caribbean is returning to a
long-term average level instead of increasing due to global warming (Nyberg et al., 2007).
3.2.2.1 Precipitation Studies Related to LULC in Puerto Rico
Observational as well as computer-modeling studies have been used to assess
impacts of LULC on Puerto Rico’s precipitation. Pagán-Trinidad (1984) assessed
precipitation origin and rain intensity variation across different landscapes of the island,
including urban settlements, and attempted to classify different rainfall origins and
associate them with island regions and landscapes. More recently, climate models and
numerical experiments have focused primarily on the impacts of urbanization on
meteorological variables around San Juan (Comarazamy, 2001; Comarazamy and
González, 2008; Comarazamy et al., 2010) and on the impacts of coastal deforestation

50
(Van der Molen, 2002). Comarazamy et al. (2010) identified localized precipitation
increases caused by urban effects from San Juan. However these modeling studies have
been limited primarily to validation efforts and have large errors and low accuracy for
urban areas (Comarazamy, 2001; Comarazamy and González, 2008).
3.2.2.2 Rainfall Mapping and Regionalization Studies
Several studies have attempted to map precipitation around the island or the
Caribbean basin using a variety of methods and techniques (Table 3.1). Ewel and
Whitmore (1973) used long-term station data, vegetation characteristics and forest types
to define climate provinces for Puerto Rico. Carter and Elsner, (1996, 1997), used factor
analysis with Partially Adaptive Classification Trees to regionalize precipitation.
Malmgren and Winter (1999) combined artificial neural networks with Principal
Components Analysis (PCA) to map precipitation regions in Puerto Rico. Unfortunately,
no stations from the western half of Puerto Rico were included in the study, and this is
where both the driest region and one of the wettest regions of the island are located.
Meanwhile, Jury et al. (2007) used the same method to regionalize rainfall for the
entire Caribbean basin. An alternative approach, Parameter-elevation Regressions on
Independent Slopes Model (PRISM) used elevation models, upslope exposure to winds
carrying moisture, distance to the coastline weather station data and physical parameters
for climate mapping simulation (Daly et al., 2003). The work reported in Daly et al.,
2003 was the most recent attempt to map the climate (temperature and precipitation) of
Puerto Rico using modern sophisticated methods based on natural landscape properties,
but not LULC features.

51
3.2.2.3 Subregional Precipitation Zones and the Impacts of ENSO and NAO
Several studies have suggested the existence of sub-regional precipitation zones
or clusters based on rain patterns around the Caribbean. Puerto Rico is consistently
placed in the southeastern cluster, characterized by bimodal seasonal precipitation with
80% of the precipitation falling during summer (May – December) (Jury et al., 2007).
Two major regional atmospheric phenomena are known to have an important influence
on the Caribbean climate and Puerto Rico: El Niño Southern Oscillation (ENSO) and the
North Atlantic Oscillation (NAO) (Malmgren et al., 1998) (summarized in Table 3.2).
According to Malmgren et al. (1998) ENSO has no observable effects on Puerto Rico’s
yearly precipitation. Seasonally, ENSO seems to have a positive effect on the
southeastern region of the Caribbean which includes the eastern half of Puerto Rico (Jury
et al., 2007).
The NAO is more influential than ENSO in the southeastern Caribbean where
Puerto Rico is located (Jury et al., 2007) and the stronger the NAO the lower the
precipitation (Malmgren et al., 1998). Monthly and seasonal precipitation respond
differently to NAO in the southeastern Caribbean, although particular months may show
positive correlation with NAO and receive higher precipitation. In general, there is a
negative correlation between NAO and precipitation in most Caribbean subregions (Jury
et al., 2007). Seasonal influence is critically important in the southeastern Caribbean
because most of the precipitation in the Caribbean falls during the summer (Jury et al.,
2007). Simulations with a mesoscale model using the Parallel Climate Model (PCM) to
project future climate changes in Puerto Rico under the IPCC’s Business as Usual (BAU)

52
Scenario showed that SOI and NAO have important controls on annual Caribbean rainfall
variability (Angeles et al., 2006).
3.3 Data and Methods
The purpose of this study was to assess whether LULC and changes in LULC
have a significant impact on precipitation statistics in Puerto Rico over the past century.
Precipitation data for LULC types of key local interest, such as “urban” and “regenerated
forest” areas, were evaluated against data for nonurban areas within the same Holdridge
Ecological Life Zone (HELZ) (Figs 3.2 and 3.3); comparing data within HELZ was
found to be a useful approach in understanding LULCC impacts on temperature (Chapter
2) and thus it is reasonable to apply a similar approach for the study of precipitation. To
examine how various climate study methods help in understanding the role of LULC on
precipitation we used both simple and sophisticated research methods, including
descriptive and inferential statistics (Analysis of Variance; ANOVA), traditional climate
research methods like trends analysis, and Geographic Information Systems (GIS).
3.3.1 Precipitation and Land Use / Land Cover Data
Monthly raw total precipitation observation data for 1900-2007 from 139 stations
in Puerto Rico were provided by Dr. Williams and Dr. Vose from NOAA and were used
for geographical analysis. The Helmer et al. (2002) Puerto Rico Forest Type and Land
Cover digitized map (c.1992) and the Puerto Rico Gap Analysis Project map from Gould
et al., 2007 (c.2004) were provided by the United States Forest Service’s Institute of
Tropical Forestry in Puerto Rico. The 1992 Map used 30 meter grid spacing and 33 land

53
use /cover classes while the 2004 Map used 15 meter grid spacing and 72 land use / cover
classes.
3.3.2 Puerto Rico Holdridge Ecological Lifezones Data
Puerto Rico HELZ digital maps were provided by the United States Forest
Service’s Institute of Tropical Forestry in Puerto Rico from Puerto Rico Gap Analysis
Project (Gould et al., 2007). There are six HELZs in Puerto Rico; Subtropical Dry Forest
(DF), Subtropical Moist Forest (MF), Subtropical Wet Forest (WF), Subtropical Lower
Montane Wet Forest (LMWF), Subtropical Lower Montane Rain Forest (LMRF), and
Subtropical Rain Forest (RF). The main three HELZ are DF, WF and MF which together
cover 99% of the island. The DF is the smallest of the main HELZs, covering 14% of the
island and has the highest temperatures and lowest precipitation. The MF is the largest
HELZ and covers 62% of the territory and has medium level temperatures and
precipitation. The WF covers 23% of the island and has the lowest temperatures and
highest precipitation. The other remaining three HELZ cover less than 1% of the island
and are mostly limited to the Rain Forest reservation. For simplification and convenience
they were not analyzed as independent regions but considered part of the Rain Forest
Reserve or the Wet Forest HELZ, however, all station data were used for map creation.
3.3.3 Statistical Methods
Since average quantities are heavily influenced by extreme values, average and
median precipitation curves were plotted together to track occurrence of higher
precipitation periods. We expect average and median curves to be close and very similar

54
if data follows a symmetric distribution; however if higher precipitation periods dominate
the frequency of periods then the median would be well above the average and if lower
precipitation periods dominate the median would be well below the average.
Statistical analyses of the observational data focused on testing for precipitation
differences between HELZ and between LULC classes within HELZ. To examine for
possible precipitation differences associated with HELZ or land use, ANOVA was used
to detect monthly, seasonal and decadal differences between regions. Digital maps were
generated from individual station records by interpolating precipitation values and were
used to provide a visual representation of spatial patterns of precipitation.
In addition, the coefficient of variation, CV (standard deviation divided by mean)
for each station was computed for different time periods. The CV estimates the variability
of the data relative to its magnitude and is a useful tool to find spatial patterns of
variability and change. The CV was mapped using Arc Map 10 Spatial Analyst Tool using
the Inverse Distance Weighted (IDW) interpolation method to assess spatial patterns of
change. The IDW method interpolates spatial values as a function of the inverse of the
distance between stations and suitable for climate mapping. Preliminary test maps were
generated using different settings of the IDW tool to assess its reliability to represent the
broad island wide patterns of rainfall already known in Puerto Rico such as the regions
with the highest and lowest precipitation. IDW settings were kept in default but several
tries were made at different grid sizes get the most detail by matching the highest
resolution layer at 15 meters by 15 meter. For convenience and processing power
limitations grid size were set at 270 meters and 100 meters.

55
Simple linear regression was used to analyze precipitation time series linear
trends in different time periods using a linear least squares fit model, given that the data
fits a normal distribution. Data were analyzed in different time periods; the entire record
of over a century of data (1900-2007); 30 year periods (1900-1929, 1930-1959, 1960-
1989 and 1990-2007), PRISM (1963-1995) and Reanalysis (1979-2005). The later
period of 1990-2007 is shorter including only the data available for a full year at the
beginning of this study, the PRISM period is frequently used for studies because of the
high amount of station/year data and the Reanalysis period is when atmospheric grid
became available until the latest year available at the beginning of this study. We
considered PRISM and Reanalysis periods to evaluate how quantitatively distinctive they
are from the other periods and how selecting them could have altered our results.
However, only the 30-year periods were considered for ANOVA although all periods
were analyzed for trends.
3.3.4 GIS Methods
ARC MAP GIS 9.2 was used to select climate stations inside the HELZs and
specific land use classes using the 1992 and 2004 LULC maps. Only stations located
inside the main three HELZ were considered for regional ANOVA analysis but all (139)
stations were used to generate GIS interpolated maps. From the 1992 LULC map, the
“urban and barren” land cover class was considered as “urban” while in the 2004 LULC
map, the “High Density Urban” land cover class was selected as “urban” (Figs 3.4 and
3.5). Different biomes respond differently to impervious surfaces and so ecological
contexts are important (Imhoff et al., 2010). To control for any local ecological variation,

56
“urban” regions were analyzed in their HELZ against their respective “non urban” areas
to avoid any misinterpretation of the results due to stations located in different HELZ.
The two urban land covers from the 1992 and the 2004 maps were coded for the
corresponding HELZ as U[HELZ]92 and U[HELZ]04 respectively.
Several data subsets were used for the analysis of urban regions because of the
use of two different station regional selection methods (Type A and Type B). Each data
subset was statistically analyzed in separate groups to meet statistical independence
assumption criteria. The ARC MAP GIS 9.2 default “intersect” data selection method
considered only stations contained inside the urban LULC and was classified as “Type A
Selection”, the other method (Type B Selection) used 30, 60 and 90 meters radius buffers
around each station. Urban areas from A selection were coded 1992 A (U1992A) and
2004 A (U2004A), urban areas from the B selection were coded 1992 B (U1992B) and
2004 B (U2004B). As the number of urban stations increased by the increased buffer
size, they were subtracted from the Non Urban counterpart and new averages were
computed for both, the new urban region with additional stations and the new non urban
station with subtracted stations (Table 3.3 and Table 3.4).
The DF was subdivided into Urban Dry Forest by LULC map and Selection type
into (UDF92A, UDF92B, UDF04A and UDF04B) which included all urban stations from
the DF and Dry Forest Non Urban (DFNU92A, DFNU92B, DFNU04A and DFNU04B)
which excluded all urban stations from the DF. The MF was subdivided into Moist
Forest (MF) consisting of all stations including those selected as “urban” for analysis
purposes between the three HELZ, the Moist Forest Non Urban Selection A (MFNUA)
and B (MFNUB) excluded urban stations for each and 1992 and 2004 LULC maps coded

57
by selection type A or B (MFNU92A, MFNU92B, MFNU04A and MFNU04B). The
WF was subdivided into Wet Forest Reserve (WFR) located at the base of the Rain
Forest Reserve, the Unregenerated Wet Forest at the east (URWF) and the Regenerated
Wet Forest in the West (RWF), where natural reforestation has occurred.
Monthly total average, median and average total precipitation for each year were
computed directly from the monthly data to statistically evaluate decadal, monthly and
seasonal differences. The summarized data were computed by averaging all stations
inside the HELZs, the subdivided HELZs and the urban areas from the 1992 and 2004
LULC maps. The averages represent total averages for each month, and the medians
represent the median of the median values for total precipitation for each month
respectively throughout the 1900-2007 period. Monthly summary data were computed
by averaging or identifying the median precipitation values for each month for the period
1900 to 2007 for each region. Seasonal precipitation was computed by averaging
monthly totals corresponding to the local Dry Season from December to April and the
Wet Season from May to November (Malmgren and Winter, 1999). Finally, ARC MAP
10.1 IDW interpolation tool was used to create precipitation maps for each period to later
extract and assess urban versus non-urban magnitudes with statistical methods.
3.4 Results and Discussion
In Puerto Rico there are two statistically distinctive (α = 0.05), periods of rainfall:
the Dry Season or Winter (December to April) and the Wet Season or Summer (May to
November). Wet months and wet places show higher rainfall variation while dry months
and drier places show less rainfall variation (Fig 3.6). Median and average annual cycle

58
curves tend to separate late in the wet season as a result of larger rainfall events at the end
of the summer months. During the annual cycle a small variation at urban stations seem
to occur as they receive less rainfall during the Wet Season and in general slightly more
precipitation falls in the non-urban region, in particular this is true for the Wet Forest and
Moist Forest HELZs, however the Dry Forest showed a different pattern in some
selection method samples by registering more precipitation in urban stations than in non-
urban. (Figs. 3.7 to 3.13).
Historical monthly cycle graphs show the highest rainfall variability occurs at the
beginning of the Wet Season or at the driest months (June and July) where most of the
precipitation deficits are evident in all HELZs and across climatological periods (Figs
3.14 to 3.17). The peak months of the Wet Season are more consistent showing the least
variability over time. Wet Season Precipitation has been decreasing in all HELZ through
the century while Dry Season precipitation showed slight increases in the Moist Forest
and Dry Forest, but the Dry Forest have been the HELZ with the highest and most
notable increase (Figure 3.18).
Historical trends for the 90th
, 50th
and 10th
percentiles of monthly precipitation for
the 30-year climatological periods in each HELZ have decreased (Figs. 3.19, 3.20 and
3.21). Most of the trends are decreasing for the entire century however, the 90th
percentile in the Wet Forest and the Dry Forest have an increasing trend, suggesting an
increase in frequency of larger precipitation periods (months or years) in these two
HELZs while smaller periods are decreasing in the entire island. Despite the dominant
decreasing trend in the 50th
percentile, it has been increasing since 1989 in all HELZ
suggesting increase in median precipitation in the last period of 17 years. All 10th

59
percentiles have been decreasing rapidly for the entire century in each HELZ, suggesting
a heavy decrease in small precipitation periods, however only in the Dry Forest the 10th
percentile has been increasing in the last period of 17 years. The decrease in precipitation
combined with an increase of heavy precipitation periods of the most recent 17 years
matches projections for the Caribbean Basin under climate change scenarios (Neelin et al.,
2006). Although from the analyzed data the magnitude and intensity of precipitation
events is not evident, periods of larger precipitation may occur by either low frequency of
large precipitation events or high frequency of small precipitation events both yielding
large amounts of total accumulations for a given period (months or years). Climate
change projections for the Caribbean point at higher frequency of dry periods combined
with a lower frequency of high precipitation periods (Neelin et al., 2006).
Monthly precipitation for the period 1900-2007 in most areas of Puerto Rico
follows a Gaussian (Normal) distribution. However, eastern HELZ Subdivision sites
precipitation record fitted the Johnson transformation distribution (Table 3.5), which may
suggest a different dominant synoptic or sea breeze orographic forcing rainfall origin at
these locations. At all Wet Forest Subdivisions median precipitation is higher than the
average (Table 3.5) as they receive more rain events of higher magnitudes than other
HELZ’s. Of the three HELZ studied, the most precipitation falls in the Wet Forest, as
expected, followed by the Moist Forest while the Dry Forest receives the lowest
precipitation and is statistically different from the Moist Forest and the Wet Forest (α =
0.05). The Moist Forest and the Wet Forest precipitation average are higher than the
average precipitation for the main three HELZs.

60
Average annual precipitation in Puerto Rico has been decreasing for the past
century (1900-1990) in all three HELZs with most stations recording negative trends
(Figure 3.3). However, particular stations, zones and time periods, positive trends have
also occurred (Figs. 3.21 and 3.22). Since the 1970s average annual precipitation level
then increased slightly since the 1990s (Figure 3.3). A notable increase in median
precipitation primarily in the Wet Forest from 1920s to the 1950s was followed by a
dramatic drop in median precipitation in all HELZs after 1970, but all HELZs show
increasing median and average precipitation in the last decade of the record (Figure 3.3).
Dry and wet periods in Puerto Rico seem to follow a cyclic pattern consistent in the
Caribbean basin that has been associated with the North Atlantic Oscillation (Larsen,
2000). Average and median decadal precipitation has greater separation since the 1970s,
particularly in the Dry Forest (Figure 3.3). Average and median rainfall has increased
consistently in the Dry Forest since the 1970s while in the Moist and Wet Forests it began
since the 1990s (Figure 3.3). Greater separation between average and median curves
after 1970 is consistent with global warming projections for the Caribbean of an increase
in drier periods combined with bigger precipitation events (Neelin et al., 2006).
In general, urban areas received slighter less average precipitation than the non-
urban areas at each HELZ, with the exception of the 1992 map B selection 30 meter
buffer. Table 3.6 shows urban versus non-urban average monthly precipitation
differences expressed using a ratio in every HELZ and for every selection method. Ratio
values > 1 indicate average monthly precipitation that is above the average for Puerto
Rico as a whole or the HELZ, values, 1 indicate the contrary. The 2004 map station
61
selections consistently showed more rainfall over urban areas than over non-urban in the
Dry Forest in all selections (Table 3.7).
3.4.1 ANOVA Results
Urban regions could induce precipitation because of increased convection and/or
convergence over the city and the presence of favorable aerosols for cloud formation. On
the other hand precipitation could decrease because of the presence of particular
unfavorable aerosols for cloud formation, air pollution and decrease of mixing ratio or
less available moisture. If urban areas in Puerto Rico are somehow affecting local
precipitation then the differences between urban and non-urban regions should be
reflected in any direction. However, no statistical differences were found in average
monthly precipitation between urban areas and non-urban areas in each HELZ for any
selection type or buffer size based on One Way ANOVA (α = 0.05). Thus we reject the
null hypothesis that there are statistically meaningful differences in average monthly
precipitation between urban and non-urban areas. Also our results are independent of the
selection method used to categorize stations between urban and non-urban. In other
words, urban and non-urban areas statistically receive the same amounts of monthly
average precipitation and, based on the used data and methods, the development of urban
landscapes has not statistically changed the amounts of rainfall compared to the average
and variability of the corresponding HELZ. This result contrasts with effects observed in
larger continental cities, and may reflect the overwhelming dominance of maritime or
synoptic conditions in controlling precipitation across Puerto Rico, little contrast between
urban and non-urban areas or the small size of urban areas in the island.

62
3.4.2 Precipitation Trends
In general, decreasing trends dominate average rainfall over Puerto Rico for the
last century regardless of HELZ (Figure 3.22), which is consistent with reports of
decreasing Caribbean precipitation (Larsen, 2000). However, the most recent 17 years
show a different pattern, with most stations having positive trends (Figs. 3.23 and 3.24).
In the Dry Forest a different pattern than the other HELZ occurred, registering increasing
precipitation trends in the urban area for most time periods that were analyzed (century,
PRISM, NARR), consistently contradicting the long term pattern of decreasing trends
that dominate the island. Thus, even on a small island in the Tropics the scale of Puerto
Rico, there are noticeable intraregional climatic differences. HELZ are important to
account for when comparing urban and rural climate stations because detectable
differences may be because of natural differences in microclimates.
3.4.3 GIS Interpolated Maps Analysis
Yearly average total precipitation and its corresponding trends from surface
stations were interpolated with GIS ARC MAP 10.1 to further investigate precipitation
patterns and changes related to urban and non-urban areas at each HELZ. The data were
divided into the study periods previously mentioned and average values were interpolated
applying the IDW method commonly used for precipitation point data. Statistical
analysis was performed on GIS generated grid cells to evaluate urban versus non-urban
magnitudes.
We found statistical differences between urban and non-urban yearly average total
precipitation in most time periods and HELZs (Tables 3.8 and 3.9). These findings were

63
consistent with GIS analysis of PRISM maps generation by a different method not
considering any land covers, using different spatial resolution and time period. However,
some findings were somehow unexpected or at least counter intuitive as there is no clear
correlation between urban and non-urban precipitation with the direction, time, quantity
and location (Figs. 3.25 and 3.26) We expected that any urban impacts on the
precipitation would be evident or limited to the later periods when urban development
and buildup has been notably intense. Statistical differences between urban and non
urban areas from the beginning of the century would suggest that urban impacts have
always existed locally or that rainfall naturally splits statistically differently at urban and
non urban locations.
We also found statistical differences between urban versus non-urban yearly
average total precipitation trends but this relationship does not remain constant across
periods and occurs in both directions in all HELZs (Tables 3.10 and 3.11). Higher urban
trends prevail in most periods in the Wet Forest and Moist Forest HELZs (Figure 3.27).
Higher urban trends in the Wet Forest had a direct relationship consistent with this HELZ
receiving more average total rain than its non urban counterpart as earlier discussed and
may indicate the higher sensibility of this HELZ to urban development. Meanwhile the
dominance of higher urban trends in the Moist Forest contrasts urban versus non-urban
average totals findings that showed more even split across study periods (Figs. 3.26 and
3.27). The Dry Forest also contrasts average totals findings by showing a more even
urban versus non-urban trends split in the opposite case (Figs. 3.26 and 3.27). The
relationships found in the Moist Forest and Dry Forest urban and non-urban trends by

64
periods, may be indicative of a future shift related to urban development in both regions
as they are the two most urbanized HELZs in the island.
3.5 Conclusions
Precipitation has been decreasing in Puerto Rico for most of the century and in all
HELZs, particularly before 1970, a period in which monthly average and median curves
are relatively consistent (Figure 3.3). Seasonally, Wet Season Precipitation has been
decreasing in all HELZ through the century but the Dry Forest have been the HELZ with
the highest and most notable Dry Season precipitation increase (Figure 3.18). However,
a different pattern emerged after 1970 with average monthly and median precipitation
curves showing more separation, particularly in the Dry Forest HELZ. The Dry Forest is
the only HELZ where urban precipitation has been increasing recently (Figure 3.24).
This new pattern could well be the effects of new climate or just the first half of the 30-
year period receiving higher precipitation that precedes the second half of the period of
decreasing similar to the one that dominates all 30 year periods of the analysis.
We found evidence that urban development has impacted local precipitation based
on an urban effect on local precipitation detected by GIS generated data analysis.
However, this impact was not detected directly from station data analysis. Finding urban
impacts from the beginning of the century was unexpected. The found relationship exists
in both directions as some HELZ receive more precipitation over urban areas than over
non-urban areas while others behave the opposite way. Further, the found relationship is
never constant and is reversed in some periods (Tables 3.8 and 3.9). Precipitation over
urban areas dominates in the Wet Forest while precipitation over non-urban areas

65
dominate in the Dry Forest (Figure 3.24). These findings were also unexpected. The
Wet Forest is mostly forested and urban development is virtually nonexistent, however it
may reveal a higher sensitivity or response to urban impacts than other HELZs. On the
other hand, the Dry Forest is the driest, warmest and most lightly forested region of the
island where urban development is not as intensive and widespread as in the Moist Forest.
This condition could increase urban precipitation because of increased surface roughness
and convection.
In addition, this work has provided an effective new approach that could be used
by small islands to assess LULCC impacts in the local climate. This method could be
applied to any climate variable and any land use or land cover type using station dada,
GIS tools and analysis of variance.
Future research should consider rainfall intensity variation across landscapes as
well as distinction between types of or rainfall source across landscapes as well. Also,
radar and satellite studies should be use to complement knowledge due to the scatter
nature of rainfall and the limitation that represent working with station data that may not
accurately capture the wide spread nature of precipitation. In addition, we recommend
the use of adjusted and filtered data to isolate locally generated events from synoptic
events and standardized land cover vegetation classification for climate and ecological
research. Finally, the use of earlier Land Cover digitized maps would help the analysis
since in its absence this study assumed that the current urban developed area was
unchanged throughout the entire century, resulting in an overestimation of the amount of
urban area or pixels that existed at the beginning of the century that may in turn explain
some unexpected results for the periods early in the century.
66
3.5.1 Acknowledgments
We thank Dr. Vose and Dr. Williams at NOAA for providing precipitation
observation data for 1900-2007 from 139 stations in Puerto Rico. Also, Olga Ramos
from the Institute of Tropical Forestry for providing HELZ and other local GIS data, Dr.
Chris Daly for providing PRISM GIS data and Sigfredo Torres-González from the USGS
Caribbean Water Center office for providing rain gage data.
3.6 References
Angeles, M. E., Gonzalez, J. E., Erickson III, D. J., & Hernández, J. L. (2006). An
assessment of future Caribbean climate changes using the BAU scenario by coupling a
global circulation model with a regional model. Proc. 86th Am. Met. Soc. Meet.,
Atlanta, Georgia, USA.
Carter, M. M. and Elsner, J. B. (1996). Convective Rainfall Regions of Puerto Rico.
International Journal of Climatology, Vol. 16, 1033-1043
Carter, M. M., & Elsner, J. B. (1997). A statistical method for forecasting rainfall over
Puerto Rico. Weather and Forecasting, 12(3), 515-525.
Claussen, Martin; Brovkin, Victor; and Ganopolski, Andrey. (2001). Biogeophysical
versus biogeochemical feedbacks of large-scale land cover change. Geophysical
Research Letters, March 15, 2001. Vol. 28, No. 6, 1011-1014.
Comarazamy, D.E., (2001). Atmospheric modeling of Caribbean Region: precipitation
and wind analysis in Puerto Rico for April 1998. Thesis, Master of Science in
Mechanical Engineering, University of Puerto Rico, Mayaguez Campus.
Comarazamy Daniel E. and González, Jorge E. (2008). On the Validation of the
Simulation of Early Season Precipitation on the Island of Puerto Rico Using a
Mesoscale Atmospheric Model. American Meteorological Society. Journal of
Hydrometeorology. Vol. 9. Issue 3. June 2008. 507-520.
67
Comarazamy, D. E., González, J. E., Luvall, J. C., Rickman, D. L., & Mulero, P. J.
(2010). A land-atmospheric interaction study in the coastal tropical city of San Juan,
Puerto Rico. Earth Interactions, 14(16), 1-24.
Daly, C., E.H. Helmer, and M. Quinones. (2003). Mapping the climate of Puerto Rico,
Vieques, and Culebra. International Journal of Climatology, 23: 1359-1381.
Ewel J and Whitmore J. (1973). The Ecological Life Zones of Puerto Rico and the US
Virgin Islands. Forest Service Research Paper ITF-18. Institute of Tropical Forestry Rio
Piedras Puerto Rico. Forest Service US Department of Agriculture.
Ezber, Yasemin, Omer Lutfi Sen, Tayfun Kindap and Mehmet Karaca. (2007). Climatic
effects of urbanization in Istanbul: a statistical and modeling analysis. Int. J. Climatol.
27: 667–679 (2007)
Fall S., Niyogi D. , Semazzi F., (2006), Analysis of Mean Climate Conditions in Senegal
(1971–98), Earth Interactions, 10, Paper 5, 1-40.
Gould, W., C. Alarcón, B. Fevold, M.E. Jiménez, S. Martinuzzi, G. Potts, M. Solórzano,
and E. Ventosa. (2007). Puerto Rico Gap Analysis Project – Final Report. USGS,
Moscow, ID and the USDA Forest Service International Institute of Tropical Forestry,
Río Piedras, PR.
Grau, H. Ricardo, T. Mitchell Aide, Jess K. Zimmerman, John R. Thomlinson, Eileen
Helmer, and Xioming Zou. (2003). The Ecological Consequences of Socioeconomic
and Land-Use Changes in Postagriculture Puerto Rico. BioScience. Vol. 53 No. 12
1159-1168
Harmsen, Eric W; Norman L. Miller, Nicole J. Schlegel, J.E. Gonzalez. (2009). Seasonal
climate change impacts on evapotranspiration, precipitation deficit and crop yield in
Puerto Rico. Agricultural Water Management 96 (2009) 1085–1095
Helmer, E. H., O.Ramos, T. Del M. López, M.Quiñones, and W. Diaz. (2002). Mapping
the Forest Type and Land Cover of Puerto Rico, a Component of the Caribbean
Biodiversity Hotspot. Caribbean Journal of Science, Vol. 38, No. 3-4, 165–183,
Jauregui Ernesto and Romales, Ernesto. (1996). Urban Effects on Convective
Precipitation In Mexico City. Atmospheric Environment Vol. 30, No. 20, pp. 3383-3389
Jury, Mark; Malmgren, Bjorn A. and Winter Amos. (2007). Subregional precipitation
climate of the Caribbean and relationships with ENSO and NAO. Journal of
Geophysical Research, Vol. 112: 1-10.

68
Jury, M. R. (2009). An intercomparison of observational, reanalysis, satellite, and
coupled model data on mean rainfall in the Caribbean. Journal of Hydrometeorology,
10(2), 413-430
Jury MR and Sanchez DM. (2009). Composite Meteorological Forcing of Puerto Rican
Springtime Flood Events. American Meteorological Society. Weather and
Forecasting. Volume 24. February. 262-271
Larsen, M.C., (2000), Analysis of 20th century rainfall and streamflow to characterize
drought and water resources in Puerto Rico, Physical Geography, 21, 494–521.
Malmgren B, Winter A, Chen D. (1998). El Niño–Southern Oscillation and North
Atlantic Oscillation control of the Puerto Rico climate. Journal of Climate 11: 2713–
2717.
Malmgren B, Winter A. (1999). Climate Zonation in Puerto Rico Based on Multivariate
Statistical Analysis and an Artificial Neural Network. Journal of Climate, 12(4): 977–
985.
Ming Lei, D. Niyogi, C. Kishtawal, R. Pielke Sr., A. Beltrán-Przekurat, T. Nobis, and S.
Vaidya, (2008): Effect of explicit urban land surface representation on the simulation of
the 26 July 2005 heavy rain event over Mumbai, India. Atmos. Chem. Phys., 8: 8773-
8816
Ming Lei and Niyogi Dev. (2010). Simulation of Indianapolis Thunderstorms using
Explicit Urban Parameterization within a Mesoscale Model, J. Appl. Meteor. Climatol.,
in revision.
Moran, J. M. (2002). Online weather studies. American Meteorological Association.
Murphy, D. J., Hall, M. H., Hall, C. A., Heisler, G. M., Stehman, S. V., &
Anselmi‐Molina, C. (2011). The relationship between land cover and the urban heat
island in northeastern Puerto Rico. International Journal of Climatology, 31(8), 1222-
1239.
Neelin, J. D. , M.Munnich, H. Su, J. E. Meyerson, and C. E. Holloway. 2006. Tropical
drying trends in global warming models and observations. PNAS. April. vol. 103. no.
16. 6110- 6115
Pagan-Trinidad, (1984). Statistical Analyses of Spatial and Temporal Storm Rainfall
Characteristics in Puerto Rico. Project No. 374103 Final Technical Report. United
States Department of Interior

69
Pielke R.A, J . Adegoke, A. Beltran N-Przekurat, C. A. Hiemstra, J . Lin, U. S. Nair, D.
Niyogi and T. E. Nobis. (2007). An overview of regional land-use and land-cover
impacts on rainfall Tellus, 59B, 587–601
Ramirez-Beltran, Nazario D., William k. M. Lau, Amos Winter, Joan M. Castro, Nazario
Ramirez Escalante. (2007). Empirical probability models to predict precipitation levels
over Puerto Rico Stations. American Meteorological Society. Monthly Weather
Review. Volume 135: 877-890.
Ray, C. L. (1933). Wet and Dry Periods in Puerto Rico, 1899 1932. Monthly Weather
Review, 61, 222.
Stewart I, Oke T. (2009). Newly Developed “Thermal Climate Zones” for Defining and
Measuring Urban Heat Island Magnitude in the Canopy Layer. Proceedings of the
American Meteorological Annual Meeting, Phoenix, Arizona. 11–15 January. Available
online at http://ams.confex.com/ams/pdfpapers/150476.pdf. [Access year 2009].
Uppala, S., Simmons, A., Dee, D., Kållberg, P., & Thépaut, J. N. (2007). Atmospheric
reanalyses and climate variations. In Climate Variability and Extremes during the Past
100 Years (pp. 103-117). Springer Netherlands.
Van der Molen, M. K. (2002). Meteorological impacts of land use change in the maritime
tropics. PhD, Vrije Universiteit, Amsterdam, The Netherlands.
Velazquez-Lozada A, Gonzalez JE, and Winter A . (2006). Urban Heat Island Effect
Analysis for San Juan, Puerto Rico, Journal of Atmospheric Environment, 40 (9): 1731-
1741.

70
CHAPTER 4: ASSESSING THE IMPACTS OF LAND USE AND LAND COVER
CHANGES ON PUERTO RICO’S PRECIPITATION USING REGIONAL
ATMOSPHERIC MODELING SYSTEM (RAMS) SIMULATIONS
4.1 Abstract
Climate change has global to local consequences; however, local climates are also
affected by boundary layer feedbacks from Land Use and Land Cover Changes (LULCC).
Understanding the role that LULCC play in modifying local climate and weather events
is critical for land use planning and impact mitigation initiatives. Most climate studies
have focused on assessing impacts of global warming and climate change on global and
local temperatures in continental settings, while fewer studies have focused on
precipitation feedbacks from the drivers and internal forcing particularities of tropical
maritime climates feedbacks from LULCC. However, several studies have been
conducted in the tropical island of Puerto Rico regarding LULCC providing good
opportunities for follow up studies. Here we used Regional Atmospheric Modeling
System (RAMS) to assess the feedbacks of the major LULCC in Puerto Rico in a
selected event to observe how land features and processes may be driving, impacting or
playing a role in precipitation events. We also explored possible explanations for the
longer term observed patterns of previous precipitation studies over Puerto Rico during
the past century. We found that (1) the Central and Western parts of the island respond
more to LULCC while the Eastern part is less sensitive and appears to be controlled by

71
other factors (2) all substitutions in urban areas caused decreased precipitation
island wide (3) the frequency of unexpected counter intuitive results stresses the need for
further research to reliably run RAMS in environments and conditions similar to those of
Puerto Rico.
4.2 Introduction
Climate Change has global to local drivers, feedbacks and impacts. However,
local impacts are known to be affected by natural phenomena and anthropogenic
activities that occur within the Planetary Boundary Layer (PBL). The field of
microclimatology is concerned with the study and understanding of atmospheric
phenomena and variables that play a role in weather and climate within the PBL. This
includes land processes such as urbanization, and deforestation. Many existing climate
models address global climate dynamics and variables that operate at very large scales,
however PBL land features and processes interact with local atmospheric variables and
can alter the local climate.
Local natural and anthropogenic land features and processes can alter
precipitation events by changing related variables such as humidity, surface roughness,
temperature, vertical velocity, aerosols, and processes such as evapotranspiration rates
and cloud formation (Chapter 3). Surface temperatures in turn have an impact on vertical
velocity and convective potential related to cloud formation and rain intensity.
Evapotranspiration, water content and humidity control the availability of water for cloud
formation. Aerosols effect water droplet formation and also cloud formation potential.
Surface roughness increases convergence and cloud formation potential. With such a

72
wide range of interconnected processes, a particularly effective way to examine the
potential impacts of LULCC on the climate system at a local level is through numerical
modeling.
The Regional Atmospheric Modeling System (RAMS) is a meteorological
computer simulation application developed by the Atmospheric Science Department from
Colorado State University to conduct computational experiments of regional and local
atmospheric circulation at high resolutions. This model is of particular importance for
regional and local meteorological studies because it considers terrain properties and
landscape energy fluxes and dynamics often unaccounted for in global scale circulation
models. RAMS uses observed meteorological data to perform simulations that allow us
to study potential land features and land process change scenarios that would otherwise
be impossible, or at least extremely expensive and time consuming, real world
experiments.
In order to assess impacts of global-scale changes on local weather and climate,
the internal variability of local climate and weather must be first assessed (IPCC, 2007).
Observational climate and weather studies are useful to assess internal variability and
long- term changes (e.g., chapters 2 and 3) but allow little control over forcing variables.
In contrast, numerical computational experiments rely on many assumptions but can
complement observational studies by simulating possible scenarios by controlling values
of key variables and parameters . Modeling systems, such as RAMS have been used to
perform numerical computational experiments that help us understand and predict the
possible feedbacks and impacts of natural changes and anthropogenic activities. Thus
this type of model has great potential to increase understanding of the role that LULCC

73
has played in the changes revealed by the studies of long-term climate data presented in
chapters 2 and 3.
RAMS has previously been used to study the weather of Puerto Rico with an
emphasis on particular places and specific phenomena, such as the impacts of the Urban
Heat Island (UHI) over San Juan, the temperature impacts of different natural forests, and
CO2-forced climate change scenarios (Table 4.1). Although these studies provided an
important base for further research, and some of them addressed rainfall questions, most
of them were focused on understanding or predicting specific phenomena over the San
Juan region or the impacts of the urban area, or addressed synoptic influences or forcings.
Island-wide spatial variations in precipitation induced by mesoscale natural and
anthropogenic land process feedbacks are relatively understudied, and there are
unanswered questions about the local drivers, feedbacks, impacts and internal variability
that need to be addressed to effectively assess the impacts of global- to local-scale
changes on Puerto Rico’s precipitation.
4.2.1 Previous Mesoscale Studies and RAMS Work in Puerto Rico
Previous studies using RAMS in Puerto Rico have focused primarily on the Urban
Heat Island (UHI) effect in the San Juan area and the future impacts of expanding the city
(Table 4.1; Comarazamy, 2001; Velazquez-Lozada A et al., 2006; Comarazamy and
González, 2008; Comarazamy et al., 2010). Van der Molen (2002) investigated the
meteorological effects of deforestation of the coastlines with an emphasis on Rain Forest
dominant vegetation types; no urban conditions were considered and the precipitation
analysis was short and inconclusive. In contrast, Angeles et al. (2006) focused on

74
synoptic impacts of larger-scale driving forces by simulating an IPCC Business as Usual
CO2 increase scenario as well as El Niño and the North Atlantic Oscillation impacts on
Puerto Rico’s temperature and precipitation. They found that surface air temperatures
will be 2.5°C above monthly average for 2048 and that mesoscale rainfall is strongly
influenced by land dry areas .
In this work we used RAMS to assess particular LULCC feedbacks in Puerto
Rico and how they drive precipitation changes in different locations. We focus on
particular areas that represent Holdridge Ecological Life Zones (HELZ) and regions with
most dramatic LULCC impacts over the past century, as indicated by past work. This
includes the San Juan urban area and a regenerated forest region in western Puerto Rico.
The main objectives of this study are (see also Table 4.2) to:
1. Assess the impacts of LULCC feedbacks on local precipitation events
2. Examine how major LULCC and dominant HELZ play a role in driving or
modifying local precipitation events
3. Provide possible explanations for observed long term precipitation patterns between
urban and non urban areas in different HELZs
4. Assess possible long-term precipitation response to changes in different land uses
and land covers in Puerto Rico.

75
4.3 Methods
4.3.1 Summary
In this research we examined the potential use of the RAMS model to examine
how individual storm events are affected by changes in land use in selected areas of
Puerto Rico. A map of the island using 2001 satellite-derived land classes (Friedl et al.,
2002) was modified to conform with the latest land cover map from the Puerto Rico 2004
Gap Analysis Project by substituting RAMS land cover classes where needed. The
model was configured to replicate control runs and then selected land cover types were
substituted and the model run was repeated to study the response of the model to selected
land cover changes (Table 4.4). Such an approach is a standard experimental process for
LULCC modeling studies (Pielke et al. 2011). Model simulations involved
systematically substituting the actual land covers at locations of interest with alternative
RAMS land cover classes, while keeping remaining areas the same so that we could
isolate the responses for specific land use changes. Additional parameter adjustments
and modifications of the initial conditions were used to study model output responses to
different environmental conditions.
To select candidate events for RAMS modeling, radar reflectivity data
corresponding to different precipitation events were evaluated. The intent was to identify
relatively locally triggered rain event around areas representing the major natural
variability microclimates and LUCC patterns of the island (Table 4.3). NOAA daily
storm reports were examined to verify and understand the non-synoptic nature of events.
Station hourly data were compiled wherever available for verification. Model

76
verification was performed by qualitative evaluation comparing radar loops with
equivalent output from RAMS for control runs simulating May 23, 2010,. Simulated
radar loops for the control runs were evaluated for (1) precipitation totals, (2) rain
location, (3) time of occurrence, (4) rain duration and (5) rain intensity against observed
radar loops from the mesoscale triggered rain events from around the island.
Simulated weather data and variables of interest associated with mesoscale
precipitation triggering mechanisms were evaluated around areas of interest representing
major LUCC locations and the HELZs in the island (Table 4.5). Rainfall quantities and
related variables were observed, mapped, tabulated and plotted across the locations of
interest so that differences could be evaluated.
4.3.2 Numerical Model
This numerical experiment uses the RAMS model to evaluate the model
sensitivity to the surface land type. In order to achieve this, a series of scenarios are run
within the mode for a thunderstorm on 5/23/10 over Puerto Rico.
4.3.2.1 Atmospheric Model: RAMS
The Regional Atmospheric Modeling System (RAMS) is a sophisticated, cloud-
resolving mesoscale model capable of simulating thunderstorms at city-scale (Cotton et
al., 2003; Pielke et al., 1992). It solves the non-hydrostatic atmospheric equations of
motion on a polar-stereographic C-grid (Arakawa and Lamb, 1981). The version run for
this study utilizes the Harringon radiative parameterization (1997), Klemp-Wilhelmson
boundary conditions (1978), and the Mellor-Yamada turbulence closure scheme (1982).

77
The cloud microphysics parameterization is a two-moment bin-emulating scheme
(Meyers, Walko, Harrington, and Cotton, 1997; Saleeby and Cotton, 2004). It utilizes
two cloud-condensation nuclei sizes based on observations by Hobbs et al. (1980) to
represent two modes of cloud nucleation. This is relevant as within urban areas, such as
San Juan, urban aerosols fit such observations.
For this study, RAMS was run in a three-way interactive nested grid configuration
(Walko, Tremback, Pielke, andCotton, 1995). From coarsest to finest, the grid spacing
was 64km – 16km – 4km with a timestep of 90s – 15s – 2.5s respectively. Figure 4.1
shows the relative locations of each grid within the study domain. The vertical spacing
was 40m with a 1.1 stretching ratio at each vertical grid level (i.e. Δz1=40m, Δz2=44m,
Δz3=48.4m etc.) The Kain-Fritch convective parameterization (1993) was used in the
two outmost grids. The inner grid has sufficient resolution such that the cloud
microphysics alone is capable of resolving convective (Kain, 2004). Table 4.6 details the
size of the grid domain and initialization parameters.
4.3.2.2 Land surface Model: LEAF-3
The land-surface in RAMS is parameterized by the fully coupled Land
Ecosystem-Atmosphere Feedback model (LEAF-3, Walko et al., 2000; Walko and
Tremback 2005). It uses a finite number of vegetation parameters, measurable by satellite,
to classify the land-surface vegetation type into one of twenty-one classes. The vegetation
parameters are green vegetation albedo, brown vegetation albedo, emissivity, maximum
simple ratio (defined as the ratio of 1+NDVI to 1-NDVI), maximum total area index,
stem area index, vegetation clumping fraction, vegetation fraction, vegetation height, root

78
depth, dead fraction and minimum stomatal resistance. Table 4.7. Table of parameters
used to define vegetative land-use types in LEAF-3. ( Walko and Tremback 2005)
The model uses a one-to-one lookup table to create the land-surface classification
based on the land classes from the Olson Global Ecosystem updated to 2001 MODIS
land-cover classes at 1km resolution (Friedl et al., 2002; Olson et al., 2001). The Olson
classes map the biosphere at approximately 1km resolution. The lookup table condenses
the 96 Olson classes into the 21 model classes. It should be noted that while more classes
are possible in the model, each model land class must be sufficiently different from the
others to make a border between land classes significant. Figure 4.2 shows the model
land-classes in the Olson tile containing Puerto Rico. There is no differentiation between
different types of tropical forest because of the insignificantly small measurable
differences between these types, as far as the model is concerned. Therefore the model
will not distinguish between a wet forest and a dry forest, but rather classify all as
“Evergreen broadleaf forest”, and this is discussed further in the limitations section of the
paper. The San Juan urban area was parameterized with the Town Energy Budget urban
canopy parameterization (Masson, 2000).
4.3.3 Input Data
The model is initialized from the NCEP GFS analysis (Kalnay, Kanamitsu, and
Baker, 1990) of temperature, moisture, and wind vectors and reinitialized every six hours
at the outer grids, with the inner grid nudged. The GFS analysis has 1.0° resolution
(approximately 50km near Puerto Rico) and represents the finest available resolution in
this vicinity. The GFS analysis is upscaled to the outer grid resolution of 64km, then

79
downscaled within RAMS to each of the two inner grids. The dynamic downscaling for
this experiment is consistent with the conclusions made by Castro et al. (2005) to retain
the observed atmospheric conditions. Other variables are computed within the model to
retain dynamic balance.
4.3.4 Experimental Design
4.3.4.1 Case Study
The case for this experiment is a series of weakly forced (or air-mass)
thunderstorms over the island of Puerto Rico on May 23, 2010. At approximately 17UTC,
a thunderstorm forms upwind of San Juan, weakens over the city, then slightly
reintensifies downwind. Later that hour, thunderstorms form downwind of the reforested
wet forest, on the west end of the island. Both events demonstrate some modification
over the land-surfaces under investigation: the reforested wet-forest, the San Juan urban
area, or the rain forest reserve. Figure details observed precipitation on the island as
derived from combined radar and rain-gauge observations (following Seo, 1998).
4.3.4.2 Land-Surface Scenarios
The experimental design for this modeling study simulates the same initial
conditions from 5/22 – 5/24, 2010, changing the underlying land-surface conditions to
determine how they affected thunderstorm development. The goal of the control
experiment is to produce a reasonable simulation of observations, not a replication. Each
land-surface scenario is then compared to the control to determine how individual

80
elements impact storm development and total precipitation. In each case, the scenario
compares a changed land-surface to either urban or evergreen broadleaf forest.
Land surfaces considered are bare soil, grassland, shrubland, crops, and an
expansion of existing land surface types. Bare soil removes all vegetation or buildings,
simulating a null case. Grassland and shrubland represent a less intensely vegetated
surface than broadleaf forest. Crops demonstrate how storm development changes with
agricultural land-use change. Expansion of the areas covered by existing land surface
types may demonstrate either a green-planning scenario, as in the case of expanded forest,
or a future urbanization development scenario.
Table 4.8. provides details for each scenario run for this experiment, including
how the land surface was changed. For the forest scenarios (RF and RWF), the bare soil,
grassland, and shrubland changes simulate the effects of lessening vegetation intensity,
while the spatial expansion does the opposite. For the urban scenarios, the changes
simulate how different urban boundaries or an expanded urban envelope can impact
storm development. Figure 4.1 shows the regions of changed land-surface for each set of
scenarios. Also shown is the downwind region of San Juan analyzed for precipitation
change and the three subdivisions of the island analyzed.
4.3.4.3 Control Results and Verification
The simulation reproduced the observations reasonably well. As previously stated,
the purpose of the control run was not to replicate observations, but produce a similar
precipitation pattern to study the land surface impacts. Figure 4.2 shows the model and
observed temperatures for different points on the island. Temperatures patterns are

81
smoother than observed data because the relatively coarse resolution of the model cannot
replicate microscale features. Otherwise, the temperatures agree quite well with
observations. Figure 4.3 details the model-produced precipitation during the period of
radar observation. The model produces surface precipitation in the same general area as
observed, making this useful for the sensitivity study. The precipitation is less than
observed due to the convective parameterization in the coarser grids. Table 4.9 compares
the selected event with the verified RAMS control run.
4.4 Data
Five minute reflectivity radar loops were obtained from the National Weather
Service office in San Juan. Land Use / Land Cover as well as Holdridge Ecological Life
Zones, geological, topographic and hydrologic digital maps were provided by the United
States Forest Service, International Institute of Tropical Forestry. Radiosonde data were
downloaded from the Wyoming Radiosonde global database, CMORPH data were
downloaded from the CMORPH database website, TRMM data were downloaded from
the TRMM database website. Hourly weather data were downloaded from NOAA NCDC
to generate time series of the control runs. Total precipitation satellite distribution maps
where downloaded from NOAA’s Advance Hydrologic Prediction Service.

82
4.5 Results and Discussion
4.5.1 Precipitation Changes
The first method by which precipitation is compared for this study compares total
accumulated water volume at the surface compared with that simulated in the control. For
example, 1mm of surface rain over a 4km grid represents 16,000m3 of total water, or 1.6
x 109 kg of water. When compared to a different value of the same magnitude, it is
equivalent to comparing precipitation amounts. Figures 4.8 to 4.13 show the percent of
surface water in each region compared to control.
4.5.1.1 Urban Scenarios (UI-A)
For each region on the island, changing the San Juan urban surface to another
land surface type reduced overall precipitation. The important forcing driving
precipitation in San Juan for this event is the mesoscale boundary between the urban and
rural environments. By changing it from urban to any other land surface, the gradient is
reduced and precipitation at the boundary is reduced. Notably, changing it from urban to
bare soil (1), grass (2), shrubs (3), and crops (4) reduces the surface temperature gradient
in each case. Changing the surface to broadleaf forest (5) would reduce the surface
gradient the most, but also adds more potential evapotranspiration, increasing moisture
and not reducing precipitation as much as the other scenarios.
In the downwind region, the precipitation change behaves differently. Downwind
intensification is governed primarily by atmospheric aerosols affecting drizzle formation.
Therefore, urban aerosols or some other source of aerosols are necessary for downwind

83
intensification. For all scenarios except the change to bare soil, the precipitation in the
downwind region is reduced, presumably because of the reduction in aerosols. In UI1A
(Fig. 4.12), the storm remains intense downwind not because of reintensification, but
because it did not weaken at the urban boundary.
4.5.1.2 Urban Expansion Scenarios (UI-B)
The urban expansion scenarios modify the location of the upwind mesoscale
circulation. Therefore precipitation upwind of the urban area increases in the central
region of the island (Figure 4.7) and is greatly reduced over the now-larger urban center
(Fig. 4.13). Overall precipitation on the entire western third of the island is increased due
to higher overall rain rates. The greatest changes come from those scenarios (UI-2B, UI-
5B) where the urban area is expanded south. This tightens the gradient between the
broadleaf forest and the urban area and modifies the atmospheric water availability
upwind.
Figure 4.11 demonstrates the effect of the upwind mesoscale circulation. In the
UI-5A scenario, the urban area is replaced with broadleaf forest, reducing the gradient
and thus upwind precipitation. In UI-5B the expanded urban area changes the location of
the gradient, thus increasing precipitation in the new upwind boundary. This particular
change, between eliminating and intensifying the gradient demonstrates that the observed
change to the thunderstorm on radar in the vicinity of San Juan was due to the urban-rural
boundary.

84
4.5.1.3 Rain Forest Reserve (RF)
Changes to the land surface of the rain forest reserve produce precipitation
changes both in the immediate vicinity and upwind of the San Juan urban area, due to
combined effects of urban-rural boundaries and forest boundaries. Changing the land
surface of the rain forest reserve from forest to bare soil (RF-1) creates another surface
mesoscale boundary capable of modifying storm behavior. The precipitation downwind
of the San Juan urban area is increased in the RF-1 scenario because of secondary
boundaries formed at the forest-bare soil boundary.
In the RF-1 scenario precipitation is increased upwind in the western and central
portions of the island. The total decrease in evapotranspiration keeps more water in the
atmosphere, leading to more efficient precipitation formation upwind of the rain forest
reserve. Figure 4.15 shows a map of precipitation changes as compared to the control. It
shows a large expanded area of increased precipitation around the changed land surface
resulting from both: greater atmospheric moisture availability and a change in surface
gradient. The combined surface gradients of sensible and latent heat (Fig. 4.7) between
forest to bare soil and urban to rural increases the precipitation upwind of the urban area.
4.5.1.4 Regenerated Wet Forest (RWF)
When considering the changes noted in the RWF scenarios, one should consider
the difference between a realistic change and a false teleconnection. The control
produced the lowest surface precipitation compared to observation on the western third of
the island, causing a comparison to show very large percent differences compared to the
control. In the central part of the island (Fig. 4.10), changing the RWF to bare soil (RWF-

85
1) or shrubs (RWF-3) increases precipitation, while changing it to grassland (RWF-2) or
crops (RWF-4) decreases precipitation. These precipitation changes are due to the change
in surface land gradient and surface moisture availability. The crops and grassland
decrease the gradient, while the bare soil and shrubs increases it. By expanding the RWF
(5), the forest becomes more complete, akin to the rainforest reserve. Therefore
precipitation increases greatly, especially downwind and in the region of land use change.
Figure 4.13 shows the mapped precipitation difference between the RWF-4 and RWF-5
scenarios. The RWF-4 increases precipitation in the central part of the island, making it
more realistic than the control. The RWF-5 scenario increases precipitation especially in
the changed areas of new forest.
This study provides insight into the land surface interactions behind a typical
thunderstorm system on Puerto Rico. As noted in Figure 4.11, the observed thunderstorm
modification at the urban boundary can be replicated in the model via eliminating and
intensifying the boundary. However, the highly heterogeneous nature of the land surface
makes it difficult to conclude how other regions modify the thunderstorm. Especially
difficult is the regenerated wet forest, which appears poorly represented in the study.
As simulated in the model, the eastern part of the island received the most
precipitation the day of the event (Fig. 4.17) but this region responded to each expansion
scenario and LC substitution reducing precipitation. Certain regions showed stronger
sensitivity to LULCC than others. Changing the land cover resulted in decreased
precipitation for 75% of the cases (Fig. 4.18). The primary reason for this is that changes
in the land surface caused the peak precipitation from the control simulation (Fig. 4.6) to
move farther offshore and thus decrease for all the island subregions. The fact that all but

86
one urban scenario decreased precipitation suggests that the urban land surface effect is
dependent on the location of the urban area relative to the location of precipitation.
Substituting shrubs for the existing land type caused the most instances of
increased precipitation in the scenarios (46.7%) followed by expansion of existing forests
(30%), and bare soil. Substituting forests for the control land surface decreased
precipitation in all cases (100%), with decreases in precipitation for grassland (93.3%),
crops (86.7%), and the city expansions (80%) (Fig. 4.19). The shrub substitutions
increased precipitation in the most cases because it was heterogeneous compared to the
most other types of land surface. Therefore it created the upward motions at the boundary
necessary to increase precipitation. While counterintuitive, substituting forest decreased
precipitation because most of the island is broadleaf forest (Fig. 4.2). Therefore changing
other land surfaces to forest decreases any land surface heterogeneity, reduces the effect
of the land-sea breeze driving the precipitation, and moves the peak precipitation further
offshore.
Expanding the rain forest reserve reduced precipitation island-wide, while
expanding the regenerated wet forest increased precipitation. This is because expanding
the rain forest reserve decreased the urban heat island effects on upward motion. The
regenerated wet forest is far enough away from the urban area that it is not directly linked
to its effects. Therefore by expanding it, the moisture availability on the island increases
and there is more precipitation. Expanding the urban area westward resulted in the
greatest decrease in precipitation. This is due to the particular location of the urban-rural
gradient. By moving it westward, it particularly effects the distribution of precipitation,
moving it offshore and decreasing it over the entire island.

87
The particular location of the urban-rain forest boundary in the control was
important to how much precipitation fell on the eastern portion of the island. Any
changes moved the precipitation farther offshore and affected the entire island. Other
parts of the island were more locally affected by changing the land surface (Fig. 4.20).
The central part of the island was highly variable to changes in the land surface. Both
affected by the urban-rural boundary and moisture from the western half, it was
particularly susceptible to the movement of the peak precipitation further on land or
offshore. The western part of the island was also susceptible to this.
4.6 Conclusions
The modeling component of this study simulated a single event, May 23, 2010,
where possible thunderstorm modification was observed in the vicinity of San Juan.
Using the RAMS model, several scenarios were run to study the impact of individual
regions of land-surface heterogeneity on the event. The control land-cover produced a
reasonable, but not exact, simulation of the observed precipitation event. The land surface
was then varied in the vicinity of the San Juan, Rain Forest Reserve, regenerated wet
forest, and unregenerated wet forest ecoregions, and new scenarios were simulated with
each.
Changes to modeled precipitation were most intense over and downwind of the
San Juan as shown in the changes to the urban area. Eliminating the urban area increased
precipitation of the urban center, while expanding it reduced precipitation. Expanding the
urban area also changed how much precipitation fell downwind. Relatively large changes

88
to precipitation were also simulated by changing the Rain Forest Reserve. Eliminating the
rain forest reserve reduced precipitation over the area. However, the Rain Forest Reserve,
for this particular event lies downwind of San Juan. Therefore there is a combined effect
of the San Juan urban area and the Rain Forest Reserve, which makes it difficult to
attribute the changes in precipitation to either region individually. Changing the Rain
Forest Reserve to bare soil to crops, respectively, decreases and increases precipitation in
the area. The decrease with bare soil is expected due to the reduced moisture. The crop
surface would theoretically also decrease surface moisture. However, the crop surface
also interacts with the unchanged urban land surface, and causes an invigorated storm
downwind of San Juan. This dual interaction makes it difficult to attribute observed
changes to the thunderstorm only to the urban area, or only to the urban-forest boundary.
Furthermore, the storm was not in the vicinity of the unregenerated and
regenerated wet forest ecoregions; yet, the change in precipitation upwind of the urban
area was on the same order of magnitude as the changes downwind with similar land
surface changes. This false teleconnection in the model likely does not represent a
realistic change and is not corroborated by other studies. Therefore it is difficult to
attribute significance to any of the individual land-surface interactions with the
thunderstorm. That is to say if any changes to the thunderstorm are produced near the
urban area, they are not significantly different from changes produced in a scenario away
from the urban area. This is not to say we cannot draw more generalized conclusions
about potential urban-rural and other land-surface heterogeneity interactions with
thunderstorm. It just cannot easily be shown through single-scenario based modeling
studies as shown here.

89
There are several limitations associated with this type of study:
1. The multiple collocated land-surface heterogeneities.
2. The scale of precipitation forcing on Puerto Rico.
3. The time scale of the study performed.
4. Data availability and the model's ability to initialize.
There are several urban-rural heterogeneities on Puerto Rico, and each could
individually modify a thunderstorm. San Juan has crops, forest, and most importantly
water (see next paragraph) on its boundary. A thunderstorm will be modified differently
depending on which of these boundaries it interacts with. In considering the Rain Forest
Reserve, changes to the urban area and changes to the forest may have competing
impacts. For example, changing either the urban area or the forest to crops increases
precipitation downwind, but for different reasons. Additionally, expanding the urban area
has the same impact as reducing the forest. Given that expanding the urban area in this
particular case may involve also reducing the forest, the impacts can also be falsely
intensified. Based on this, it is not easily possible to perform a true single-variable
scenario study with San Juan and the Rain Forest reserve.
The biggest problem with studying land-surface interaction with precipitation in
any way on Puerto Rico is the scale of the precipitation forcing. The primary mode of
precipitation on the island is seasonality (time). Precipitation will be heavier during the
wet season, and lighter during the dry season regardless of the land surface. The
secondary mode, more local than seasonality, is land-sea boundary and terrain. Local
precipitation in Puerto Rico is governed most strongly by the land-sea breeze combined

90
with local terrain forcing convection during the day and suppressing it at night. The
urban-rural heterogeneity is the strongest on the island, but it still remains a weaker
overall forcing than the synoptic and fixed-land based forcings. In order to observe the
nature of the urban-rural precipitation change on the island, it must be filtered from the
larger scale processes. Beyond the urban-rural, other heterogeneities (i.e. forest-crops)
represent an even weaker forcing and require further filtering to observe.
While RAMS is capable of simulating local-scale precipitation, it will also
simulate the larger scale processes at the proper scale. A case-scenario approach, as
shown here, is not the best way to remove these large-scale forcings to demonstrate the
land-surface heterogeneity based changes. The time-scale of the study becomes important
in order to filter the land-surface forcing from the larger scale forcings. For a single-event,
the largest-scale forcings dominate, even in a mesoscale model. At a longer time-scale
(weeks to months), the larger scale forcings become close to an average value and can be
removed to reveal the local forcing. However, the particular shortcomings of the model
prevent such a study here.
The best available input data near Puerto Rico is the GFS analysis, at 0.5-1.0 deg
resolution (50-100km). There exist some finer scale products near Puerto Rico, but given
the downscaling necessary to achieve 1km resolution near San Juan, they cannot be
applied to the entire outer domain of the model. Downscaling 50km input data to
represent a 1km feature is feasible, but is poorly represented here. We are forced to use a
single-event control because other events do not produce a control simulation close to
observations. These studies, not shown, do not void nor validate any previous
assumptions on land-surface interaction, but rather demonstrate a true limitation of the

91
RAMS model in Puerto Rico. The model has successfully simulated land-surface
interactions in other regions, even those using the same downscaling. However, the
particular problems present in Puerto Rico prevent RAMS in its current form from
successfully simulating cases here. Given the modeling experiment was only a portion of
the greater study, we cannot make any conclusions regarding the specific interaction of
the different ecoregions on the island with thunderstorms based only on this portion.
4.6.1 Recommendations for Future Work
Based on the results of this study, we can propose several future experiments,
beyond the scope of this paper. First, the model must be better calibrated to handle
simulations over Puerto Rico. This may involve assimilating surface and upper-air
observations along with reanalysis to improve model initialization. Additionally, NAM
analysis at a finer resolution, not readily available for research, could be used to initialize
the model. When reasonable and consistent control simulations can be produced, week
long to seasonal simulations can be performed to isolate the land-surface signal from
larger scale signals. The single-event runs are useful, but do not produce statistical results
for this particular type of event. Most importantly, the physics of the model may need to
be modified to handle precipitation on the island. The cloud physics, with the exception
of the GCCN, are parameterized based on continental clouds. The sea salt, and especially
ice-nucleating dust in the tropics are different enough to be significant. Furthermore for a
seasonal run, observational assimilation of aerosols, a feature only present in the most
theoretical of research at the current time, may be necessary to best simulate the seasonal

92
precipitation. Only with those improvements can we more fully extract the land-surface-
precipitation interaction on Puerto Rico.
4.7 References
Angeles, M. E., Gonzalez, J. E., Erickson III, D. J., & Hernández, J. L. (2006). An
assessment of future Caribbean climate changes using the BAU scenario by coupling a
global circulation model with a regional model. Proc. 86th Am. Met. Soc. Meet.,
Atlanta, Georgia, USA.
Carter, M. M., & Elsner, J. B. (1997). A statistical method for forecasting rainfall over
Puerto Rico. Weather and Forecasting, 12(3), 515-525.
Comarazamy-Figueroa, D.E., (2002). Atmospheric modeling of Caribbean Region:
precipitation and wind analysis in Puerto Rico for April 1998. Thesis, Master of
Science in Mechanical Engineering, University of Puerto Rico, Mayaguez Campus.
Comarazami, Daniel E. and González Jorge E. (2008). On the validation of Early Season
Precipitation on the Island of Puerto Rico Using a Meso Scale Atmospheric Model.
Journal of Hydrometeorology. Vol 9. Issue 3. 507-520.
Comarazamy, D. E., González, J. E., Luvall, J. C., Rickman, D. L., & Mulero, P. J.
(2010). A land-atmospheric interaction study in the coastal tropical city of San Juan,
Puerto Rico. Earth Interactions, 14(16), 1-24.
Daly, C., E.H. Helmer, and M. Quinones. (2003). Mapping the climate of Puerto Rico,
Vieques, and Culebra. International Journal of Climatology, 23: 1359-1381.
Fall S., Niyogi D. , Semazzi F., (2006), Analysis of Mean Climate Conditions in Senegal
(1971–98) , Earth Interactions, 10, Paper 5, 1-40.
IPCC 2007. Fourth Assessment Report. Climate Change (2007): Chapter 9:
Understanding and Attributing Climate Change
Malmgren B, Winter A, Chen D. (1998). El Niño–Southern Oscillation and North
Atlantic Oscillation control of the Puerto Rico climate. Journal of Climate 11: 2713–
2717.
Malmgren B, Winter A. (1999). Climate Zonation in Puerto Rico Based on Multivariate
Statistical Analysis and an Artificial Neural Network. Journal of Climate, 12(4): 977–
985.

93
Moran, J. M. (2002). Online weather studies. American Meteorological Association.
Murphy, D. J., Hall, M. H., Hall, C. A., Heisler, G. M., Stehman, S. V., &
Anselmi‐Molina, C. (2011). The relationship between land cover and the urban heat
island in northeastern Puerto Rico. International Journal of Climatology, 31(8), 1222-
1239.
Ramirez-Beltran, Nazario D., William k. M. Lau, Amos Winter, Joan M. Castro, Nazario
Ramirez Escalante. (2007). Empirical probability models to predict precipitation levels
over Puerto Rico Stations. American Meteorological Society. Monthly Weather Review.
135: 877-890.
Velazquez-Lozada A, Gonzalez JE, and Winter A. (2006). Urban Heat Island Effect
Analysis for San Juan, Puerto Rico, Journal of Atmospheric Environment, 40 (9): 1731-
1741.
Van der Molen, Michiel K. (2002). Meteorological Impacts of Land Use Change in the
Maritime Tropics. VRIJE UNIVERSITEIT . PhD Thesis.
Walko, Robert L. and Tremback, Craig J. INTRODUCTION TO RAMS 4.3/4.4
RAMS: The Regional Atmospheric Modeling System. Technical Description (Draft)

94
CHAPTER 5 CONCLUSIONS
The field of microclimatology is concerned with phenomena and surface
processes related to long-term weather within the Planetary Boundary Layer (PBL).
Natural sources as well as anthropogenic activities alter and modify surface processes in
ways that feedback in to the local climate by changing physical, biological and chemical
properties. Land Use / Land Cover Changes are known to alter land surface
characteristics and fluxes that can alter local weather and long-term climate. Most
knowledge about these impacts has been derived from studies in continental climates and
less is known about other types such as tropical – maritime climates. This dissertation
provided an opportunity to expand our knowledge of tropical climates dominated by
maritime conditions. Small tropical islands with maritime climates face unique
challenges to Global Warming/Climate Change because of sea level rise and loss of
coastlines in addition to any synergistic forcing effects of local LULCC.
The primary objective of this study was to determine the nature and pattern of
long-term changes in temperature and precipitation in Puerto Rico, a tropical maritime
island, and to determine if components of these changes in climate may be attributable to
local Land Use / Land Cover Changes. Long-term patterns for temperature and
precipitation were assessed by geographic region using Holdridge Ecological Life Zones

95
(HELZs). HELZs provide a useful tool to assess local climate variation as they
integrate ecological and environmental variables. The analyses included specific
evaluations of whether urbanization and reforestation are significant drivers of local
climate variation. A detailed numerical model that simulates individual storm events was
then used to simulate impacts of Land Use / Land Cover changes as part of building
explanations of how Land Use / Land Cover change alters the local weather events that
are the basis for long term climates.
5.1 Temperature Findings
On a scale of many decades, temperature changes in Puerto Rico are broadly
consistent with Global Sea and Land Temperature variations over the same time periods;
however there is considerable local temperature variability as represented by HELZ. A
variety of techniques were used to determine if there were significant differences in
temperature records between urban and non-urban areas and as a function of forest
regeneration. PCA/EOF identified urban areas and regenerated forest areas as being
distinct from areas not impacted by these land use changes, with higher values in stations
from the San Juan Urban area and the Regenerated Forest. The results of the OMR
analysis were counterintuitive, with the highest OMR trends in stations in the
Unregenerated Forest where no Land Use / Land Cover Changes have been documented.
However, the OMR results were limited to average temperatures because there are no
NARR maximum and minimum temperatures available and this may be one cause of the
anomalous results.

96
ANOVA was found to be a reliable method to assess urban versus non-urban
differences in Puerto Rico. Average temperatures in urban and non-urban areas were not
statistically distinct, and this finding is consistent with previous studies. However
maximum and minimum temperatures were significantly different between urban and
non-urban areas, with a confidence interval of 95% (α = 0.05). Statistical analysis of
GIS generated maps at each HELZ also detected a significant difference between all
urban and non-urban temperatures. These results were consistent with the results from
the statistical analysis of PRISM generated maps for all temperatures at each HELZ with
the same confidence interval and critical value. These findings provide strong evidence
that urban development have impacted temperatures around the whole island or that
urban temperatures signals were detected at each HELZ.
Temperature results represent minimum impacts since the analysis was done on
adjusted temperature data formulated to eliminate or reduce urban signals from the record.
Environmental impacts of findings may result in increased energy consumption because
of the increase in population use of air conditioner. Ecological impacts may result in
displacement of species and changes in habitat extension or boundaries. Mitigation may
be possible through urban greening and reforestation practices to increase albedo.
5.2 Precipitation Findings
Precipitation in Puerto Rico has been decreasing over the past century, consistent
with trends in the Caribbean basin as a whole. However, there is considerable
geographical variability in precipitation in Puerto Rico as represented by HELZ. Most
stations in Puerto Rico across all HELZs display the dominant pattern of decreasing

97
precipitation for the past century. However for the last 17 years a notable pattern of
increasing stations trends suggests that precipitation patterns maybe changing. Average
and median precipitation have been relatively close in all HELZs over the past century,
however from the 1990’s a new pattern has emerged with greater separation between
average and median precipitation magnitudes. This suggests an increase in distance or
difference between months with higher precipitation and those of lower precipitation that
is consistent with climate change projections for the Caribbean basin in which dryer
periods are expected with occasional periods of heavy rain.
Precipitation in non-urban stations was constantly higher than urban precipitation
across all HELZs. The slight reduction in precipitation that falls over urban areas may
relate to reductions in the mixing ratio and/or because of downwind advection of low
pressures. However, the small magnitude of the difference between urban and non-urban
precipitation may be because any effects of the urban settlements are too small to be seen
within the larger variability and trend associated with the predominant humid maritime
climate. The magnitude of the differences of monthly average precipitation on surface
stations is not statistically significant using a confidence interval of 95% (α = 0.05).
However, statistical analysis of GIS generated maps of yearly average total precipitation
detected statistical differences between urban and non-urban precipitation at each HELZ
using the same confidence interval and critical value. Further analysis of GIS generated
maps for monthly average precipitation trends confirmed statistical differences between
urban and non urban magnitudes. In addition, PRISM generated maps and confirmed
these findings using the same confidence interval of 95% (α = 0.05). However, finding
statistical differences between urban and non-urban areas from the beginning of the

98
century is surprising and may point to the assumptions of the unchanged land cover
through time or interpolation function hyper sensitivity.
5.3 RAMS Findings
Regional Atmospheric Modeling System (RAMS) is a weather event software
capable of performing numerical experiments related to land features and processes and
their effects on atmospheric phenomena. RAMS was used in this work to help us
understand how the major land use land cover changes and ecological regions in Puerto
Rico play a role changing or modifying precipitation events. A local thunderstorm event
with little synoptic influence was selected for the simulation. The most common and
probable land covers types and scenarios were systematically substituted to analyze
responses to these changes.
Some patterns seem to confirm that precipitation in the eastern part of the island is
more controlled by other drivers than Land Use / Land Cover Changes while the central
part showed the most sensitivity to simulation scenarios. However, the counterintuitive
nature of some results raised questions about the accuracy of RAMS and its reliability to
produce credible results at this scale. For instance, the fact that the model cannot yet
distinguish between Dry Forest and Wet Forest vegetation is an important limitation give
that the Dry Forest is the second largest HELZ in Puerto Rico and also the second more
impacted by urban development. Regarding results, the model predicts decreased
precipitation in the whole island with every single urban area substitution including forest.
It also it predicts increasing precipitation in other parts of the island is the Rain Forest
was substituted by bare soil. Although Puerto Rico currently developing “Land Use Plan”

99
may benefit from the use numerical modeling as well as other small jurisdictions, more
studies are needed to fine tune parameters and settings to improve performance.
5.4 Synthesis
Strong evidence for the impacts of urban development in Puerto Rico on
temperatures and precipitation have been provided to address an important climate
question relevant for assessing Climate Change impacts locally and around the world. A
simple method using station data and statistical methods without the use of mathematical
transformations or Reanalysis databases was developed and demonstrated suitable to
assess land use / land cover impacts for other small areas on any climate variable of
interest. Station location changes may be critical for some results that depend on small
number of stations, although adjusted data should account for that, the use of large
samples (many climate stations) should lessen any possible bias.
Computer model simulations are potentially useful in helping us reveal,
understand and predict how land process and features can change weather events but the
pilot study done in this dissertation suggests the much more fine-tuning is needed to
adequately model weather dynamics on small islands. Spatial resolution and
parameterization issues need to be addressed to accurately reproduce weather events at
small scales in order to produce credible results that can be instrumental for decision
making policies and practices. Puerto Rico offers great opportunities for follow-up
studies and developing better tools and methods for climate research of small islands.

100
5.5 Study Contributions
o Scientific Knowledge and Decision Making
Temperature findings increase our understanding of warming trends and temperatures
impacts of urban versus non-urban areas. Temperature maybe represent additional
stress or displacement for some species, higher temperatures may increase health
hazards and local energy consumption. Precipitation findings present important
challenges to be addressed locally as rainfall show a general decreasing trend and
local reservoirs are experiencing storage reductions because of sedimentation while
population and consumption increase. However, analysis from this study is
consistent with precipitation projections for the Caribbean region expecting dryer dry
periods and wetter more intense precipitation in wet periods pointing at critical water
conservation and management policy needed for adaptation.
o Statistical differences
ANOVA and t-test were used to assess statistical differences in temperatures
magnitudes and precipitation quantities between the urban and non urban areas using
a confidence interval of 95% or significance level of 0.05.
o Considered operational definition of Land Use versus Land Cover
This work methodologically addressed the difference between Land Use and Land
Cover by performing a replicate analysis for both definitions (Selection A and
Selection B).
o First use of FILNET 2 adjusted data in Puerto Rico
The temperatures data used for this study was first available in the summer of 2008.
o Use of HELZ’s for microclimate studies

101
Holdridge Ecological Life Zones, is a useful geographical tool created and used by
ecologists that generates climate provinces based on biotemperature, humidity, and
precipitation representing different conditions at different latitudes and altitudes. In
other words, climate variables are already contemplated and embedded with
vegetation.
o Multiple methods comparison
Traditional and contemporary climate methods (ANOVA, T-Test, PCA/EOF, OMR
and trends analysis) were combined to test the hypothesis of urban areas impacting
the local climate by altering local temperatures and precipitation.
o Regenerated Forest and Dry Forest Analysis
So far, related climate studies in Puerto Rico have focused on the urban impacts of
the San Juan urban area and the Rain Forest while studies about land processes in the
Regenerated Forest and the Dry Forest have been lacking.
o Characterization and Parameterization
Findings and results could provide valuable information to characterize the climate of
Caribbean islands and parameterize similar climates to feed climate models and
simulations.
5.6 Study Limitations
o Long term analysis is limited to the past century and the use of monthly summarized
temperature and precipitation data from land surface stations, unfortunately no
additional climate variables observations in Puerto Rico, such as winds, humidity,
pressure, radiation etc have such long term databases.

102
o Temperature analysis made on adjusted temperature continuous database while
precipitation analysis was made on raw data containing many gaps and missing
values.
o HELZs borders may be questionable as zones are assumed to be steady and not have
changes for many decades, it is currently unknown how HELZ borders and
extensions have changed.
o Station locations were assumed to remain unchanged for the period of the study,
however, temperature adjusted data should have account for that.
o FILNET 2 algorithm uncertainties are clear since it effectiveness to remove urban
signals from the temperatures are evident since the statistical analysis was able to
detect urban signals.
o Urban station temperature analysis was limited to the Moist Forest, while non-urban
temperature stations were located in the Dry Forest and Wet Forest to do a
comparative analysis.
o Too few temperature stations are located at urban areas and near natural reservations.
More urban temperature stations are needed even at the Moist Forest since currently
only the San Juan Urban area is represented and more stations are needed near natural
reservations to monitor changes and impacts . Some critical locations of research
interest, either have no stations or very little numbers such as east of San Juan, north
of the Rain Forest, the Rain Forest and the Unregenerated Wet Forest.
o No altitudinal variation was considered for temperature, however HELZ’s already
controls for any variation related to altitude through its climate regionalization
scheme.

103
o Main focus was on urban land use / land cover change; feedbacks from other land
uses / land covers, ecological & environmental variables were not considered.
However, the method used here may be use to study any other climate variable and
land use/land cover.
o No NARR maximum and minimum temperature data available to do OMR
o OMR analysis performed on selected stations and not all areas represented and no
Dry Forest stations were included.
o Raw precipitation raw data uncertainties, gaps and discontinuities.
o RAMS uncertainties and difficulties to parameterize or distinguish between local
vegetation types BATS may not accurately represent all existent Puerto Rico’s Land
Covers.
o Simulated events were limited rain events, no calm days were simulated.
o Control event verification data was limited to a handful of stations with hourly data
leaving out areas of research interest.
o There is only one radio sounding station in Puerto Rico to cover the entire island.
o Selected simulated weather events may not represent long term patterns
o Study was limited to local effects; no association or impacts of larger climatic
forcings combined with local land processes have been studied.
o The role and effects of aerosols and environmental pollution in air are not considered.
o No surface fluxes databases available
o Land Covers were limited to the most recent maps assuming that urban regions
remained static from actual to the past overestimating the amount and extent of urban
areas.

104
5.7 Future Directions
Longer term simulations runs are important to understand how changes in short
term weather conditions may alter the longer-term climate patterns. Higher time
resolution data for long term analysis and more climate variables such as humidity, winds,
pressures, radiation etc as well as surface fluxes are desirable. Satellite based
temperature and precipitation data may be useful for complementing station data
discontinuities and geographic coverage. Also, radar data may help in the study of
precipitation. Since maritime conditions dominate, sea surface data should be linked to
local land surface processes. Further studies should address other land covers types like
different agriculture lands, different levels of urbanization and different land uses that
represent different combinations of albedo and aerodynamic roughness levels. The
impacts of aerosols and environmental pollution should also be considered since they
play an important role in precipitation. Past Land Use / Land Cover reconstructions
would be useful to link surface processes with early century climate. Parameterization
studies of local land covers are needed so that they become more accurately represented
in BATS. Studies about the Regenerated Forest and Dry Forest represent unique and
important opportunities for further research.

105
CHAPTER 2 TEMPERATURE TABLES
Table 2.1. Holdridge Ecological Life Zone (HELZ) relative coverage and number of
temperature stations for Puerto Rico
Puerto Rico HELZ Coverage (% of
Puerto Rico’s land area)
Number of HCN temperature
stations
Subtropical Dry Forest (DF) 14 7
Subtropical Moist Forest (MF) 62 35
Subtropical Wet Forest (WF) 23 10
*Subtropical Lower Montane Wet Forest < 1 0
*Subtropical Lower Montane Rain Forest < 1 1
*Subtropical Rain Forest < 1 1
*= recoded as WF zones excluded from regional analysis breakdown. HELZ data from
International Institute of Tropical Forestry, weather stations from NOAA Historical
Climate Network .
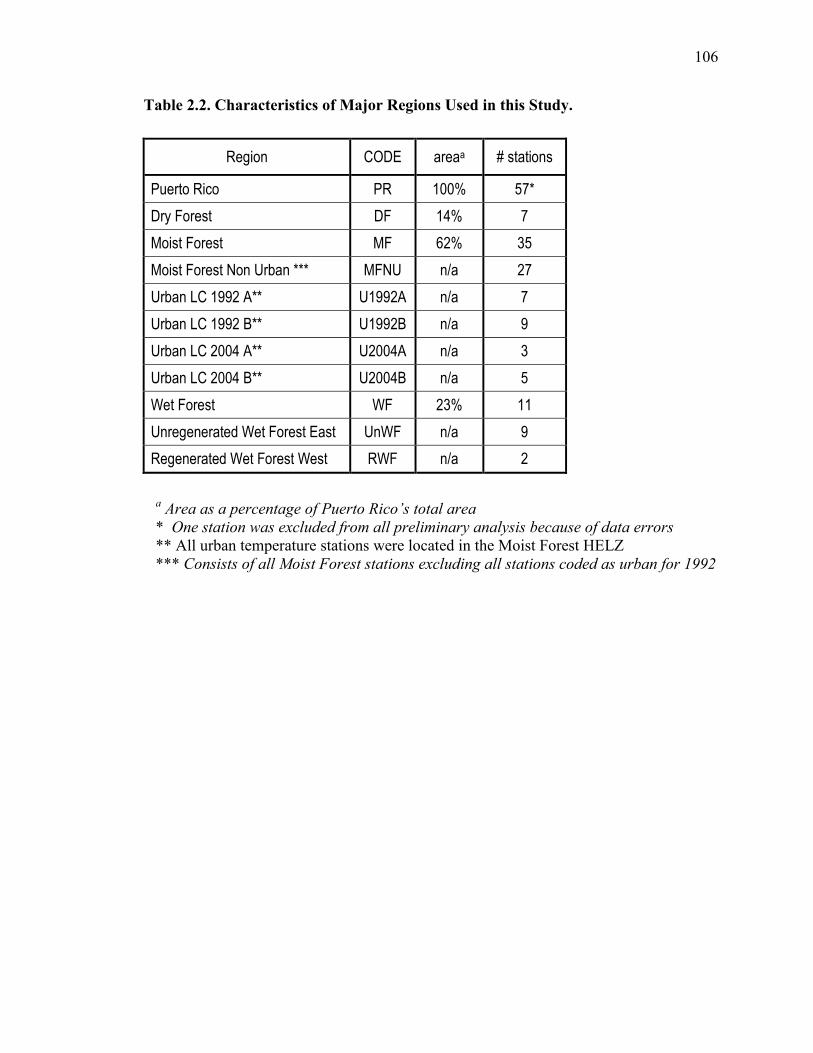
106
Table 2.2. Characteristics of Major Regions Used in this Study.
a Area as a percentage of Puerto Rico’s total area
* One station was excluded from all preliminary analysis because of data errors
** All urban temperature stations were located in the Moist Forest HELZ
*** Consists of all Moist Forest stations excluding all stations coded as urban for 1992
Region CODE areaa # stations
Puerto Rico PR 100% 57*
Dry Forest DF 14% 7
Moist Forest MF 62% 35
Moist Forest Non Urban *** MFNU n/a 27
Urban LC 1992 A** U1992A n/a 7
Urban LC 1992 B** U1992B n/a 9
Urban LC 2004 A** U2004A n/a 3
Urban LC 2004 B** U2004B n/a 5
Wet Forest WF 23% 11
Unregenerated Wet Forest East UnWF n/a 9
Regenerated Wet Forest West RWF n/a 2

107
Table 2.3. Seasonal and Annual Temperature statistics for HELZ, Moist Forest
Urban Land Use Areas and Non-Urban, and areas of Regenerated and
Unregenerated Forest 1900-2007.
Temperature, oC
Region
Annual Dry Season Wet Season
Min Ave Max Min Ave Max Min Ave Max
DF 21.58 26.12 30.66 20.03 24.86 29.69 22.70 27.04 31.38
MF 20.41 25.41 30.41 18.83 24.05 29.27 21.56 26.41 31.25
WF 17.33 22.26 27.19 15.85 20.98 26.11 18.41 23.20 27.98
RWF 17.17 22.16 27.16 15.67 20.85 26.02 18.27 23.13 27.99
UWF 18.03 22.68 27.33 16.64 21.56 26.48 19.05 23.51 27.97
MFNU 19.51 24.63 29.76 17.97 23.32 28.67 20.63 25.59 30.56
*U1992A 20.73 24.57 28.41 19.20 23.21 27.23 21.83 25.55 29.27
*U1992B 20.95 24.93 28.90 19.44 23.59 27.73 22.04 25.90 29.76
*U2004A 20.84 24.92 29.00 19.20 23.50 27.81 22.03 25.95 29.87
*U2004B 21.24 25.26 29.28 19.70 23.90 28.11 22.36 26.25 30.14
* Stations located in the Moist Forest HELZ

10
8
Table 2.4. HELZ Temperature Ratios and Differences
DF = Dry Forest, MF = Moist Forest, WF = West Forest, PR = Puerto Rico
Temperature Ratio
(HELZ Temp / PR Temp; oC)
Temperature Difference
(HELZ Temp – PR Temp; oC)
Remarks HELZ Min. Ave. Max. Min. Ave. Max.
DF 1.10 1.07 1.05 1.93 1.74 1.45 At least 1.5 degrees warmer than PR
MF 1.04 1.04 1.04 0.76 1.03 1.21 Around 1 degree warmer than PR
WF 0.88 0.91 0.93 -2.32 -2.12 -2.02 Over 2 degrees colder than PR
PR 1 1 1 0 0 0 Over 1 degree of temperature differences between HELZ’s

10
9
Table 2.5. Significance of temperature differences between HELZ (ANOVA)
Decadal Seasonal Wet Seasonal Dry Monthly
HELZ Min Ave Max Min Ave Max Min Ave Max Min Ave Max
DF 0.000 0.000 0.315 0.000 0.000 0.000 0.000 0.000 0.000 0.145 0.365 0.836
MF 0.000 0.000 0.315 0.000 0.000 0.768 0.000 0.000 0.032 0.145 0.365 0.836
WF 0.000 0.000 0.000 0.000 0.000 0.768 0.000 0.000 0.032 0.000 0.000 0.000
Bold values are significant (α = 0.05)
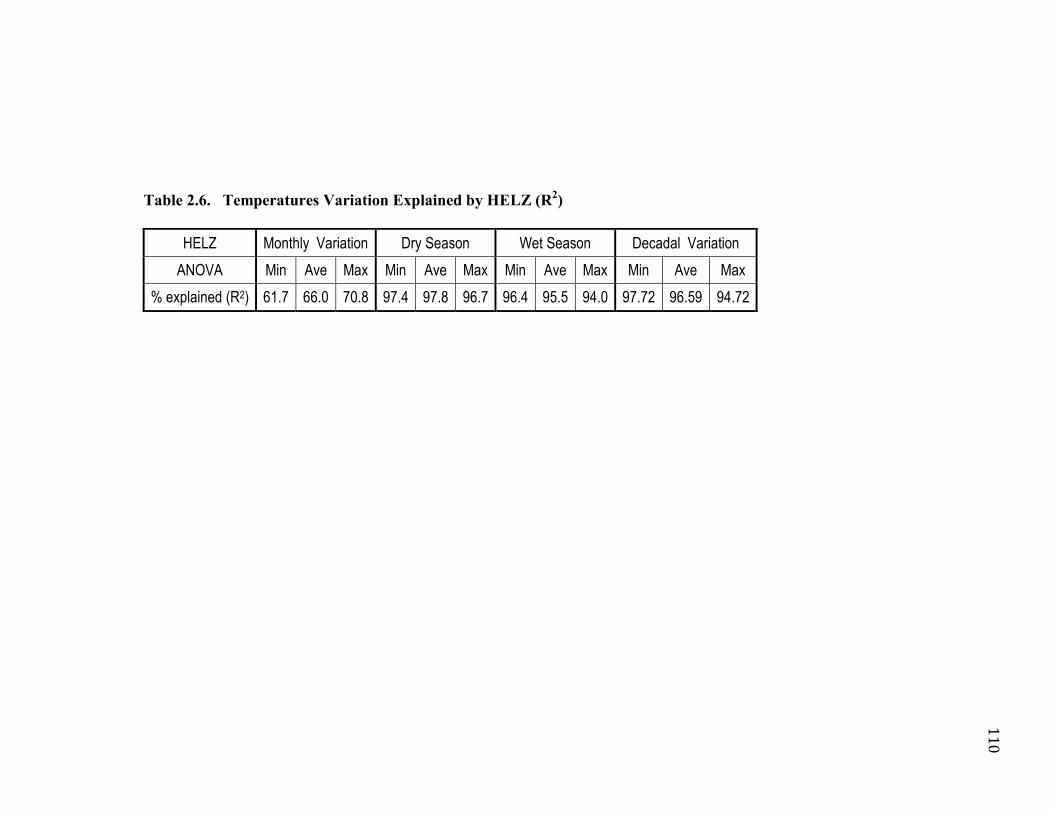
11
0
Table 2.6. Temperatures Variation Explained by HELZ (R2)
HELZ Monthly Variation Dry Season Wet Season Decadal Variation
ANOVA Min Ave Max Min Ave Max Min Ave Max Min Ave Max
% explained (R2) 61.7 66.0 70.8 97.4 97.8 96.7 96.4 95.5 94.0 97.72 96.59 94.72

11
1
Table 2.7 Urban versus Non Urban One Way ANOVA
Urban versus Non Urban One Way ANOVA, for urban classification by selection method
Urban
Code
Monthly Seasonal Dry Seasonal Wet Decadal
Min Ave Max Min Ave Max Min Ave Max Min Ave Max
*U1992A 0.245 1.000 0.022 0.000 0.928 0.000 0.000 0.998 0.000 0.000 0.985 0.000
*U1992B 0.114 0.977 0.281 0.000 0.281 0.000 0.000 0.180 0.000 0.000 0.208 0.000
*U2004A 0.185 0.980 0.408 0.000 0.666 0.000 0.000 0.092 0.003 0.000 0.242 0.000
*U2004B 0.037 0.726 0.799 0.000 0.001 0.005 0.000 0.000 0.152 0.000 0.000 0.045
Regenerated Forest versus Unregenerated Forest One Way ANOVA
UWF vs RWF 0.591 0.842 0.995 0.000 0.000 0.040 0.000 0.061 1.000 0.000 0.003 0.832
Bold values are significant (σ = 0.05)

11
2
Table 2.8. EOF Modes for all Temperatures
Temperature Type First Mode Second Mode Total
Minimum 60.13% 6.88% 67.01%
Average 77.73% 4.27% 81.99%
Maximum 72.71% 5.14% 77.85%

11
3
Table 2.9 Main Locations Top 10% Temperature Stations Summary
Century Temperatures Century EOF
Location HELZ Min Ave Max Min Ave Max
*San Juan Urban MF 2/5 1/5 0 1/5 1/5 0
Regenerated Forest WF 0 0 0 1/5 0 3/5
Unregenerated Forest WF 0 0 0 0 0 0
Rain Forest WF 0 0 0 0 0 0
Dry Forest DF 3/5 4/5 2/5 0 0 1/5
Numbers from the total Top 10%
*Includes urban stations outside San Juan area classified as urban in 1992 and/or 2004

11
4
Table 2.10 Main Locations Bottom 10% Temperature Stations Summary
Location HELZ
Century Temperatures Century EOF
Min Ave Max Min Ave Max
*San Juan Urban MF 0 0 0 2/5 2/5 2/5
Regenerated Forest WF 4/5 4/5 2/5 1/5 0 0
Unregenerated Forest WF 0 0 0 0 0 0
Rain Forest WF 1/5 1/5 2/5 0 0 0
Dry Forest DF 0 0 0 1/5 0 0
Number from the total Bottom 10%
*Includes urban stations outside San Juan area classified as urban in 1992 and/or 2004

11
5
Table 2.11. Puerto Rico’s Average and Median period trends for all temperatures
Trend
Century
1900-2007
PRISM
1963-1995
OMR
1979-2005
Warming
1970-2007
Min Ave Max Min Ave Max Min Ave Max Min Ave Max
Average (oC / year) 0.01 0.01 0.01 0.02 0.02 0.02 0.02 0.02 0.02 0.03 0.03 0.03
Median (oC / year) 0.01 0.01 0.01 0.02 0.02 0.02 0.02 0.02 0.02 0.03 0.03 0.03

11
6
Table 2.12. Main Locations Top 10% Temperature Stations Summary
Location HELZ
Century Temperatures Century Trends
Min Ave Max Min Ave Max
*San Juan Urban MF 2/5 1/5 0 1/5 0 1/5
Regenerated Forest WF 0 0 0 1/5 0 1/5
UnRegenerated Forest WF 0 0 0 0 0 0
Rain Forest WF 0 0 0 0 0 0
Dry Forest DF 3/5 4/5 2/5 1/5 1/5 0
Numbers from the total Top 10%
*Includes urban stations outside San Juan area classified as urban in 1992 and/or 2004

11
7
Table 2.13 Main Locations Bottom 10% Temperature Stations Summary
Location HELZ
Century Temperatures Century Trends
Min Ave Max Min Ave Max
*San Juan Urban MF 0 0 0 2/5 2/5 1/5
Regenerated Forest WF 4/5 4/5 2/5 1/5 1/5 0
UnRegenerated Forest WF 0 0 0 0 0 0
Rain Forest WF 1/5 1/5 2/5 0 0 0
Dry Forest DF 0 0 0 1/5 0 0
Numbers from the total Bottom 10%.
*Includes urban stations outside San Juan area classified as urban in 1992 and/or 2004

118
Table 2.14. Ranked OMR for Average Temperature Trends of Selected Stations
Station Name
HELZ/LC
1979 – 2005 Yearly Trends oC 1979 – 2005 Decadal Trends
oC
FILNET NARR OMR FILNET NARR OMR
MARICAO_2_SSW Regenerated
Forest 0.033 0.007 0.026 0.331 0.070 0.261
CERRO_MARAVILLA Regenerated
Forest 0.027 0.005 0.023 0.274 0.048 0.227
CARITE_DAM UnReg.
Forest 0.026 0.005 0.021 0.255 0.049 0.206
CAYEY_1_E U1992 0.025 0.004 0.021 0.249 0.044 0.205
SAN_LORENZO_ESPINO UnReg.
Forest 0.025 0.005 0.020 0.246 0.051 0.196
RIO_PIEDRAS U2004 0.021 0.005 0.016 0.210 0.048 0.162
SAN_SEBASTIAN_2_WNW Regenerated
Forest 0.022 0.006 0.016 0.217 0.058 0.158
GUINEO_RESERVOIR Regenerated
Forest 0.018 0.004 0.014 0.185 0.045 0.140
LARES_2_SE Regenerated
Forest 0.018 0.005 0.013 0.177 0.048 0.129
SAN_JUAN_CITY U1992B &
U2004B 0.011 0.006 0.006 0.114 0.056 0.058
GARZAS Regenerated
Forest 0.010 0.005 0.005 0.102 0.052 0.050
ADJUNTAS_SUBSTN Regenerated
Forest 0.007 0.005 0.001 0.066 0.052 0.014
SAN_JUAN_WSFO U2004 0.005 0.006 -0.001 0.048 0.059 -0.011

119
Table 2.15. Results of the statistical analysis for century average temperature values
for each HELZ from GIS generated maps and each evaluated data base.
HELZ
PRISM maps
1963-1995 t -test (2 tailed)
FILNET SPLINE maps
1900-2007 t - test (2 tailed)
Max T Ave T Min T Max T Ave T Min T
Wet Forest 0.00 0.00 0.00 0.00 0.00 0.00
Moist Forest 0.00 0.00 0.00 0.00 0.00 0.00
Dry Forest 0.00 0.00 0.00 0.00 0.00 0.00
Results at 95% confidence interval (σ = 0.05)

120
Table 2.16. Difference in Urban versus Non Urban average century or period
temperatures magnitudes from GIS generated maps for each HELZ and data set.
Wet Forest
FILNET Temperature oC PRISM Temperature o
C
Temperature U NU U-NU U NU U-NU
Maximum 30.16 28.13 2.02 30.21 27.97 2.24
Average 24.22 23.05 1.17 24.02 22.75 1.27
Minimum 18.28 17.98 0.31 17.88 17.58 0.31
Moist Forest
FILNET Temperature oC PRISM Temperature o
C
Temperature U NU U-NU U NU U-NU
Maximum 29.62 29.15 0.47 30.15 29.68 0.48
Average 25.00 24.27 0.73 25.22 24.54 0.68
Minimum 20.37 19.70 0.68 20.33 19.49 0.84
Dry Forest
FILNET Temperature oC PRISM Temperature o
C
Temperature U NU U-NU U NU U-NU
Maximum 30.13 29.80 0.34 31.08 30.78 0.30
Average 25.56 25.32 0.24 25.80 25.53 0.27
Minimum 20.99 20.85 0.15 20.55 20.32 0.23
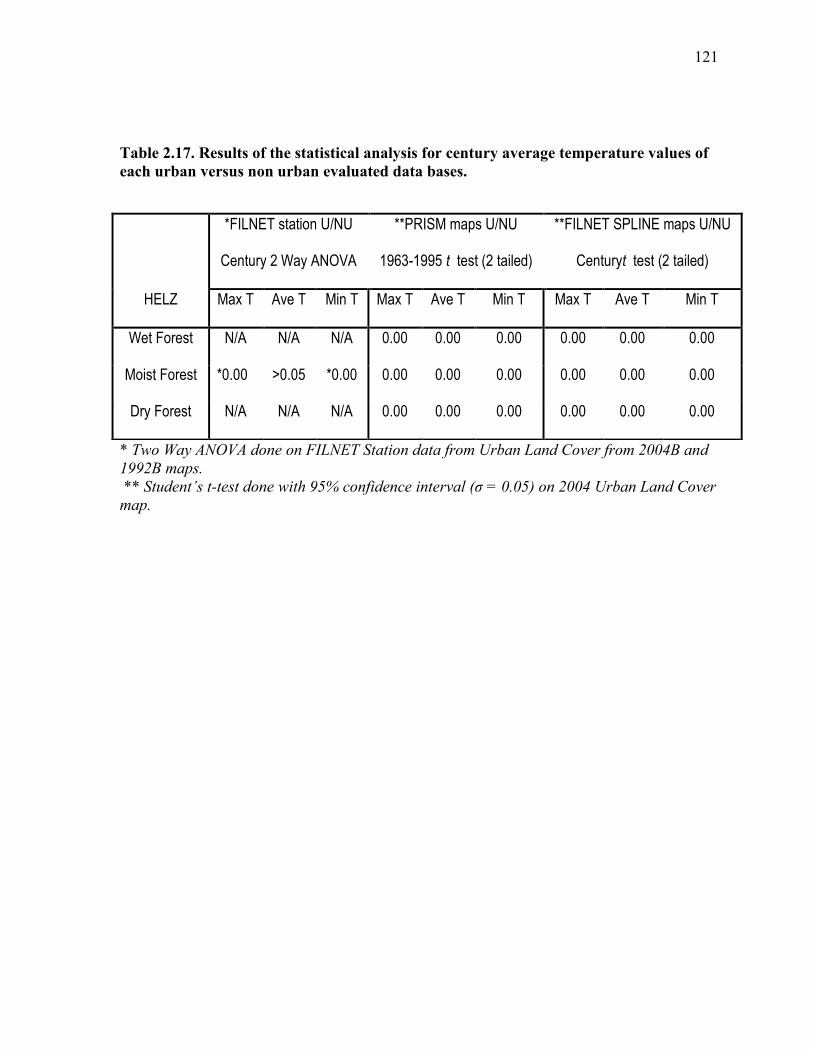
121
Table 2.17. Results of the statistical analysis for century average temperature values of
each urban versus non urban evaluated data bases.
* Two Way ANOVA done on FILNET Station data from Urban Land Cover from 2004B and
1992B maps.
** Student’s t-test done with 95% confidence interval (σ = 0.05) on 2004 Urban Land Cover
map.
HELZ
*FILNET station U/NU
Century 2 Way ANOVA
**PRISM maps U/NU
1963-1995 t test (2 tailed)
**FILNET SPLINE maps U/NU
Centuryt test (2 tailed)
Max T Ave T Min T Max T Ave T Min T Max T Ave T Min T
Wet Forest N/A N/A N/A 0.00 0.00 0.00 0.00 0.00 0.00
Moist Forest *0.00 >0.05 *0.00 0.00 0.00 0.00 0.00 0.00 0.00
Dry Forest N/A N/A N/A 0.00 0.00 0.00 0.00 0.00 0.00
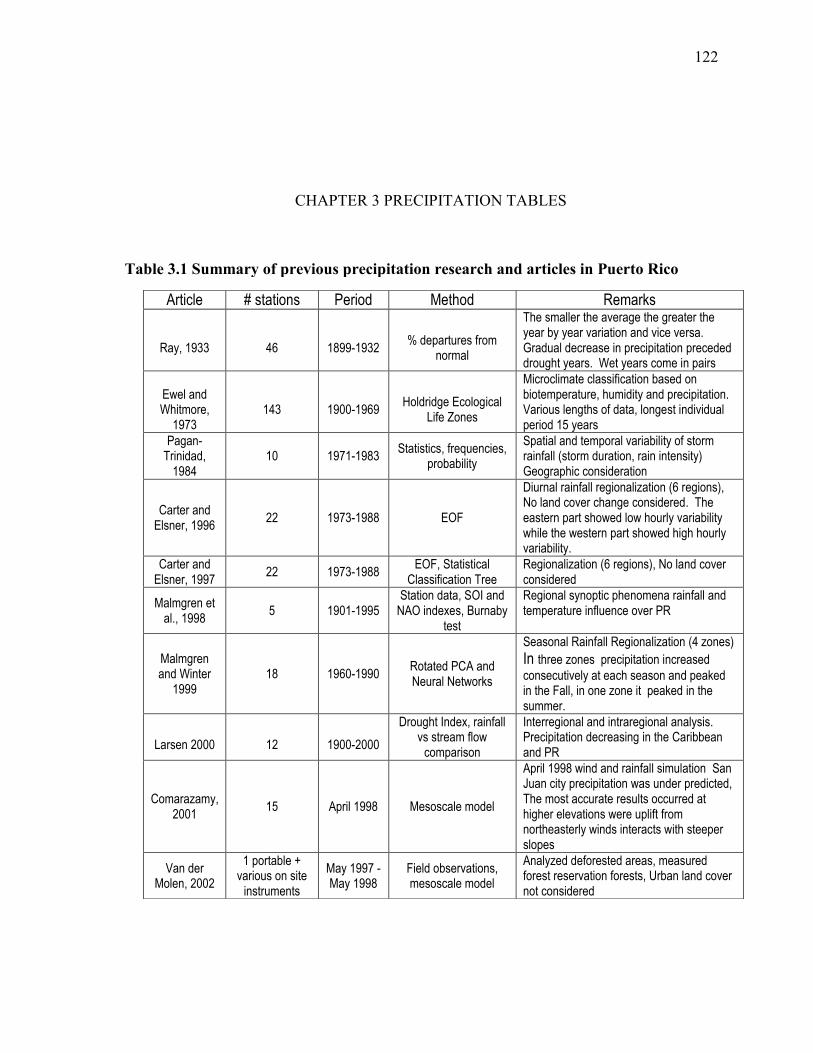
122
CHAPTER 3 PRECIPITATION TABLES
Table 3.1 Summary of previous precipitation research and articles in Puerto Rico
Article # stations Period Method Remarks
Ray, 1933
46
1899-1932
% departures from
normal
The smaller the average the greater the year by year variation and vice versa. Gradual decrease in precipitation preceded drought years. Wet years come in pairs
Ewel and Whitmore,
1973
143
1900-1969
Holdridge Ecological
Life Zones
Microclimate classification based on biotemperature, humidity and precipitation. Various lengths of data, longest individual period 15 years
Pagan-Trinidad,
1984 10 1971-1983
Statistics, frequencies, probability
Spatial and temporal variability of storm rainfall (storm duration, rain intensity) Geographic consideration
Carter and Elsner, 1996
22 1973-1988 EOF
Diurnal rainfall regionalization (6 regions), No land cover change considered. The eastern part showed low hourly variability while the western part showed high hourly variability.
Carter and Elsner, 1997
22 1973-1988 EOF, Statistical
Classification Tree Regionalization (6 regions), No land cover considered
Malmgren et al., 1998
5 1901-1995 Station data, SOI and
NAO indexes, Burnaby test
Regional synoptic phenomena rainfall and temperature influence over PR
Malmgren and Winter
1999 18 1960-1990
Rotated PCA and Neural Networks
Seasonal Rainfall Regionalization (4 zones) In three zones precipitation increased
consecutively at each season and peaked in the Fall, in one zone it peaked in the summer.
Larsen 2000
12
1900-2000
Drought Index, rainfall vs stream flow
comparison
Interregional and intraregional analysis. Precipitation decreasing in the Caribbean and PR
Comarazamy, 2001
15 April 1998 Mesoscale model
April 1998 wind and rainfall simulation San Juan city precipitation was under predicted, The most accurate results occurred at higher elevations were uplift from northeasterly winds interacts with steeper slopes
Van der Molen, 2002
1 portable + various on site
instruments
May 1997 - May 1998
Field observations, mesoscale model
Analyzed deforested areas, measured forest reservation forests, Urban land cover not considered

123
Table 3.1 cont.
Daly et al., 2003
47 Temp; 108 Precip.
1963-1995 PRISM
No land cover change considered. Spatial variation of rainfall was associated to elevation, upslope exposure to winds carrying moisture and distance to coastline.
Neelin et al., 2006
Gridded data 1970-2003 1950-2002 1951-2000
Satellite databases, gridded station
data, Precipitation models
Higher model agreement in the Caribbean and Central American of Summer dying trend and increase in heavy rain events
Ramírez-Beltrán et al.,
2007 6 1901-2001 Statistical models
Logistic Regression; Categorical Classification of precipitation events, no land cover considered
Jury et al., 2007
35 regional (7 from PR)
1951-1981 Factor Analysis Caribbean basin rainfall regionalization
Nyberg et al., 2007
4 cores (paleo study)
1730-2005
Coral cores, wind shear record
reconstruction, artificial neural
networks
Historical Caribbean basin hurricane activity
Comarazamy and
González, 2008
15 1993 and
1998 Mesoscale model
Early wet season simulation, No land cover change considered
Harmsen et al., 2009 3 1960-2000
GCM downscaling, trends, linear
regression
precipitation deficits scenarios resulted in crop yield reduction and wetter wet seasons and drier dry seasons
Jury, 2009
Interpolated data from
17,000 Caribbean
stations to grids
1979-2000
Observations, Reanalysis,
Satellite, and Coupled
Model Data
Evaluated ability of different products to represent mean annual Caribbean rainfall. Caribbean rainfall is projected to decline around 20% over the next 100 yr.
Jury and Sanchez,
2009 60 (rain gages) 1979-2005
NCAR, statistics of daily rainfall
Most flood events in Puerto Rico occurred in May, August and September
Comarazamy et al., 2010
N/A Atlas Mission
Observations
February 10-20, 2004
Mesoscale model
Mixed Urban and Natural adjustments yielded more accurate results. U-R temperature up to 2.5o C difference Increased precipitation downwind Southwest San Juan

12
4
Table 3.2. Annual effects of ENSO and NAO on Puerto Rico’s Precipitation
a) Malmgren et al., 1998; b) Jury et al., 2007 Effects are based on observations unless otherwise indicated.
* are effects deduced from the paper narrative, and + are effects described as expected in the paper narrative.
Climate Variable
ENSO Effect
NAO Index
High Average Low High Average Low
1990-1995a a a a a a a
Total Precipitation No effect+ No effect+ No effect+ < average* No effect* > average*
Average Precipitation No effect No effect No effect < average No effect > average
Median Precipitation No effect+ No effect+ No effect+ < average+ No effect+ > average+
1951-1981b b b b b b b
Monthly Total Precipitation No effect+ No effect+ No effect+ > average > average < average
Monthly Average Precipitation No effect* No effect* No effect* > average* > average* < average*
Seasonal Precipitation > average > average > average < average < average > average

12
5
Table 3.3. Number of stations by Selection Type and Analyzed HELZ and Land Cover for 1992 Puerto Rico Land
Cover Map.
Each selection data set was evaluated in an independent replicated analysis.
1992 Puerto Rico Land Cover Map Stations by Analyzed Selection Type and Study Regions
HELZ Total
stations
HELZ
subdivisions
Selection A Selection B 30 m Selection B 60 m Selection B 90 m
U NU U U NU NU NU NU
Wet Forest 27
Regenerated 0 22 0 22 4 18 7 15
Unregenerated 0 3 0 3 0 3 0 3
Rain Forest Reserve 0 2 0 2 0 2 0 2
Moist Forest 75 N/A 13 62 21 54 N/A N/A N/A N/A
Dry Forest 24 N/A 2 22 4 20 11 13 N/A N/A

12
6
Table 3.4. Number of stations by Selection Type and Analyzed HELZ and Land Cover for 2004 Puerto Rico Gap Map .
Each selection data set was evaluated in an independent replicated analysis.
2004 Puerto Rico GAP Map # of Stations by Analyzed Selection Type and Study Regions
HELZ Total
stations
HELZ
subdivisions
Selection A Selection B 30 m Selection B 60 m
U NU U NU U NU
Wet Forest 27
Regenerated 0 22 0 22 0 22
Unregenerated 0 3 0 3 0 3
Rain Forest Reserve 0 2 0 2 0 2
Moist Forest 75 N/A 7 68 11 64 15 60
Dry Forest 24 N/A 3 21 4 20 5 19

12
7
Table 3.5. Holdridge Ecological Life Zones Distributions and Descriptive Statistics
HELZ Data
distribution Mean
(cm/month) Standard Deviation
Median (cm/month)
Maximum (cm/month)
Remarks
WFR Johnson
Transformation 21.89 6.198 24.95 29.12
Rain Forest Reservation. Wettest region in Puerto Rico, different to most of Puerto Rico. Median
above Average
WF Gaussian 18.29 8.165 17.76 30.27 Center Mountains. Highest rainfall variation and
maximum
UnWF Johnson
Transformation 19.79 6.733 23.10 27.32 Eastern Mountain, Median above Average
RWF Gaussian 18.52 8.484 18.88 30.19 Regenerated Wet Forest, Median Above Average,
MF Gaussian 14.20 4.773 14.34 20.18 Most of Puerto Rico. Mean and median very similar
DF Gaussian 8.19 4.447 7.80 15.33 Driest region in Puerto Rico. Significantly different
to ALL others in every test

12
8
Table 3.6. 1992 LULC Average Monthly Precipitation Ratio 1900-2007
Total HELZ / PR Selection A Selection B 30 meters Selection B 60 meters
Remarks 1992 cm/month cm/month Urban Non Urban Urban Non Urban Urban Non Urban
WF 18.29 1.32 N/A N/A 1.07 0.99 0.91 1.01 Urban B 30 More precipitation over urban
MF 14.20 1.02 0.90 1.01 0.91 1.02 0.91 1.02 Less precipitation over urban areas vs no urban
DF 7.80 0.56 0.97 1.06 1.02 1.06 1.02 1.08 Less precipitation over urban areas vs no urban. Smaller difference
PR 13.88 1.00 0.87 1.02 0.89 1.00 0.85 1.03 Less precipitation over urban areas vs no urban

12
9
Table 3.7. 2004 LULC Average Monthly Precipitation Ratio 1900-2007
Total (cm/month)
HELZ / PR (cm/month)
Selection A Selection B 30 meters Selection B 60 meters
Remarks 2004 Urban Non Urban Urban Non Urban Urban Non Urban
WF 18.29 1.32 N/A N/A N/A N/A N/A N/A Less precipitation over urban areas vs no urban
MF 14.20 1.02 0.96 0.99 0.94 1.00 0.95 1.00 Less precipitation over urban areas vs no urban
DF 7.80 0.56 1.26 1.02 1.17 1.03 1.08 1.05 More precipitation over urban areas vs no urban
PR 13.88 1.00 0.901 0.910 0.882 0.914 0.877 0.917 Less precipitation over urban areas vs no urban

13
0
Table 3.8 Yearly Average Total Precipitation for each period and its corresponding Urban versus Non urban T-test
significance values
270m 1900-1929 cm/year 1930-1959 cm/year 1960-1989 cm/year 1990-2007 cm/year 1963-1995 cm/year OMR cm/year PRISM cm/year
U NU Sig. U NU Sig. U NU Sig. U NU Sig. U NU Sig. U NU Sig. U NU Sig.
WF 375.16 341.81 0.000 429.40 398.76 0.000 470.76 406.70 0.000 202.75 214.86 0.000 504.77 433.56 0.000 361.72 319.98 0.000 165.62 172.84 0.000
MF 347.26 340.77 0.000 279.59 338.75 0.000 364.01 362.77 0.027 170.64 183.18 0.000 386.65 385.55 0.057 297.06 299.43 0.000 99.45 104.12 0.000
DF 226.24 220.29 0.000 266.67 240.35 0.000 244.45 255.27 0.000 151.52 153.16 0.001 267.08 273.51 0.000 232.89 233.05 0.802 207.74 216.95 0.000
270 meter grid cell

13
1
Table 3.9 Yearly Average Total Precipitation for each period and its corresponding Urban versus Non urban T-test
significance values.
100m 1900-1929 cm/year 1930-1959 cm/year 1960-1989 cm/year 1990-2007 cm/year 1963-1995 cm/year OMR cm/year PRISM cm/year
U NU Sig. U NU Sig. U NU Sig. U NU Sig. U NU Sig. U NU Sig. U NU Sig.
WF 375.33 342.11 0.000 434.80 398.95 0.000 479.00 407.02 0.000 199.31 214.37 0.000 513.57 434.07 0.000 362.57 320.32 0.000 165.62 172.84 0.000
MF 347.45 341.00 0.000 260.05 341.21 0.000 364.02 362.77 0.000 169.90 183.31 0.000 387.81 385.43 0.000 298.75 299.43 0.000 99.45 104.12 0.000
DF 225.54 219.91 0.000 271.75 238.65 0.000 240.31 255.44 0.000 149.74 153.06 0.000 263.21 273.52 0.000 229.67 233.04 0.000 207.74 216.95 0.000
100 meter grid cell

13
2
Table 3.10 270 meter Grid Cell Yearly Average Total Precipitation Trends for each period and its corresponding
Urban versus Non urban T test significance values
270m
1900-1929 cm/year 1930-1959 cm/year 1960-1989 cm/year 1990-2007 cm/year 1963-1995 cm/year OMR cm/year Century cm/year
U NU Sig. U NU Sig. U NU Sig. U NU Sig. U NU Sig. U NU Sig. U NU Sig.
WF -0.008 -0.015 0.000 0.133 0.026 0.000 -0.132 -0.195 0.000 -0.710 -0.451 0.000 -0.104 -0.135 0.000 -0.139 -0.664 0.000 -0.041 -0.043 0.000
MF -0.013 -0.018 0.000 0.005 0.006 0.413 -0.009 -0.090 0.000 -0.120 -0.163 0.000 -0.048 -0.115 0.000 -0.109 -0.187 0.000 -0.044 -0.050 0.000
DF -0.007 -0.016 0.000 -0.040 -0.052 0.000 -0.274 -0.270 0.389 0.025 -0.002 0.000 -0.182 -0.162 0.000 -0.066 -0.064 0.467 -0.042 -0.069 0.000

13
3
Table 3.11 100 meter Grid Cell Yearly Average Total Precipitation Trends for each period and its corresponding
Urban versus Non urban T test significance values
100m 1900-1929 cm/year 1930-1959 cm/year 1960-1989 cm/year 1990-2007 cm/year 1963-1995 cm/year OMR cm/year Century cm/year
U NU Sig. U NU Sig. U NU Sig. U NU Sig. U NU Sig. U NU Sig. U NU Sig.
WF -0.008 -0.019 0.000 0.134 0.029 0.000 -0.133 -0.198 0.000 -0.762 -0.464 0.000 -0.100 -0.136 0.000 -0.142 -0.675 0.000 -0.039 -0.071 0.000
MF -0.015 -0.023 0.000 -0.003 0.009 0.000 0.011 -0.094 0.000 -0.120 -0.166 0.000 -0.030 -0.121 0.000 -0.098 -0.191 0.000 -0.040 -0.045 0.000
DF -0.011 -0.023 0.000 -0.038 -0.053 0.000 -0.287 -0.273 0.000 0.019 -0.003 0.000 -0.194 -0.163 0.000 -0.072 -0.069 0.052 -0.045 -0.052 0.000

134
CHAPTER 4 RAMS TABLES

13
5
Table 4.1 Summary of previous RAMS work about Puerto Rico
Article Objectives Assumptions Remarks Findings
Comarazamy, 2001
Simulate early wet season precipitation (April 1998)
April 1998 RAMS circulation & rainfall simulation
urban vegetation and green areas not considered,
inland water bodies were not represented and soil type
soil moisture seem inadequate
City very inaccurate
higher elevations most accurate at higher elevations northeasterly winds interacts
with steeper slopes increasing precipitation.
Van der Molen, 2002
Simulate Rain Forest types
to study meteorological differences between natural land covers and deforested
locations in Puerto Rico.
coastal deforestation covered with pasture and
lowland forest
Analyzed deforested areas, measured forest reservation vegetation, Urban
land cover not measured, considered or simulated
data gathered from a field campaign results not verified against actual
observations
conversion of coastal forests to pasture would result in decrease precipitation
Angeles et al., 2006
Simulate IPCC Bussines as Usual scenario towards
2048
Transient CO2 increase
RAMS and PCM coupled model
Sea Level (SL) will increase in 0.35 cm, SOI and NAO drives the 15 years annual rainfall
variability. The most accuracy achieved at synoptic scales for
the dry and late rainfall seasons. Mesoscale rainfall strongly influenced by the land dry areas
late rainfall season mesoscale rainfall in the Caribbean is driven by the vertical wind shear &
dry/moisture advection. RAMS finer grid predicts future warmer areas over Puerto Rico
surface air temperatures 2.5°C above monthly average for 2048. Early rainfall season shows
sudden rainfall increases dry season will have more intense and abrupt rainfall

13
6
Table 4.1 cont.
Velazquez-Lozada et al.,
2006
Assess current UHI over San Juan and simulate ad quantify future UHI caused
by development
Potential native vegetation-
scenario replacing
urban needle leaf trees
replaced
concrete with island
predominant soil texture
urban expansion
based on population
increase for 2050
Topography was not modified for any of the simulations
impact of urban LCLU in the upper atmosphere is related to the sensible heat fluxes
from the surface
80°F potential vegetation scenario
82.5 °F actual scenario
84.75 °F future scenario
Comarazamy and González, 2008
Simulate early wet season precipitation (April 1998)
Year 1998 considered
representative of climatology
April considered Wet Season
1998 very warm and hurricane active
year No land cover considered Early wet season precipitation is characterized
by convective rainfall, differential heating and local moisture transport
greatest accuracy at higher elevations urban area very inaccurate
Comarazamy and González, 2010
Simulate current urban conditions, potential
vegetation and a mixture urban and natural
Assess reliability of RAMS to study LULC changes in
tropical coastal areas
Validated control runs against ATLAS 2004 aerial observation mission.
Mixed Urban & Natural adjustments yielded more accurate results.
UHI showed about 2.5 C intensity Increased precipitation downwind/southwest of San
Juan

13
7
Table 4.2. Study objectives, research questions and hypothesis
Objectives Research Sub questions Hypotheses
Discover and measure LUC/C and dominant HELZ feedbacks on local precipitation events
Is there any LUC/C and dominant HELZs based feedback on local precipitation events?
Local LUC/C and dominant HELZs feedbacks on local precipitation events can be effectively detected and measured through RAMS simulations.
Explain how mayor LUC/C and dominant HELZ play a role driving or modifying local precipitation events.
What are the major LUC/C feedbacks on local precipitation events? What are the dominant HELZs feedbacks in local precipitation events? What mechanism, environmental variables and conditions related to major LUC/C and dominant HELZs are controlling or modifying local precipitation events? How are the identified mechanism, environmental variables and conditions controlling or modifying local precipitation events?
Major LUC/C are modifying local precipitation events by changing magnitudes of variables of interest and/or altering convection, convergence and/or cloud formation mechanisms Dominant HELZs are controlling local precipitation events trough the variables of interest and/or convection, convergence and/or cloud formation mechanisms Variables of interest and convection, convergence and/or cloud formation mechanisms acting on local precipitation events can be identified and measured trough RAMS simulations
Explain the observed long term precipitation patterns between urban vs non urban areas in the different HELZs
Why are Urban & Non Urban monthly precipitation statistically similar across Puerto Rico? What mechanisms, environmental variables and conditions are causing that monthly precipitation is statistically similar across Puerto Rico?
Although individual precipitation events may be modified by mayor LUC/C, monthly quantities are balanced by different responses throughout the month. The same mechanisms, environmental variables and conditions identified and measured trough RAMS simulations are causing similar urban vs non urban monthly precipitation
Asses possible long term precipitation response to changes in the different land use and land covers in Puerto Rico.
What are the expected impacts potential of LUC/C feedbacks on local precipitation events? What is the magnitude potential of LUC/C feedbacks on local precipitation events?

13
8
Table 4.3. Locations of Interest, HELZ and Land Cover
Main Location Description HELZ Actual Land Cover
San Juan Urban The largest urban/city like setting in the island
where UHI effect has been detected Moist Forest Urban
Rain Forest Reserve Natural forest reserve with the lowest temperatures
and highest precipitation Wet Forest Broadleaf Forest / Non Urban
Regenerated Forest Former crop lands where natural forest re-growth
have occurred Wet Forest
Broadleaf Forest / Non Urban / extremely
very low scattered Urban
Unregenerated Forest Similar environment to Regenerated Forest but no
crops or forest re-growth Wet Forest Broadleaf Forest / Non Urban
Dry Forest Natural environment with the highest temperatures
and lowest precipitation Dry Forest Irrigated Crops / Some Urban
Dry Forest Reserve Natural forest reserve with the highest
temperatures and lowest precipitation Dry Forest Shrubs / Non Urban

13
9
Table 4.4. Selected Land Cover substitutions for RAMS Simulations
Land Cover Substitutions Justification
Evergreen Broadleaf Dominates higher altitudes in the island
Bare soil Base comparison to urban development
Forest & Urban Expansions Forecast potential changes of forest growth and impacts of urban development
Grass Dominates lower altitudes in the island
Shrubs Dominates driest regions in the island
Cropland Hint to a past dominated land cover and forecast possible impacts of potential agriculture development
policy

14
0
Table 4.5. Variables of interest and associated mesoscale rainfall triggering mechanisms
Variable Trigger Mechanism
Justification Remarks Hypothesis
Precipitation All local & synoptic
Researched state variable / dependent variable
Focused on local mechanisms, can either increase or decrease with impacts
Expected lower in urban and air polluted locations
Temperature Convection May increase convection Triggers raising air from land processes Expected higher at urban and
regions with intense land processes
Surface heat flux
Convection; Convergence
Increased convection & may facilitate air mass discrepancies
Caused by raising air from land processes Expected higher at urban and
regions with high land processes
Latent heat flux
Convergence; cloud nuclei
May facilitate air mass discrepancies and cloud
formation
Evaporation caused by temperature also related to plant transpiration; water vapor
available for clouds,
Expected higher at urban and regions with intense land processes
Relative humidity
Convergence; cloud nuclei
May facilitate air mass discrepancies and cloud
formation
Water vapor available for clouds Caused by evaporation and plant transpiration
Expected lower in urban and air polluted locations
Mixing ratio Convergence; cloud nuclei
May facilitate air mass discrepancies and cloud
formation
Water content available for clouds related to evaporation and plant transpiration
Expected lower in urban and air polluted locations
Soil Moisture Convection Fuel storms; May increase
convection Associated with temperature, evaporation
and plant transpiration Expected lower in urban and high
temperature locations
Vertical velocity
Convection Implies convection Associated with temperature and raising
air from land processes Expected higher in urban and high
temperature locations
Rain water content
Convergence; cloud nuclei
May facilitate air mass discrepancies
Associated with evaporation and plant transpiration
Expected lower in urban and air polluted locations
Cloud fraction Convection;
Convergence; cloud nuclei
Increased convection & may facilitate air mass discrepancies
and cloud formation
Associated with evaporation, plant transpiration, natural aerosols and air
pollution
Expected lower in urban and air polluted locations
Surface convergence
Convergence; cloud nuclei
Implies air mass discrepancies and may facilitate cloud formation
Associated with physical features on land causing uplift of air masses
Expected higher at urban and regions with intense land processes

14
1
Table 4.6: Table indicating model parameters for each of the three nested grids.
Grid 1 Grid 2 Grid 3
NX x NY 48 x 32 50 x 34 70x 38
Center Lat./Lon. (18.23N, 66.45W) (18.23N, 66.45W) (18.23N, 66.45W)
NZ 48 48 48
Δx and Δy 64km 16km 4km
Unstretched Δz 40m 40m 40m
Δt 90 15 2.5
Initialization GFS Analysis G1 & 80% GFS nudging G2 & 50% GFS nudging
Convective scheme Kain-Fritch Kain-Fritch Explicit
Cloud Microphysics Explicit Explicit Explicit

14
2
Table 4.7. Table of parameters used to define vegetative land-use types in LEAF-3. ( Walko and Tremback 2005)
Green
veg.
albedo
Brown
veg.
albedo
Emiss.
Max.
simple
ratio
Max.
total
area
index
Stem
area
index
Veg.
clumping
fraction
Veg.
Fraction
Veg.
height
Root
depth
Dead
fraction
Min.
stomatal
res.
0 - Ocean 0.00 0.00 0.00 0.0 0.0 0.0 0.0 0.00 0.0 0.0 0.0 0
1 - Lakes, rivers,
streams 0.00 0.00 0.00 0.0 0.0 0.0 0.0 0.00 0.0 0.0 0.0 0
2 - Icecap, glacier 0.00 0.00 0.00 0.0 0.0 0.0 0.0 0.00 0.0 0.0 0.0 0
3 - Desert, bare soil 0.00 0.00 0.00 0.0 0.0 0.0 0.0 0.00 0.0 0.0 0.0 0
4 - Evergreen needle
leaf tree 0.14 0.24 0.97 5.4 8.0 1.0 1.0 0.80 20.0 1.5 0.0 500
5 - Deciduous needle
leaf tree 0.14 0.24 0.95 5.4 8.0 1.0 1.0 0.80 22.0 1.5 0.0 500
6 - Deciduous broadleaf
tree 0.20 0.24 0.95 6.2 7.0 1.0 0.0 0.80 22.0 1.5 0.0 500
7 - Evergreen broadleaf
tree 0.17 0.24 0.95 4.1 7.0 1.0 0.0 0.90 32.0 1.5 0.0 500
8 - Short grass 0.21 0.43 0.96 5.1 4.0 1.0 0.0 0.75 0.3 0.7 0.7 100
9 - Tall grass 0.24 0.43 0.96 5.1 5.0 1.0 0.0 0.80 1.2 1.0 0.7 100
10 - Semi, desert 0.24 0.24 0.96 5.1 1.0 0.2 1.0 0.20 0.7 1.0 0.0 500
11 - Tundra 0.20 0.24 0.95 5.1 4.5 0.5 1.0 0.60 0.2 1.0 0.0 50
12 - Evergreen shrub 0.14 0.24 0.97 5.1 5.5 1.0 1.0 0.70 1.0 1.0 0.0 500
13 - Deciduous shrub 0.20 0.28 0.97 5.1 5.5 1.0 1.0 0.70 1.0 1.0 0.0 500
14 - Mixed woodland 0.16 0.24 0.96 6.2 7.0 1.0 0.5 0.80 22.0 1.5 0.0 500
15 - Crop, mixed
farming, grassland 0.22 0.40 0.95 5.1 5.0 0.5 0.0 0.85 1.0 1.0 0.0 100
16 - Irrigated crop 0.18 0.40 0.95 5.1 5.0 0.5 0.0 0.80 1.1 1.0 0.0 500
17 - Bog or marsh 0.12 0.43 0.98 5.1 7.0 1.0 0.0 0.80 1.6 1.0 0.0 500
18 - Wooded grassland 0.20 0.36 0.96 5.1 6.0 1.0 0.0 0.80 7.0 1.0 0.0 100
19 - Urban and builtup 0.20 0.36 0.90 5.1 3.6 1.0 0.0 0.74 6.0 0.8 0.0 500
20 - Wetland evergreen
broadleaf tree 0.17 0.24 0.95 4.1 7.0 1.0 0.0 0.90 32.0 1.5 0.0 500

143
Table 4.8: Details of land-surface changes for each scenario.
Scenario San Juan City Rain Forest Reserve Regenerated Wet Forest
Urb
an
Sce
na
rio
s
UI-1A Replace w/ bare soil - - - - - -
UI-2A Replace w/ grassland - - - - - -
UI-3A Replace w/ shrubs - - - - - -
UI-4A Replace w/ crops - - - - - -
UI-5A Replace w/ forest - - - - - -
Ra
in F
ore
st R
eser
ve
Sce
na
rio
s
RF-1 - - - Replace w/ bare soil - - -
RF-2 - - - Replace w/ grassland - - -
RF-3 - - - Replace w/ shrubs - - -
RF-4 - - - Replace w/ crops - - -
RF-5 Expand in all dir. - - -
Reg
ener
ate
d W
et F
ore
st
Sce
na
rio
s
RWF-1 - - - - - - Replace w/ bare soil
RWF-2 - - - - - - Replace w/ grassland
RWF-3 - - - - - - Replace w/ shrubs
RWF-4 - - - - - - Replace w/ crops
RWF-5 - - - - - - Expand in all dir.
Urb
an
Ex
pa
nsi
on
Sce
na
rio
s UI-1B Expand west - - - - - -
UI-2B Expand south - - - - - -
UI-3B Expand east - - - - - -
UI-4B Expand west & east - - - - - -
UI-5B Expand in all dir. - - - - - -

144
CHAPTER 2 TEMPERATURE FIGURES
Figure 2.1 Puerto Rico and Global Ocean 1900-2007 Average Temperature Anomalies.
Global data from NOAAA, Puerto Rico data from FILNET 2.
-1
-0.8
-0.6
-0.4
-0.2
0
0.2
0.4
0.6
0.8
1
19
00
19
10
19
20
19
30
19
40
19
50
19
60
19
70
19
80
19
90
20
00
Puerto Rico Global Ocean
Ce
lc
ius
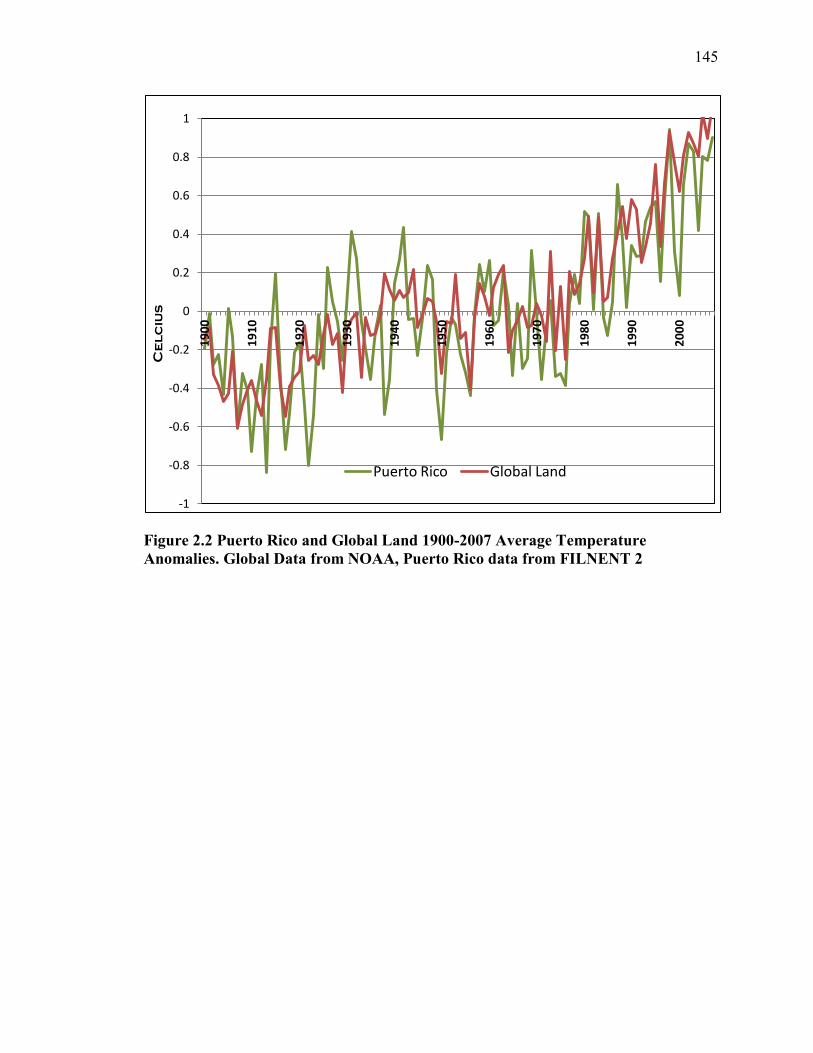
145
Figure 2.2 Puerto Rico and Global Land 1900-2007 Average Temperature
Anomalies. Global Data from NOAA, Puerto Rico data from FILNENT 2
-1
-0.8
-0.6
-0.4
-0.2
0
0.2
0.4
0.6
0.8
1
19
00
19
10
19
20
19
30
19
40
19
50
19
60
19
70
19
80
19
90
20
00
Puerto Rico Global Land
Ce
lc
ius
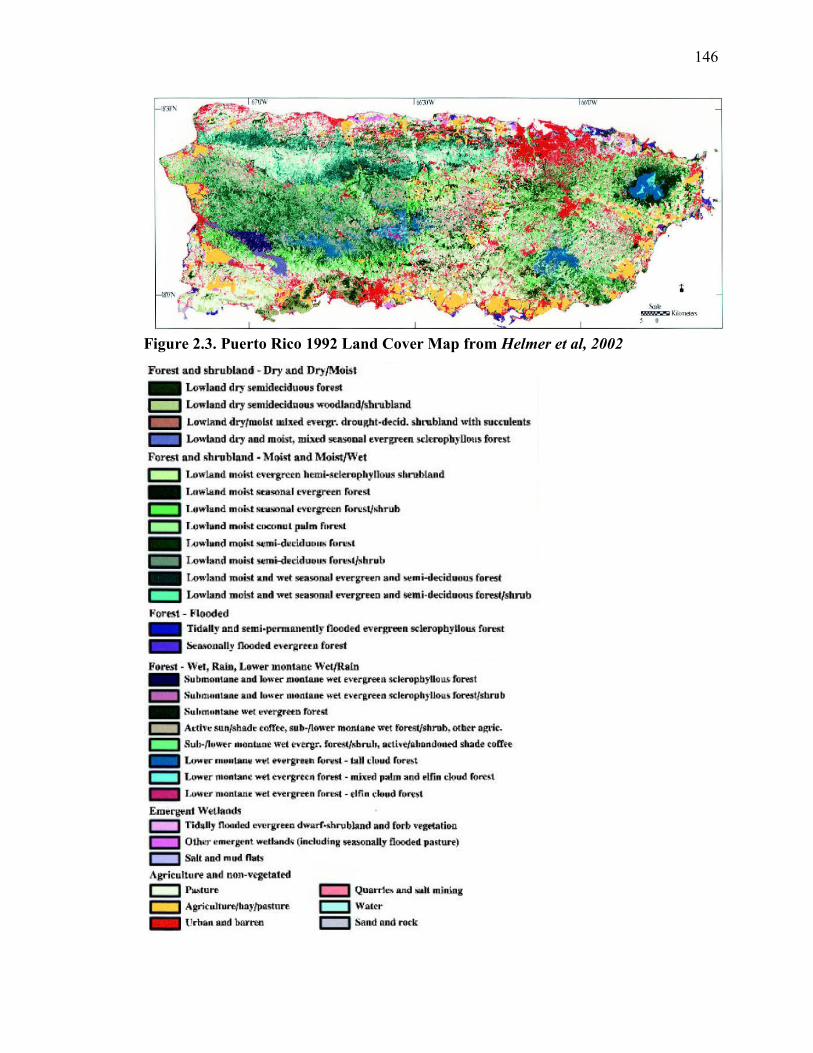
146
Figure 2.3. Puerto Rico 1992 Land Cover Map from Helmer et al, 2002

147
Figure 2.4. Puerto Rico GAP 2004 Land Cover Map from Gould et al, 2007
.0 10 20 30 405
Miles

148
Figure 2.5. Puerto Rico Holdridge Ecological Lifezones (HELZ), urban areas and
weather stations. HELZ data from US Forest Service, urban areas data from
Puerto Rico GAP 20014, weather stations data from NOAA Historical Climate
Network
.0 10 20 30 405
Miles
Legend
Stations
Heavy Urban 2004
HELZ
Holdridge Ecological Lifezones
Dry Forest
Moist Forest
Lower Montane Rain Forest
Subtropical Rain Forest
Lower Montane Wet Forest
Subtropical Wet Forest
costa
Legend
Stations
Heavy Urban 2004
HELZ
Holdridge Ecological Lifezones
Dry Forest
Moist Forest
Lower Montane Rain Forest
Subtropical Rain Forest
Lower Montane Wet Forest
Subtropical Wet Forest
costa

149
Figure 2.6. Distribution of years registering normal (80% frequency), above normal
(>10% frequency) and below normal (<10% frequency) minimum temperature at
each HELZ
0.0%
10.0%
20.0%
30.0%
40.0%
50.0%
60.0%
70.0%
80.0%
90.0%
100.0%
< 10% 11-89% > 90%
Puerto Rico Wet Forest Moist Forest Dry Forest
% o
f y
ears

150
Figure 2.7 Distribution of years registering normal (80% frequency), above normal
(>10% frequency) and below normal (<10% frequency) average temperatures at
each HELZ
0.0%
10.0%
20.0%
30.0%
40.0%
50.0%
60.0%
70.0%
80.0%
90.0%
100.0%
< 10% 11-89% > 90%
Puerto Rico Wet Forest Moist Forest Dry Forest
% o
f y
ears
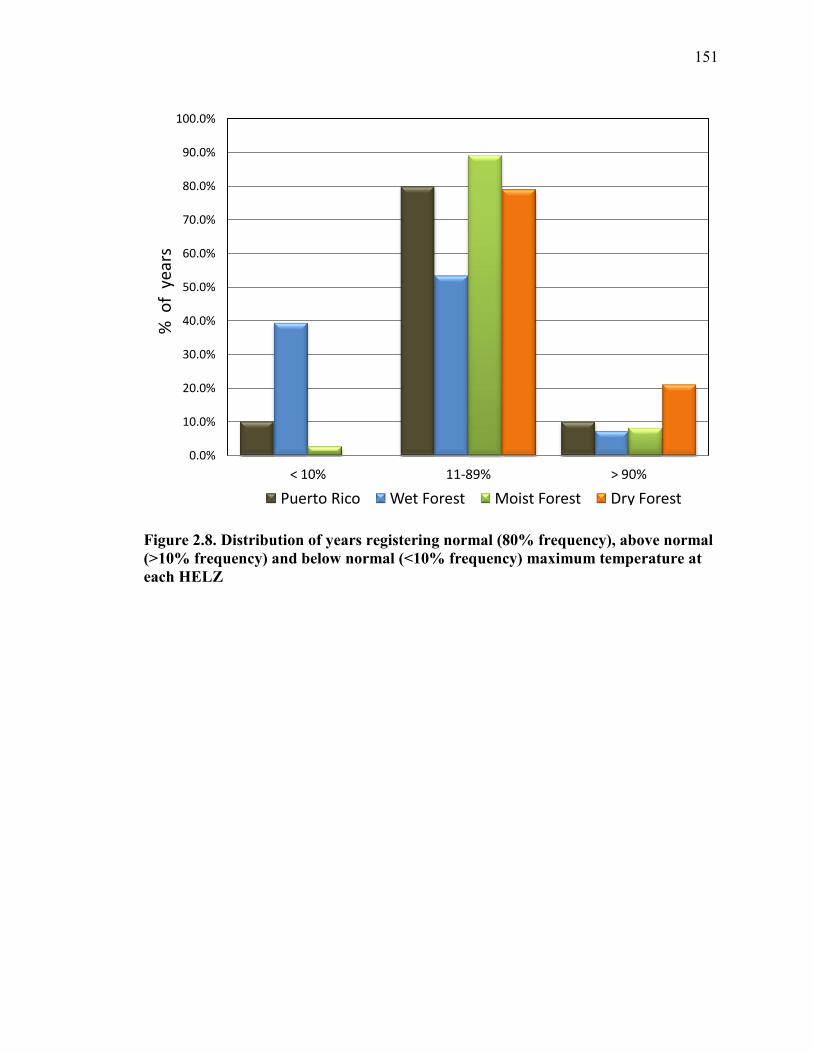
151
Figure 2.8. Distribution of years registering normal (80% frequency), above normal
(>10% frequency) and below normal (<10% frequency) maximum temperature at
each HELZ
0.0%
10.0%
20.0%
30.0%
40.0%
50.0%
60.0%
70.0%
80.0%
90.0%
100.0%
< 10% 11-89% > 90%
Puerto Rico Wet Forest Moist Forest Dry Forest
% o
f y
ears

152
Figure 2.9. Puerto Rico’s SPLINE interpolated Century Maximum Temperature
EOF
Legend
urban_2004_area
lifezones83_transparent
<all other values>
ECOZONE
df-S
mf-S
rf-LM
rf-S
wf-LM
wf-S
Stations
FILNET_Max_T_EOF
ValueHigh : 167045
Low : 5690
.0 10 20 30 405
Miles

153
Figure 2.10. Puerto Rico’s SPLINE interpolated Century Average Temperature
EOF
.0 10 20 30 405
Miles
Legend
urban_2004_area
lifezones83_transparent
<all other values>
ECOZONE
df-S
mf-S
rf-LM
rf-S
wf-LM
wf-S
Stations
FILNET_Ave_T_EOF
ValueHigh : 165077
Low : 3146

154
Figure 2.11. Puerto Rico’s SPLINE interpolated Century Minimum Temperature
EOF
.0 10 20 30 405
Miles
Legend
urban_2004_area
lifezones83_transparent
<all other values>
ECOZONE
df-S
mf-S
rf-LM
rf-S
wf-LM
wf-S
Stations
FILNET_Min_T_EOF
ValueHigh : 181039
Low : -33286

155
Figure 2.12. Puerto Rico’s 1900-2007 Maximum Temperature Station Trends
-0.040
-0.030
-0.020
-0.010
0.000
0.010
0.020
0.030
Ce
lciu
s/ye
ar

156
Figure 2.13. Puerto Rico’s 1900-2007 Average Temperature Station Trends
-0.030
-0.020
-0.010
0.000
0.010
0.020
0.030
Ce
lciu
s/ye
ar

157
Figure 2.14. Puerto Rico’s 1900-2007 Minimum Temperature Station Trends
-0.030
-0.020
-0.010
0.000
0.010
0.020
0.030
Ce
lciu
s/ye
ar

158
Figure 2.15. Puerto Rico’s 1900-2007 Maximum Temperature station trend
frequency distribution
0%
10%
20%
30%
40%
50%
60%
70%
80%
90%
100%
< 10% 11-89% > 90%
Total Wet Forest Moist Forest Dry Forest
% o
f st
atio
ns

159
Figure 2.16. Puerto Rico’s 1900-2007 Average Temperature station trend frequency
distribution
0%
10%
20%
30%
40%
50%
60%
70%
80%
90%
100%
< 10% 11-89% > 90%
Total Wet Forest Moist Forest Dry Forest
% o
f st
atio
ns

160
Figure 2.17. Puerto Rico’s 1900-2007 Minimum Temperature station trend
frequency distribution
0%
10%
20%
30%
40%
50%
60%
70%
80%
90%
100%
< 10% 11-89% > 90%
Total Wet Forest Moist Forest Dry Forest
% o
f st
atio
ns

161
Figure 2.18. Puerto Rico’s Urban 1900-2007 Average Temperature years frequency
distribution
0.0%
10.0%
20.0%
30.0%
40.0%
50.0%
60.0%
70.0%
80.0%
90.0%
100.0%
< 10% 11-89% > 90%
Moist Forest Urban 92 A Urban 92 B Urban 04 A Urban 04 B
% o
f ye
ars

162
Figure 2.19. Puerto Rico’s HELZ 1963-1995 Average Temperature year frequency
distribution
0.0%
10.0%
20.0%
30.0%
40.0%
50.0%
60.0%
70.0%
80.0%
90.0%
100.0%
< 10% 11-89% > 90% Moist Forest Urban 92 A Urban 92 B Urban 04 A Urban 04 B
% o
f ye
ars

163
Figure 2.20 FILNET GIS interpolated data urban minus non-urban temperature
differences by type of temperature
0.00
0.50
1.00
1.50
2.00
2.50
Maximum Average Minimum
Wet Forest Moist Forest Dry Forest
Tem
per
atu
re (
Cel
ciu
s)

164
Figure 2.21 PRISM data urban minus non-urban temperature differences by type of
temperature
0.00
0.50
1.00
1.50
2.00
2.50
Maximum Average Minimum
Wet Forest Moist Forest Dry Forest
Tem
pe
ratu
re (
Cel
ciu
s)

165
Figure 2.22. FILNET urban minus non-urban temperatures differences by HELZ
0.00
0.50
1.00
1.50
2.00
2.50
Wet Forest Moist Forest Dry Forest
Minimum Average Maximum
Tem
pe
ratu
re (
Cel
ciu
s)

166
Figure 2.23. PRISM urban minus non-urban temperatures differences by HELZ
0.00
0.50
1.00
1.50
2.00
2.50
Wet Forest Moist Forest Dry Forest
Minimum Average Maximum
Tem
per
atu
re (
Cel
ciu
s)

167
CHAPTER 3 PRECIPITATION FIGURES
Figure 3.1. Puerto Rico’s Holdridge Ecological Lifezones, Areas of Interest &
Weather stations. HELZ data from US Forest Service, urban areas data from
Puerto Rico GAP 20014, weather stations data from NOAA Historical Climate
Network
.0 10 20 30 405
Miles
Legend
Stations
Heavy Urban 2004
HELZ
Holdridge Ecological Lifezones
Dry Forest
Moist Forest
Lower Montane Rain Forest
Subtropical Rain Forest
Lower Montane Wet Forest
Subtropical Wet Forest
costa
Legend
Stations
Heavy Urban 2004
HELZ
Holdridge Ecological Lifezones
Dry Forest
Moist Forest
Lower Montane Rain Forest
Subtropical Rain Forest
Lower Montane Wet Forest
Subtropical Wet Forest
costa

168
Figure 3.2 1900-2007 Average and Median Monthly Precipitation for Puerto Rico’s
Holdridge Ecological Lifezones
2.0
6.0
10.0
14.0
18.0
22.0
26.0
30.0
Wet Forest Average Wet Forest Median Moist Forest Average Moist Forest Median Dry Forest Average Dry Forest Median
Mo
nth
ly P
reci
pit
atio
n (
cm/m
on
th)

169
Figure 3.3. Puerto Rico’s Holdridge Ecological Lifezones Average and Median
Monthly Precipitation through the decades
3.0
8.0
13.0
18.0
23.0
1900 1910 1920 1930 1940 1950 1960 1970 1980 1990 2000
Wet Forest Average Wet Forest Median Moist Forest Average Moist Forest Median Dry Forest Average Dry Forest Median
Mo
nth
ly P
reci
pit
atio
n (
cm/m
on
th)

170
Figure 3.4. Puerto Rico 1992 Land Cover Map from Helmer et al, 2002

171
Figure 3.5. Puerto Rico GAP 2004 Land Cover Map from Gould et al, 2007
.0 10 20 30 405
Miles

172
Figure 3.6. Monthly Average and Median Precipitation for Urban stations by
HELZ
1.5
4.5
7.5
10.5
13.5
16.5
19.5
22.5
25.5
January February March April May June July August September October November December
Urban RWF 92B 60m Average Urban RWF 92B 60m Median Urban MF 92B 30m Average Urban MF 92B 30m Median Urban MF 2004B 60m Average Urban MF 2004B 60m Median Urban DF 92B 60m Average Urban DF 92B 60m Median Urban DF 2004B 60m Average Urban DF 2004 B 60m Median
Mo
nth
ly P
reci
pit
atio
n (
cm/m
on
th)

173
Figure 3.7. Average & Median Urban versus Non Urban Monthly Precipitation for
Wet Forest selections
4.0
9.0
14.0
19.0
24.0
29.0
Wet Forest Urban 92B 60m Average Wet Forest Urban 92B 60m Median Wet Forest Non Urban 92B 60m Average Wet Forest Non Urban 92B 60m Median Urban RWF 92B 90m Average Urban RWF 92B 90m Median WF Non Urban 92B 90m Average WF Non Urban 92B 90m Median
Mo
nth
ly P
reci
pit
atio
n (
cm/m
on
th)

174
Figure 3.8. Monthly Average and Median Precipitation for the Moist Forest Urban
A and Non-Urban Selections
5.0
7.0
9.0
11.0
13.0
15.0
17.0
19.0
21.0
January February March April May June July August September October November December
Moist Forest Total Average Moist Forest Total Median Urban MF 92A Average Urban MF 92A Median Urban MF 2004A Average Urban MF 2004A Median MNFU 92A Average MFNU 92A Median MFNU 2004A Average MFNU 2004A Median
Mo
nth
ly P
reci
pit
atio
n (
cm/m
on
th)

175
Figure 3.9. Monthly Average and Median Precipitation for the Moist Forest Urban
B and Non-Urban Selections
5.0
7.0
9.0
11.0
13.0
15.0
17.0
19.0
21.0
January February March April May June July August September October November December
Moist Forest Total Average Moist Forest Total Median
Urban MF 92B 30m Average Urban MF 92B 30m Median
Urban MF 2004B 30m Average Urban MF 2004B 30m Median
Urban MF 2004B 60m Average Urban 2004B 60m Median
MFNU 92B 30m Average MFNU 92B 30m Median
MFNU 2004B 30m Average MFNU 2004B 30m Median
MFNU 2004B 60m Average MFNU 2004B 60m Median
Mo
nth
ly P
reci
pit
atio
n (
cm/m
on
th)

176
Figure 3.10. Average Monthly Precipitation for the Dry Forest Urban 1992 A and
Non- Urban Selections
2.0
4.0
6.0
8.0
10.0
12.0
14.0
16.0
Jan Feb Mar Apr May Jun Jul Aug Spt Oct Nov Dec
Urban Dry Forest 92 A Average DF No Urban 92 A Average
Urban Dry Forest 92 B 30m Average DF No Urban 92 B 30m Average
Urban Dry Forest 92 B 60m Average DF No Urban 92 60m Average
Mo
nth
ly P
reci
pit
atio
n (
cm/m
on
th)

177
Figure 3.11. Median Monthly Precipitation for the Dry Forest Urban 1992 A and
Non- Urban Selections
1.5
3.5
5.5
7.5
9.5
11.5
13.5
Jan Feb Mar Apr May Jun Jul Aug Spt Oct Nov Dec
Urban Dry Forest 92 A Median DF No Urban 92 A Median
Urban Dry Forest 92 B 30m Median DF No Urban 92 B 30m Median
Urban Dry Forest 92 B 60m Median DF No Urban 92 B 60m Median
Mo
nth
ly P
reci
pit
atio
n (
cm/m
on
th)

178
Figure 3.12. Average Monthly Precipitation for Dry Forest 2004 Urban versus Non-
Urban Selections
2.0
4.0
6.0
8.0
10.0
12.0
14.0
16.0
Jan Feb Mar Apr May Jun Jul Aug Spt Oct Nov Dec
Urban Dry Forest 2004 A Average DF No Urban 2004 A Average
Urban Dy Forest 2004 B 30m Average DF No Urban 2004 B 30m Average
Urban Dry Forest 2004 B 60m Average DF No Urban 2004 B 60m Average
Mo
nth
ly P
reci
pit
atio
n (
cm/m
on
th)

179
Figure 3.13. Median Monthly Precipitation for Dry Forest 2004 Urban versus Non-
Urban Selections
2.0
4.0
6.0
8.0
10.0
12.0
14.0
Jan Feb Mar Apr May Jun Jul Aug Spt Oct Nov Dec
Urban Dry Forest 04 A Median DF No Urban 04 A Median
Urban Dry Forest 04 B 30m Median DF No Urban 04 B 30m Median
Urban Dry Forest 04 B 60m Median DF No Urban 04 B 60m Median
Mo
nth
ly P
reci
pit
atio
n (
cm/m
on
th)

180
Figure 3.14. Puerto Rico Annual Cycle Monthly Precipitation by Periods (cm)
0.0
5.0
10.0
15.0
20.0
25.0
30.0
35.0
Jan Feb Mar Apr May Jun Jul Aug Spt Oct Nov Dec
1900-1929 1930-1959 1960-1989 1990-2007
Pre
cip
itat
ion
(cm
/mo
nth
)

181
Figure 3.15. Wet Forest Annual Cycle Monthly Precipitation by Periods (cm)
0.0
5.0
10.0
15.0
20.0
25.0
30.0
35.0
Jan Feb Mar Apr May Jun Jul Aug Spt Oct Nov Dec
1900-1929 1930-1959 1960-1989 1990-2007
Pre
cip
itat
ion
(cm
/mo
nth
)

182
Figure 3.16. Moist Forest Annual Cycle Monthly Precipitation by Periods (cm)
0.0
5.0
10.0
15.0
20.0
25.0
30.0
35.0
Jan Feb Mar Apr May Jun Jul Aug Spt Oct Nov Dec
1900-1929 1930-1959 1960-1989 1990-2007
Pre
cip
itat
ion
(cm
/mo
nth
)

183
Figure 3.17. Dry Forest Annual Cycle Monthly Precipitation by Periods
0.0
5.0
10.0
15.0
20.0
25.0
30.0
35.0
Jan Feb Mar Apr May Jun Jul Aug Spt Oct Nov Dec
1900-1929 1930-1959 1960-1989 1990-2007
Pre
cip
itat
ion
(cm
/mo
nth
)

184
Figure 3.18 Seasonal Monthly Total Precipitation by Periods
0.0
5.0
10.0
15.0
20.0
25.0
30.0
1900-1929 1930-1959 1960-1989 1990-2007
Wet Forest Dry Wet Forest Wet
Moist Forest Dry Moist Forest Wet
Dry Forest Dry Dry Forest Wet P
reci
pit
atio
n c
m/m
on
th
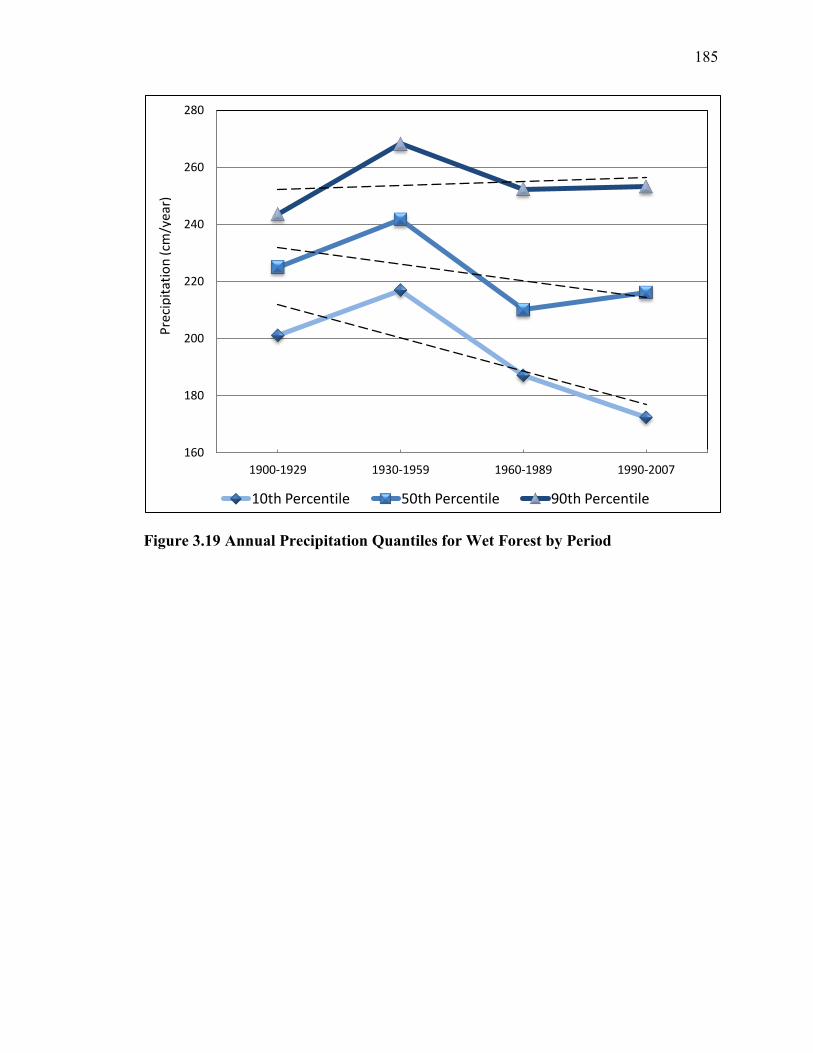
185
Figure 3.19 Annual Precipitation Quantiles for Wet Forest by Period
160
180
200
220
240
260
280
1900-1929 1930-1959 1960-1989 1990-2007
10th Percentile 50th Percentile 90th Percentile
Pre
cip
itat
ion
(cm
/yea
r)

186
Figure 3.20 Annual Precipitation Quantiles for Moist Forest by Period
120
130
140
150
160
170
180
190
200
210
220
1900-1929 1930-1959 1960-1989 1990-2007
10th Percentile 50th Percentile 90th Percentile
Pre
cip
itat
ion
(cm
/yea
r)

187
Figure 3.21 Annual Precipitation Quantiles for Dry Forest by Period
60
70
80
90
100
110
120
130
140
1900-1929 1930-1959 1960-1989 1990-2007
10th Percentile 50th Percentile 90th Percentile
Pre
cip
itat
ion
(cm
/ye
ar)
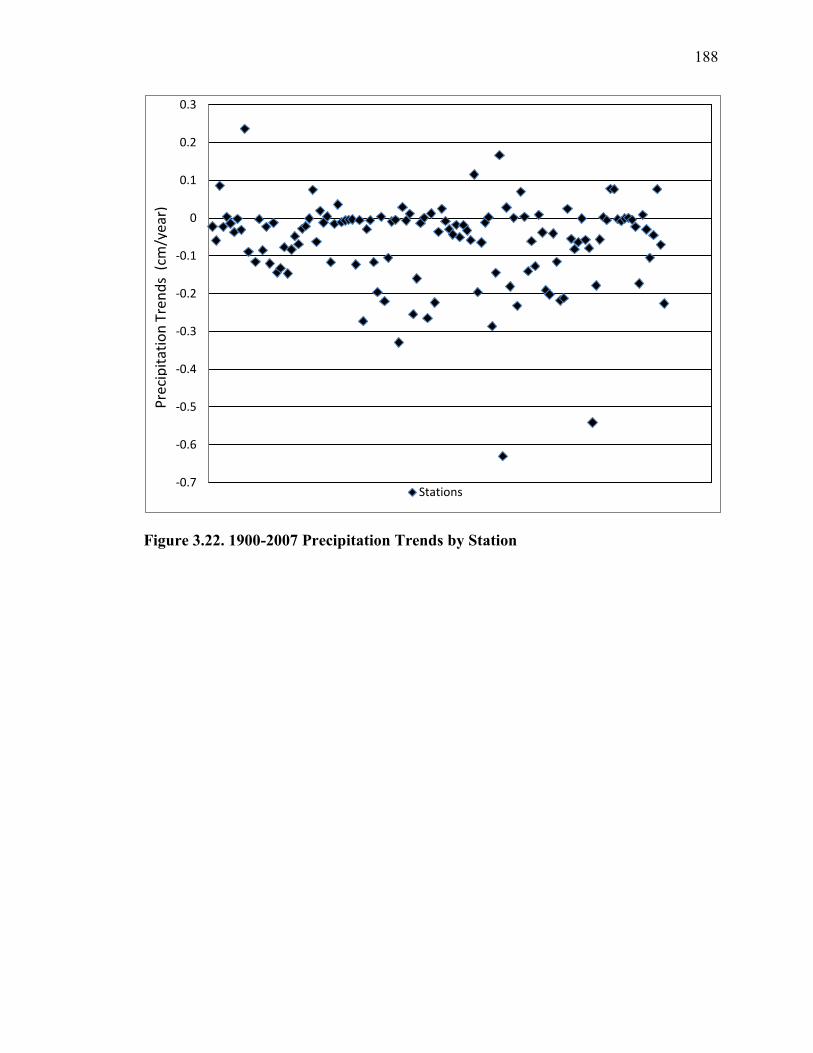
188
Figure 3.22. 1900-2007 Precipitation Trends by Station
-0.7
-0.6
-0.5
-0.4
-0.3
-0.2
-0.1
0
0.1
0.2
0.3
Stations
Pre
cip
itat
ion
Tre
nd
s (
cm/y
ear)

189
Figure 3.23. 1900-2007 Station Precipitation Trends by period
0
10
20
30
40
50
60
70
80
90
100
1900-1929 1930-1959 1960-1989 1990-2007
Stations showing Positive trends Stations showing negative trends
Nu
mb
er o
f St
atio
ns

190
Figure 3.24. Number of stations with positive versus negative trends by HELZ and
period
0
10
20
30
40
50
60
70
80
90
100
1900-1929 1930-1969 1970-1989 1990-2007
Puerto Rico Positive Puerto Rico Negative
Dry Forest Positive Dry Forest Negative
Moist Forest Positive Moist Forest Negative
Wet Forest Positive Wet Forest Negative
Nu
mb
er o
f P
reci
pit
atio
n S
tati
on
s

191
Figure 3.25 Yearly Average Total Precipitation Urban versus Non-Urban
Difference
-100.0
-80.0
-60.0
-40.0
-20.0
0.0
20.0
40.0
60.0
80.0
100.0
1900-1929 1930-1959 1960-1989 1990-2007
Wet Forest Moist Forest Dry Forest
Pre
cip
itat
ion
Dif
fere
nce
(cm
/ye
ar)

192
Figure 3.26. Number of study periods receiving higher Yearly Average Urban
versus Non-Urban Total Precipitation
0
1
2
3
4
5
6
Wet Forest Moist Forest Dry Forest
Urban Non Urban
Nu
mb
er o
f S
tud
y P
erio
ds

193
Figure 3.27. Number of study periods recording higher Urban versuss Non-Urban
precipitation trends
0
1
2
3
4
5
6
7
Wet Forest Moist Forest Dry Forest
Urban Non Urban N
um
ber
of
Stu
dy
Per
iod
s

194
CHAPTER 4 RAMS FIGURES
Figure 4.1. Map detailing location of each grid for the study. The 50km resolution of
the GFS input data is overlaid on the outermost grid.

195
Figure 4.2. Map detailing LEAF-3 land-use types near Puerto Rico.

196
Figure 4.3. Map of radar derived observed precipitation within the inner grid for
1200UTC 5/23 to 1200UTC 5/24.

197
Figure 4.1. Map detailing areas of land-use change within the model for each set of
scenarios. Also shown is the region downwind of San Juan analyzed, and the
subdivisions of the island analyzed.

198
Figure 4.2. Observed versus simulated temperature during study for a) San Juan
International Airport, b) Arecibo, c) Mayaguez, and d) Yabucoa Harbor.

199
Figure 4.3. Total simulated precipitation for the inner grid, shown on the same scale
as radar derived precipitation in Figure .

200
Figure 4.4. Changes in sensible and latent heat fluxes at 18UTC 5/23/10 showing an
increase in both gradients.

201
Figure 4.5. Total accumulated precipitation as a ratio to control for the entire island.

202
Figure 4.6. Total accumulated precipitation as a ratio to control for the western part
of the island.
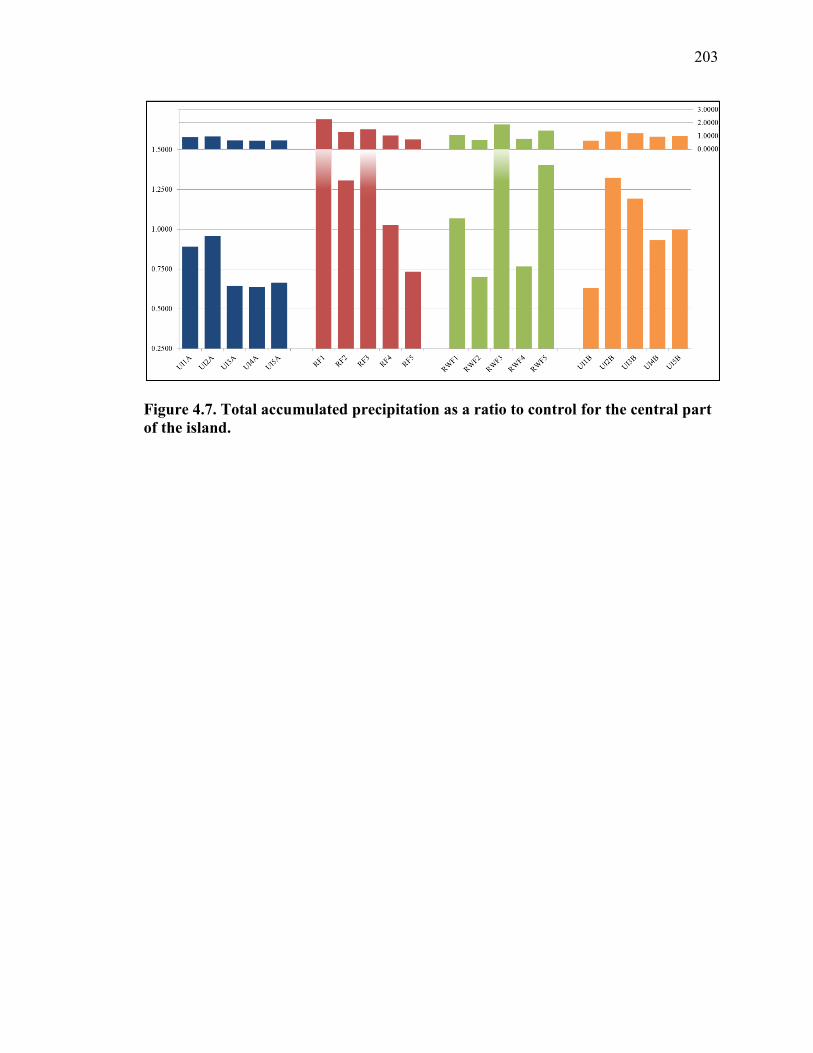
203
Figure 4.7. Total accumulated precipitation as a ratio to control for the central part
of the island.

204
Figure 4.8: Total accumulated precipitation as a ratio to control for the eastern part
of the island.

205
Figure 4.9. Total accumulated precipitation as a ratio to control for the region
downwind of San Juan.

206
Figure 4.10. Total accumulated precipitation as a ratio to control for individual
areas of changed land surface for each scenario.

207
Figure 4.11. Comparison of the change in precipitation between the a) UI5A
scenario and b) UI5B scenario. In UI5A, the surface is changed to forest, reducing
the urban gradient and reducing upwind precipitation. In UI5B, the expanded
urban envelope changes the location of the mesoscale circulation, changing the
location of upwind precipitation.
(a)
(b)

208
Figure 4.12. Precipitation difference between control and RF1 scenario. Resulting
precipitation represents the combined effects of the changed land surface from
forest to bare soil interacting with the unchanged urban area to the west.

209
Figure 4.13. Map of precipitation difference between control and a) RWF4 scenario
and b) RWF5 scenario. Shown here for clarification of large percentage difference
in Fig. 12.
(b)
(a)

210
Figure 4.17. Control 6 hour Average Precipitation Time Series
0
0.1
0.2
0.3
0.4
0.5
0.6
0.7
0.8
0.9
1
1.1
18UTC 5/21 00UTC 5/22 06UTC 5/22 12UTC 5/22 18UTC 5/22 00UTC 5/23 06UTC 5/23 12UTC 5/23 18UTC 5/23 00UTC 5/24 06UTC 5/24 12UTC 5/24
Pre
cip
itat
ion
(ce
nti
met
ers)
Total Island
Western 3rd
Central 3rd
Eastern 3rd
Downwind of San Juan
May 23, 2010
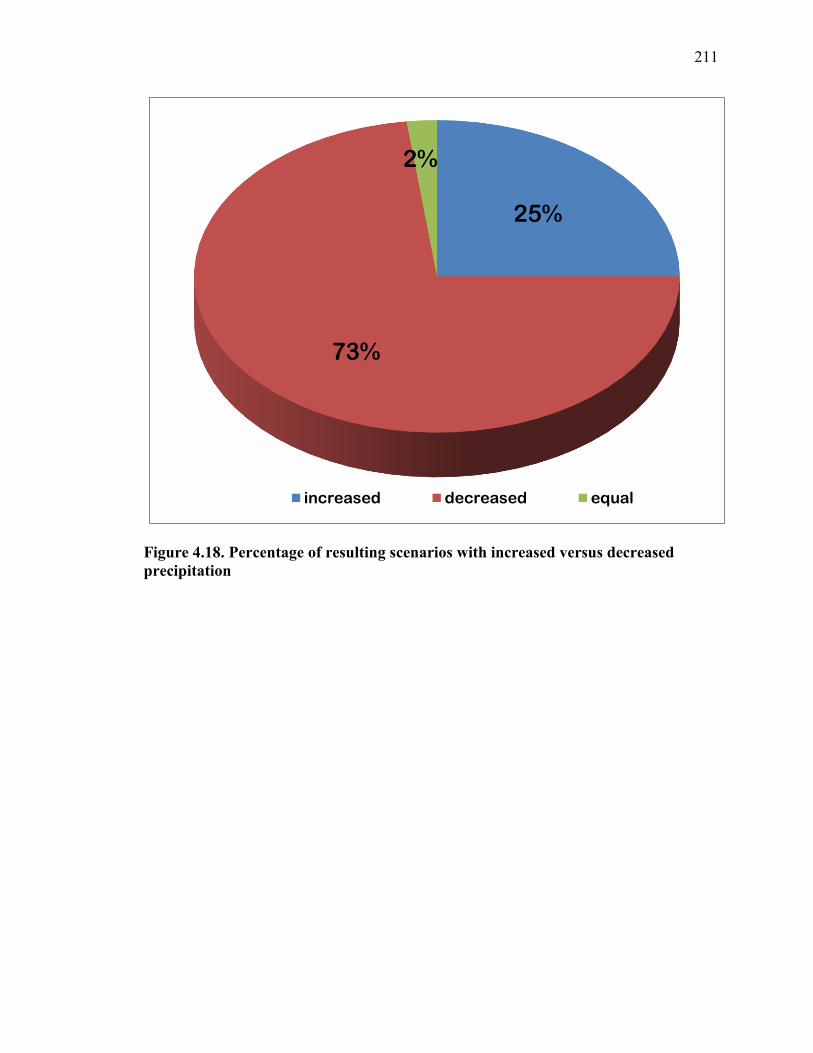
211
Figure 4.18. Percentage of resulting scenarios with increased versus decreased
precipitation
25%
73%
2%
increased decreased equal

212
Figure 4.19. Percentage of Increase versus Decrease Precipitation Results by
Scenario
0%
10%
20%
30%
40%
50%
60%
70%
80%
90%
100%
increase decrease
Shrubs Expand Forests Bare Soil Expand City Crops Grassland Forests
Perc
enta
ge o
f Sce
nari
o Re
sults

213
Figure 4.20. Precipitation Response ratio for each scenario at each region relative to
control
0.00
0.50
1.00
1.50
2.00
2.50
Total Island Western 3rd Central 3rd Eastern 3rd Downwind of San Juan
Urban/Bare Soil Urban/Grassland Urban/Shrubs Urban/Crops Urban/Forest Rain Forest/Bare Soil Rain Forest/Grassland Rain Forest/Shrubs Rain Forest/Crops Rain Forest/Expand all Regenerated Forest/Bare Soil Regenerated Forest/Grassland Regenerated Forest/Shrubs Regenerated Forest/Crops Regenerated Forest/Expand all Urban/Expand West Urban/Expand South Urban/Expand East Urban/Expand East & West Urban/Expand all
cm

APPENDICES

214
Appendix A Figures
Figure A.1. Ecozones Decadal Average Temperature Dry Season Standardized
Anomalies
-2.5
-2
-1.5
-1
-0.5
0
0.5
1
1.5
2
2.5
19
00
19
10
19
20
19
30
19
40
19
50
19
60
19
70
19
80
19
90
20
00
Dry Forest Dry Moist Forest Dry Urban 1992 Dry Urban 2004 Dry Moist Forest No Urban Dry Wet Forest Dry Wet Forest East Dry Wet Forest West Dry Puerto Rico
Te
mp
era
ture
(C
elc
ius
)

215
Figure A.2. Ecozones Decadal Average Temperature Wet Season Standardized
Anomalies
-2.5
-2
-1.5
-1
-0.5
0
0.5
1
1.5
2
2.5
19
00
19
10
19
20
19
30
19
40
19
50
19
60
19
70
19
80
19
90
20
00
Dry Forest Wet Moist Forest Wet Urban 1992 A Wet Urban 2004 A Wet Moist Forest No Urban Wet Forest Wet
Te
mp
era
ture
(C
elc
ius
)
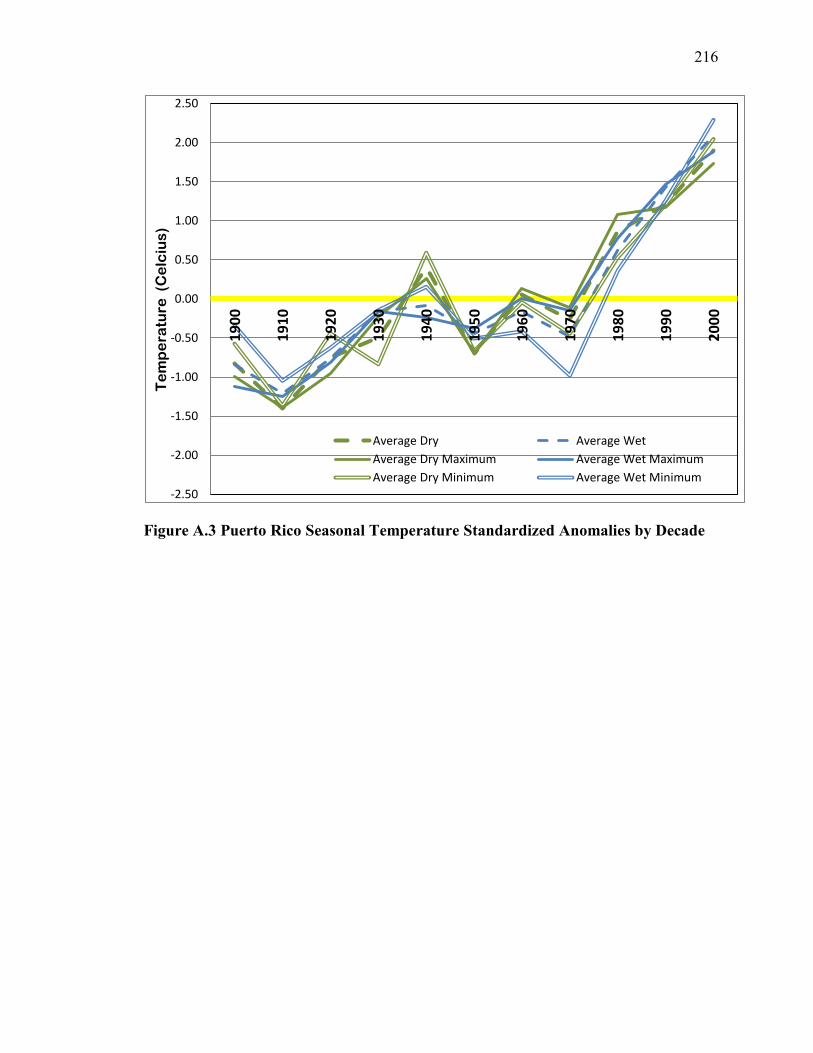
216
Figure A.3 Puerto Rico Seasonal Temperature Standardized Anomalies by Decade
-2.50
-2.00
-1.50
-1.00
-0.50
0.00
0.50
1.00
1.50
2.00
2.50
19
00
19
10
19
20
19
30
19
40
19
50
19
60
19
70
19
80
19
90
20
00
Average Dry Average Wet
Average Dry Maximum Average Wet Maximum
Average Dry Minimum Average Wet Minimum
Te
mp
era
ture
(C
elc
ius
)

217
Figure A.4 Dry Forest Percentage Decadal Temperature changes
-2.00%
-1.50%
-1.00%
-0.50%
0.00%
0.50%
1.00%
1.50%
2.00%
1910 1920 1930 1940 1950 1960 1970 1980 1990 2000
min ave max
Te
mp
era
ture
(C
elc
ius
)

218
Figure A.5 Moist Forest Percentage Decadal Temperature changes
-2.00%
-1.50%
-1.00%
-0.50%
0.00%
0.50%
1.00%
1.50%
2.00%
1910 1920 1930 1940 1950 1960 1970 1980 1990 2000
min ave max
Te
mp
era
ture
(C
elc
ius
)

219
Figure A.6 Wet Forest Percentage Decadal Temperature changes
-2.00%
-1.50%
-1.00%
-0.50%
0.00%
0.50%
1.00%
1.50%
2.00%
1910 1920 1930 1940 1950 1960 1970 1980 1990 2000
min ave max
Te
mp
era
ture
(C
elc
ius
)

220
Figure A.7 1992 A Urban minus Non-Urban Decadal Temperature Difference
-2.0
-1.5
-1.0
-0.5
0.0
0.5
1.0
1.5
2.0
1900 1910 1920 1930 1940 1950 1960 1970 1980 1990 2000
Tem
pe
ratu
re (
Ce
lciu
s)
Min Ave Max

221
Figure A.8 1992 B Urban minus Non-Urban Decadal Temperature Difference
-2.0
-1.5
-1.0
-0.5
0.0
0.5
1.0
1.5
2.0
1900 1910 1920 1930 1940 1950 1960 1970 1980 1990 2000
Tem
pe
ratu
re (
Ce
lciu
s)
Min Ave Max

222
Figure A.9. 2004 A Urban minus Non-Urban Decadal Temperature Difference
-2.0
-1.5
-1.0
-0.5
0.0
0.5
1.0
1.5
2.0
1900 1910 1920 1930 1940 1950 1960 1970 1980 1990 2000
Te
mp
era
ture
(C
elc
ius)
Min Ave Max
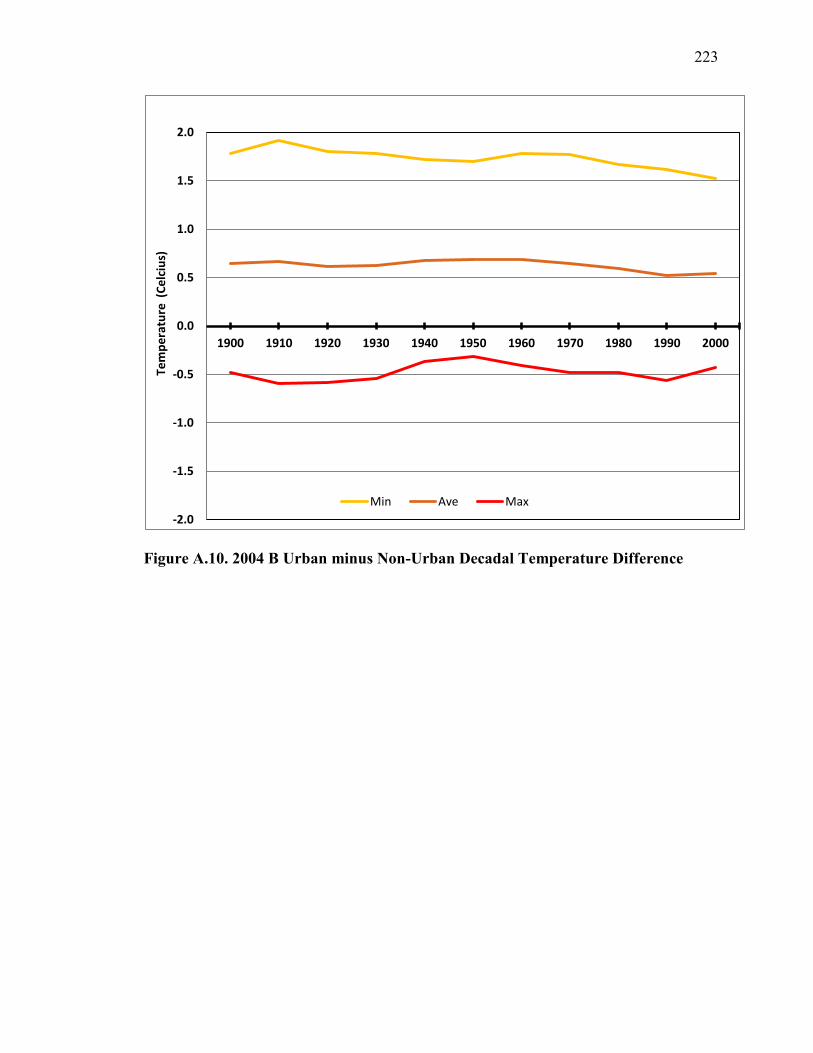
223
Figure A.10. 2004 B Urban minus Non-Urban Decadal Temperature Difference
-2.0
-1.5
-1.0
-0.5
0.0
0.5
1.0
1.5
2.0
1900 1910 1920 1930 1940 1950 1960 1970 1980 1990 2000
Tem
pe
ratu
re (
Ce
lciu
s)
Min Ave Max

224
Figure A.11 Urban 2004 A versus Urban 2004 B Average Monthly Temperature
18.5
20.5
22.5
24.5
26.5
28.5
30.5
Jan Feb Mar Apr May Jun Jul Aug Spt Oct Nov Dec
Urban 2004 A Max Urban 2004 B max
Urban 2004 A Ave Urban 2004 B Ave
Urban 2004 A Min Urban 2004 B Min
Tem
pe
ratu
re (
Cel
siu
s)

225
Figure A.12 Urban Stations Minimum Temperature 1900-2007 Trends Distribution
0%
10%
20%
30%
40%
50%
60%
70%
80%
< 10% 11-89% > 90%
Moist Forest Urban 92 A Urban 92 B Urban 04 A Urban 04 B
% o
f st
atio
ns

226
Figure A.13. Urban Stations Average Temperature 1900-2007 Trends Distribution
0%
10%
20%
30%
40%
50%
60%
70%
80%
< 10% 11-89% > 90%
Moist Forest Urban 92 A Urban 92 B Urban 04 A Urban 04 B
% o
f st
atio
ns

227
Figure A.14 Urban Stations Maximum Temperature 1900-2007 Trends Distribution
0%
10%
20%
30%
40%
50%
60%
70%
80%
90%
< 10% 11-89% > 90%
Moist Forest Urban 92 A Urban 92 B Urban 04 A Urban 04 B
% o
f st
atio
ns

228
Figure A.15 Station Monthly Minimum Temperature by HELZ
15.0
17.0
19.0
21.0
23.0
25.0
27.0
29.0
31.0
33.0
35.0
Jan Feb Mar Apr May Jun Jul Aug Sep Oct Nov Dec
Dry Forest
Moist Forest
Wet Forest
Tem
pe
ratu
re (
Cel
siu
s)

229
Figure A.16 Station Monthly Average Temperature by HELZ
15.0
17.0
19.0
21.0
23.0
25.0
27.0
29.0
31.0
33.0
35.0
Jan Feb Mar Apr May Jun Jul Aug Sep Oct Nov Dec
Dry Forest
Moist Forest
Wet Forest
Tem
per
atu
re (
Cel
siu
s)

230
Figure A.17 Station Monthly Average Temperature by HELZ
15.0
17.0
19.0
21.0
23.0
25.0
27.0
29.0
31.0
33.0
35.0
Jan Feb Mar Apr May Jun Jul Aug Sep Oct Nov Dec
Dry Forest
Moist Forest
Wet Forest
Tem
per
atu
re (
Cel
siu
s)

231
Figure A.18 Number of Precipitation Stations in Service per year 1900-2007
0
10
20
30
40
50
60
70
80
90
100
1900 1905 1910 1915 1920 1925 1930 1935 1940 1945 1950 1955 1960 1965 1970 1975 1980 1985 1990 1995 2000 2005
Dry Forest Moist Forest Wet Forest
Nu
mb
er
of
Stat
ion
s

232
Figure A.19 Percentage of Stations Registering Usual versus Extreme Yearly
Average Precipitation for 1900-2007 (Precipitation Station Frequency Distribution)
0%
10%
20%
30%
40%
50%
60%
70%
80%
90%
Scarse Usual Excess
Puerto Rico (all stations)
Per
cen
tage
of
stat
ion
s

233
Figure A.20. Percentage of Decades Registering Usual versus Extreme Yearly
Average Precipitation by HELZ (Decadal Frequency Distribution)
0.0%
10.0%
20.0%
30.0%
40.0%
50.0%
60.0%
70.0%
< 10% 11-89% > 90%
Wet Forest Moist Forest Dry Forest
Per
cen
tage
of
dec
ade
s

234
Figure A.21. Percentage of Decades Registering Usual versus Extreme Yearly
Average Precipitation in the Wet Forest by U/NU Land Cover (Decadal Frequency
Distribution)
0%
10%
20%
30%
40%
50%
60%
70%
80%
< 10% 11-89% > 90%
Wet Forest Urban 92B 60m No Urban 92B 60m Urban 92B 90m No Urban 92B 90m
Pe
rcen
tage
of
dec
ades

235
Figure A.22. Percentage of Decades Registering Usual versus Extreme Yearly
Average Precipitation in the Moist Forest by U/NU Land Cover (Decadal Frequency
Distribution)
0%
10%
20%
30%
40%
50%
60%
70%
80%
< 10% 11-89% > 90%
Moist Forest Urban 92A No Urban 92A Urban 2004A No Urban 2004A
Per
cen
tage
of
dec
ade
s

236
Figure A.23 Percentage of Decades Registering Usual versus Extreme Yearly
Average Precipitation in the Dry Forest by U/NU Land Cover (Decadal Frequency
Distribution)
0%
10%
20%
30%
40%
50%
60%
70%
80%
< 10% 11-89% > 90%
Dry Forest
Urban 92B 60m
NU 92B 60m
Urban 04A
No Urban 04A
Urban 04B 30m
No Urban 04B 30m
Per
cen
tage
of
de
cad
es

237
Figure A.24. 1963-1995 Average Annual Temperature map generated from PRISM
Annual Maximum and Minimum Temperature maps

238
Figure A. 25. Holdridge Ecological Lifezones, Temperature Stations and 2004 High
Density and Low Density Urban Areas
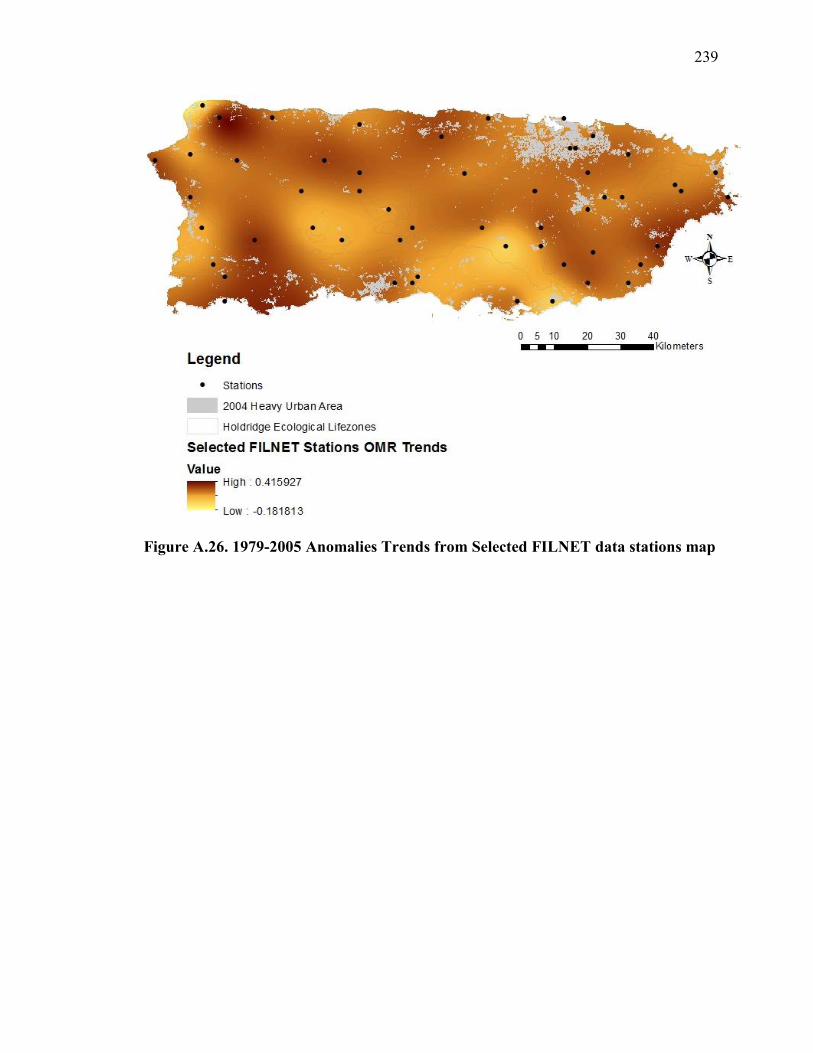
239
Figure A.26. 1979-2005 Anomalies Trends from Selected FILNET data stations map

240
Figure A. 27. 1979-2005 North America Regional Reanalysis Anomalies trends map

241
Figure A.28. 1979-2005 FILNET selected stations observations anomalies minus
North America Regional Reanalysis trends map
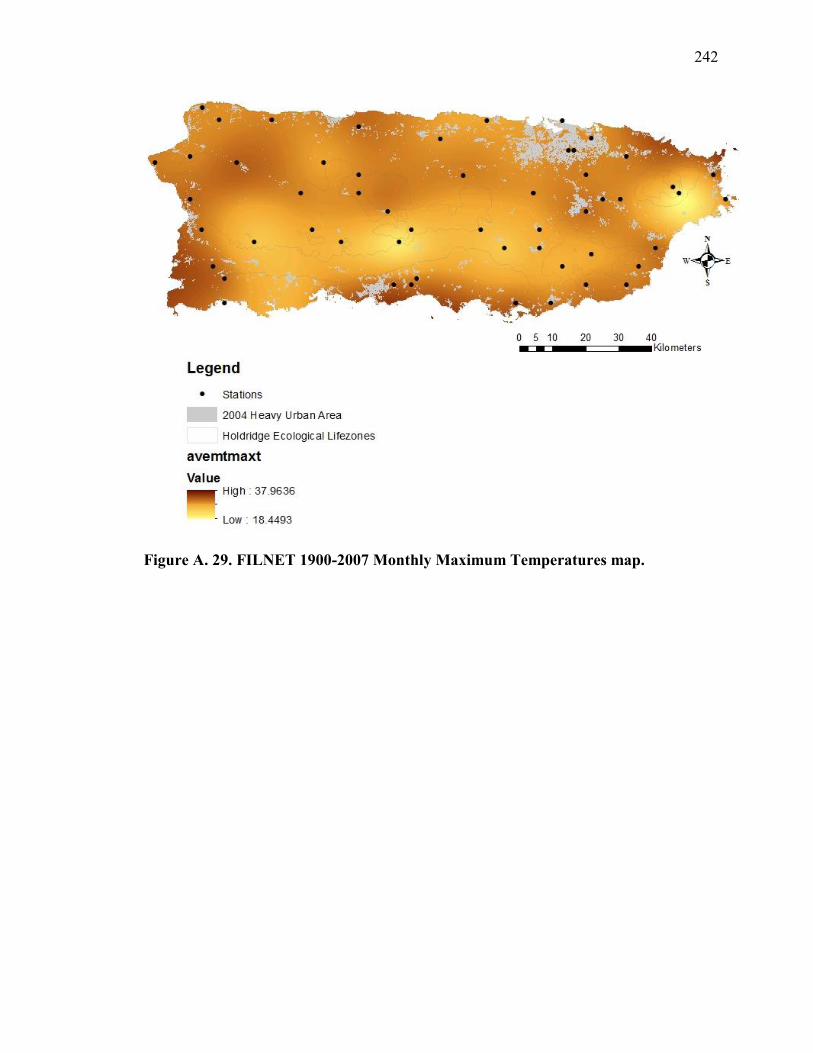
242
Figure A. 29. FILNET 1900-2007 Monthly Maximum Temperatures map.

243
Figure A.30. FILNET 1900-2007 Monthly Average Temperatures map

244
Figure A.31. FILNET 1900-2007 Monthly Minimum Temperatures map

245
Figure A.32. 1900-1929 Yearly Average Total Precipitation in centimeters at 100
meter resolution

246
Figure A.33. 1930-1959 Yearly Average Total Precipitation in centimeters at 100
meter resolution

247
Figure A.34. 1960-1989 Yearly Average Total Precipitation in centimeters at 100
meter resolution

248
Figure A.35. 1990-2007 Yearly Average Total Precipitation in centimeters at 100
meter resolution
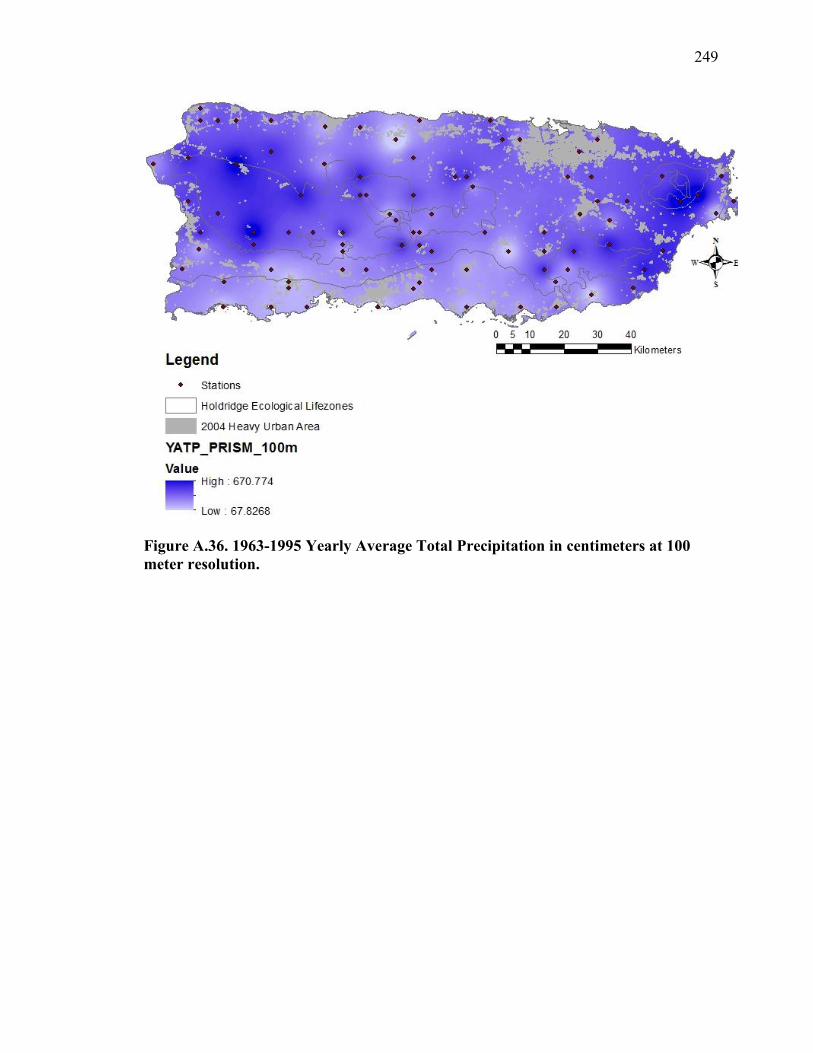
249
Figure A.36. 1963-1995 Yearly Average Total Precipitation in centimeters at 100
meter resolution.

250
Figure A.37. 1979-2005 Yearly Average Total Precipitation in centimeters at 100
meter resolution

251
Figure A.38. 1900-1929 Average Total Precipitation Trends at 100 meter resolution

252
Figure A. 39. 1930-1959 Average Total Precipitation Trends at 100 meter resolution

253
Figure A. 40. 1960-1989 Average Total Precipitation Trends at 100 meter resolution

254
Figure A.41. 1990-2007 Average Total Precipitation Trends at 100 meter resolution

255
Figure A. 42. 1963-1995 Average Total Precipitation Trends at 100 meter resolution

256
Figure A. 43. 1979-2005 Average Total Precipitation Trends at 100 meter resolution

25
7
Appendix B Tables
TABLE B.1. 1992 LULC CENTURY AVERAGE PRECIPITATION TRENDS (YEARLY VERSUS REGION)
Selection A Selection B 30 meters Selection B 60 meters Selection B 90 meters
1992 Urban No Urban Urban No Urban Urban No Urban Urban No Urban Remarks
WF N/A N/A - (100%) - (86%) - (100%) - (83%) - (100%) - (82%) Decreasing precipitation
MF - (85%) - (74%) - (81%) - (74%) N/A N/A N/A N/A Decreasing precipitation
DF 50/50 - (77%) - (75%) - (75%) N/A N/A N/A N/A Urban A behaving differently
Total - (80%) - (77%) - (80%) - (77%) N/A N/A N/A N/A Decreasing precipitation
Values are percentages of the number of stations located in urban or non urban areas respectively.
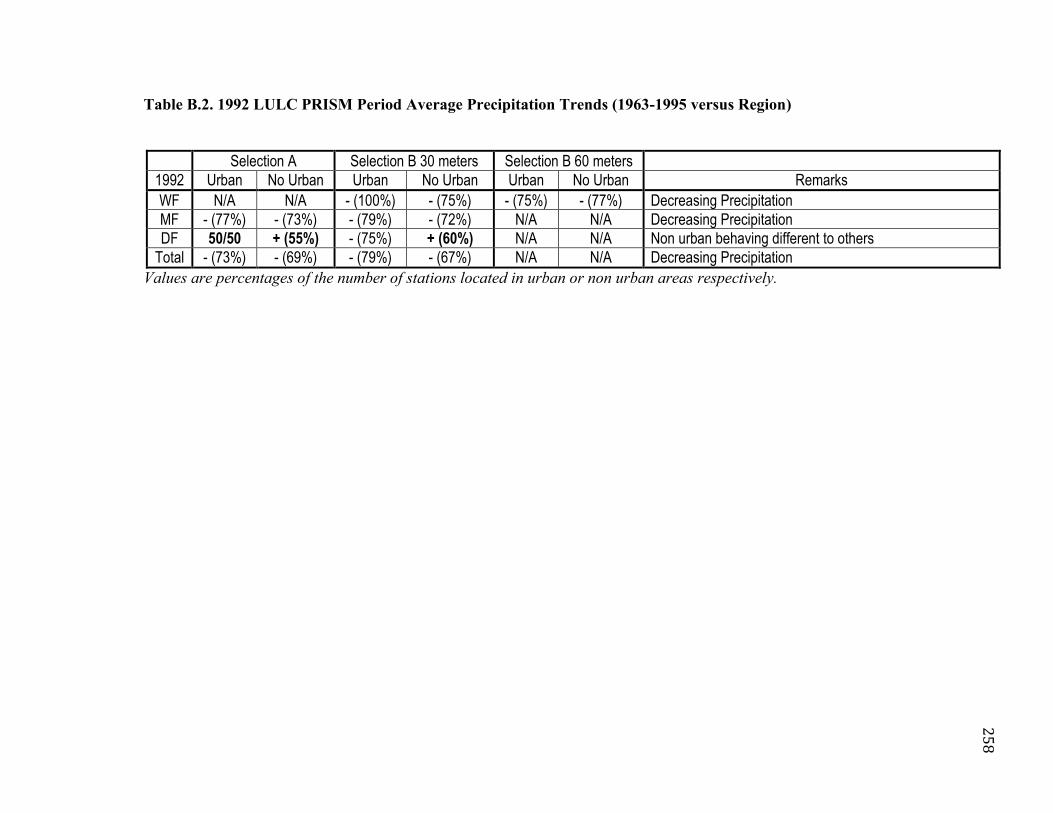
25
8
Table B.2. 1992 LULC PRISM Period Average Precipitation Trends (1963-1995 versus Region)
Selection A Selection B 30 meters Selection B 60 meters
1992 Urban No Urban Urban No Urban Urban No Urban Remarks
WF N/A N/A - (100%) - (75%) - (75%) - (77%) Decreasing Precipitation
MF - (77%) - (73%) - (79%) - (72%) N/A N/A Decreasing Precipitation
DF 50/50 + (55%) - (75%) + (60%) N/A N/A Non urban behaving different to others
Total - (73%) - (69%) - (79%) - (67%) N/A N/A Decreasing Precipitation
Values are percentages of the number of stations located in urban or non urban areas respectively.

25
9
Table B.3. 1992 LULC NARR Period Average Precipitation Trends (1979-2005 versus Region)
Selection A Selection B 30 meters Selection B 60 meters
1992 Urban No Urban Urban No Urban Urban No Urban Remarks
WF N/A N/A - (100%) - (59%) - (100%) - (53%) Decreasing Precipitation
MF + (57%) - (64%) - (64%) - (59%) N/A N/A Urban A increasing
DF 50/50 - (54%) - (77%) 50/50 N/A N/A Urban A & 30m NU behaving different
Total + (55%) - (62%) - (67%) - (58%) N/A N/A Urban A increasing
Values are percentages of the number of stations located in urban or non urban areas respectively.

26
0
Table B.4. 2004 LULC Century Average Precipitation Trends (Yearly versus Region)
Selection A Selection B 30 meters Selection B 60 meters
2004 Urban No Urban Urban No Urban Urban No Urban Remarks
WF N/A N/A N/A N/A N/A N/A No urban stations
MF - (86%) - (75%) - (91%) - (73%) - (80%) - (75%) Decreasing precipitation
DF - (67%) - (76%) - (75%) - (75%) - (80%) - (74%) Decreasing precipitation
Total - (80%) - (77%) - (87%) - (76%) - (80%) - (77%) Decreasing precipitation
Values are percentages of the number of stations located in urban or non urban areas respectively

26
1
Table B.5. 2004 LULC Average Precipitation PRISM Trends (1963-1995 versus Region)
Selection A Selection B 30 meters Selection B 60 meters
2004 Urban No Urban Urban No Urban Urban No Urban Remarks
WF N/A N/A N/A N/A N/A N/A No urban stations
MF 50/50 - (76%) - (70%) - (74%) - (69%) - (75%) Decreasing precipitation
DF - (67%) + (57%) 50/50 + (55%) - (60%) + (58%) Non Urban behaving differently
Total - (56%) - (70%) - (64%) - (70%) - (67%) - (70%) Decreasing Precipitation
Values are percentages of the number of stations located in urban or non urban areas respectively

26
2
Table B.6. 2004 LULC Average Precipitation OMR Trends (1979-2005 versus Region)
Selection A Selection B 30 meters Selection B 60 meters
2004 Urban No Urban Urban No Urban Urban No Urban Remarks
WF N/A N/A N/A N/A N/A N/A No urban stations
MF - (67%) - (60%) - (83%) - (57%) - (75%) - (58%) Decreasing precipitation
DF + (100%) - (57%) + (100%) - (62%) + (67%) - (58%) Urban increasing
Total 50/50 - (61%) - (63%) - (60%) - (64%) - (60%) Urban A behaving differently
Values are percentages of the number of stations located in urban or non urban areas respectively

263
Table B.7. Six Hour Average grid cell precipitation in centimeters for each study
region of the island. The region Downwind of San Juan also includes precipitation
over the ocean.
Time Total Island
(cm)
Western 3rd
(cm)
Central 3rd
(cm)
Eastern 3rd
(cm)
Downwind of
San Juan (cm)
18UTC 5/21 0 0 0 0 0
00UTC 5/22 0.087 0.21 0.051 0.000 0.000
06UTC 5/22 0.32 0.58 0.28 0.10 0.084
12UTC 5/22 0.34 0.46 0.38 0.17 0.20
18UTC 5/22 0.46 0.46 0.52 0.38 0.45
00UTC 5/23 0.59 0.49 0.64 0.65 0.62
06UTC 5/23 0.45 0.33 0.40 0.62 0.50
12UTC 5/23 0.50 0.44 0.48 0.57 0.35
18UTC 5/23 0.40 0.32 0.39 0.49 0.36
00UTC 5/24 0.49 0.48 0.46 0.54 0.59
06UTC 5/24 0.58 0.58 0.58 0.56 0.78
12UTC 5/24 0.72 0.79 0.70 0.67 1.00

264
Table B.8. Percentage differences in total precipitation over the modeled period for
each scenario as ratio of the control. Relative changes in precipitation comparing
each scenario to the control by study region.
Scenario Total Island
(%)
Western 3rd
(%)
Central 3rd
(%)
Eastern 3rd
(%)
Downwind of
San Juan (%)
UI1A 0.81 0.90 0.90 0.80 1.03
UI2A 0.75 0.79 0.95 0.70 0.93
UI3A 0.71 0.77 0.67 0.72 0.31
UI4A 0.62 0.76 0.66 0.58 0.64
UI5A 0.75 0.82 0.68 0.79 0.62
RF1 1.35 1.25 2.15 0.96 1.44
RF2 0.83 0.90 1.30 0.69 0.81
RF3 1.14 1.21 1.56 0.90 0.90
RF4 0.77 1.10 1.05 0.65 0.52
RF5 0.60 1.00 0.73 0.47 0.26
RWF1 0.70 1.01 1.10 0.49 0.80
RWF2 0.71 0.76 0.70 0.70 0.61
RWF3 1.20 1.21 1.90 0.80 1.08
RWF4 0.73 0.80 0.76 0.70 0.63
RWF5 1.07 0.78 1.40 0.95 1.24
UI1B 0.70 0.75 0.67 0.70 0.76
UI2B 0.94 1.27 1.30 0.72 0.81
UI3B 0.88 1.26 1.21 0.74 0.96
UI4B 0.82 1.09 0.94 0.75 0.70
UI5B 0.93 0.81 1.00 0.88 0.76

265
VITA

265
Angel Ruben Torres-Valcárcel MPH Ph.D
Education
PhD, Climatology/Environmental Sciences, Natural Resources Sustainability &
Conservation. Purdue University, West Lafayette Indiana 2005-2013 GPA 3.75
MPH, Public Health General Program, 2001, University of Puerto Rico, Medical
Sciences Campus
Graduate studies towards a Master of Planning / Environmental Planning. 1995 – NF,
University of Puerto Rico, Rio Piedras Campus (57 / 60 credit hour completed)
BS, Environmental Sciences, 1995, University of Puerto Rico, Rio Piedras Campus
Other Education & Training
Non profit Organization Management Workshop:
“How to Develop a Volunteer Program” October 23 – November 6, 2009
Non profit Organization Management Workshop:
“How to Apply for Federal Tax Exemption”; “How to Retain Federal tax Exemption
Status”, Puerto Rico Federal Affairs Administration. August 18, 2009
Advance Management Principles, Krannert School of Business Executive Education
Program Purdue University, May 2008

266
Science teachers Meteorological Education Certification Workshop sponsored by
American Meteorological Society (listener) September 2007
Network Plus Certification Training; Network Technician Workshop, 2002
Educational Computer Center, Carolina Puerto Rico
PhD research topics
The Impact of Land Use & Land Cover Changes in Puerto Rico’s Climate (2008-present)
The instrumentation of mangrove’s methane emissions as an ecosystem biomarker (2005-
2007)
.Other research
Volunteer ecological research work to establish a mechanized field sample image
processing system (August - December 2004)
Masters Degree Research Experience:
The Use of a Spatial Criteria in the Management of Ryan White Title I Funds in
San Juan EMA – Final Project GIS Study 2000, Advisor Jose Cobos MD
Undergraduate Research:
Biogeography of Sierra Palm in the Caribbean National Forest – Final Project
GIS study 1995, Advisors: Alberto Sabat PhD, Jose Molinelli Freytes PhD
Other Undergraduate Research Experience:
Sexual Tendencies of Sierra Palm offspring – Ecology Lab, Biology Department
University of Puerto Rico, Rico, Rio Piedras Campus; Research Assistant, June 1994 to
December 1994, PI: Alberto Sabat PhD
Forest Nutrients Dynamics – Advance Experimental Ecology, Biology Department; June
1994 to December 1994, Professor: Ariel Lugo PhD

267
Acknowledgments
July 2005 - 2006 – GPA above 3.50 Dean Graduate School Office of Minority Programs
July 2006 - 2007 - GPA above 3.50 Dean Graduate School Office of Minority Programs
Awarded Fellowships, Scholarships and Grants
Bisland Dissertation Fellowship - January 2010
Kinesis Scholarship - January 2008, 2009, 2010
Henri Silver Graduate Scholarship - May 2008
Fernandez Bjerg Scholarship - January 2007
Purdue Strategic Initiatives Fellowship - January 2007
Purdue Doctoral Fellowship - January 2005
Research Skills & Qualities
Computer literate, GIS expertise, strategic planning, program evaluation design, grant
writing, operational analysis, Environmental and Public Health programs and project
management. Goal oriented, creativity, initiative.
Languages
Fluent in English and Spanish, Reading Writing and Speaking.
Research Interests
Environmental Sciences, Sustainability, Sustainable Management, Biodiversity,
Conservation, Ecology, Public Health, Environmental Planning, Climatology, Renewable
Energy, Bioremediation, Phytoremediation.
Teaching Experience
January 2011 – May 2011
Part Time Professor - Teach undergraduate & graduate courses, evaluate and grade
student’s work and academic performance. Guide and supervise graduate student’s final

268
projects. Biology Department; Environmental Science Program Pontifical Catholic
University of Puerto Rico
Biological Sciences– Undergraduate
Biological Sciences Online Theoretical Course
Environmental Topics – Graduate
Environmental Science Master’s Degree Seminar Coordination
Community Service II – Graduate
Environmental Science Master’s Degree Final Community Project Supervision
Environmental Planning - Graduate
Environmental Science Master’s Degree Environmental Planning Course
August 2010 to December 2010:
Part Time Professor - Teach undergraduate & graduate courses, evaluate and grade
student’s work and academic performance. Guide and supervise graduate student’s final
projects. Biology Department; Environmental Science Program Pontifical Catholic
University of Puerto Rico
Environmental Management – Undergraduate
Environmental Science Bachelors Degree Theoretical Conference
Environmental Health – Graduate
Environmental Science Master’s Degree Theoretical Conference
Community Service I – Graduate
Environmental Science Master’s Degree Final Project

269
January 2008 to May 2008:
Teaching Assistant – Grading and academic assistance for two courses. Department of
Earth & Atmospheric Sciences, Purdue University.
Work Experience
May 2011 to present: Program Planner; Soccer Tournament and Competition
Development Program. Designed league’s development plans; reviewed & developed
competition ruling and regulations, designed game calendars, designed on league security
protocols. Academia Nacional de Fútbol - Puerto Rico Soccer Federation.
January 2001 to January 2005: Independent Contractor / Consultant; Program Planning,
Evaluation, Fund Raising, Grant Writing and Information Systems Services – Community
Projects
November 1999 – September 2000: Program Evaluation Consultant – Ryan White Title
IV, Puerto Rico Department of Health
May 1999 to June 2001: Information Center Operator; System Maintenance and Trouble
Shooting, Client Service - Center for Interdisciplinary Studies and Information Systems,
Graduate School of Public Health, Medical Sciences Campus
March 1998 to May 1998: Research Assistant; Grant writing clerical & computer
applications support, Internet Search - Center for Evaluation and Socio Medic Research,
University of Puerto Rico, Medical Sciences Campus.
February 1996- February 1999: Planner / Assistant – GIS projects, Environmental Studies
Planning Projects, Policy Analysis, Planning Studies, Environmental Assessment; G .
Navas & Associates

270
July 1 1994 to July 30 1994: Clerk; Howard Hughes Summer Job Program – Support
Clerical Tasks; Environmental Protection Agency Caribbean Office
September 1989 – February 1996: Office Assistant – Work Study Program – Economic
Assistance Office, University of Puerto Rico, Rio Piedras Campus
Independent Professional Projects
Innovative Strategies Education Program – Proposal for the creation of an Aquatic
Program in a Public School. Written October 2004; Approved April 2005.
Health/Recreational Services Project – Independent Contractor
Planning and Policy Analysis for the Development of a Resort with Recreational Services
for Retired Workers, Private 2002
AIDS Task Force – Volunteer Work; Planning, Evaluation and Grant Writing Assistance;
Ryan White Title I Management Office, Local Government Agency 1997 – present
Ryan White Care Act Title I 2004 narrative, planning.
Ryan White Title I grant writing for FY 2005; Severe Need, 2005 Program Work Plan
Health Services - Ryan White Title IV 1999 Grant - Consultation
Program Progress Report for 1999, Program Work Plan for 2000 Grant, Evaluation Work
Plan for 2000 Grant, Continuous Quality Improvement Initiatives Plan and narrative for
2000 Grant, Information System Protocol, Case Management Guide
Review Assessment 2000, Fathers Advisory Committee Assessment Report 2000
Environmental Assessments – G Navas & Associates Inc.
Housing Project Impact Assessment in Aibonito – Local Government, 1998

271
Fresh Water Well Potential Assessment in Vega Alta – Private, 1998
Flooding Control Alternatives for Vega Alta Municipality - Local Government, 1998
Land Use and Environmental Impact Assessment of BFI Proposed Domestic Land Fill in
Salinas- Local Government, 1998
Corporate Professional Projects
Planning – G. Navas & Associates Inc.
Land Use Policy and Impacts of a Residential Commercial Complex in Vega Alta –
Local Government, 1998
Zoning Maps Updates- GIS Mapping - Local Governments, 1997
Cartographic System for Cement Shipping – GIS Mapping – Private, 1996
Historical Migration Analysis for Mayaguez Municipality - Local Government, 1996
Community Projects
Founded “Corporación para la Sustentabilidad Ambiental” COSUAM de Puerto Rico
(Eng. Environmental Sustainability Corporation) a local private non profit organization
to promote environmental sustainability (August 2007). Elected President - November
2007 – stepped down March 15, 2011.
School Aquatic Program: September 2004 - 2006
Julio Sellés Solá Elementary School; Innovative School Swimming Program; Grant
Writing 2004 & 2005
“Academia Nacional de Fútbol Inc.”; Youth Soccer Development Project: August 2003
– January 2005
Program Coordinator: Program Planning, Fund Raising, Grant Writing, President /
Delegate
Co Vice-president (2003-2004)
First Women’s Open Indoor Soccer Cup - June 2005

272
Puerto Rico Soccer Beach 2005 tournament executive committee- August 2005
Founding member of “Liga Metropolitana de Fútbol” (Metropolitan Youth Soccer
League) -2007
“Centro de Envejecientes Manantial de Amor”; Center for Elderly Services; Program
Consultant, Planning, Fund Raising, Grant Writing 2001
Puerto Rico Lupus Group; Lupus Support Group Program Consultant: Planning, Fund
Raising, Grant Writing 2001
Luis A Señeriz Foundation - MADDPR; Mothers Against Drunk Drivers of Puerto Rico;
Program Consultant: Planning, Fund Raising, Grant Writing 2001
“BioHealth Survey Systems”; Community Health Research Board Secretary; Planning,
Fund Rising, Grant Writing 2001
Metro Emergency Response Team; Fire, Rescue and Medical Emergency Response
Services Program Consultant: Planning, Fund Raising, Grant Writing 2001.
Public Statements & Community Participation
March 21, 2013 – “La Descarga Original” Sports radio talk show participation.
Host: Talk show members Subject: National Soccer League Plans and Tournaments.
December 7, 2012 – Environmental Expert Community Panel. Review and comment on
sixth grade class Environmental Education Project “PRO-CASA”. University of Puerto
Rico Elementary School.
August 5, 2012 – Local Newspaper “El Vocero” Interview
Host: Adriana Vélez Subject: COSUAM’s Sustainable School Program, COSUAM
origins, development, projects and accomplishments

273
June 14, 2012, - Caribbean Landscape Conservation Cooperative Open House
(Participant)
Host: Dr. William Gould / International Institute of Tropical Forestry, USDA Forest
Service
April 16, 2012 – Local Newspaper “El Nuevo Dia” Interview
Host: Iliana Fuentes Lugo Subject: COSUAM’s Sustainable School Program, COSUAM
origins, development, projects and accomplishments
February 9, 2012 – Local station Radio Hit 1250 am radio interview
Host: Marielisa Ortiz Berríos. Subject: Environmental Sustainability, COSUAM’s
development, projects and accomplishments, Sustainable School Program
April 8, 2011 - Newspaper column “La Vía de los Verdes” about the controversial
building of a local gas pipeline”. “El Nuevo Día”.
April 1, 2011 – Local News TV interview about COSUAM and its participation in the
local environmental organization coalition for the “Under Water Press Conference
2011”announcing “Earth Month” activities.
March 14-30, 2011 – University Program Proposal Evaluator for “Consejo de Educación
Superior” (transl. Puerto Rico’s Higher Education Council)
July 17, 2010 - Newspaper column “¿Cual Puerto Rico Verde?” Education on
Environmental Sustainability and critical revision on local “green washing” initiatives”.
“El Nuevo Día”.
June 5, 2010 – San Juan Urban Long Term Research Area (ULTRA) Community Forum
about quality of life and environmental health of the city of San Juan and surrounding
areas.

274
April 13, 2010 – Community focal group evaluation of the Center for Volunteer
Development” about the quality of services provided
April 1, 2010 – News magazine column about COSUAM and its ongoing projects in
Vieques; “Vieques Events”. April 2010 issue
March 30, 2010 – Video Interview -“Te Informa”, Purdue University Hispanic TV
Program.
Host: Isabel Trujillo. Subject: COSUAM’s development, projects and accomplishments
March 26, 2010 - Newspaper column “¿Desarrollo Sostenible?” Contextual revision on
the controversial path of local government initiatives towards environmental
sustainability. “El Nuevo Día”
February 19, 2010 - Radio interview WALO 1240. “A Ciencia Cierta”
Host: Susan Soltero. Subject: COSUAM’s Sustainable Schools Program
December 14, 2009 - Newspaper column “Sustentabilidad Ambiental o Desarrollo
Sostenido” addressing the differences between “Environmental Sustainability” initiatives
vs “ Sustainable Development” initiatives. “Claridad”
December 1, 2009 - Community focus group to validate a questionnaire about the
desirable traits profile of local high school graduates
September 3, 2009 - Radio interview WALO 1240. “A Ciencia Cierta”
Host:Susan Soltero. Subject: The Impacts of Land Use and Land Cover Changes in
Puerto Rico's Climate; Land Surface Impacts on post land-fall storm structure
September 16, 2009 - Radio interview WALO 1240. “A Ciencia Cierta”
Host:Susan Soltero. Subject: Environmental Sustainability; COSUAM

275
May 9, 2009 - Newspaper column “Sustentabilidad en Peligro” on the risks of local
government legislation for Puerto Rico sustainability goals. “El Nuevo Día”
December 18 2008; Newspaper column “Ojo a las Canalizaciones” on the
environmental and public safety concerns of channelizing rivers and streams, “El Nuevo
Día”
October 1, 2008; Newspaper column “El COPUR y las Medallas Olimpicas: La Crisis
Social del Deporte en Puerto Rico” addressing the social importance of sports in Puerto
Rico Claridad
September 4, 2008; Newspaper column “Medallas en Contexto” addressing Puerto Rico’s
Olympic sports issues, “El Nuevo Día”
January 7, 2008; Radio Interview at local radio station as public education activity on
how to reduce individual ecological footprint, Magic 97.3 FM
December 22, 2007 - Newspaper Column “ Ademas de Paseo Caribe” on the problem of
commercialization of residential areas “El Nuevo Día” page 89.
November 2007 – Submitted public declaration with recommendations on the problem of
commercialization of residential areas.
May - July 2007 Local Radio Interviews / public education on global warming/climate
change WKAQ 580, “La Hora Magica” & Radio Isla 1320 & “Si No Lo Digo Reviento”
July 2005; Public Statement before Villa Nevarez Lion’s Club members in behalf of an
aquatic program for a local Elementary Public School.

276
March 2003; Pronouncement before Puerto Rico’s Permits and Regulations
Administration. Represented the Community in opposition to the demolition of empty
residential structures for the development of commercial parking areas.
April 2003; Pronouncement before Puerto Rico’s Planning Board – Represented the
community in opposition to the expansion of commercial activities into the residential
area through changes of zoning districts.
November 2003; Pronouncement before Puerto Rico’s Planning Board - Represented the
community in opposition to the expansion of commercial activities into the residential
area through changes of zoning districts.
Attended Conferences and Workshops
Online Science Seminar: "Spatial and temporal analysis of land cover and landscape
structure change in Zagros forests, Western Iran” by Dr. Henareh. November 28, 2012.
International Institute of Tropical Forestry.
San Juan ULTRA Seminar. “The Study of the Social-Ecology, Resilience,
and Sustainability of Cities” by Dr. Charles Redman from the School of Sustainability,
Arizona State University. January 18, 2011 at Center for Puerto Rico, Sila M. Calderon
Foundation.
Online Course Design Workshop. October 1 & October 15, 2010. Pontifical Catholic
University of Puerto Rico
Workshop of Theory & Design of Long Term Research in Socio-Ecological Systems,
December 16-18, 2008. University of Puerto Rico
"Legacies of the Rain Forest Project and the Future of Environmental Sciences in Puerto
Rico" Symposium. November 2007. University of Puerto Rico

277
Invited Guest to UPR Law School Maritime Rights Oral Exam (Court simulation on sea
pollution liability case), May 2007, University of Puerto Rico
GIS symposium: “The Use of Geographic Information Systems in Applied Ecology and
Conservation”, May 28 2005, University of Puerto Rico.
Research Seminar: “How to get a Published Article” by Dr. Ruth E. Zambrana: June 27,
2005, University of Puerto Rico
Offered Conferences, Presentations, Workshops & Talks
Activity: “US Green Building Council SEEDS Program for schools”
Date: June 19, 2013
Location: “Administración de Asuntos Energéticos”, San Juan, Puerto Rico
Topic: Composting Principles
Audience: School teachers and administrators
Activity: Summer Camp Workshop talk
Date: June 12, 2013
Location: “Santo Tomás de Aquino ”, Bayamón, Puerto Rico
Topic: Environmental Sustainability
Audience: Summer camp youngsters
Activity: Summer Camp Workshop talk
Date: June 7, 2013
Location: “Luis Muñoz Marín Foundation”, Trujillo Alto, Puerto Rico
Topic: Environmental Sustainability
Audience: Summer Camp youngsters
Activity: Sustainable Communities Program introductory talk
Date: May 24, 2013
Location: “Residencial Público La Montaña”, Aguadilla, Puerto Rico
Topic: Environmental Sustainability
Audience: Public housing kids, youngsters, parents and community leaders
Activity: Sustainable Schools Program Introductory talk
Date: May 17, 2013
Location: “Juan A. Sánchez Dávila Elementary School”, Manatí, Puerto Rico
Topic: Sustainable Schools Program
Audience: Teachers, students parents, and community leaders

278
Activity: Sustainable Schools Program (School Environmental Fair) Composting talk
Date: May 10, 2013
Location: “Jardines del Paraiso Elementary School”, Rio Piedras, Puerto Rico
Topic: Compost basics / How to build a compost
Audience: 2nd
grade students
Activity: Sustainable Schools Program (School Environmental Fair) Composting
workshop
Date: May 8, 2013
Location: “Francisco Felicie Elementary/Middle School”, Vega Alta, Puerto Rico
Topic: Compost basics / How to build a compost workshop
Audience: 5th
grade students and teachers
Activity: Sustainable Schools Program Composting workshop
Date: May 7, 2013
Location: “Juan José Osuna High School”, San Juan, Puerto Rico
Topic: Compost basics / How to build a compost workshop
Audience: High students from 9th
to 12th
and teachers
Activity: Sustainable Schools Program talk
Date: May 1, 2013
Location: “Luis Llorens Torres High School”, Juana Díaz, Puerto Rico
Topic: Environmental Sustainability
Audience: 11th
and 12th
students and teachers
Activity: Community Composting Project workshop
Date: April 23, 2013
Location: “Colegio Nuestra Señora Del Carmen”, Trujillo Alto, Puerto Rico
Topic: Compost basics / How to build a compost workshop
Audience: 8th
& 9th
grade students and teachers
Activity: Community Composting Project demonstrative talk
Date: April 18, 2013
Location: “Trujillo Alto’s Major office”, Trujillo Alto, Puerto Rico
Topic: Compost & Composting
Audience: Municipal government employees
Activity: Sustainable School Program introductory talk
Date: April 17, 2013
Location: “Juan José Osuna” High School, San Juan, Puerto Rico
Topic: Sustainable Schools Program principles and benefits
Audience: Middle and high school students and teachers
Activity: “US Green Building Council SEEDS Program for Schools”
Date: March 23, 2013

279
Location: “Interamerican University, Arecibo” , Puerto Rico
Topic: School & Community Works, COSUAM’s Sustainable Schools Program
Audience: School officials and teachers
Activity: Green Week presentation talk
Date: March 21, 2013
Location: “Four Points Hotel”, Caguas , Puerto Rico
Topic: Compost & Composting
Audience: Hotel administrators and employees
Activity: Green Week presentation talk
Date: March 19, 2013
Location: “Four Points Hotel”, Caguas , Puerto Rico
Topic: Environmental Sustainability
Audience: Hotel administrators and employees
Activity: COSUAM’s Community Compost Project presentation talk
Date: March 17, 2013
Location: “El Comandante”, San Juan” , Puerto Rico
Topic: Composting
Audience: Adults, community leaders and neighborhood members
Activity: COSUAM’s Community Compost Project presentation talk
Date: March 14, 2013
Location: “Venus Gardens Middle School, San Juan” , Puerto Rico
Topic: Composting
Audience: Ninth grade students
Activity: COSUAM’s Community Compost Project presentation talk
Date: March 12, 2013
Location: “Antonio S Pedreira Elementary School”, Trujillo Alto , Puerto Rico
Topic: Composting
Audience: Third grade students
Activity: COSUAM’s Community Compost Project presentation talk
Date: March 6, 2013
Location: “Centro Niños en Acción, Trujillo Alto” , Puerto Rico
Topic: Composting
Audience: Pre School students (3 – 4 years old)
Activity: COSUAM’s Sustainable Schools Program presentation talk
Date: January 31, 2012
Location: “Dra. Conchita Cuevas High School, Gurabo” , Puerto Rico
Topic: Environmental Sustainability
Audience: High School students (Seniors, Juniors & Sophomores)

280
Activity: COSUAM’s Sustainable Schools Program presentation talk
Date: December13, 2012
Location: “University of Puerto Rico Elementary School, San Juan ” , Puerto Rico
Topic: Environmental Sustainability
Audience: Sixth grade students
Activity: COSUAM’s Sustainable Schools Program presentation talk
Date: November 2, 2012
Location: “Arturo Grant Pardo Middle School, Lajas ” , Puerto Rico
Topic: Environmental Sustainability
Audience: Seventh grade students
Activity: COSUAM’s Sustainable Schools Program presentation talk
Date: October 26, 2012
Location: “Centro y Colegio Valenciana, Añasco ” , Puerto Rico
Topic: Energy, energy conservation and wind energy harnessing
Audience: First & Second grade students
Activity: “US Green Building Council SEEDS Program for Schools”
Date: October 20, 2012
Location: “Liceo Aguadillano ” Aguadilla, Puerto Rico
Topic: School & Community Works, COSUAM’s Sustainable Schools Program
Audience: School officials and teachers
Activity: COSUAM’s Sustainable Schools Program presentation talk
Date: October 17, 2012
Location: “Dr. Conchita Cuevas High School, Gurabo Puerto Rico ”
Topic: Environmental Sustainability and Organic Gardening
Audience: High School students
Activity: COSUAM’s Sustainable Schools Program presentation talk
Date: October 8, 2012
Location: “Agricultural Extension Service, Gurabo Puerto Rico ”
Topic: COSUAM’s Sustainable Schools Program
Audience: Government officials, community organizations
Activity: “COSUAM’s Sustainable Schools Program Talk”
Date: September 12, 2012
Location: “Saint Francis School” – Carolina, Puerto Rico
Topic: Environmental Sustainability
Audience: High school senior students
Activity: “US Green Building Council SEEDS Program for Schools”
Date: August 30, 2012

281
Location: “Puerto Rico College of Architects ”
Topic: School & Community Works, COSUAM’s Sustainable Schools Program
Audience: School officials and teachers
Activity: “US Green Building Council SEEDS Program for Schools”
Date: May 3, 2012
Location: “Puerto Rico College of Architects ”
Topic: School & Community Works, COSUAM’s Sustainable Schools Program
Audience: School officials and teachers
Activity: COSUAM’s Sustainable Schools Program Talk”
Date: April 19, 2012
Location: “University of Puerto Rico Secondary School – San Juan Puerto Rico
Topic: Environmental Sustainability
Audience: High School students
Activity: COSUAM’s Sustainable Schools Program Talk”
Date: February 3, 2012
Location: “Laura Mercado” Middle & High School – San Germán Puerto Rico
Topic: Environmental Sustainability
Audience: School teachers
Activity: COSUAM’s Sustainable Schools Program Talk”
Date: January 10, 2012
Location: “Padre Pablo Gutierrez Elementary School” – Aguada Puerto Rico
Topic: Environmental Sustainability for teachers
Audience: School teachers
Activity: “US Green Building Council SEEDS Program for Schools”
Date: May 7, 2011
Location: “Puerto Rico College of Architects ”
Topic: School & Community Works, COSUAM’s Sustainable Schools Program
Audience: School officials and teachers
Activity: “School Composting Conference”
Date: February 25, 2011
Location: “German Rieckehoff High School” – Vieques, Puerto Rico
Topic: Composting Theory for students
Audience: High School students
Activity: “School Composting Workshop”
Date: February 25, 2011
Location: “German Rieckehoff High School” – Vieques, Puerto Rico
Topic: Composting Theory and Practice for students
Audience: High School students

282
Activity: “School Composting Workshop”
Date: February 24, 2011
Location: “20 de septiembre de 1988 Middle School” – Vieques, Puerto Rico
Topic: Composting Theory and Practice for students
Audience: Middle School students & teachers
Activity: “School Composting Workshop”
Date: November 22, 2010
Location: Epifanio Estrada Middle School – Aguada, Puerto Rico
Topic: Composting Theory and Practice for students
Audience: Middle School students
Activity: Environmental Science Seminar
Date: November 17, 2010
Location: Pontifical Catholic University of Puerto Rico – Ponce, Puerto Rico
Topic: The Impacts of Land Use/Land Cover Changes in Puerto Rico’s Climate
Audience: Science Graduate Students
Activity: “Recyclable Containers Conversion Workshop”
Date: October 16, 2010
Location: Vieques, Puerto Rico
Topic: Conversion of used containers into recycling containers
Audience: School students, teachers, community organizations & local government
officials
Activity: Energy Conservation Week
Date: February 25, 2010
Location: Loíza County, Puerto Rico
Topic: “Energy Conservation”
Audience: Local government employees
Activity: Liberal Arts Week
Date: February 17, 2010
Location: National University College, Arecibo Puerto Rico
Topic: “Sustainable Development or Environmental Sustainability” for students
Audience: College students
Activity: NYU-FRN Winter 2009-Carbon and Climate - Local Research Symposium
Date: January 14, 2009
Location: University of Puerto Rico, Rio Piedras Campus
Topic: The Impacts of Land-Use and Land-Cover Changes in the Climate of Puerto Rico
Audience: Scientists, university professors and students

283
Scientific Publications
Rochon et al., (2010). “Real-Time Remote Sensing in Support of Ecosystem Services &
Sustainability” in Peter Liotta, et al., eds. Ecosystems Services & Environmental
Security. Thousand Oaks, CA: Sage Publications, (volume 69, 2010).
Rochon, G. L., Quansah, J. E., Fall, S., Araya, B., Biehl, L. L., Thiam, T., ... &
Maringanti, C. (2010). Remote Sensing, Public Health & Disaster Mitigation. In
Geospatial Technologies in Environmental Management (pp. 187-209). Springer
Netherlands.
Rochon, G. L., Niyogi, D., Fall, S., Quansah, J. E., Biehl, L., Araya, B., ... & Thiam, T.
(2010). Best management practices for corporate, academic and governmental transfer of
sustainable technologies to developing countries. Clean Technologies and Environmental
Policy, 12(1), 19-30.