Embed Size (px)
Citation preview

ORI GIN AL PA PER
Impacts of topography and land cover changeon thunderstorm over the Huangshan (Yellow Mountain)area of China
Die Wang • Junfeng Miao • Zhemin Tan
Received: 28 October 2012 / Accepted: 7 February 2013 / Published online: 27 February 2013� Springer Science+Business Media Dordrecht 2013
Abstract In this study, the Weather Research and Forecasting (WRF) model (version
3.1.1) was used to simulate a thunderstorm event which occurred on August 18, 2010,
over the Yellow Mountain area of China. This event was a typical thunderstorm embedded
in high-pressure systems. First, the development processes of mountain–valley breeze and
convective cells were studied; second, this study focused on revealing the influencing
mechanism of complex topography and heterogeneous land cover on thunderstorm by
removing the Yellow Mountain and changing the land use categories. On flat terrain, the
simulated results displayed that the convection weakened persistently, cloud top decreased
sharply, and intensity of precipitation reduced. Moreover, there was no up-slope valley
breeze, convergence, and lifting of water vapor could be found on the mountaintop. Then,
the role of land use was revealed by changing original land cover into grassland, mixed
forests, and bare soil in the innermost area, respectively. When covered by grassland, there
were less sensible heating and lower moisture, leading to the planet boundary layer height
decreasing and vertical lifting weakening, which tended to cause more stable atmosphere
and less rainfall on the mountaintop; when covered by mixing forests, only small differ-
ences presented in simulated meteorological fields, including wind fields, moisture, cloud
water mixing ratio, precipitation, and other fields; when covered by bare soil, the latent
heating was more important in influencing the process of thunderstorm. There were less
latent heating and lower accumulated water vapor compared to other experiments, causing
vertical lifting weakening, stability of atmosphere increasing, and precipitation decreasing.
Keywords The Yellow Mountain � Thunderstorm � Topography � Land cover change
D. Wang � J. Miao (&)Key Laboratory of Meteorological Disaster of Ministry of Education,Nanjing University of Information Science and Technology, Nanjing, Chinae-mail: [email protected]
Z. TanKey Laboratory of Mesoscale Severe Weather of Ministry of Education,Nanjing University, Nanjing, China
123
Nat Hazards (2013) 67:675–699DOI 10.1007/s11069-013-0595-0

1 Introduction
Orography plays a significant character in influencing weather processes by exchanging
momentum and energy between large-scale and mesoscale weather systems. When
mountains are encountered, many factors, including water vapor, wind shear, atmospheric
stability, and direction of the leading air, will be combined to influence the local weather
situations. Besides, the orographic wave and vortex which may generate torrential flood,
debris flow, cold air damming, exceptional track of storm, and coastally trapped dis-
turbance are also regarded as the important weather phenomena induced by orography
(Lin 2007).
The orographic precipitation is very complex as the primary factor to be considered in
forecasting local mesoscale weather (Hohenegger et al. 2005). When the mountains are
high enough, a large number of moist airs lift forcedly and decrease its temperature to
dewpoint by expansion and adiabatic cooling over the slopes (Wallace and Hobbs 1977).
The condensation of water vapor contained within the air initially forms the orographic
clouds over the mountains. After that, the cloud droplets gradually grow into raindrops and
fall to the ground when large sufficiently. Furthermore, heterogeneous terrain has great
effects on duration, location, scope, quantity, and intensity of rainfall. During the past
several tens of years, the trigger and enhancement mechanisms of orographic rainstorm
have been summed up as thermal force, dynamic factors, and even topographic features
(e.g., shapes and dimensions) (Smith 1979; Roe 2005). To huge mountains, greater pre-
cipitation is related to up-slope condensation, small disturbance, or wind convergence on
the leeward slopes in stable atmospheric conditions (Mass 1981; Chu and Lin 2000); to
monticules, the seeder–feeder mechanism which can lead to intense rainfall is particularly
important, because it helps condensation nucleus grow into droplets (Bergeron 1949;
Robichaud and Austin 1988).
Previously, for understanding the fundamental features of local circulation and devel-
opment processes of orographic precipitation, two-dimensional (2D) hydrostatic models
(e.g., Gallus and Klemp 2000; Chu and Lin 2000) and diagnostic models (e.g., Chris and
Joel 2004; Kunz and Kottmeier 2006) are accessed successfully to be used. Without
considering the static stability of the atmosphere and the dimensions of topography, the
flow dynamics and three-dimensional (3D) structures of wind fields cannot be described
clearly over complex terrains. Therefore, it is crucial to use a 3D non-hydrostatic numerical
model to reveal the 3D structure of convection cells, and the vertical circulation of
the mountain–valley breeze by incorporating an actual terrain and land cover databases
(e.g., Paul and Nikolai 2011).
The Yellow Mountain which located near Huangshan City of Anhui Province in Eastern
China in the subtropics has a typical monsoon humid climate. There are three major peaks
among 72 distinguished peaks with various shapes, namely Lotus Flower Peak, Bright
Summit Peak, and Celestial Capital Peak. Most studies focus on the sea of clouds and
mesoscale rainstorm under the beneficial synoptic-scale circulation background, using
models with simple dynamic frameworks and physical parameterizations in the Yellow
Mountain region (e.g., Zhai et al. 1995; Wu et al. 2005; Chen and Zhao 2006). Not too
many studies pay close attention to the circulation and thunderstorms triggered by inho-
mogeneous heating from the earth’s surface.
Moreover, Land cover over the Yellow Mountain area has been modified significantly
during the past decades. This region will be reshaped continuously by exploiting the
natural scenic spots and expanding urban areas in coming future. Land cover changes have
far-reaching influences on the characteristics of PBL and regional land–atmosphere
676 Nat Hazards (2013) 67:675–699
123

interaction (Pielke 2001; Cui et al. 2006; Mahmood et al. 2006; Ter Maat et al. 2006;
Pielke et al. 2007a, b; Raddatz 2007; Nair et al. 2011). Various numerical models have
been used for studying the impacts of land cover changes on wind fields, temperature, soil
moisture, atmospheric water vapor content, convective cloud, and convective precipitation
(e.g., Chang and Wetzel 1991; Clark and Arritt 1995; Shen 1998; Crawford et al. 2001;
Pielke 2001; Adegoke et al. 2003; Narisma and Pitman 2003; Gero and Pitman 2006; Sen
Roy et al. 2007, 2011). The development and evolution of intense convective weather
processes are influenced profoundly by increasing available energy over vegetated ground
(Pielke et al. 2007a; Pielke 2001). Nevertheless, the most previous studies concentrate on
orographic effects instead of land cover changes in the Yellow Mountain region. Conse-
quently, it is necessary for us to reveal the impacts of different land use types on local
circulation and severe convection deeply, using 3D mesoscale numerical model.
2 Model description and initialization
The 3D non-hydrostatic atmospheric model WRF (Skamarock et al. 2005) is a mesoscale
numerical model designed for a wide range of operational forecasting and academic
research needs. In recent years, it generally gains popularity in simulating the severe
convective weathers. Therefore, in this study, the ARW-WRF version 3.1.1 model with four
nested domains (D1, D2, D3, and D4) and two-way nesting schemes is adopted for use.
Domains are centered on the mountaintop (30.15�N, 118.15�E), and the horizontal grid
resolutions are 27, 9, 3, and 1 km, with 150 9 150, 196 9 196, 184 9 184, and 124 9 124
grid points for D1, D2, D3, and D4, respectively (Fig. 1). D1 covers central and Eastern
China, which is responsible for simulating the large-scale circulation and synoptic-scale
Fig. 1 Map showing the model domains (D1, D2, D3, and D4) and topography (color). Bold solid lines(rectangle) denote the geographic locations of the nested grids. The central point is located on themountaintop (30.15�N, 118.15�E)
Nat Hazards (2013) 67:675–699 677
123

weather systems. The D2 and D3 are setted up to capture mesoscale and local weather
situation, and the D4 is the area of especial concern. The locations of the three inner grids
are far enough away from the boundaries of the outer grids that they would not be greatly
affected by the values at the outer boundaries during a 48-h period. The vertical grids for all
domains consist of 35 levels ranging from the ground to 100 hPa, and the lowest layer is
approximately at 48 m AGL. The topography (Fig. 2a) and land use (Fig. 3) are obtained
from the Moderate Resolution Imaging Spectroradiometer (MODIS) databases in 2001 at
10, 5, 2 arc-min, and 30 arc-sec resolutions for D1, D2, D3, and D4, separately. The physical
parameterizations used in this study are given in Table 1, and the cumulus scheme is not
used in D3 and D4 (Miao et al. 2008, 2009). The final reanalysis (FNL) data from National
Center for Environmental Prediction (NCEP) updated every 6 h with horizontal resolution
of 1� 9 1� was used in this study. Interpolated FNL data in horizontal and vertical direc-
tions were considered as the initial fields and lateral boundary conditions.
3 Numerical experiments
With the purpose of capturing the significant influence of topography and land use changes
on mountain–valley breeze and thunderstorm, a series of sensitivity tests were performed.
The run which used the real topography and land use types was denoted as the control
(CNTL) experiment. In contrast, the remaining three other runs which were identical to the
CNTL run except for land use types were designed to run with uniform grassland
(GRASS), mixed forests (FOREST), and bare soil (DESERT) in D4, respectively
(Table 2). Furthermore, in order to show the dynamic and thermodynamic effects of
Fig. 2 Terrain of D4 (color and with contours every 200 m) in the a CNTL and b TOPO runs, solid line(AB) indicates the location of the vertical cross-section used in this study (along 118.15�E). Location of tenAWSs marked by circle signs: Xiuning (XN), Zhaixi (ZX), Huangshan (HS), Jiuhuashan (JHS), Jingde (JD),Qimen (QM), Yixian (YX), Shexian (SX), Tunxi (TX), and Huangshanqu (HSQ) indicated for verification ofmodel outputs
678 Nat Hazards (2013) 67:675–699
123

terrain, a TOPO experiment was conducted, with the region (29.80–30.35�N,
117.80–118.45�E) being cut down in elevation (to 200 m) (see Fig. 2b). The integral time
period was 48 h (from 0000 UTC 17 August to 0000 UTC August 19, 2010). The first 16 h
of this period was discarded as a part of the model spin-up, and the remaining 32 h formed
the time period of interest for this study.
4 Case description
The period from 0900 to 1400 LST on August 18, 2010, witnessed a thunderstorm over the
Yellow Mountain area. By observation, the relatively heavy precipitation cells were
Fig. 3 Land use categories of D4 with 30 arc-second resolution data from the MODIS (2001) datasets
Table 1 WRF physical parameterizations
Parameterization Reference
Microphysics scheme: Lin et al. Lin et al. (1983)
Longwave radiation: rapid radiative transfer model Mlawer et al. (1997)
Shortwave radiation: Dudhia Dudhia (1989)
Land surface scheme: Noah land surface model Chen and Dudhia (2001)
Surface scheme: Monin–Obukhov (Janjic) Janjic (2002)
Planetary boundary layer scheme: Yonsei University (YSU) Hong et al. (2006)
Cumulus scheme: Kain-Fritsch scheme (only for D1 and D2) Kain (2004)
Nat Hazards (2013) 67:675–699 679
123

situated at Jiuhuashan (JHS), Huangshanqu (HSQ), and Huangshan (HS) automatic
weather stations (AWSs), with the 12-hour-accumulated amount of precipitation reaching
71.7, 68.1, and 58.3 mm, respectively (Fig. 6a). As can be seen clearly from the 500 hPa
height field (Fig. 4a), the southeast of China was subject to the West Pacific subtropical
high (WPSH), and the Yellow Mountain (signed by the red point) located to the top and
back portion of the WPSH. The upper southerly air current would carry the warm and
moist air into the Yellow Mountain area, which could create large-scale background field
for thunderstorm. At 850 hPa (Fig. 4b), the counterpart region was covered by warmer
(above 20 �C) and drier air and prevailed southwest winds without any shear lines. The
large temperature differences between surface and upper air were beneficial to accumulate
convective instability energy and produce thunderstorm. Hence, the selected thunderstorm
mainly developed under weak synoptic pressure gradients. The differences of thermal
properties of non-homogeneous underlying surface layer and the local circulation played a
leading role in triggering this severe convection.
Fig. 4 The synoptic weather pattern at 1000 LST on August 18, 2010, at a 500 hPa and b 850 hPa,showing geopotential height (dam, blue lines), temperature (�C, red lines), and relative humidity (color).The red point shows the position of the mountaintop of the Yellow Mountain
Table 2 Summary of the numerical experiments
Experiment Land use Topography
CNTL Heterogeneous land use (MODIS data) Realistic terrain
TOPO Heterogeneous land use (MODIS data) Flat terrain (200 m)(29.80–30.35�N,117.80–118.45�E)
GRASS Homogeneous land use (grassland) Realistic terrain
FOREST Homogeneous land use (mixed forests) Realistic terrain
DESERT Homogeneous land use (bare soil) Realistic terrain
680 Nat Hazards (2013) 67:675–699
123
5 Results and discussion
5.1 Comparison with observations
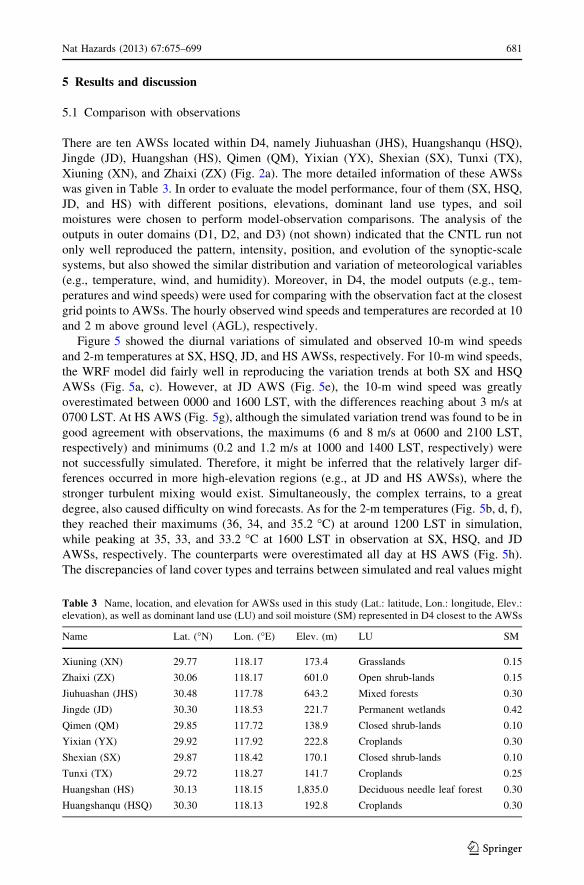
There are ten AWSs located within D4, namely Jiuhuashan (JHS), Huangshanqu (HSQ),
Jingde (JD), Huangshan (HS), Qimen (QM), Yixian (YX), Shexian (SX), Tunxi (TX),
Xiuning (XN), and Zhaixi (ZX) (Fig. 2a). The more detailed information of these AWSs
was given in Table 3. In order to evaluate the model performance, four of them (SX, HSQ,
JD, and HS) with different positions, elevations, dominant land use types, and soil
moistures were chosen to perform model-observation comparisons. The analysis of the
outputs in outer domains (D1, D2, and D3) (not shown) indicated that the CNTL run not
only well reproduced the pattern, intensity, position, and evolution of the synoptic-scale
systems, but also showed the similar distribution and variation of meteorological variables
(e.g., temperature, wind, and humidity). Moreover, in D4, the model outputs (e.g., tem-
peratures and wind speeds) were used for comparing with the observation fact at the closest
grid points to AWSs. The hourly observed wind speeds and temperatures are recorded at 10
and 2 m above ground level (AGL), respectively.
Figure 5 showed the diurnal variations of simulated and observed 10-m wind speeds
and 2-m temperatures at SX, HSQ, JD, and HS AWSs, respectively. For 10-m wind speeds,
the WRF model did fairly well in reproducing the variation trends at both SX and HSQ
AWSs (Fig. 5a, c). However, at JD AWS (Fig. 5e), the 10-m wind speed was greatly
overestimated between 0000 and 1600 LST, with the differences reaching about 3 m/s at
0700 LST. At HS AWS (Fig. 5g), although the simulated variation trend was found to be in
good agreement with observations, the maximums (6 and 8 m/s at 0600 and 2100 LST,
respectively) and minimums (0.2 and 1.2 m/s at 1000 and 1400 LST, respectively) were
not successfully simulated. Therefore, it might be inferred that the relatively larger dif-
ferences occurred in more high-elevation regions (e.g., at JD and HS AWSs), where the
stronger turbulent mixing would exist. Simultaneously, the complex terrains, to a great
degree, also caused difficulty on wind forecasts. As for the 2-m temperatures (Fig. 5b, d, f),
they reached their maximums (36, 34, and 35.2 �C) at around 1200 LST in simulation,
while peaking at 35, 33, and 33.2 �C at 1600 LST in observation at SX, HSQ, and JD
AWSs, respectively. The counterparts were overestimated all day at HS AWS (Fig. 5h).
The discrepancies of land cover types and terrains between simulated and real values might
Table 3 Name, location, and elevation for AWSs used in this study (Lat.: latitude, Lon.: longitude, Elev.:elevation), as well as dominant land use (LU) and soil moisture (SM) represented in D4 closest to the AWSs
Name Lat. (�N) Lon. (�E) Elev. (m) LU SM
Xiuning (XN) 29.77 118.17 173.4 Grasslands 0.15
Zhaixi (ZX) 30.06 118.17 601.0 Open shrub-lands 0.15
Jiuhuashan (JHS) 30.48 117.78 643.2 Mixed forests 0.30
Jingde (JD) 30.30 118.53 221.7 Permanent wetlands 0.42
Qimen (QM) 29.85 117.72 138.9 Closed shrub-lands 0.10
Yixian (YX) 29.92 117.92 222.8 Croplands 0.30
Shexian (SX) 29.87 118.42 170.1 Closed shrub-lands 0.10
Tunxi (TX) 29.72 118.27 141.7 Croplands 0.25
Huangshan (HS) 30.13 118.15 1,835.0 Deciduous needle leaf forest 0.30
Huangshanqu (HSQ) 30.30 118.13 192.8 Croplands 0.30
Nat Hazards (2013) 67:675–699 681
123

be attributed to the differences of 2-m temperature. Hence, these analyses confirmed that
the WRF simulation might reasonably capture the dominant regional-scale features and
supplement the observations by providing a broader context in this study.
5.2 Evolution of local circulation
5.2.1 Horizontal structure
First, the diurnal circulation of horizontal 10-m wind fields over the Yellow Mountain area
on August 18, 2010, was analyzed. In Fig. 6, it made clearly that the mountain–valley
breeze was well established, transformed, and developed in this region. There was a
diminishing down-slope wind on the mountaintop and north slope (30.12–30.2�N) between
0000 and 0700 LST, with the wind speed reducing to 2 m/s. After sunrise (0900 LST), the
mountain’s surface heated air quicker than the valley bottom could, causing up-slope flow.
Simultaneously, the convergence zone of wind directions and convective cloud (see
Fig. 11a) appeared on the mountaintop (30.14�N). It might be inferred that the valley wind
played an important role in producing thunderstorm. The valley breeze (up-slope wind)
prevailed from 0900 to 1800 LST when there was an opposite conversion of wind direction
occurred. After that time, the convergence zone moved to the leeward slopes, and there
was a down-slope wind of cooler air along the Yellow Mountain slopes, with the maximum
Fig. 5 Diurnal variations of simulated and observed 10-m wind speed and 2-m temperature at SX, HSQ,JD, and HS AWSs on August 18, 2010
682 Nat Hazards (2013) 67:675–699
123

wind velocity reaching 6 m/s after 2000 LST. Note that the frequency of slight breeze (low
to 0.5 m/s) was higher during the period of valley wind.
Specifically, it could be exhibited clearly in the horizontal cross-sections which
involved the evolution of complex wind fields in D4 (Fig. 7). At 0200 LST (Fig. 7a), an
intense mountain breeze which flowed from the mountaintop to the valley floor was
organized along two sides of the Yellow Mountain, especially on the south slope. How-
ever, with the generally enhanced solar radiation, wind pattern changed dramatically at
0900 (Fig. 7b). The transition from down- to up-slope wind occurred on higher elevations
first, and then, the up-slope flow generally covered the whole valley. A convergence line in
accordance with the orientation of the mountain ridge ranged from northeast to southwest
and displayed a northwest development tendency apparently. Until sunset, being absented
from solar radiation, the mountain breeze prevailed, and wind speed increased rapidly
(Fig. 7d). Thus, through the above analysis, there was obvious and important flow pattern
(mountain–valley breeze) in the Yellow Mountain region on August 18, 2010.
5.2.2 Vertical structure
The vertical cross-sections of wind fields, vertical velocity (W 9 10), and meridional
wind speeds along line AB (see in Fig. 2a) were clearly exhibited in Fig. 8. Although the
thunderstorm produced, the background wind speeds in the Yellow Mountain region
were low under high-pressure systems. The meridional wind speeds less than 4 m/s
during the whole day above 2.5 m. Before accessing to the solar heating (Fig. 8a), cold
air slided down the north slope, and only a slight disturbance of wind cloud be seen at
Fig. 6 N–S and time cross-sections of simulated 10-m wind fields (U and V-components, vector),topography (contours), and 10-m wind speed (color) along line AB on August 18, 2010
Nat Hazards (2013) 67:675–699 683
123

0200 LST, with the vertical velocity reaching 0.35 m/s. Then, the convective layer
started to develop due to enhanced solar radiation, and an up-slope flow flushed out from
the valleys, before converging on the mountaintop. At 0900 LST, the velocity of updraft
increased (up to 1.5 m/s) at 30.15�N in Fig. 8b, which indicated a well-developed valley
circulation. At this time, the initial convection appeared on the mountaintop and
developed sharply in the following hours (Figs. 11a, b). However, the airflow crossed the
mountaintop and formed the down-slope wind on the north slope (30.17–30.3�N) at 1600
LST, because the temperature gradient reversed the background wind rose generally
Fig. 7 Simulated differences between 10-m wind fields and the innermost domain average of 10-m windfields (U and V-components, vector) and V-component (color) at a 0200, b 0900, c 1600, and d 2000 LSTon August 18, 2010, and topography (m, contours)
684 Nat Hazards (2013) 67:675–699
123

(Fig. 8c). The later period experienced that the down-slope wind increased and pooled
down below. At 2000 LST, a downward motion (up to 1.2 m/s) accompanying with
warming might produce to motivate a reversed ascending air current near 30.2�N in
Fig. 8d. Summing up the above, the vertical structure of mountain–valley breeze dis-
played clearly, especially the valley wind in the daytime, providing favorable explanation
for the formation of thunderstorm.
Fig. 8 Vertical cross-sections of simulated wind fields (V and W 9 10-components, vector), verticalvelocity (color), and V-component (ms-1, contours) along line AB at a 0200, b 0900, c 1600, and d 2000LST on August 18, 2010
Nat Hazards (2013) 67:675–699 685
123

5.3 Evolution of cloud and precipitation
In order to evaluate the model performance in simulating the development process of
orographic cloud and precipitation evens, a comparison between observational and sim-
ulated 24-h accumulated rainfall was given. Because of the dispersed AWSs in positions,
the precipitation of every AWS in observation tended to be marked by figures rather than
contours. Figures. 9a, b showed that the WRF model could duplicate the precipitation
process reasonably and integrally, whether in scope or strength of rainfall. More specifi-
cally, the maximum accumulated precipitation centers were highly concentrated on the
mountaintop area in the CNTL run, reaching 50 and 35 mm which was slightly less than
the observation (58.3 and 71.7 mm) at HS and JHS AWSs, respectively. It might be
attributed to the convergence of wind fields and lifting movement in this area (Fig. 10a).
But another maximum precipitation center which located at HSQ AWS (30.3�N, 118.13�E)
was not successfully reproduced. This was likely contributed to terrain height errors
between real (up to 1,864.8 m) and modeled (up to 1,200 m) regions, as well as the system
errors of numerical model. To sum up, it suggested that this should be considered as a
relatively reasonable and effective simulation of this thunderstorm event.
In Fig. 11, the three stages of thunderstorm, including the developing, mature, and
dissipation stages, were well captured by the WRF model on August 18, 2010. Individual
orographic cloud appeared first on the mountaintop (about 30.15�N) at approximately 0900
LST (Figs. 11a, 12a), which was supposed to be the cumulus stage. Weak as it was, the
disturbances in up-flow (1.4 m/s), cloud water mixing ratio (0.7 g/kg), and water vapor
(below 3 km) was discernible. Then, under the influences of topography and mountain–
valley winds, the airflow converged and lifted forcedly on the summit of the Yellow
Mountain, companying with a great amount of moisture perturbation. Being isolation from
the surface heating, the rising air and moisture quickly cooled into water drops, which
could appear as cumulus cloud. Besides, the lower temperature aloft further contributed to
condensate vapor into raindrops, which could lead to latent release and atmosphere
warming. Until 1000 LST (Figs. 11b, 12b), the maximum vertical velocity was 6 m/s, and
the cloud and rain water mixing ratio peaked at 1.1 and 1.9 g/kg, respectively. During this
period, the initial convection barely moved, with the wet tongue deepening and potential
temperature falling sharply. Moreover, as crucial indicators of atmospheric instability, the
convective available potential energy (CAPE) and convective inhibition (CIN) which
could indicate the vertical development of strong convection were considered. The cloud
top height grew rapidly with the increasing CAPE, elevating to 6 km. The CIN decreased
by 11 J/kg in the valley, which created atmospheric instability. With the up-flow, a shallow
convection appeared between 29.9 and 30�N, growing sharply in the following time. Until
1100 LST (Figs. 11c, 12c), The CIN further dropped (to 9 J/kg), while the vapor distur-
bance, vertical velocity, and CAPE rose in the counterpart area. Nevertheless, on the
mountaintop, the potential temperature perturbations only appeared in lower layer (within
2 km), and the velocity of up-flow decreased to 1.2 m/s (Fig. 12c). Then, background wind
increased, causing two convection cells on the south slope merging with each other and
moving to the peak (Figs. 11d, 12d). The stronger downdraft (12 m/s at 3–3.5 m) near
30.2�N caused by the dissipated cells halted the flow traveling north. The local up-flow
transported moist air into the thunderstorm cell which gave rise to a deep moist tongue. An
hour later (at 1300 LST), the convective cells developed after being provided together the
dynamic lifting (e.g., the vertical velocity reached 3.5 m/s) and abundant water vapor
between 30.15 and 30.2�N (see Figs. 11e, 12e). As inferred from Figs. 11f and 12f, the
mountain air was cooled by the less solar radiation after sunset. The momentum
686 Nat Hazards (2013) 67:675–699
123

Fig. 9 Simulated 24-h accumulated precipitation (color), topography (m, contours) on August 18, 2010, fora OBS, b CNTL, c TOPO, d GRASS, e FOREST, and f DESERT. The measured precipitation was markedon every AWS with red numbers
Nat Hazards (2013) 67:675–699 687
123

Fig. 10 Simulated moisture flux divergence (color), wind fields (V and W 9 10-components, vector), andtopography (m, contours) on 1.8 km at 1000 LST on August 18, 2010, for the a CNTL, b TOPO, c GRASS,d FOREST, and e DESERT experiments
688 Nat Hazards (2013) 67:675–699
123

descending and down-slope wind got together to bring high near-surface wind, before
suppressing the development of moisture and potential temperature disturbance. The CIN
increased from 5 to 20 J/kg, which indicated a weakened convection. As the cloud and rain
water mixing ratio dropped to 0.3 and 0.4 g/kg, the thunderstorm had been started to
dissipate.
Consequently, the trigger mechanisms of thunderstorm were likely attributed to the
mountain–valley breeze and topographic feature, including dynamic and thermal factors.
The former could create the up-flow and convergence centers on the mountaintop, and the
latter warmed and humidified the mountain air over the Yellow Mountain area.
5.4 Effect of topography
In Fig. 9c, after the Yellow Mountain was removed, the rainfall sharply reduced to around
5 mm, and the main precipitation cores disappeared in D4. Without orographic forcing, a
sustaining southwesterly prevailed, causing no vertical motion and convergence lines
(convergence centers of wind and moisture) near the mountains (Fig. 10b). It implied that
the thunderstorm was triggered by the climbing airflow on the windward slopes and the
valley winds during the daytime, as the dynamic and thermodynamic effects of the
mountainous area.
Fig. 11 Vertical cross-sections of simulated cloud water mixing ratio (color), rain water mixing ratio(dashed, 10-1g/kg), wind fields (V and W 9 10-components, vector), and water vapor mixing ratio (solid,g/kg) along line AB at a 0900, b 1000, c 1100, d 1200, e 1300, and f 1400 LST on August 18, 2010
Nat Hazards (2013) 67:675–699 689
123

In addition, Fig. 13a, b showed the vertical cross-sections of the wind fields (U- and
W 9 10-components), CIN, CAPE, cloud water mixing ratio, water vapor mixing ratio,
vertical velocity, and potential temperature along line AB at 1000 LST in the TOPO
experiment. It was found that the maximum vertical velocity was only 0.06 m/s, and the
cloud water mixing ratio nearly disappeared. The atmosphere developed into a stable one,
with evenly distributed potential temperature, CIN, CAPE, and water vapor mixing ratio in
north–south direction. This was disadvantage to the vertical transport of moisture and
release of convective instable energy. Hence, the terrain was the main factor of creating the
mountain–valley circulation and convection. Under complex topography, the daytime
period was experienced a strong enough thermally induced up-slope flow, contributing to
transported the warm and moisture into the upper air. Along with the condensation of water
vapor and latent heat release, the potential instable energy accumulated and released,
before causing this thunderstorm event.
5.5 Effect of land cover
In the 1950s, the proportion of land use and land cover in the Yellow Mountain Scenic
Area was 75 %, whereas the percentage rapidly declined to 73.6 % in 1971, by reason of
Fig. 12 Vertical cross-sections of simulated CAPE (color), CIN (blue contours, J/kg), vertical velocity(dashed, 10-1m/s), and potential temperature (solid, K) along line AB at a 0900, b 1000, c 1100, d 1200,e 1300, and f 1400 LST on August 18, 2010
690 Nat Hazards (2013) 67:675–699
123

engineering construction, water and soil erosion, forest fire, and trampling. From then on,
effective management and careful protection were implemented to increase land cover, the
figure reaching 93 % in 2009. From the above, we designed three sensitivity experiments
to study the impacts of land use changes on the development processes of mountain–valley
breeze and thunderstorm. Reducing plant height was considered first, in other words,
inhomogeneous land cover was replaced by uniform grassland (GARSS) to show the
Fig. 13 Vertical cross-sections of simulated cloud water mixing ratio (color), rain water mixing ratio(dashed, 10-1g/kg), water vapor mixing ratio (solid, g/kg), and wind fields (V and W 9 10-components,vector) on the left column; CAPE (color), CIN (blue contours, J/kg), vertical velocity (dashed, 10-1m/s),and potential temperature (solid, K) on the right column along line AB at 1000 LST on August 18, 2010, forthe TOPO, GRASS, FOREST, and DESERT experiments
Nat Hazards (2013) 67:675–699 691
123

effects of vegetation deterioration. Second, a FOREST experiment with homogeneous
mixed forests was designed to reveal the influencing mechanism of natural expansion of
forests in recent years. Finally, the extent of influence which the natural distribution of
vegetation could lead to over the Yellow Mountain area was worthy of consideration.
Hence, it was necessary to give an extreme experiment (DESERT), running without any
vegetation.
Fig. 13 continued
692 Nat Hazards (2013) 67:675–699
123

5.5.1 GRASS experiment
In both GRASS and CNTL (Fig. 9b, d), the precipitation centers had the same locations at
(30.2�N, 118.11�E), (30.19�N, 118.2�E), (30.1�N, 118.4�E), and (30.52�N, 117.81�E),
respectively. When covered by grassland, the precipitations reduced by 20 and 25 mm at
the first two positions, while increased by about 10 and 15 mm at the last two centers. The
convective core on the summit of the Yellow Mountain (30.2�N, 118.11�E) was considered
in more detail. Figure 10c showed that the rainfall decreased according as a slight decrease
in moisture and momentum gathered in the most region of D4, especially on the moun-
taintop in the GRASS experiment.
In Fig. 13c, d, it showed that the vertical velocity dropped to 2.5 m/s at 1000 LST, lead
to less condensation of water vapor in the main body of orographic cumuli. For this reason,
the cloud top height decreased (to around 5 km), and there was an outflow from the cloud
base at 30.16�N, which implied that the deep convection experienced a shorter period and
had been in dissipative stage. The cloud and rain water mixing ratio were 0.88 and 1.1
g/kg, respectively. Moreover, the lesser CAPE and higher CIN were the part factors
of weakening of the convection (Fig. 14a). From Fig. 14b, the perturbation potential
temperature reduced (by 1.2 K) on the mountaintop, causing an increased lapse rate, and
higher static stability. Based on this, relatively less moisture and heat released upward to
maintain the development of thunderstorm.
Covered by grassland, the innermost domain average surface sensible heat flux had
reduced (Fig. 15f), lead to relatively stable atmospheric. Besides, it could be found that the
surface roughness declined (0.12 m), causing the horizontal wind speeds increasing
sharply (Figs. 10c, 15e), and the valley breeze well developing. Therefore, the decrease in
soil moisture could not bring higher evapotranspiration and latent heating (Fig. 15h).
Combining the above, it could not provide advantages in thermal conditions to maintain
the development of thunderstorm. Note that the differences in 2-m temperature, skin
surface temperature, net radiation, PBL height, and latent heat flux were almost negligible
(Fig. 15c, d, g, h).
5.5.2 FOREST experiment
In the FOREST experiment (Figs. 9e, 10d), the differences in simulated wind fields and the
development of convective rainfall were small due to the fact that the most of D4 in the
CNTL run was covered by mix forests. But the rain belt which located near Jiuhua
Mountain expanded and the rain center (30.19�N, 118.2�E) shifted to its southwest.
Figure 13e, f indicated that the vertical velocity dropped to 2.4 m/s, which provided
disadvantage in vertical transporting moisture and energy followed by a decreased cloud
top height (around 4 km) and rain water mixing ratio (0.4 g/kg). Furthermore, it could be
indicated from Fig. 14c, d that the differences between the FOREST and CNTL runs were
small in CAPE, CIN, and perturbation potential temperature. In spite of this, the pertur-
bation potential temperature increased in the lower atmosphere, while had opposite trend in
the higher counterpart. So, the convective cloud could not develop higher and stronger.
Figure 15 revealed that the changes had slight influence on the simulated results of
surface variables. In other words, the diurnal variations were nearly the same and difficult
to distinguish. Due to vegetation height and surface roughness increasing (around 0.5 m),
there was a slight decline in wind speed (Fig. 15e), companying with a weaker conver-
gence and vertical motion (2.4 m/s in Fig. 13f). Along with lower soil moisture, it was
hardly for warm and moisture air near the ground to be delivered to form the deeper
Nat Hazards (2013) 67:675–699 693
123

cumulus convection core (2.8 m in Fig. 13e). Therefore, heterogeneous underlying surface
was propitious to accumulate the water vapor and CAPE, which was likely to continue and
reinforce the thunderstorm.
5.5.3 DESERT experiment
In Fig. 9f, there was almost no center of precipitation in mountainous area without any
vegetation. With the valley wind and orographic forcing, the moisture only gathered on the
Fig. 14 Vertical cross-sections of simulated differences of CAPE (color) and CIN (contours, J/kg) betweenthe a GRASS and CNTL, c FOREST and CNTL, as well as e DESERT and CNTL experiments on the leftcolumn; simulated differences of perturbation potential temperature (color, contours, K) between theb GRASS and CNTL, d FOREST and CNTL, as well as f DESERT and CNTL experiments on the rightcolumn along line AB at 1000 LST on August 18, 2010
694 Nat Hazards (2013) 67:675–699
123

top of the Yellow Mountain (Fig. 10e). However, compared to the CNTL run (Fig. 13g, h),
the up-flow aroused by the valley wind and orographic forcing was very weaker at 1000
LST, with lower velocity (0.55 m/s), less range, and lower extended height (3.3 km) on the
mountaintop. The vertical velocity decreased with height rapidly. In Figs. 14e, f, Both the
CAPE and perturbation potential temperature fallen, while the CIN rose. The differences of
three variables between DESERT and CNTL were up to 1,000 J/kg, 0.8 K, and 20 J/kg,
respectively. Therefore, it could be inferred that the bare soil restrained the transportation
of water upward and development of cumulus (below 3 km).
In the CNTL run (Fig. 15b), net radiation increased drastically after 0500 LST with the
results that transpiring water went up, and turbulence of near-surface air enhanced greatly.
In Fig. 15a, before turning into a strong convection at 1000 LST, the turbulent mixing and
ground surface evaporation kept the same level of intensity, causing water vapor mixing
ratio increased slowly. The period between 1600 and 1800 LST witnessed weaker cumulus
convection and decreased turbulent motion, with the near-surface moisture accumulating
quickly and reaching its maximum at 20 g/kg. However, the water vapor mixing ratio
remained steady below 18.4 g/kg for a day in the DESERT experiment. Additionally, the
water vapor content was related to many factors, including convergence and divergence of
airflow, ground surface evaporation, and water–vapor exchange vertically. Partly, due to
the reduction in surface roughness (0.01 m), maximum differences of surface wind speeds
between CNTL and DESERT were up to 2 m/s (Fig. 15e). For lack for vapor source, it was
difficult to transfer the vapor upward and release latent heat flux, despite the wind speed
increasing sharply. The maximum latent heat flux was only 130 W/m2 at 1300 LST
(Fig. 15h). Furthermore, the solar radiation could easily pass through the shallow clouds
and heated the surface of the mountaintop. Hence, as compared to their CNTL counter-
parts, the differences between skin and near-surface temperatures rose because of higher
albedo (0.38), bringing larger sensible heat flux after 1200 LST compared to CNTL
Fig. 14 continued
Nat Hazards (2013) 67:675–699 695
123

(Fig. 15c, d, f). The sensible heat flux rose smoothly and reached its peak at 1300 LST.
From Fig. 15f and g, it was inferred that the sensible heat flux was supposed to be the
primary contributing factors for the diurnal variation of PBL height, which was similar to
the main findings by Zhang et al. (2009). Figure 15g showed that the maximum PBL
height was 1,200 and 1,600 m in CNTL and DESERT, respectively. Therefore, after
desertization, it was adverse for accumulating vapor and heat, which cloud restrain strong
convection within the lower PBL.
6 Summary and conclusions
Using a mesoscale numerical model WRF version 3.1.1, the impacts of topography and
land use changes on thunderstorm over the Yellow Mountain area of China were inves-
tigated. The case we chosen was occurred on August 18, 2010, under weak synoptic
pressure gradients. Detailed analyses and comparative studies lead to primary conclusions
on the research questions posed at the beginning of the study.
First, assessment using observational data of AWSs (e.g., temperatures, wind speeds,
and precipitations) confirmed that WRF could describe the meteorological fields accurately
Fig. 15 Diurnal variations of the innermost domain average modeled a water vapor mixing ratio, b netradiation, c surface skin temperature, d 2-m temperature, e 10-m wind speed, f sensible heat flux, g PBLheight, and h latent heat flux for the CNTL, GRASS, FOREST, and DESERT experiments on August 18,2010
696 Nat Hazards (2013) 67:675–699
123

in spite of missing a precipitation cell in the north valley; second, the mesoscale local
circulation and the development process of thunderstorm were analyzed. Simulation results
indicated that the valley breeze prevailed after sunrise and converged on the mountaintop,
which might provide uplift airflow and water vapor conditions for the formation of initial
convection; third, a TOPO experiment (see Table 2) revealed that the complex topography
(the Yellow Mountain) played a significant role in determining the amount and locations of
the precipitation. On flat terrain, the main effects were local disturbance weakening
without strong topographic convergence and lifting of wind and water vapor associated
with the valley wind. In contrast, the CNTL showed stronger vertical mixing, raising the
moisture, increasing potential temperature disturbance, and accumulating convective
instability energy, which was conducive to the growth of convective clouds; finally, other
three sensitivity tests with uniform grassland (GRASS), mixed forests (FOREST), and bare
soil (DESERT) were conducted. Among the impacts of land use changes, both the thermal
and momentum transport were significant for the localized thunderstorm. When covered by
grassland, there were less sensible heating and lower moisture, leading to the PBL height
decreasing and vertical lifting weakening, which tended to cause more stable atmosphere
and less rainfall on the mountaintop. When covered by mixing forests, only small dif-
ferences presented in simulated meteorological fields (e.g., wind fields, moisture, cloud
water mixing ratio, precipitation, and other fields). In DESERT experiment, the latent
heating was more important in influencing the process of thunderstorm. There were less
latent heating and lower accumulated water vapor compared to other experiments, causing
vertical lifting weakening, stability of atmosphere increasing, and precipitation reducing.
Although the WRF model exhibited reasonable performance and revealed preliminary
results about the impacts of land use changes on thunderstorm, shortcomings should be
pointed out when understanding these conclusions. Because the characteristics of thun-
derstorms cannot give complete investigations in a case, particularly the changes in the
microphysical features of the convection cells which were viewed as an important part of
the simulated thunderstorm. Further investigations in revealing the formation mechanism
of thunderstorm should be worth conducting using advanced numerical models.
Acknowledgments This research was jointly supported by the Special Fund of Scientific Research forPublic Welfare Industry (Meteorology) of the Ministry of Science and Technology of China (Grant No.GYHY201006004), the National Natural Science Foundation of China (Grant No. 41030962), and theNational Key Technology Research and Development Program of the Ministry of Science and Technologyof China (Grant No. 2013BAK05B03).
References
Adegoke JO, Pielke RA, Eastman J, Mahmood R, Hubbard KG (2003) Impact of irrigation of midsummersurface fluxes and temperature under dry synoptic conditions: a regional atmospheric model study ofthe U.S. High Plains. Mon Wea Rev 131:556–564
Bergeron T (1949) Problem of artificial control of rainfall on the globe. Tellus 1:32–43Chang JT, Wetzel PJ (1991) Effects of spatial variations of soil moisture and vegetation on the evolution of
a pre-storm environment: a numerical case study. Mon Wea Rev 119:1368–1390Chen F, Dudhia J (2001) Coupling an advanced land surface–hydrology model with the penn state–NCAR
MM5 modeling system. Part II: preliminary model validation. Mon Wea Rev 129:587–604Chen Q, Zhao M (2006) A numerical experiment on the effect of terrain on the precipitation. Scientia
Meteorol Sinica 26:484–493 (in Chinese)Chris F, Joel M (2004) A simplified diagnostic model of orographic rainfall for enhancing satellite-based
rainfall estimates in data-poor regions. J Appl Meteorol 43:1366–1378
Nat Hazards (2013) 67:675–699 697
123

Chu CM, Lin YL (2000) Effects of orography on the generation and propagation of mesoscale convectivesystems in a two-dimensional conditionally unstable flow. J Atmos Sci 57:3817–3837
Clark CA, Arritt RW (1995) Numerical simulations of the effect of soil moisture and vegetation cover on thedevelopment of deep convection. J Appl Meteorol 34:2029–2045
Crawford TM, Stensrud DJ, Mora F, Merchant JW, Wetzel PJ (2001) Value of incorporating satellite-derived land cover data in MM5/PLACE for simulating surface temperatures. J Hydrometeorol2:453–468
Cui X, Graf HF, Langmann B, Chen W, Huang R (2006) Climate impacts of anthropogenic land use changeson the Tibetan Plateau. Glob Planet Change 54:33–56
Dudhia J (1989) Numerical study of convection observed during the Winter Monsoon experiment using amesoscale two-dimensional model. J Atmos Sci 46:3077–3107
Gallus WA, Klemp JB (2000) On the behavior of flow over step orography. Mon Wea Rev 128:1153–1164Gero AF, Pitman AJ (2006) The impact of land cover change on a simulated storm event in the Sydney
basin. J Appl Meteorol Clim 45:283–300Hohenegger C, Walser A, Wolfgang L, Schar C (2005) Cloud resolving ensemble simulations of the August
2005 Alpine flood. QJR Meteorol Soc 134:889–904Hong SY, Noh Y, Dudhia J (2006) A new vertical diffusion package with an explicit treatment of
entrainment processes. Mon Wea Rev 134:2318–2341Janjic ZI (2002) Nonsingular implementation of the Mellor-Yamada level NCEP mesomodel. NCEP Office
Note 437:61Kain JS (2004) The Kain–Fritsch convective parameterization: an update. J Appl Meteorol 43:170–181Kunz M, Kottmeier C (2006) Orographic enhancement of precipitation over low mountain ranges. Part I:
model formulation and idealized simulations. J Appl Meteorol Clim 45:1025–1040Lin YL (2007) Mesoscale dynamics. Cambridge University Press, Cambridge, MALin YL, Farley RD, Orville HD (1983) Bulk parameterization of the snow field in a cloud model. Clim Appl
Meteorol 22:1065–1092Mahmood R, Foster SA, Keeling T, Hubbard KG, Carlson C, Leeper R (2006) Impacts of irrigation on 20th
century temperature in the northern Great Plains. Glob Planet Change 54:1–18Mass C (1981) Topographically forced convergence in western Washington State. Mon Wea Rev 109:
1335–1347Miao JF, Chen D, Wyser K, Borne K, Lindgren J, Strandevall MKS, Thorsson S, Achberger C, Almkvist E
(2008) Evaluation of MM5 mesoscale model at local scale for air quality applications over the Swedishwest coast: influence of PBL and LST parameterizations. Meteorol Atmos Phys 99:77–103
Miao JF, Wyser K, Chen D, Ritchie H (2009) Impacts of boundary layer turbulence and land surface processparameterizations on simulated sea breeze characteristics. Ann Geophys 27(6):2303–2320
Mlawer EJ, Taubman SJ, Brown PD, Iacono MJ, Clough SA (1997) Radiative transfer for inhomoge-neous atmosphere: RRTM, a validated correlated-k model for the longwave. J Geophys Res 102:16663–16682
Nair US, Wu Y, Kala J, Lyons TJ, Pielke RA, Hacker JM (2011) The role of land use change on thedevelopment and evolution of the west coast trough, convective clouds, and precipitation in southwestAustralia. J Geophys Res 116:D07103. doi:10.1029/2010JD014950
Narisma GT, Pitman AJ (2003) The impact of 200 years of land cover change on the Australian near-surfaceclimate. J Hydrometeorol 4:424–436
Paul MM, Nikolai D (2011) A numerical study of the effects of orography on supercells. Atmos Res100:457–478
Pielke RA (2001) Influence of the spatial distribution of vegetation and soils on the prediction of cumulusconvection rainfall. Rev Geophys 39:151–177
Pielke RA, Adegoke J, Beltran-Przekurat A, Hiemstra CA, Lin J, Nair US, Niyogi D, Nobis TE (2007a) Anoverview of regional land use and land cover impacts on rainfall. Tellus 59B:587–601
Pielke RA, Adegoke J, Chase TN, Marshall CH, Matsui T, Niyogi D (2007b) A new paradigm for assessingthe role of agriculture in the climate system and in climate change. Agric For Meteorol 142:234–254
Raddatz RL (2007) Evidence for the influence of agriculture on weather and climate through the trans-formation and management of vegetation: illustrated by examples from the Canadian Prairies. AgricFor Meteorol 142:186–202
Robichaud AJ, Austin GL (1988) On the modeling of warm orographic rain by seeder-feeder mechanism.QJR Meteorol Soc 114:967–988
Roe GH (2005) Orographic precipitation. Annu Rev Earth Planet Sci 33:645–671Sen Roy S, Mahmood R, Quintanar AI, Gonzalez A (2011) Impacts of irrigation on dry season precipitation
in India. Theor Appl Climatol 104:193–207
698 Nat Hazards (2013) 67:675–699
123

Sen Roy S, Mahmood R, Niyogi DDS, Lei M, Foster SA, Hubbard KG, Douglas E, Pielke RA (2007)Impacts of the agricultural Green Revolution-induced land use changes on air temperatures in India.J Geophys Res 112:D21108
Shen J (1998) Numerical modeling of the effects of vegetation and environmental conditions on the lakebreeze. Boundary-Layer Meteorol 87:481–498
Skamarock WC, Klemp JB, Dudhia J, Gill DO, Barker DM, Wang W, Powers JG (2005) A description ofthe advanced research WRF version 2, NCAR Tech Note 468 + STR 88 pp
Smith RB (1979) The influence of mountains on the atmosphere. Adv Geophys 21:87–230Ter Maat HW, Hutjes RWA, Ohba R, Ueda H, Bisselink B, Bauer T (2006) Meteorological impact
assessment of possible large scale irrigation in Southwest Saudi Arabia. Glob Planet Change54:183–201
Wallace JM, Hobbs PV (1977) Atmospheric science: an introductory survey. Academic Press, New YorkWu YX, Yang BG, Wang KQ, Hua RG, Xu W (2005) Climatic analysis of cloud deck in Huangshan.
Scientia Meteorol Sinica 25:97–104 (in Chinese)Zhai GQ, Gao K, Yu ZX, Tu CH (1995) Numerical simulation of the effects of mesoscale topography in a
heavy rain process. Scientia Atmospherica Sinica 19:475–480 (in Chinese)Zhang CL, Chen F, Miao SG (2009) Impacts of urban expansion and future green planting on summer
precipitation in the Beijing metropolitan area. J Geophys Res 114(2):1–26
Nat Hazards (2013) 67:675–699 699
123