Embed Size (px)
Citation preview
2
I. Performance and Asset Allocation • Asset Allocation: Current and Target Allocations (page 4) • Performance by Asset Class (page 5)
II. Public Equities
• Asset Class Overview (page 7) • Portfolio Management Structure (page 8) • Allocation (page 9-10) • Performance (page 11-12)
III. Fixed Income
• Core Fixed Income • Asset Class Overview (page 14) • Portfolio Management Structure (page 15) • Allocation (page 16) • Performance (page 17)
• Non-Core Fixed Income • Asset Class Overview (page 18) • Portfolio Management Structure (page 19) • Allocation (page 20) • Committed Allocation (page 21) • Performance (page 22)
IV. Real Estate
• Asset Class Overview (page 24) • Portfolio Management Structure (page 25) • Allocation (page 26) • Performance (page 27-29)
V. Real Return
• Asset Class Overview (page 31) • Portfolio Management Structure (page 32-33) • Allocation (page 34) • Performance (page 35)
VI. Absolute Return • Asset Class Overview (page 37) • Portfolio Management Structure (page 38) • Allocation (page 39) • Performance (page 40)
VII. Private Equity
• Asset Class Overview (pages 42) • Portfolio Management Structure (page 43) • Allocation (page 44-45) • Performance (page 46)
VIII. Compliance • Compliance Overview (page 48) • Pacing Plan Update (page 49)
IX. Risk Management
• Overview (page 51) • Total Fund Risk (page 52) • Implementation Risk Ranges (page 53) • Total Fund & Asset Class Regional Exposures (page 54) • Total Fund tracking Error (page 55) • Evolution of Risk Over Time (page 56) • Updates (page 57)
3
I. Performance and Asset Allocation
4
0.0%
5.0%
10.0%
15.0%
20.0%
25.0%
Core FixedIncome
US Equities Non-USEquities
Real Return Real Estate PrivateEquity
AbsoluteReturn
Non-CoreFixed Income
CashEquivalents
Perc
ent A
lloca
ted
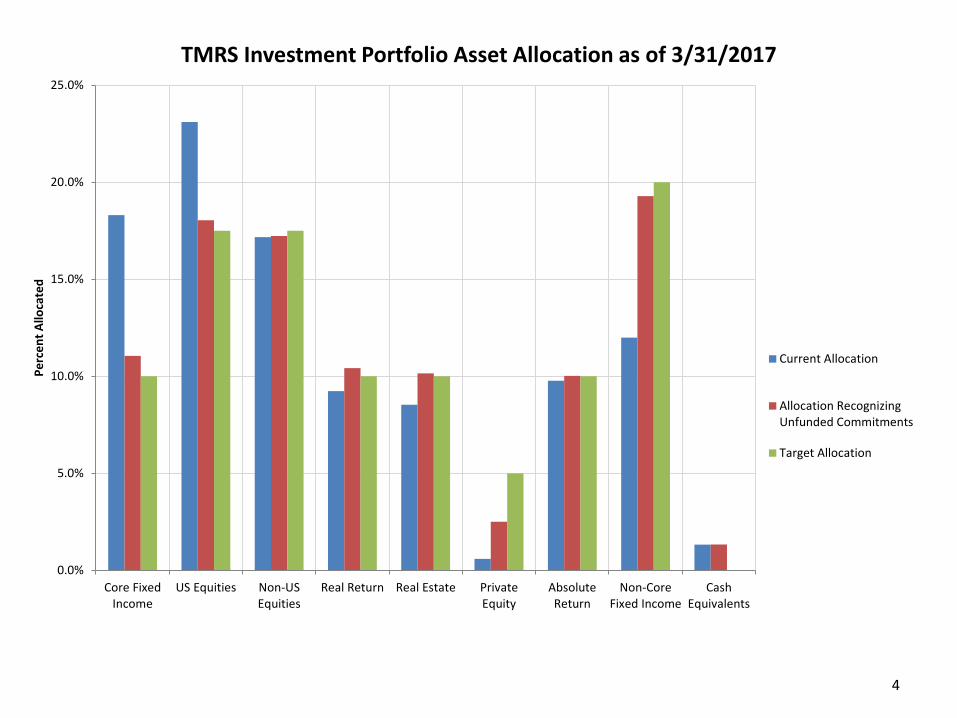
TMRS Investment Portfolio Asset Allocation as of 3/31/2017
Current Allocation
Allocation RecognizingUnfunded Commitments
Target Allocation
5
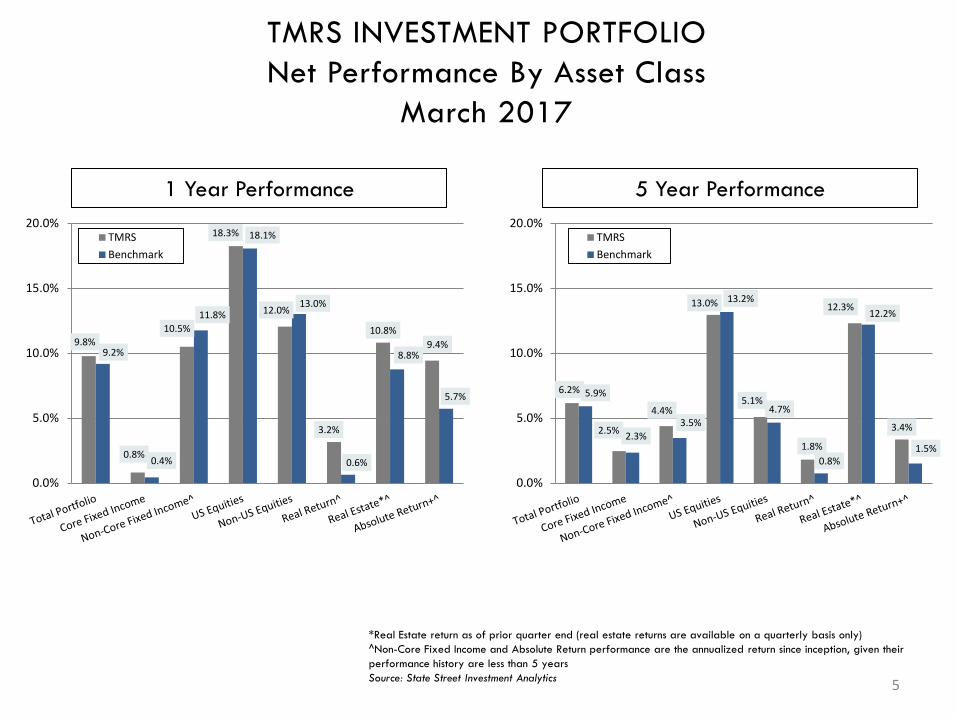
TMRS INVESTMENT PORTFOLIO Net Performance By Asset Class
March 2017
1 Year Performance 5 Year Performance
*Real Estate return as of prior quarter end (real estate returns are available on a quarterly basis only) ^Non-Core Fixed Income and Absolute Return performance are the annualized return since inception, given their performance history are less than 5 years Source: State Street Investment Analytics
9.8%
0.8%
10.5%
18.3%
12.0%
3.2%
10.8% 9.4%
9.2%
0.4%
11.8%
18.1%
13.0%
0.6%
8.8%
5.7%
0.0%
5.0%
10.0%
15.0%
20.0%TMRSBenchmark
6.2%
2.5%
4.4%
13.0%
5.1%
1.8%
12.3%
3.4%
5.9%
2.3% 3.5%
13.2%
4.7%
0.8%
12.2%
1.5%
0.0%
5.0%
10.0%
15.0%
20.0%TMRSBenchmark

6
7
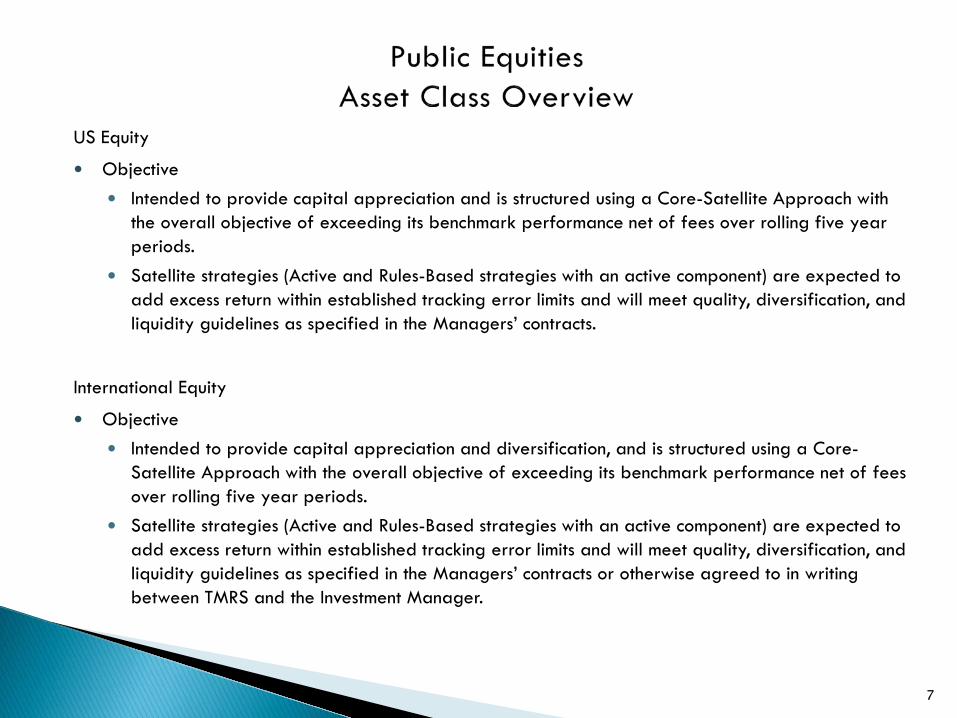
US Equity
Objective Intended to provide capital appreciation and is structured using a Core-Satellite Approach with
the overall objective of exceeding its benchmark performance net of fees over rolling five year periods.
Satellite strategies (Active and Rules-Based strategies with an active component) are expected to add excess return within established tracking error limits and will meet quality, diversification, and liquidity guidelines as specified in the Managers’ contracts.
International Equity
Objective Intended to provide capital appreciation and diversification, and is structured using a Core-
Satellite Approach with the overall objective of exceeding its benchmark performance net of fees over rolling five year periods.
Satellite strategies (Active and Rules-Based strategies with an active component) are expected to add excess return within established tracking error limits and will meet quality, diversification, and liquidity guidelines as specified in the Managers’ contracts or otherwise agreed to in writing between TMRS and the Investment Manager.
8
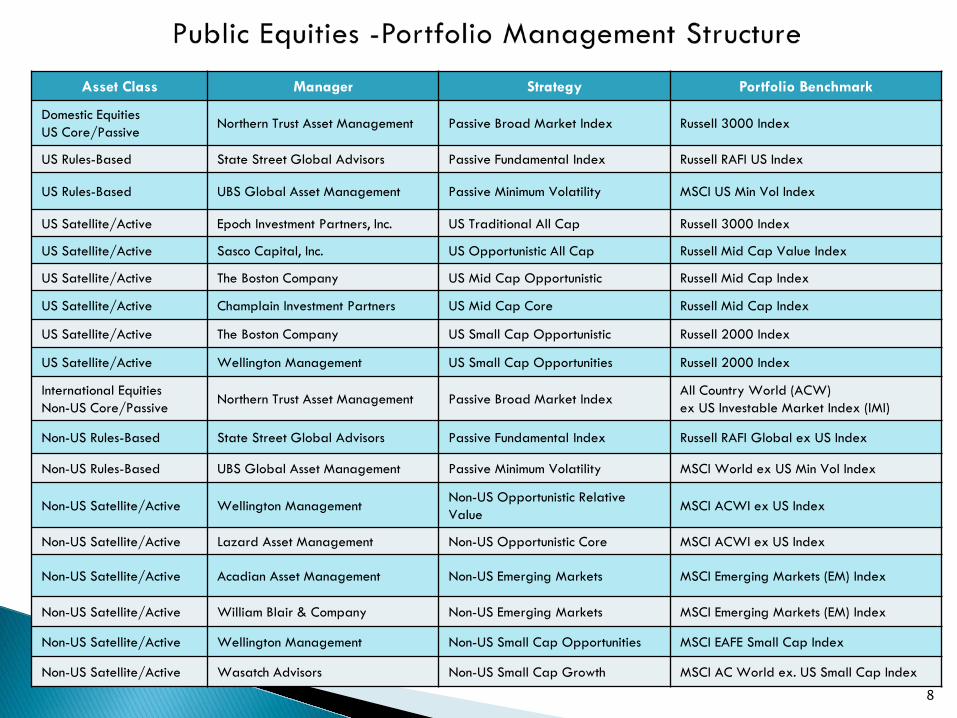
Asset Class Manager Strategy Portfolio Benchmark
Domestic Equities US Core/Passive
Northern Trust Asset Management Passive Broad Market Index Russell 3000 Index
US Rules-Based State Street Global Advisors Passive Fundamental Index Russell RAFI US Index
US Rules-Based UBS Global Asset Management Passive Minimum Volatility MSCI US Min Vol Index
US Satellite/Active Epoch Investment Partners, Inc. US Traditional All Cap Russell 3000 Index
US Satellite/Active Sasco Capital, Inc. US Opportunistic All Cap Russell Mid Cap Value Index
US Satellite/Active The Boston Company US Mid Cap Opportunistic Russell Mid Cap Index
US Satellite/Active Champlain Investment Partners US Mid Cap Core Russell Mid Cap Index
US Satellite/Active The Boston Company US Small Cap Opportunistic Russell 2000 Index
US Satellite/Active Wellington Management US Small Cap Opportunities Russell 2000 Index
International Equities Non-US Core/Passive
Northern Trust Asset Management Passive Broad Market Index All Country World (ACW) ex US Investable Market Index (IMI)
Non-US Rules-Based State Street Global Advisors Passive Fundamental Index Russell RAFI Global ex US Index
Non-US Rules-Based UBS Global Asset Management Passive Minimum Volatility MSCI World ex US Min Vol Index
Non-US Satellite/Active Wellington Management Non-US Opportunistic Relative Value
MSCI ACWI ex US Index
Non-US Satellite/Active Lazard Asset Management Non-US Opportunistic Core MSCI ACWI ex US Index
Non-US Satellite/Active Acadian Asset Management Non-US Emerging Markets MSCI Emerging Markets (EM) Index
Non-US Satellite/Active William Blair & Company Non-US Emerging Markets MSCI Emerging Markets (EM) Index
Non-US Satellite/Active Wellington Management Non-US Small Cap Opportunities MSCI EAFE Small Cap Index
Non-US Satellite/Active Wasatch Advisors Non-US Small Cap Growth MSCI AC World ex. US Small Cap Index
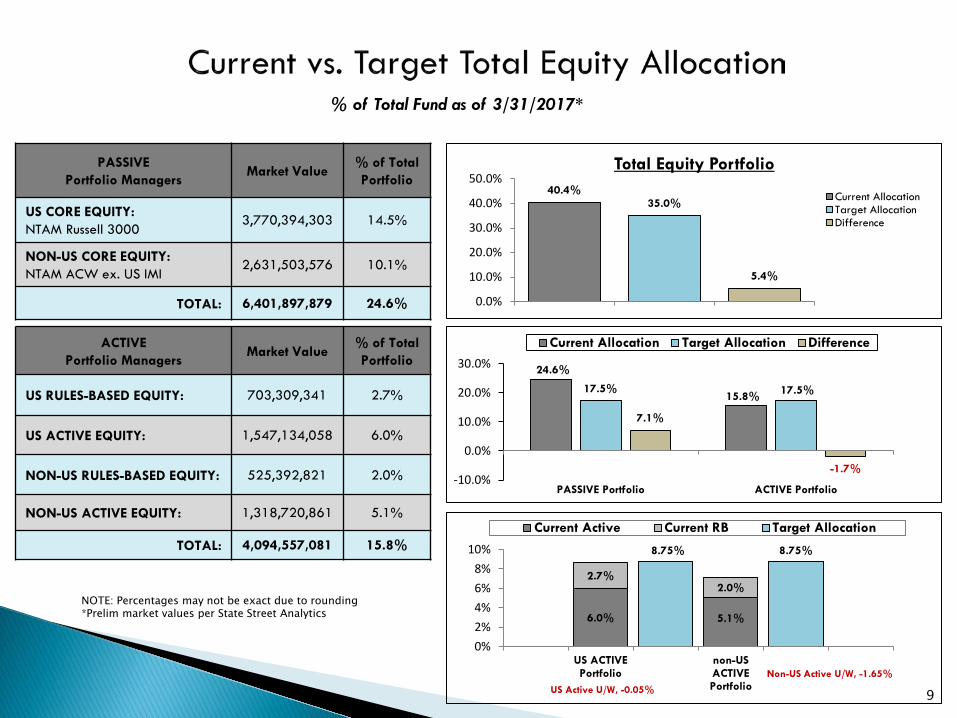
9
% of Total Fund as of 3/31/2017*
PASSIVE Portfolio Managers
Market Value % of Total Portfolio
US CORE EQUITY: NTAM Russell 3000
3,770,394,303 14.5%
NON-US CORE EQUITY: NTAM ACW ex. US IMI
2,631,503,576 10.1%
TOTAL: 6,401,897,879 24.6%
ACTIVE Portfolio Managers
Market Value % of Total Portfolio
US RULES-BASED EQUITY: 703,309,341 2.7%
US ACTIVE EQUITY: 1,547,134,058 6.0%
NON-US RULES-BASED EQUITY: 525,392,821 2.0%
NON-US ACTIVE EQUITY: 1,318,720,861 5.1%
TOTAL: 4,094,557,081 15.8%
NOTE: Percentages may not be exact due to rounding *Prelim market values per State Street Analytics
24.6%
15.8% 17.5% 17.5%
7.1%
-1.7% -10.0%
0.0%
10.0%
20.0%
30.0%
PASSIVE Portfolio ACTIVE Portfolio
Current Allocation Target Allocation Difference
40.4% 35.0%
5.4%
0.0%
10.0%
20.0%
30.0%
40.0%
50.0%Total Equity Portfolio
Current AllocationTarget AllocationDifference
6.0% 5.1%
2.7% 2.0%
8.75% 8.75%
0%2%4%6%8%
10%
US ACTIVEPortfolio
non-USACTIVEPortfolio
Current Active Current RB Target Allocation
US Active U/W, -0.05%
Non-US Active U/W, -1.65%
10 As of 3/31/2017 Preliminary market values
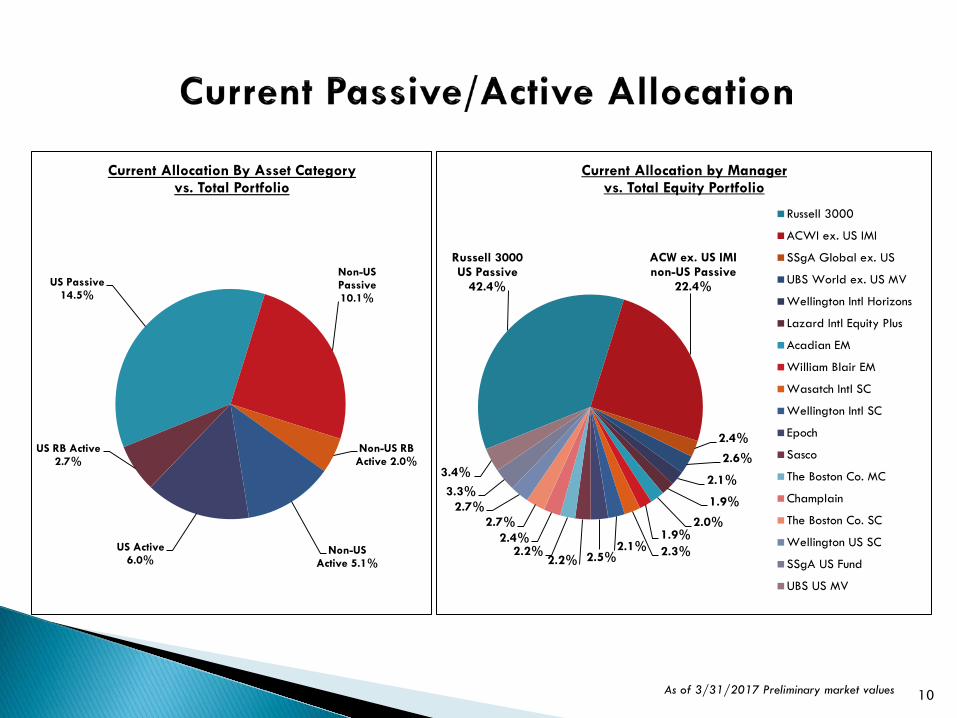
US Passive 14.5%
Non-US Passive 10.1%
Non-US RB Active 2.0%
Non-US Active 5.1%
US Active 6.0%
US RB Active 2.7%
Current Allocation By Asset Category vs. Total Portfolio
Russell 3000 US Passive
42.4%
ACW ex. US IMI non-US Passive
22.4%
2.4%
2.6%
2.1%
1.9%
2.0% 1.9% 2.3% 2.1%
2.5% 2.2% 2.2%
2.4% 2.7%
2.7% 3.3%
3.4%
Current Allocation by Manager vs. Total Equity Portfolio
Russell 3000
ACWI ex. US IMI
SSgA Global ex. US
UBS World ex. US MV
Wellington Intl Horizons
Lazard Intl Equity Plus
Acadian EM
William Blair EM
Wasatch Intl SC
Wellington Intl SC
Epoch
Sasco
The Boston Co. MC
Champlain
The Boston Co. SC
Wellington US SC
SSgA US Fund
UBS US MV
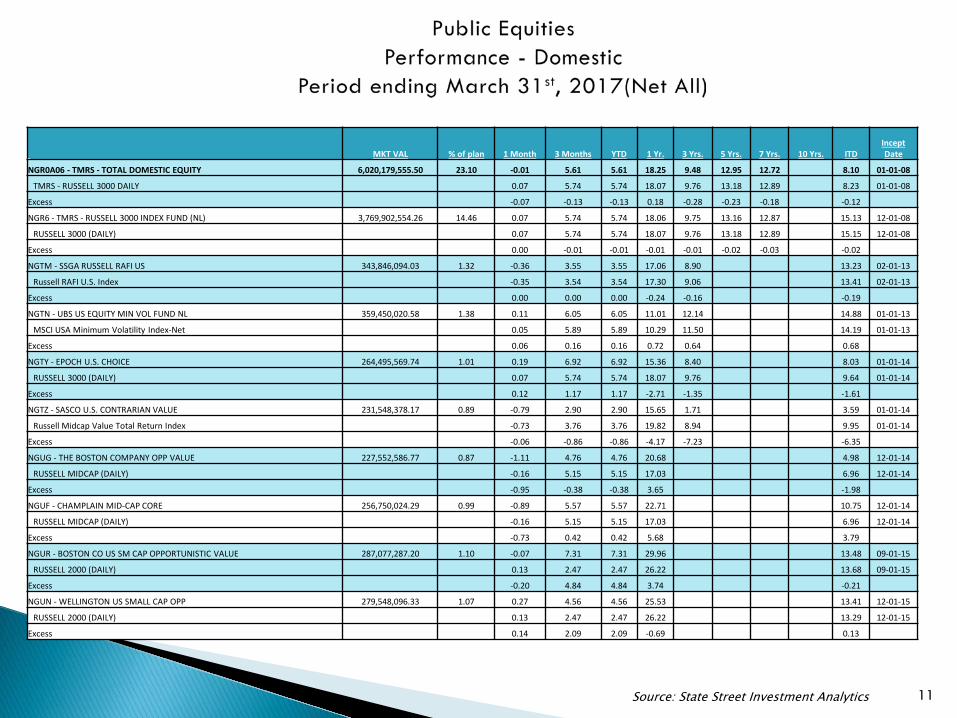
11 Source: State Street Investment Analytics
MKT VAL % of plan 1 Month 3 Months YTD 1 Yr. 3 Yrs. 5 Yrs. 7 Yrs. 10 Yrs. ITD Incept Date
NGR0A06 - TMRS - TOTAL DOMESTIC EQUITY 6,020,179,555.50 23.10 -0.01 5.61 5.61 18.25 9.48 12.95 12.72 8.10 01-01-08
TMRS - RUSSELL 3000 DAILY 0.07 5.74 5.74 18.07 9.76 13.18 12.89 8.23 01-01-08
Excess -0.07 -0.13 -0.13 0.18 -0.28 -0.23 -0.18 -0.12
NGR6 - TMRS - RUSSELL 3000 INDEX FUND (NL) 3,769,902,554.26 14.46 0.07 5.74 5.74 18.06 9.75 13.16 12.87 15.13 12-01-08
RUSSELL 3000 (DAILY) 0.07 5.74 5.74 18.07 9.76 13.18 12.89 15.15 12-01-08
Excess 0.00 -0.01 -0.01 -0.01 -0.01 -0.02 -0.03 -0.02
NGTM - SSGA RUSSELL RAFI US 343,846,094.03 1.32 -0.36 3.55 3.55 17.06 8.90 13.23 02-01-13
Russell RAFI U.S. Index -0.35 3.54 3.54 17.30 9.06 13.41 02-01-13
Excess 0.00 0.00 0.00 -0.24 -0.16 -0.19
NGTN - UBS US EQUITY MIN VOL FUND NL 359,450,020.58 1.38 0.11 6.05 6.05 11.01 12.14 14.88 01-01-13
MSCI USA Minimum Volatility Index-Net 0.05 5.89 5.89 10.29 11.50 14.19 01-01-13
Excess 0.06 0.16 0.16 0.72 0.64 0.68
NGTY - EPOCH U.S. CHOICE 264,495,569.74 1.01 0.19 6.92 6.92 15.36 8.40 8.03 01-01-14
RUSSELL 3000 (DAILY) 0.07 5.74 5.74 18.07 9.76 9.64 01-01-14
Excess 0.12 1.17 1.17 -2.71 -1.35 -1.61
NGTZ - SASCO U.S. CONTRARIAN VALUE 231,548,378.17 0.89 -0.79 2.90 2.90 15.65 1.71 3.59 01-01-14
Russell Midcap Value Total Return Index -0.73 3.76 3.76 19.82 8.94 9.95 01-01-14
Excess -0.06 -0.86 -0.86 -4.17 -7.23 -6.35
NGUG - THE BOSTON COMPANY OPP VALUE 227,552,586.77 0.87 -1.11 4.76 4.76 20.68 4.98 12-01-14
RUSSELL MIDCAP (DAILY) -0.16 5.15 5.15 17.03 6.96 12-01-14
Excess -0.95 -0.38 -0.38 3.65 -1.98
NGUF - CHAMPLAIN MID-CAP CORE 256,750,024.29 0.99 -0.89 5.57 5.57 22.71 10.75 12-01-14
RUSSELL MIDCAP (DAILY) -0.16 5.15 5.15 17.03 6.96 12-01-14
Excess -0.73 0.42 0.42 5.68 3.79
NGUR - BOSTON CO US SM CAP OPPORTUNISTIC VALUE 287,077,287.20 1.10 -0.07 7.31 7.31 29.96 13.48 09-01-15
RUSSELL 2000 (DAILY) 0.13 2.47 2.47 26.22 13.68 09-01-15
Excess -0.20 4.84 4.84 3.74 -0.21
NGUN - WELLINGTON US SMALL CAP OPP 279,548,096.33 1.07 0.27 4.56 4.56 25.53 13.41 12-01-15
RUSSELL 2000 (DAILY) 0.13 2.47 2.47 26.22 13.29 12-01-15
Excess 0.14 2.09 2.09 -0.69 0.13
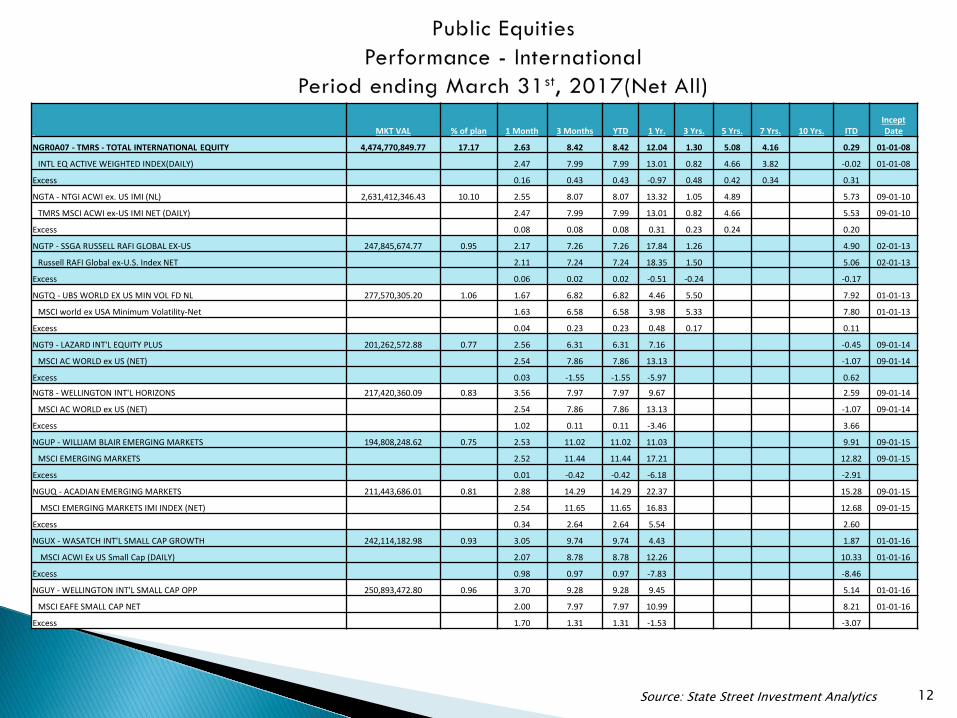
12 Source: State Street Investment Analytics
MKT VAL % of plan 1 Month 3 Months YTD 1 Yr. 3 Yrs. 5 Yrs. 7 Yrs. 10 Yrs. ITD Incept Date
NGR0A07 - TMRS - TOTAL INTERNATIONAL EQUITY 4,474,770,849.77 17.17 2.63 8.42 8.42 12.04 1.30 5.08 4.16 0.29 01-01-08
INTL EQ ACTIVE WEIGHTED INDEX(DAILY) 2.47 7.99 7.99 13.01 0.82 4.66 3.82 -0.02 01-01-08
Excess 0.16 0.43 0.43 -0.97 0.48 0.42 0.34 0.31
NGTA - NTGI ACWI ex. US IMI (NL) 2,631,412,346.43 10.10 2.55 8.07 8.07 13.32 1.05 4.89 5.73 09-01-10
TMRS MSCI ACWI ex-US IMI NET (DAILY) 2.47 7.99 7.99 13.01 0.82 4.66 5.53 09-01-10
Excess 0.08 0.08 0.08 0.31 0.23 0.24 0.20
NGTP - SSGA RUSSELL RAFI GLOBAL EX-US 247,845,674.77 0.95 2.17 7.26 7.26 17.84 1.26 4.90 02-01-13
Russell RAFI Global ex-U.S. Index NET 2.11 7.24 7.24 18.35 1.50 5.06 02-01-13
Excess 0.06 0.02 0.02 -0.51 -0.24 -0.17
NGTQ - UBS WORLD EX US MIN VOL FD NL 277,570,305.20 1.06 1.67 6.82 6.82 4.46 5.50 7.92 01-01-13
MSCI world ex USA Minimum Volatility-Net 1.63 6.58 6.58 3.98 5.33 7.80 01-01-13
Excess 0.04 0.23 0.23 0.48 0.17 0.11
NGT9 - LAZARD INT'L EQUITY PLUS 201,262,572.88 0.77 2.56 6.31 6.31 7.16 -0.45 09-01-14
MSCI AC WORLD ex US (NET) 2.54 7.86 7.86 13.13 -1.07 09-01-14
Excess 0.03 -1.55 -1.55 -5.97 0.62
NGT8 - WELLINGTON INT'L HORIZONS 217,420,360.09 0.83 3.56 7.97 7.97 9.67 2.59 09-01-14
MSCI AC WORLD ex US (NET) 2.54 7.86 7.86 13.13 -1.07 09-01-14
Excess 1.02 0.11 0.11 -3.46 3.66
NGUP - WILLIAM BLAIR EMERGING MARKETS 194,808,248.62 0.75 2.53 11.02 11.02 11.03 9.91 09-01-15
MSCI EMERGING MARKETS 2.52 11.44 11.44 17.21 12.82 09-01-15
Excess 0.01 -0.42 -0.42 -6.18 -2.91
NGUQ - ACADIAN EMERGING MARKETS 211,443,686.01 0.81 2.88 14.29 14.29 22.37 15.28 09-01-15
MSCI EMERGING MARKETS IMI INDEX (NET) 2.54 11.65 11.65 16.83 12.68 09-01-15
Excess 0.34 2.64 2.64 5.54 2.60
NGUX - WASATCH INT'L SMALL CAP GROWTH 242,114,182.98 0.93 3.05 9.74 9.74 4.43 1.87 01-01-16
MSCI ACWI Ex US Small Cap (DAILY) 2.07 8.78 8.78 12.26 10.33 01-01-16
Excess 0.98 0.97 0.97 -7.83 -8.46
NGUY - WELLINGTON INT'L SMALL CAP OPP 250,893,472.80 0.96 3.70 9.28 9.28 9.45 5.14 01-01-16
MSCI EAFE SMALL CAP NET 2.00 7.97 7.97 10.99 8.21 01-01-16
Excess 1.70 1.31 1.31 -1.53 -3.07
13
III. Fixed Income
14
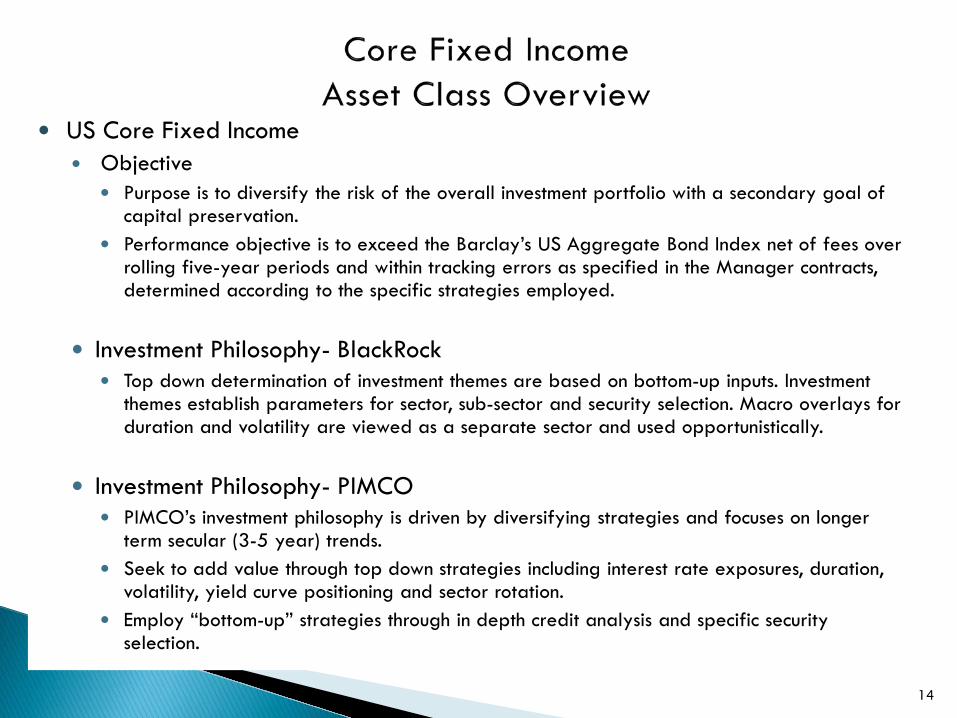
US Core Fixed Income Objective
Purpose is to diversify the risk of the overall investment portfolio with a secondary goal of capital preservation.
Performance objective is to exceed the Barclay’s US Aggregate Bond Index net of fees over rolling five-year periods and within tracking errors as specified in the Manager contracts, determined according to the specific strategies employed.
Investment Philosophy- BlackRock Top down determination of investment themes are based on bottom-up inputs. Investment
themes establish parameters for sector, sub-sector and security selection. Macro overlays for duration and volatility are viewed as a separate sector and used opportunistically.
Investment Philosophy- PIMCO PIMCO’s investment philosophy is driven by diversifying strategies and focuses on longer
term secular (3-5 year) trends. Seek to add value through top down strategies including interest rate exposures, duration,
volatility, yield curve positioning and sector rotation. Employ “bottom-up” strategies through in depth credit analysis and specific security
selection.
15
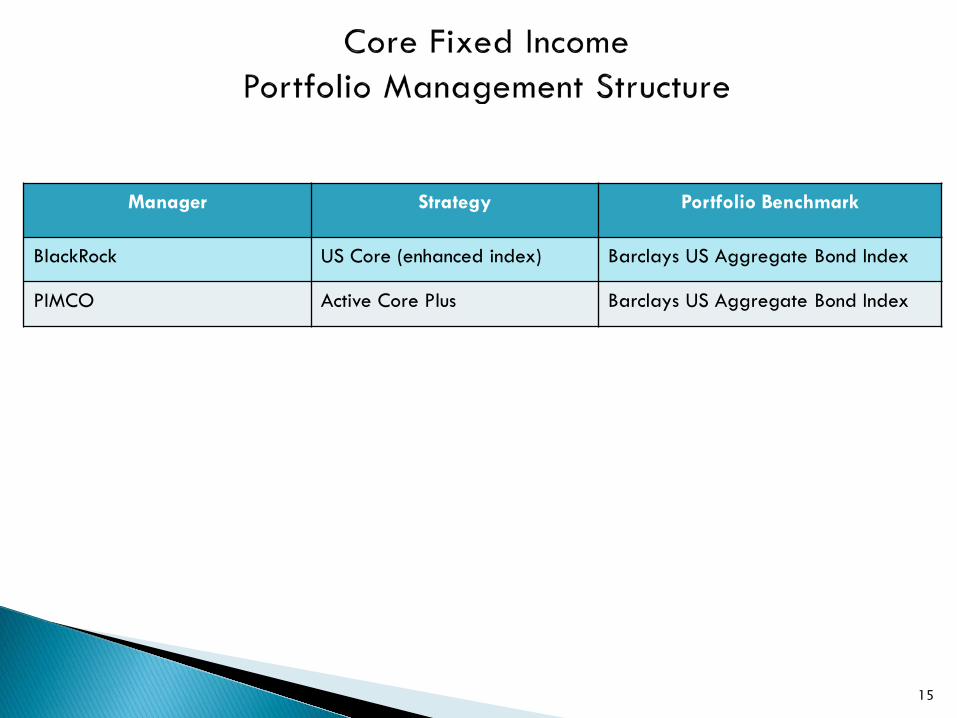
Manager Strategy Portfolio Benchmark
BlackRock US Core (enhanced index) Barclays US Aggregate Bond Index
PIMCO Active Core Plus Barclays US Aggregate Bond Index
16
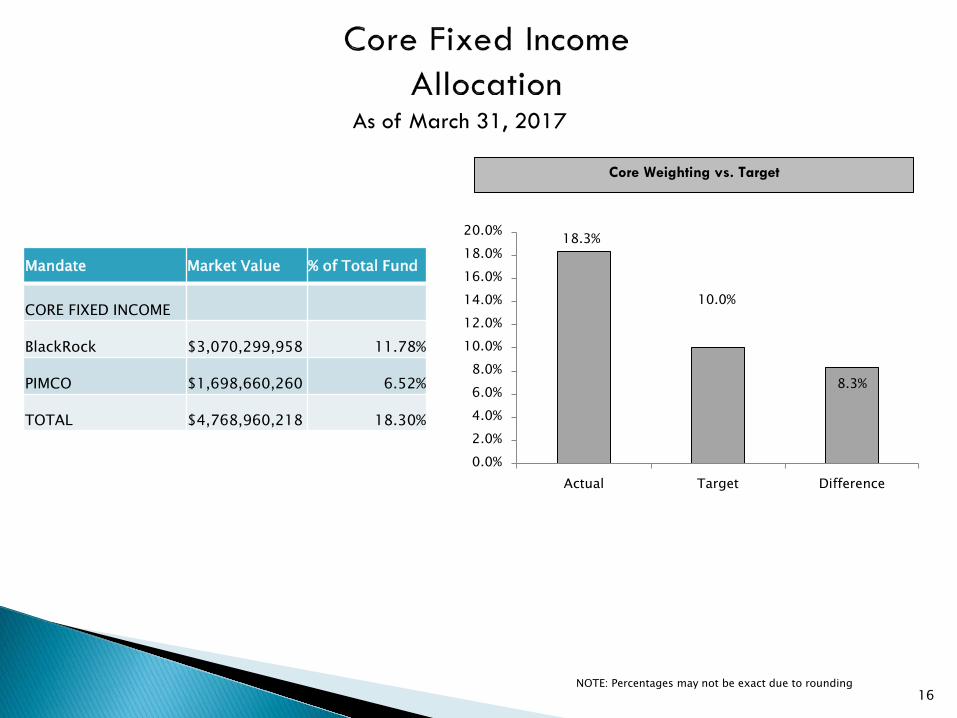
As of March 31, 2017
NOTE: Percentages may not be exact due to rounding
Core Weighting vs. Target
Mandate Market Value % of Total Fund
CORE FIXED INCOME
BlackRock $3,070,299,958 11.78%
PIMCO $1,698,660,260 6.52%
TOTAL $4,768,960,218 18.30%
18.3%
10.0%
8.3%
0.0%2.0%4.0%6.0%8.0%
10.0%12.0%14.0%16.0%18.0%20.0%
Actual Target Difference
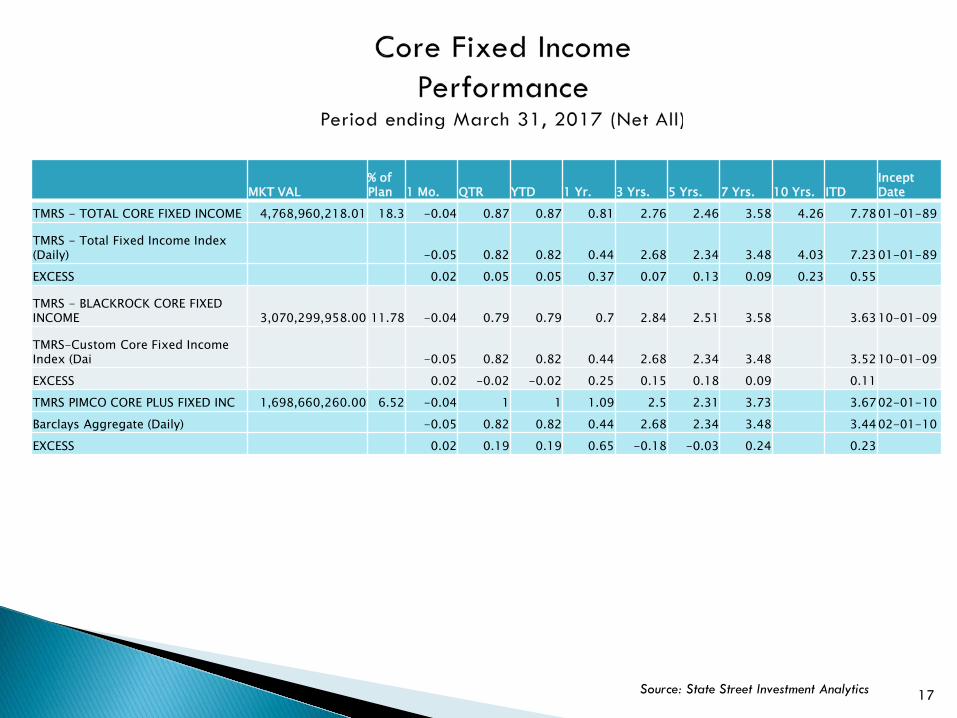
17 Source: State Street Investment Analytics
MKT VAL % of Plan 1 Mo. QTR YTD 1 Yr. 3 Yrs. 5 Yrs. 7 Yrs. 10 Yrs. ITD
Incept Date
TMRS - TOTAL CORE FIXED INCOME 4,768,960,218.01 18.3 -0.04 0.87 0.87 0.81 2.76 2.46 3.58 4.26 7.78 01-01-89
TMRS - Total Fixed Income Index (Daily) -0.05 0.82 0.82 0.44 2.68 2.34 3.48 4.03 7.23 01-01-89
EXCESS 0.02 0.05 0.05 0.37 0.07 0.13 0.09 0.23 0.55
TMRS - BLACKROCK CORE FIXED INCOME 3,070,299,958.00 11.78 -0.04 0.79 0.79 0.7 2.84 2.51 3.58 3.63 10-01-09
TMRS-Custom Core Fixed Income Index (Dai -0.05 0.82 0.82 0.44 2.68 2.34 3.48 3.52 10-01-09
EXCESS 0.02 -0.02 -0.02 0.25 0.15 0.18 0.09 0.11 TMRS PIMCO CORE PLUS FIXED INC 1,698,660,260.00 6.52 -0.04 1 1 1.09 2.5 2.31 3.73 3.67 02-01-10
Barclays Aggregate (Daily) -0.05 0.82 0.82 0.44 2.68 2.34 3.48 3.44 02-01-10
EXCESS 0.02 0.19 0.19 0.65 -0.18 -0.03 0.24 0.23
18
Objective The purpose is to enhance total return through income and capital appreciation and provide
diversification to the total investment portfolio. This allocation may be managed actively and/or passively through multiple managers in consideration of manager concentration risk.
The Performance Objectives is to exceed the returns of a blended benchmark comprised of the Barclays US Corporate High Yield Index 50%, the JPM GBI-EM Global Diversified Index (USD Unhedged) 25%, and JPM CEMBI Broad Diversified Index 25%, net of fees over rolling five-year periods and within tracking errors as specified in the manager contracts or otherwise agreed to in writing, determined according to the specific strategies employed.
19
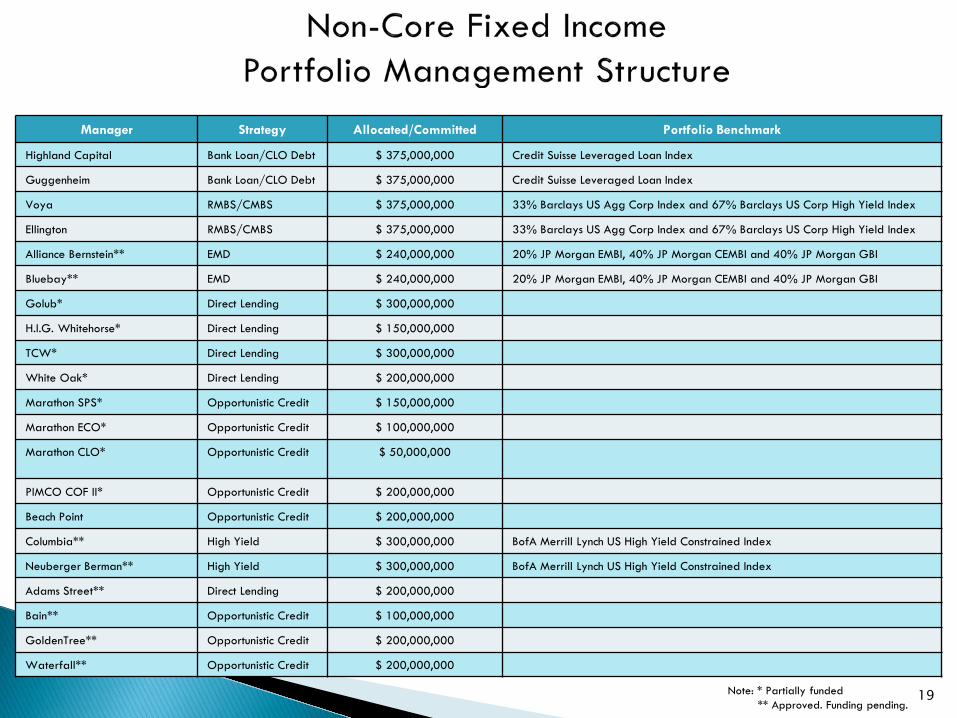
Manager Strategy Allocated/Committed Portfolio Benchmark
Highland Capital Bank Loan/CLO Debt $ 375,000,000 Credit Suisse Leveraged Loan Index
Guggenheim Bank Loan/CLO Debt $ 375,000,000 Credit Suisse Leveraged Loan Index
Voya RMBS/CMBS $ 375,000,000 33% Barclays US Agg Corp Index and 67% Barclays US Corp High Yield Index
Ellington RMBS/CMBS $ 375,000,000 33% Barclays US Agg Corp Index and 67% Barclays US Corp High Yield Index
Alliance Bernstein** EMD $ 240,000,000 20% JP Morgan EMBI, 40% JP Morgan CEMBI and 40% JP Morgan GBI
Bluebay** EMD $ 240,000,000 20% JP Morgan EMBI, 40% JP Morgan CEMBI and 40% JP Morgan GBI
Golub* Direct Lending $ 300,000,000
H.I.G. Whitehorse* Direct Lending $ 150,000,000
TCW* Direct Lending $ 300,000,000
White Oak* Direct Lending $ 200,000,000
Marathon SPS* Opportunistic Credit $ 150,000,000
Marathon ECO* Opportunistic Credit $ 100,000,000
Marathon CLO* Opportunistic Credit
$ 50,000,000
PIMCO COF II* Opportunistic Credit $ 200,000,000
Beach Point Opportunistic Credit $ 200,000,000
Columbia** High Yield $ 300,000,000 BofA Merrill Lynch US High Yield Constrained Index
Neuberger Berman** High Yield $ 300,000,000 BofA Merrill Lynch US High Yield Constrained Index
Adams Street** Direct Lending $ 200,000,000
Bain** Opportunistic Credit $ 100,000,000
GoldenTree** Opportunistic Credit $ 200,000,000
Waterfall** Opportunistic Credit $ 200,000,000
Note: * Partially funded ** Approved. Funding pending.
20
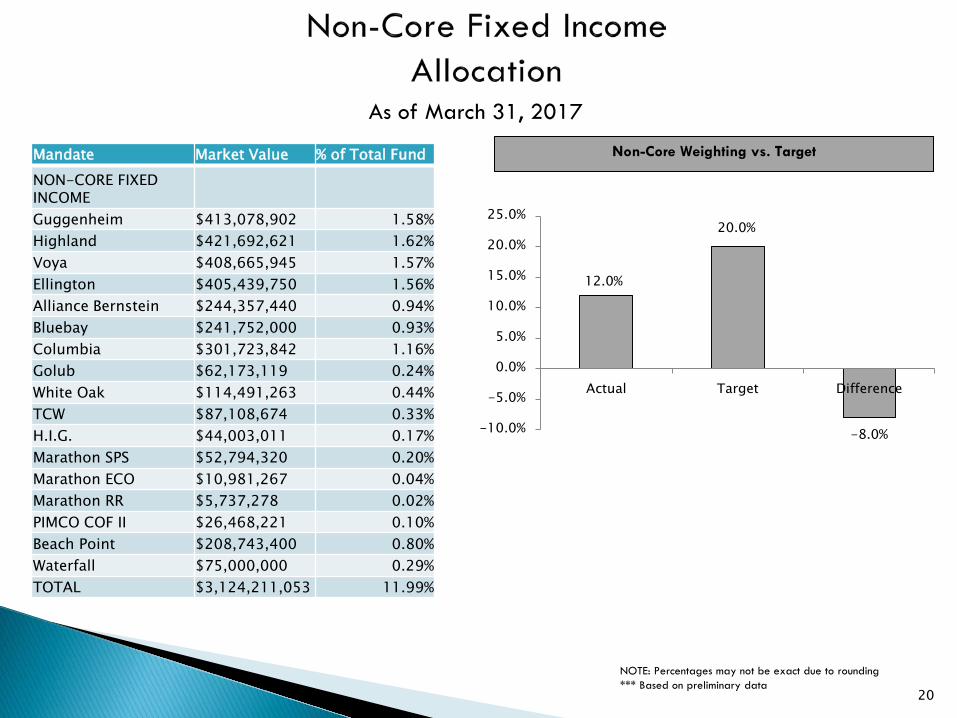
As of March 31, 2017
Non-Core Weighting vs. Target
NOTE: Percentages may not be exact due to rounding *** Based on preliminary data
Mandate Market Value % of Total Fund
NON-CORE FIXED INCOME Guggenheim $413,078,902 1.58% Highland $421,692,621 1.62% Voya $408,665,945 1.57% Ellington $405,439,750 1.56% Alliance Bernstein $244,357,440 0.94% Bluebay $241,752,000 0.93% Columbia $301,723,842 1.16% Golub $62,173,119 0.24% White Oak $114,491,263 0.44% TCW $87,108,674 0.33% H.I.G. $44,003,011 0.17% Marathon SPS $52,794,320 0.20% Marathon ECO $10,981,267 0.04% Marathon RR $5,737,278 0.02% PIMCO COF II $26,468,221 0.10% Beach Point $208,743,400 0.80% Waterfall $75,000,000 0.29% TOTAL $3,124,211,053 11.99%
12.0%
20.0%
-8.0% -10.0%
-5.0%
0.0%
5.0%
10.0%
15.0%
20.0%
25.0%
Actual Target Difference
21
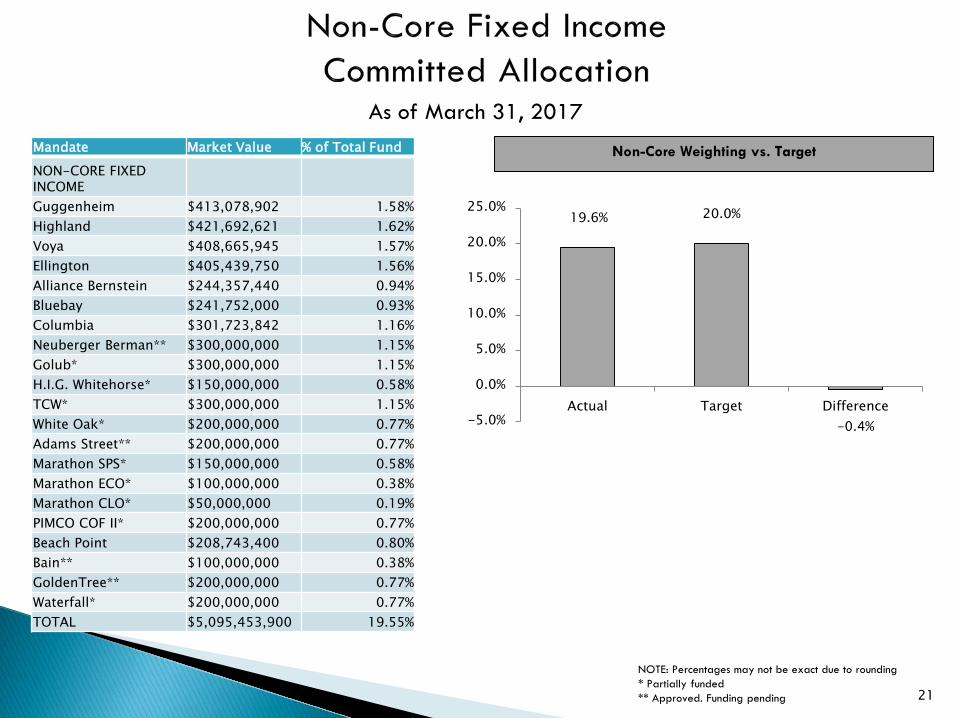
As of March 31, 2017
Non-Core Weighting vs. Target
NOTE: Percentages may not be exact due to rounding * Partially funded ** Approved. Funding pending
Mandate Market Value % of Total Fund
NON-CORE FIXED INCOME Guggenheim $413,078,902 1.58% Highland $421,692,621 1.62% Voya $408,665,945 1.57% Ellington $405,439,750 1.56% Alliance Bernstein $244,357,440 0.94% Bluebay $241,752,000 0.93% Columbia $301,723,842 1.16% Neuberger Berman** $300,000,000 1.15% Golub* $300,000,000 1.15% H.I.G. Whitehorse* $150,000,000 0.58% TCW* $300,000,000 1.15% White Oak* $200,000,000 0.77% Adams Street** $200,000,000 0.77% Marathon SPS* $150,000,000 0.58% Marathon ECO* $100,000,000 0.38% Marathon CLO* $50,000,000 0.19% PIMCO COF II* $200,000,000 0.77% Beach Point $208,743,400 0.80% Bain** $100,000,000 0.38% GoldenTree** $200,000,000 0.77% Waterfall* $200,000,000 0.77% TOTAL $5,095,453,900 19.55%
19.6% 20.0%
-0.4% -5.0%
0.0%
5.0%
10.0%
15.0%
20.0%
25.0%
Actual Target Difference
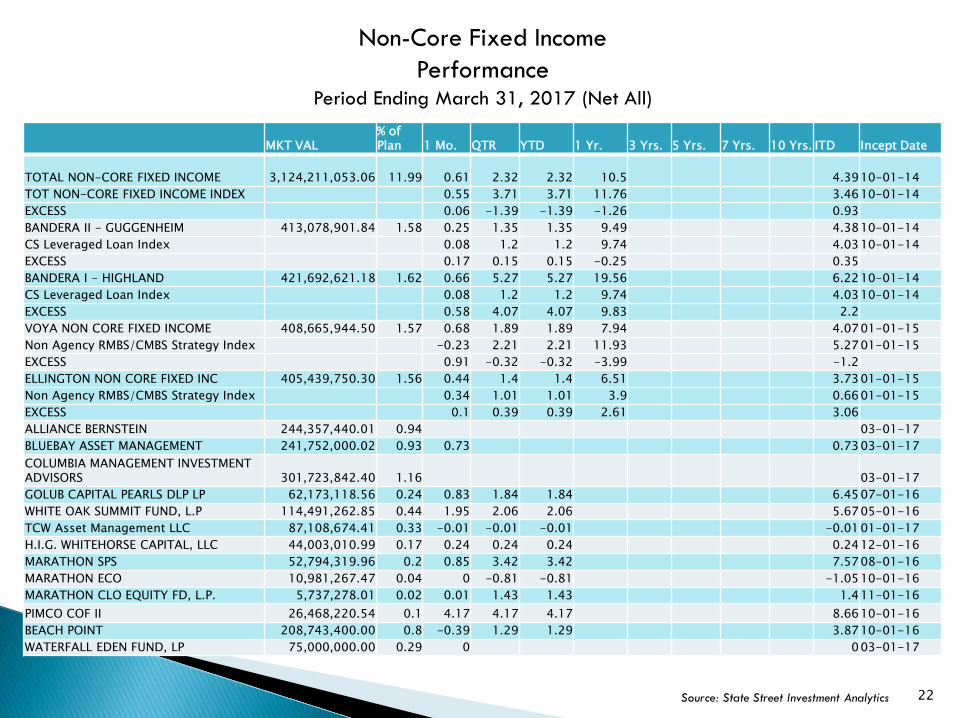
22 Source: State Street Investment Analytics
Non-Core Fixed Income Performance
Period Ending March 31, 2017 (Net All)
MKT VAL % of Plan 1 Mo. QTR YTD 1 Yr. 3 Yrs. 5 Yrs. 7 Yrs. 10 Yrs. ITD Incept Date
TOTAL NON-CORE FIXED INCOME 3,124,211,053.06 11.99 0.61 2.32 2.32 10.5 4.39 10-01-14 TOT NON-CORE FIXED INCOME INDEX 0.55 3.71 3.71 11.76 3.46 10-01-14 EXCESS 0.06 -1.39 -1.39 -1.26 0.93 BANDERA II - GUGGENHEIM 413,078,901.84 1.58 0.25 1.35 1.35 9.49 4.38 10-01-14 CS Leveraged Loan Index 0.08 1.2 1.2 9.74 4.03 10-01-14 EXCESS 0.17 0.15 0.15 -0.25 0.35 BANDERA I - HIGHLAND 421,692,621.18 1.62 0.66 5.27 5.27 19.56 6.22 10-01-14 CS Leveraged Loan Index 0.08 1.2 1.2 9.74 4.03 10-01-14 EXCESS 0.58 4.07 4.07 9.83 2.2 VOYA NON CORE FIXED INCOME 408,665,944.50 1.57 0.68 1.89 1.89 7.94 4.07 01-01-15 Non Agency RMBS/CMBS Strategy Index -0.23 2.21 2.21 11.93 5.27 01-01-15 EXCESS 0.91 -0.32 -0.32 -3.99 -1.2 ELLINGTON NON CORE FIXED INC 405,439,750.30 1.56 0.44 1.4 1.4 6.51 3.73 01-01-15 Non Agency RMBS/CMBS Strategy Index 0.34 1.01 1.01 3.9 0.66 01-01-15 EXCESS 0.1 0.39 0.39 2.61 3.06 ALLIANCE BERNSTEIN 244,357,440.01 0.94 03-01-17 BLUEBAY ASSET MANAGEMENT 241,752,000.02 0.93 0.73 0.73 03-01-17 COLUMBIA MANAGEMENT INVESTMENT ADVISORS 301,723,842.40 1.16 03-01-17 GOLUB CAPITAL PEARLS DLP LP 62,173,118.56 0.24 0.83 1.84 1.84 6.45 07-01-16 WHITE OAK SUMMIT FUND, L.P 114,491,262.85 0.44 1.95 2.06 2.06 5.67 05-01-16 TCW Asset Management LLC 87,108,674.41 0.33 -0.01 -0.01 -0.01 -0.01 01-01-17 H.I.G. WHITEHORSE CAPITAL, LLC 44,003,010.99 0.17 0.24 0.24 0.24 0.24 12-01-16 MARATHON SPS 52,794,319.96 0.2 0.85 3.42 3.42 7.57 08-01-16 MARATHON ECO 10,981,267.47 0.04 0 -0.81 -0.81 -1.05 10-01-16 MARATHON CLO EQUITY FD, L.P. 5,737,278.01 0.02 0.01 1.43 1.43 1.4 11-01-16 PIMCO COF II 26,468,220.54 0.1 4.17 4.17 4.17 8.66 10-01-16 BEACH POINT 208,743,400.00 0.8 -0.39 1.29 1.29 3.87 10-01-16 WATERFALL EDEN FUND, LP 75,000,000.00 0.29 0 0 03-01-17

23
IV. Real Estate
24
Objective To enhance total return and provide diversification to the overall investment portfolio. Due to the illiquid and cyclical nature of the real estate asset class, Staff and the Real Estate
Investment Consultant recommend that the target allocation be invested over a multi-year period in order to avoid considerable vintage year risks.
Performance Objective Long term performance objective is a real rate of return (adjusted for inflation) of five percent
(5%) net of investment management fees. The real estate portfolio is expected to generate returns net of all fees and expenses, in excess
of their respective indices, over rolling five year investment time horizons.
25
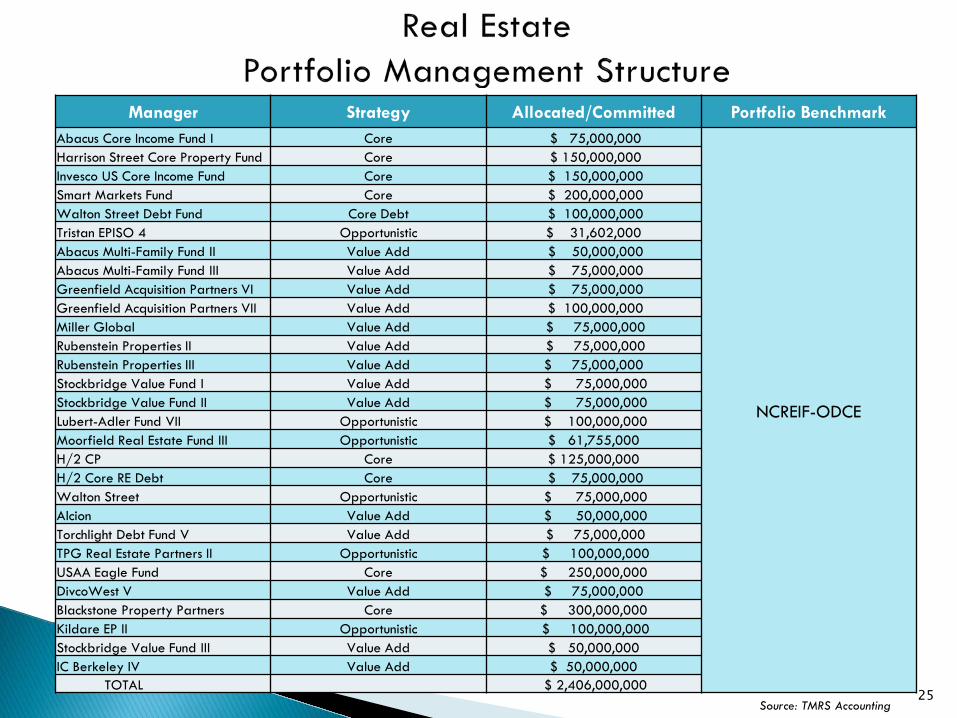
Manager Strategy Allocated/Committed Portfolio Benchmark Abacus Core Income Fund I Core $ 75,000,000
NCREIF-ODCE
Harrison Street Core Property Fund Core $ 150,000,000 Invesco US Core Income Fund Core $ 150,000,000 Smart Markets Fund Core $ 200,000,000 Walton Street Debt Fund Core Debt $ 100,000,000 Tristan EPISO 4 Opportunistic $ 31,602,000 Abacus Multi-Family Fund II Value Add $ 50,000,000 Abacus Multi-Family Fund III Value Add $ 75,000,000 Greenfield Acquisition Partners VI Value Add $ 75,000,000 Greenfield Acquisition Partners VII Value Add $ 100,000,000 Miller Global Value Add $ 75,000,000 Rubenstein Properties II Value Add $ 75,000,000 Rubenstein Properties III Value Add $ 75,000,000 Stockbridge Value Fund I Value Add $ 75,000,000 Stockbridge Value Fund II Value Add $ 75,000,000 Lubert-Adler Fund VII Opportunistic $ 100,000,000 Moorfield Real Estate Fund III Opportunistic $ 61,755,000 H/2 CP Core $ 125,000,000 H/2 Core RE Debt Core $ 75,000,000 Walton Street Opportunistic $ 75,000,000 Alcion Value Add $ 50,000,000 Torchlight Debt Fund V Value Add $ 75,000,000 TPG Real Estate Partners II Opportunistic $ 100,000,000 USAA Eagle Fund Core $ 250,000,000 DivcoWest V Value Add $ 75,000,000 Blackstone Property Partners Core $ 300,000,000 Kildare EP II Opportunistic $ 100,000,000 Stockbridge Value Fund III Value Add $ 50,000,000 IC Berkeley IV Value Add $ 50,000,000
TOTAL $ 2,406,000,000 Source: TMRS Accounting
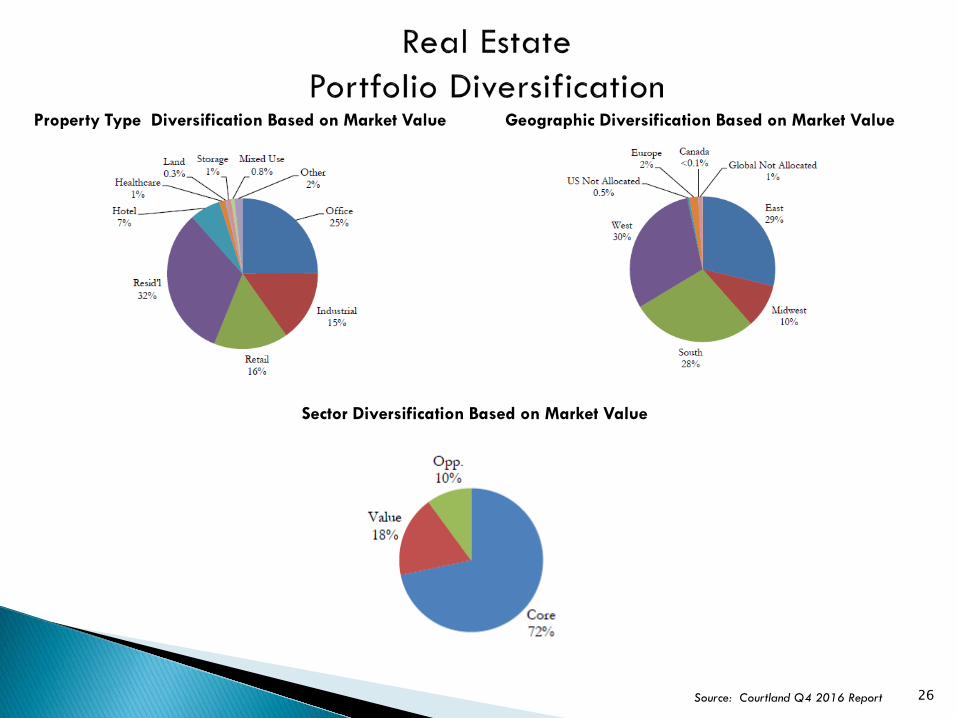
26 Source: Courtland Q4 2016 Report
Property Type Diversification Based on Market Value Geographic Diversification Based on Market Value
Sector Diversification Based on Market Value
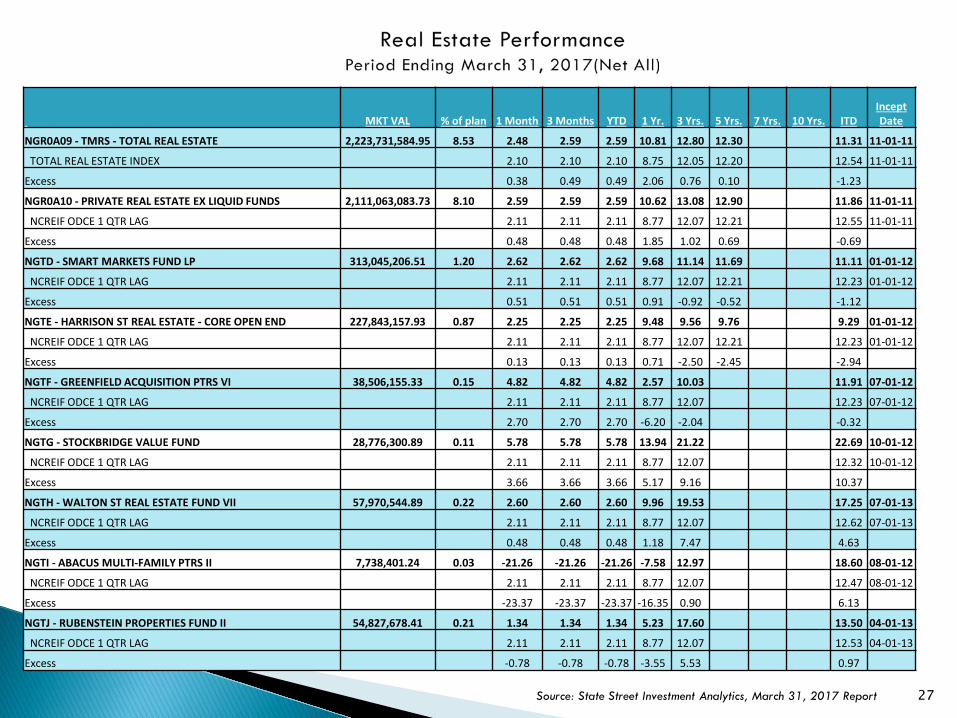
27 Source: State Street Investment Analytics, March 31, 2017 Report
MKT VAL % of plan 1 Month 3 Months YTD 1 Yr. 3 Yrs. 5 Yrs. 7 Yrs. 10 Yrs. ITD Incept Date
NGR0A09 - TMRS - TOTAL REAL ESTATE 2,223,731,584.95 8.53 2.48 2.59 2.59 10.81 12.80 12.30 11.31 11-01-11
TOTAL REAL ESTATE INDEX 2.10 2.10 2.10 8.75 12.05 12.20 12.54 11-01-11
Excess 0.38 0.49 0.49 2.06 0.76 0.10 -1.23
NGR0A10 - PRIVATE REAL ESTATE EX LIQUID FUNDS 2,111,063,083.73 8.10 2.59 2.59 2.59 10.62 13.08 12.90 11.86 11-01-11
NCREIF ODCE 1 QTR LAG 2.11 2.11 2.11 8.77 12.07 12.21 12.55 11-01-11
Excess 0.48 0.48 0.48 1.85 1.02 0.69 -0.69
NGTD - SMART MARKETS FUND LP 313,045,206.51 1.20 2.62 2.62 2.62 9.68 11.14 11.69 11.11 01-01-12
NCREIF ODCE 1 QTR LAG 2.11 2.11 2.11 8.77 12.07 12.21 12.23 01-01-12
Excess 0.51 0.51 0.51 0.91 -0.92 -0.52 -1.12
NGTE - HARRISON ST REAL ESTATE - CORE OPEN END 227,843,157.93 0.87 2.25 2.25 2.25 9.48 9.56 9.76 9.29 01-01-12
NCREIF ODCE 1 QTR LAG 2.11 2.11 2.11 8.77 12.07 12.21 12.23 01-01-12
Excess 0.13 0.13 0.13 0.71 -2.50 -2.45 -2.94
NGTF - GREENFIELD ACQUISITION PTRS VI 38,506,155.33 0.15 4.82 4.82 4.82 2.57 10.03 11.91 07-01-12
NCREIF ODCE 1 QTR LAG 2.11 2.11 2.11 8.77 12.07 12.23 07-01-12
Excess 2.70 2.70 2.70 -6.20 -2.04 -0.32
NGTG - STOCKBRIDGE VALUE FUND 28,776,300.89 0.11 5.78 5.78 5.78 13.94 21.22 22.69 10-01-12
NCREIF ODCE 1 QTR LAG 2.11 2.11 2.11 8.77 12.07 12.32 10-01-12
Excess 3.66 3.66 3.66 5.17 9.16 10.37
NGTH - WALTON ST REAL ESTATE FUND VII 57,970,544.89 0.22 2.60 2.60 2.60 9.96 19.53 17.25 07-01-13
NCREIF ODCE 1 QTR LAG 2.11 2.11 2.11 8.77 12.07 12.62 07-01-13
Excess 0.48 0.48 0.48 1.18 7.47 4.63
NGTI - ABACUS MULTI-FAMILY PTRS II 7,738,401.24 0.03 -21.26 -21.26 -21.26 -7.58 12.97 18.60 08-01-12
NCREIF ODCE 1 QTR LAG 2.11 2.11 2.11 8.77 12.07 12.47 08-01-12
Excess -23.37 -23.37 -23.37 -16.35 0.90 6.13
NGTJ - RUBENSTEIN PROPERTIES FUND II 54,827,678.41 0.21 1.34 1.34 1.34 5.23 17.60 13.50 04-01-13
NCREIF ODCE 1 QTR LAG 2.11 2.11 2.11 8.77 12.07 12.53 04-01-13
Excess -0.78 -0.78 -0.78 -3.55 5.53 0.97
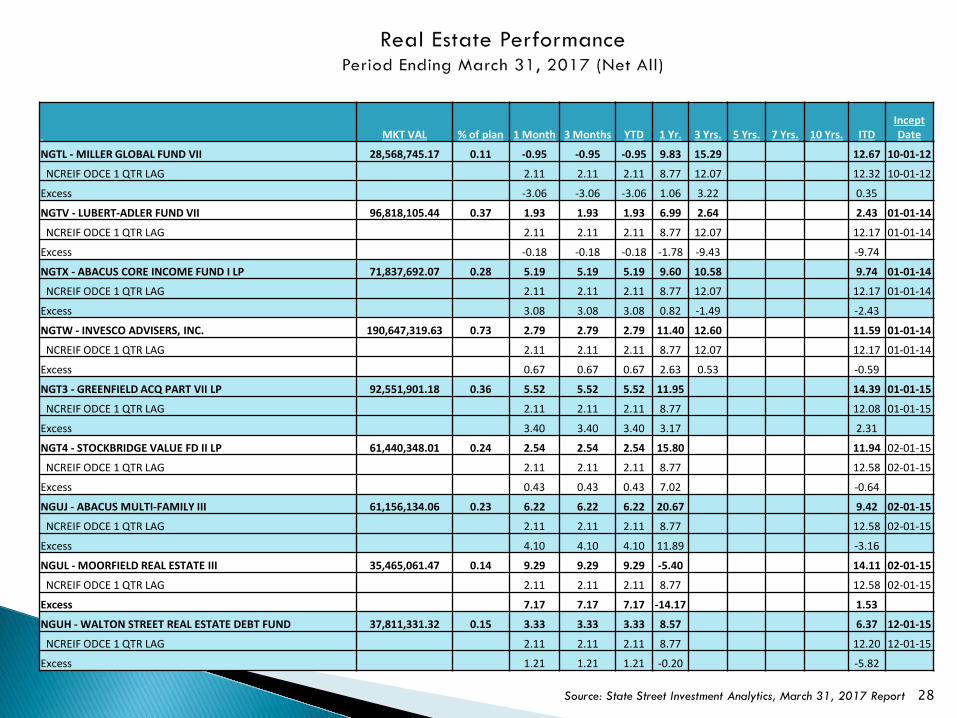
28 Source: State Street Investment Analytics, March 31, 2017 Report
MKT VAL % of plan 1 Month 3 Months YTD 1 Yr. 3 Yrs. 5 Yrs. 7 Yrs. 10 Yrs. ITD Incept Date
NGTL - MILLER GLOBAL FUND VII 28,568,745.17 0.11 -0.95 -0.95 -0.95 9.83 15.29 12.67 10-01-12
NCREIF ODCE 1 QTR LAG 2.11 2.11 2.11 8.77 12.07 12.32 10-01-12
Excess -3.06 -3.06 -3.06 1.06 3.22 0.35
NGTV - LUBERT-ADLER FUND VII 96,818,105.44 0.37 1.93 1.93 1.93 6.99 2.64 2.43 01-01-14
NCREIF ODCE 1 QTR LAG 2.11 2.11 2.11 8.77 12.07 12.17 01-01-14
Excess -0.18 -0.18 -0.18 -1.78 -9.43 -9.74
NGTX - ABACUS CORE INCOME FUND I LP 71,837,692.07 0.28 5.19 5.19 5.19 9.60 10.58 9.74 01-01-14
NCREIF ODCE 1 QTR LAG 2.11 2.11 2.11 8.77 12.07 12.17 01-01-14
Excess 3.08 3.08 3.08 0.82 -1.49 -2.43
NGTW - INVESCO ADVISERS, INC. 190,647,319.63 0.73 2.79 2.79 2.79 11.40 12.60 11.59 01-01-14
NCREIF ODCE 1 QTR LAG 2.11 2.11 2.11 8.77 12.07 12.17 01-01-14
Excess 0.67 0.67 0.67 2.63 0.53 -0.59
NGT3 - GREENFIELD ACQ PART VII LP 92,551,901.18 0.36 5.52 5.52 5.52 11.95 14.39 01-01-15
NCREIF ODCE 1 QTR LAG 2.11 2.11 2.11 8.77 12.08 01-01-15
Excess 3.40 3.40 3.40 3.17 2.31
NGT4 - STOCKBRIDGE VALUE FD II LP 61,440,348.01 0.24 2.54 2.54 2.54 15.80 11.94 02-01-15
NCREIF ODCE 1 QTR LAG 2.11 2.11 2.11 8.77 12.58 02-01-15
Excess 0.43 0.43 0.43 7.02 -0.64
NGUJ - ABACUS MULTI-FAMILY III 61,156,134.06 0.23 6.22 6.22 6.22 20.67 9.42 02-01-15
NCREIF ODCE 1 QTR LAG 2.11 2.11 2.11 8.77 12.58 02-01-15
Excess 4.10 4.10 4.10 11.89 -3.16
NGUL - MOORFIELD REAL ESTATE III 35,465,061.47 0.14 9.29 9.29 9.29 -5.40 14.11 02-01-15
NCREIF ODCE 1 QTR LAG 2.11 2.11 2.11 8.77 12.58 02-01-15
Excess 7.17 7.17 7.17 -14.17 1.53
NGUH - WALTON STREET REAL ESTATE DEBT FUND 37,811,331.32 0.15 3.33 3.33 3.33 8.57 6.37 12-01-15
NCREIF ODCE 1 QTR LAG 2.11 2.11 2.11 8.77 12.20 12-01-15
Excess 1.21 1.21 1.21 -0.20 -5.82
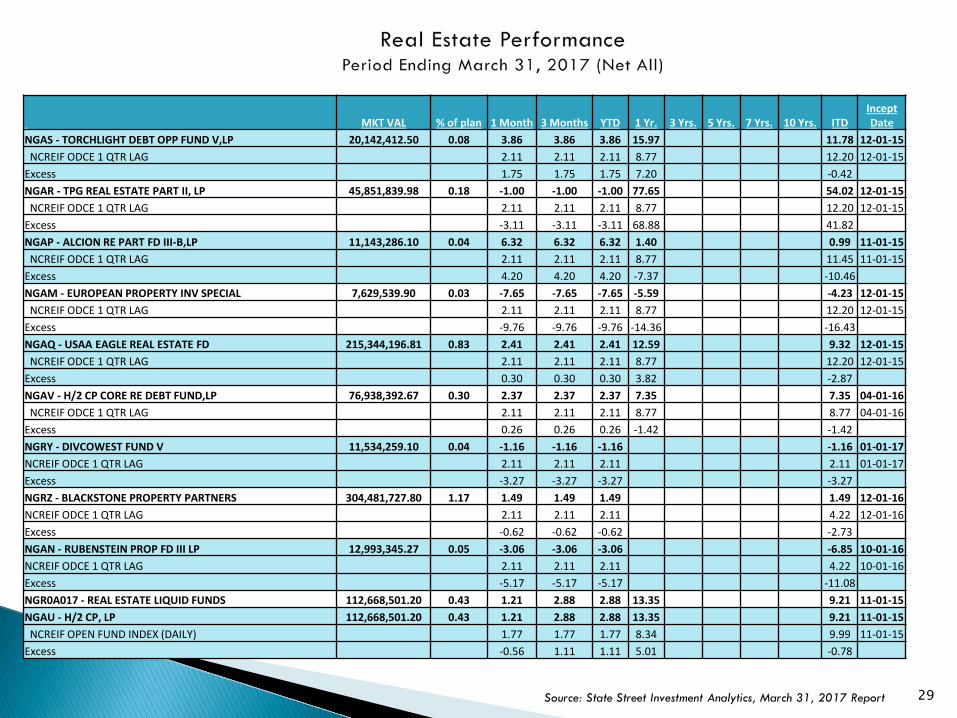
29 Source: State Street Investment Analytics, March 31, 2017 Report
MKT VAL % of plan 1 Month 3 Months YTD 1 Yr. 3 Yrs. 5 Yrs. 7 Yrs. 10 Yrs. ITD Incept Date
NGAS - TORCHLIGHT DEBT OPP FUND V,LP 20,142,412.50 0.08 3.86 3.86 3.86 15.97 11.78 12-01-15 NCREIF ODCE 1 QTR LAG 2.11 2.11 2.11 8.77 12.20 12-01-15
Excess 1.75 1.75 1.75 7.20 -0.42 NGAR - TPG REAL ESTATE PART II, LP 45,851,839.98 0.18 -1.00 -1.00 -1.00 77.65 54.02 12-01-15 NCREIF ODCE 1 QTR LAG 2.11 2.11 2.11 8.77 12.20 12-01-15
Excess -3.11 -3.11 -3.11 68.88 41.82 NGAP - ALCION RE PART FD III-B,LP 11,143,286.10 0.04 6.32 6.32 6.32 1.40 0.99 11-01-15 NCREIF ODCE 1 QTR LAG 2.11 2.11 2.11 8.77 11.45 11-01-15
Excess 4.20 4.20 4.20 -7.37 -10.46 NGAM - EUROPEAN PROPERTY INV SPECIAL 7,629,539.90 0.03 -7.65 -7.65 -7.65 -5.59 -4.23 12-01-15 NCREIF ODCE 1 QTR LAG 2.11 2.11 2.11 8.77 12.20 12-01-15
Excess -9.76 -9.76 -9.76 -14.36 -16.43 NGAQ - USAA EAGLE REAL ESTATE FD 215,344,196.81 0.83 2.41 2.41 2.41 12.59 9.32 12-01-15 NCREIF ODCE 1 QTR LAG 2.11 2.11 2.11 8.77 12.20 12-01-15
Excess 0.30 0.30 0.30 3.82 -2.87 NGAV - H/2 CP CORE RE DEBT FUND,LP 76,938,392.67 0.30 2.37 2.37 2.37 7.35 7.35 04-01-16 NCREIF ODCE 1 QTR LAG 2.11 2.11 2.11 8.77 8.77 04-01-16
Excess 0.26 0.26 0.26 -1.42 -1.42 NGRY - DIVCOWEST FUND V 11,534,259.10 0.04 -1.16 -1.16 -1.16 -1.16 01-01-17 NCREIF ODCE 1 QTR LAG 2.11 2.11 2.11 2.11 01-01-17 Excess -3.27 -3.27 -3.27 -3.27 NGRZ - BLACKSTONE PROPERTY PARTNERS 304,481,727.80 1.17 1.49 1.49 1.49 1.49 12-01-16 NCREIF ODCE 1 QTR LAG 2.11 2.11 2.11 4.22 12-01-16 Excess -0.62 -0.62 -0.62 -2.73 NGAN - RUBENSTEIN PROP FD III LP 12,993,345.27 0.05 -3.06 -3.06 -3.06 -6.85 10-01-16 NCREIF ODCE 1 QTR LAG 2.11 2.11 2.11 4.22 10-01-16 Excess -5.17 -5.17 -5.17 -11.08 NGR0A017 - REAL ESTATE LIQUID FUNDS 112,668,501.20 0.43 1.21 2.88 2.88 13.35 9.21 11-01-15 NGAU - H/2 CP, LP 112,668,501.20 0.43 1.21 2.88 2.88 13.35 9.21 11-01-15 NCREIF OPEN FUND INDEX (DAILY) 1.77 1.77 1.77 8.34 9.99 11-01-15
Excess -0.56 1.11 1.11 5.01 -0.78

30
V. Real Return
31
Objective Purpose is to enhance total return and provide diversification and hedge against inflation risks
to the overall investment portfolio. Due to the varied nature of the Real Return space the portfolio will include strategies across a
variety of real asset types as well as a number of investment vehicle types in order to maintain a diversified approach.
Performance Objective Long term performance objective over a period 5 years or a full market cycle is a real rate of
return (adjusted for inflation) of CPI + 400 basis points. On a short term basis the real return portfolio is expected to generate returns net of all fees
and expenses, in excess of their respective indices individually and in excess of the Barclay’s World Government Inflation Linked Bond Index for the portfolio as a whole.
32
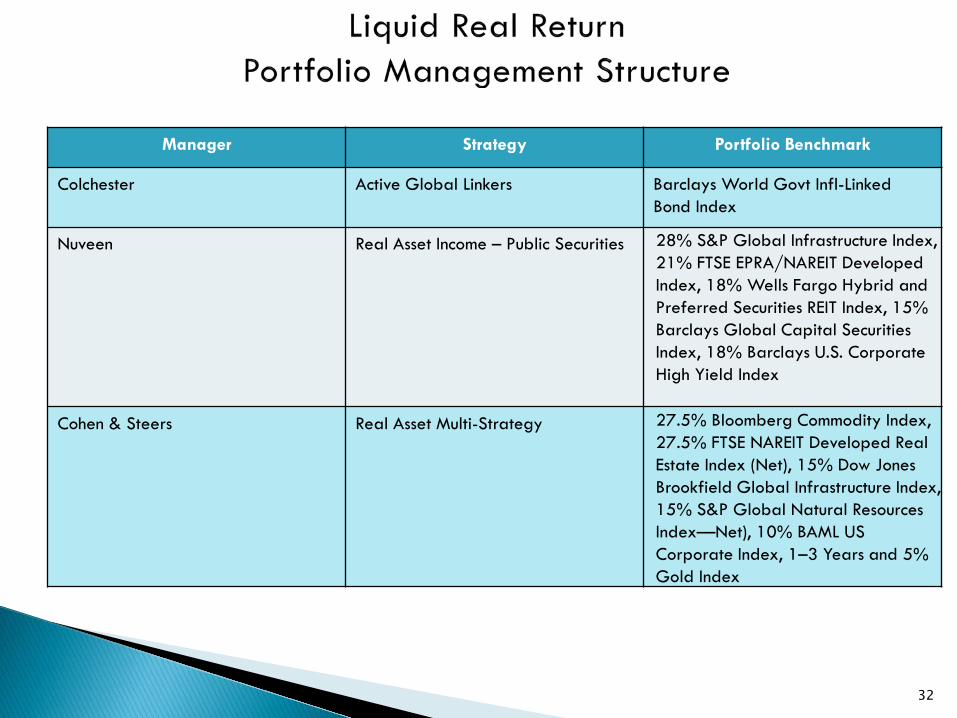
Manager Strategy Portfolio Benchmark
Colchester Active Global Linkers Barclays World Govt Infl-Linked Bond Index
Nuveen
Real Asset Income – Public Securities
28% S&P Global Infrastructure Index, 21% FTSE EPRA/NAREIT Developed Index, 18% Wells Fargo Hybrid and Preferred Securities REIT Index, 15% Barclays Global Capital Securities Index, 18% Barclays U.S. Corporate High Yield Index
Cohen & Steers Real Asset Multi-Strategy 27.5% Bloomberg Commodity Index, 27.5% FTSE NAREIT Developed Real Estate Index (Net), 15% Dow Jones Brookfield Global Infrastructure Index, 15% S&P Global Natural Resources Index—Net), 10% BAML US Corporate Index, 1–3 Years and 5% Gold Index
33
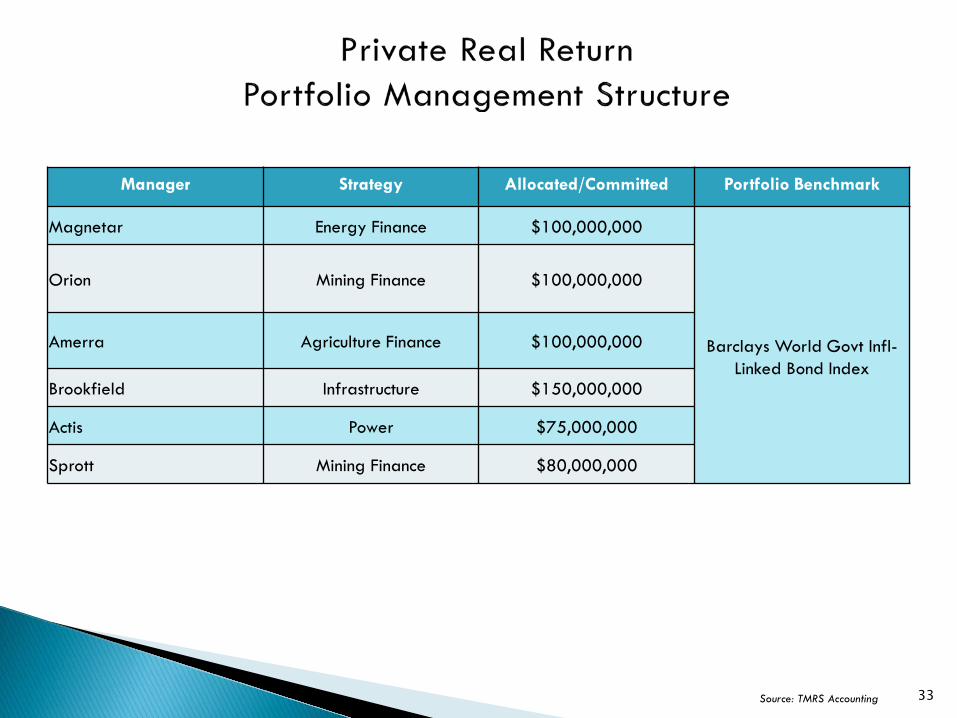
Manager Strategy Allocated/Committed Portfolio Benchmark
Magnetar Energy Finance $100,000,000
Barclays World Govt Infl-
Linked Bond Index
Orion Mining Finance
$100,000,000
Amerra Agriculture Finance $100,000,000
Brookfield Infrastructure $150,000,000
Actis Power $75,000,000
Sprott Mining Finance $80,000,000
Source: TMRS Accounting
34
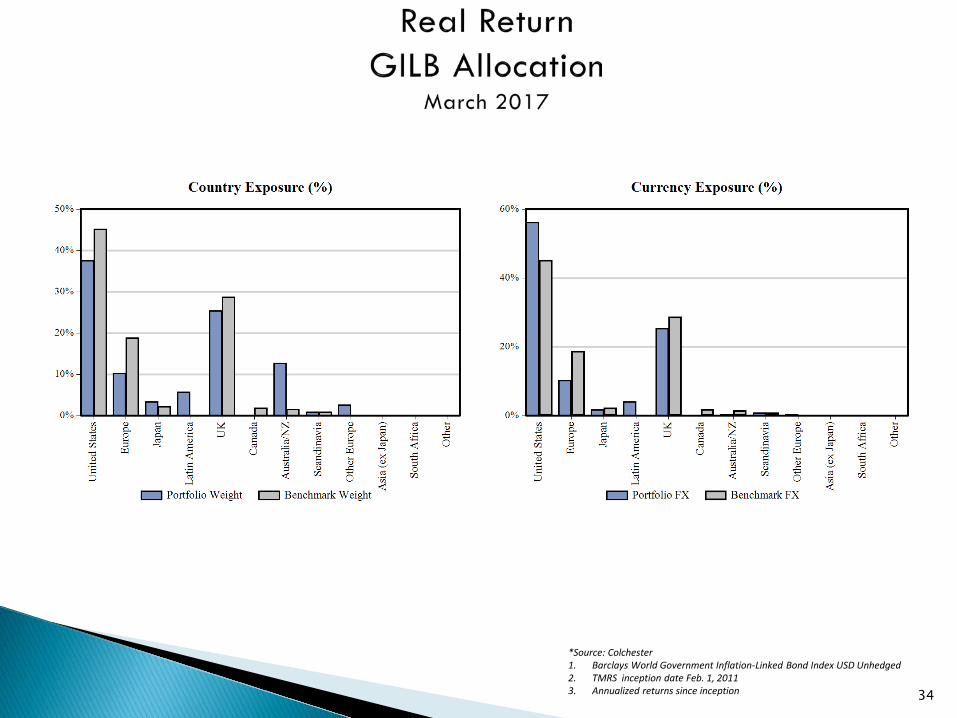
*Source: Colchester 1. Barclays World Government Inflation-Linked Bond Index USD Unhedged 2. TMRS inception date Feb. 1, 2011 3. Annualized returns since inception
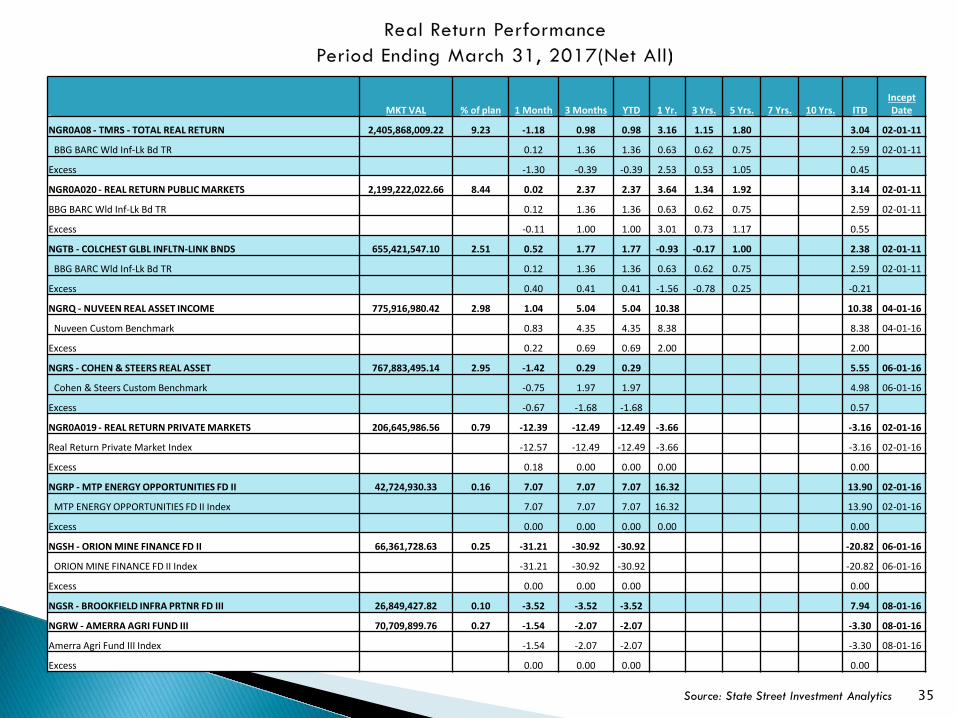
35 Source: State Street Investment Analytics
MKT VAL % of plan 1 Month 3 Months YTD 1 Yr. 3 Yrs. 5 Yrs. 7 Yrs. 10 Yrs. ITD Incept Date
NGR0A08 - TMRS - TOTAL REAL RETURN 2,405,868,009.22 9.23 -1.18 0.98 0.98 3.16 1.15 1.80 3.04 02-01-11
BBG BARC Wld Inf-Lk Bd TR 0.12 1.36 1.36 0.63 0.62 0.75 2.59 02-01-11
Excess -1.30 -0.39 -0.39 2.53 0.53 1.05 0.45
NGR0A020 - REAL RETURN PUBLIC MARKETS 2,199,222,022.66 8.44 0.02 2.37 2.37 3.64 1.34 1.92 3.14 02-01-11
BBG BARC Wld Inf-Lk Bd TR 0.12 1.36 1.36 0.63 0.62 0.75 2.59 02-01-11
Excess -0.11 1.00 1.00 3.01 0.73 1.17 0.55
NGTB - COLCHEST GLBL INFLTN-LINK BNDS 655,421,547.10 2.51 0.52 1.77 1.77 -0.93 -0.17 1.00 2.38 02-01-11
BBG BARC Wld Inf-Lk Bd TR 0.12 1.36 1.36 0.63 0.62 0.75 2.59 02-01-11
Excess 0.40 0.41 0.41 -1.56 -0.78 0.25 -0.21
NGRQ - NUVEEN REAL ASSET INCOME 775,916,980.42 2.98 1.04 5.04 5.04 10.38 10.38 04-01-16
Nuveen Custom Benchmark 0.83 4.35 4.35 8.38 8.38 04-01-16
Excess 0.22 0.69 0.69 2.00 2.00
NGRS - COHEN & STEERS REAL ASSET 767,883,495.14 2.95 -1.42 0.29 0.29 5.55 06-01-16
Cohen & Steers Custom Benchmark -0.75 1.97 1.97 4.98 06-01-16
Excess -0.67 -1.68 -1.68 0.57
NGR0A019 - REAL RETURN PRIVATE MARKETS 206,645,986.56 0.79 -12.39 -12.49 -12.49 -3.66 -3.16 02-01-16
Real Return Private Market Index -12.57 -12.49 -12.49 -3.66 -3.16 02-01-16
Excess 0.18 0.00 0.00 0.00 0.00
NGRP - MTP ENERGY OPPORTUNITIES FD II 42,724,930.33 0.16 7.07 7.07 7.07 16.32 13.90 02-01-16
MTP ENERGY OPPORTUNITIES FD II Index 7.07 7.07 7.07 16.32 13.90 02-01-16
Excess 0.00 0.00 0.00 0.00 0.00
NGSH - ORION MINE FINANCE FD II 66,361,728.63 0.25 -31.21 -30.92 -30.92 -20.82 06-01-16
ORION MINE FINANCE FD II Index -31.21 -30.92 -30.92 -20.82 06-01-16
Excess 0.00 0.00 0.00 0.00
NGSR - BROOKFIELD INFRA PRTNR FD III 26,849,427.82 0.10 -3.52 -3.52 -3.52 7.94 08-01-16
NGRW - AMERRA AGRI FUND III 70,709,899.76 0.27 -1.54 -2.07 -2.07 -3.30 08-01-16
Amerra Agri Fund III Index -1.54 -2.07 -2.07 -3.30 08-01-16
Excess 0.00 0.00 0.00 0.00

36
VI. Absolute Return
37
Objective Purpose is to diversify equity and credit market risk by targeting hedge fund return streams
that are independent of the directionality of the broad stock and bond markets. The ARS portfolio will be invested in a wide variety of hedge fund strategies, with specific constraints on overall portfolio risk and individual manager exposure.
Performance objective is to exceed the benchmark, defined as the HFRI Fund of Funds Diversified Index, net of fees, and to earn in excess of the appropriate long-term benchmark (3-month LIBOR + 500 basis points) on an ongoing rolling 5-year period.
Investment Philosophy Predicated on manager skill in:
Rotating (long/short trading) market factors based on valuation Navigating less liquid, non public and opaque markets Navigating special situations Predicting and capturing market trends
Accordingly, ARS is not an “asset class” (or market sector)
38
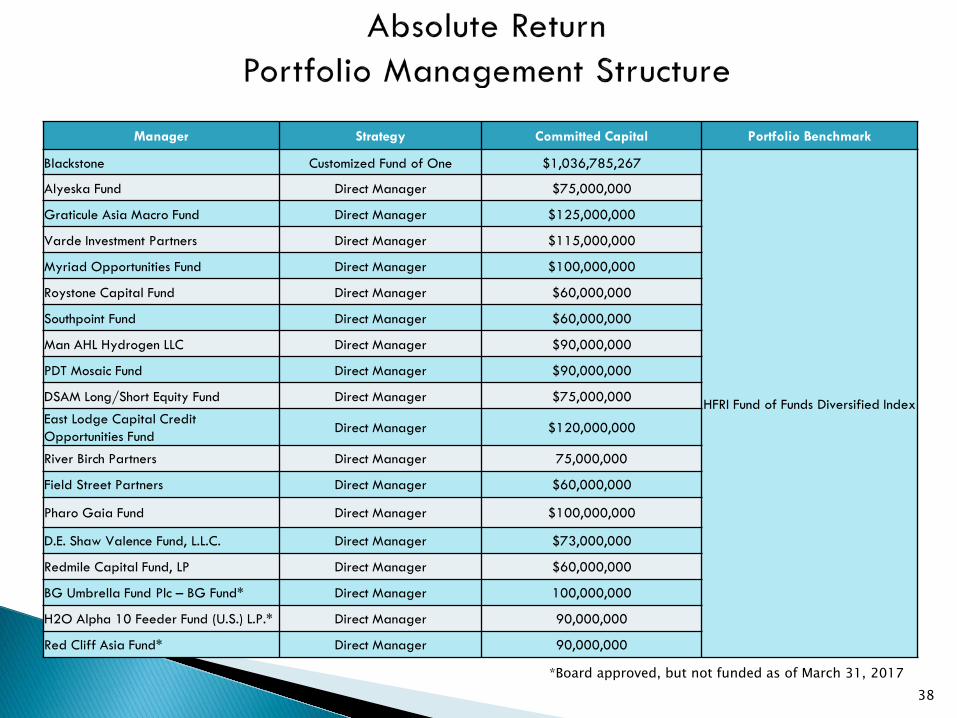
Manager Strategy Committed Capital Portfolio Benchmark
Blackstone Customized Fund of One $1,036,785,267
HFRI Fund of Funds Diversified Index
Alyeska Fund Direct Manager $75,000,000
Graticule Asia Macro Fund Direct Manager $125,000,000
Varde Investment Partners Direct Manager $115,000,000
Myriad Opportunities Fund Direct Manager $100,000,000
Roystone Capital Fund Direct Manager $60,000,000
Southpoint Fund Direct Manager $60,000,000
Man AHL Hydrogen LLC Direct Manager $90,000,000
PDT Mosaic Fund Direct Manager $90,000,000
DSAM Long/Short Equity Fund Direct Manager $75,000,000
East Lodge Capital Credit Opportunities Fund
Direct Manager $120,000,000
River Birch Partners Direct Manager 75,000,000
Field Street Partners Direct Manager $60,000,000
Pharo Gaia Fund Direct Manager $100,000,000
D.E. Shaw Valence Fund, L.L.C. Direct Manager $73,000,000
Redmile Capital Fund, LP Direct Manager $60,000,000
BG Umbrella Fund Plc – BG Fund* Direct Manager 100,000,000
H2O Alpha 10 Feeder Fund (U.S.) L.P.* Direct Manager 90,000,000
Red Cliff Asia Fund* Direct Manager 90,000,000
*Board approved, but not funded as of March 31, 2017
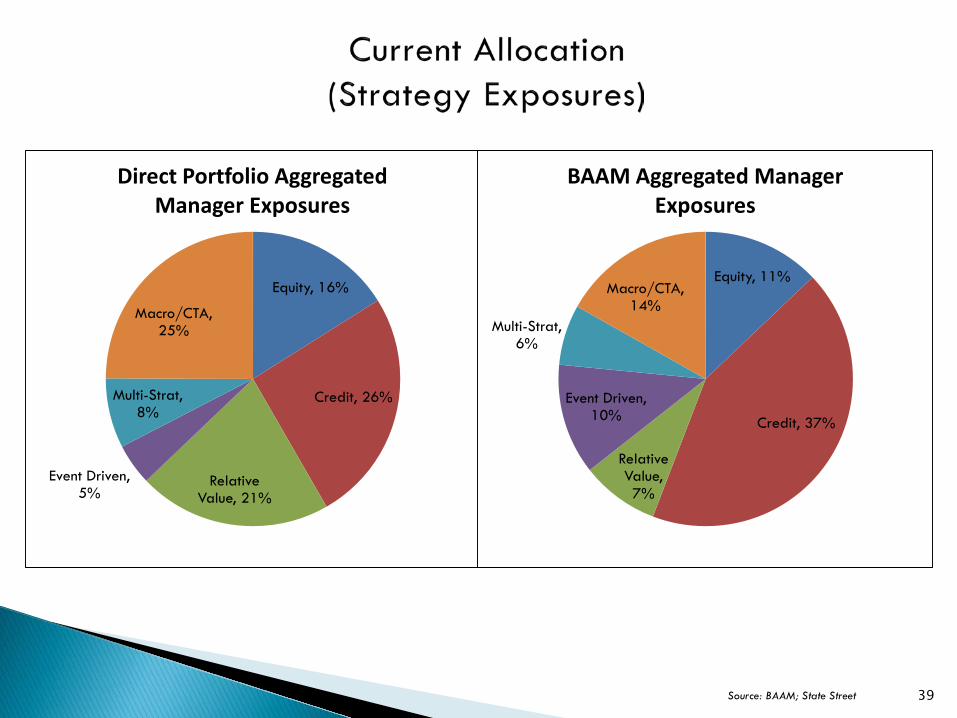
39 Source: BAAM; State Street
Equity, 16%
Credit, 26%
Relative Value, 21%
Event Driven, 5%
Multi-Strat, 8%
Macro/CTA, 25%
Direct Portfolio Aggregated Manager Exposures
Equity, 11%
Credit, 37%
Relative Value, 7%
Event Driven, 10%
Multi-Strat, 6%
Macro/CTA, 14%
BAAM Aggregated Manager Exposures
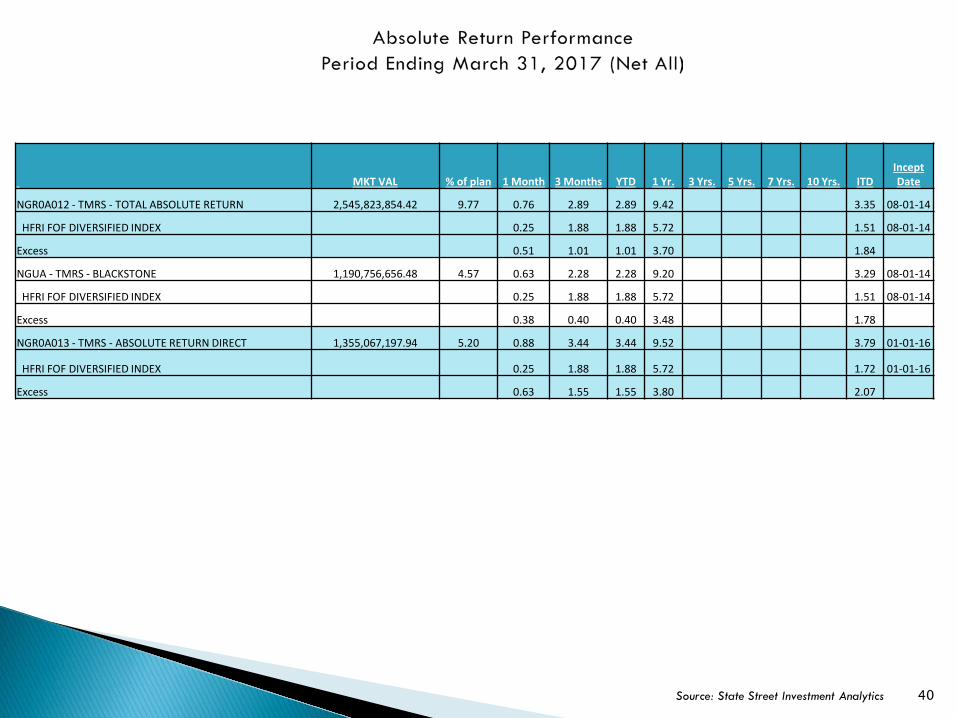
40 Source: State Street Investment Analytics
MKT VAL % of plan 1 Month 3 Months YTD 1 Yr. 3 Yrs. 5 Yrs. 7 Yrs. 10 Yrs. ITD Incept Date
NGR0A012 - TMRS - TOTAL ABSOLUTE RETURN 2,545,823,854.42 9.77 0.76 2.89 2.89 9.42 3.35 08-01-14
HFRI FOF DIVERSIFIED INDEX 0.25 1.88 1.88 5.72 1.51 08-01-14
Excess 0.51 1.01 1.01 3.70 1.84
NGUA - TMRS - BLACKSTONE 1,190,756,656.48 4.57 0.63 2.28 2.28 9.20 3.29 08-01-14
HFRI FOF DIVERSIFIED INDEX 0.25 1.88 1.88 5.72 1.51 08-01-14
Excess 0.38 0.40 0.40 3.48 1.78
NGR0A013 - TMRS - ABSOLUTE RETURN DIRECT 1,355,067,197.94 5.20 0.88 3.44 3.44 9.52 3.79 01-01-16
HFRI FOF DIVERSIFIED INDEX 0.25 1.88 1.88 5.72 1.72 01-01-16
Excess 0.63 1.55 1.55 3.80 2.07

41
VII. Private Equity
42
Objective The primary objective is to enhance the total return of the overall investment portfolio,
and secondarily to provide diversification. Private Equity investments are commingled funds structured as limited partnerships with capital commitments that are drawn down over time based on manager discretion. Potential distributions are made as a fund matures and investments are typically realized over an 8-12 year horizon.
The long term policy objective is to meet or exceed the Russell 3000 + 3.00% over periods of five years or greater.
Investment Philosophy Manager selection is critical, and managers add value through:
Reducing agency conflicts and aligning equity holder/executive incentives Investment structuring and balance sheet management Deep sector experience and creating operating efficiencies Navigating non-public information and capturing illiquidity premia
Note: Due to the illiquid nature of the Private Equity asset class, the target allocation will be invested over a multi-year period in order to avoid considerable vintage year risks.
43
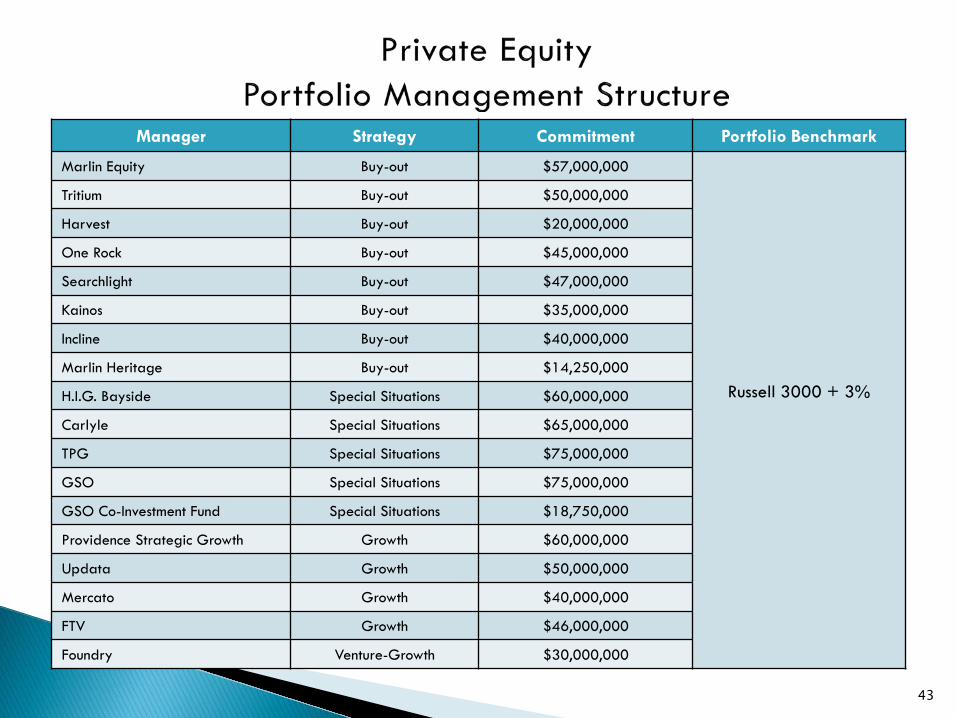
Manager Strategy Commitment Portfolio Benchmark
Marlin Equity Buy-out $57,000,000
Russell 3000 + 3%
Tritium Buy-out $50,000,000
Harvest Buy-out $20,000,000
One Rock Buy-out $45,000,000
Searchlight Buy-out $47,000,000
Kainos Buy-out $35,000,000
Incline Buy-out $40,000,000
Marlin Heritage Buy-out $14,250,000
H.I.G. Bayside Special Situations $60,000,000
Carlyle Special Situations $65,000,000
TPG Special Situations $75,000,000
GSO Special Situations $75,000,000
GSO Co-Investment Fund Special Situations $18,750,000
Providence Strategic Growth Growth $60,000,000
Updata Growth $50,000,000
Mercato Growth $40,000,000
FTV Growth $46,000,000
Foundry Venture-Growth $30,000,000
44
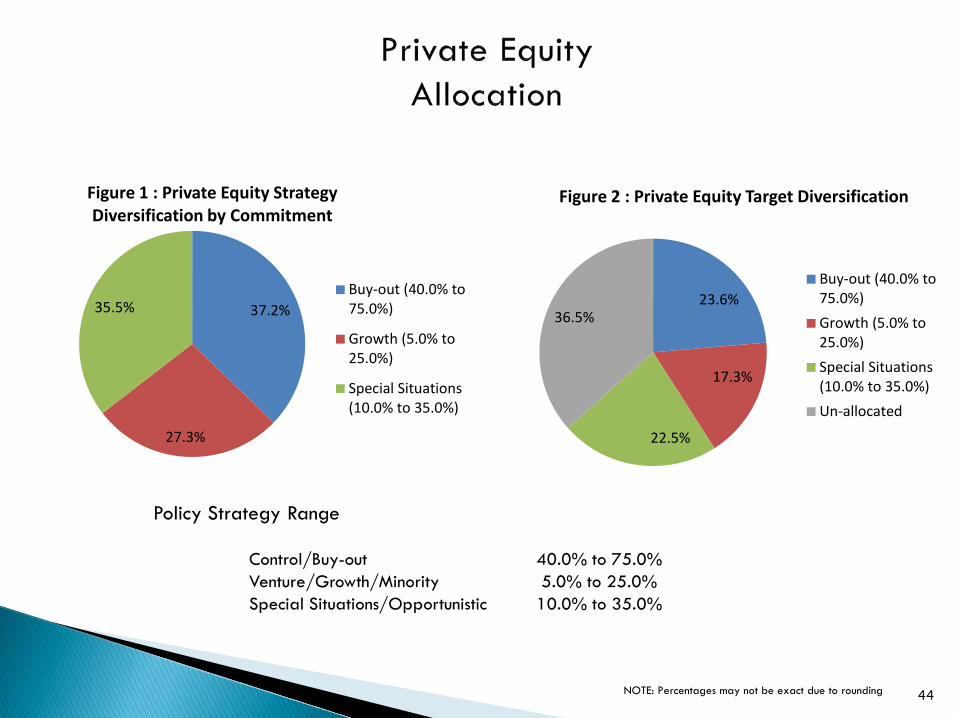
Policy Strategy Range Control/Buy-out 40.0% to 75.0% Venture/Growth/Minority 5.0% to 25.0% Special Situations/Opportunistic 10.0% to 35.0%
NOTE: Percentages may not be exact due to rounding
37.2%
27.3%
35.5%
Figure 1 : Private Equity Strategy Diversification by Commitment
Buy-out (40.0% to75.0%)
Growth (5.0% to25.0%)
Special Situations(10.0% to 35.0%)
23.6%
17.3%
22.5%
36.5%
Figure 2 : Private Equity Target Diversification
Buy-out (40.0% to75.0%)Growth (5.0% to25.0%)Special Situations(10.0% to 35.0%)Un-allocated
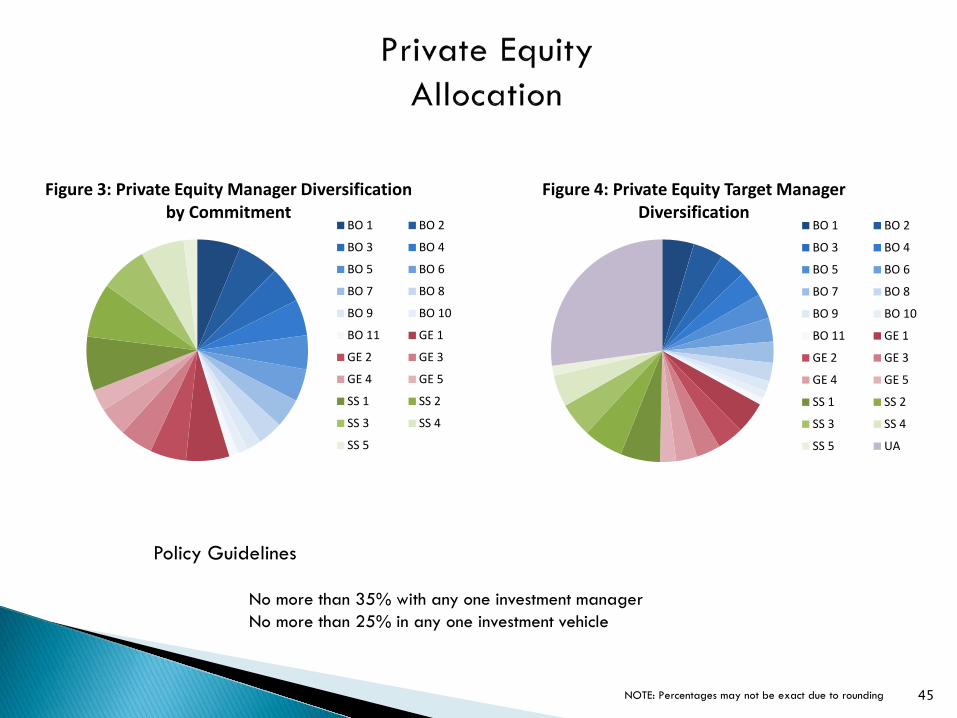
45 NOTE: Percentages may not be exact due to rounding
Policy Guidelines No more than 35% with any one investment manager No more than 25% in any one investment vehicle
Figure 4: Private Equity Target Manager Diversification
BO 1 BO 2
BO 3 BO 4
BO 5 BO 6
BO 7 BO 8
BO 9 BO 10
BO 11 GE 1
GE 2 GE 3
GE 4 GE 5
SS 1 SS 2
SS 3 SS 4
SS 5 UA
Figure 3: Private Equity Manager Diversification by Commitment
BO 1 BO 2
BO 3 BO 4
BO 5 BO 6
BO 7 BO 8
BO 9 BO 10
BO 11 GE 1
GE 2 GE 3
GE 4 GE 5
SS 1 SS 2
SS 3 SS 4
SS 5
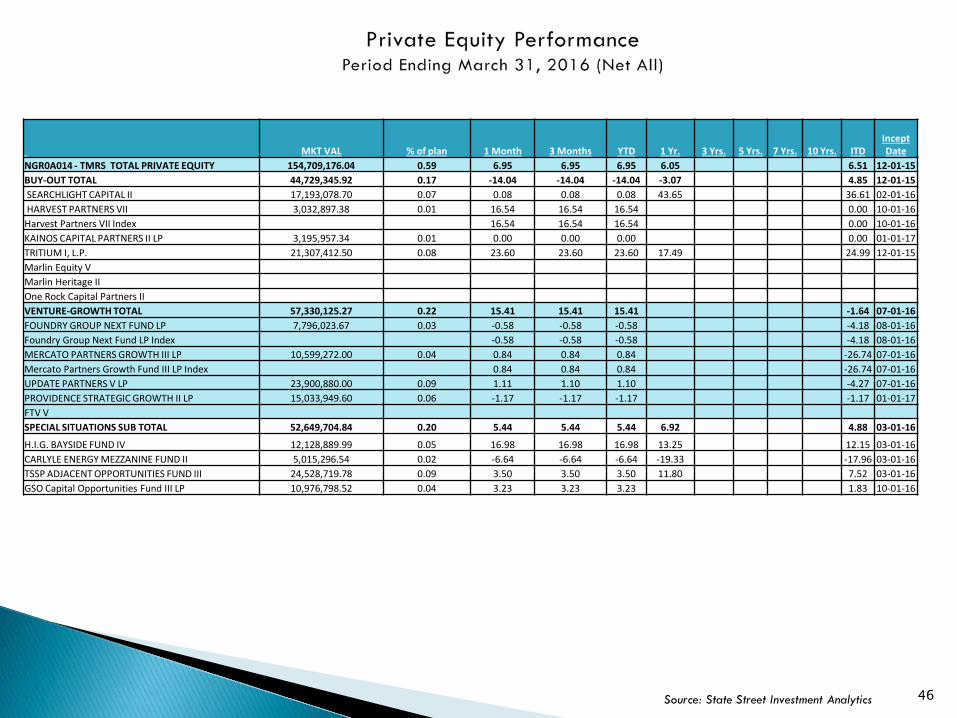
46 Source: State Street Investment Analytics
MKT VAL % of plan 1 Month 3 Months YTD 1 Yr. 3 Yrs. 5 Yrs. 7 Yrs. 10 Yrs. ITD Incept Date
NGR0A014 - TMRS TOTAL PRIVATE EQUITY 154,709,176.04 0.59 6.95 6.95 6.95 6.05 6.51 12-01-15 BUY-OUT TOTAL 44,729,345.92 0.17 -14.04 -14.04 -14.04 -3.07 4.85 12-01-15 SEARCHLIGHT CAPITAL II 17,193,078.70 0.07 0.08 0.08 0.08 43.65 36.61 02-01-16 HARVEST PARTNERS VII 3,032,897.38 0.01 16.54 16.54 16.54 0.00 10-01-16 Harvest Partners VII Index 16.54 16.54 16.54 0.00 10-01-16 KAINOS CAPITAL PARTNERS II LP 3,195,957.34 0.01 0.00 0.00 0.00 0.00 01-01-17 TRITIUM I, L.P. 21,307,412.50 0.08 23.60 23.60 23.60 17.49 24.99 12-01-15 Marlin Equity V Marlin Heritage II One Rock Capital Partners II VENTURE-GROWTH TOTAL 57,330,125.27 0.22 15.41 15.41 15.41 -1.64 07-01-16 FOUNDRY GROUP NEXT FUND LP 7,796,023.67 0.03 -0.58 -0.58 -0.58 -4.18 08-01-16 Foundry Group Next Fund LP Index -0.58 -0.58 -0.58 -4.18 08-01-16 MERCATO PARTNERS GROWTH III LP 10,599,272.00 0.04 0.84 0.84 0.84 -26.74 07-01-16 Mercato Partners Growth Fund III LP Index 0.84 0.84 0.84 -26.74 07-01-16 UPDATE PARTNERS V LP 23,900,880.00 0.09 1.11 1.10 1.10 -4.27 07-01-16 PROVIDENCE STRATEGIC GROWTH II LP 15,033,949.60 0.06 -1.17 -1.17 -1.17 -1.17 01-01-17 FTV V SPECIAL SITUATIONS SUB TOTAL 52,649,704.84 0.20 5.44 5.44 5.44 6.92 4.88 03-01-16
H.I.G. BAYSIDE FUND IV 12,128,889.99 0.05 16.98 16.98 16.98 13.25 12.15 03-01-16 CARLYLE ENERGY MEZZANINE FUND II 5,015,296.54 0.02 -6.64 -6.64 -6.64 -19.33 -17.96 03-01-16 TSSP ADJACENT OPPORTUNITIES FUND III 24,528,719.78 0.09 3.50 3.50 3.50 11.80 7.52 03-01-16 GSO Capital Opportunities Fund III LP 10,976,798.52 0.04 3.23 3.23 3.23 1.83 10-01-16

47
VIII. Compliance

48
• IPS Objectives • The primary objective of Compliance is to implement a detailed compliance program which
uses a combination of daily, weekly and monthly testing of all testable parameters of the Investment Policy Statement and all Manager guidelines at the Manager, asset class and total fund level, as appropriate.
• Testing may be completed either through systematic resources (automated custodial compliance) or manually if necessary.
• Compliance personnel shall create and present a quarterly report to the Board with the results of the testing performed during each period.
49
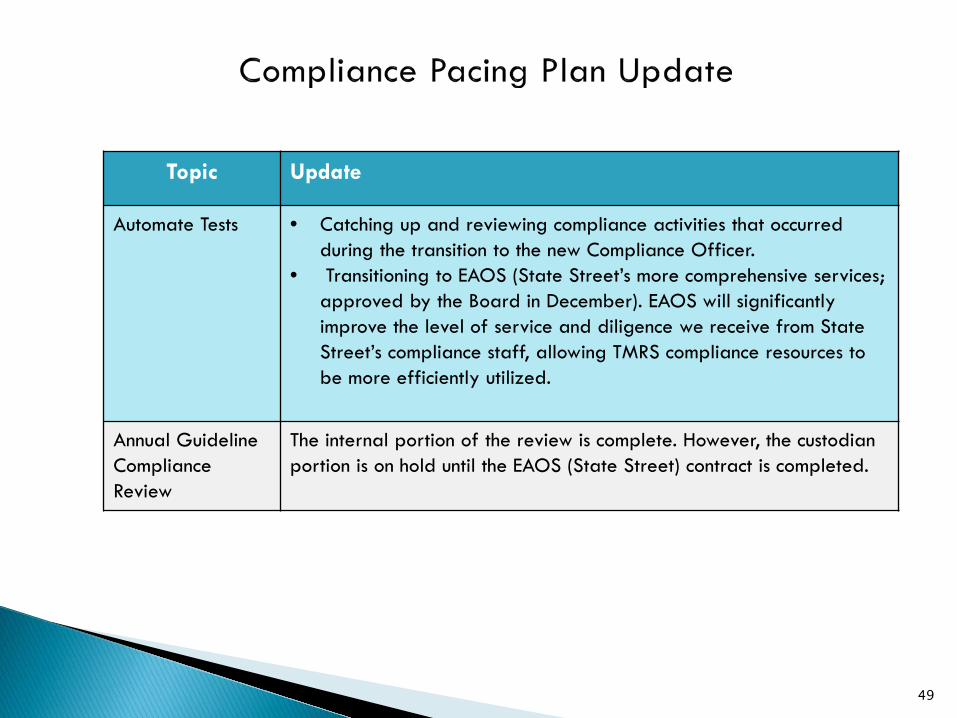
Topic Update
Automate Tests • Catching up and reviewing compliance activities that occurred during the transition to the new Compliance Officer.
• Transitioning to EAOS (State Street’s more comprehensive services; approved by the Board in December). EAOS will significantly improve the level of service and diligence we receive from State Street’s compliance staff, allowing TMRS compliance resources to be more efficiently utilized.
Annual Guideline Compliance Review
The internal portion of the review is complete. However, the custodian portion is on hold until the EAOS (State Street) contract is completed.
50
IX. Risk Management
• Risk Report Highlights: Q4 2016 • We are now reporting risk numbers implied by IPS Asset Class Strategy Guidelines (as
discussed in the February 2017 Risk Management Annual Review) • Those risk numbers are included in the table on p2 • The chart of those numbers is on p3
• Total Risk is at 7.3% and in line with historical forward looking levels
• Forward looking Tracking Error decreased to 1.0% and is in line with levels just prior to adoption of the new asset allocation in 2015
• Risk Management Objective • Management of the risk of not achieving TMRS investment objectives
• Risk Management Responsibilities: • Defining investment risk management policy and strategy • Building a risk aware culture • Analytical tools for investment risk management • Reporting on investment risk to the Board
51
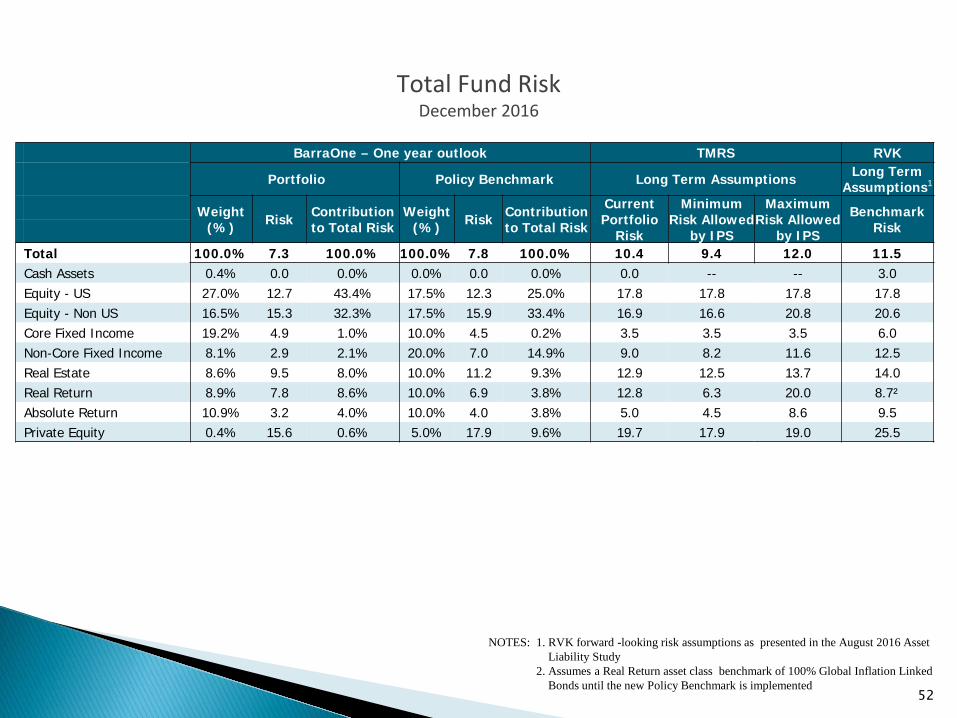
Total Fund Risk December 2016
52
NOTES: 1. RVK forward -looking risk assumptions as presented in the August 2016 Asset Liability Study 2. Assumes a Real Return asset class benchmark of 100% Global Inflation Linked Bonds until the new Policy Benchmark is implemented
BarraOne – One year outlook TMRS RVK
Portfolio Policy Benchmark Long Term Assumptions Long Term Assumptions1
Weight (%) Risk Contribution
to Total Risk Weight
(%) Risk Contribution to Total Risk
Current Portfolio
Risk
Minimum Risk Allowed
by IPS
Maximum Risk Allowed
by IPS
Benchmark Risk
Total 100.0% 7.3 100.0% 100.0% 7.8 100.0% 10.4 9.4 12.0 11.5 Cash Assets 0.4% 0.0 0.0% 0.0% 0.0 0.0% 0.0 -- -- 3.0 Equity - US 27.0% 12.7 43.4% 17.5% 12.3 25.0% 17.8 17.8 17.8 17.8 Equity - Non US 16.5% 15.3 32.3% 17.5% 15.9 33.4% 16.9 16.6 20.8 20.6 Core Fixed Income 19.2% 4.9 1.0% 10.0% 4.5 0.2% 3.5 3.5 3.5 6.0 Non-Core Fixed Income 8.1% 2.9 2.1% 20.0% 7.0 14.9% 9.0 8.2 11.6 12.5 Real Estate 8.6% 9.5 8.0% 10.0% 11.2 9.3% 12.9 12.5 13.7 14.0 Real Return 8.9% 7.8 8.6% 10.0% 6.9 3.8% 12.8 6.3 20.0 8.7² Absolute Return 10.9% 3.2 4.0% 10.0% 4.0 3.8% 5.0 4.5 8.6 9.5 Private Equity 0.4% 15.6 0.6% 5.0% 17.9 9.6% 19.7 17.9 19.0 25.5
53
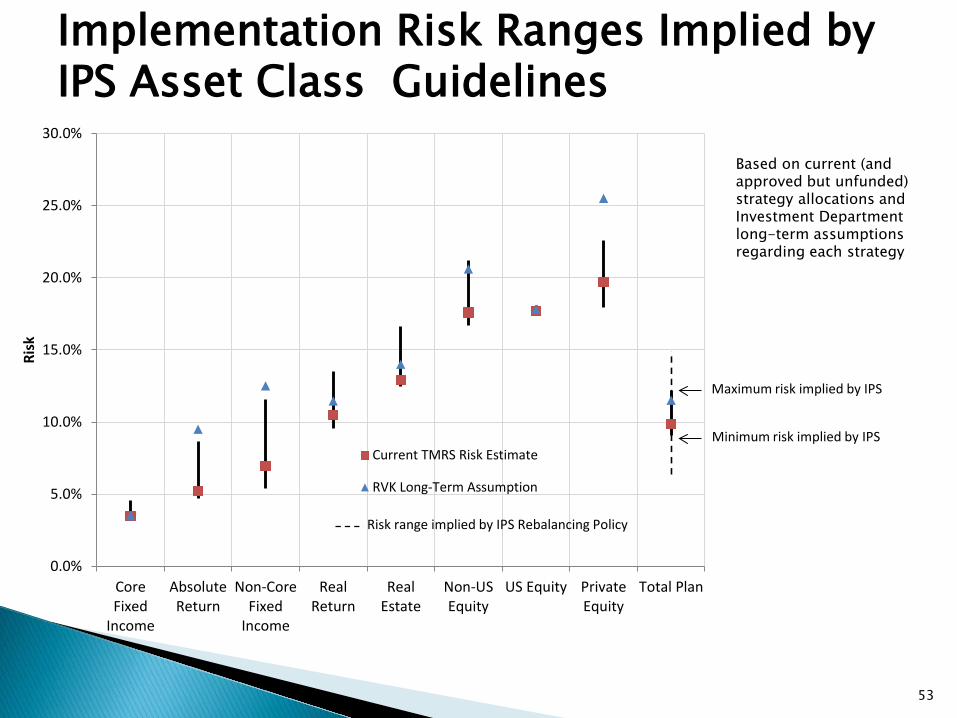
Implementation Risk Ranges Implied by IPS Asset Class Guidelines
Based on current (and approved but unfunded) strategy allocations and Investment Department long-term assumptions regarding each strategy
0.0%
5.0%
10.0%
15.0%
20.0%
25.0%
30.0%
CoreFixed
Income
AbsoluteReturn
Non-CoreFixed
Income
RealReturn
RealEstate
Non-USEquity
US Equity PrivateEquity
Total Plan
Risk
Current TMRS Risk Estimate
RVK Long-Term Assumption
Risk range implied by IPS Rebalancing Policy
Minimum risk implied by IPS
Maximum risk implied by IPS
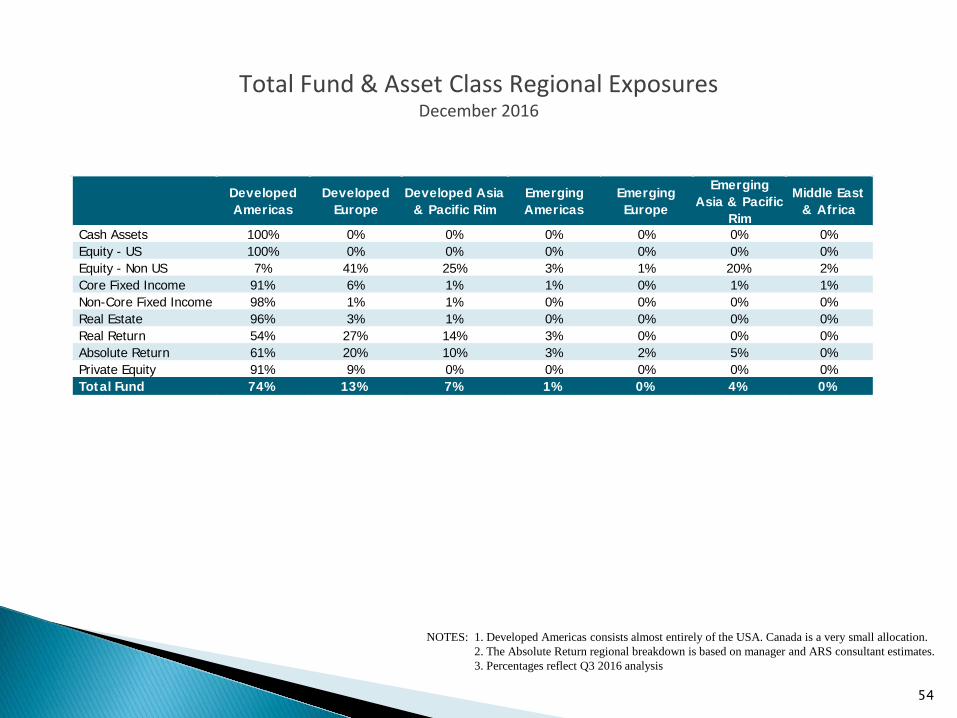
Total Fund & Asset Class Regional Exposures December 2016
54
NOTES: 1. Developed Americas consists almost entirely of the USA. Canada is a very small allocation. 2. The Absolute Return regional breakdown is based on manager and ARS consultant estimates. 3. Percentages reflect Q3 2016 analysis
Developed Americas
Developed Europe
Developed Asia & Pacific Rim
Emerging Americas
Emerging Europe
Emerging Asia & Pacific
Rim
Middle East & Africa
Cash Assets 100% 0% 0% 0% 0% 0% 0% Equity - US 100% 0% 0% 0% 0% 0% 0% Equity - Non US 7% 41% 25% 3% 1% 20% 2% Core Fixed Income 91% 6% 1% 1% 0% 1% 1% Non-Core Fixed Income 98% 1% 1% 0% 0% 0% 0% Real Estate 96% 3% 1% 0% 0% 0% 0% Real Return 54% 27% 14% 3% 0% 0% 0% Absolute Return 61% 20% 10% 3% 2% 5% 0% Private Equity 91% 9% 0% 0% 0% 0% 0% Total Fund 74% 13% 7% 1% 0% 4% 0%
55
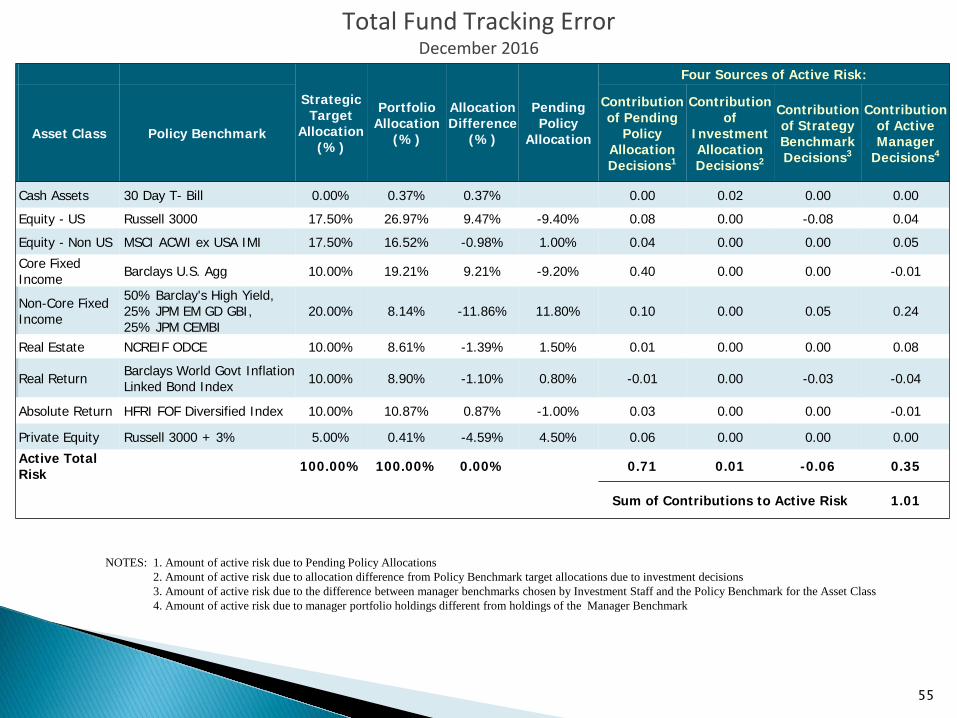
NOTES: 1. Amount of active risk due to Pending Policy Allocations 2. Amount of active risk due to allocation difference from Policy Benchmark target allocations due to investment decisions 3. Amount of active risk due to the difference between manager benchmarks chosen by Investment Staff and the Policy Benchmark for the Asset Class 4. Amount of active risk due to manager portfolio holdings different from holdings of the Manager Benchmark
Strategic Target
Allocation (%)
Portfolio Allocation
(%)
Allocation Difference
(%)
Pending Policy
Allocation
Four Sources of Active Risk:
Asset Class Policy Benchmark
Contribution of Pending
Policy Allocation Decisions1
Contribution of
Investment Allocation Decisions2
Contribution of Strategy Benchmark Decisions3
Contribution of Active Manager
Decisions4
Cash Assets 30 Day T- Bill 0.00% 0.37% 0.37% 0.00 0.02 0.00 0.00
Equity - US Russell 3000 17.50% 26.97% 9.47% -9.40% 0.08 0.00 -0.08 0.04
Equity - Non US MSCI ACWI ex USA IMI 17.50% 16.52% -0.98% 1.00% 0.04 0.00 0.00 0.05
Core Fixed Income Barclays U.S. Agg 10.00% 19.21% 9.21% -9.20% 0.40 0.00 0.00 -0.01
Non-Core Fixed Income
50% Barclay's High Yield, 25% JPM EM GD GBI, 25% JPM CEMBI
20.00% 8.14% -11.86% 11.80% 0.10 0.00 0.05 0.24
Real Estate NCREIF ODCE 10.00% 8.61% -1.39% 1.50% 0.01 0.00 0.00 0.08
Real Return Barclays World Govt Inflation Linked Bond Index 10.00% 8.90% -1.10% 0.80% -0.01 0.00 -0.03 -0.04
Absolute Return HFRI FOF Diversified Index 10.00% 10.87% 0.87% -1.00% 0.03 0.00 0.00 -0.01
Private Equity Russell 3000 + 3% 5.00% 0.41% -4.59% 4.50% 0.06 0.00 0.00 0.00
Active Total Risk 100.00% 100.00% 0.00% 0.71 0.01 -0.06 0.35
Sum of Contributions to Active Risk 1.01
Total Fund Tracking Error December 2016
56
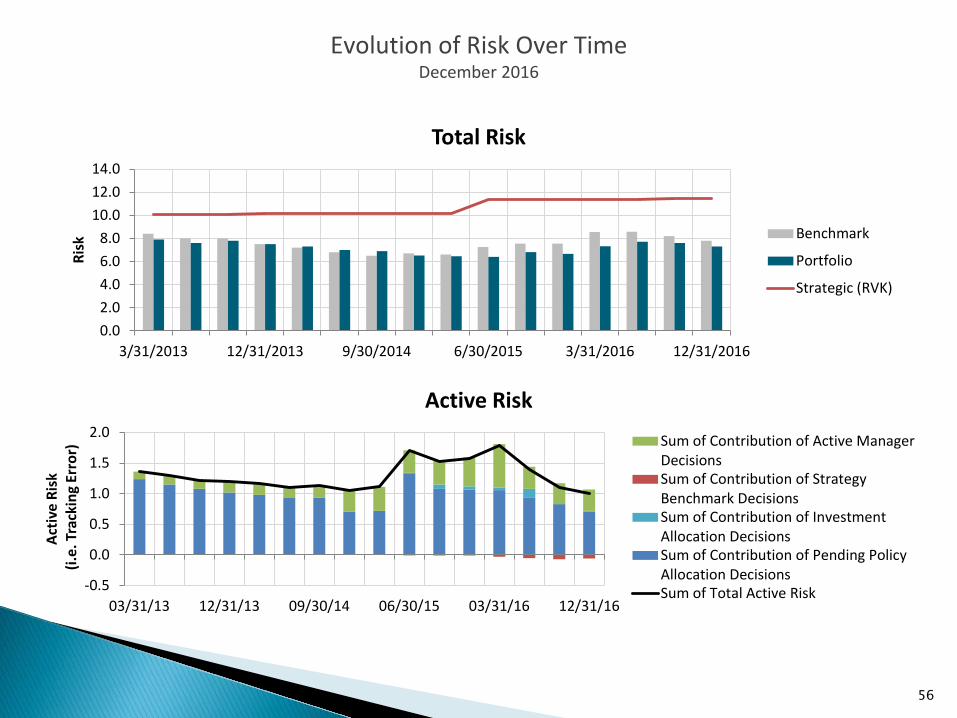
Evolution of Risk Over Time December 2016
0.02.04.06.08.0
10.012.014.0
3/31/2013 12/31/2013 9/30/2014 6/30/2015 3/31/2016 12/31/2016
Risk
Total Risk
Benchmark
Portfolio
Strategic (RVK)
-0.5
0.0
0.5
1.0
1.5
2.0
03/31/13 12/31/13 09/30/14 06/30/15 03/31/16 12/31/16
Activ
e Ri
sk
(i.e
. Tra
ckin
g Er
ror)
Active Risk
Sum of Contribution of Active ManagerDecisionsSum of Contribution of StrategyBenchmark DecisionsSum of Contribution of InvestmentAllocation DecisionsSum of Contribution of Pending PolicyAllocation DecisionsSum of Total Active Risk
57
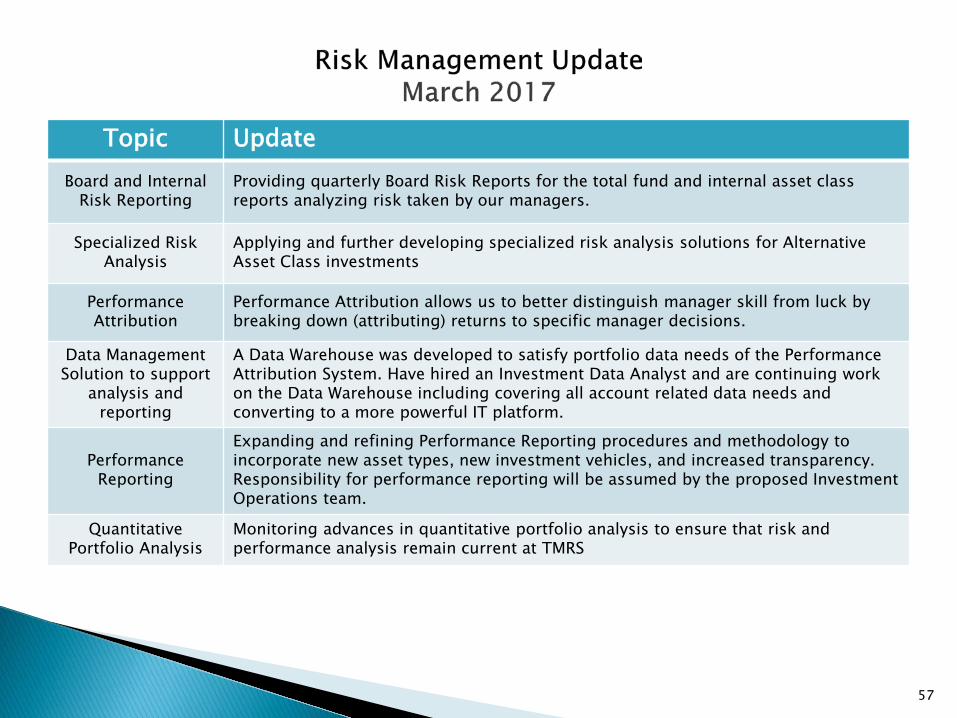
Topic Update Board and Internal
Risk Reporting Providing quarterly Board Risk Reports for the total fund and internal asset class reports analyzing risk taken by our managers.
Specialized Risk Analysis
Applying and further developing specialized risk analysis solutions for Alternative Asset Class investments
Performance Attribution
Performance Attribution allows us to better distinguish manager skill from luck by breaking down (attributing) returns to specific manager decisions.
Data Management Solution to support
analysis and reporting
A Data Warehouse was developed to satisfy portfolio data needs of the Performance Attribution System. Have hired an Investment Data Analyst and are continuing work on the Data Warehouse including covering all account related data needs and converting to a more powerful IT platform.
Performance Reporting
Expanding and refining Performance Reporting procedures and methodology to incorporate new asset types, new investment vehicles, and increased transparency. Responsibility for performance reporting will be assumed by the proposed Investment Operations team.
Quantitative Portfolio Analysis
Monitoring advances in quantitative portfolio analysis to ensure that risk and performance analysis remain current at TMRS
58