Embed Size (px)
Citation preview
I-mode investigation on the Experimental Advanced
Superconducting Tokamak
X. Feng1, A.D. Liu1, C. Zhou1, Z.X. Liu1, M.Y. Wang2, G.
Zhuang1, X.L. Zou3 T.B. Wang345, Y.Z. Zhang6, J.L. Xie1, H.Q.
Liu7, T. Zhang7, Y. Liu7, Y.M. Duan7, L.Q. Hu7, G.H. Hu7,
D.F. Kong7, S.X. Wang7, H.L. Zhao7, Y.Y. Li7, L.M. Shao7,
T.Y. Xia7, W.X. Ding1, T. Lan1, H. Li1, W.Z. Mao1, W.D. Liu1,
X. Gao7, J.G. Li7, S.B. Zhang7, X.H. Zhang8, Z.Y. Liu1, C.M.
Qu1, S. Zhang1, J. Zhang1, J.X. Ji1, H.R. Fan1, and X.M.
Zhong1
1 KTX Laboratory and Department of Engineering and Applied Physics, University
of Science and Technology of China, Anhui Hefei 230026, China2 Department of Physics, Nanchang University, Nanchang 330031, China3 Institute for Magnetic Fusion Research, CEA, F-13115 Saint-Paul-lez-Durance,
France4 Southwestern Institute for Physics, CNNC, C-610200 Chengdu, China5 Department of Applied Physics, Ghent University, B-9000 Ghent, Belgium6 Center for Magnetic Fusion Theory, CAS, Hefei, Anhui 230026, China7 Institute of Plasma Physics, Chinese Academy of Sciences, Anhui Hefei 230031,
China8School of Computer and Information, Hefei University of Technology, Hefei, Anhui
230009, China
E-mail: [email protected]
E-mail: [email protected]
May 2019
Abstract. By analyzing large quantities of discharges in the unfavorable ion ~B×∇Bdrift direction, the I-mode operation has been confirmed in EAST tokamak. During
the L-mode to I-mode transition, the energy confinement has a prominent improvement
by the formation of a high- temperature edge pedestal, while the particle confinement
remains almost identical to that in the L-mode. Similar with the I-mode observation
on other devices, the Er profiles obtained by the eight-channel Doppler backscattering
system (DBS8)[1] show a deeper edge Er well in the I-mode than that in the L-mode.
And a weak coherent mode (WCM) with the frequency range of 40-150 kHz is observed
at the edge plasma with the radial extend of about 2-3 cm. WCM could be observed
in both density fluctuation and radial electric field fluctuation, and the bicoherence
analyses showed significant couplings between WCM and high frequency turbulence,
implying that the Er fluctuation and the caused flow shear from WCM should play an
important role during I-mode. In addition, a low-frequency oscillation with a frequency
range of 5-10 kHz is always accompanied with WCM, where GAM intensity is decreased
or disappeared. Many evidences show that the a low-frequency oscillation may be a
arX
iv:1
902.
0475
0v3
[ph
ysic
s.pl
asm
-ph]
31
May
201
9
I-mode investigation on the Experimental Advanced Superconducting Tokamak 2
novel kind of limited cycle oscillation but further investigations are needed to explain
the new properties such as the harmonics and obvious magnetical perturbations.
Keywords : I-mode, DBS8, WCM, Er pertubation, Er well
1. Introduction
As the H-mode with type-I edge localized modes (ELM) can generate unacceptable heat
loads to the divertor and plasma-facing components, the I-mode is being explored as
an alternative operating mode for future devices. The I-mode simultaneously features
high-energy confinement, such as the H-mode, and low particle confinement, such as the
L-mode without ELMs, and this type of quiet pedestal can protect the divertor target
from ELM heat flux with an acceptable plasma energy confinement.
The I-mode was originally observed as an energy confinement improved mode in
1990s[2]; currently, it has been widely investigated in Alcator C-Mod[3, 4, 5, 6, 7, 8, 9,
10], AUG[11, 12, 13, 14, 15, 16], and DIII-D[17]. In unfavorable configurations[18],
the L-mode to I-mode transition occurs when the heating power exceeds a certain
threshold[19], and an edge energy transport barrier[7] is constructed accompanied with
the weak coherent mode (WCM)[13, 8, 9, 10, 17] at the steepest temperature gradient
region. In the I-mode operation, an Er well[5, 6, 17, 12] forms at the edge of the
plasma, and a stable temperature pedestal is simultaneously established[20, 21]. The
poor particle confinement in the I-mode also contributes to a low core impurity level
and sustains the operation performance.[22, 23]
In this paper, the typical I-mode investigation in EAST is presented for the first
time. In 2014, the upper divertor was upgraded to full tungsten, while the lower
divertor was conserved to be carbon.[24] Consequently, all high- performance discharges
were in the upper single null shape to reduce the carbon impurities entering the main
plasma.[25] Thus, operations most frequently have a clockwise toroidal field, such
that the ion ~B × ∇B drift directs away from the active X point, which provides a
large amount of discharges for the I-mode investigation. After numerous equilibrium
parameters and fluctuation signals have been analyzed, the I-mode operation in EAST
is confirmed. L-mode to I-mode transition can be triggered by all types of heating
methods, and no heating preference is observed, which is consistent with the results
in other tokamaks[11, 18]. In EAST, the WCM with the frequency of 40-150 kHz is
observed in both density fluctuation and Er fluctuation at the plasma edge using the
eight-channel Doppler backscattering system (DBS8) in the I-mode operation, and a
low frequency oscillation (5-10 kHz) is also observed when the WCM is present. The
geodesic acoustic model (GAM) may disappear at the location where the WCM is most
significant, while it can still exist at other locations in I-mode on EAST.
The paper is organized as follows. In section 2, the experimental conditions
and eight-channel Doppler backscattering system for the fluctuation investigation are
I-mode investigation on the Experimental Advanced Superconducting Tokamak 3
presented. The identification of the main features of the I-mode, including the density,
temperature and radial electric field profiles, and the WCM are shown in section 3. The
nonlinear interaction among the WCM, the low-frequency oscillation and background
turbulence by a bicoherence analysis is also included in section 3. The last section is
the summary.
2. Experimental conditions and diagnostics
All experiments were performed on the Experimental Advanced Superconducting
Tokamak (EAST)[26, 27, 28, 29], which is the first full superconducting divertor tokamak
with R0 ∼ 1.88 m, a ∼0.45 m, Ip ≤1.0 MA, BT ≤ 3.5 T. And the ITER-like configuration
of EAST makes this work more meaningful. The EAST features complete RF wave
heating, including lower hybrid wave heating (LHW), ion cyclotron resonance heating
(ICRF), electron cyclotron resonance heating (ECRH), and two neutral beam injection
(NBI) systems, one in the co-current direction while the other is in the counter.
The turbulence measurements are achieved by the DBS8 system,[1] and it can
simultaneously launch eight different frequencies (55, 57.5, 60, 62.5, 67.5, 70, 72.5
and 75 GHz) into the plasma. Because the probing beam is obliquely launched to
the cutoff layer, the Doppler shift caused by the movement of the turbulence at the
cutoff layer fd can be written as fd = u⊥k⊥/2π, where u⊥ is the perpendicular velocity,
and k⊥ is the perpendicular wavenumber at the cutoff layer. In the laboratory frame,
the perpendicular velocity is the sum of the turbulence phase velocity and background
E×B velocity, which is expressed as u⊥ = vphase + vE×B. In many cases, at the plasma
edge, vphase is much smaller than vE×B, and we can calculate the radial electric field as
Er ∼ u⊥B.[30, 31]
The backscattered signal is obtained as the in-phase (I = Acosφ) and quadrature
(Q = Asinφ) of the I/Q mixer; this complex signal is written as Aeiφ = I + iQ. Then,
the phase can be calculated as φ(t) = arctan[Q(t)/I(t)], and the signal amplitude is
A(t) =√I2(t) +Q2(t), where A corresponds to the density fluctuation level and the
phase change rate dφ corresponds to the perpendicular velocity of the cutoff layer (also to
the radial electric field with the relationship of u⊥ ∼ Er/B).[31] Two different methods
are commonly used to extract the Doppler shift from the DBS signal: the center of
gravity of the complex amplitude signal and the phase derivative method. In this study,
we choose the phase derivative method to directly obtain the Doppler shift from the
change in phase signal: fd = dφ/dt[31], since it is the simplest one with the best time
resolution.
DBS has been widely used for turbulence measurements with specific wavenumbers
(4 − 15 cm−1 for the system in this article). For the WCM, which is a type of larger-
scale fluctuation (wavenumber smaller than 2 cm−1), can not be directly observed in
the backscattered signal because its wavenumber is too small. However, the WCM can
modulate the cutoff layer,[13] and the DBS signal is sensitive to the oscillation caused
by this modulation. Thus, WCM features such as the frequency can also be observed
I-mode investigation on the Experimental Advanced Superconducting Tokamak 4
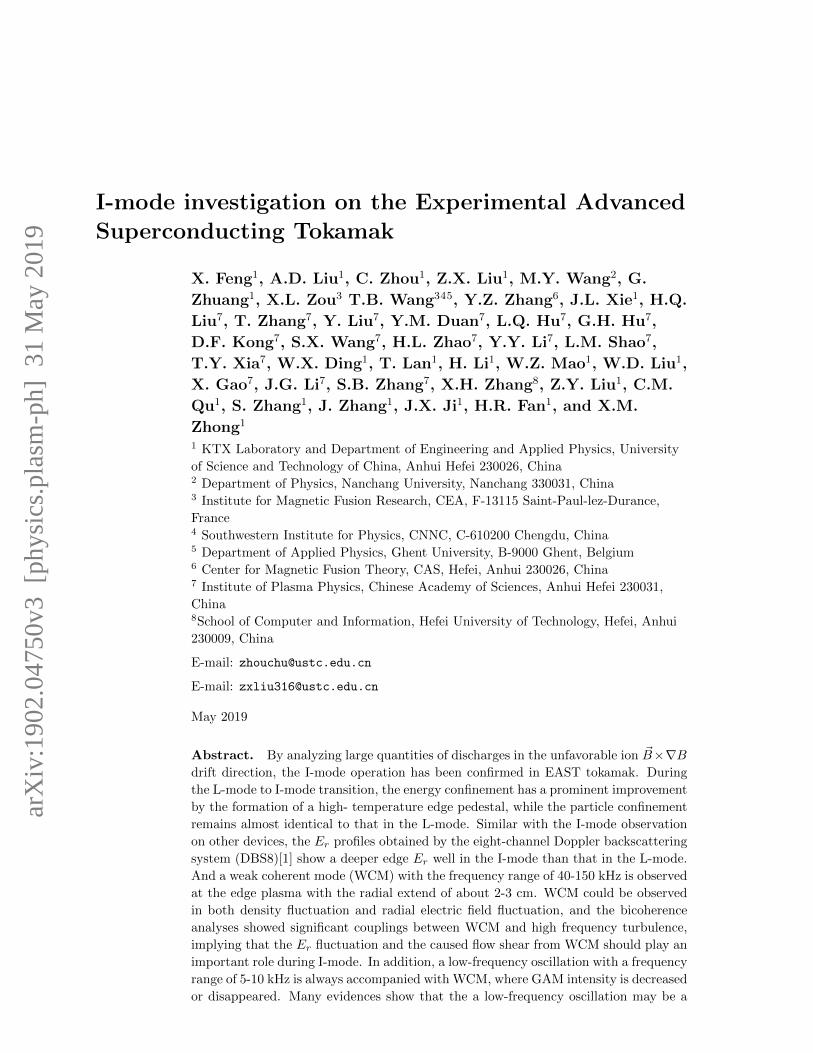
Figure 1. Example of upper single-null Bφ=2.23 T, q95 ∼ 5 I-mode discharge with
L-mode, I-mode phases indicated. (a) Plasma current and line-averaged density n̄e; (b)
NBI and ECRH heating power; (c) Te from ECE in core and edge; (d) Dα recycling;
(e) stored energy WMHD; (f) WCM in the Er perturbation. (g), (h), and (i) are power
spectrum of the Er perturbation for three time slices from the same channel used in
panel (f).
in DBS signals.
3. Experimental results and analysis
3.1. Identification of the I-mode
Currently, I-mode in EAST could be achieved under such parameter space with plasma
currents of Ip ∼ 0.45 − 0.7 MA and toroidal magnetic field Bφ = 2.26 − 2.49 T under
upper-single null (USN) geometries with an unfavorable ion ~B×∇B directed away from
the active X-point[4]. In particular, in discharges with heating-powers above 1.8 MW
and line-averaged electron densities above 2.5 ∗ 1019 m−3, the features of the I-mode
become quite distinct. No heating method preference is observed, and the L-mode to
I-mode transition can be triggered by various heating methods. A typical example of
the I-mode discharge 69327 is shown in Fig. 1. This discharge is accompanied with
I-mode investigation on the Experimental Advanced Superconducting Tokamak 5
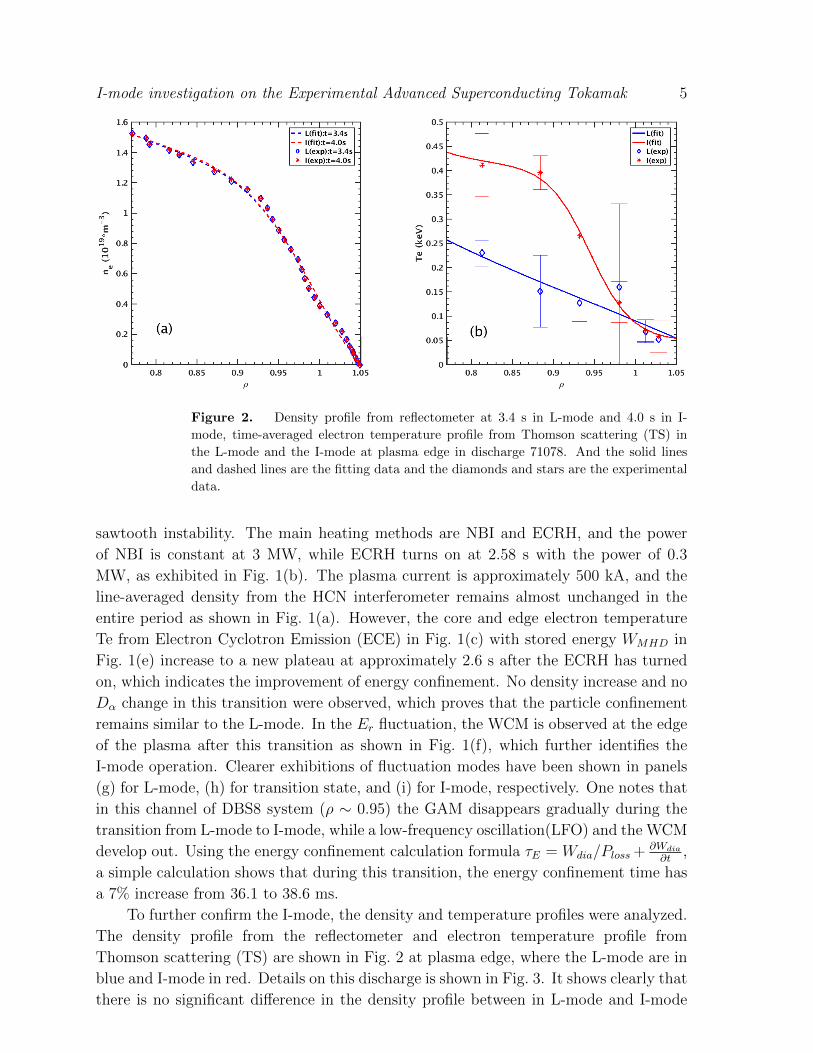
Figure 2. Density profile from reflectometer at 3.4 s in L-mode and 4.0 s in I-
mode, time-averaged electron temperature profile from Thomson scattering (TS) in
the L-mode and the I-mode at plasma edge in discharge 71078. And the solid lines
and dashed lines are the fitting data and the diamonds and stars are the experimental
data.
sawtooth instability. The main heating methods are NBI and ECRH, and the power
of NBI is constant at 3 MW, while ECRH turns on at 2.58 s with the power of 0.3
MW, as exhibited in Fig. 1(b). The plasma current is approximately 500 kA, and the
line-averaged density from the HCN interferometer remains almost unchanged in the
entire period as shown in Fig. 1(a). However, the core and edge electron temperature
Te from Electron Cyclotron Emission (ECE) in Fig. 1(c) with stored energy WMHD in
Fig. 1(e) increase to a new plateau at approximately 2.6 s after the ECRH has turned
on, which indicates the improvement of energy confinement. No density increase and no
Dα change in this transition were observed, which proves that the particle confinement
remains similar to the L-mode. In the Er fluctuation, the WCM is observed at the edge
of the plasma after this transition as shown in Fig. 1(f), which further identifies the
I-mode operation. Clearer exhibitions of fluctuation modes have been shown in panels
(g) for L-mode, (h) for transition state, and (i) for I-mode, respectively. One notes that
in this channel of DBS8 system (ρ ∼ 0.95) the GAM disappears gradually during the
transition from L-mode to I-mode, while a low-frequency oscillation(LFO) and the WCM
develop out. Using the energy confinement calculation formula τE = Wdia/Ploss + ∂Wdia
∂t,
a simple calculation shows that during this transition, the energy confinement time has
a 7% increase from 36.1 to 38.6 ms.
To further confirm the I-mode, the density and temperature profiles were analyzed.
The density profile from the reflectometer and electron temperature profile from
Thomson scattering (TS) are shown in Fig. 2 at plasma edge, where the L-mode are in
blue and I-mode in red. Details on this discharge is shown in Fig. 3. It shows clearly that
there is no significant difference in the density profile between in L-mode and I-mode
I-mode investigation on the Experimental Advanced Superconducting Tokamak 6
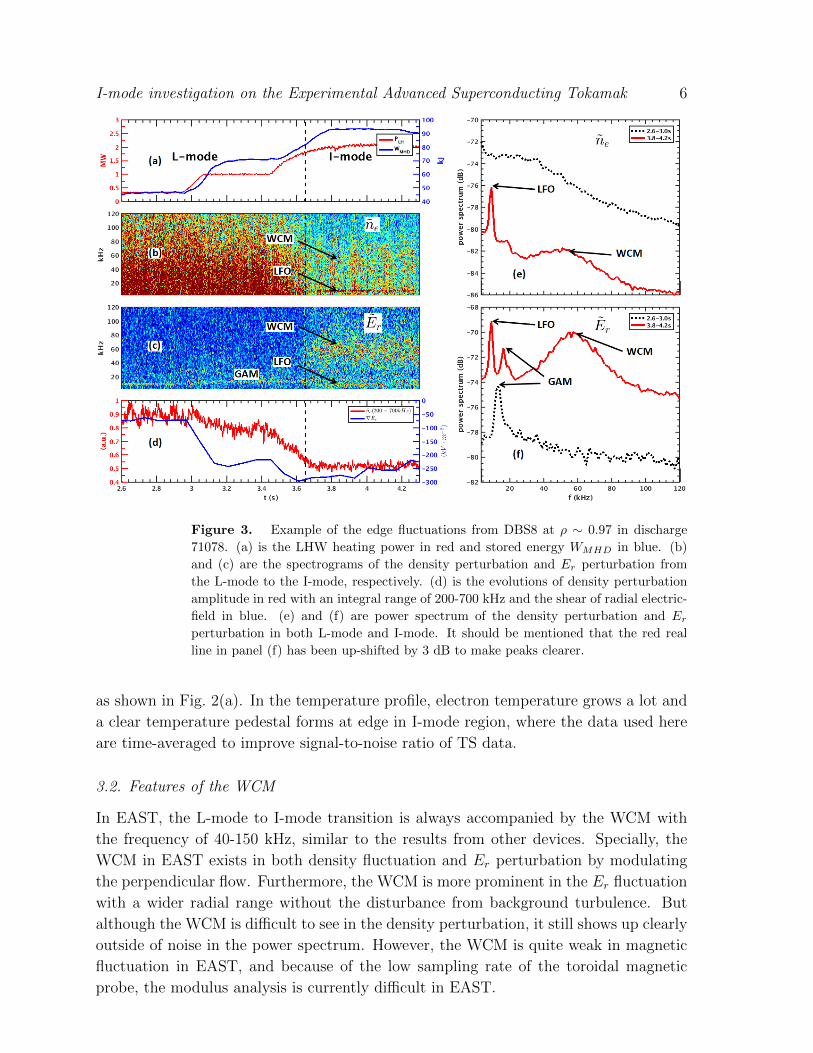
Figure 3. Example of the edge fluctuations from DBS8 at ρ ∼ 0.97 in discharge
71078. (a) is the LHW heating power in red and stored energy WMHD in blue. (b)
and (c) are the spectrograms of the density perturbation and Er perturbation from
the L-mode to the I-mode, respectively. (d) is the evolutions of density perturbation
amplitude in red with an integral range of 200-700 kHz and the shear of radial electric-
field in blue. (e) and (f) are power spectrum of the density perturbation and Erperturbation in both L-mode and I-mode. It should be mentioned that the red real
line in panel (f) has been up-shifted by 3 dB to make peaks clearer.
as shown in Fig. 2(a). In the temperature profile, electron temperature grows a lot and
a clear temperature pedestal forms at edge in I-mode region, where the data used here
are time-averaged to improve signal-to-noise ratio of TS data.
3.2. Features of the WCM
In EAST, the L-mode to I-mode transition is always accompanied by the WCM with
the frequency of 40-150 kHz, similar to the results from other devices. Specially, the
WCM in EAST exists in both density fluctuation and Er perturbation by modulating
the perpendicular flow. Furthermore, the WCM is more prominent in the Er fluctuation
with a wider radial range without the disturbance from background turbulence. But
although the WCM is difficult to see in the density perturbation, it still shows up clearly
outside of noise in the power spectrum. However, the WCM is quite weak in magnetic
fluctuation in EAST, and because of the low sampling rate of the toroidal magnetic
probe, the modulus analysis is currently difficult in EAST.
I-mode investigation on the Experimental Advanced Superconducting Tokamak 7
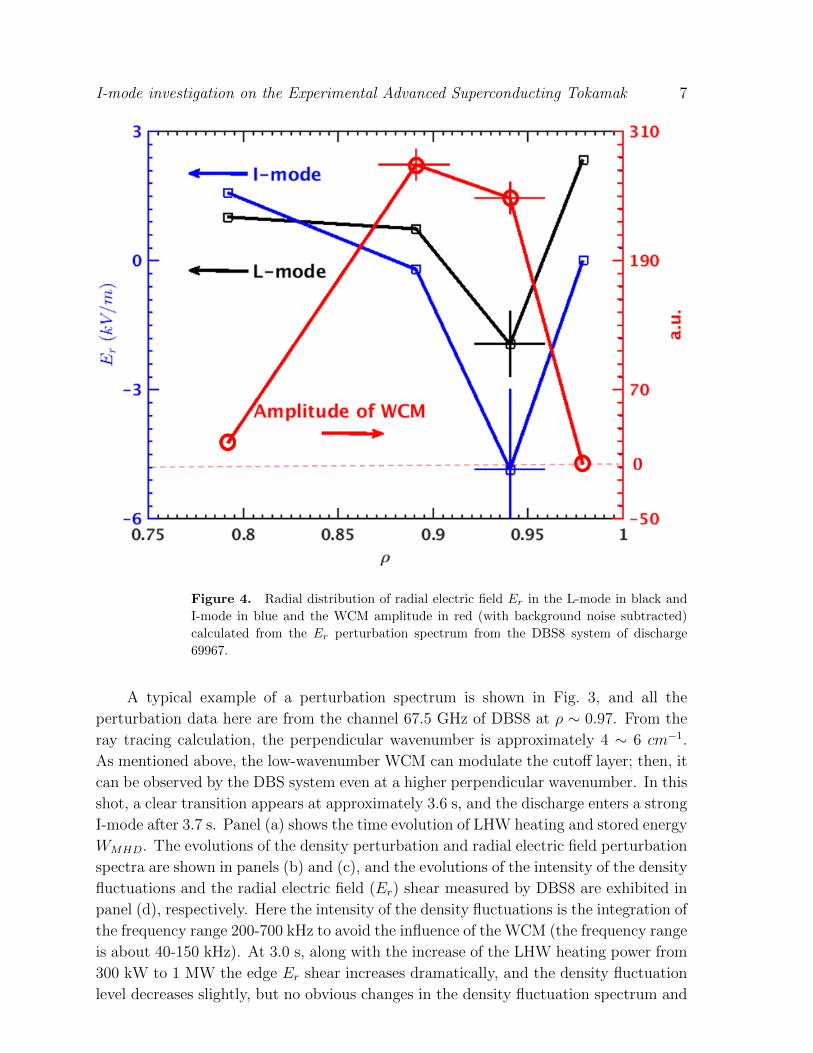
Figure 4. Radial distribution of radial electric field Er in the L-mode in black and
I-mode in blue and the WCM amplitude in red (with background noise subtracted)
calculated from the Er perturbation spectrum from the DBS8 system of discharge
69967.
A typical example of a perturbation spectrum is shown in Fig. 3, and all the
perturbation data here are from the channel 67.5 GHz of DBS8 at ρ ∼ 0.97. From the
ray tracing calculation, the perpendicular wavenumber is approximately 4 ∼ 6 cm−1.
As mentioned above, the low-wavenumber WCM can modulate the cutoff layer; then, it
can be observed by the DBS system even at a higher perpendicular wavenumber. In this
shot, a clear transition appears at approximately 3.6 s, and the discharge enters a strong
I-mode after 3.7 s. Panel (a) shows the time evolution of LHW heating and stored energy
WMHD. The evolutions of the density perturbation and radial electric field perturbation
spectra are shown in panels (b) and (c), and the evolutions of the intensity of the density
fluctuations and the radial electric field (Er) shear measured by DBS8 are exhibited in
panel (d), respectively. Here the intensity of the density fluctuations is the integration of
the frequency range 200-700 kHz to avoid the influence of the WCM (the frequency range
is about 40-150 kHz). At 3.0 s, along with the increase of the LHW heating power from
300 kW to 1 MW the edge Er shear increases dramatically, and the density fluctuation
level decreases slightly, but no obvious changes in the density fluctuation spectrum and
I-mode investigation on the Experimental Advanced Superconducting Tokamak 8
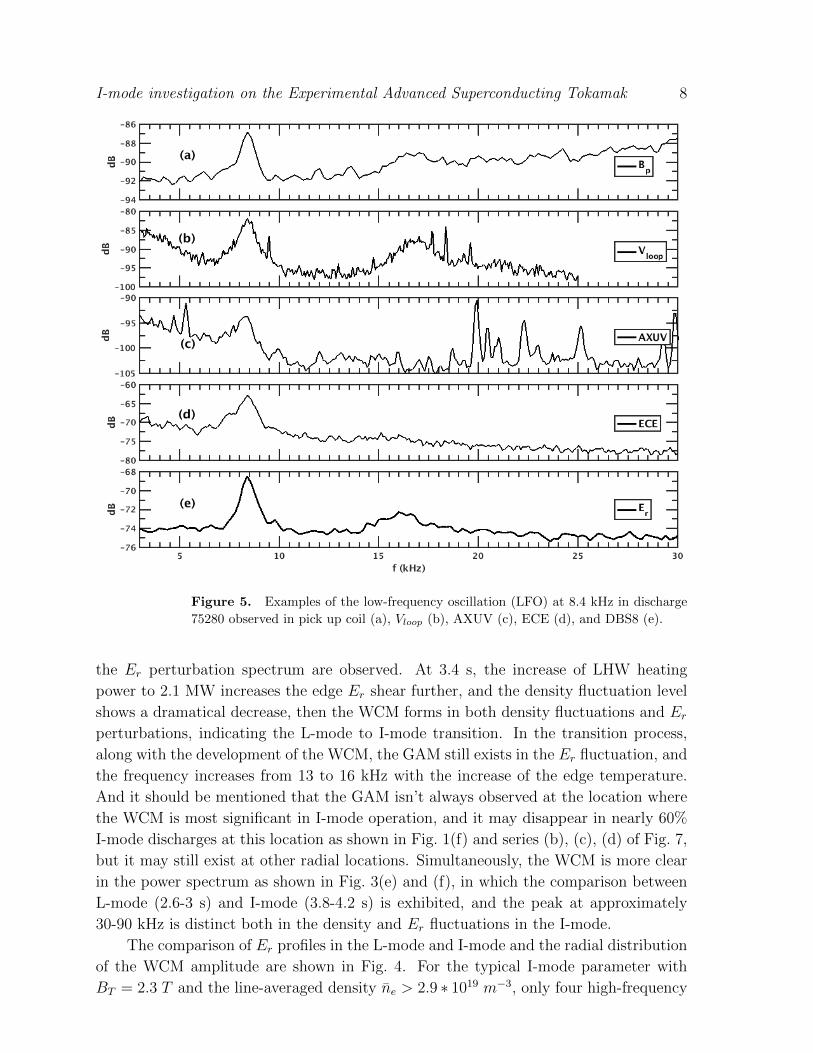
Figure 5. Examples of the low-frequency oscillation (LFO) at 8.4 kHz in discharge
75280 observed in pick up coil (a), Vloop (b), AXUV (c), ECE (d), and DBS8 (e).
the Er perturbation spectrum are observed. At 3.4 s, the increase of LHW heating
power to 2.1 MW increases the edge Er shear further, and the density fluctuation level
shows a dramatical decrease, then the WCM forms in both density fluctuations and Erperturbations, indicating the L-mode to I-mode transition. In the transition process,
along with the development of the WCM, the GAM still exists in the Er fluctuation, and
the frequency increases from 13 to 16 kHz with the increase of the edge temperature.
And it should be mentioned that the GAM isn’t always observed at the location where
the WCM is most significant in I-mode operation, and it may disappear in nearly 60%
I-mode discharges at this location as shown in Fig. 1(f) and series (b), (c), (d) of Fig. 7,
but it may still exist at other radial locations. Simultaneously, the WCM is more clear
in the power spectrum as shown in Fig. 3(e) and (f), in which the comparison between
L-mode (2.6-3 s) and I-mode (3.8-4.2 s) is exhibited, and the peak at approximately
30-90 kHz is distinct both in the density and Er fluctuations in the I-mode.
The comparison of Er profiles in the L-mode and I-mode and the radial distribution
of the WCM amplitude are shown in Fig. 4. For the typical I-mode parameter with
BT = 2.3 T and the line-averaged density n̄e > 2.9 ∗ 1019 m−3, only four high-frequency
I-mode investigation on the Experimental Advanced Superconducting Tokamak 9
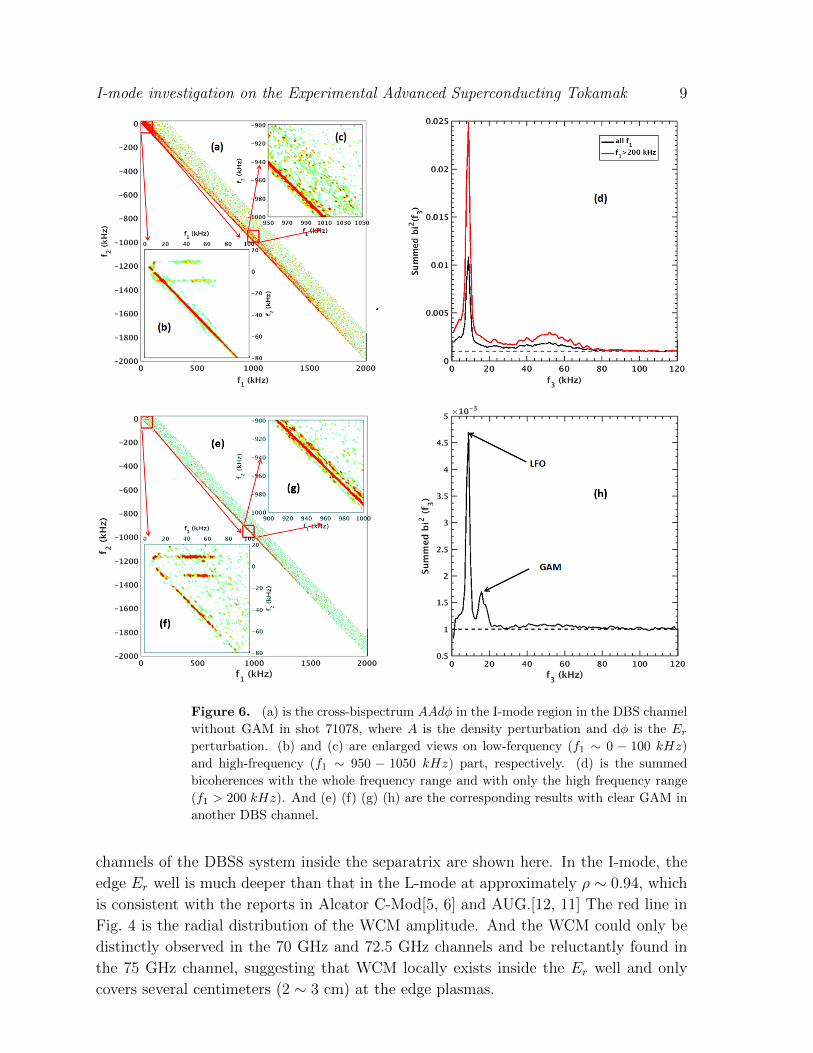
Figure 6. (a) is the cross-bispectrum AAdφ in the I-mode region in the DBS channel
without GAM in shot 71078, where A is the density perturbation and dφ is the Erperturbation. (b) and (c) are enlarged views on low-ferquency (f1 ∼ 0 − 100 kHz)
and high-frequency (f1 ∼ 950 − 1050 kHz) part, respectively. (d) is the summed
bicoherences with the whole frequency range and with only the high frequency range
(f1 > 200 kHz). And (e) (f) (g) (h) are the corresponding results with clear GAM in
another DBS channel.
channels of the DBS8 system inside the separatrix are shown here. In the I-mode, the
edge Er well is much deeper than that in the L-mode at approximately ρ ∼ 0.94, which
is consistent with the reports in Alcator C-Mod[5, 6] and AUG.[12, 11] The red line in
Fig. 4 is the radial distribution of the WCM amplitude. And the WCM could only be
distinctly observed in the 70 GHz and 72.5 GHz channels and be reluctantly found in
the 75 GHz channel, suggesting that WCM locally exists inside the Er well and only
covers several centimeters (2 ∼ 3 cm) at the edge plasmas.
I-mode investigation on the Experimental Advanced Superconducting Tokamak 10
Specially, a low-frequency oscillation (LFO) with a frequency range of 5-10 kHz
always accompanies the WCM in the EAST I-mode operation as shown in Fig. 1(f)
(approximately 7 kHz) and in Fig. 3(a) and (b) (approximately 9 kHz). Many
observations show that the LFO is another character of the I-mode operation beside
the WCM in EAST, and it seems that LFO always instead of GAM at the position
where WCM is generated. Unlike the GAM, the density perturbation and electron
temperature perturbation of LFO are both distinct as well as the Er perturbation.
Actually, the oscillation could be detected by nearly all diagnostics at the plasma edge,
such as the magnetic pick-up coils, Dα filterscopes, divertor probes, edge (ECE) channel,
absolute extreme ultra violet diodes (AXUV), soft-X rays, and even loop voltage coils.
The power spectra of some signals during I-mode in shot 75280 are shown in Fig. 5,
and these distinct peaks suggest that LFO has large influence on the plasma edge
region although its radial extend range is similar to WCM. It should be noted that
the second harmonic of LFO could also sometimes be seen, as shown in Fig. 5(a)(b)
and (e). The toroidal symmetry feature of LFO could be easily confirmed from the
magnetic coils (not shown), together with the fact that LFO always instead of GAM at
the position where WCM is generated, implying that LFO is a novel kind of zonal flows
during I-mode. However, there are several significant differences between LFO here and
the quasiperiodic Er oscillation (also called limited-cycle oscillation, LCO, or dithering
sometimes) appearing during L-H transition in EAST and other devices [32, 33, 34, 35].
Firstly, LFO seems not purely electrostatic, as shown in Fig. 5(a) and (b); secondly, the
typical LFO frequency is about 3 times larger than the LCO in EAST L-H transition
(2-3 kHz)[32], against to the ion-ion collisional damping process of zonal flows; thirdly,
the harmonics of zonal flow have never been reported before and is difficult to explain
theoretically[36]. There must be some other process, maybe like the coupling between
LFO and WCM, need to be considered in the predator-prey model[37, 38] to explain
these differences. More investigation are needed to draw definitive statements on the
nature of LFO.
To further investigate the interaction among the WCM, LFO and background
turbulence, bicoherence analyses are used in this article. The cross-bicoherence of two
signals φ1(t) and φ2(t) is defined as:
b2(f1, f2) =
⟨|φ1(f1)φ1(f2)φ
∗2(f3 = f1 + f2)|2
⟩⟨|φ1(f1)φ1(f2)|2
⟩ ⟨|φ∗2(f3 = f1 + f2)|2
⟩ (1)
where φj(fi) is the Fourier transform of φj(t). Fig. 6 presents the amplitude, amplitude
and dφ cross-bicoherence[39] from two channels with and without GAM in the DBS8
during I-mode shot 71078. Panels (a) (b) (c) (d) are the channel with only LFO and
panels (e) (f) (g) (h) are the adjacent channel with LFO and GAM coexisting. In
panel (a) without GAM, two lines are quite bright in Fig. 6(a): f1 + f2 = fLFO, and
f1 + f2 = fWCM , which indicates strong nonlinear interactions among the LFO, WCM
and background turbulence. And this is the first observation of the coupling between
the WCM and background turbulence. Also the enlargement of the low-frequency part
I-mode investigation on the Experimental Advanced Superconducting Tokamak 11
in panel (b) shows a strong interaction between the WCM and LFO with a different
colorbar, which matches well with the report in AUG[13] but substitutes the GAM with
the LFO which may strongly indicate that the LFO observed in EAST plays a similar
role in the process of the I-mode development as the GAM reported in AUG[13]. In the
summed bicoherence, the peaks at approximately 9 kHz (LFO) and 35-74 kHz (WCM)
are distinct, which strongly exceed the significance level, as shown in Fig. 6(d). To clearly
show the intensity between LFO/WCM and high frequency turbulence (> 200 kHz),
the summed bicoherence with only high frequency components (f1 > 200 kHz) is
also estimated as red line in panel (d), which is about twice the summed bicoherence
with all frequency components, indicating that the averaged coupling intensity between
LFO/WCM and high frequency turbulence is actually much larger than that between
LFO and WCM. These results imply that although the total density fluctuation level is
decreasing during I-mode, the coupling between small scale turbulence and large scale
coherence modes such as LFO and WCM still plays an important role, and WCM and
LFO may both receive energy from background turbulence. For the channel with both
GAM and LFO, two lines are observed in panel (g), refered to f1 + f2 = fGAM and
f1 +f2 = fLFO, respectively. Although WCM still exists in this channel, which could be
speculated from the couplings between LFO and WCM in panel (f), no obvious coupling
between WCM and background turbulence is observed (the summed bicoherence at
f3 = 30 − 70 kHz a little above the noise level is due to the contribution from
the LFO/GAM and WCM couplings), again implying that the nonlinear three-wave
interactions between WCM and turbulence mainly occur at the generation location of
WCM.
4. Summary
The I-mode operation in EAST has been verified, and it can be maintained for almost
the entire flat top in one discharge. The unfavorable ion ~B × ∇B direction is also a
key condition in the I-mode appearance as in Alcator C-Mod, AUG and DIII-D. The
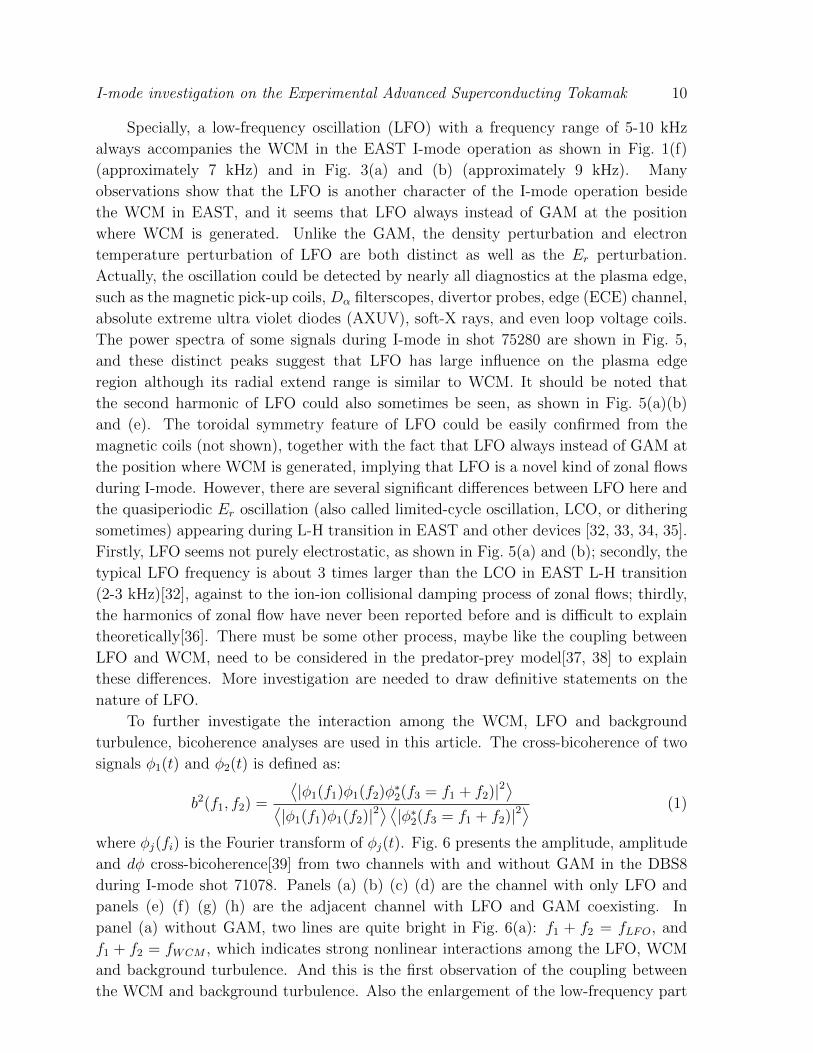
L-mode to I-mode transition can be triggered by various heating methods such as LHW
heating, NBI, ICRF heating and ECRH as shown in Fig. 7, no heating preference is
observed. However, a preference of high plasma currents Ip is found in EAST. Many
observations show that the L-mode to I-mode transition mainly occurs in the discharges
with heating power > 1.8 MW and the density > 2.5 ∗ 1019 m−3. Generally, the I-mode
has a stored energy improvement of nearly 50% based on the L-mode.
As a typical characteristic of the I-mode, the WCM is observed in both density
perturbation and Er perturbation in EAST. An Er well is observed at the plasma edge
in the L-mode and I-mode regions, and it is deeper in the I-mode, as observed in AUG.
The WCM is mainly localized inside position of the Er well, and extended radially only
2-3 cm, i.e., could be distinctly observed at one or two channels for DBS diagnostic.
Specifically, a low-frequency oscillation with a frequency range of 5-10 kHz is observed
to be always accompanied with the WCM in the I-mode operation, Which is regarded
I-mode investigation on the Experimental Advanced Superconducting Tokamak 12
Figure 7. Typical I-mode discharges triggered by different auxiliary heating methods.
From top to bottom are evolutions of heating power, stored energy, line-averaged
density from HCN interferometer, electron temperature from available ECE, radial
electric field perturbation from DBS. (a) shot 71078 triggered by LHW only. (b) shot
69976 triggered by ICRF. (c) shot 75493 triggered by NBI. (d) shot 69327 triggered
by ECRH.
as another typical characteristic for I-mode on EAST. It is possible a novel kind of
limited-cycle oscillation, but some unique features, like the magnetic components and
the harmonics are still need more investigations. And the GAM which is often observed
in L-mode region isn’t always observed in I-mode operation, and it may disappear in
nearly 60% I-mode discharges at the location where the WCM is the most significant,
but it may still exist at other radial locations. Through the bicoherence analysis, it is
found that both WCM and LFO strongly couple to the background turbulence in EAST,
and interaction between WCM and the LFO also exists strongly, which may indicate
that the LFO may play a similar role in the process of the I-mode development as the
GAM in AUG, where GAM is found to both modulate and broaden the WCM. And the
bicoherence also implys that the coupling between WCM with turbulence is probably a
I-mode investigation on the Experimental Advanced Superconducting Tokamak 13
key factor during the generation and saturation processes of WCM. Considering that the
intrinsic instability of WCM is still unknown, the role of small scale turbulence should
be paid more attention for future research on WCM.
Acknowledgments
The authors especially thank Dr. Jerry Hughes for the helpful discussions and Dr.
Tianfu Zhou for his kind help in ECE DATA providing. The present work was supported
in part by National MCF Energy R&D Program under Grant No. 2017YE0301204 and
2018YFE0311200, Natural Science Foundation of China under Grant No. 11635008,
Anhui Provincial Natural Science Foundation No. 1708085QA23. We also acknowledge
the EAST team for the support of these experiments.[1] J.Q. Hu et al 2017 Rev. Sci. Instrum. 88, 073504
[2] F. Ryter et al 1998 Plasma Phys. Control. Fusion 40 725
[3] D.G. Whyte et al 2010 Nucl. Fusion 50 105005
[4] A.E. Hubbard et al 2017 Nucl. Fusion 57 126039
[5] R.M. McDermott et al 2009 Phys. Plasmas 16, 056103
[6] C. Theiler et al 2014 Nucl. Fusion 54 083017
[7] A.E. Hubbard et al 2011 Phys. Plasmas 18, 056115
[8] I. Cziegler et al 2013 Phys. Plasmas 20, 055904
[9] A.E. White et al 2011 Nucl. Fusion 51 113005
[10] A.E. White et al 2014 Nucl. Fusion 54 083019
[11] F. Ryter et al 2017 Nucl. Fusion 57 016004
[12] E. Viezzer et al 2013 Nucl. Fusion 53 053005
[13] P. Manz et al 2015 Nucl. Fusion 55 083004
[14] P. Manz et al 2017 Nucl. Fusion 57 086022
[15] T. Happel et.al 2017 Plasma Phys. Control. Fusion 59 014004
[16] T. Happel et al 2016 Nucl. Fusion 56 064004
[17] A. Marinoni et al 2015 Nucl. Fusion 55 093019
[18] A.E. Hubbard et al 2016 Nucl. Fusion 56 086003
[19] A.E. Hubbard et al 2012 Nucl. Fusion 52 114009
[20] J.R. Walk et al 2014 Phys. Plasmas 21, 056103
[21] J.W. Hughes et al 2013 Nucl. Fusion 53 043016
[22] J.E. Rice et al 2015 Nucl. Fusion 55 033014
[23] J.E. Rice et al 2018 Nucl. Fusion 58 126008
[24] Z.b. Zhou et al 2015 Fusion Energ. 34:9398
[25] L. Zhang et al 2017 Nuclear Materials and Energy 12, 774
[26] Xianzu GONG et al 2017 Plasma Sci. Technol. 19 032001
[27] J. Li et al 2013 Nature Physics 9, 817821
[28] Baonian Wan et al 2013 Nucl. Fusion 53 104006
[29] Z.X. Liu et al 2018 27th IAEA EX/P5-1, Ahmedabad, India, October 22-27
[30] G.D. Conway et al 2004 Plasma Phys. Control. Fusion 46 951
[31] G.D. Conway et al 2005 Plasma Phys. Control. Fusion 47 1165
[32] G.S. Xu et al 2011 Phys. Rev. Lett. 107, 125001
[33] L. Schmitz et al 2012 Phys. Rev. Lett. 108, 155002
[34] T. Estrada et al., Europhys. Lett. 92, 35001 (2010).
[35] Cheng J. et al 2013 Phys. Rev. Lett. 110 265002
[36] P.H. Diamond et al 2005 Plasma Phys. Control. Fusion 47 R35
[37] K. Miki et al 2012 Phys. Plasmas 19, 092306
I-mode investigation on the Experimental Advanced Superconducting Tokamak 14
[38] Eun-jin Kim et al 2003 Phys. Rev. Lett. 90 185006
[39] J.C. Hillesheim et al 2012 Phys. Plasmas 19, 022301


![Experimental investigation on the combustion and exhaust ......biodiesel in dual fuel mode. • Experimental Data analysis of emissions. 1.1 DUAL FUEL INJECTION: Workman et al. [1]](https://img.pdfslide.us/doc/110x75/5f0250fc7e708231d403aab7/experimental-investigation-on-the-combustion-and-exhaust-biodiesel-in-dual.jpg)