Embed Size (px)
Citation preview

VELOCITY DISPERSIONS IN GALAXIES: I. THE SO GALAXY NGC 7332
Donald C. Morton and Roger A. ChevalierPrinceton University ObservatoryReceived
ABSTRACT
A coude spectrum of the SO galaxy NGC 7332 with 0.9A resolution from
186 to 36 -A was obtained with the Princeton SEC vidicon television camera
and the Hale telescope. Comparisons with spectra of G and K giant stars,
numerically broadened for various Maxwellian velocity distributions, give a
dispersion velocity in the line of sight of 160 ±20 km sec with the best
fit at G8III. The dispersion appears to be constant within ±35 km sec
out to l.h kpc (H 10'CT'km '/s'e.c-. v,'mP9-,,..,•),•• After correction for projection,'- ••'•'j _H".V-'''C.-|
the rotation curve has a slope of O.l6 km sec" '""pc~ at 'the center and a
velocity of 130 km sec at l.h kpc where it is still increasing. For an
estimated effective radius of 3.5 kpc enclosing half the light, the virial
theorem gives a mass of I.h x 10 MO if the mass-to-light ratio is constant
Q
throughout the galaxy. The photographic luminosity is 8.3 x 10 LQ so that
the M/L ratio is 17.

-2-*'
I. INTRODUCTION *•
Our knowledge of the masses of single elliptical galaxies depends
mainly on measurements of the component stars. Dispersions can be derived
from a few line profiles in high resolution spectra, but such spectra have
been obtained for only the very brightest galaxies (Burbidge, Burbidge, and
Fish 1961 a, b, c; Minkowski 1961). The Princeton SEC vidicon television
camera described by Lowrance, Morton, Zucchino, Oke, and Schmidt (1972) has
proven to be an ideal detector for these observations. The low background
noise permits integration times of several hours with high sensitivity so
that the tube can record a small wavelength band of a faint object at high
dispersion. If the spectrum is not widened, the two-dimensional TV picture
also can give information on rotation and the variation of the dispersion
with distance from the center. -'King;'(1963) -has emphasized the importance
of dispersion measurements away from the center to give constraints on the
dependence of the distribution function on angular momentum. A number of
spectra of SO and elliptical galaxies have now been obtained with the tele-
vision camera on.the coude spectrograph of the Hale 200-inch telescope. We
report here the results for the first galaxy, NGC 7332.
This galaxy has been classified as E7 by van den Bergh (i960), S0? pec
by Sandage (l96l), and SO pec by de Vaucouleurs and de Vaucouleurs (196 ).
Photographs have been published by Burbidge and Burbidge (1959), Sandage
(l96l), and van Houten (1961). The Burbidges noted that the nuclear region
is almost rectangular and van Houten distinguished between bulge and disc
components. The Burbidges also pointed out that the thin extensions of the
major axis beyond the nucleus are not exactly collinear and suggested there
-3-
f
might be tidal interaction with the Sc galaxy NGC 7339 which is 'only 5' away.
The velocity dispersion of the stars in the galaxy is best derived by
comparison with spectra of bright stars similar to the galaxy in spectral
type. If all objects are observed with the same instrument and the same
slit width, no corrections are needed for the spectrograph resolution pro-
vided the galaxy lines are well resolved. Humason, May all, and Sandage
(1956) quoted G3 as the spectral type for both NGC 7332 and M32, but
Burbidge, Burbidge, and Fish used the KOIII star £ Tau in their analysis of
M32. Consequently, we obtained comparison spectra ranging from F5HI to
Various techniques have been used for broadening the lines in the star
spectra to match the galaxy profiles . Minkowski depended on visual compari-
sons of photographs of the galaxy spectrum with sets of spectra of a star
or galaxy artificially smeared to represent Gaussian distributions with
various dispersions. Alternatively Burbidge, Burbidge and Fish compared
intensity plots of M32 with a series for § Tau broadened to various disper-
sions by numerical calculation. The digital data arising from the reduction
of the TV spectra, along with a modern computer, permit 'further improve-
ments in the numerical approach as outlined in IV.

-k-
II. OBSERVATIONS .,.
As described by Lowrance et al (1972) the TV camera was mounted at the
focus of the 36-inch Schmidt camera of the 200-inch coude" spectrograph.
There the dispersion in third order was Q.jkR mm" corresponding to O.U2A1
per U8/M bandwith-limited picture element on the TV cathode. An untrailed
spectrum of WGC 7332 was obtained on October 8, 1970 in a five hour expo-
sure centered on 5:30 UT. The comparison stars HD 6l06 (F5III), HD 326l
(G5III), HD 5l8lU (G8III) and HD l+9l6l (K IIl) were taken later that night
or the following night with exposures of 25 to 65 sec. The seeing was
estimated to be about 3" for the galaxy exposure and better for the stars.
The width of the spectrograph slit was set at 1mm corresponding to l'.'35 so
that after a factor 10 demagnification the projected width on the cathode
was 0.87A. The measured TV camera response to the appropriate test pattern
of 5 square-wave cycles per mm was about 90 percent.
The slit was oriented north-south through the nucleus at an angle of
about 25 to the major axis, with the image rotator in the beam. The slit
length included 27" of the galaxy with the nucleus approximately in the
center. The TV cathode covered the range Ul60 to H390&, but both ends of
the frame for NGC 7332 were read out after the first two hours of the expo-
sure to check the integrated signal strength, leaving the range Ul86 to
36 $ for the final readout. This range included almost all the lines which
Burbidge, Burbidge and Fish found suitable for determining dispersion velo-
cities, namely H/^ A 227 of Cal, and several lines.of Pel. A Corning
5330 filter was used to eliminate second and fourth-order wavelengths.
At the end of each exposure the vidicon target was read out in ana-
logue form to a magnetic tape which was later digitized. Figure 1 is a

-5-
picture of the spectrum of WGC 7332 made with a mechanical film scanner from
the digital record after application of the calibration factors described
below. The vertical scale has been magnified ^.5 times the horizontal
scale. The TV lines were nearly parallel to the dispersion with a height
of 33/J- or 0'.'5; they are divided into digital picutre elements each 28/tt
or 0.25A wide. The bright spot in the middle of the spectrum, just below
the nucleus resulted from an accidental switching off of the power to the
camera between exposure and readout, probably causing a voltage transient
which made the electron scanning beam expose this part of the target.
III. DATA REDUCTION
a) Noise Filter
Since the absorption features in the galaxy spectrum were rather
broad, it was desirable to filter out the high frequency noise components
before comparison with the stellar spectra. Noise was introduced into the
TV output primarily by the quantum fluctuations in the signal, with an
additional contribution from the readout amplifier at the low light levels
away from the nucleus. Following the recent discussion of the processing
of spectra by Brault and White (1971), we multiplied the Fourier transform
of each TV line"in the galaxy frame by the filter function
& - Ps (DX P +P
s n
where P and P' are respectively the power spectra of the signal and thes n
noise in the galaxy spectrum. We derived the total power spectrum (P +P )s n
for each TV line of the galaxy directly from the digitized data by a fast
Fourier transform routine. ¥e could not know P for the .galaxy without aS
noise-free exposure, but an estimate of the behaviour of P at high fre-S

-6-
quencies was obtained from the shape of the power spectrum of the well-
exposed comparison star HD 326l in which the noise component was rela-
tively small. Since the star has many narrow lines, its P must be greaters
than that for the galaxy at high frequencies and consequently the filtering
of the galaxy was less severe than if we had used the true P for thes
galaxy.
The filter function was approximated by <p « 1 for frequencies V~ i/,
£> = 0 for VJP) J and linear between >*, and V^ whose values changed gradually
from one TV line to the next. For example on the TV line with maximum
intensity in the nucleus we chose y, = 0.0k and l£ = 0.3 cycles per digital
element^corresponding to khO and 58 km sec respectively. This filter
function also was applied to the comparison star after smoothing to the
dispersion of 160 km sec derived for the galaxy in the next section.
Comparison with the unfiltered star spectrum showed that the adopted disper-
sion velocity was not affected by the filtering.
b) Intensity Calibration
Since the output of the TV camera is not linear with exposure at high
intensities, the tube was calibrated at 10 intensity levels including zero,
at each point on the cathode by illuminating it uniformly with a constant
light source and integrating for various time intervals. It was assumed
that varying the exposure time was equivalent to varying the light inten-
sity, since some preliminary experiments have shown no evidence of recipro-
city failure. Smoothed calibration factors were then applied to each picture
point by point. It was necessary to watch for a shift in the zero level
which occurred between the observing run at Palomar and the calibration in
Princeton possibly due to changes of the target bias voltage and the base
level in the tape recorder.

-7-
c) S-Distortion
The S-distortion curved the spectrum relative to the TV lines. Both
galaxy and star frames were corrected for this effect by a simple transfor-
mation which was derived from the deviation of the line of maxiumu intensity
from a'specific TV line at each wavelength.
d) Tube Background and Sky
For the star exposures, both the sky signal and dark current from the
TV cathode were negligible, but they made important contributions to the
galaxy especially in the fainter outer parts. An estimate of the tube
background on the long exposure was obtained from the region of the TV frame
outside the iron comparison spectrum, but no direct sky measure was avail-
able because the galaxy covered the whole length of the slit. Since the
quarter moon was up during 70 percent of the five hour .exposure on NGC 7332,
we finally adopted a relatively large sky correction amounting to 25% of the
background on the galaxy, so that after subtraction of the background, the
sky was 11$ of the remaining signal from the nucleus and k5% of the signal
at the end of the slit. This choice for the sky seemed reasonable because
the resulting equivalent widths of the absorption lines were then nearly
constant across the galaxy, particularly the H7^ line.which is unlikely to
show any effects of variations in stellar population.
This problem of determining the sky contribution to the continuum
level in the spectrum of a galaxy shows the need for a special feature in
the design of spectrographs to be used with the new generation of sensitive
two-dimensional electro-optical detectors. It would be very helpful if the
spectrograph were to have a path by which a dispersed sample of sky light
away from the galaxy could be recorded at the same time*

-8-
IV. VELOCITY DISPERSION, REDSHIFT, AND ROTATION
a) Broadening of Stellar Spectra
We have adopted the usual assumptions that all stars contributing to
the observed galaxy spectrum around 4300& have a Maxwellian velocity distri
bution with the same dispersion CT in the line of sight, and they have the
same spectral shape l(?s). The composite spectrum at ?\e, therefore, must be
(2)
To simplify computation we assumed hff rather than cr is constant with wave-
length over the narrow range from 4l86 to 36 2. covered by the TV spectrum
of the galaxy. Thus the dispersion cr varied inversely with A along the
spectrum, but the change was only ±2%. With constant }c<r the right-hand
side is a convolution integral, and application of the convolution theorem
gave the broadened spectrum l(h) from the inverse Fourier transformation of
the product of the Fourier transforms of the Gaussian and an observed star
spectrum l(A). In this way broadened spectra were generated for the compar-
ison stars with many values of 0" from 50 to 200 km sec
b) Velocity Dispersion
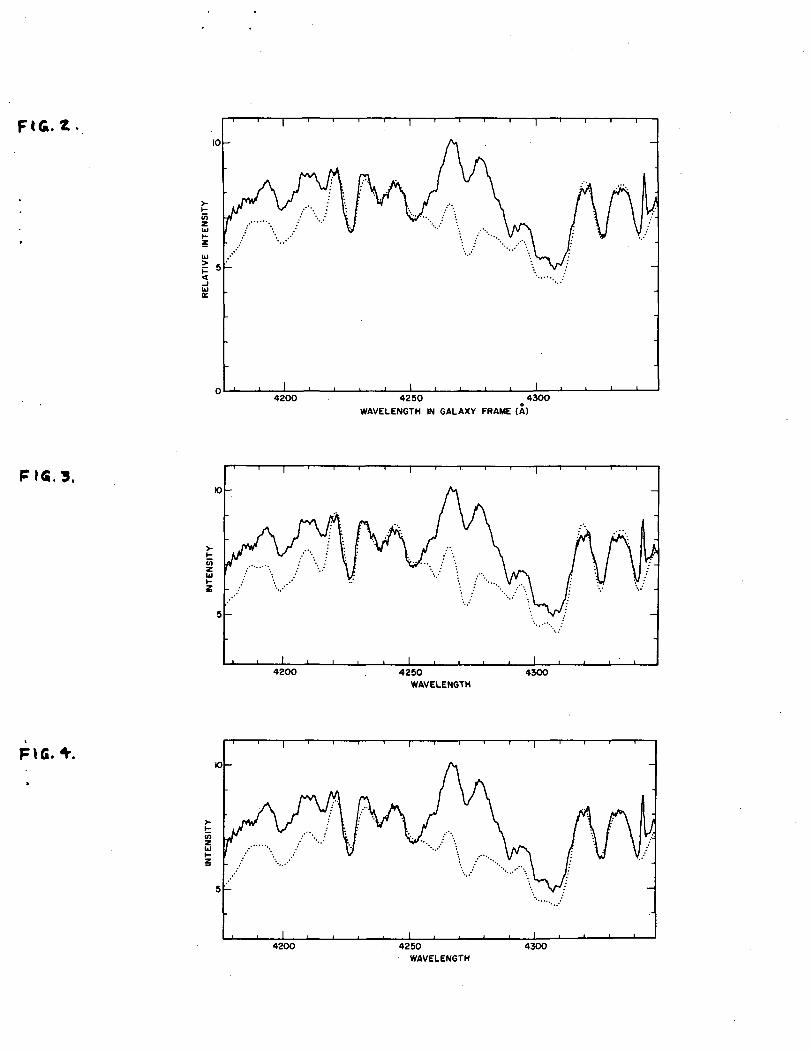
Since the seeing was about 3", averages over 7 TV lines of the galaxy
spectrum were plotted for comparison with the broadened stellar spectra. In
Figure 2, the average containing the brightest part of the nucleus is shown
beside the G8III star with CT = l6o km sec" . The region around 7( 272 of
Fel has an anomalously high intensity in the galaxy due to the nearby read-
out error on the TV frame. The diffrential redshift in the galaxy lines
causes slight deviations from the wavelengths of the star lines at each end

-9-
of the spectrum. Figures 3 and h also show the nucleus and the G8III star,
but with cr = I*l0.and 180 km sec" . At the lower dispersion velocity the
stellar lines are deeper than those in the galaxy, while for the higher
value ) 227 of Cal is shallower in the star. Therefore we conclude that
the dispersion in the center of NGC 7332 is 160 km sec , with an uncertainty
of about 20 km sec . In our visual fitting procedure, no attempt was made
to force agreement of the continuum levels over a wide wavelength range so
that any difference between the energy distributions of the stars and galaxy
would not influence the derived velocity.
In Figures 5 and 6 the nucleus is compared with the best fits for the
G5III star at or - 160 km sec'1, and K III at 150 km sec" . The Cal line is
too weak in the broadened G5III star while both Cal and Fel are too strong
in the K III star showing that these types are definitely different from the
spectral class of the galaxy, which is best represented by a G8ll star inour spectral region.
At 10" from the center of the galaxy the decreased signal-to-noise
ratio and uncertainties in the sky contribution made estimates of the dis-
persion much more difficult. However, it appeared to have approximately the
nuclear value of l60 km sec with the uncertainty increased to 35 km sec
It is unlikely these numbers would change if a different sky correction had
been used in Hid.
c) Redshift
Measurement of the centers of the lines p\ 226.7 of Cal, and^U271.7
and U325-7 of Fel gave a radial velocity of 1170 ±60 km sec" after
correction for the earth's orbital motion. This value is consistent with
±50 km sec" quoted by Humason, Mayall, and Bandage (1950) . We have

-10-
adopted a recession velocity of 1 6U km sec derived by correcting the
latter figure for the solar motion in the local group. With a Hubble
constant of 100 km sec mpc , the distance is lU.6 mpc.
d) Rotation
Rotational velocities were obtained at various projected distances up
to 10" from the center by measuring the wavelength shifts necessary
to superpose plots of the nuclear region on the spectra of the outer parts.
The observed rotation curve is shown in Figure 7 where the vertical bars
indicate subjective estimates of the errors. The velocity changes rapidly in
the central region and appears to level off farther out, though the maximum
probably lies beyond the width of our spectrum. The measured radii and
velocities require correction for both the inclination of the galaxy from
the plane of the sky and the 25 deviation of the slit from the major axis.
We have adopted an inclination of ?6 from the ratio of the axes b/a » 0.2
of the outermost isophote given by van Houten (1961), since he indicates
the light at large distances from the center must come entirely from the disc.
If we assume a simple disc model for the whole galaxy, with the surfaces of
constant velocity on cylinders, equation (l) of Rubin and Ford (1970) shows
that an apparent distance of 10" or 710 pc along the slit is really 2.0 x
710 = 11+20 pc along a radius of the galaxy and the true rotational velocity
at the end of this radius is 2.2 x 60 = 130 km sec" . The true slope of
the velocity curve at the center is O.l6 km sec pc" .
V. MASS AND LUMINOSITY OF NGC 7332
Since our velocity measures are limited to the central part of the
galaxy, this is the region for which we would have the most confidence in

-11-
any derived properties such as the mass-to-light ratio. However, it is
interesting to try to calculate the total mass of the galaxy under the
simplyfying assumptions that the observed dispersion velocity is representa-
tive of the whole galaxy and M/L is constant over the galaxy.
a) General Theory
If we assume a galaxy is in a stationary state we can estimate its mass
from the relation between the kinetic energy T and potential energy/I given
by the virial theorem,
2T +/l= 0 . ' (3)
Both random motions and rotation contribute to T, but for the present we
shall assume the rotation is small so that
T
where M is the total mass of the galaxy and <t/* is the mean square velocity
averaged over all directions, and assumed to be the same for all stars.
In order to relate V/^to the observed dispersion <f in the line of
sight, we must make an additional assumption regarding the distribution ofrt
orbital eccentricities. For pure radial motions ^U/^»flf at the center
and decreases rapidly towards the outer regions. On the other hand, for9
isotropic motions ^U" » 3ff . Since atmospheric seeing usually will
blend the nucleus with some of the outer parts Poveda, Iturriaga, and Orozco
(i960) have suggested that some combination may be more appropriate such as
3 2= & . In another investigation for a spherical system, Povedo, Cruz,
and Batiz (i960) found that 17% radial orbits plus 83% circular orbits would
/ »>. 2give constant observed dispersion across the galaxy and then <JJ 7 « 2<r .
Our measurements of WGC 7332 seem to indicate constant ff so that we might

-12-
prefer the last relation. However, we have adopted
(5)
as did Burbidge, Burbidge, and Fish (1961) and Fish (19610 because they
believed some consideration must be given to both isotropic motions outside
the nucleus and the neglected rotational motions which also contribute to
the total kinetic energy.
In this derivation of the mass of a galaxy it is important to remember
that the brighter, more massive stars may contribute most of the light used
to obtain the observed dispersion velocity, while a significant fraction of
ths mass could be contained in fainter low-mass stars which need not have
the same \lt /.
If we assume the ratio of mass to luminosity is constant across a gal-
axy, the distribution of light gives the total potential energy
M dM (6)•v* —
rJ7 = G / _r_r
'o
where M is the mass inside radius r. The easiest method for calculating
follows the principles described by Poveda (1958) who integrated de Vancouleur's
(1953) standard luminosity distribution for elliptical galaxies. If we ap-
proximate the surface brightness in magnitudes at distance r from the center by
im(r) - m(0)
we can determine an effective radius R^ of a circle which encloses half the2 .
light by drawing a straight line through a plot of observed magnitudes .1. • •
versus ru along the minor axis and noting where they fall by 8.33 mag from
the extrapolated line at r «= 0. Poveda showed thatJZ*5 -0.322GM /Rg- in cgs units
for spherical galaxies and Fish (196 ) added two approximate corrections

-13-
for ellipticals. Since R2 is normally determined from measures along the
2/3minor axis, the expression for must be multiplied by (b/a) ' where b/a
is the apparent ratio of minor and major axes. Also the coefficient should
be increased to 0.3 to correct for the projection effect which makes the
apparent ratio of axes in ellipticals average 16% less than the true ratio
of equatorial and polar axes. Thus,
n „, GM2 /bf/3 ,ON
'Hi V2
where the constant is appropriate for cgs units. Our equation (8) corrects
a slight error in Fish's calculation of the coefficient and his apparently
mistaken inversion of the ratio b/a. In practice the effective radius is
always described by an angle BI_ leaving RI to be calculated from a distance2 2
estimate which is usually obtained from the recession velocity V and the
Hubble constant H.
We can combine equations (3), ( ), (5) and (8) to give
where or and V are now in km sec , H is in km sec rape , and p g- is in
arc sec.
b) Application to WGC 7332
We estimated H|- by matching van Houten's (l96l) photometry along the
minor axis to de Vaucouleur's law. A good fit was not possible because the
light of NGC 7332 diminished faster with increasing radius than expected
from the law, but the effective radius for half the light probably lies
between 5" and 25". We have given most weight to the.photometry of the

-14-0
brighter parts of the galaxy and adopted 2 = 20". Van Houten's data also
show that the axial ratio ranges from 0.50 near the center, to 0.24 at the
outermost isophate. We have used b/a = 0.40 in equation 9- At the distance
of 14.6 rape, the radius R^ = 3-5 kpc, after correcting for projection. At2 . '
a true radius of 1.4 kpc or 0.4 RI_ we found V , = 130 km sec" . According2 rot
to Table 2 of Poveda, Iturriaga, and Orozco (1960), 80 percent of the mass
of a spherical galaxy lies outside this radius. If the average rotational
velocity of all this mass is 130 km sec , the rotational contribution to
the kinetic energy is about 50 percent of \ M«- so that our use of lT/ =
2 23cr instead of 2 Or probably accounts for the rotation more than adequately.
Therefore we find the mass is
MO~ i>H * \irj-
b) Photographic Luminosity
We have calculated the luminosity of WGC 7332 over the photographic
band from the integrated m =11.9 quoted by Van Houten and a galacticPS
extinction of 0.25 cscb = 0.5 mag. The distance derived from the Hubble
law gave an absolute magnitude M = -19.4 - 5 log (lOO/H). Stebbins andPS
Kron (1957) obtained M =5-37 for the sun so that the ratio of photographic
Q ?luminosities must be L/L0 = 8.3 x 10 (lOO/H) . The ratio of mass to lumin-
osity for EGC 7332 is then M = 17 Mo (' H \L L0 llOO/"
VI. DISCUSSION
Velocity dispersions have been determined by the methods mentioned in
%~I- for 13 E and SO galaxies. According to the summary by Minkowski (I96l)
the values range from 100 km sec" for the E2 dwarf NGC 221 (M32) to 480 km

-15-
sec" for the EOp giant NGC kkQ6 (M8?). Four SO galaxies lie between 195
and 270 km sec" . Thus our value of 160 km sec" for NGC 7332 is consis-
tent with previous SO measures, although it now has the second lowest known
dispersion velocity.
Rotation has been found in four other spherical galaxies. Our central
slope of O.l6 km sec pc is comparable with the values of 0.22 and 0.50
km sec pc reported by King and Minkowski (1966) for the E 5 galaxies
NGC 1*621 and 4697 respectively. In contrast, Walker (1962) measured 7.8 km
sec pc in M32 and Minkowski's (1966) measures near the center of the
E7-SO galaxy NGC 3115 indicated a slope of 2 km sec" pc" .
Genkin and Genkina (1969) have listed masses for eight elliptical gal-
axies derived from velocity dispersions by the principles described in this
paper. For the more elongated types their values must be increased by
2/3factors up to two because they followed Fish and incorrectly used (b/a) '
in equation 9« Six of the galaxies lie in the range of approximately 1 to
2 x 10¹² M0 while M32 is about 3 x 10⁹ MQ . Only WGC 3379 with M~ 1 x 10¹¹ M0
is comparable to the I.k x 10 M^we found for NGC 7332. Our M/L ratio of 17 is
within a factor two of the ratios for M32, NGC 3379, and NGC M+72, but smaller
than the values ranging from 50 to 120 found for five of the six massive
ellipticals.
Masses and M/L ratios for double galaxies have been derived by Page (1962,
1966) on the assumption of circular orbits. For 19 E and 8 SO galaxies with
measurements of the highest weight, he obtained an average mass of (5.9*1.5)
x 10 M and an average M/L ratio of 90±37. This ratio is higher than we
found for NGC 7332 but consistent with the M/L values derived from the
widths of the absorption lines in five massive ellipticals. Further analysis
of the data on double galaxies is in order following the approach of

-16-
Wolf and Bahcall (1972) to better define the limits of the uncertainty in
the average mass. At the same time, since either of the assumptions of
constant velocity dispersion or constant M/L usually used in the applica-
tion of the virial theorem to a single galaxy could "be seriously in error,
it is desirable to obtain masses for some pairs of galaxies by both methods.
Thus a determination of the radial velocity of NGC 7339, the apparent com-
panion of NGC 7332, could be very useful. Our measurement of the dispersion
velocity in NGC 7332 really gives information about only the central stars
whose light contributes to the observed spectrum. If the mass falls off
less rapidly with radius than the light, as suggested by data on the
Milky Way and M31, much of the mass of NGC 7332 could lie in the faint
outer parts and then the average M/L would be considerably larger.
We wish to thank Dr. J.B. Oke of the Hale Observatories for making part
of his observing time on the 200-inch telescope available to us and for
suggesting the problem of velocity dispersions in galaxies. John Lowrance,
Paul Zucchino, and John Opperman of the Princeton University Observatory
assisted in the installation and operation of the camera at Palomar.
Dr. Philip Crane of the Princeton Physics Department provided the intensity
calibration and Dr. Edward Jenkins of the Princeton Observatory contributed
helpful advice on the numerical noise filter and convolution integrals. The
development and use of the SEC vidicon was supported by the National Aero-
nautics and Space Administration under contract NSR-31-001-127 to Princeton
University. The analysis of the data was supported through NASA contract
NSr-31-001-901 (D.C.M.) and a National Science Foundation graduate fellow-
ship (R.A.C.).
-17-
REFEREWCES
Bergh, S. van den, I960, Fubl. of D. Dunlap Obs. II, Nr. 6.
Brault, J.W. and White, O.R. 1971, Astron. and Ap., 13, 169.
Burbidge, E.M., Burbidge, G.R., and Fish, R.A. 196la, Ap. J. 133, 393.
. 196Ib, Ap. J. 133, 1092.
. 196lc, Ap. J. 13 , 251.
Burbidge, E.M., and Burbidge, G.R. 1959, Ap. J., 130, 20.
Fish, R.A. 196U, Ap. J. 139, 2Qk.
Genkin, I.L., and Genkina, L.M. 1969, Astron. Zhurnal, lj-6, 1128.
Houten, C.J. van 1961, B.A.N., 16, 1.
Humason, M.L., Mayall, N.U., and Sandage, A.R. 1956, A.J., 6l, 97.
King, I.R. 1963, Ann. Rev. Astron. and Ap., 1, 179.
King, I.R. and Minkowski, R. 1966, Ap. J., 1 3, 1002.
Lowrance, J.L., Morton, B.C., Zucchino, P., Oke, J.B., and Schmidt, M. 1972,
Ap. J., 171, 000.
Minkowski, R. I960, Ann d'Ap. 23, 385.
Minkowski, R. 1961, Problems of Extragalactic Research, ed. G.C. McVittie
(New York: Macmillan Co.), p. 112.
Page, T.L. 1962, Ap. J., 136, 685.
. 1966, Proc. Fifth Berkeley Symp. Math. Stat. and Prob., 3, 31.
Poveda, A. 1958, Bol. Obs. Tonantzintla y Tacubaya, 17, 3.
Poveda, A., Cruz, C., and Batiz, G. I960, A.J. 65, 97.
Poveda, A., Iturriaga, R., and Orozco, I. I960, Bol. Obs. Tonantzintla y
Tacubaya, 20, 3.

-18-
Rubin, V.C., and Ford, W.K. 1970, Ap. J., 159, 379-
Sandage, A.R. 19&1, The Hubb_le_ Atlas of Galaxies, Carnegie Institution of
Washington Publ. No. 6l8.
Stebbins, J. and Kron, G.E. 1957, Ap. J., 126, 266.
Vaucouleurs, G. de. 1959, Handbuch der Fhyslk, 53, 311. (Berlin: Springer)
Vaucouleurs, G. de and Vaucouleurs, A. de 196 , Reference Cataloge of Bright
Galaxies (Austin: University of Texas Press).
Vaucouleurs, G. de 1953, M.H.R.A.S. 113, 13U.
Walter, M.F. 1962, Ap. J. 136, 695.
Wolf, R.A., and Bahcall, J.N. 1972, Ap.J., (in press).

-19-
FIGURE CAPTIONS
Figure 1
The spectrum of NGC 7332, reproduced from the digitized data obtained
on the integrating SEC vidicon television camera. The spectrum covers the
range from *H86 to k36k-A with wavelengths increasing to the right. The
horizontal TV scan lines are divided into digital picture elements. The
vertical scale has been magnified U.5 times relative to the horizontal scale,
the comparison spectrum is an iron arc and the emission line crossing the
spectrum at the far right is A 358.3 of Hgl in the night sky. The bright
spot just under the nucleus was accidently added to the TV target between
exposure and readout.
Figure 2
The adopted fit of the galaxy spectrum (solid line) with the G8III star
(dotted line) broadened to G~ « 160 km sec" . The peak in the middle of
the galaxy spectrum is a spurious intensity increase due to an electronic
failure just prior to readout. The continuum level of the G8III star fell
below the galaxy at the shortest wavelengths. The widths 'of the weaker
lines in the iron arc show that the resolution is about 0.9A.
Figure 3
Comparison of the galaxy (solid line) with the G8III star (dotted line)
broadened to G~ * lUo km sec" , a lower limit on the acceptable dispersion
velocity.
Figure 4
Comparison of the galaxy (solid line) with the G8III (dotted line)
broadened to Cf » 180 km sec" } an upper limit on the acceptable dispersion
velocity.

-20-
Figure 5
Comparison of the galaxy (solid line) with the G5III star (dotted line)
broadened to O~ = 160 km sec , the best fit for this spectral type. Note
that this star better reproduces the continuum level of the galaxy, but
the line profiles do not fit as well as with the G8III star.
Figure 6(dotted line)
Comparison of the galaxy (solid line) with the K^Ill/star broadened to
Cr « 150 km sec , the best fit for this spectral type. Here neither the
line profiles nor the slope of the continuum resemble the galaxy very well.
Figure 7
The observed rotation curve for NGC 7332 before correction for the 25
deviation of the slit from the major axis. The vertical bars are subjective
estimates of the errors.

_L4200 42SO 4300
WAVELENGTH IN GALAXY FRAME (A)
K>
Zu
4200 4250WAVELENGTH
43OO
I I420O 4250
WAVELENGTH43OO

. s:10
I4200
I4250
WAVELENGTH4300
4200 4250WAVELENGTH
4300
Ft 6. 7. 80
_ 60U«tfl
^ 40jt
£ 20o
3 oui>
^ 20
1K 40KO11 60
801 0 8 6 4 2 0 2 4 6 8 1 0
DISTANCE FROM NUCLEUS (ore sec)