Embed Size (px)
Citation preview
I 1 I NASA
DESIGN CRITERIA
I I SPACE VEHICLE
I [ENVIRONMENT)
I
I
i
c
~~
NASA SP-8067
EARTH ALBEDO AND EMITTED RADIATION
JULY 1971
NATIONAL AERONAUTICS AND SPACE ADMINISTRATION
https://ntrs.nasa.gov/search.jsp?R=19710023628 2018-07-22T12:48:43+00:00Z
NASA experience has indicated a need for uniform design criteria for space vehicles. Ac- cordingly, criteria are being developed in the following areas of technology :
I Environment Structures Guidance and Control Chemical Propulsion
Individual components are issued as separate monographs as soon as they are completed. A list of monographs published in this series can be found on the last page.
These monographs are to be regarded as guides to design and not as NASA requirements, except as may be specified in formal project specifications. It is expected, however, that the monographs will be used to develop requirements for specific projects and be cited as the applicable documents in mission studies, or in contracts for the design and development of space vehicle systems.
This monograph was prepared under the cognizance of the Goddard Space Flight Center (GSFC) with Scott Mills as the program coordinator. Robert Lyle, James Leach, and Lester Shubin of Exotech Incorporated developed the monograph. William R. Bandeen, Assistant Chief of the Laboratory for Meteorology and Earth Sciences at GSFC, members of the GSFC Meteorology Branch, and Thomas H. Vonder Haar of Colorado State University provided guidance in determining the monograph’s scope and reviewed it for technical validity.
Comments concerning the technical content of these monographs will be welcomed by the National Aeronautics and Space Administration, Goddard Space Flight Center, Systems Reliability Directorate, Greenbelt, Maryland 2077 1.
July 1971
1
For sale by the National Technical Information Service, Springfield, Virginia 22151 - Price $3.00
CONTENTS i
FOREWORD . . . . . . . . . . . . . . . . . . . . . . . . . . . . . . . . . . . . . . . . . . . . . . . . . . . . . . i
j.
1 . INTRODUCTION . . . . . . . . . . . . . . . . . . . . . . . . . . . . . . . . . . . . . . . . . . . . . . . . . . 1
2 . STATE OF THE ART .............................................. 1 2.1 Basicconcepts ................................................ 1
2.1.1 Radiation Budget ........................................ 1 2.1.2 SolarConstant .......................................... 2
2.2 Natural Phenomena Affecting Albedo and Long Wave Radiation . . . . . . . . . . 2 2.2.1 Albedo ................................................ 3 2.2.2 Long Wave Radiation ..................................... 3
2.3 Historical Summary of Albedo and Thermal Radiation Studies . . . . . . . . . . . 5 2.3.1 Ground-Based Studies ..................................... 5 2.3.2 Satellite and Other High-Altitude Measurements . . . . . . . . . . . . . . . . . 6 2.3.3 Interpretation of Experimental Results ........................ 7
2.4 Spectral Content of Albedo and Long Wave Radiation . . . . . . . . . . . . . . . . . . 9 2.4.1 Albedospectra . . . . . . . . . . . . . . . . . . . . . . . . . . . . . . . . . . . . . . . . . . 9 2.4.2 Emission Spectra . . . . . . . . . . . . . . . . . . . . . . . . . . . . . . . . . . . . . . . . . 9
2.5 Results of Recent Theoretical and Experimental Studies . . . . . . . . . . . . . . . . 13 2.5.1 Mean Values of Albedo .................................... 16 2.5.2 Mean Values of Thermal Emission ............................ 17 2.5.3 Diurnal and Seasonal Variations ............................. 17
2.6 Basis for Design Values ........................................... 27
3 . CRITERIA . . . . . . . . . . . . . . . . . . . . . . . . . . . . . . . . . . . . . . . . . . . . . . . . . . . . . . . 27 3.1 Global Annual Averages ......................................... 27 3.2 Geographical Distribution of Albedo and Emission ..................... 28 3.3 Temporal Variations of Albedo and Emission ......................... 28
3.3.1 Seasonal Variations ....................................... 28 3.3.2 Diurnal Variations . . . . . . . . : ............................... 28
3.4 Spectral Distributions ...................... : .................... 28 3.4.1 Albedo ................................................ 28 3.4.2 EarthEmission .......................................... 28
REFERENCES ........................................................ 37
SUPPLEMENTAL REFERENCES ......................................... 41
NASA SPACE VEHICLE DESIGN CRITERIA MONOGRAPHS NOW ISSUED . . . . . 43
iii
EARTH ALBEDO AND EMITTED RADIATION
1. INTRODUCTION
The fraction of solar radiation reflected (albedo) and the radiation emitted by the Earth must be considered as well as direct solar radiation in design of space vehicles which are to operate near the Earth. For such missions Earth albedo and emitted radiation may be s i e nificant factors in spacecraft thermal design and selection of operating characteristics of optical-sensor systems. Albedo and emitted radiation also may need to be considered in the design of spacecraft attitude control systems because of radiation torques, which are the sub- ject of a related design criteria monograph (ref. 1).
This monograph gives global annual averages of Earth albedo and radiation to use in estima- ting long term effects on space vehicle equipment and surfaces. For shorter term effects, ex- tremes are given which may be encountered because of geographical, seasonal, and diurnal variations. The monograph also treats spectral distributions of albedo and Earth radiation. The recommended values incorporate results of the extensive measurements from spacecraft which have been important in revising earlier estimates.
A related design criteria monograph on solar electromagnetic radiation gives values for the solar constant and solar spectral irradiance which have been developed from high-altitude measurements made from aircraft, balloons, and spacecraft (ref. 2).
2. STATE
2.1 Basic
OF THE ART
Concepts
The albedo of the Earth is the fraction of the total incident solar radiation that is reflected into space as a result of scattering in the atmosphere and reflection from clouds and the sur- face. Practically all of this reflected radiation is in the wavelength range from 0.29pm to 5pm.
A portion of the incident solar radiation is absorbed as heat by the Earth and its atmosphere which then emit thermal radiation (also termed long wave radiation) primarily at wavelengths jgreater than 4pm. This emission and the radiation flux resulting from albedo comprise the j total outgoing radiation.
2.1.1 Radiation Budget
Investigations of Earth albedo and radiation for the most part have been ancillary to assess- ments of the radiation budget in studies of climate and meteorology. Both the absorbed ra- diation and the thermal emission are components of the radiation budget which is part of the Earth’s energy budget. The local radiation budget is defined mathematically as:
1
R N = I o ( l -A)-RL
where
RN = net radiation flux per unit area across the “top of the atmosphere”
I , = incoming solar irradiance per unit area of the spherical boundary of the Earth- atmosphere system
A = planetary albedo
RL = long wave radiation (LWR) flux per unit area lost to space
The principle of energy conservation requires that the total energy budget must balance at every place and over any time period. However, the radiative portion of this budget is not similarly constrained because it is only one component of the total energy budget of the Earth-atmosphere system. The energy exchange indicated for the radiation budget varies with latitude from equatorial to polar regions and provides the driving force for large scale atmos- pheric and oceanic circulations. The reflected radiation (including scattered radiation) and emitted thermal radiation are two of the three factors of the radiation budget and are treated in this monograph. The third factor is the incoming solar irradiance which is the subject of another design criteria monograph (ref. 2) which is partly summarized in section 2.1.2.
2.1.2 Solar Constant
The value of the solar constant (solar irradiance at mean Earth-Sun distance) most often quoted in earlier years was 2.00 cal cm-2 min-l. This number was computed by F. S. Johnson in 1954 (ref. 3) by integrating the spectral irradiance curve. The spectral irradiance data were obtained by extrapolating to zero air mass the measurements made by ground- based instruments. Recent evaluations of the solar constant have been based on measure- ments obtained with total irradiance radiometers flown in high altitude aircraft (refs. 4 to 6). As a result of measurements from highaltitude aircraft, balloons, and spacecraft, a new value for the solar constant of 1353 k21 watts m-2 (1.940 k0.03 cal cm-2 min-’ ) is being adopted as the revised NASA design value (ref. 2).
The radiation balance studies with Nimbus 2 data employed a value for the solar constant of 1395 watts m-* (2.00 cal cm-2 min-l); the data from Nimbus 3 is being interpreted on the basis of a solar constant value of 1360 watts m-2 (1.950 cal cm-2 min-l).
2.2 Natural Phenomena Affecting Albedo and long Wave Radiation The values of Earth albedo and emission vary with location and time. The dominating influ- ences on albedo and emission are the topography of Earth and meteorological conditions.
2
1 -
i
Secondary factors are the solar elevation angle, which varies diurnally and seasonally, and the spectral content of incident solar energy.
The topographical factors encompass the variations of the Earth’s surface, i.e., soil, water, ice, and foliage, all of which have different reflection characteristics and LWR properties. The meteorological influence on albedo and emission includes the composition and density of the atmosphere as well as cloud formations. As much as 75 percent of the incoming solar radiation may be reflected by clouds depending on area covered, thickness, altitude, moisture content, and reflectance of the underlying surface. Clouds also affect long wave emission by absorbing a portion of the outgoing radiation and emitting it at the colder cloud-top temperature.
2.2.1 Albedo
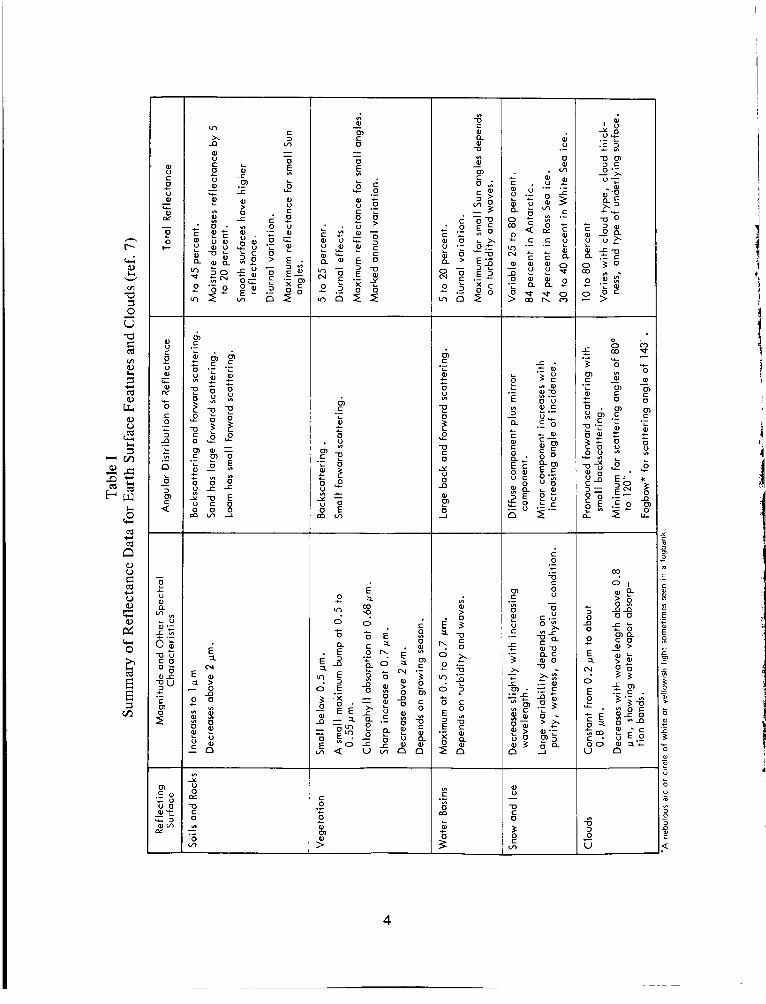
Table I (developed from ref. 7) indicates ranges of total reflectance for Earth surface fea- tures and clouds and some of the causes of variations. Table I also gives the spectral re- flection characteristics and angular distribution of reflectance which have second order effects on the sum of reflected energy from the different Earth features. From this infor- mation, it can be concluded the Earth is nonhomogeneous with nondiffuse spectrally de- pendent reflectance.
Although the ranges of reflectance characteristics are vast, the average values of reflectance for various classes of geographical features and over large areas show the following trends:
0 Reflectance tends to increase with a decreasing solar elevation angle.
0 Continental areas generally have higher albedo values than ocean areas.
0 Albedo increases with latitude due in part to the decreasing solar elevation angle, snow and ice cover near the poles, and increased cloud cover associated with large scale weather activity.
0 Regions of dense-cloud cover have higher albedo values.
0 Albedo values for any region vary seasonally, primarily because of changes in cloudi- ness, vegetation, and snow and ice cover.
2.2.2 Long Wave Radiation
Long wave radiation is principally influenced by the temperature of the Earth’s surface and the amount of cloud cover. A warmer region of the Earth’s surface will emit more radiation than a colder area. Increasing cloud cover tends to lower LWR by absorbing radiation upwelling from the generally warmer Earth’s surface and emitting according to the colder cloud-top temperatures. In the absence of clouds, air temperature and moisture
3
-
0
C 0 U 0
0 PL
0 0
I-
+
- - - c
-
0
C 0 U W
0 CIC
0 C 0
3
+
- L
L
.- c
+ c VI .- D
6 - 3 m 4
u) C 3 n wl
x
m
E 3.
E 2 3 .
m .- L
c c W
0 U v)
P 5 2 7)
0 Y U 0
0 n
E? _1
VI C .- 0" m L
c 0)
2
0 U
7)
0
-
3 e ln
4
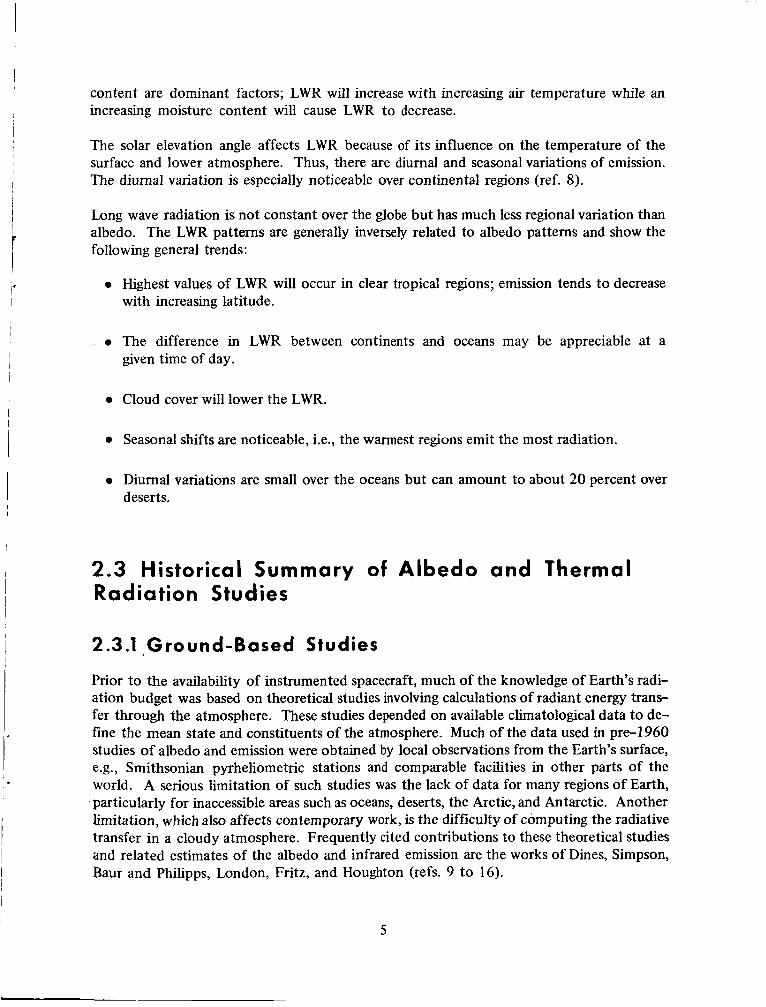
I content are dominant factors; LWR will increase with increasing air temperature while an increasing moisture content will cause LWR to decrease.
The solar elevation angle affects LWR because of its influence on the temperature of the surface and lower atmosphere. Thus, there are diurnal and seasonal variations of emission. The diurnal variation is especially noticeable over continental regions (ref. 8).
Long wave radiation is not constant over the globe but has much less regional variation than albedo. The LWR patterns are generally inversely related to albedo patterns and show the following general trends:
Highest values of LWR will occur in clear tropical regions; emission tends to decrease with increasing latitude.
The difference in LWR between continents and oceans may be appreciable at a given time of day.
Cloud cover will lower the LWR.
Seasonal shifts are noticeable, i.e., the warmest regions emit the most radiation.
Diurnal variations are small over the oceans but can amount to about 20 percent over deserts.
2.3 Historical Summary of Albedo and Thermal Radiation Studies
2.3.1 Ground-Based Studies
Prior to the availability of instrumented spacecraft, much of the knowledge of Earth's radi- ation budget was based on theoretical studies involving calculations of radiant energy trans- fer through the atmosphere. These studies depended on available climatological data to d e fine the mean state and constituents of the atmosphere. Much of the data used in pre- 1960 studies of albedo and emission were obtained by local observations from the Earth's surface, e.g., Smithsonian pyrheliometric stations and comparable facilities in other parts of the world. A serious limitation of such studies was the lack of data for many regions of Earth, particularly for inaccessible areas such as oceans, deserts, the Arctic, and Antarctic. Another limitation, which also affects contemporary work, is the difficulty of computing the radiative transfer in a cloudy atmosphere. Frequently cited contributions to these theoretical studies and related estimates of the albedo and infrared emission are the works of Dines, Simpson, Baur and Philipps, London, Fritz, and Houghton (refs. 9 to 16).
5
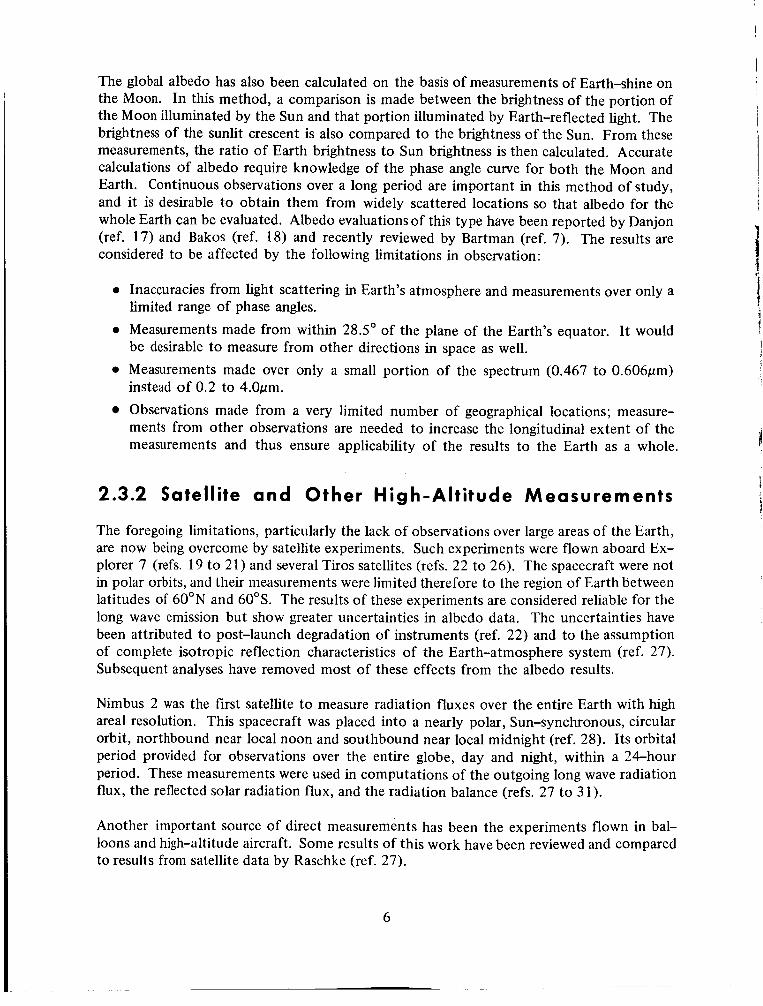
The global albedo has also been calculated on the basis of measurements of Earth-shine on the Moon. In this method, a comparison is made between the brightness of the portion of the Moon illuminated by the Sun and that portion illuminated by Earth-reflected light. The brightness of the sunlit crescent is also compared to the brightness of the Sun. From these measurements, the ratio of Earth brightness to Sun brightness is then calculated. Accurate calculations of albedo require knowledge of the phase angle curve for both the Moon and Earth. Continuous observations over a long period are important in this method of study, and it is desirable to obtain them from widely scattered locations so that albedo for the whole Earth can be evaluated. Albedo evaluations of this type have been reported by Danjon (ref. 17) and Bakos (ref. 18) and recently reviewed by Bartman (ref, 7). The results are considered to be affected by the following limitations in observation:
0 Inaccuracies from light scattering in Earth's atmosphere and measurements over only a limited range of phase angles.
0 Measurements made from within 28.5' of the plane of the Earth's equator. It would be desirable to measure from other directions in space as well.
0 Measurements made over only a small portion of the spectrum (0.467 to 0.606pm) instead of 0.2 to 4.Opm. Observations made from a very limited number of geographical locations; measure- ments from other observations are needed to increase the longitudinal extent of the measurements and thus ensure applicability of the results to the Earth as a whole.
2.3.2 Satellite and Other High-Altitude Measurements
The foregoing limitations, particularly the lack of observations over large areas of the Earth, are now being overcome by satellite experiments. Such experiments were flown aboard Ex- plorer 7 (refs. 19 to 21) and several Tiros satellites (refs, 22 to 26). The spacecraft were not in polar orbits, and their measurements were limited therefore to the region of Earth between latitudes of 60"N and 60"s. The results of these experiments are considered reliable for the long wave emission but show greater uncertainties in albedo data. The uncertainties have been attributed to post-launch degradation of instruments (ref. 22) and to the assumption of complete isotropic reflection characteristics of the Earth-atmosphere system (ref. 27). Subsequent analyses have removed most of these effects from the albedo results.
Nimbus 2 was the first satellite to measure radiation fluxes over the entire Earth with high areal resolution. This spacecraft was placed into a nearly polar, Sun-synchronous, circular orbit, northbound near local noon and southbound near local midnight (ref. 28). Its orbital period provided for observations over the entire globe, day and night, within a 24-hour period. These measurements were used in computations of the outgoing long wave radiation flux, the reflected solar radiation flux, and the radiation balance (refs. 27 to 3 1).
Another important source of direct measurements has beell the experiments flown in bal- loons and high-altitude aircraft. Some results of this work have been reviewed and compared to results from satellite data by Raschke (ref. 27).
6
2.3.3 Interpretation of Experimental Results
I' 1
The collections of data by the foregoing methods and the associated calculations have all contributed to the present knowledge of Earth's albedo and radiative emission. However, the many attempts to obtain precisely defined iralues for these radiative fluxes have produced a considerable range of results.
Bartman (ref. 7), Raschke (ref. 271, Vonder Haar (ref. 8), and others, who have reviewed and compared various studies of albedo with their own works, cite the differences in source mat- erial and assumptions concerning the optical properties of the Earth-atmosphere system as the major causes for the dispersion of results. Bartman reviewed the problems of obtaining anistropic models of Earth for albedo studies with beam radiance measurements and de- veloped a mathematical model of the geometrical-physical aspects of Earth. However, there is no generally accepted model which includes all of the geometrical-physical and the geographical-meteorological aspects pertinent to a complete treatment of Earth albedo.
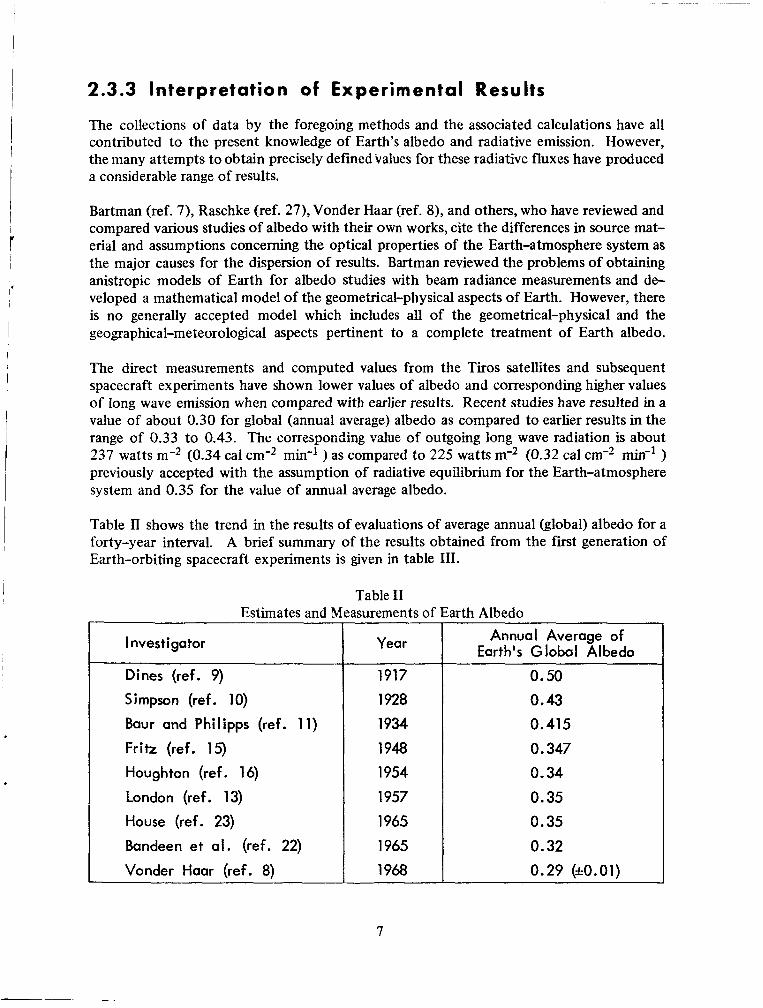
The direct measurements and computed values from the Tiros satellites and subsequent spacecraft experiments have shown lower values of albedo and corresponding higher values of long wave emission when compared with earlier results. Recent studies have resulted in a value of about 0.30 for global (annual average) albedo as compared to earlier results in the range of 0.33 to 0.43. The corresponding value of outgoing long wave radiation is about 237 watts m-2 (0.34 cal cm-2 min-l ) as compared to 225 watts m-2 (0.32 cal cm-2 min-' ) previously accepted with the assumption of radiative equilibrium for the Earth-atmosphere system and 0.35 for the value of annual average albedo.
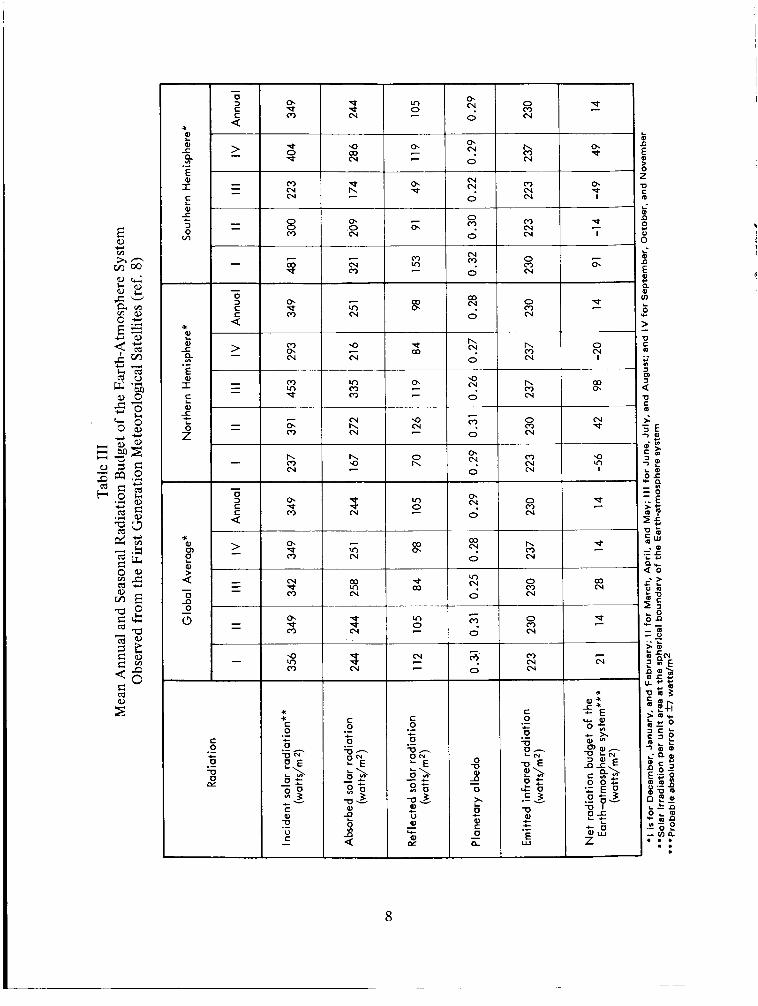
Table I1 shows the trend in the results of evaluations of average annual (global) albedo for a forty-year interval. A brief summary of the results obtained from the first generation of Earth-orbiting spacecraft experiments is given in table 111.
Table I1 Estimates and Measurements of Earth Albedo
I 1 Investigator
Dines (ref. 9) Simpson (ref. 10) Baur and Phi iipps (ref. 11) Fri tz (ref. 15) Houghton (ref. 16) London (ref. 13) House (ref. 23) Bandeen et al. (ref. 22) Vonder Haar (ref. 8)
Year
1917 1928 1 934 1948 1954 1957 1965 1965 1968
Annual Average of Earth's Global Albedo
0.50 0.43 0.415 0.347 0.34 0.35 0.35 0.32 0.29 (kO.01)
7
9 0 (3 N
0. cv. w In
3 0 0
I\ 0. c) d cv
0.
0
N
0
cv.
cv.
0. 7
9 $3 7
2 (3 0. c.l cv P
0. w 7
0.
sl
c) N cv
8 (3
5 0.
3 0
(3 0. c.l
" I f N I\
0 h! 0 cv I \ '
(3 c.l
I\ (3 cv
W 0. z
0
(3 u, w q = 0.
(3
7
0. (3
7
1 0
a cv
9 u)
I\ (3 e4
a i r : c
0.
0 h! (3
N N
0.
sl 0.
0 h! a cv
f
h (3 N
0.
sl 03 N
0
u,
0 cv. 0
(3 cv 02 N
cv sl 0.
sl c
1 0
0 (3 N
9
7
cv 9 u) CY
$ 1 " cv c 5 0
(3 cv N
* 5:
c 0
-0 Q, + + .- E
w
I
8
2.4 Spectral Content of Albedo and long Wave Radiation Ninety-nine percent of the incident solar radiation is within the spectral range of 0.2 to 4pm. The ultraviolet waves below 0.3pm (1.2 percent of total energy) are absorbed in the outer atmospheric layers, primarily by ozone. Of the remaining energy, about 30 percent is reflected back into space, and about 70 percent is absorbed by the Earth and its atmosphere on a global average basis. The distribution of energy among these processes varies consider- ably from region to region because of differences in reflection and absorption characteristics of target surfaces.
2.4.1 Albedo Spectra
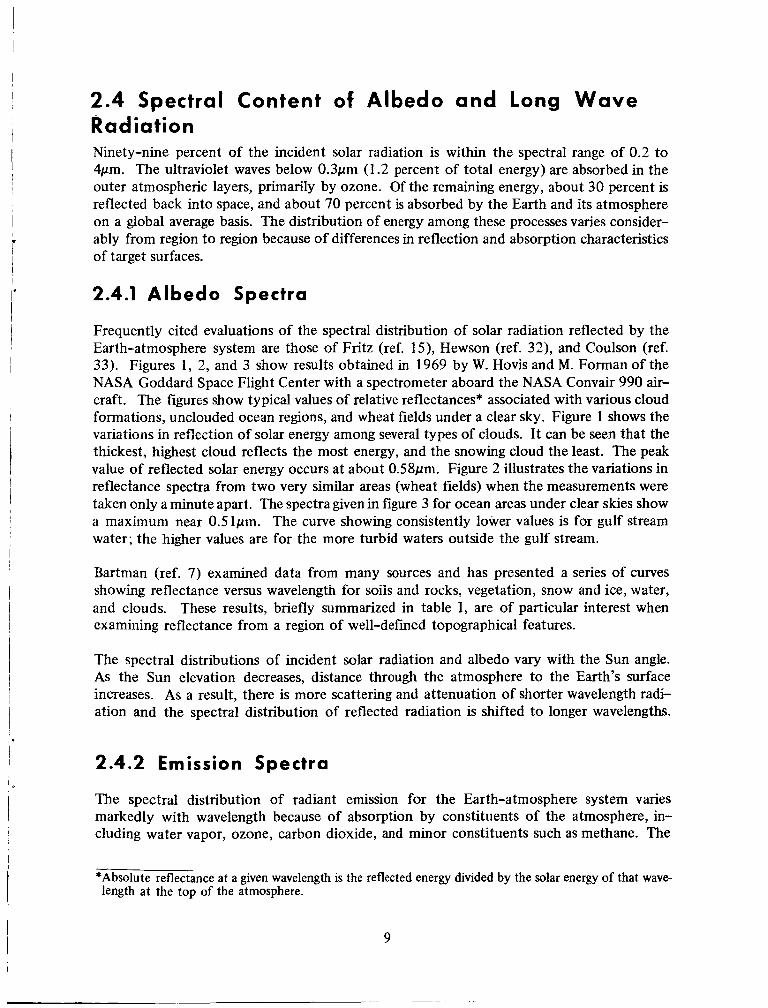
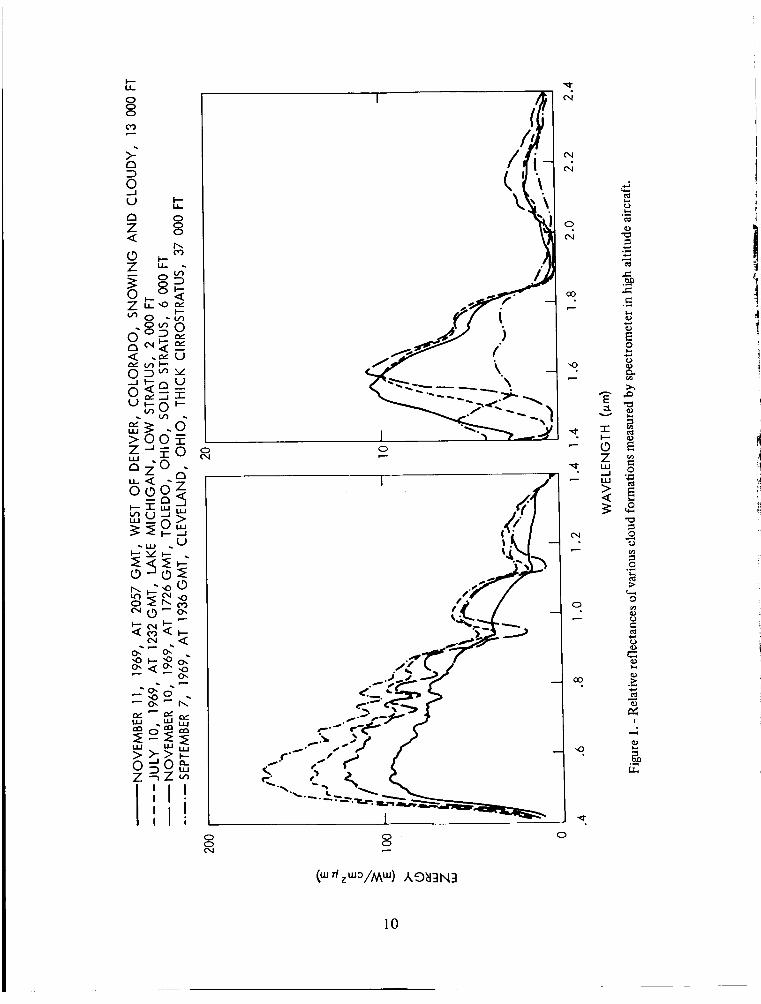
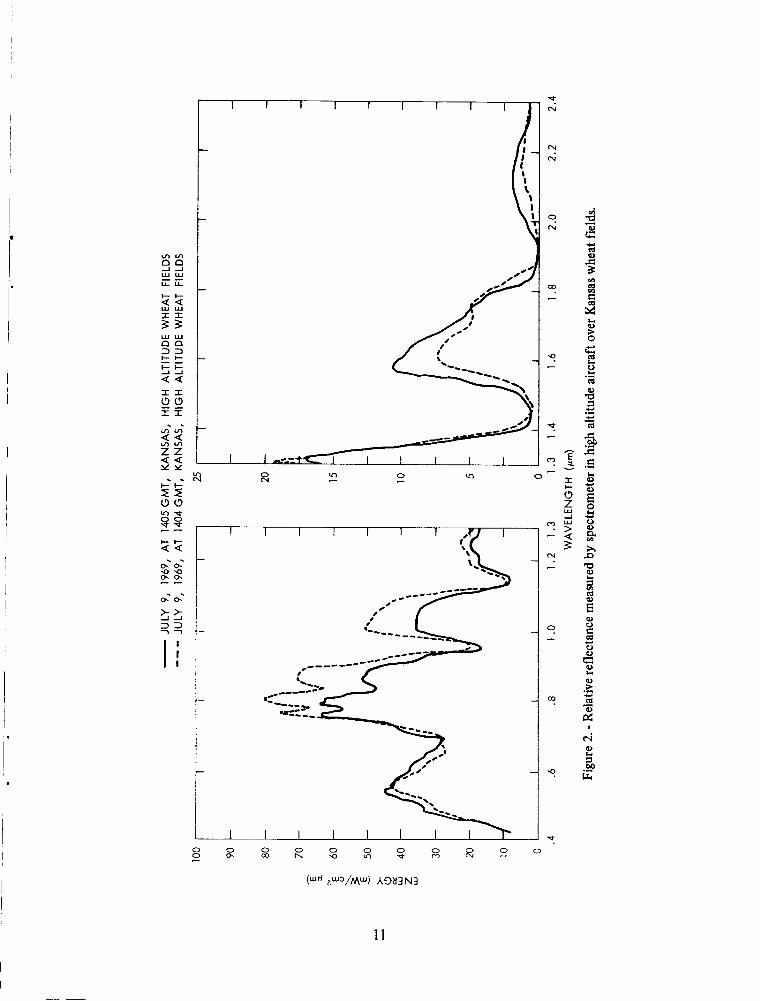
Frequently cited evaluations of the spectral distribution of solar radiation reflected by the Earth-atmosphere system are those of Fritz (ref. 15), Hewson (ref. 32), and Coulson (ref. 33). Figures 1, 2, and 3 show results obtained in 1969 by W. Hovis and M. Forman of the NASA Goddard Space Flight Center with a spectrometer aboard the NASA Convair 990 air- craft. The figures show typical values of relative reflectances* associated with various cloud formations, unclouded ocean regions, and wheat fields under a clear sky. Figure 1 shows the variations in reflection of solar energy among several types of clouds. It can be seen that the thickest, highest cloud reflects the most energy, and the snowing cloud the least. The peak value of reflected solar energy occurs at about 0.58pm. Figure 2 illustrates the variations in reflectance spectra from two very similar areas (wheat fields) when the measurements were taken only a minute apart. The spectra given in figure 3 for ocean areas under clear skies show a maximum near 0.51pm. The curve showing consistently lower values is for gulf stream water; the higher values are for the more turbid waters outside the gulf stream.
Bartman (ref. 7) examined data from many sources and has presented a series of curves showing reflectance versus wavelength for soils and rocks, vegetation, snow and ice, water, and clouds. These results, briefly summarized in table I, are of particular interest when examining reflectance from a region of well-defined topographical features.
The spectral distributions of incident solar radiation and albedo vary with the Sun angle. AS the Sun elevation decreases, distance through the atmosphere to the Earth's surface increases. As a result, there is more scattering and attenuation of shorter wavelength radi- ation and the spectral distribution of reflected radiation is shifted to longer wavelengths.
2.4.2 Emission Spectra
The spectral distribution of radiant emission for the Earth-atmosphere system varies markedly with wavelength because of absorption by constituents of the atmosphere, in- cluding water vapor, ozone, carbon dioxide, and minor constituents such as methane. The
*Absolute reflectance at a given wavelength is the reflected energy divided by the solar energy of that wave- length at the top of the atmosphere.
9
10
11
0
/.
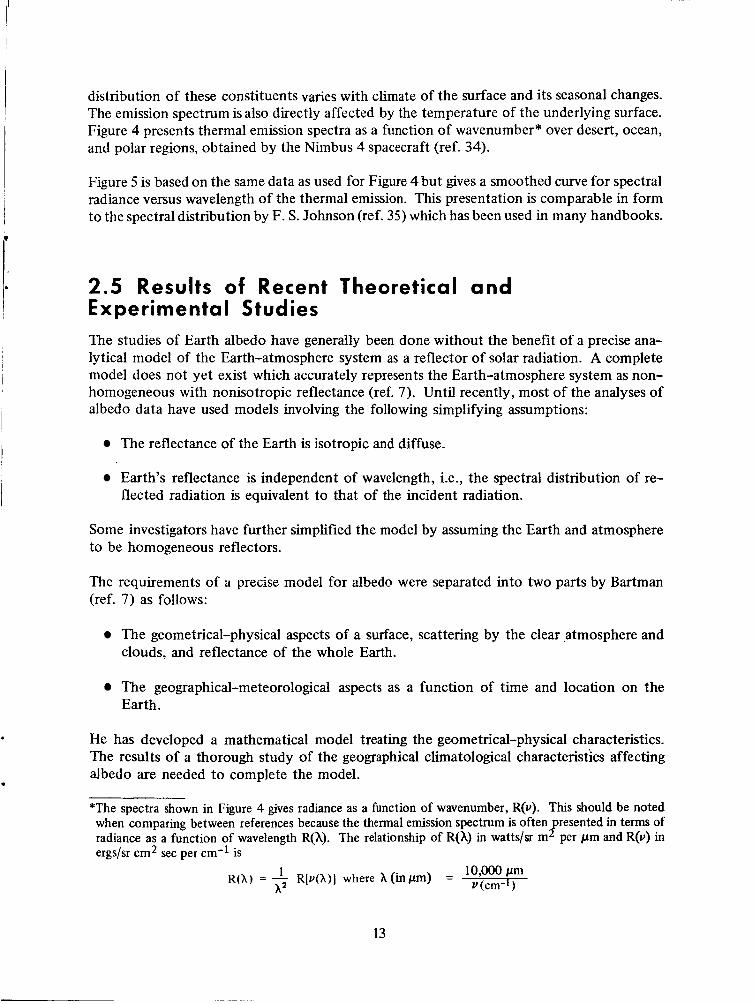
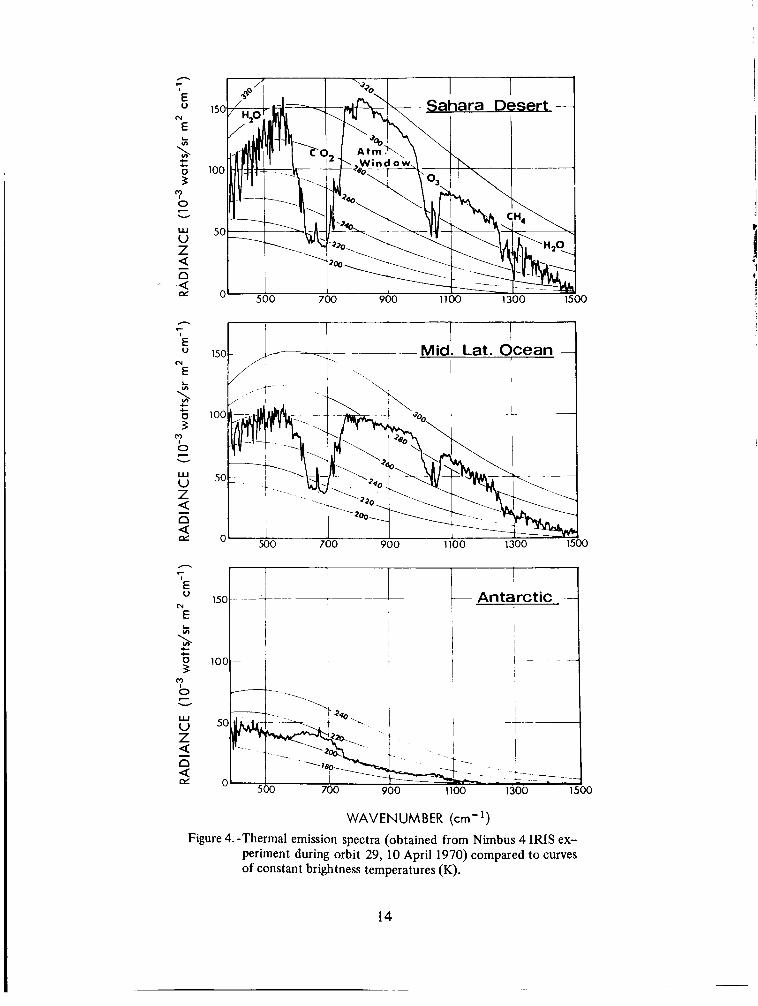
distribution of these constituents varies with climate of the surface and its seasonal changes. The emission spectrum is also directly affected by the temperature of the underlying surface. Figure 4 presents thermal emission spectra as a function of wavenumber* over desert, ocean, and polar regions, obtained by the Nimbus 4 spacecraft (ref. 34).
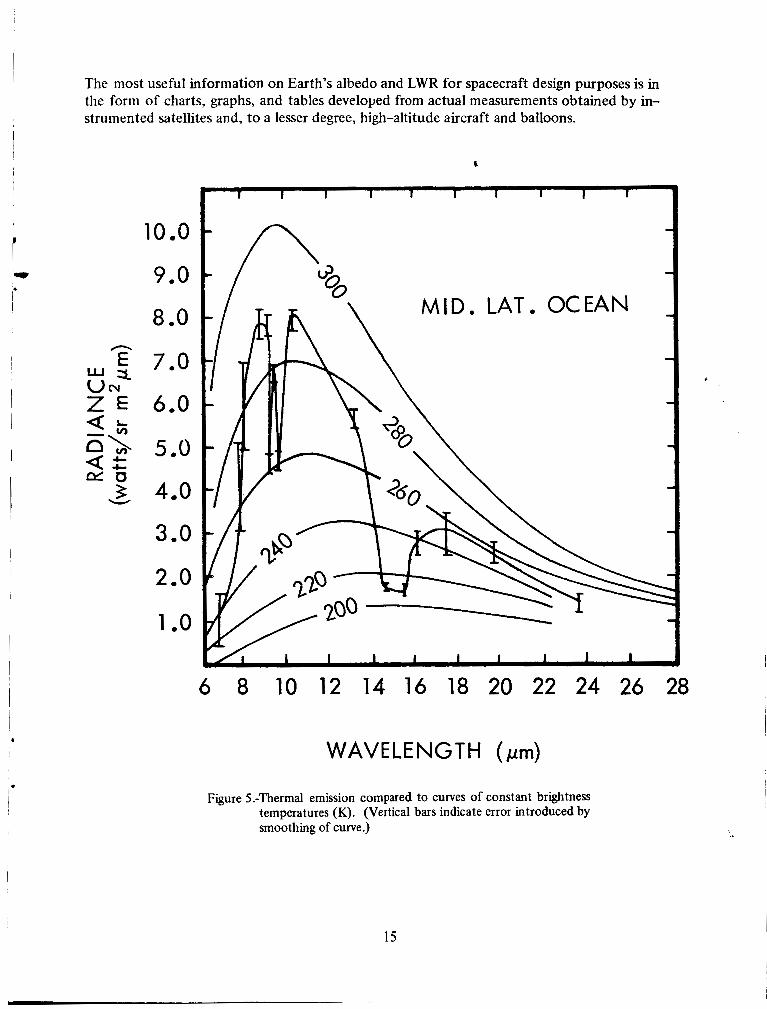
Figure 5 is based on the same data as used for Figure 4 but gives a smoothed curve for spectral radiance versus wavelength of the thermal emission. This presentation is comparable in form to the spectral distribution by F. S. Johnson (ref. 35) which has been used in many handbooks.
2.5 Results of Recent Theoretical and Experimenta I Studies The studies of Earth albedo have generally been done without the benefit of a precise ana- lytical model of the Earth-atmosphere system as a reflector of solar radiation. A complete model does not yet exist which accurately represents the Earth-atmosphere system as non- homogeneous with nonisotropic reflectance (ref. 7). Until recently, most of the analyses of albedo data have used models involving the following simplifying assumptions:
The reflectance of the Earth is isotropic and diffuse.
Earth’s reflectance is independent of wavelength, i.e., the spectral distribution of re- flected radiation is equivalent to that of the incident radiation.
Some investigators have further simplified the model by assuming the Earth and atmosphere to be homogeneous reflectors.
The requirements of a precise model for albedo were separated into two parts by Bartman (ref. 7) as follows:
The geometrical-physical aspects of a surface, scattering by the clear ,atmosphere and clouds, and reflectance of the whole Earth.
The geographical-meteorological aspects as a function of time and location on the Earth.
He has developed a mathematical model treating the geometrical-physical characteristics. The results of a thorough study of the geographical climatological characteristics affecting albedo are needed to complete the model.
*The spectra shown in Figure 4 gives radiance as a function of wavenumber, R(v). This should be noted when comparing between references because the thermal emission spectrum is often presented in terms of radiance as a function of wavelength R(X). The relationship of R(X) in watts/= m2 per pm and R(v) in ergs/sr cm* sec per cm-1 is
1 10,000 pm h2
R(X) = - R[v(X)] where X (in pm) = v(cm-l)
13
500 700 900 1100 1300 It
--.. i
I -Antarctic -
WAVENUMBER (cm-l)
Figure 4. -Thermal emission spectra (obtained from Nimbus 4 IRIS ex- periment during orbit 29, 10 April 1970) compared to curves of constant brightness temperatures (K).
14
4
i
The most useful information on Earth’s albedo and LWR for spacecraft design purposes is in the form of charts, graphs, and tables developed from actual measurements obtained by in- strumented satellites and, to a lesser degree, high-altitude aircraft and balloons.
10.0
9.0
8 .O
7.0
6.0
5 00
4.0
3.0
2.0
1.0
I I I I I I I I 1 I
MID. LAT. OCEAN
1 1 I I 1 1 I 1 I
6 8 10 12 14 16 18 20 22 24 26 28
WAVELENGTH (pm)
Figure 5.-Thermal emission compared to curves of constant brightness temperatures (K). (Vertical bars indicate error introduced by smoothing of curve.)
15
2.5.1 Mean Values of Albedo
0.60 - -
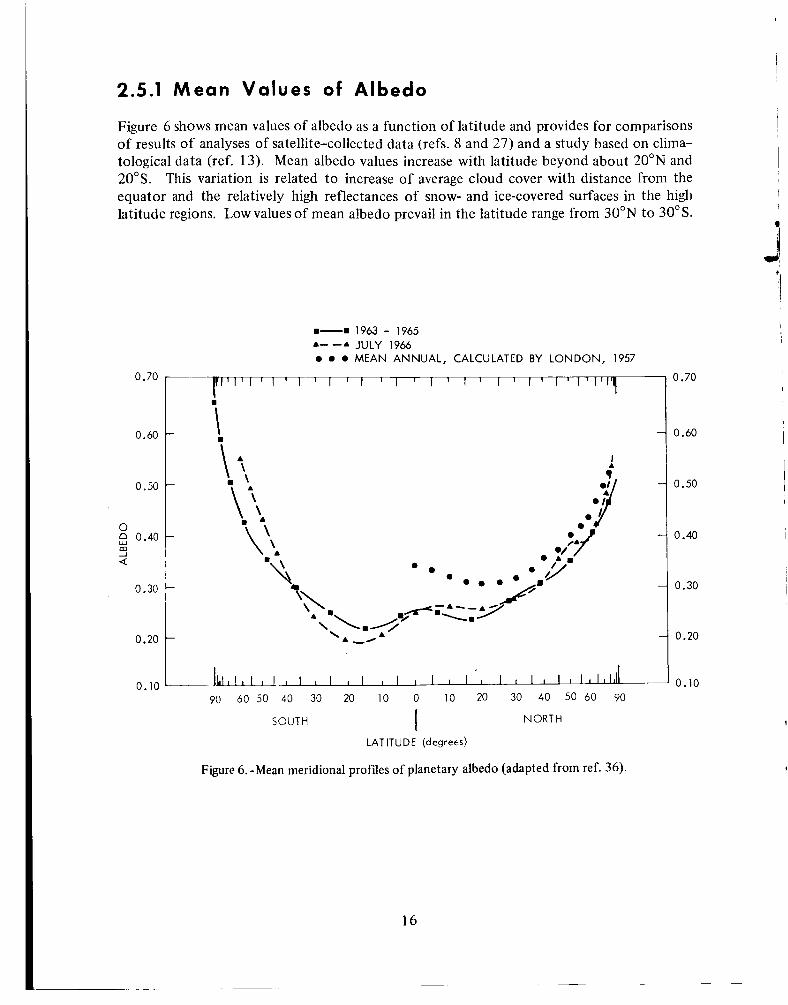
Figure 6 shows mean values of albedo as a function of latitude and provides for comparisons of results of analyses of satellite-collected data (refs. 8 and 27) and a study based on clima- tological data (ref. 13). Mean albedo values increase with latitude beyond about 20"N and 20"s. This variation is related to increase of average cloud cover with distance from the equator and the relatively high reflectances of snow- and ice-covered surfaces in the high latitude regions. Low values of mean albedo prevail in the latitude range from 30"N to 30"s.
0.60
ri i
0.50
0
m E) 0.40
0.30
0.20
0.10 I I b l I I I I I I I I I I I I l I , I I I l I I l I I I L L L L A 0.10 90 60 50 40 30 20 10 0 10 20 30 40 50 60 90
NORTH I SOUTH
LATITUDE (degrees)
Figure 6. -Mean meridional profiles of planetary albedo (adapted from ref. 36).
16
ir c
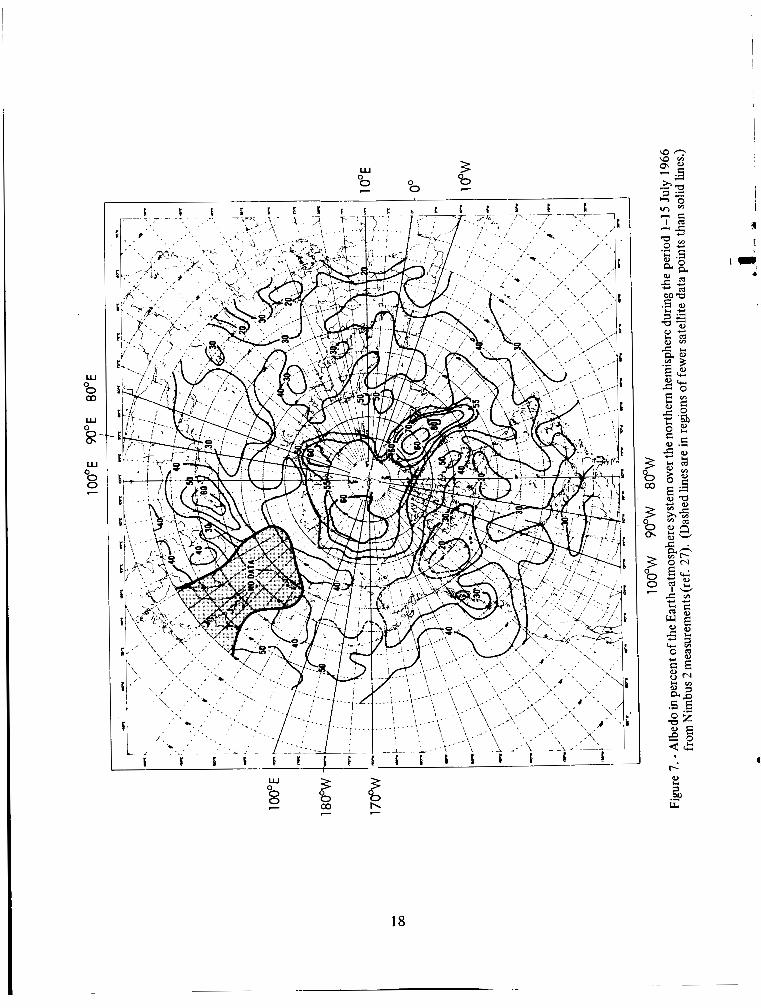
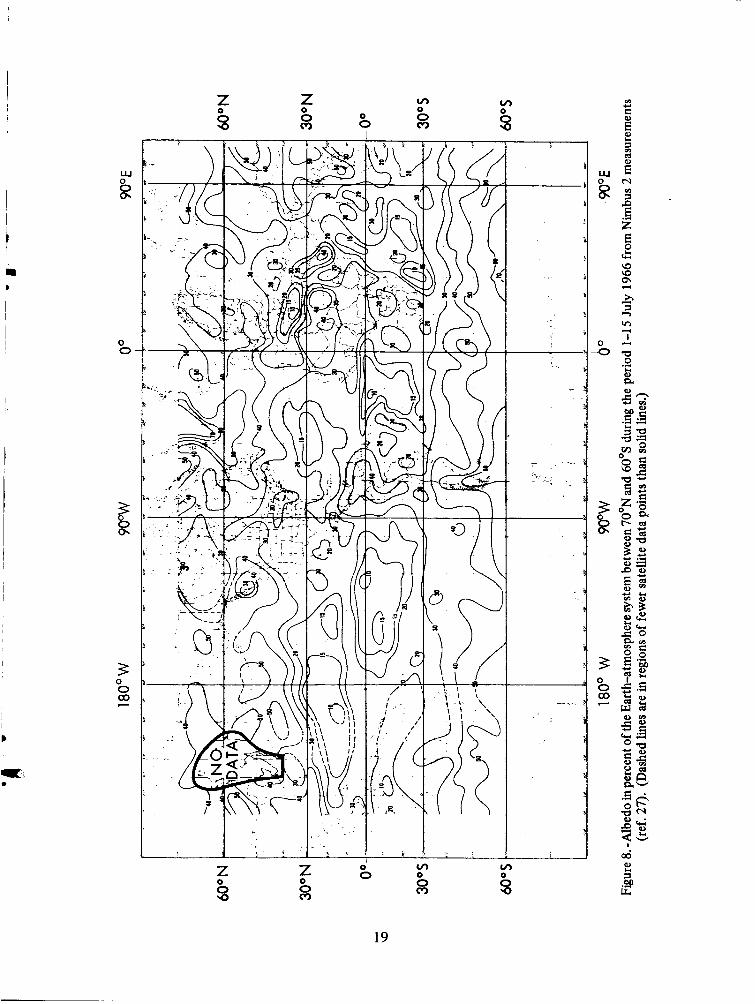
Figures 7 and 8 show geographical distributions of average values of albedo for the period 1 to 15 July 1966. These figures are based on Nimbus 2 data for one-half the period used for Raschke's curve in Figure 6. Similar charts of Earth's albedo for various periods ranging from 15 days to more than 40 months are available (refs. 8 and 27). These charts show that low albedo values generally prevail for ocean regions under clear skies. The mean albedo of the Antarctic region always exceeds 0.60, whereas in the northern polar region the albedo ranges from 0.45 to 0.60 (ref. 8).
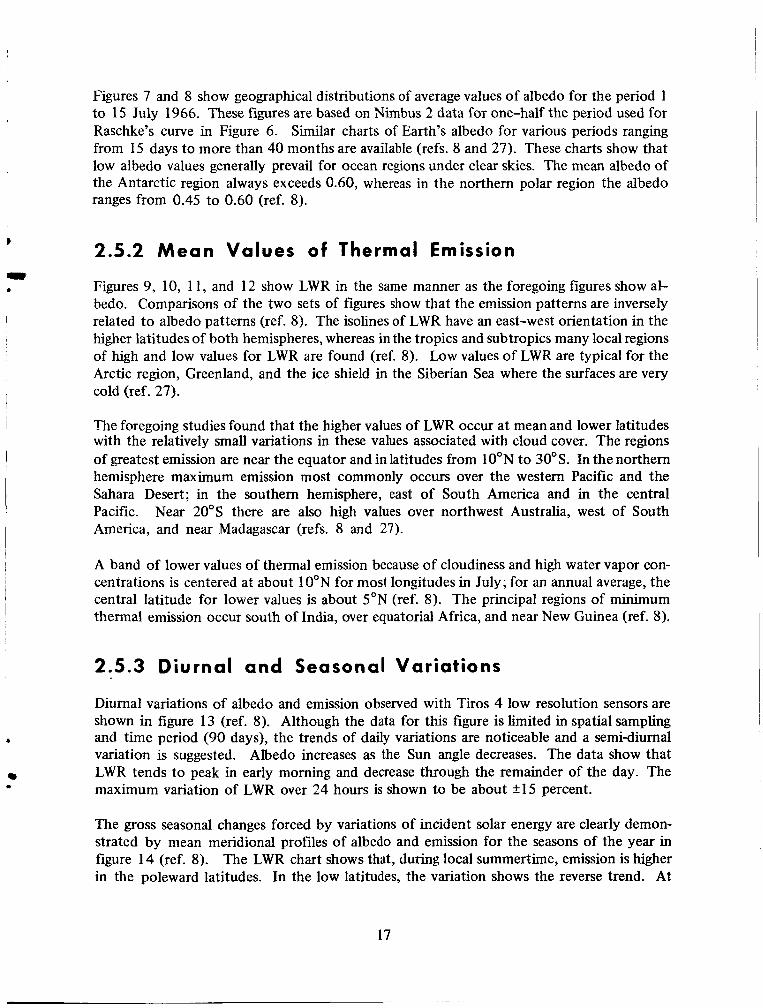
2.5.2 M e a n Values of Thermal Emission
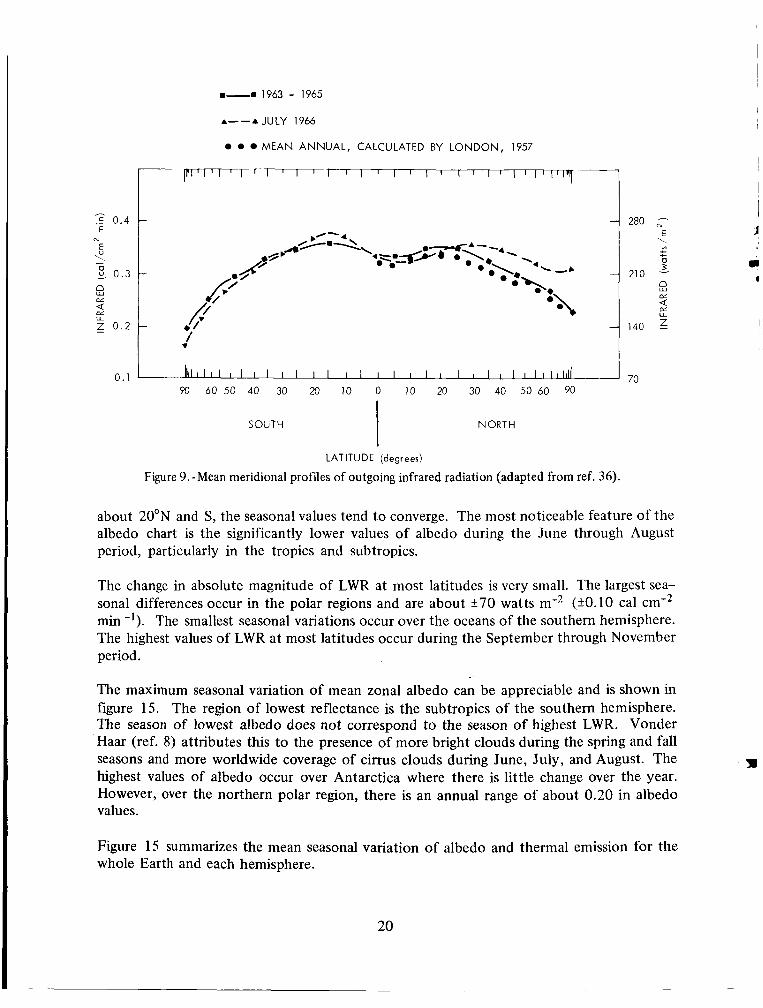
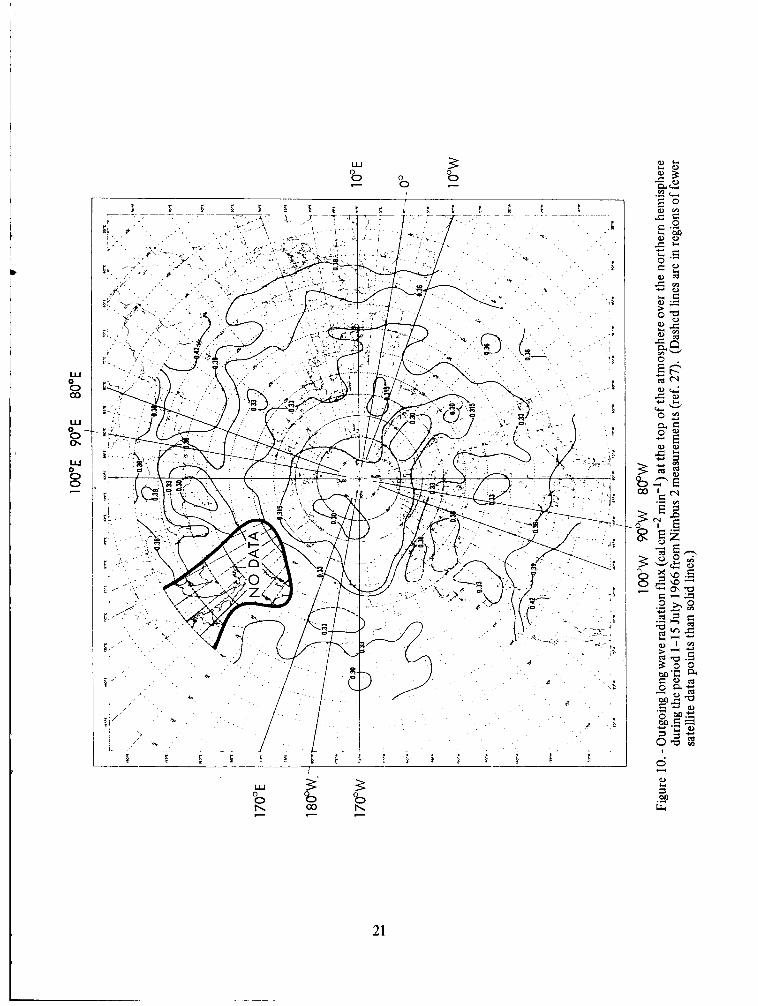
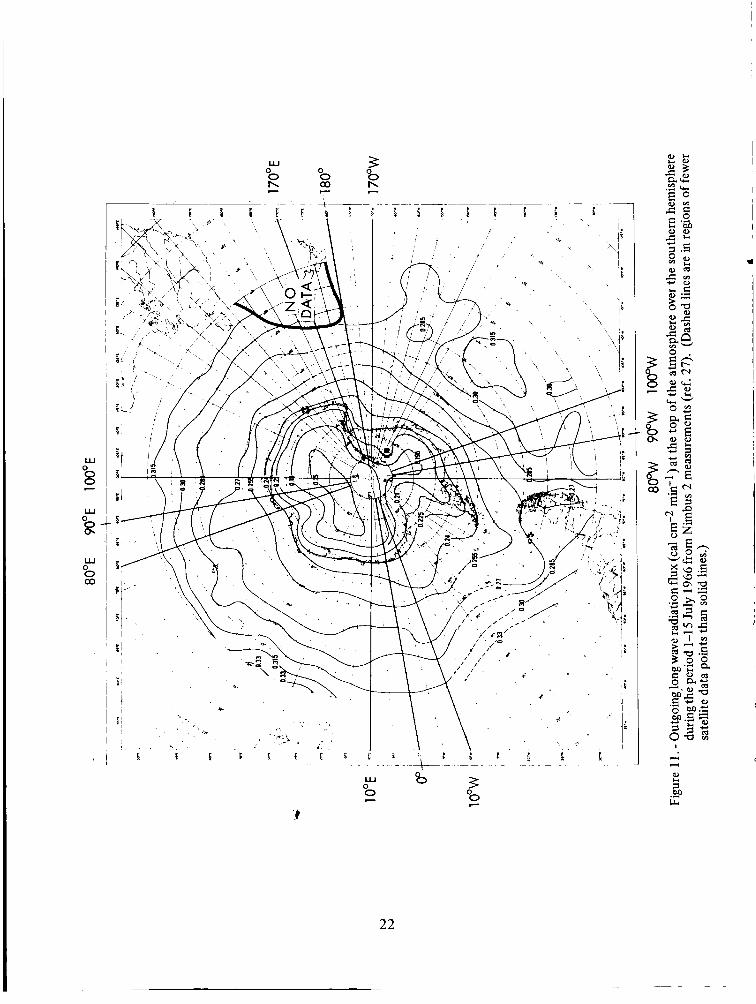
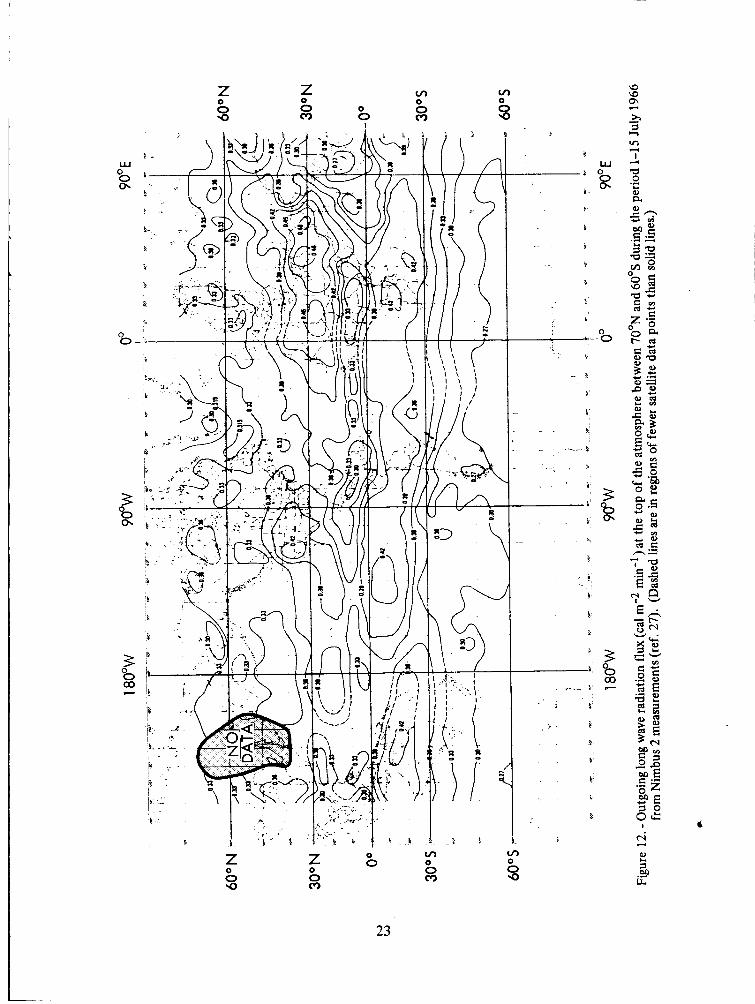
Figures 9, 10, 11, and 12 show LWR in the same manner as the foregoing figures show al- bedo. Comparisons of the two sets of figures show that the emission patterns are inversely related to albedo patterns (ref. 8). The isolines of LWR have an east-west orientation in the higher latitudes of both hemispheres, whereas in the tropics and subtropics many local regions of high and low values for LWR are found (ref. 8). Low values of LWR are typical for the Arctic region, Greenland, and the ice shield in the Siberian Sea where the surfaces are very cold (ref. 27).
The foregoing studies found that the higher values of LWR occur at mean and lower latitudes with the relatively small variations in these values associated with cloud cover. The regions of greatest emission are near the equator and in latitudes from 10"N to 30"s. In thenorthern hemisphere maximum emission most commonly occurs over the western Pacific and the Sahara Desert; in the southern hemisphere, east of South America and in the central Pacific. Near 20"s there are also high values over northwest Australia, west of South America, and near Madagascar (refs. 8 and 27).
A band of lower values of thermal emission because of cloudiness and high water vapor con- centrations is centered at about 1 OoN for most longitudes in July; for an annual average, the central latitude for lower values is about 5"N (ref. 8). The principal regions of minimum thermal emission occur south of India, over equatorial Africa, and near New Guinea (ref. 8).
2.5.3 Diurnal and Seasonal Variations
b
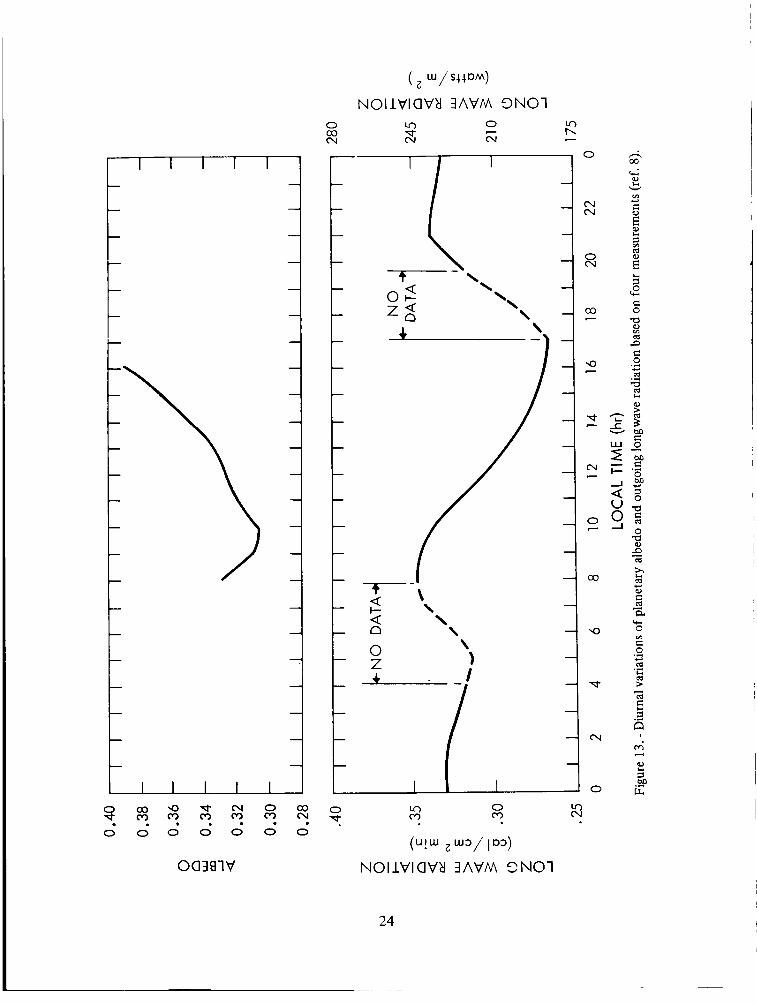
Diurnal variations of albedo and emission observed with Tiros 4 low resolution sensors are shown in figure 13 (ref. 8). Although the data for this figure is limited in spatial sampling and time period (90 days), the trends of daily variations are noticeable and a semi-diurnal variation is suggested. Albedo increases as the Sun angle decreases. The data show that LWR tends to peak in early morning and decrease through the remainder of the day. The maximum variation of LWR over 24 hours is shown to be about k15 percent.
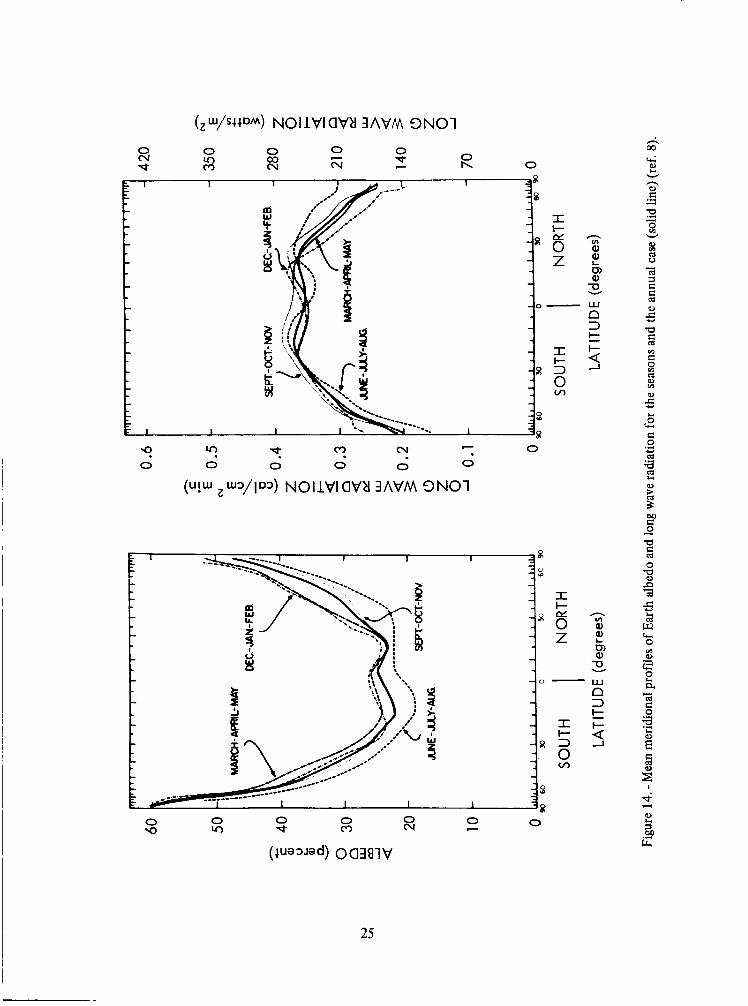
The gross seasonal changes forced by variations of incident solar energy are clearly demon- strated by mean meridional profiles of albedo and emission for the seasons of the year in figure 14 (ref. 8). The LWR chart shows that, during local summertime, emission is higher in the poleward latitudes. In the low latitudes, the variation shows the reverse trend. At
17
W 3 0 b O O 0 7 c
W
03
w 0
O 0
8-
"0 W
0 7
18
I
z 0 0 @a b
tn 0 0 @a
0 tn
0 0 @a
0 Z 0 0
@a
tn
19
m-. 1963 - 1965
A--A JULY 1966
MEAN ANNUAL, CALCULATED BY L O N D O N , 1957
p m r - r - 1 1 I I i I I I I I I 1 I 1 I 1 I I 1 1 I I I T
70 90 60 50 40 30 20 IO 0 10 20 30 40 50 60 90
0.1 I 1 1 1 1 I I I l I I I 1 I I I I I I I I 1 I I I I I I I I I I I l 1 1 1 1
SOUTH NORTH
1
I 1
LATITUDE (degrees)
Figure 9.-Mean meridional profiles of outgoing infrared radiation (adapted from ref. 36).
about 20"N and S, the seasonal values tend to converge. The most noticeable feature of the albedo chart is the significantly lower values of albedo during the June through August period, particularly in the tropics and sub tropics.
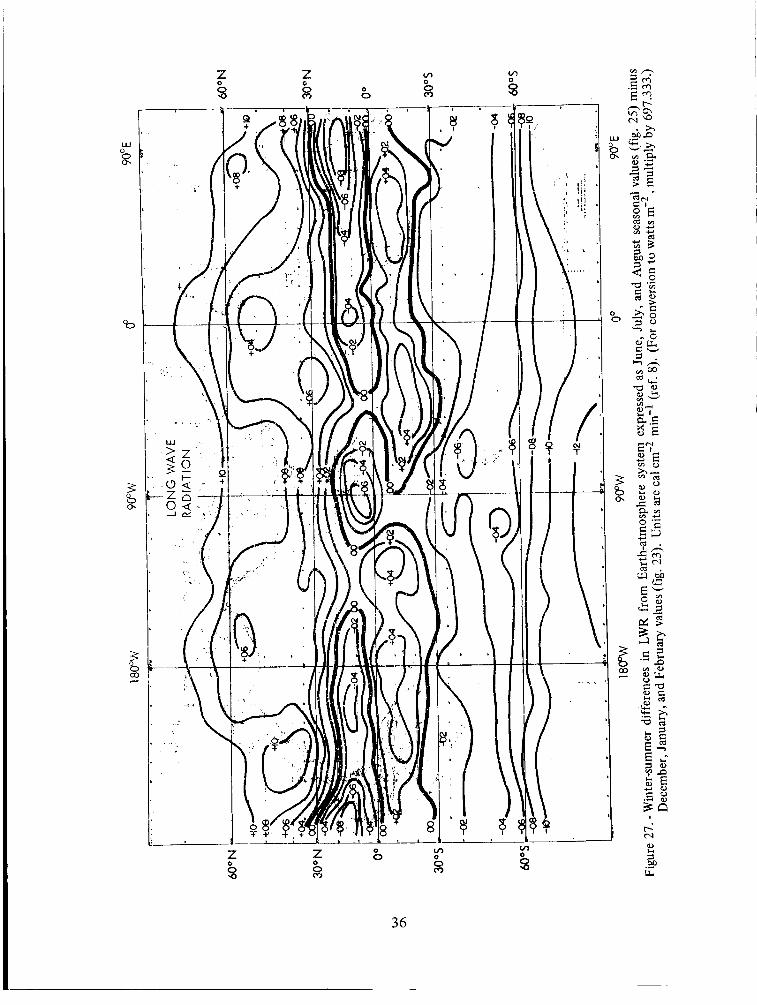
The change in absolute magnitude of LWR at most latitudes is very small. The largest sea- sonal differences occur in the polar regions and are about k70 watts m-2 (kO.10 cal cm-2 min -I). The smallest seasonal variations occur over the oceans of the southern hemisphere. The highest values of LWR at most latitudes occur during the September through November period.
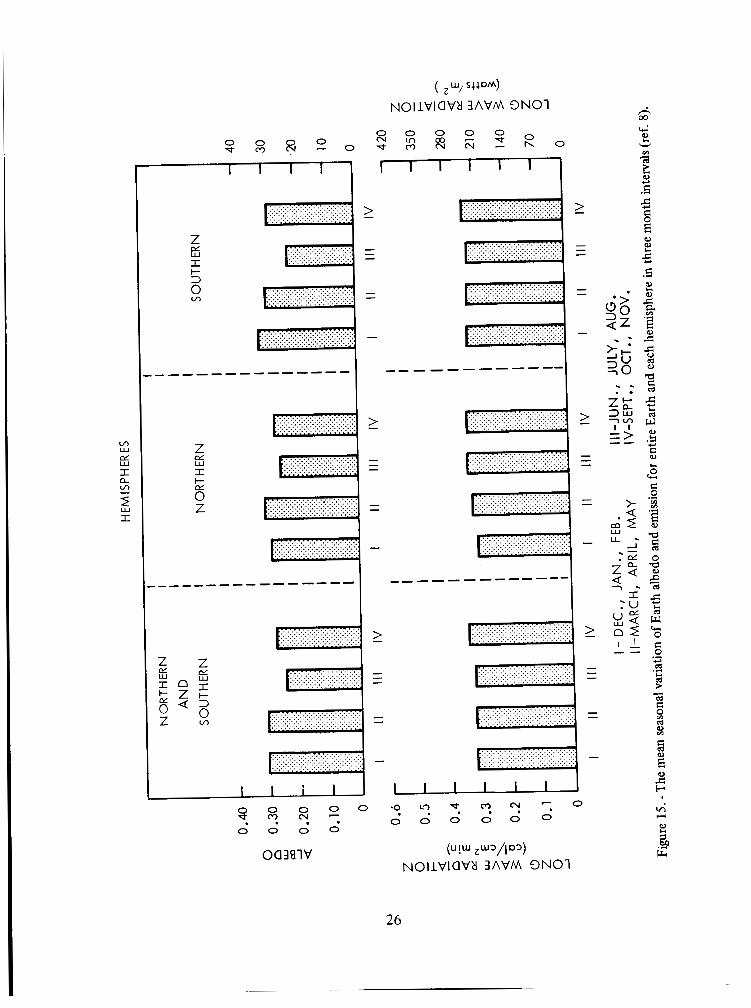
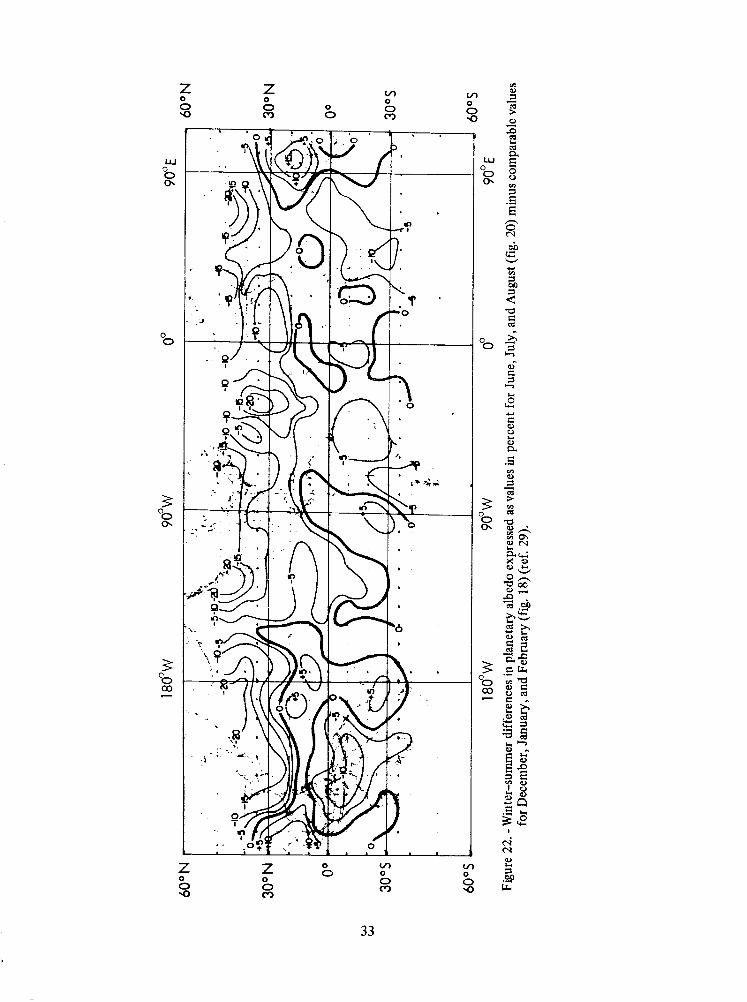
The maximum seasonal variation of mean zonal albedo can be appreciable and is shown in figure 15. The region of lowest reflectance is the subtropics of the southern hemisphere. The season of lowest albedo does not correspond to the season of highest LWR. Vonder Haar (ref. 8) attributes this to the presence of more bright clouds during the spring and fall seasons and more worldwide coverage of cirrus clouds during June, July, and August. The highest values of albedo occur over Antarctica where there is little change over the year. However, over the northern polar region, there is an annual range of about 0.20 in albedo values.
Figure 15 summarizes the mean seasonal variation of albedo and thermal emission for the whole Earth and each hemisphere.
20
W 0 0 00
W 0 - 0 0.
W 0 0 0 -
21
W 3 0 "0 OO 0 c -
22
I
1
Z 0 0 9
0 v)
0 0 c3 c 9 0
0 Z 0
23
I 24
0 hl -4-
0 1\ 0
I I-
n
8 0 z E m
6 m
h 00
3 m 3 c 4 W s 9 a
W s 2 b
a 9
25
v, w e W I 0- L” 2 w I
7
Z f5 I I-
8 Z
c e
26
2.6 Basis for Design Values
The values for albedo and outgoing LWR which have been determined on the basis of local ground-based climatological instruments require revision in view of more recent data. Wide variations in the calculated annual average values of albedo are apparent from the results shown in table 11. Satellite measurements strongly indicate average dbedo values significantly lower than previous estimates with a corresponding increase in long wave emission. Partic- ularly significant to the more precise evaluation of the annual average albedo and mean ther- mal emission have been the efforts of Bandeen, Pasternak, Halev, Strange, Raschke, Moller, and Vonder Haar (refs. 8 , 2 2 , 2 9 , 3 0 , 3 1, and 37). An annual mean of 237 watts m-2 (0.34 cal cm-2 min-' ) for long wave emission is in fair agreement with Pasternak's reevaluation of Tiros 7 data, the Nimbus 2 results, and Vonder Haar's analysis (ref. 8). An annual mean value for albedo of 0.30 k0.02 (ref. 38) is compatible with the results of these recent anal- yses and when used with the emission figure yields a reasonable thermal balance.
The largest variations from the mean values are related to geographical features of the Earth- atmosphere system. Highest values of albedo, i.e., X.60, occur over polar regions; the lowest values, i.e., <0.20, occur in the latitude range of 20"N to 20"s. The higher values of Earth emission, i.e., >244 watts m-' (0.35 cal cm-' min"), occur in this same latitude range. The lower values of LWR, i.e., <174 watts rn-' (0.25 cal cm" min-' ), are associated with the polar regions.
3. CRITERIA The quantitative descriptions of the albedo and the long wavelength emission of Earth pre- sented here should be used in the design of space vehicles, space vehicle systems, expen- ments, and instrumentation.
3.1 Global Annual Averages
As a fmt approximation, suitable for estimating the effects of Earth emission and albedo on spacecraft subsystems and elements having relatively long thermal time constants, the Earth may be treated as a uniform and diffuse (Lambertian) emitter and reflector. The mean an- nual values to be used are:
Emission: 237 +7 watts m-2 (0.34 k0.01 cal cm-2 min-l Albedo: 0.30 k0.02
These values were derived fron analyses of data acquired by spacecraft (ref. 38). It should be recognized that they were derived from albedo values that range from about 0.10 to 0.80 and from long wave radiation values ranging from about 105 to greater than 350 watts m-2 (0.15 to 0.50 cal cm-' min-') over limited geographical regions.
27
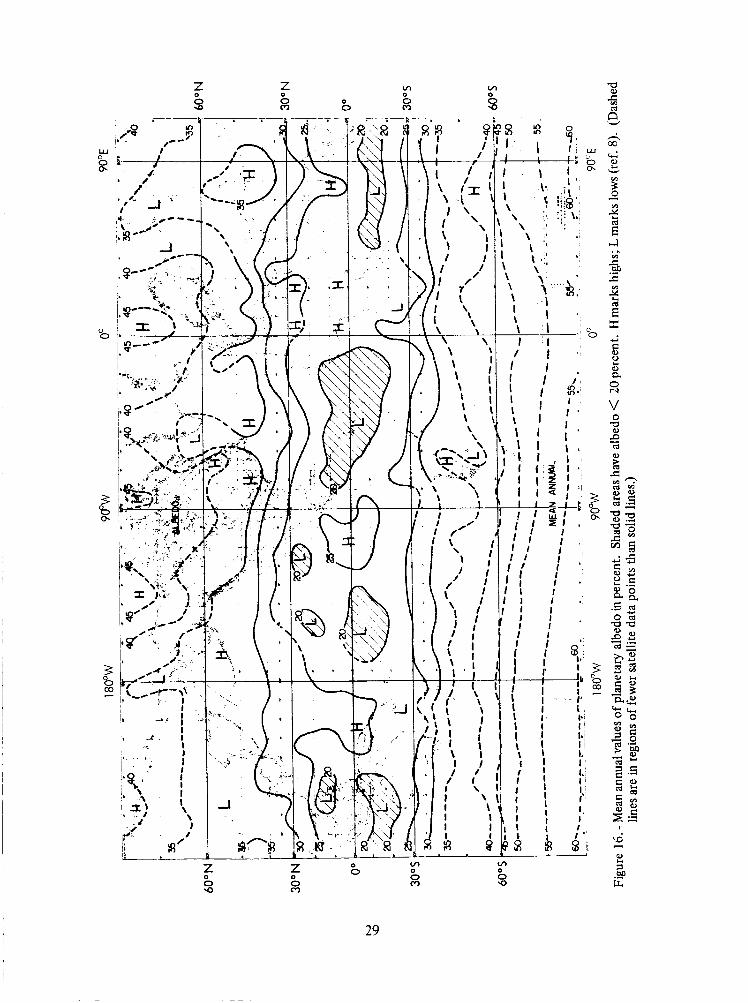
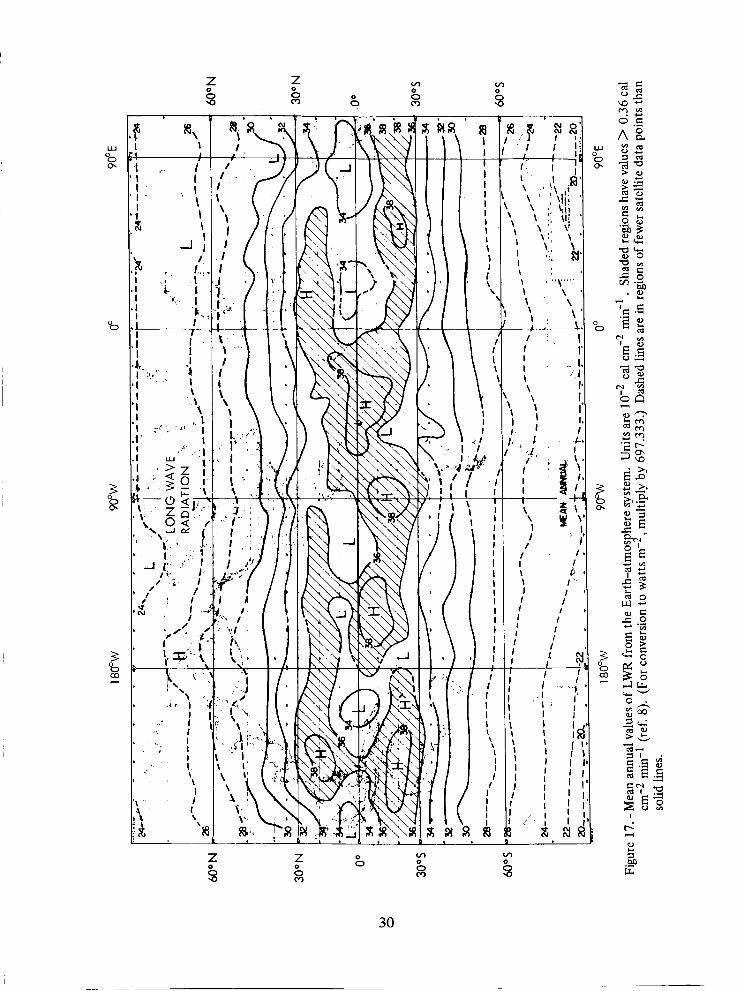
3.2 Geographical Distribution of Albedo and Emission Figures 16 and 17 show geographical distributions of mean annual values of albedo and LWR for the Earth-atmosphere system. The charts were developed using satellite data to derive average annual values over 10" x 10" latitude-longitude regions.
3.3 Temporal Variations of Albedo and Emission
3.3.1 Seasonal Variations
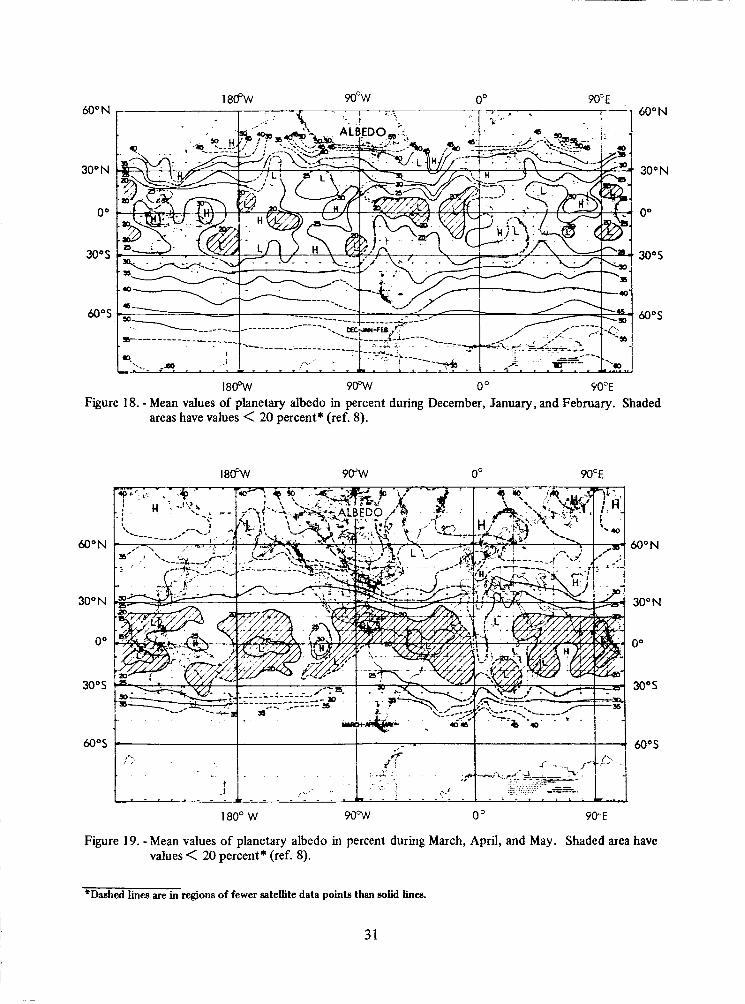
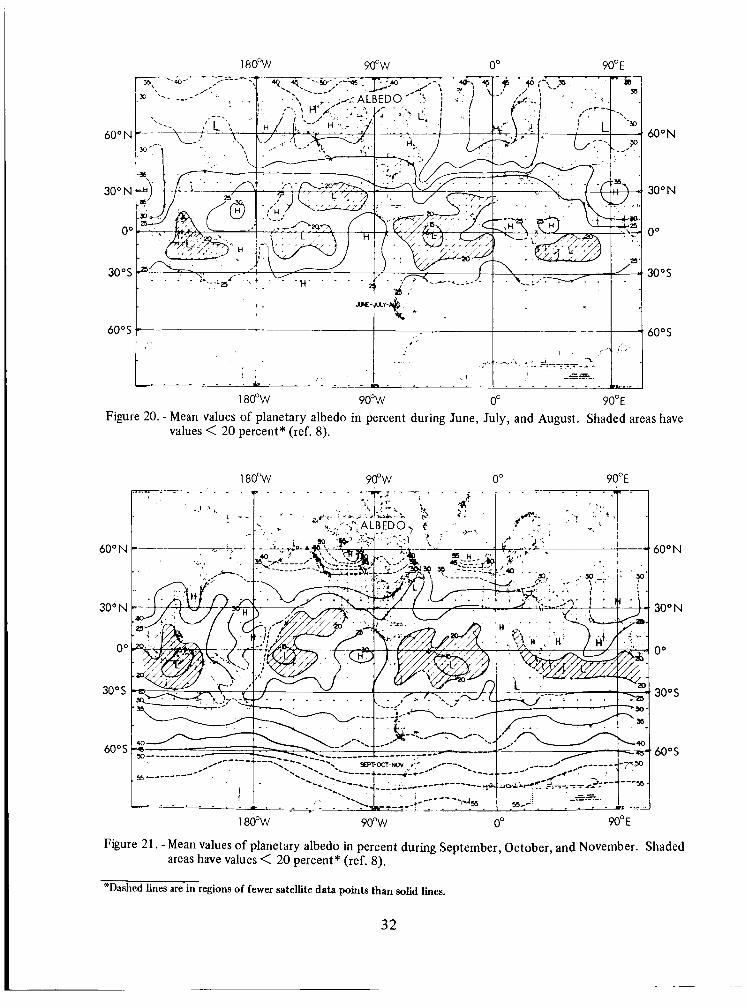
Figures 18 to 21 give the geographical distributions of mean values for albedo over the quarters of a year beginning in December, March, June and September. Figure 22 shows differences between seasonal extremes for all geographical regions.
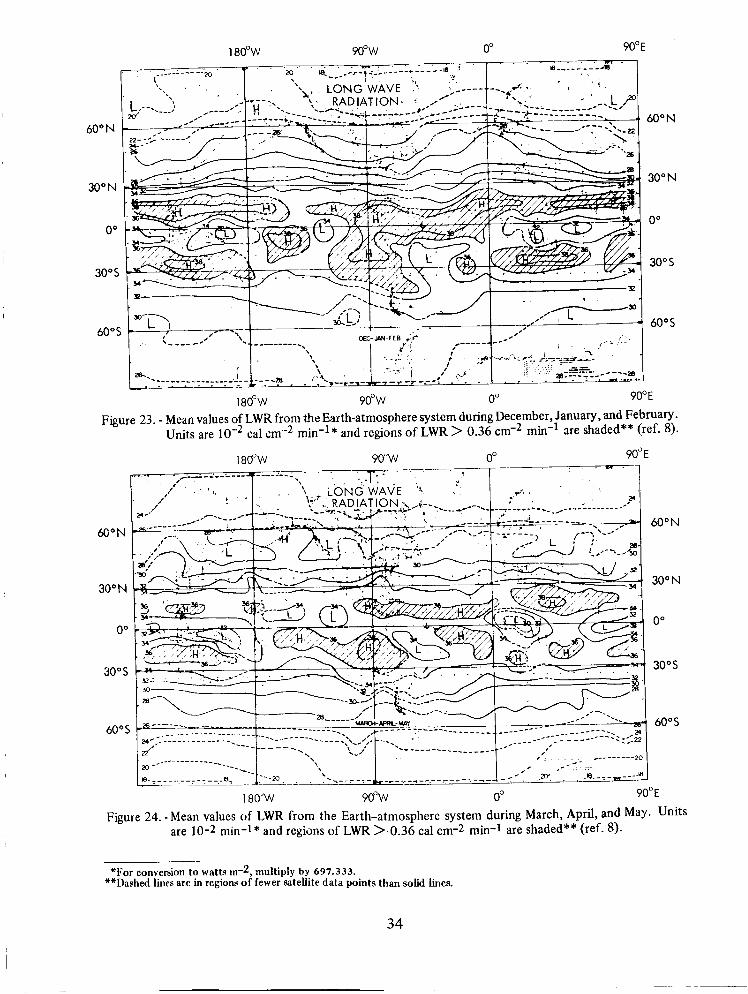
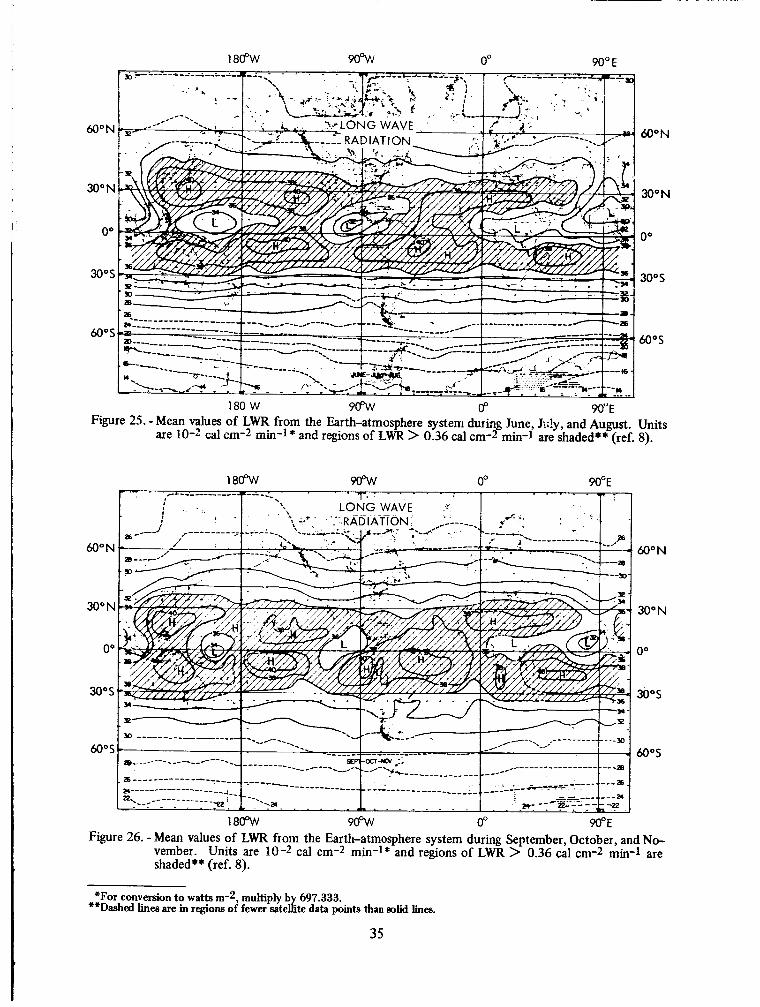
Distributions of seasonal mean values of outgoing radiation (LWR) are shown in figures 23 to 26. Figure 27 shows the difference between winter and summer values of LWR in all regions.
3.3.2 Diurnal Variations
Definitive information on diurnal variation of albedo and LWR is not available because of spatial and temporal limitations of data from first generation meteorological satellites. Independent approximations of the effects of diurnal variation on globally averaged albedo and long wave radiation data (ref. 39 and Vonder Haar and Hanson*) are in general agreement and indicate k0.04 for albedo and k28 watts inb2 (k0.04 cal cm-2 min-') for LWR.
3.4 Spectral Distributions
3.4.1 Albedo
The average spectral distributions of solar radiation reflected by the Earth-atmosphere sys- tem for a range of cloud conditions and various types of underlying surface are given in fig- ures 1 to 3. For information on reflectance versus wavelength of specific types of surfaces, see reference 7.
3.4.2 Earth Emission
The spectral distributions of LWR from Earth are shown in figures 4 and 5 .
*Vonder Haar, CH. ; and Hanson, K. J . : A Note on the Diurnal Variation of Planetary Albedo and Out- going Long Wave Radiation, 1968 (unpublished, available from T. H. Vonder Haar, Colorado State Univcrsity, Ft. Collins).
28
Z Z v) m 0 0 0
0 0
8 0 0 53 m 0 (3
0 m 0 0
Z 0 0
s3 s3 Z 0 9
29
Z Z v) 0 0 0 '0
0 0 0 s: 0 c)
Z 0 0 '0
I I I I
;k I - I
I 7
I I I I I I I I I I I I I I I I I +
I I I I I I \ \
\ I I
I I
I I I I
30
60" N
30" N
0"
30"s
60° N
30" N
0"
30° S
180%' 9 w O0 50'E Figure 18. - Mean values of planetary albedo in percent during December, January, and February. Shaded
areas have values < 20 percent* (ref. 8).
180% 90"w O0 9 0 " E
60" N
30" N
0"
30"s
60"s
60" N
30" N
0"
3005
60"s
180° W WOW 0' 9O'E
Figure 19. - Mean values of planetary albedo in percent during March, April, and May. Shaded area have values < 20 percent* (ref. 8).
'Dashed lines are in regions of fewer satellite data points than solid lines.
31
90"W O0 90" E
60" N 60"N
30" N 30" N
0" 0"
30'5 30"s
60"s 60"s
. . . . . .
1 8oow 90"W 0" 90"E Figure 20. - Mean values of planetary albedo in percent during June, July, and August. Shaded areas have
values < 20 percent* (ref. 8).
90°W 0" 90' E
60"N
30" N
0"
30" S
60"s
1 80"W 90"W 0" 90" E
Figure 21. - Mean values of planetary albedo in percent during September, October, and November. Shaded areas have values < 20 percent* (ref. 8).
"Dashrd lines are in regions of fewer satellite data points than solid lines.
32
Z 0 9
w 0 0.
3
0 0
3 "0 0.
3 "0 a3 7
Z 0 0 9
Z v, 0
0 0
0 0 m 0 m
0 m 0
Z 0 0 0 0 m m
m 0 0 9
33
Y0"W 0" 90" E 180"W
60"N
30" N
0"
30" S
60" S
90" W 0" 90" E 18OCW
Figure 23. - Mean values of L W from the Earth-atmosphere system during December, January, and February. cal cm.-2 min-l* and regions of LWR > 0.36 cm-2 min-' are shaded** (ref. 8). Units are
60" N 60"N
30° N 30"N
0" 0"
30" S 30"s
60'5 60'5
---------________ ---- _ _ _ _ __-------- _ _ _ _ _ _
90"w 0" 90" E 180'W
Figure 24. - Mean values of LWR from the Earth-atmosphere system during March, April, and May. Units are 10-2 min-l* and regions of LWR >.0.36 cal cm-2 min-l are shaded** (ref. 8).
*For conversion to watt.? rn-2, multiply by 697.333. **Dashed lincfi are in regions of fewer satellite data points than solid lines.
34
18@W 0" 90" E
60" N
30" N
0"
30"s
60"s
60" N
30" N
0"
30"s
180 W 9oow 0" ! W E Figure 25. - Mean values of LWR from the Earth-atmosphere system durhg June, Jrdy, and August. Units
are 10-2 cal crn-2 &-I* and regions of LWR > 0.36 cal cm-2 min-1 are shaded** (ref. 8).
60" b
30" t\
0'
30":
60":
60" N
30" N
0"
30"s
180%' 904h/ 0" WE Figure 26. - Mean values of LWR from the Earth-atmosphere system during September, October, and No-
vember. Units are 10-2 cal cm-2 min-l* and regions of LWR > 0.36 cal cm-2 mh-1 are shaded** (ref. 8).
*For conversion to watts m-2, multiply b 697.333. **Dashed lines are in regions of fewer sate&te data points than solid linea.
35
Z m c
0 0
00 0 00
0 VI
0 m a 0
36
REFERENCES
1. Anon.: Spacecraft Radiation Torques. NASA SP-8027, Oct. 1969.
2. Anon.: Solar Electromagnetic Radiation. NASA SP-8005. Revised, May 197 1.
3. Johnson, F. S.: The Solar Constant. J. Meteorol., vol. 11, 1954, pp. 431-439.
4. Thekaekara, M. P.; Kruger, R.; and Duncan, C. H.: Solar Irradiance Measurements from a Research Aircraft. Applied Optics, vol. 8, no. 8, Aug. 1969, pp. 1713-1732.
5. Thekaekara, M. P., ed.: The Solar Constant and the Solar Spectrum Measured from a Research Aircraft. NASA TR R-35 1, Washington, D.C., Oct. 1970.
6. Drummond, A. J.; Hickey, J. R.; Scholes, W. J.; and Laue, E. G.: Multichannel Radiometer Measurement of Solar Irradiance. J. Spacecraft and Rockets, vol. 4, no. 9, Sept. 1967, pp. 1200-1 206.
7. Bartman, F. L.: The Reflectance and Scattering of Solar Radiation by the Earth. College of Eng., Univ. of Michigan, Tech. Report 05863-1 1-T (Contract NASr-54(03)), Feb. 1967 (also available as NASA CR-83954).
8. Vonder Haar, T. H.: Variations of the Earth’s Radiation Budget. Ph.D. Thesis, Univ. of Wisconsin, Feb. 1968 (available Univ. Microfilms No. 68-9 144).
9. Dines, W. H.: The Heat Balance of the Atmosphere. Quart. J. Roy. Meteorol. SOC., VOI. 43, 1917, pp. 151-158.
10. Simpson, G. C.: Further Studies in Terrestrial Radiation, Memorandum, Roy. Me- teorol. SOC., vol. 3, no. 21, 1928, pp. 1-26.
11. Baur, F.; and Philipps, H.: Der Warmehaushalt der Lufthulle der Nordhalbkugel im Januar and Juli und zur Zeit der Aquinoktien und Solstitien. Part I. Die Einstrahlung bei normaler Solarkonstante. Gerlands Beitr. Geophys., vol. 42, 1934, pp. 160-207.
12. Baur, F.; and Philipps, H.: Der Warmehaushalt der Lufthulle der Nordhalbkugel im Januar und Juli und zur Zeit der Aquinoktien und Solstitien. Part 11. Ausstrahlung, Gegenstrahlung und meridionaler Warmetransport bei normaler Solarkonstante. Ger- lands Beitr. Geophys., vol. 45, 1935, pp. 82-132.
13. London, Julius: A Study of the Atmospheric Heat Balance. Dept. of Meteorol. and Oceanography, New York Univ. Tech. Report AFCRC-TR-57-287 (Final Report, Con- tract AF19(122)-165, ASTIA No. AD 117227), July 1957.
37
14.
15.
16.
17.
18.
19.
20.
21.
22.
23.
24.
25.
26.
27.
28.
Fritz, S.: Solar Radiant Energy and Its Modification by the Earth and Its Atmosphere. Compendium of Meteorology, Am. Meteorol. SOC., Boston, 195 1, pp. 13-33.
Fritz, S.: The Albedo of the Planet Earth and of Clouds. J. Meteorol., vol. 6, Aug. 1949, pp. 277-282.
Houghton, H. G.: On the Annual Heat Balance of the Northern Hemisphere. J . Me- teorol., vol. 11, no. 1, Feb. 1954, pp. 1-9.
Danjon, A.: “Albedo, Color, and Polarization of thc Earth.” Chapter 15, The Earth as a Planet-The Solar System, 11, Univ. Chicago Press, 1953.
Bakos, G. A.: Measures of the Earthshine. Special Report 162, Astrophys. Observa- tion, Smithsonian Inst., Aug. 1964.
Weinstein, M.; and Suomi, V.: Analysis of Satellite Infrared Radiation Measurements on a Synoptic Scale. Monthly Weather Review, vol. 89, 1961, pp. 419-428.
Malkevich, M. S . ; Pokras, V. M.; and Yurkova, L. I.: Measurements of Radiation Bal- ance from the Satellite Explorer VII. Planet. Space Sci., vol. l l , 1962, pp. 839-865.
Bignell, K. J. : Heat-Balance Measurements from an Earth-Satellite-An Analysis of Some Possibilities. Quart. J . Roy. .‘Meteorol. SOC., vol. 87, 1961, pp. 231-244.
Bandeen, W. R.; Halev, M.; and Strange, I.: A Radiation Climatology in the Visible and Infrared from the Tiros Meteorological Satellites. NASA TN-2534, 1965.
House, F. B.: The Radiation Balance of the Earth from a Satellite. Ph.D. Thesis, Univ. of Wisconsin, 1965 (also available as NASA CR-76422).
Rasool, S . I.; and Prabhakara, C.: Heat Budget of the Southern Hemisphere: Problems in Atmospheric Circulation, eds. Garcia and Malone. Spartan Books, 1966, pp. 76-92
Winston, J . S.: Planetary-Scale Characteristics of Monthly Mean Long-Wave Radiation and Albedo and Some Year-to-Year Variations. Monthly Weather Review, vol. 95, no. 5, May 1967, pp. 235.
Winston, J . S . ; and Taylor, V. R.: Atlas of World Maps of Long-Wave Radiation and Albedo. ESSA Tech. Report NESC-43, Environmental Sci. Services Admin., Washing- ton, D.C., 1967.
Raschke, E. : The Radiation Balance of the Earth-Atmosphere System from Radiation Measurements of the Nimbus I1 Meteorological Satellite. NASA TN D-4589, 1968.
Nordberg, W.; McCulloch, A. W.; Foshee, L. L.; and Bandeen, W. R.: Preliminary Re- sults from Nimbus 11. Bull. Am. Meteorol. SOC., vol. 47, 1967, pp. 857-872.
38
29. Raschke, E.; and Pasternak, M.: The Global Radiation Balance of the Earth Atmos- phere System Obtained from Radiation Data of the Meteorological Satellite Nimbus 11. Space Research, VIII, North-Holland Pub. Co. (Amsterdam), 1968.
30. Pasternak, M.: An Atlas of Total Outgoing Long-Wave Radiation and of Short-Wave Reflectances from Nimbus I1 Observations. GSFC Preprint X-622-67-500, Oct. 1967 (also available as NASA TM S-55974).
31. Raschke, E.; Moller, F.; and Bandeen, W. R.: The Radiation Balance of the Earth- Atmosphere System over Both Polar Regions Obtained from Radiation Measurements of the Nimbus I1 Meteorological Satellite. GSFC Preprint X-622-67-460, Sept. 1967 (also available as NASA TM X-55954).
32. Hewson, E. W.: The Reflection, Absorption, and Transmission of Solar Radiation by Fog and Cloud. Quart. J. Am. Meteorol. SOC., vol. 69, 1943, pp. 47-62.
33. Coulson, K. L.: Characteristics of the Radiation Emerging from the Top of a Rayleigh Atmosphere-11. Total Upward Flux and Albedo. Planetary Space Sci., vol. 1, 1959, pp. 277-284.
34. Hanel, R. A.; and Conrath, B. J.: Thermal Emission Spectra of the Earth and Atmos- phere from the Nimbus 4 Michelson Interferometer Experiment. Nature, vol. 228, no. 5267, Oct. 1970, pp. 143-145.
35. Johnson, F. S.: Thermal Radiation from the Earth. Satellite Environment Handbook, Stanford Univ. Press, 1961, pp. 11 1-1 16.
36. Vonder Haar, T. H.; and Suomi, V. E.: Satellite Observations of the Earth’s Radiation Budget. Science, vol. 163, no. 3868, Feb. 1969, pp. 667-669.
37. Raschke, E.; and Bandeen, W. R.: Studies of Reflection Characteristics of the Planet Earth from a Synchronous Satellite-Preliminary Results. GSFC Preprint X-622-67-572, Nov. 1967 (also available as NASA TM X-63045).
38. Raschke, E.; and Bandeen, W. R.: The Radiation Balance of the Planet Earth from Ra- diation Measurements of the Satellite Nimbus 11. J. Applied Meteorol., vol. 9, April 1970, pp. 215-238.
39. Astling, E. G.; and Horn, L. H.: 1964: An Analysis of Diurnal Variations in TIROS I1 Radiation Data. Annual Report (Grant WBGl 0), Dept. of Meteorol., Univ. Wisconsin, 1964.
39
S U P P L E M E N T A L R E F E R E N C E S
i Linton, R. C.: Earth Albedo Studies Using Pegasus Thermal Data. Paper 67-332, AIAA
Thermophys. Specialist Conference (New Orleans), April 1967 (also available in Prog- gress in Astronautics & Aeronautics, vol. 20, Academic Press, New York, 1967, pp. 475-490.
Aldrich, L. B.: The Reflecting Power of Clouds. Smithsonian Miscell. Collections, vol. 69, no. 10, 1919.
Allison, L. J.; Gray, Jr., T. I.; and Warnecke, G.: A Quasi-Global Presentation of TIROS I11 Radiation. NASA SP-53, 1964.
Byers, H. R.: General Meteorology, 3rd ed. McGraw-Hill, New York, pp. 25-44, 4662.
Camack, W. G.: Albedo and Earth Radiation. Space Materials Handbook, eds. Goetzel, Rittenhouse, and Singletary. Addison-Wesley Pub. Co., 1965, pp. 39-50.
Cunningham, F. G.: Earth Reflected Solar Radiation Input to Spherical Satellites. ARS Journal, vol. 32, no. 7, July 1962, pp. 1033-1036.
Fontana, A.: The Effect of Planetary Albedo on Solar Orientation of Spacecraft. NASA TN D-4133, 1967.
Godske, C. L.; Bergeron, T.; Bjerknes, J.; and Bundgaard, R. C.: Dynamic Meteorology and Weather Forecasting. Am. Meteorological SOC., (Boston), and Camegie Inst., (Washing- ton, D.C.), 1957, pp. 85-117.
Hanel, R. A.; Bandeen, W. R.; and Conrath, B. J.: The Infrared Horizon of the Planet Earth. NASA TN D-1850, 1963.
Hanson, K. J.; Vonder Haar, T. H.; and Suomi, V. E.: Reflection of Sunlight to Space and Absorption by the Earth and Atmosphere over the United States during Spring, 1962. Monthly Weather Rev., vol. 95, no. 6, June 1967, pp. 354-362.
Heller, G.: Thermal Environment and Control of Space Vehicles. Section 22.4. Handbook of Astronautical Engineering, H. H. Koelle, ed., 196 1, pp. 104-1 09.
Kline, S. J.; and McClintock, F. A.: Describing Uncertainties in Single Sample Experiments. Mechanical Eng., vol. 75, 1953, pp. 3-8.
Kreith, F.: Radiation Heat Transfer for Spacecraft and Solar Power Plant Design. Internatl. Textbook Co., Scranton, Pa., 1962.
Labs, D.; and Neckel, H.: The Radiation of the Solar Photosphere from 2000A to loop. I Zeitschrift fur Astrophysik, vol. 69, 1968, pp. 1-73.
Neiburger, M. : Reflection, Absorption and Transmission by Stratus Cloud. J. Meteorol., VOI. 6, 1949, pp. 98-104.
Pearson, B. D., Jr.; and Nee:, C. B.: Albedo and Earth-Radiation Measurements from OSO-11. Paper 67-330, AIAA Thermophysics Specialist Conference (New Orleans), April 1967 (Also available in Progress in Astronautics & Aeronautics, vol. 20, Academic Press, New York, 1967, pp. 439-456).
Rasool, S. I.: Structure of Planetary Atmospheres. AIAA Journal, vol. 1, no. 1, Jan. 1963, pp. 6-9.
Snoddy, W. C.: Irradiation Above the Atmosphere Due to Rayleigh Scattering and Diffuse Terrestrial Reflections. M.S. Thesis, Univ. of Alabama, 1964.
Sparkman, B. A.; and Cherrix, G. T.: Simultaneous Cloud Albedo Measurements Taken with Airborne Sol-a-Meters and Airborne and Nimbus I1 Orbiting Medium Resolution Infra- red Radiometer. GSFC Preprint X-622-67-49, Feb. 1967 (also available as NASA TM X-55705).
Telegadas, K.; and London, J.: A Physical Model for the Northern Hemisphere Troposphere for Winter and Summer. Res. Div., College of Engineering, New York Univ., Scientific Report No. 1 (Contract AFl9( 122)-165), 1954.
Wark, D. Q.; and Hilleary, D. T.: Atmospheric Temperature: Successful Test of Remote Probing. Science, vol. 165, no. 3899, Sept. 1969, pp. 1256-1258.
Wark, D. Q.; Yamamoto, G.; and Lienesch, J. H.: Methods of Estimating Infrared Flux and Surface Temperature from Meteorological Satellites. J. Atmospheric Sci., vol. 19, Sept. 1962, pp. 369-384.
42
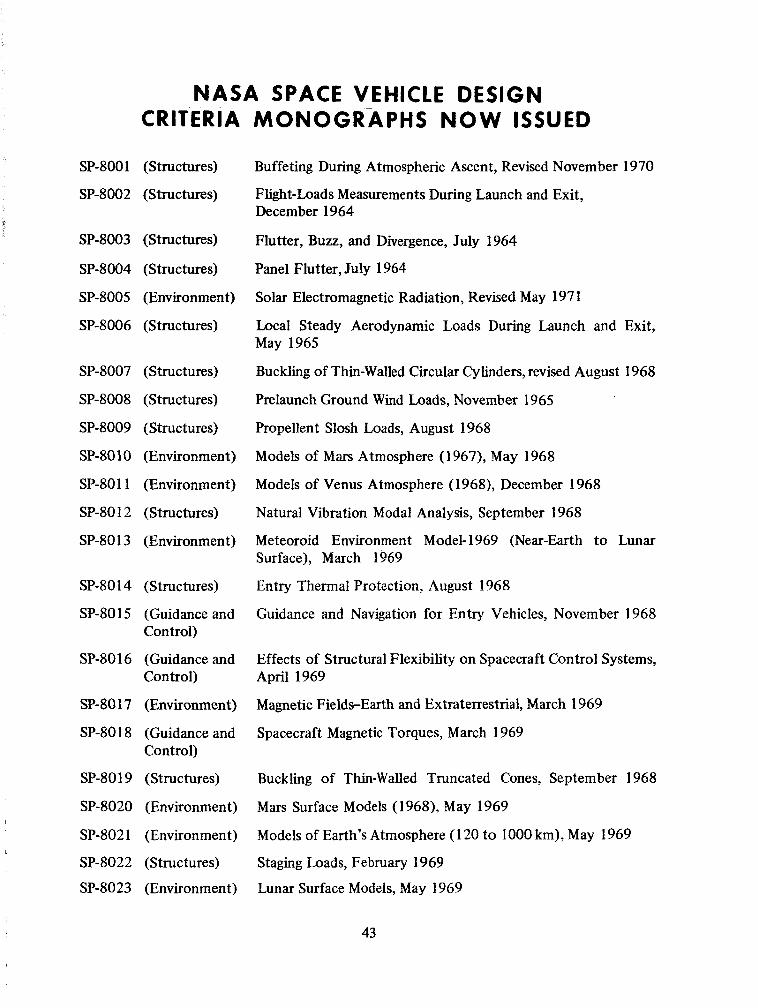
NASA SPACE VEHICLE DESIGN CRITERIA MONOGRAPHS NOW ISSUED
SP-8001 (Structures) Buffeting During Atmospheric Ascent, Revised November 1970
SP-8002 (Structures) Flight-Loads Measurements During Launch and Exit,
SP-8003 (Structures) Flutter, Buzz, and Divergence, July 1964
December 1964 L
SP-8004 (Structures) Panel Flutter, July 1964
SP-8005 (Environment) Solar Electromagnetic Radiation, Revised May 197 1
SP-8006 (Structures)
SP-8007 (Structures)
SP-8008 (Structures)
SP-8009 (Structures)
SP-8010 (Environment)
SP-8011 (Environment)
SP-80 1 2 (Structures)
SP-8013 (Environment)
SP-8014 (Structures)
SP-8015 (Guidance and
SP-8016 (Guidance and
SP-80 17 (Environment)
SP-8018 (Guidance and
SP-80 1 9 (Structures)
SP-8020 (Environment)
Control)
Control)
Control)
Local Steady Aerodynamic Loads During Launch and Exit, May 1965
Buckling of Thin-Walled Circular Cylinders, revised August 1968
Prelaunch Ground Wind Loads, November 1965
Propellent Slosh Loads, August 1968
Models of Mars Atmosphere (1967), May 1968
Models of Venus Atmosphere (1968), December 1968
Natural Vibration Modal Analysis, September 1968
Meteoroid Environment Model- 1969 (Near-Earth to Lunar Surface), March 1969
Entry Thermal Protection, August 1968
Guidance and Navigation for Entry Vehicles, November 1968
Effects of Structural Flexibility on Spacecraft Control Systems, April 1969
Magnetic Fields-Earth and Extraterrestrial, March 1969
Spacecraft Magnetic Torques, March 1969
Buckling of Thin-Walled Truncated Cones, September 1968
Mars Surface Models (1 968), May 1969
SP-8021 (Environment)
SP-8022 (Structures) Staging Loads, February 1969
SP-8023 (Environment) Lunar Surface Models, May 1969
Models of Earth’s Atmosphere (120 to 1000 km), May 1969
I
43
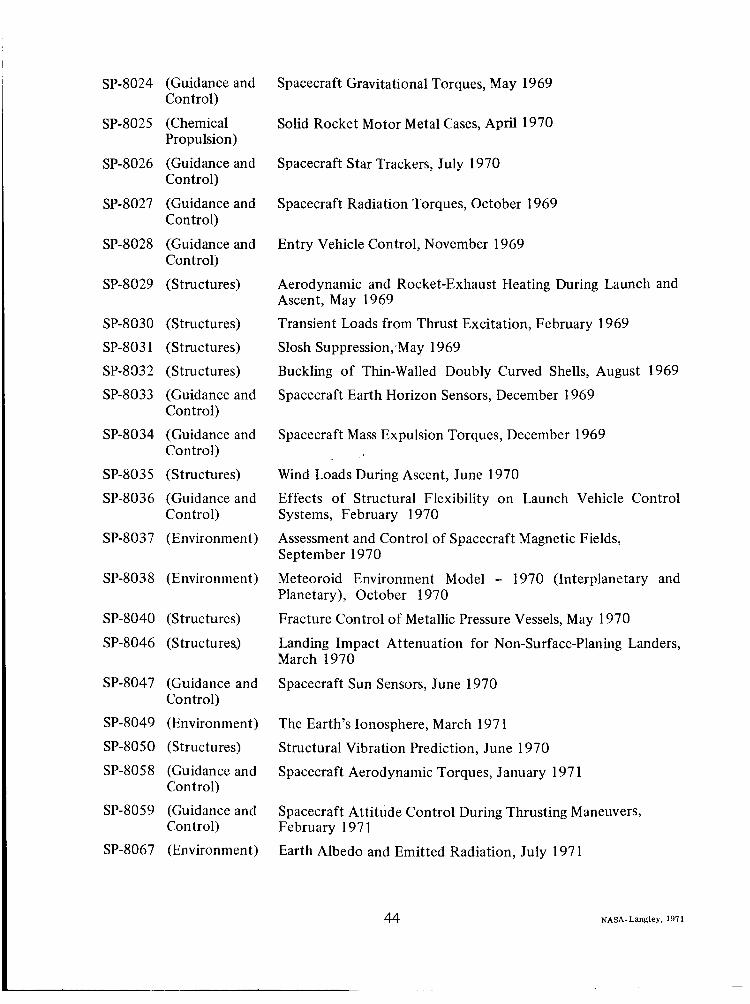
SP-8024 (Guidance and
SP-802 5 (Chemical
SP-8026 (Guidance and
SP-8027 (Guidance and
SP-8028 (Guidance and
SP-8029 (Structures)
Control)
Propulsion)
Control)
Control)
Controlj
SP-8030 (Structures) SP-803 1 (Structures)
SP-8 03 2 (Structures) SP-8033 (Guidance and
SP-8034 (Guidance and
SP-8035 (Structures) SP-8036 (Guidance and
SP-803 7 (Environment)
Control)
Control)
Control)
SP-803 8 (Environment )
SP-8040 (Structures)
SP-8046 (Structures)
SP-8047 (Guidance and
SP-8049 (Environment)
SP-80 5 0 (Structures)
SP-8058 (Guidance and
SP-8059 (Guidance and
SP-8067 (Environment)
Control)
Control)
Control)
Spacecraft Gravitational Torques, May 1969
Solid Rocket Motor Metal Cases, April 1970
Spacecraft Star Trackers, July 1970
Spacecraft Radiation Torques, October 1969
Entry Vehicle Control, November 1969
Aerodynamic and Rocket-Exhaust Heating During Launch and Ascent, May 1969 Transient Loads from Thrust Excitation, February 1969
Slosh Suppression;May 1969 Buckling of Thin-Walled Doubly Curved Shells, August 1969
Spacecraft Earth Horizon Sensors, December 1 969
Spacecraft Mass Expulsion Torques, December 1969
Wind Loads During Ascent, June 1970
Effects of Structural Flexibility on Launch Vehicle Control Systems, February 1970
Assessment and Control of Spacecraft Magnetic Fields, September 1970
Meteoroid Environment Model - 1970 (Interplanetary and Planetary), October 1970
Fracture Control of Metallic Pressure Vessels, May 1970
Landing Impact Attenuation for Non-Surface-Planing Landers, March 1970
Spacecraft Sun Sensors, June 1970
The Earth’s Ionosphere, March 197 1
Structural Vibration Prediction, June 1970
Spacecraft Aerodynamic Torques, January 197 1
Spacecraft Attitude Control During Thrusting Maneuvers, February 197 1
Earth Albedo and Emitted Radiation, July 197 1
44 NASA-Langley, 1971
NATIONAL AERONAUTICS AND SPACE ADMINISTRAT ION WASHINGTON, D.C. 20546
OFFICIAL BUSINESS PENALTY FOR PRIVATE uaE $so0
FIRST CLASS MAIL
POSTAGE AND FEES PAID NATIONAL AHcoNAvIlCs AND
SPACE ADMINISTRATION
I
t