Embed Size (px)
Citation preview

Recent Progress of the Re-EntryAerodynamics Research in Japan
JIRO KONDO, FUMIO TAMAKI,
RYUMA KAWAMURA
University of Tokyo
and GORO KAMIMOTO
University of Kyoto,Japan
SUNIN1ARY
The object of the present paper is to describe the research activities on re-
entry aerodynamics in recent years. As an introduction, the sounding rocket
programme of the University of Tokyo is reviewed briefly. In the part of
theoretical studies, (a) the optimum re-entry trajectory, (h) deformation of
nose cone by sublimation, (e) supersonic base pressure, (d) quantum
mechanics of dissociating gas, (e) non-equilibrium flow in the nose region of
a blunt body and (.1) coupling effects of radiation and dissociation in a
stagnation-point flow are discussed. In the second part of the paper, experi-
mental facilities and some results are described, namely (a) hypersonic wind
tunnels, (h) gun tunnels, (e) ablation tunnel and (d) electro-magnetic shock
tube are included. Finally, the problems which are remaining unsolved and
the progress of the studies in the future are discussed. Some characteristics
of the researches of re-entry are emphasised.
I. INTRODU(' HON
On behalf of the Japanese Society for Aero/Space Sciences, we would like
to pay our highest respect to the Royal Aeronautical Society which, this
year, is celebrating the centennial anniversary of its founding. During the
century since its establishment, the Society has achieved a great many
brilliant accomplishments in both the theoretical and experimental fields of
aeronautical research. At the same time it has produced many masterpieces

628 Aerospace Proceedings 1966
of aircraft. In short, it has always played the part of the leader in the aero-
nautical sciences of the world.
It is a great honour and pleasure to be allowed to participate in the Fifth
Congress of the International Council of the Aeronautical Sciences and to
report on the progress of re-entry aerodynamics in Japan. Our lecture consists
of three parts. We should like to describe, first, the present state of theoretical
research in re-entry aerodynamics, and second, our experimental facilities
and our future research plans as well as a few points of interest concerning
re-entry aerodynamics.
We have in Japan a group of scientists who are interested in the theoretical
and experimental researches of re-entry aerodynamics. Many of them are
associated with universities while some are in research institutes or industries.
Although the research of re-entry problems is not requested urgently by
rocket designers, our interest still lies in the aerodynamics related to re-entry
since it does include a new field of aerodynamic science and contains various
interesting issues in it. Our Ministry of Education gives the financial aid to
the group of aerodynamic scientists to achieve a comprehensive research
work on this re-entry problem. The present report is based chiefly on the
results obtained by this research group.
Sounding rocket project
The sounding rocket project of the University of Tokyo in 1955 was to
participate in the sounding rocket programme of the International Geo-
graphical Year 1957-58. The solid propellant two-stage rocket of Kappa-6
was used successfully in 1958 for the measurements of temperature and wind,
cosmic-ray intensity and atmospheric pressure up to the altitude of 60 km
(37 m). The project was continued after IGY and pushed forward to partici-
pate in the world synoptic rocket soundings programme of COSPAR during
the International Quiet Sun Year 1964-65. The main effort of the University
of Tokyo has been concentrated to develop powerful rocket systems, to
construct the range facilities and to operate the firing. During the five years
from 1960to 1965,several sounding rocket systems have been completed.
Kappa -8L is the improved version of K-6, and its peak altitude is 170 km
with 25 kg payload. It served for wind measurement by sodium vapour
method and for geomagnetic measurement.
Kappa-8 with a booster of 420 mm diameter can climb to 200 km with
25 kg payload.
Kappa-9L is a three-stage rocket and its peak altitude is 350 km with
60 kg payload.
Lambda, a solid propellant booster has a diameter of 785 mm and can
produce 40 ton thrust. It was completed in 1963and the first flight of a three-
stage rocket L-3, a combination of Lambda and Kappas took place in 1964.
coll
imati
on
Tow
er
KA
,,O
SR
TM
A SP
AC
E C
EN
TE
R
UN
IVE
RS
ITY
O
F T
OK
YO
1,-
scte
r P
iih
,Aw
metr
y
\nte
nni
1in
str
um
ents
L
oti
t or
FIG
. 1
—T
he
genera
l arr
angem
ent
of
Kagoshim
a
Space
Centr
e
(Univ
ers
ity
of
Tokyo)
Rin
go
tom
mu
nic
ati
on
nhserv
ati
on
Post
CD
opti
cal
tracki
Cente
r7 u
rvati
on
Post
- --
"
Sta
tion
nto
r_N
adi
047
?kti
/„.T
n•t
runii
,t.,
Fil
trance
/ L
am
bda
Lau
ncher
Anom
om
ete
r T
ow
er
Lam
hda
Cente
r
t
J
,\ tit
at
1on,,
al
Tra
ct:
in
—
!,It
i B
ridge
orX
i1,/
Mu L
auncher
/
&b'
Cell
tr
iol
IT-7,17,7cii
iih
ouses
Patr
ol
Ship
Mu
C
en
ter
Radar
Cia
ller<
60lci.

630 ,4erospace Proceedings 1966
Ho. 2 -- Lambda rocket
It succeeded in the scientific observations up to the altitude of 1100 km with100 kg payload.
A small rocket for meteorological observation, named MT 135, has alsobeen developed and used for wind and temperature measurement up to60 km altitude.
Mu rocket is under development which is capable of launching a satelliteinto orbit. A big solid-propellant rocket motor M-1400, having a diameterof 1.4 m (4.6 ft) and producing a thrust of 100 tons (220,000 lb) is now incourse of development.
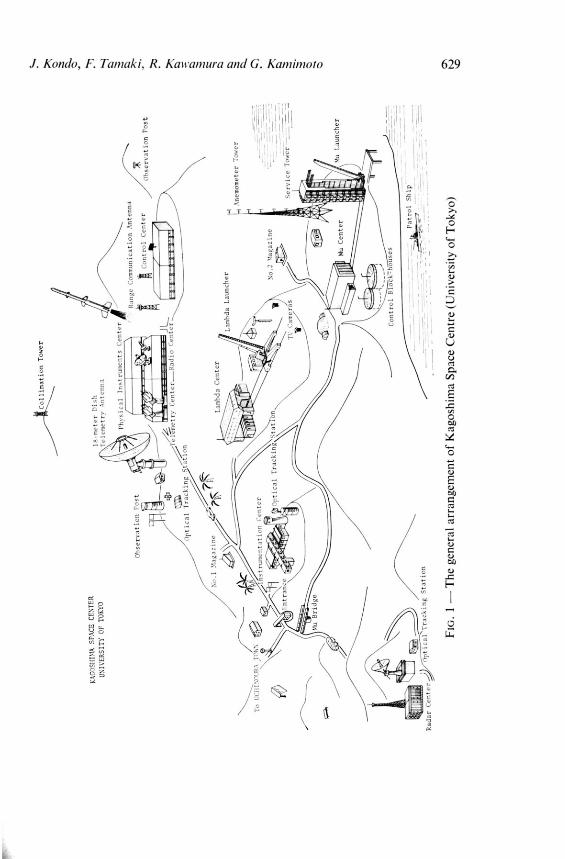
Firings of rockets are carried out at Kagoshima Space Center, Universityof Tokyo, which is equipped with all the necessary facilities for launching,telemetry, radar and optical tracking, date acquisition, assembling andcheck out.
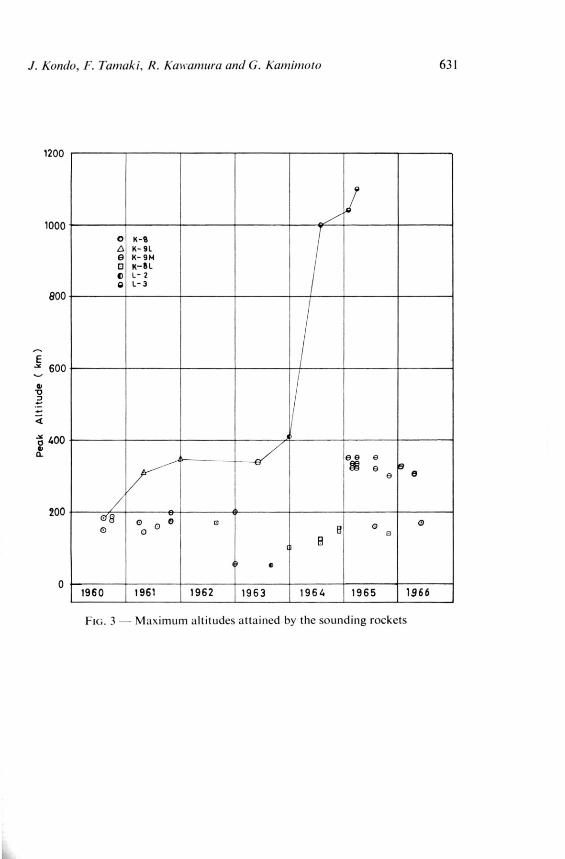
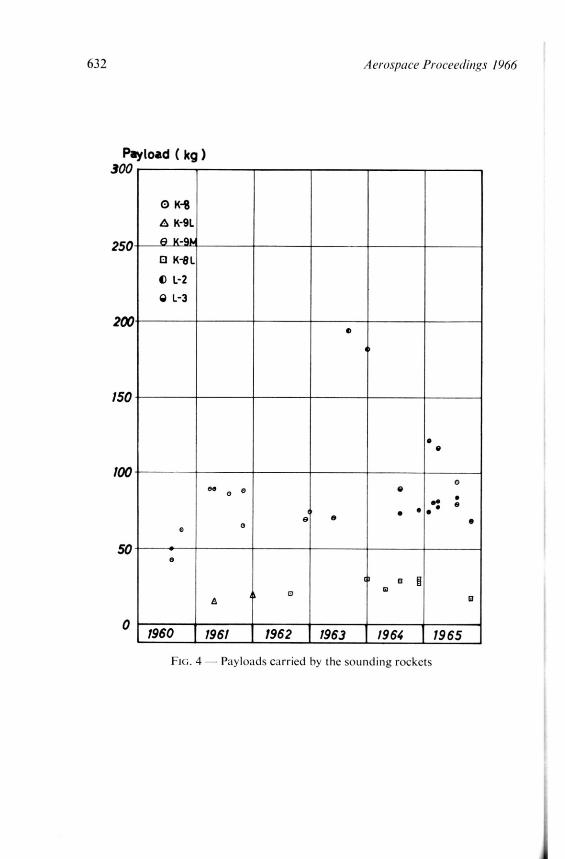
Figure 1 shows the general arrangement of the Kagoshima Space Center,located at the southern end of the Japanese islands. Fig. 2 indicates thedimensions of Lambda rocket and Figs. 3 and 4 give the maximum altitudesand the payloads attained by our sounding rockets during these five years.
J. Kondo, F. Tamaki, R. Kawamura aml G. Kamimoto 631
1200
1000
01 K-8K-91K- 9MK--81L- 2
ci L-3
800
—E
600
t 400Q.
200
le e;
o oo
01960 1961 19 62 1963 1964 1965 19 66
FIG. 3 - - Maximum altitudes attained by the sounding rockets
632 Aerospace Proceedings 1966
Payload ( kg )
300
K-8
K-91
250KIL
L-2
L-3
200
150
•
100o 0
0•
50o
A
01960 1961 1962 1963 1964 1965
FIG. 4 — Payloads carried by the sounding rockets

J. Kondo, F. Tamaki, R. Kawamura and G. Kamimoto 633
SYMBOLS
a velocity of soundA, area of cross-section in barrelA, area of cross-section in breach
E total energyh Planck's constant
K, dissociation rate constantk; dissociation rate constant from jth vibrational energy levelL4 length of compression tube
Ms, incident shock Mach numberp, P pressure
P„ air pressure for driving piston (taking into account finite volume ofair chamber)
P1', air pressure for driving piston (assuming infinite volume of airchamber)
P„ initial barrel pressurePR initial breach pressure
radius vector from the centre of 02 moleculeT temperature
vibrational temperatureUp, piston velocity
velocity component normal to the uniform flowvelocity component parallel to the uniform flow
V volumeV,, intra-molecular potential of oxygen molecule
Vin inter-molecular potential of oxygen and argon
CC non-dimensional dissociation rate based on the dissociation rateafter the detached shock
0 non-dimensional temperature based on the temperature after thedetached shock
p reduced mass of argonp intra-molecular distance, density (Fig. 13)
a cross-section of dissociating moleculea 1/a, normalised cross-section of dissociation based on the cross-section
of zero levelduration (Tables 1 and 2)
T„ distance from the shock to the wall in terms of optical thickness(Fig. 14)
1/z wave function
634 Aerospace Proceedings 1966
Suffixes1 initial condition of driven tube2 condition behind incident shock wave5 condition behind reflected shock waveA initial condition in helium chamberB final condition of helium gas compressed by piston/ stagnation condition
* throat condition
2. THEORETICAL STUDIES ON RE-ENTRY AERODYNAMICS
The most important problem concerning re-entry aerodynamics is that ofheat. The gas around the vehicle entering the atmosphere at an extremelyhigh velocity, involves an enormous amount of total enthalpy and the realgas effects become very important in the analysis of the flow reaion. Thesurface of the nose cone is heated to a very high temperature, therefore someadequate precaution should be provided to protect the damage due to heat.Since it might cost a great deal to build experimental facilities to simulate the
re-entry environment on the ground, theoretical studies are carried out toanalyse the various aspects of the re-cntry aerodynamics.
Optimum re-entry trajectory
The study of the optimum trajectory by controlling the angle of attack of alifting vehicle is one of the most interesting problems concerning re-entry.The trajectory may be so determined as to restrict either the maximum heatingrate at the stagnation point of the vehicle or the maximum accelerationduring the re-entry flight in the earth's atmosphere. The optimum re-entrytrajectory for the minimum total heat input during the re-entry is studied.Figure 5 indicates the typical results corresponding to the initial re-entryangle" '.
An approximate solution for the equation of motion of the lifting body isobtained which simpli fies the numerical calculation of flight pass.
The aerodynamic characteristics of a particular shape of winged vehiclein a hypersonic flow are also studied.
Determination of the nose-cone by sublimating ablation
The utilisation of an evaporating or subliming material as the heat pro-
tection will be most effective since the most part of heat, transferred to thebody, is absorbed as the latent heat associated with the phase change. Theinjection rate will be determined by the amount of heat flow and the heat

J. Kondo, F. Tamaki, R. Kawamura and G. Kamimoto 635
km120
100
80
60
40
8163 3627°
20
0o
_J20 40 60 80 100 120 140 160 130 2,S0km
Horizontal Distance
HG. 5 — Optimum trajectories corresponding to various re-entry angles
transfer rate at a point on the body is influenced by the injection rate in theupstream of this point.
The general method of estimating the overall deformation of the nose - conecovered by a sublimating material is investigated, under the followingbasic assumptions:
The flow is laminar and the rate of deformation of the body is muchsmaller than the velocity of the flow, so that the flow is assumed to be quasi-steady while the boundary layer flow establishes very rapidly. The mass whichsublimates from the surface is proportional to the heat transferred from theflow to the body.
Figure 6 shows a numerical example, starting from a spherical configura-
FIG. ô — Deformation of the spherical nose-cone by sublimation
636 Aerospace Proceedings 1966
tion, the change in shape has been found for several cases. The erosion at thestagnation point is most remarkable since the heat transfer rate at the stag-nation point is maximum on the surface and it decreases parabolically as thedistance from that point increases'''.
Supersonic base pressure
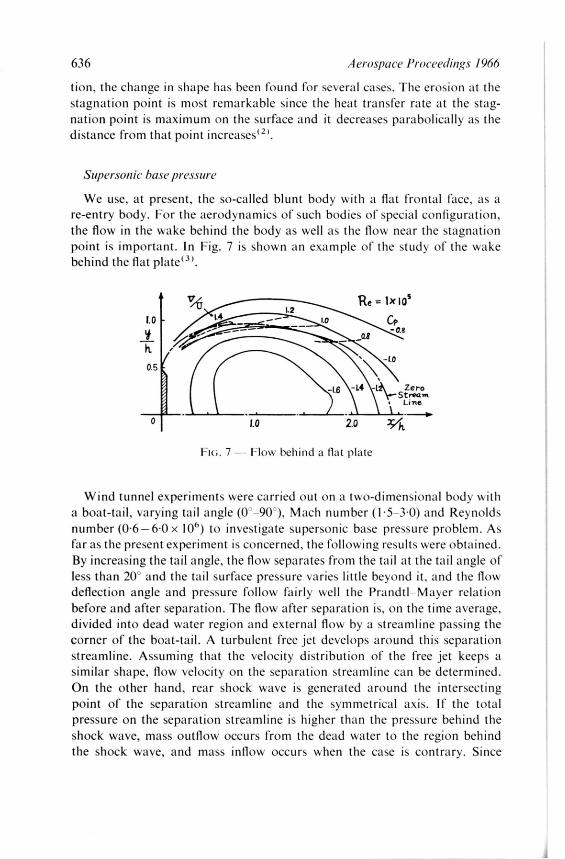
We use, at present, the so-called blunt body with a flat frontal face, as are-entry body. For the aerodynamics of such bodies of special configuration,the flow in the wake behind the body as well as the flow near the stagnationpoint is important. In Fig. 7 is shown an example of the study of the wakebehind the flat plate").
Re= IX 105
1.0-05
-1.6 -14\._ ZeroStream
Line
-11%.o 1.0: 541.
FRi. 7 - Flow behind a flat plate
Wind tunnel experiments were carried out on a two-dimensional body witha boat-tail, varying tail angle (0 -90' ), Mach number (1.5-3.0) and Reynoldsnumber (0.6— 6.0 x 10⁶) to investigate supersonic base pressure problem. Asfar as the present experiment is concerned, the following results were obtained.By increasing the tail angle, the flow separates fi-om the tail at the tail angle ofless than 20 and the tail surface pressure varies little beyond it, and the flowdeflection angle and pressure follow fairly well the Prandtl- Mayer relationbefore and after separation. The flow after separation is. on the time average,divided into dead water region and external flow by a streamline passing thecorner of the boat-tail. A turbulent free jet develops around this separationstreamline. Assuming that the velocity distribution of the free jet keeps asimilar shape, flow velocity on the separation streamline can be determined.On the other hand, rear shock wave is generated around the intersectingpoint of the separation streamline and the symmetrical axis. If the totalpressure on the separation streamline is higher than the pressure behind theshock wave, mass outflow occurs from the dead water to the region behindthe shock wave, and mass inflow occurs when the case is contrary. Since
1.0 1.41.2
It
0 5

J. Kondo, F. Tamaki, R. Kawamura and G. Kamimoto 637
either case contradicts the stationarity of the flow, the total pressure of theseparation streamline must be equal to the pressure behind the shock wave.Usilw this condition and the free jet theory, the relation between Mach numberand base pressure can be primarily obtained. The above theory seems to givea good agreement with the experimental results.
Quantum mechanical studr on dissociation qf gas
Many researches have been done to explain the real gas effects of air at thehypervelocity as well. The calculation considering the quantum mechanicalmechanism of dissociation has been carried out to explain theoretically thecharacteristics of air at high temperatures. To investigate the dissociation ofdiatomic molecules at high temperature, the dissociation by vibrational excita-tion has been considered for the model of a collinear collision of an oxygenmolecule with an argon atom as shown in Fig. 8.
INIRA MOLECULAR
POTENTIAL VINTER MOLECVLAR
POTENTIAL
FREE STATE \Ar
BOUACI STATE I
FIG. 8 - -Model of collinear collision
The Schrodinizer equation for the collision yields
r h, d 2 h 2 d2
„,(p)± L. (p, r) =L 2p dr= 2p0, dp-
We may take the Morse potential for the intra-molecular potential 1/02 anda simple exponential potential for the inter-molecular potential Vin,. Thecross-section has been calculated by the Born approximation. The cross-section for the dissociation from jth vibrational level at sufficiently highenerizetic collision is indicated in Fig. 9, which indicates that the dissociationfrom the higher vibrational levels may take place more easily than from thelower levels. The dissociation rate constant Ka is given in Fig. 10. Thetemperature dependence of Kd shows a satisfactory agreement with theexperimental data although the absolute value of Kd—li p,A is too large.

638 Aerospace Proceedings 1966
This may be caused by the application of the Born approximation and alsoby the inadequate assumption on potentials(4) .
Non-eguilibrium flow in the nose region of a blunt body
Behind the detached shock in front of the re-entry body, the temperatureof the air is raised to the extremely high value and the real gas effect is involved.
10"
lo"
10"
lolo
10 10 20 30 40 50
..i vibrational level
FIG. 9 — Cross-section for dissociation vs. vibrational level
10-4
10-"
10-"
10-14
10'j=40
10-"0 1 2 3 4 5
( 1/T ) x 104 ( K )
FIG. 10 — Dissociation rate constant vs. temperature
Kd
(
cc/
PARTICLE
-
sec
Expt K.L. WRAY
=50
M.0 MAC& A. VAUGHAN i'45
J. Kondo, F. Tamaki, R. Kawamura and G. Kamimoto 639
The internal energy of gas is activated at high enthalpy level, then dissociationof diatomic molecules and ionisation may take place in the flow field. It takessome finite time to reach the equilibrium state for this activated thermo-chemical process. The interaction between flow mechanisms and chemicalprocesses should be considered, since it also takes a finite time for a group ofgas molecules to be carried some distance by gas flow.
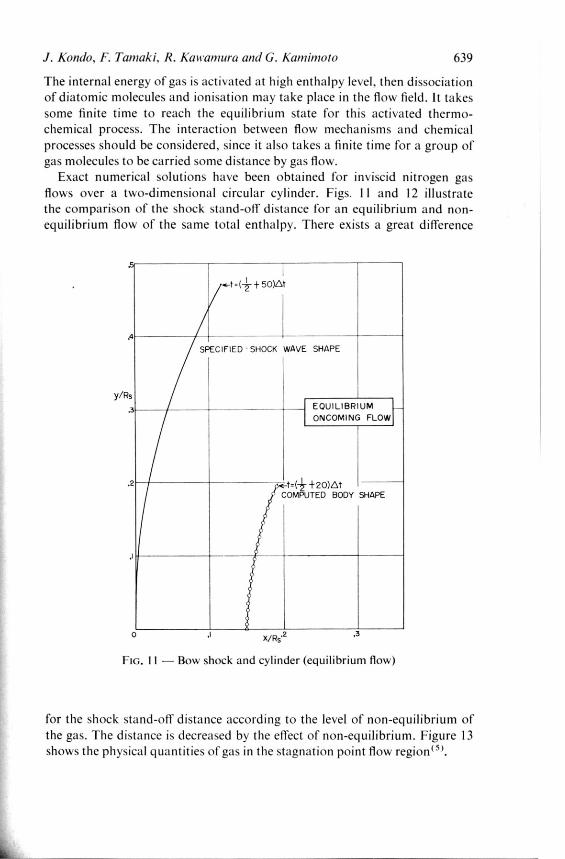
Exact numerical solutions have been obtained for inviscid nitrogen gasflows over a two-dimensional circular cylinder. Figs. 11 and 12 illustratethe comparison of the shock stand-off distance for an equilibrium and non-equilibrium flow of the same total enthalpy. There exists a great difference
<-1=1++ SO)At
.4
SPECIFIED • SHOCK WAVE SHAPE
y/Rs
.3 EQUILIBRIUM
ONCOMING FLOW
.2 ‹- t=02"+20)AtCOMPUTED BODY SHAPE
0 X/Rs'2 ,3
Fie. 11 — Bow shock and cylinder (equilibrium flow)
for the shock stand-off distance according to the level of non-equilibrium ofthe gas. The distance is decreased by the effect of non-equilibrium. Figure 13shows the physical quantities of gas in the stagnation point flow region(5'.

640 Aerospace Proceedings 1966
Effect of radiation and dissociation behind a strong shock wave
The hypervelocity of a space vehicle at a re-entry stage introduces compli-
cated phenomena into the flow around the body. Behind a strong detached
shock wave, the air may be raised to an extremely high temperature, the
molecules of the air dissociate into atoms and the radiation enery of the
hot gas is absorbed and emitted while the heat is transferred by conduction
simultaneously. To estimate the total energy transfer at the stagnation point
of the vehicle, the effects of radiation and dissociation should be considered
in the hypersonic flow around the body.
When radiation is coupled with other modes of energy transfer, the energy
conservation can be expressed in terms of integral differential equations since
the energy is transported by radiation by means of electromagnetic waves
while the heat conduction and convection are involved by contact between
particles of matter. Thus, the radiative contribution to the total energy flux
depends on the macroscopic configuration of the system, while the conduction
0,5(12-1-50)A t
0,4
Y/Rs
0.
SPECIFIED SHOCK WAVE SHAPE
NONE OUIL IBRI UM 1_ONCOMI NG FLOW
42
=(12--FI9)Lt
COMPUTED BODY SHAPE
0.1
x/Fts 0'2 43
FIG. 12 — Bow shock and cylinder (non-equilibrium flow)
J. Kondo,F. Tamaki,R. Kawamura and G. Kamimoto 641
25,0 STAGNATION
STREAMLINE y/Rs. 0
25,0
y/Rs-0,21
T.
Tv, 20,0
.2 20,0
P,
P,
T .
Tv,
P,
15,0
,I5
P,
15.0
Tv
Tv10.0
.1 10,0
5,0
,05 5,0
axioa
V
SHOCKBODYSHOCKBODY
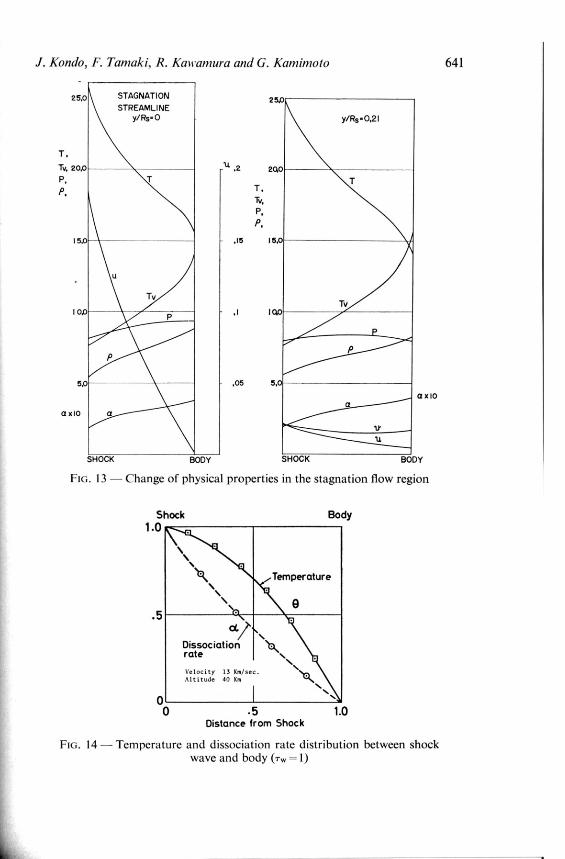
FIG. 13 — Change of physical properties in the stagnation flow region
ShockBody1.0
\\--k
Temperature
•o
.5cc?
Dissociationrate
\.
Velocity13 Km/sec.
Altitude40 Km
0
0 .5 1.0Distance from Shock
FIG. 14 — Temperature and dissociation rate distribution between shock wave and body (Ty, =I)
642 Aerospace Proceedings 1966
due to the microscopic situation can be expressed by derivatives of quantitiesexpressing the state of the system.
A one-dimensional flow model is established for stagnation point flow
between a strong shock wave and a body. Equations of continuity, momentum,together with that of energy furnish the system of fundamental equations forthe problem. The method of steepest descent is applied to solve the energyequation. Temperature and atom fraction rate in a stagnation-point flowunder the coupled influence of radiation, conduction and dissociation are
obtained. Figure 14shows one of the results'''.
3. EXPERIMENTAL FACILITIES AND SOME RESULTS OBTAINED
Next we will refer to the experimental facilities available for the re-entry
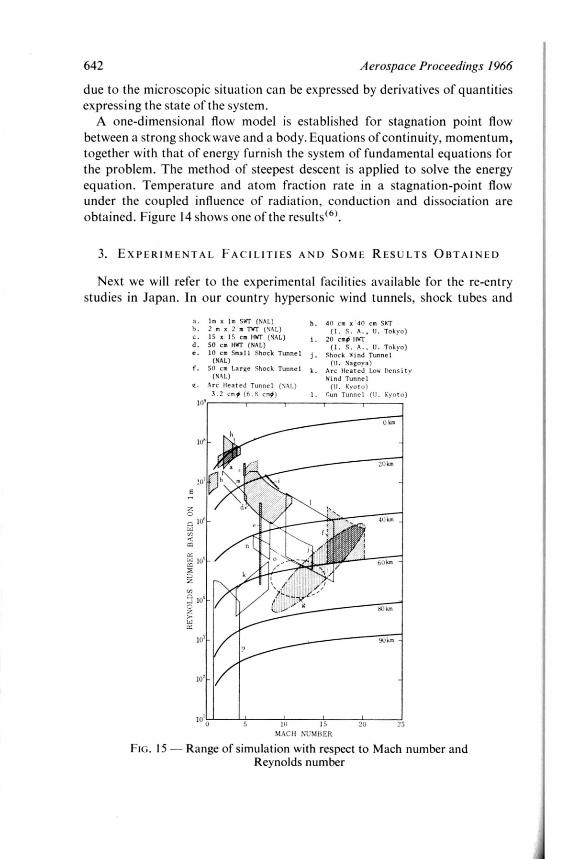
studies in Japan. In our country hypersonic wind tunnels, shock tubes and
a. lm x lm SWT (NAL)
h. 2mx2mTWT (NAL)C. IS u IS cm Hva (NAL)d. SO cm HWT (NAL)e. 10 cm Small Shock Tunnel
(NAL)f. SO cm Large Shock Tunnel
(NAL)g. Arc Seated Tunnel (KALI
3.2 cm# (6.5 cot)
10°
h. 40 cm x 40 cm SHT
(I. S. A., U. Tokyo)
I. 20 cm# (KT(I. S. A., U. Tokyo)
Shock Kind Tunnel(H. Nagoya)
Arc Heated Lou Hensityhind Tunnel(U. Kyoto)
1.(lun Tunnel (U. Ky)
()km
10°
20km
10'015 20 25
MACH NUMBER
FIG. 15— Range of simulation with respect to Mach number and Reynolds number
J. Kondo, F. Tatnaki, R. Kawatnura and G. Kamimoto 643
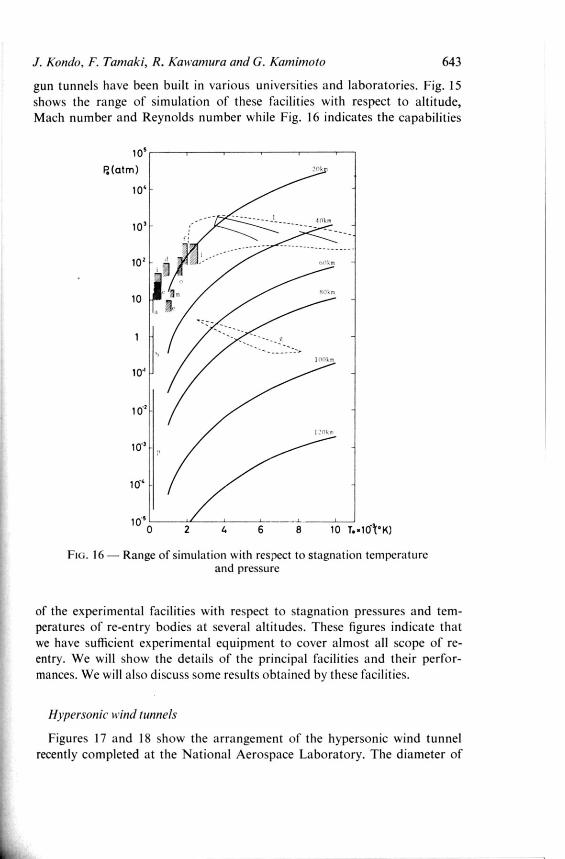
gun tunnels have been built in various universities and laboratories. Fig. 15 shows the range of simulation of these facilities with respect to altitude, Mach number and Reynolds number while Fig. 16 indicates the capabilities
10'
Fgatm) 2.4 r
10'
10'
10'
10sokm
104
10-2
10-'
io-50 2 4 6 8 10 T.x10-1°K)
FIG. 16 — Range of simulation with respect to stagnation temperature and pressure
of the experimental facilities with respect to stagnation pressures and tem-peratures of re-entry bodies at several altitudes. These figures indicate thatwe have sufficient experimental equipment to cover almost all scope of re-entry. We will show the details of the principal facilities and their perfor-mances. We will also discuss some results obtained by these facilities.
Hypersonic wind tunnels
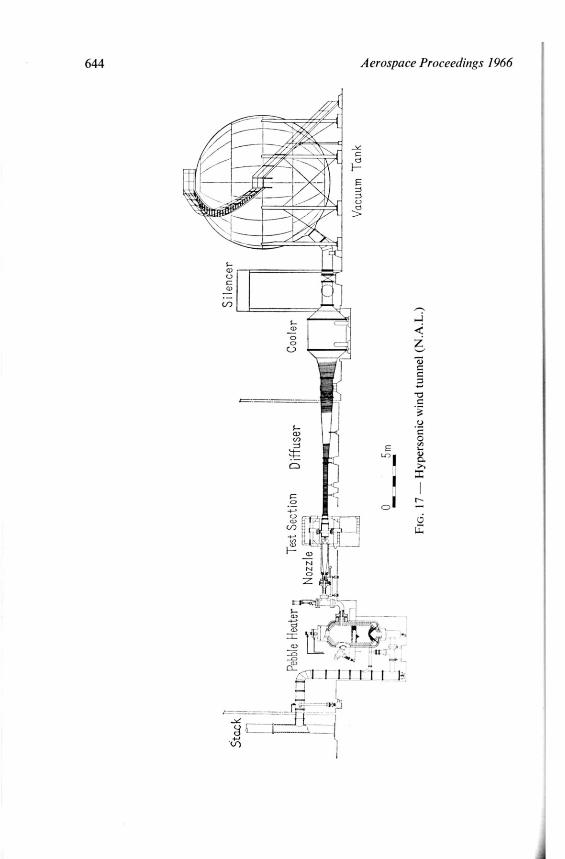
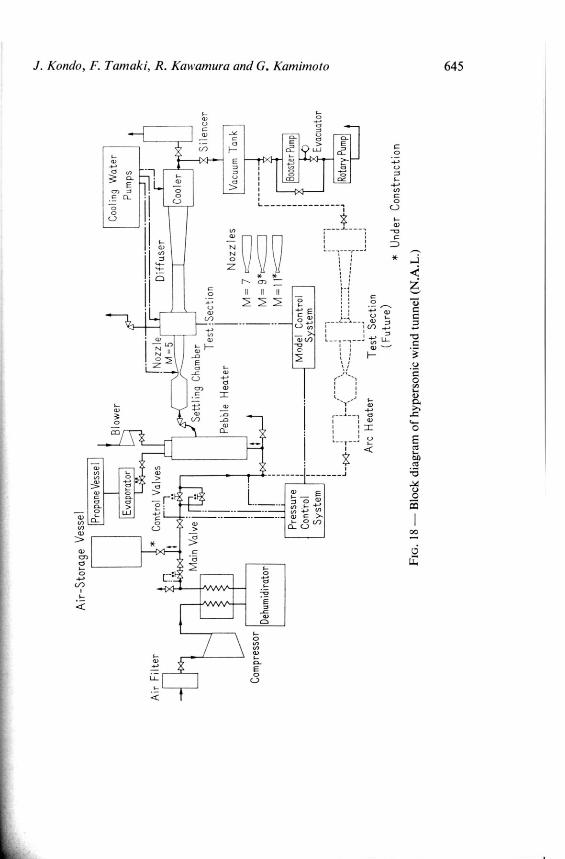
Figures 17 and 18 show the arrangement of the hypersonic wind tunnelrecently completed at the National Aerospace Laboratory. The diameter of
Sile
ncer
Coo
ler f
i-
Vac
uum
T
ank
cr, Aer
ospa
ce
Pro
ceed
ings
1966
Sta
ck
-
I Lf 1_
111*
Peb
ble Hea
ter 14
,,,D
iffus
erT
est
Sec
tion
Noz
zle
:="_
:•--
7.;
•
- _
,
0 5m
=N
II
FIG
. 17
— H
yper
soni
c w
ind
tunn
el
(N.A
.L.)
BI o
wer
Evapora
tor
Cool ing
Wate
r
Pum
ps
_1
!.J
Coo
ler
.1-N
ozzle
= 5
Diffu
ser
Air
Filte
r*
Con
trol
Valv
es
Dehum
idirato
r
Main
V
alv
e••
Pre
ssure
Con
tro
lS
yste
m
Te
st
Se
ction
(F
utu
re)
*U
nder
Constr
uction
FIG
.18
—B
lock dia
gra
m
of
hypers
onic
w
ind tu
nnel
(N.A
.L.)
Arc
H
eate
r
Aft-S
tora
ge
Vesse
l
Pro
paneV
esseI
Settl in
gC
ham
ber
Te
st
Pe
bble
H
ea
ter
Section
Nozzle
s
M =
7
iiiI
= 9*t=
=
M =
l*
c=
==
=
__---
---
Silen
ce
r
Vacu
um
Ta
nk]
Bo
oste
r Pum
p.
Eva
cu
ato
r
Rota
ry P
um
p
Com
pre
ssor
model
Con
trol
Sste
m
oio
uquiv
x
•Dp/iV
Ilin
UM
MU
X
'èr
Vra
w1
li'opuoN
f
Cr
reservoir
( 4 m' , 150 kg/cre)
heater
silencer
SOØ
valve
heating chamber
nozzle test chamber
(600°C.
SC, kg/cm')
ejector
diffuser
A
compressor
(200
atm.)
atmosphere
4000
valve
spherIcal
reservoir
(524 m',
IS kg/cm')
200
valve
FIG
.19 —
Hypers
onic
w
ind
tunnel
(Univ
ers
ity
of
Tokyo)
Aerospace
Proceedin
gs
1966
J. Kondo, F. Tamaki, R. Kawamura and G. Kamimoto 647
the test section is 500 mm (20 inches) and the operation time is 40-120 secondsat Mach numbers 5, 7, 9 and 11. This is the intermittent blow-down typetunnel in which the compressed air at 200 kg/cm2, stored in a high pressurereservoir through a drier, is heated up to 1000-C by an alumina pebbleheater and introduced in a test section. A model is supported by a string and astrut and its attitude can be changed according to a programme during theoperation period. The air is finally discharged into the atmosphere through asilencer or restored in a large vacuum tank of 1150 m3. This wind tunnel hasjust started operation and experiments on re-entry bodies are scheduled.
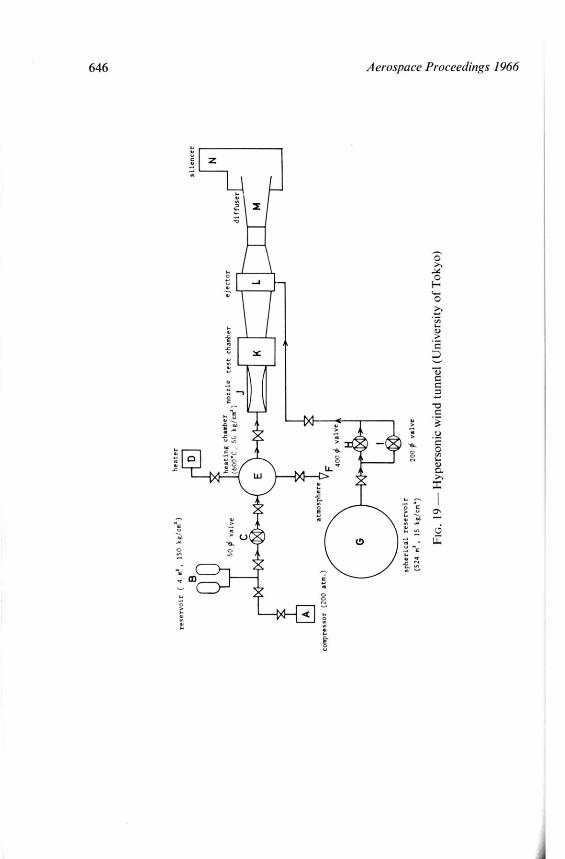
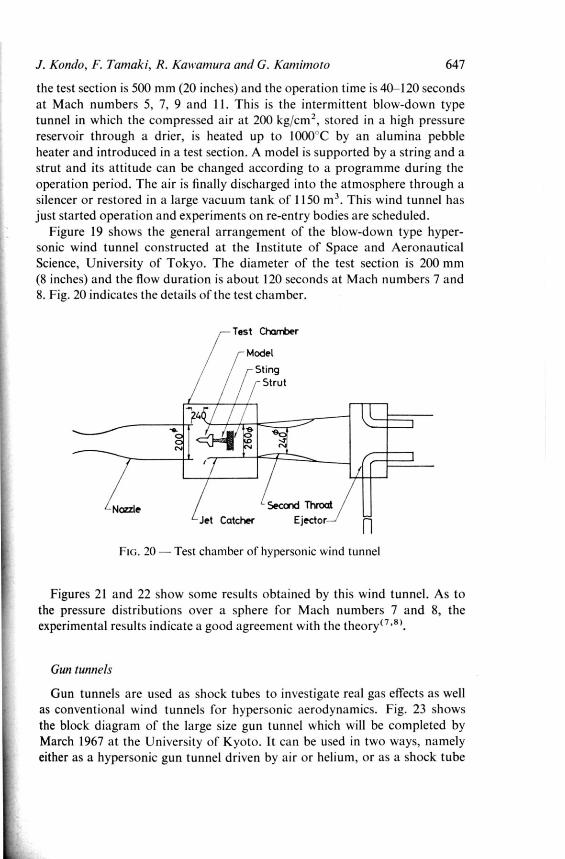
Figure 19 shows the general arrangement of the blow-down type hyper-sonic wind tunnel constructed at the Institute of Space and AeronauticalScience, University of Tokyo. The diameter of the test section is 200 mm(8 inches) and the flow duration is about 120 seconds at Mach numbers 7 and8. Fig. 20 indicates the details of the test chamber.
/-Nozzle Second Throat
Jet Catcher Ejector-,
FIG. 20 — Test chamber of hypersonic wind tunnel
Figures 21 and 22 show some results obtained by this wind tunnel. As tothe pressure distributions over a sphere for Mach numbers 7 and 8, theexperimental results indicate a good agreement with the theory(7 '8).
Gun tunnels
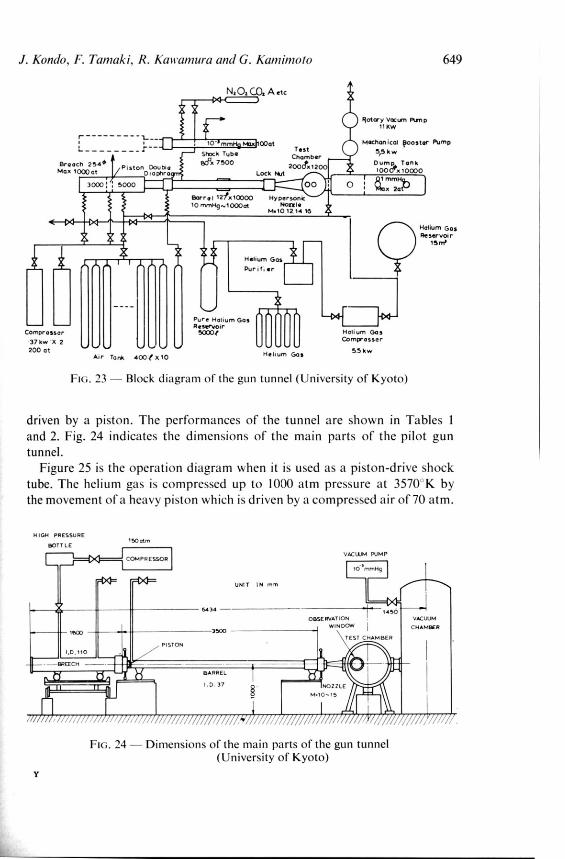
Gun tunnels are used as shock tubes to investigate real gas effects as wellas conventional wind tunnels for hypersonic aerodynamics. Fig. 23 showsthe block diagram of the large size gun tunnel which will be completed byMarch 1967 at the University of Kyoto. It can be used in two ways, namelyeither as a hypersonic gun tunnel driven by air or helium, or as a shock tube
Test Chamber
Model
Sting /- Strut

1.0
M.= 5.8
0.5
O Presnt Exp.LM:
—gan Dyke
Oliver Exp. Mcor5.8
o
o
00 25 5 0 75 e(deg) 100
Flo. 21 — Surface pressure distribution on a semi-sphere at high Mach numbers
0,5
Rb
0.4
0.3
0.2
Presnt Exp.
Oliver
Rainey
Crawford. MccauleyA Charters
Sugimoto
— Van DykeLighthill Constant
N.
0.11 2 3 4 5 7 8M 9
Flo. 22 — Stand-off distance of bow shock wave in front of a sphere for various Mach numbers
J. Kondo, F. Taniaki, R. Kawamura and G. Kamhnoto 649
N,ORCO.A etc
Rotary Vocurn Pump 111(W
- –
Br Go ER 2 540Piston DoueMax 1000 et
bliaphra
3000 5000
• 10- mrn Max 00atT•st
SI1004 TubeChamber
sycgi 7 500200A1200
Lock Nut
Meehan !cal li1003ter Pump
55 kw
u T cnokci ma
were! 121 x1000010 rnrnHa,1000at
oo 0.103"x"2 :P
Hp personiNorele
M.10 12 14 IS
Helium Gas
Our It i or
Helium Gas
Reservoir 15rn'
Pure Helium GasReservoir
Comprasser5000e
37 kw 'X 2
200 atAir Tar* 4C0 t X10
Helium Gas
Helium Gas Compr asser
5 5 kw
Flo. 23 — Block diagram of the gun tunnel (University of Kyoto)
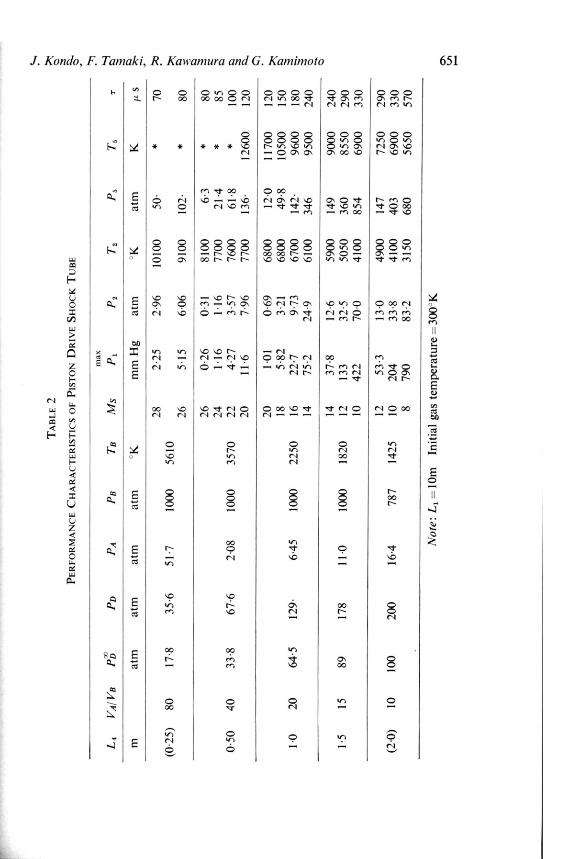
driven by a piston. The performances of the tunnel are shown in Tables 1and 2. Fig. 24 indicates the dimensions of the main parts of the pilot guntunnel.
Figure 25 is the operation diagram when it is used as a piston-drive shocktube. The helium gas is compressed up to 1000 atm pressure at 3570K bythe movement of a heavy piston which is driven by a compressed air of 70 atm.
H IGH PRESSURE150 au,
BOTT LE
COmPRESSORVACUUM PUMP
10 'mmHg
UNIT IN rn-n
64341450
leCe 3500
BARREL
I .0. 37
OBSERVATIONWINDOW
VACUUM
CHAMBER
TEST CHAMBER
LID 110
- —BREECH
PISTON
NOZZLE
M.10 -15
Flo. 24 — Dimensions of the main parts of the gun tunnel(University of Kyoto)
650 Aerospace Proceedings 1966
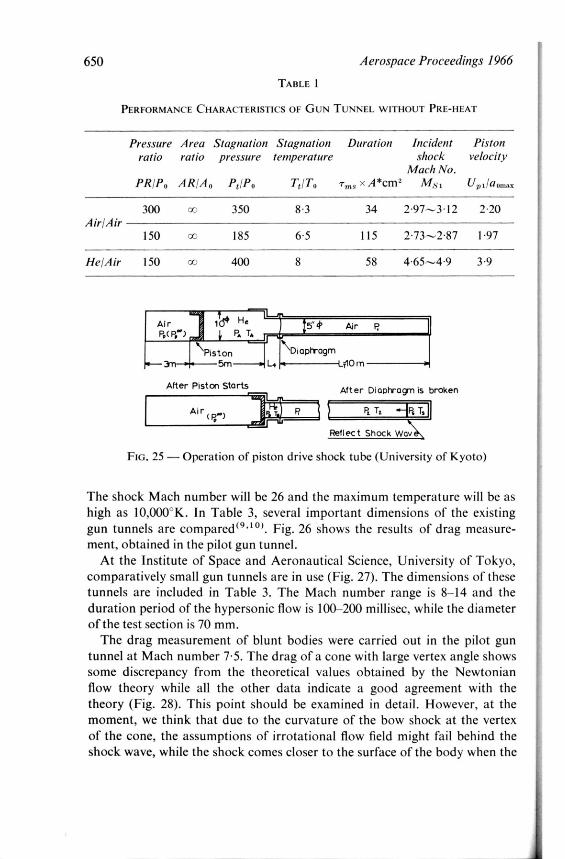
TABLE
PERFORMANCE CHARACTERISTICS OF GUN TUNNEL WITHOUT PRE-HEAT
Pressure Area Stagnation Stagnation Duration Incident Pistonratio ratio pressure temperature shock velocity
Mach No.
PRIPo ARIA() PdP0 TilTo Tms X A *cm2 AIN1 Upliaoma.
300 'Y.: 350 8-3 34 2.97-3.12 2.70Airl Air
150 oc) 185 6.5 115 2.73-2.87 1-97
Hel Air 150 7..c, 400 8 58 4-65-4-9 3-9
Air ids He 5 4, AirPA TA
\ Piston \ Diaphragm
5m L4 iO IT1
After Piston StartsAfter Di opl-rog-n is broken
Air(r) T
FIG. 25 — Operation of piston drive shock tube (University of Kyoto)
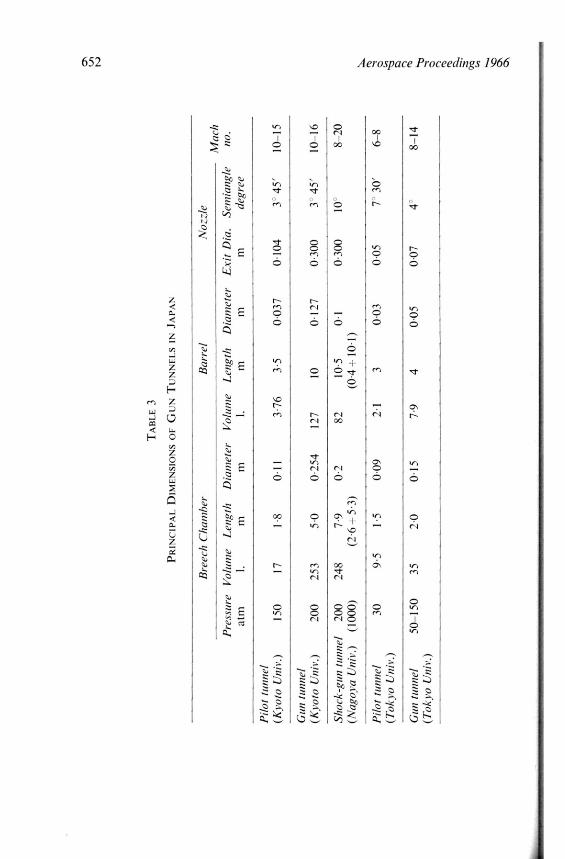
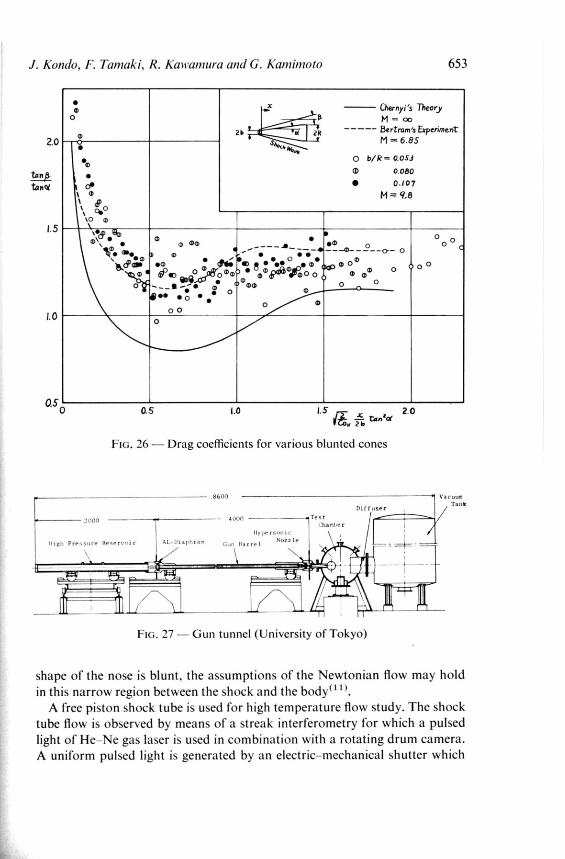
The shock Mach number will be 26 and the maximum temperature will be ashigh as 10,000°K. In Table 3, several important dimensions of the existinggun tunnels are compared19.' °). Fig. 26 shows the results of drag measure-ment, obtained in the pilot gun tunnel.
At the Institute of Space and Aeronautical Science, University of Tokyo,comparatively small gun tunnels are in use (Fig. 27). The dimensions of thesetunnels are included in Table 3. The Mach number range is 8-14 and theduration period of the hypersonic flow is 100-200 millisec, while the diameterof the test section is 70 mm.
The drag measurement of blunt bodies were carried out in the pilot guntunnel at Mach number 7.5. The drag of a cone with large vertex angle showssome discrepancy from the theoretical values obtained by the Newtonianflow theory while all the other data indicate a good agreement with thetheory (Fig. 28). This point should be examined in detail. However, at themoment, we think that due to the curvature of the bow shock at the vertexof the cone, the assumptions of irrotational flow field might fail behind theshock wave, while the shock comes closer to the surface of the body when the
J.
Kon
do,
F.
Tam
aki,
R.
Kaw
am
ura
and
G.
Ka
mim
oto
TA
BL
E2
PE
RF
OR
MA
NC
E
CH
AR
AC
TE
RIS
TIC
S
OF
P
IST
ON
D
RIV
E
SH
OC
K
TU
BE
L,
VA
I V
BP atm
PD
atm
PA
atm
P
atm
TB
-K
Ms
28
max
P1
mm
H
g
2.2
5
P2
atm
2-9
6
T2
K
10
100
P5
atm
50
.
T5
K
70
(0.2
5)
80
17.8
35-6
51.7
1000
561
0
26
5.1
56
-06
91
00
10
2-
80
26
0.2
60
.31
81
00
6.3
80
24
1-1
61
-16
770
02
1.4
85
0.5
040
33.8
67.6
2-0
810
00
357
022
4.2
73
.57
76
00
61
.8*
10
0
20
11.6
7.9
67
70
01
36
.1
26
00
12
0
20
1.0
10
-69
680
01
2-0
11
70
012
0
1
85.8
23
-21
680
04
9.8
10
50
01
50
1-0
20
64-5
129-
6.4
51
000
225
01
622-7
9-7
36
70
01
42-
96
00
18
0
1
475.2
24
.96
10
03
46
95
00
24
0
1
437-8
12
-65
90
01
49
90
00
24
01-5
15
89
178
11
-01
000
182
01
213
332
.550
50
36
085
50
29
0
10
422
70
.04
10
08
54
69
00
330
12
53.3
13
-04
90
01
47
72
50
290
(2-0
)10
100
200
16.4
78
714
25
10
204
33
.84
10
04
03
69
00
33
0
8790
83
.23
15
068
056
50
570
No
te:
L,
= 1
0m
In
itia
l gas te
mp
era
ture
=
30
0°K
TA
BL
E3
PRIN
CIP
AL
D
IME
NSI
ON
S O
F G
UN
T
UN
NE
LS
IN
JAPA
N
Pre
ssur
e at
m
Bre
ech
Cha
mbe
r
Vol
umeL
engt
h1.
mD
iam
eter
m
Vol
ume
1.
Bar
rel
Len
gthD
iam
eter
mm
Exi
t D
ia.
m
Noz
zle
—Se
mia
ngle
degr
ee
Mac
h no
.
Pil
ot
tunn
el
(K
yoto
U
niv.
)15
017
1.8
0.11
3.76
3.5
0-03
70.
104
345'
10-1
5
Gun
tun
nel
(K
yoto
U
niv.
)20
025
35-
00.
254
127
100.
127
0-30
034
5'10
-16
Shoc
k-gu
n tu
nnel
200
248
7.9
O.?
8210
.50.
10.
300
108-
20(N
agoy
a U
niv.
)(10
00)
(2.6
-i5
.3)
(0.4
+ 1
0 .1)
Pil
ot
tunn
el30
9.5
1.5
0.09
2-1
30.
030.
0573
0'6-
8(T
okyo
U
niv.
)
Giii
itu
nnel
50-1
5035
2.0
0.15
7.9
40.
050.
074
8-14
(Tok
yo
Uni
v.)
Aer
ospa
ce
Pro
ceed
ings
1966
J. Kondo, F. Tamaki, R. Kawamura and G. Kamimoto 653
2.0
•0
O
0
•
Chernyi 's Theory
M = oo— — Bertram's Experiment
NI 6.85
tonp •tang di
% 01 0\ cip
20 a,1.5
:,!64)• • 0 o Go---- a * •OE' o
184 ass -- 0 o- o
' e " • • ---- • • 0-4; —. II 'Is, OEM
11% 8 :•8. Wo'lo ° 0° 0 o7,, 0020)8•0 ma, 0 0
— __a —a,- • • ma, oc l) com o 0
• 0 • : 00
0 0
0
050 0.5 1.0 1.5 2.0
1(6,
Flo. 26 — Drag coefficients for various blunted cones
0 0.053
0 080
0.107
M = 9,8
OO
1.0
Test40000000
Ilypersen,
Nozzle000 Barrel0,01 Pre 1r r r
86 0 0
/
FIG. 27— Gun tunnel (University of Tokyo)
shape of the nose is blunt, the assumptions of the Newtonian flow may hold
in this narrow region between the shock and the body"I'.
A free piston shock tube is used for high temperature flow study. The shock
tube flow is observed by means of a streak interferometry for which a pulsed
light of He-Ne gas laser is used in combination with a rotating drum camera.
A uniform pulsed light is generated by an electric-mechanical shutter which
654 Aerospace Proceedings 1966
/, 0
blu ed cone
(Newtoni flow
34 bl ted cone
(Newtoni n flow)
I.' O. 2
o
e (Newto ian flow)
Experiments
0 cone
34# blunted cone
I 1:1 (":2 blunted cone
0 .20 4(0 60 10 /00 /20 14(0 /60 /10
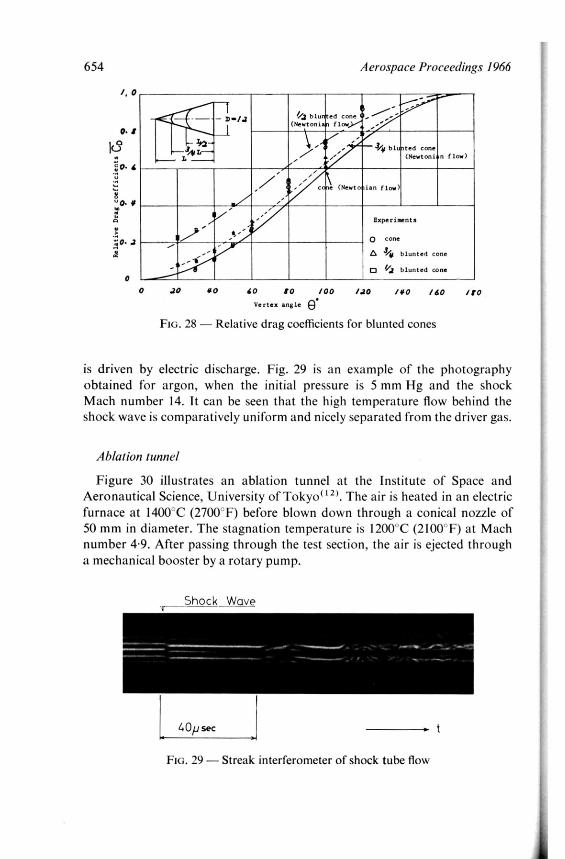
Vertex angle e.FIG. 28 — Relative drag coefficients for blunted cones
is driven by electric discharge. Fig. 29 is an example of the photography
obtained for argon, when the initial pressure is 5 mm Hg and the shockMach number 14. It can be seen that the high temperature flow behind the
shock wave is comparatively uniform and nicely separated from the driver gas.
Ablation tunnel
Figure 30 illustrates an ablation tunnel at the Institute of Space and
Aeronautical Science, University of Tokyo(I2). The air is heated in an electric
furnace at 1400°C (2700°F) before blown down through a conical nozzle of50 mm in diameter. The stagnation temperature is 1200°C (2100°F) at Machnumber 4.9. After passing through the test section, the air is ejected through
a mechanical booster by a rotary pump.
Shock Wave
40p sec
FIG . 29 — Streak interferometer of shock tube flow
t

J.
/Condo,
F.
Tam
aki,
R.
Kaw
am
ura
an
d
G.
Kam
imoto
main
heate
r la
ggin
g
heate
r nozzle
te
sting
diffu
ser
coole
r
' 0
0
0
0
00
0
0
0
0
0
--
0
0
0
• 00
06—
in N
1.5
00
360
41
500
383
66
I13
4.0
44
—_
FIG
.30
—A
bla
tion
tunnel
(Univ
ers
ity
of
Tokyo)
656 Aerospace Proceedings 1966
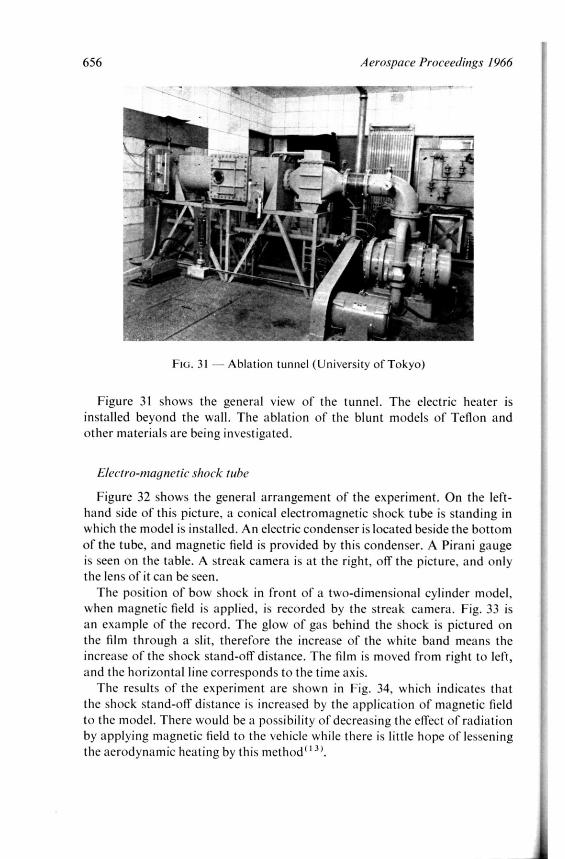
FIG. 31 -- Ablation tunnel ( (i niversity of Tokyo)
Figure 31 shows the general view of the tunnel. The electric heater isinstalled beyond the wall. The ablation of the blunt models of Teflon andother materials are being investigated.
Eleciro-inagnetic shock tube
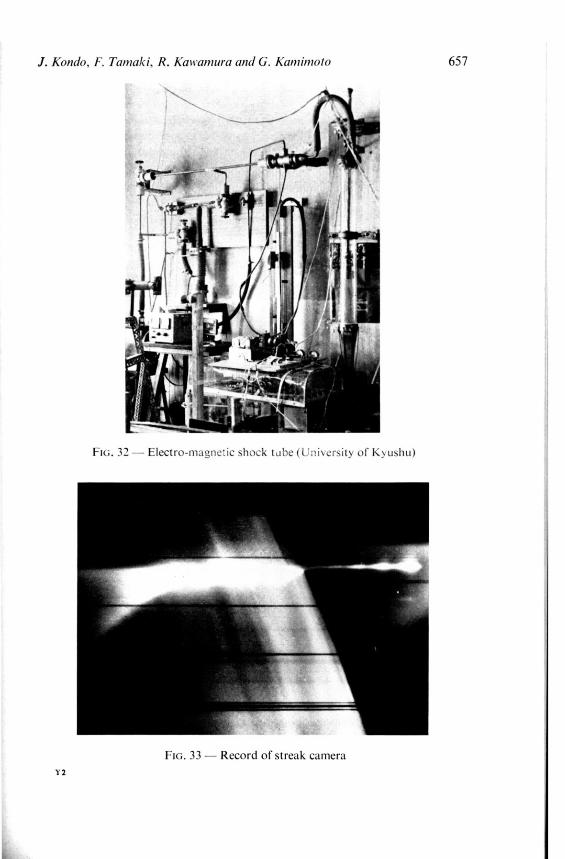
Figure 32 shows the general arrangement of the experiment. On the left-hand side of this picture, a conical electromagnetic shock tube is standing inwhich the model is installed. An electric condenser is located beside the bottomof the tube, and magnetic field is provided by this condenser. A Pirani gaugeis seen on the table. A streak camera is at the right, off the picture, and onlythe lens of it can be seen.
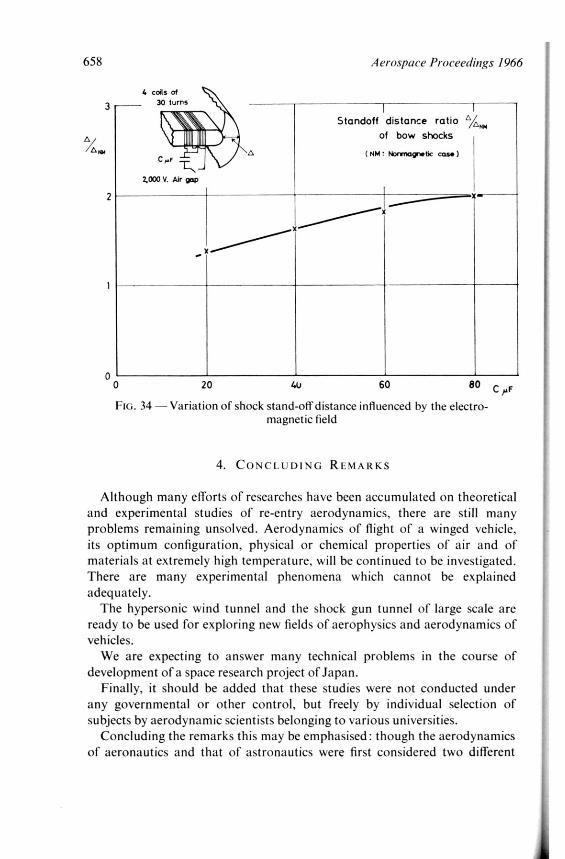
The position of bow shock in front of a two-dimensional cylinder model,when magnetic field is applied, is recorded by the streak camera. Fig. 33 isan example of the record. The glow of gas behind the shock is pictured onthe film through a slit, therefore the increase of the white band means theincrease of the shock stand-off distance. The film is moved from right to left,and the horizontal line corresponds to the time axis.
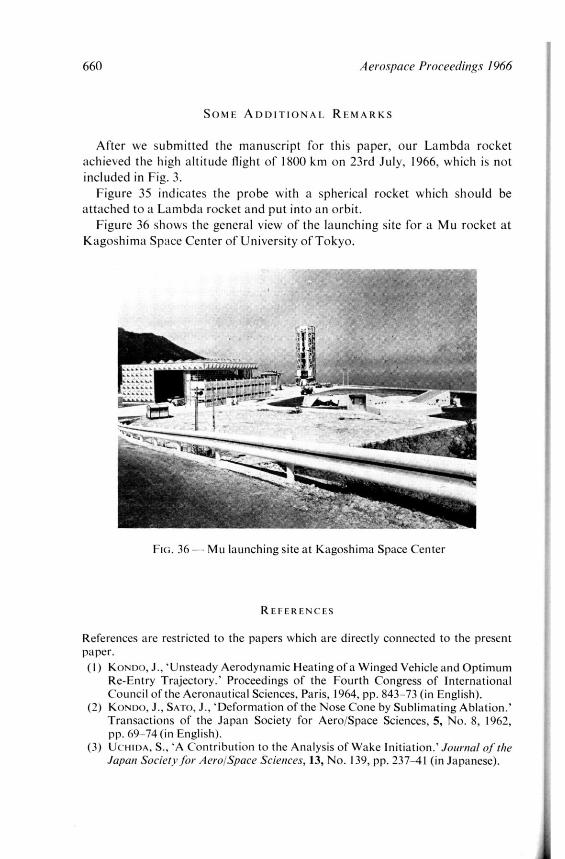
The results of the experiment are shown in Fig. 34, which indicates thatthe shock stand-off distance is increased by the application of magnetic fieldto the model. There would be a possibility of decreasing the effect of radiationby applying magnetic field to the vehicle while there is little hope of lesseningthe aerodynamic heating by this method''''.
J. Kondo, F. Tamaki, R. Kawamura and G. Kamimoto 657
Flu. 32 -- Electro-mw.znclic shock tobe ;u ,rsity of K ushu)
FIG. 33 — Record of streak camera
Y2
658 Aerospace Proceedings 1966
4 coils of
30 turns
C
"".
2.000 V. Air gap
3Standoff distance ratio VANm
of bow shocks
A ( NM : Nonmagnetic case )
2
oo 20 4U 60 80 C ,uF
FIG. 34 — Variation of shock stand-off distance influenced by the electro-
magnetic field
4. CONCLUDING REMARKS
Although many efforts of researches have been accumulated on theoreticaland experimental studies of re-entry aerodynamics, there are still manyproblems remaining unsolved. Aerodynamics of flight of a winged vehicle,its optimum configuration, physical or chemical properties of air and ofmaterials at extremely high temperature, will be continued to be investigated.There are many experimental phenomena which cannot be explainedadequately.
The hypersonic wind tunnel and the shock gun tunnel of large scale areready to be used for exploring new fields of aerophysics and aerodynamics ofvehicles.
We are expecting to answer many technical problems in the course ofdevelopment of a space research project ofJapan.
Finally, it should be added that these studies were not conducted underany governmental or other control, but freely by individual selection ofsubjects by aerodynamic scientists belonging to various universities.
Concluding the remarks this may be emphasised: though the aerodynamicsof aeronautics and that of astronautics were first considered two different

J. Kondo, F. Tamaki, R. Kawamura and G. Katnimoto 659
sciences, i.e., values such as velocity, density, pressure and temperature werethought to be fundamentally different in these two spheres of aerodynamics,our research on re-entry gradually proved a basic common feature betweenthem. Airstream can be treated as continuum flow or as particle flow andstudies from both sides are in progress. However, the problems directlyrelated to re-entry have so far been treated in the case of the continuum flowand aerodynamic studies hitherto done are chiefly concerned with it. Aero-dynamics of astronautics is not radically different from that of aeronautics,the former is rather the extension of the latter. It is interesting to notice thatregarding re-entry flight, there is no fundamental difference between the aero-dynamic characteristics of li fting vehicles and of aircraft.
We hope our present research can contribute to the progress of aeronauticsin the world. We also wish to take this opportunity to wish The InternationalCouncil of the Aeronautical Sciences continued success.
FIG. 35 — The Lambda rocket probe
660 Aerospace Proceedings 1966
SOME ADDITIONAL REMARKS
After we submitted the manuscript for this paper, our Lambda rocketachieved the high altitude flight of 1800 km on 23rd July, 1966, which is notincluded in Fig. 3.
Figure 35 indicates the probe with a spherical rocket which should beattached to a Lambda rocket and put into an orbit.
Figure 36 shows the general view of the launching site for a Mu rocket atKagoshima Space Center of University of Tokyo.
FIG. 36 — Mu launching site at Kagoshima Space Center
REFERENCES
References are restricted to the papers which are directly connected to the presentpaper.(1 ) KONDO, J., 'Unsteady Aerodynamic Heating of a Winged Vehicle and Optimum
Re-Entry Trajectory.' Proceedings of the Fourth Congress of InternationalCouncil of the Aeronautical Sciences, Paris, 1964, pp. 843-73 (in English).KONDO, J., SATO, J., 'Deformation of the Nose Cone by Sublimating Ablation.'Transactions of the Japan Society for Aero/Space Sciences, 5, No. 8, 1962,pp. 69-74 (in English).UCIIIDA, S., 'A Contribution to the Analysis of Wake Initiation.' Journal of theJapan Society for AerolSpace Sciences, 13, No. 139, pp. 237-41 (in Japanese).

J. Kondo, F. Tamaki, R. Kawamura and G. Kamimoto 661
KOURA, K., 'Distribution of Oxygen Molecules by Vibrational Excitation.'
Journal of the Japan Society for AerolSpace Sciences, 13, No. 140, 1965, pp. 296--299 (in Japanese).AKI, T., 'Inviscid Non-Equilibrium Flows through the Nose Region of a BluntBody.' Journal of the Japan Society fin. AerolSpace Sciences, 13, No. I40, 1965,pp. 288-95 (in Japanese).KONDO, J., 'The Effect of Radiation and Dissociation behind a Strong ShockWave.' Preprint of the Session B H of the Joint Meeting of the PhysicalSociety of Japan and the American Physical Society in Honolulu, Hawaii,Sept. 1965 (in English).KAWAMURA, R., KARASHIMA, K., SELO, K., 'Characteristics of the Blow-DawnType Hypersonic Wind Tunnel of Institute of Space and Aeronautical Science,University of Tokyo.' Journal of the Japan Society JOr AerolSpace Sciences, 13,No. I39, 1965, pp. 251-7 (in Japanese).KAWAMURA, R. et al. 'Report on the Supersonic Aerodynamics Laboratory.'Bulletin of the Aeronautical Research Institute, University of Tokyo, 3,No. 6 (B), 1963 (in Japanese).KAMIMOTO, G., 'A New Facility for Hypersonic Experiments.' Journal of the
Japan Society fuir AerolSpace Sciences, 13, No. 140, 1965, pp. 299-306 (inJapanese).KAMIMOTO, G., MORI, T., KIMURA, T., 'Performances Tests of the KyotoUniversity Hypersonic Gun Tunnel.' Journal of the Japan Society JO,- Aero;
Space Sciences, 11, No. 117, 1963, pp. 306-10 (in Japanese).HINADA, M., 'Some Experiments on the Hypersonic Flow Utilizing a GunTunnel.' Monthly Journal of the Institute of Industrial Science, University ofTokyo, 17, No. 10, Oct. 1965, p. 255 (in Japanese).OGUCHI, H. et al., 'The Flow Survey for a Free Piston Shock Tube.' Bulletinof Institute of Space and Aeronautical Science, University of Tokyo, 2, No. 2(A)(in Japanese).IMAHASHI, S., IWASAKI, M., 'Experiments on Shock Wave Velocities in theConical Electro-Magnetic Shock Tube.' Technology Reports of The KyushuUniversity, 37, No. 4, Jan. 1965 (in Japanese).
DISCUSSION
Dr. E. W. E. Rogers (Aero Division, National Physical Laboratory, Tedding-
ton, Middlesex, England): As someone concerned with hypersonic and re-entry aerodynamics research in the UK, I was very pleased to see the greatprogress made in Japan on this topic and the obvious enthusiasm that exists
there. The work is obviously progressing rapidly and we look forward to manysignificant advances from the Japanese laboratories. I have two matters on
which further information would be welcome. First, how is the research programme in this area devised and co-ordinated ? Is there some central
committee which selects problems and prevents duplication ? Second, thereseems to be little reference in the paper to low-density aerodynamics; rarefied-gas effects can be important in many very high-speed flight con-

662 Aerospace Proceedings 1966
ditions. In Japan, Profs. Wada and Oguchi, among others, are active inthis topic. How does their research fit into the general scene?
Dr. Kondo: We appreciate your kind comments on our work. It is a greatpleasure for us to introduce some of our achievements on re-entry aero-dynamics for those people of the world who are concerned about it.
The research group consists of about a dozen aerodynamicists, most ofthem are university professors and the others are connected with the Govern-ment research laboratories. The studies of the group are supported by theMinistry of Education, and we have obtained about £1700 per year as agroup. Obviously, this amount is too small to build experimental facilitiesdescribed in section 3 of our paper. However it is sufficient to supportmeetings of the group to discuss the use of facilities. There is not a strongcontrol on our research from any authority. Each member can take up hissubject according to his preference.
However the total number of aerodynamicists in Japan is not large, sincethere was a long vacancy of aeronautical activities after the War; and more-over the subjects of aerodynamics related with re-entry covers a wide range.Therefore, each individual needs to select a subject consciously not to overlapwith others. We have a close contact and know each other quite well. At thebeginning of each fiscal year, we used to meet to organise our individualresearch to be able to achieve the object of our project as a group.
Second, we know that the rarefied-gas dynamics is very important to under-stand the orbital flight situation of a space vehicle and some of our group arealso very interested in this field of aerodynamics. Professor H. Oguchi is amember of our group and he takes a part of our co-ordinated research.However, the most difficult aerodynamic problems associated with the re-entry stage of a vehicle occur in the comparatively low altitude where thedensity of air is dense, rather than in the upper atmosphere. Therefore werestricted ourselves for the present paper not to include the rarefied-gas effectand low density experimental facilities.


![Sistemas Embarcados Android - UFPR] · Outline Sistema Android Introdu˘c~ao Principais Caracter sticas Linux Kernel Principais M odulos Introdu˘c~ao I Desenvolvido para sistemas](https://img.pdfslide.us/doc/110x75/5c0362c209d3f2156d8c863b/sistemas-embarcados-android-ufpr-outline-sistema-android-introducao-principais.jpg)


![[Robert Grover Brown, Patrick Y. C. Hwang] Introdu(BookFi.org)](https://img.pdfslide.us/doc/110x75/55cf8f58550346703b9b63c5/robert-grover-brown-patrick-y-c-hwang-introdubookfiorg.jpg)