Embed Size (px)
Citation preview

i
HOW DOES “JUST-IN-TIME” SCAFFOLDING OF DESCRIPTIVE AND
INFERENTIAL STATISTICS WITHIN AN EXISTING, QUARTER-LONG, GROUP
POSTER PRESENTATION OF SURVEY DATA IMPACT UNDERGRADUATE
STATISTICS STUDENTS’ ABILITY TO APPLY THEIR LEARNING?
by
Ralph E. Spraker, Jr.
A professional paper submitted in partial fulfillment of the requirements for the degree
of
Master of Science
in
Science Education
MONTANA STATE UNIVERSITY Bozeman, Montana
July 2011

ii
STATEMENT OF PERMISSION TO USE
In presenting this professional paper in partial fulfillment of the requirements for
a master’s degree at Montana State University, I agree that the MSSE Program shall
make it available to borrowers under rules of the program.
Ralph E. Spraker, Jr. July 2011

iii
TABLE OF CONTENTS
INTRODUCTION AND BACKGROUND ........................................................................7
CONCEPTUAL FRAMEWORK ........................................................................................8
METHODOLOGY ............................................................................................................15
DATA AND ANALYSIS ..................................................................................................18
INTERPRETATION..........................................................................................................26
VALUES AND CLAIMS ..................................................................................................28
REFERENCES CITED ......................................................................................................31
APPENDICES ...................................................................................................................33
APPENDIX A: Learning through Our Statistics Project Survey Instrument .......34 APPENDIX B: Peer Group Evaluation Instrument ..............................................36 APPENDIX C: Statistical Poster Judging.............................................................38 APPENDIX D: Institutional Review Board .........................................................40 APPENDIX E: Student Informed Consent Form .................................................43

iv
LIST OF TABLES
1. Objectives of the Project. ...............................................................................................16
2. Triangulation Matrix of Research Components .............................................................16
3. Group Peer Ratings by Student ........................................................................................25
4. Judge Ratings of Poster Session ......................................................................................26

v
LIST OF FIGURES
1. Pre-Survey Question Modes from Learning from Our Statistics Project, (N = 13)…...18
2. Post-Survey Question Modes from Learning from Our Statistics Project, (N = 10)….19
3. Example of a Student-produced Survey from SexEd Group.…………………….……..20
4. Sample of Coded Raw Data from Student-produced Surveys from SexEd Group…....…21
5. Example of a Student-interpreted Dichotomous Data from SexEd Group…………….…22
6. Example of a Student-interpreted Likert Data from SexEd Group………………………23
7. Example of a Student-interpreted Ranking Data from SexEd Group……………………24
8. Example of a Student-produced Poster from SexEd Group…………………………...…25
9. Example of a Student-produced Poster from Introductory Biology…………………...…29
10. Example of a Student-produced Poster from Nursing Chemistry……….…………...…30

vi
ABSTRACT
The treatment of this project was based on the American Statistical Association’s (ASA) GAISE project recommendations on how students best learn statistics. I implemented a student-designed survey and poster project to provide an opportunity for my students to learn by constructing their own knowledge through active involvement and having modeled content and technology concepts and practice. They were assessed on their statistical thinking while doing open-ended investigative project as groups instead of as individuals. They received consistent and helpful feedback on their performance from their peers and through interactions with and judges. And they learned statistics better through using technology to discover conceptual understanding as they analyzed their own data.
7
INTRODUCTION AND BACKGROUND
I have been teaching mathematics and science content at the secondary level since
1987 and at the undergraduate level since 1993. I have been teaching undergraduate
statistics since 2007. This project was conducted at the Columbia, South Carolina campus
of South University, which has an enrollment of nearly 1500 students. The campus is
primarily non-traditional students enrolled in medically related majors. The Columbia
campus has a nursing program and a pharmacy school.
Research was conducted in my introductory statistics courses starting with the 13
students in my fall 2010 quarter. My former students had already been doing survey
projects for a couple of years, however, those projects had mostly been a proof of content
instead of a discovery of content and process by inquiry. During the fall 2010 quarter, I
reversed the order and presented content when it was needed. This just-in-time model
allowed students to need statistics in order to interpret data they had collected.
This application of inquiry to statistics required significant use of scaffolding of
the traditional descriptive and inferential statistics content. Scaffolding begins with
students’ pre-knowledge level and encourages them by providing the right amount of
support to move them to a higher level of understanding. I helped the students with their
spreadsheets, word processing, and presentation software to help them concentrate on
collecting and coding data, making pivot tables and charts, and formatting a large format
poster (36 x 56 inch). I provided this support term project to help students concentrate on
the process of using a survey to collect and present data.

8
This lead to the focus question of the study: How does just-in-time scaffolding of
descriptive and inferential statistics within an existing, quarter-long, group poster
presentation of survey data impact undergraduate statistics students’ ability to apply
learning?
CONCEPTUAL FRAMEWORK
Science and mathematics educators have advocated forms of inductive pedagogy
since the early 1900’s (DeBoer, 1991). Inductive pedagogy proposes that knowledge was
actively constructed by learners and was not transmitted by teachers. Constructivism, the
notion that learners construct their own knowledge, followed the early developmental
psychologist Piaget (1896-1980) who believed individuals constructed their own personal
meaning and that knowledge survived when individuals saw it as viable and abandoned it
when it was not. Therefore, a teacher’s role in education is to induce dissonance in order
to create conceptual conflict within their students and then help them to resolve their
conflict (Lawson, Abraham & Renner, 1989). Presenting data that did not fit their
learners’ existing core beliefs made it more viable for learners to accommodate new data
producing conceptual changes within their learners’ core beliefs (Posner, Strike, Hewson,
and Gerztog, 1982).
Recent proponents of constructivism have also been interested in understanding
teachers’ thought processes to discover what effective inquiry teaching is (Fang, 1996).
Inquiry pedagogy requires both teachers and students to adopt different perception of
their roles than those used in traditional didactic instruction. Crawford (2000) identified
some roles that inquiry-based teachers might adopt including “mentor, motivator, guide,

9
and innovator” (p. 931). The roles of their students were understood to be that of active
learners who constructs their own knowledge. Inquiry activity generates questions,
courses of action, and data from observation in order to draw appropriate conclusions (D.
Llewellyn, 2002).
Much of the philosophical and theoretical rationale that underlies the modern
reform movement in education has been based on constructivism (von Glasersfeld, 1989).
Reformers followed Piaget’s principle that, “To know an object is to act on it…to
modify, to transform the object, and to understand the process of the transformation, and
as a consequence to understand the way the object is constructed” (Piaget, 1964, p. 176).
Thus, learners construct their own knowledge through interaction with their world, both
people and things.
The National Research Council’s Inquiry and the National Science Education
Standards (2000) summarized, “Understanding science is more than knowing facts. The
emphasis of recent research has been on learning for understanding, which means gaining
knowledge that can be used and applied to novel situations” (p. 116). Modern reformers
have rejected traditional pedagogy’s emphasis on passive memorization of facts to active
learning and constructing of conceptual knowledge through inductive pedagogy.
A recent reform study by the National Research Council, How People Learn:
Brain, Mind, Experience, and School, was the product of the Committee on
Developments in the Science of Learning (Bransford, Brown & Cocking, 2000). The
report summarized the most important findings from neuroscience, cognitive psychology,
and human development research and how it applied to the education. The findings
present a more integrated view of memory, problem solving, reasoning, learning,

10
metacognition, and symbolic thinking. The research suggested that teachers who want to
be "learner centered" should pay “careful attention to the knowledge, skills, attitudes, and
beliefs that learners bring to the educational setting” (p. 133). Learner-centered academic
environments include teachers who:
Are aware that learners construct their own meanings, beginning with the
beliefs, understandings, and cultural practices they bring to the classroom.
If teaching is conceived as constructing a bridge between the subject
matter and the student, learner-centered teachers keep a constant eye on
both ends of the bridge. (p. 136)
Constructing that bridge included having teachers who not only have a good
understanding of content knowledge but also strong pedagogical content knowledge
(PCK). PCK uses effective strategies to help learners construct specific content
knowledge by taking into account their learners’ prior knowledge, beliefs, and cultural
experience (Bransford, et al., 2000).
Constructivist pedagogical content knowledge filtered into the statistical
educational community through its overlap with mathematics content. Guidelines for
statistical education were published in the Mathematical Association of America (MAA)
publication Heeding the Call for Change: Suggestions for Curricular Action (Cobb et al.,
1992). Cobb emphasized statistical thinking, using student data, and fostering active
learning and extended constructivist pedagogical content knowledge to undergraduate
curriculum (Aliaga et al., 2005).
In 2003, the American Statistical Association (ASA) funded the Guidelines for
Assessment and Instruction in Statistics Education or “GAISE” project that included a

11
focus group on introductory college courses (Aliaga et al., 2005). The collegiate focus
group wrote that, “We endorse the ideas in the three original goals found in the Cobb
report and have expanded them in light of today’s situation” (p. 7). This fixed Cobb’s
(1992) work as the accepted recommendations for teaching introductory statistics courses
(p. 1).
The GAISE project college focus group expanded upon Cobb and made six
recommendations for the teaching of introductory undergraduate statistics:
• Emphasize statistical literacy and develop statistical thinking;
• Use real data;
• Stress conceptual understanding rather than mere knowledge of
procedures;
• Foster active learning in the classroom;
• Use technology for developing conceptual understanding and
analyzing data;
• Use assessments to improve and evaluate student learning (Aliaga et
al., 2005. p. 1).
The co-founders of the American Statistical Association’s international research
forums, Garfield and Ben-Zvi (2007), explored how to improve student learning of
statistics by connecting and building on relevant research from psychology, learning and
cognition, statistics, and mathematics education. In 2007, Garfield presented a paper to
the ASA that provided an overview of current research on teaching and learning statistics
that summarized many studies conducted by researchers from different disciplines
focused on students at all levels. Her review stated the implications of the current
research in terms of eight principles for learning statistics. These clearly continued the
statistical constructivist tradition of Cobb (1992) and the GAISE project (2005).

12
Four of their eight principles on how students learn statistics are by constructing
knowledge, by active involvement in learning activities, by practice, and when they receive
consistent and helpful feedback on their performance (Garfield & Ben-Zvi, 2007).
As Garfield and Ben-Zvi (2007) wrote, “Teaching is not telling, learning is not
remembering. Regardless of how clearly a teacher or book tells them something, students
will understand the material only after they have constructed their own meaning for what
they are learning” (p. 387). Donovan, Bransford and Pellegrino (1999) writing for the
National Research Council agreed, “To develop competence in an area of learning,
students must have both a deep foundation of factual knowledge and a strong conceptual
framework” (p. 2). Obtaining factual information is not enough. Learners must master
concepts to have deep understanding of information. They must transform and construct a
random set of facts into usable knowledge. The teacher’s role is to coach students
beyond their preexisting understanding (Bransford et al., 2000, p. 19).
The conceptual framework allows experts to organize information
into meaningful patterns and store it hierarchically in memory to facilitate
retrieval for problem solving. And unlike pure acquisition of factual
knowledge, the mastery of concepts facilitates transfer of learning to new
problems. (Donovan et al., 1999, p. 2)
Another aspect to help statistical students to construct knowledge is to provide
scaffolding to support and augment what learners can do to help them reason a path to
understanding (Vygotsky, 1978). “Scaffolding allows learners to participate in complex
cognitive performances, such as scientific visualization and model-based learning that is
more difficult or impossible without technical support” (Bransford, et al., 2000, p. 243).

13
Kester, van Merrienboer, and Baumer (2001) argued that scaffolding could be
presented just-in-time (JIT) as in on-the-job training. “The learner would be presented
with the information needed to carry out a task precisely when it is used” (Kester, et al.,
2001, p. 373). “Prerequisite information” (i.e., facts, concepts, etc.) should be presented
“during the learning of how to do a task” (Kester, et al., 2001, p. 377). “Supportive
information” (i.e., mental, causal, or conceptual models) should be presented while
practicing the task “to promote the construction of new schemas through application”
(Kester, et al., 2001, p. 377).
Learning is an active process and should not be evaluated by high stakes
assessments only. Alternative assessment takes into consideration that learning may start
out slowly but increase in speed as the learner starts to master the concepts of the new
domain. As Bransford et al. (2000) have stated, “Often, evidence for positive transfer
does not appear until people have had a chance to learn about the new domain—and then
transfer occurs and is evident in the learner’s ability to grasp the new information more
quickly” (p. 236).
There have been many constructivist studies on alternative assessment by
researchers of college introductory statistics. All of these emphasize approaches that
involve alternative assessments, as my survey project, that are more active. For example,
Keeler & Steinhorst (1995) investigated cooperative learning and found that when
students worked in pairs, their final grades were significantly higher and that fewer
students dropped the course than in previous semesters.
Giraud (1997) found cooperative learning using random assignment of students in
groups with a range of ability provided an opportunity for the more competent students to

14
scaffold tasks with less competent students. Magel (1998) also found that implementing
cooperative groups in a large lecture class produced a significant increase on average
exam scores compared to traditional pedagogy.
Meletiou & Lee (2002) used the Project-Activities-Cooperative Learning-
Exercises or PACE model that emphasized statistical thinking, reasoning and discovery
of results from data. Students were assessed on their understanding at the beginning and
end of the course with an observed increase in understanding on tasks requiring statistical
reasoning.
Bransford, et al. (2000) believe that learning a new content takes time and
deliberate practice that enables students to monitor their learning so, “that they seek
feedback and actively evaluate their strategies and current levels of understanding. Such
activities are very different from simply reading and rereading a text” (pp. 235-236).
Zieffler (2008) reported that “Research suggests that it takes time, a well thought out
sequence of learning activities, appropriate tools, and discussion questions. Good
reasoning about important statistical concepts can be developed very carefully using
activities and tools given enough time and revisiting of these ideas” (p. 12).
Therefore, the conceptual framework used by this project was a constructivist
understanding on how students learn statistics. This framework believes students
construct knowledge best though active involvement in their learning, practice, and
feedback from their mentors. This framework’s foundation was based upon early
constructivism (Piaget and Vygotsky), the National Research Council, and modern
statistical constructivism (Cobb and GAISE).

15
METHODOLOGY
The aim of this project was to improve my practice to help my students construct
their content knowledge of statistics by implementing the GAISE project
recommendations. I began by examining my existing practice in order to improve my
pedagogical content knowledge of statistics. I also learned from experts (i.e., more
knowledgeable others) and collaborated with my peers to move my practice forward.
What I learned was that students learn statistics by constructing knowledge through
active involvement in learning activities that provide modeled practice in statistics. I
learned to assess statistical thinking by having students do open-ended investigative
projects as groups instead of as individuals where they receive consistent and helpful
feedback on their performance. They learn statistics better when technology helps them
to discover conceptual understanding as they analyze data.
My project was conducted during the fall 2010 quarter. During the quarter,
students in my undergraduate introductory statistics course worked in self-selected
groups of three to four students to analyze posters from prior quarters’ students. Each
group then produced their own project survey, spreadsheet, summary, and poster using
the former student projects as models. The objectives for the project are listed in Table 1.
The group artifacts were rich in complexity and provided evidence for several of the
research components of my capstone (Table 2).
Additionally, whole group discussions about statistical content always followed
small group activities. I modeled computer applications only when the students needed
the technology. I encouraged the students to interpret the statistical results only after they
were able to see charts generated from there pivot table data.

16
Table 1 Objectives of the Project
The objectives of the project were to enable students to:
• Use research principles to design, create, and implement a survey instrument.
• Use statistical principles to analyze, and interpret data obtained from a survey.
• Use technology to communicate findings from survey data.
Feedback and assessment were provided by peers and by myself during the
project and after milestones were accomplished. I constructed at least nine instruments
designed to collect evidence for specific research components. At least three instruments
were used to collect evidence for each particular component.
Table 2 Triangulation Matrix of Research Component
Research Component Evidenced from
Active-learning Student-produced
Data Project Surveys Project Spreadsheets Project Executive
Summaries
Group Projects Project Posters Post- and Post-Surveys
Project Executive Summaries
Peer Review Assessment
Group Peer Ratings
Post- and Post-Surveys
Project Posters Ratings by Peers
Scaffolding Modeling
Project Posters (from prior quarters)
Post- and Post-Surveys
Project Posters Ratings by
Judges
Technology Project Posters (PowerPoint)
Project Spreadsheets (Excel)
Project Executive Summaries
(Word)
The Learning Through our Statistics Project survey was administered both pre
and post-treatment (Appendix A). The survey contained 10 questions in a Likert-scale
format. The data was coded 0 for strongly disagree, 1 for disagree, 2 for neutral, 3 for

17
agree and 4 for strongly agree. The data was analyzed for comparison between the
surveys for reporting in the analysis section.
The Peer Group Evaluation instrument (Appendix B) was administered at least
twice each quarter to provide peer review assessment of each group member’s
contribution to the project. The form provided the directions to evaluate yourself and
every member of your group by circling the overall contribution to the Group Project
choices. The five choices to circle were Awesome, Reliable, Good, Ok, Poor. Results for
each student were scored, compared, and analyzed for gains or losses and used for a
participation assessment.
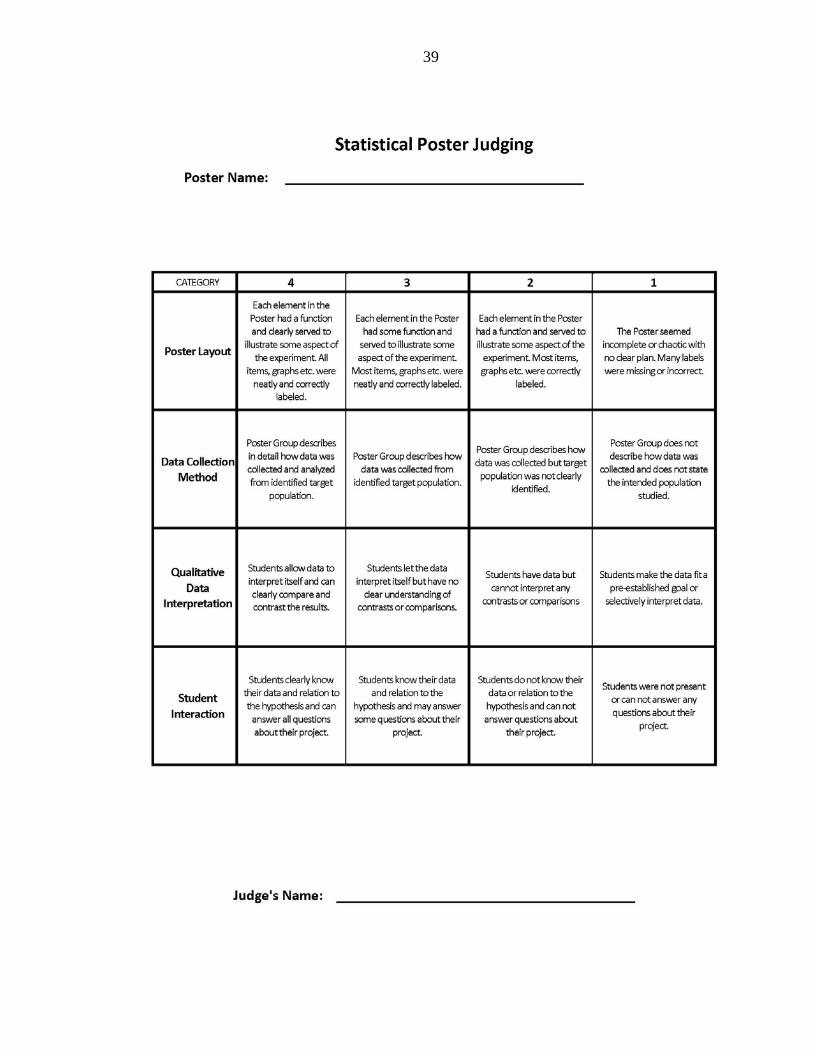
Peer Poster Ratings were administered as a group-to-group peer assessment. A
poster session provided an opportunity to communicate the findings of their projects
before external judges and their peers. “Statistical Poster Judging” was rubrics designed
for external assessments by content knowledge experts (Appendix C). Analysis of all
Lickert qualitative data used modes, modal classes, counts, and percent of totals.
Findings were discussed with my instructors and my peers from the Montana
State University EDCI 509 and 575 courses and peers from my university. Each quarter
provided an opportunity to do more data collection, analysis, iterative integrations and
revisions of my implementation based on my findings. Final findings from all three
iterations were collected into an online collection including a virtual poster and presented
at the Capstone Conference.
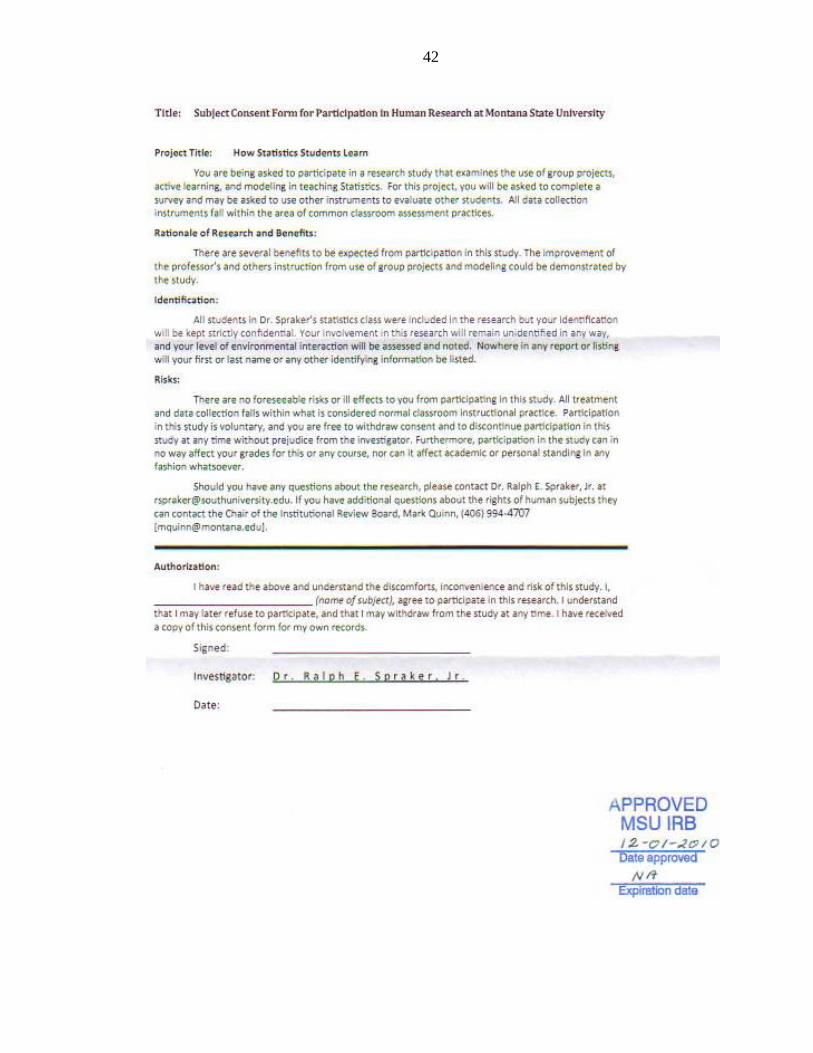
The research methodology for this project received an exemption by Montana
State University’s Institutional Review Board (Appendix D) and compliance for working
with human subjects was maintained. Specifically, my question, “How does my “just-in-
18
time” scaffolding of descriptive and inferential statistics within an existing, quarter-long,
group poster presentation of survey data impact my undergraduate statistics students’
ability to apply their learning?” was approved for research.
DATA AND ANALYSIS
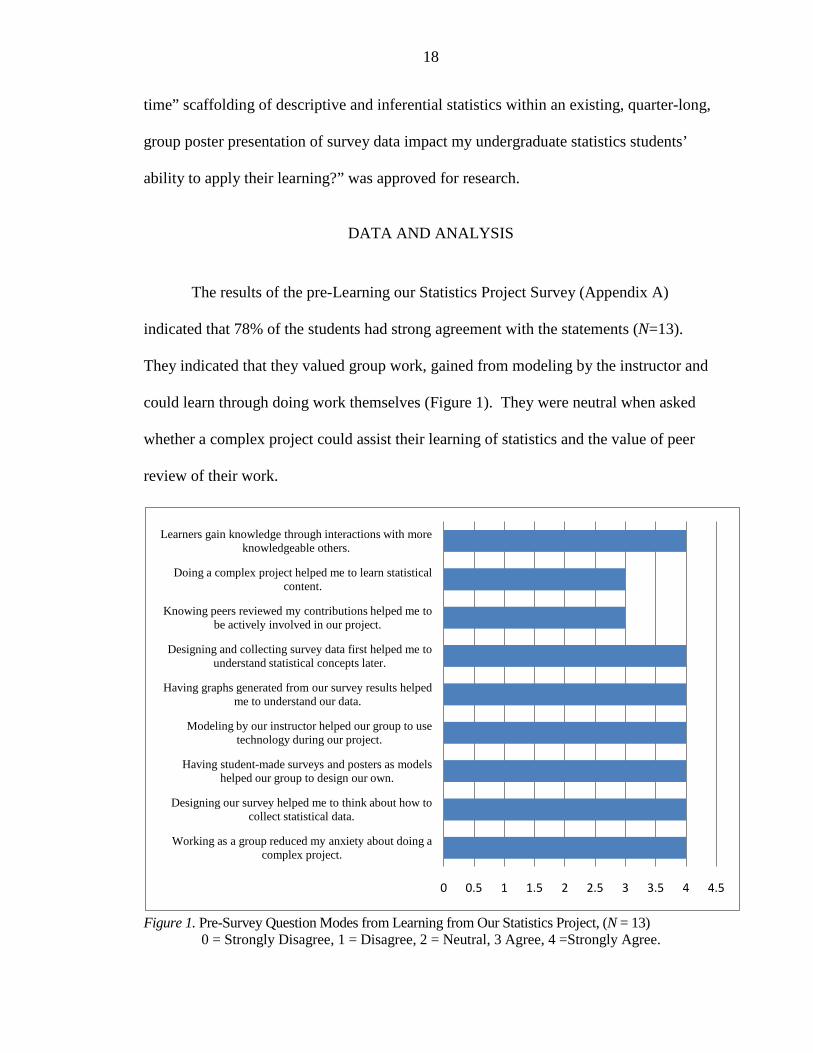
The results of the pre-Learning our Statistics Project Survey (Appendix A)
indicated that 78% of the students had strong agreement with the statements (N=13).
They indicated that they valued group work, gained from modeling by the instructor and
could learn through doing work themselves (Figure 1). They were neutral when asked
whether a complex project could assist their learning of statistics and the value of peer
review of their work.
Figure 1. Pre-Survey Question Modes from Learning from Our Statistics Project, (N = 13)
0 = Strongly Disagree, 1 = Disagree, 2 = Neutral, 3 Agree, 4 =Strongly Agree.
0 0.5 1 1.5 2 2.5 3 3.5 4 4.5
Working as a group reduced my anxiety about doing a complex project.
Designing our survey helped me to think about how to collect statistical data.
Having student-made surveys and posters as models helped our group to design our own.
Modeling by our instructor helped our group to use technology during our project.
Having graphs generated from our survey results helped me to understand our data.
Designing and collecting survey data first helped me to understand statistical concepts later.
Knowing peers reviewed my contributions helped me to be actively involved in our project.
Doing a complex project helped me to learn statistical content.
Learners gain knowledge through interactions with more knowledgeable others.

19
The post-survey results (N=10) indicated strong agreement in all areas (Figure 2).
The most significant areas of growth (22%) occurred in the two previously neutral survey
responses. The students, by the end of the term, believed that doing a project helped them
to learn a complex concept, statistics; and that peer review helped them to stay actively
committed to their project.
Figure 2. Post-Survey Question Modes from Learning from Our Statistics Project, (N = 10).
0 = Strongly Disagree, 1 = Disagree, 2 = Neutral, 3 Agree, 4 =Strongly Agree.
The students demonstrated actively learning statistics through student-produced
projects. First, groups designed their own surveys after group discussions to collect data
(Figure 3). They used dichotomous, Likert-type and ranking style questions in the
surveys. They also collected gender and age data.
0 0.5 1 1.5 2 2.5 3 3.5 4 4.5
Working as a group reduced my anxiety about doing a complex project.
Designing our survey helped me to think about how to collect statistical data.
Having student-made surveys and posters as models helped our group to design our own.
Modeling by our instructor helped our group to use technology during our project.
Having graphs generated from our survey results helped me to understand our data.
Designing and collecting survey data first helped me to understand statistical concepts later.
Knowing peers reviewed my contributions helped me to be actively involved in our project.
Doing a complex project helped me to learn statistical content.
Learners gain knowledge through interactions with more knowledgeable others.

20
Figure 3. Example of a Student-produced Survey from SexEd Group.
By way of example, the sex education research group collected 100 surveys from
their target population and conducted two simple random samples of 36 surveys using a
random number table. They coded the data from the simple random samples and created
spreadsheets (with Microsoft Excel) using their own numeric codes to interpret the
qualitative raw data produced from their surveys (Figure 4).

21
Figure 4. Sample of Coded Raw Data from Student-produced Surveys from SexEd Group.
The students then used a spreadsheet to create pivot tables from their raw data for
each simple random sample and produced bar graphs for their dichotomous data (Figure
5). They then interpreted this data and wrote a summary for later reporting and
presentation.

22
Figure 5. Example of a Student-interpreted Dichotomous Data from SexEd Group.
The students next used the spreadsheets to make additional pivot tables from their
raw data for their dichotomous data from the simple random samples. They produced bar
graphs (Figure 6), interpreted this data, and wrote a summary for later reporting and
presentation.

23
Figure 6. Example of a Student-interpreted Likert Data from SexEd Group.
Finally the student groups used spreadsheets to make another set of pivot tables
from their raw data for their ranking data from the simple random samples. They
produced bar graphs (Figure 7) to interpret the data, and wrote a summary for later
reporting and presentation.

24
Figure 7. Example of a Student-interpreted Ranking Data from SexEd Group.
The summaries and sets of bar graphs were incorporated into Word documents as
a summary. After interactions from both the instructor and the other groups, adjusted
summaries and graphs were imported into a template to make a 36 inch x 56 inch poster
(Figure 8). These were then presented before judges and the general public in a poster
session.

25
Figure 8. Example of a Student-produced Poster from SexEd Group.
The results of the Peer Group Evaluation Form indicated that the group peer
average ratings ranged from 4.56 to 5.00 (Table 2). This provided evidence that three
groups rated each other very highly as contributors. Only one group rated a single
member as a poor contributor.
Table 3. Group Peer Ratings by Student. 5 = Awesome, 4= Reliable, 3 = Good, 2= Ok, 1 = Poor
Group/Student 1 2 3 4 Average Group A 5.00 4.50
4.75
Group B 4.33 4.67 4.67
4.56 Group C 5.00 5.00 5.00
5.00
Group D 5.00 5.00 5.00 5.00 5.00
Results from the Statistical Poster Judging rubric (Appendix C) used by the
judges indicated a more moderate assessment of all three group projects (Table 3). Judges
rated Group D higher (3.3 to 3.7) on methodology, data interpretation and their

26
interactions with the judges. The other three groups were rated lower, especially on data
interpretation (2.8 to 3.1). The judges’ interaction with the students was considered a
positive input by the students. One student wrote, “The feedback given by judges were
helpful.”
Table 4. Judge Ratings of Poster Session (Rubric scored 1 to 4)
Ratings by Judges Group A Group B Group C Group D
Poster Layout 3.3 3.3 3.3 3.3
Method 3.1 3.2 3.1 3.5
Data Interpretation 2.8 3.1 2.8 3.7
Student Interaction 3.2 3.4 3.2 3.7
INTERPRETATION
Survey and qualitative data from the triangulation matrix included student-
produced posters plus the peer and judge assessments of their posters. These data
converge to indicate that my students learned statistical content from the treatment. The
students demonstrated critical thinking in their decisions on a survey topic and
development of a theme into questions designed to produce data. They also had find
patterns in the raw data to interpret in summaries.
Their interpretations were used to produce an APA style summary that included
references of their sources and documentation of their findings. This process increased
student’s statistical language and vocabulary skills. The project also helped the students
to increase their presentation and group skills. They learned about collaboration, how to
do research, how to write a survey and to gather data. They also demonstrated their
27
ability to assess and to interpret dichotomous, Lickert, and ranking data. They also
designed their posters to present their findings to both their peers and expert judges.
The findings of the treatment were consistent with the recommendations made by
the American Statistical Association’s (ASA) GAISE project on how students’ best learn
statistics. First, implementing a student-designed survey and poster project gave an
opportunity for my students to learn statistics by constructing their own knowledge. The
emphasis on statistical literacy allowed the students to develop their statistical thinking.
The student-designed survey and poster project allowed the students to learn
statistics through the GAISE emphasis on the use of real data. Students had to take the
raw data from their simple random sets of survey responses. Students transformed and
constructed usable knowledge from their survey data by coding and interpreting it into
bar graphs.
The student-designed survey group projects were also consistent with GAISE
recommendations to foster active learning and assessment through open-ended
investigative projects as groups. The projects also stressed conceptual understanding
rather than mere knowledge of procedures and had assessments designed to improve and
evaluate student learning.
GAISE recommended that statistical thinking should have modeled content. My
students received consistent and helpful feedback on their performance from their peers
and through interactions with me and judges. My students were allowed to construct their
knowledge while being supported and augmented to help them reason a path to
understanding.
28
GAISE recommended the use technology to develop conceptual understanding
and to analyze data. My students used spreadsheets to discover analysis from their own
data. They also used presentation and word processing software to produce presentations
as executive summaries and posters. One student wrote, “The project was great and very
fun! I loved working as a group.” Another student wrote, “The class was great I liked
working in groups and I liked how everyone’s hard work showed in the end.”
VALUES AND CLAIMS
The project demonstrated that the students could work at the higher levels of
analysis, application, and synthesis with statistical student-produced data. The students
also demonstrated critical thinking, questioning and expansion of their world views. One
student wrote, “I think it was an excellent way for us to learn statistics, rather than doing
strictly book work.” Another student wrote, “The project provided a broader outlook of
stats for me.”
I personally learned from the feedback of these projects and have modified each
iteration. This group project to poster technique has since been expanded to my own
chemistry and biology course. Judges from the poster session have since used this type of
project in microbiology and the general nursing curriculum.
This treatment helped me to develop as a constructivist teacher. I learned to
release control of learning and to allow students to construct their own statistical
knowledge. I had to allow some assessment to be made by judges and the students
themselves (as peers). I had to assume the roles of expert and coach and to continually
scaffold concepts and process to help them reason a path to understanding. I learned that

29
project-driven versus content-driven design gives responsibility, accountability, and self-
actualization to students. And as a result, students can thrive in an open, self-directed
environment. And this process takes them further in their learning than I could have ever
have taken them using a content-driven design. I learned that I can you use peer learning
across all subjects. Finally, I learned that when I step back, dictate less, and support more
the students break out of the teacher-imposed restrictions and student-imposed
restrictions on how learning occurs.
An extension of my treatment was to transfer project-driven posters to other
science courses. In my introductory biology, students researched systems biology topics
of their choice and presented during a poster session their findings (Figure 9). In my
nursing chemistry, nurses chose a pharmacological drug class and some representative
molecules and presented their findings during a poster session (Figure 10).
Figure 9. Example of a Student-produced Poster from Introductory Biology.

30
Additionally, professors from microbiology, anatomy and physiology, and
department chairs of nursing and business have requested my help in implementing
project-driven posters in their courses and programs.
Figure 10. Example of a Student-produced Poster from Nursing Chemistry.

31
.
REFERENCES CITED
Aliaga, M., Cobb, G., Cuff, C., Garfield J., Gould, R., Lock, R., Moore, T., Rossman, A., Stephenson, B., Utts, J., Velleman, P., & Witmer, J. (2005). Guidelines for Assessment and Instruction in Statistics Education (GAISE) Project. Washington, DC: American Statistical Association. Retrieved September 29, 2010, from www.amstat.org/education/gaise/.
Bransford, J., Brown, A.L., & Cocking, R.R. (Eds.). (2000). How people learn: Brain, mind, experience, and school. Washington, DC: National Academy Press.
Cobb, George. (1992). Teaching statistics. In Lynn A. Steen (Ed.), Heeding the call for change: Suggestions for curricular action (MAA Notes No. 22), 3-43.
Crawford, B.A. (2000) Embracing the essence of inquiry: New roles for science teachers. Journal of Research in Science Teaching, 37(9), 916-937.
DeBoer, G. E. (1991). A history of ideas in science education: Implications for practice. New York: Teachers College Press.
Donovan, M.S., Bransford, J.D., & Pellegrino, J.W. (1999) How people learn: Bridging research and practice. Washington, DC: National Academy Press.
Fang, Z. (1996). A review of research on teacher beliefs and practice. Educational Research, 38, 47-65.
Garfield, J. & Ben-Zvi, D. (2007). How students learn statistics revisited: A current review of research on teaching and learning statistics. International Statistical Review 75(3), 372–396. doi:10.1111/j.1751-5823.2007.00029.x.
Giraud, G. (1997, November). Cooperative learning and statistics instruction. Journal of Statistics Education, 5(3), 1-13. Retrieved September 29, 2010, from http://www.amstat.org/publications/jse/v5n3/giraud.html.
Keeler, C.M., & Steinhorst, R.K. (1995, July). Using small groups to promote active learning in the introductory statistics course: a report from the field. Journal of Statistics Education, 3(2), 1-10. Retrieved September 29, 2010, from http://www.amstat.org/publications/jse/v3n2/keeler.html.
Kester, L., Kirschner, P.A., van Merrienboer, J.J.G., & Baumer, A. (2001). Just-in-time information presentation and the acquisition of complex cognitive skills. Computers in Human Behavior 17, 373–391.
Lawson, A. E., Abraham, M. R., & Renner, J. N. (1989). A theory of instruction: Using the learning cycle to teach science concepts and thinking skills. Cincinnati, OH: National Association for Research in Science Teaching.

32
Llewellyn, D. (2005). Teaching high school science through inquiry: A case study approach. Thousand Oaks, CA Corwin Press
Magel, R.C. (1998, November). Using cooperative learning in a large introductory statistics class. Journal of Statistics Education, 6(3). Retrieved September 29, 2010, from http://www.amstat.org/publications/jse/v6n3/magel.html.
Meletiou, M., & Lee, C. (2002, December). Teaching students the stochastic nature of statistical concepts in an introductory statistics course. Statistics Education Research Journal, 1(2), 22-37.
National Research Council. (2000). Inquiry and the National Science Education Standards: A guide for teaching and learning. Committee on Development of an addendum to the National Science Education Standards on scientific inquiry: Center for Science, Mathematics, and Engineering Education. S. Olson and S. Loucks-Horsley (Eds.). Washington, DC: National Academy Press.
Piaget, J. (1964). Development and learning. Journal of Research in Science Teaching, 2(3), 176-178.
Posner, G.J., Strike, K.A., Hewson, P.W. & Gerztog, W.A. (1982). Accommodation of a scientific concept: Toward a theory of conceptual change. Science Education, 66(2), 211-227.
von Glasersfeld, E. (1989). Cognition, construction of knowledge, and teaching. Synthese, 80, 121 -140.
Vygotsky, L. (1978). Mind and Society. Cambridge, MA: Harvard University Press.
Zieffler, A., Garfield, J., Alt, S., Dupuis, D., Holleque, K. & Beng Chang, B. (2008). What does research suggest about the teaching and learning of introductory statistics at the college level? A review of the literature. Journal of Statistics Education, 16(2) from www.amstat.org/publications/jse/v16n2/zieffler.html.

33
APPENDICES
34
APPENDIX A
LEARNING THROUGH OUR STATISTICS PROJECT SURVEY INSTRUMENT

35

36
APPENDIX B
PEER GROUP EVALUATION INSTRUMENT

37

38
APPENDIX C
STATISTICAL POSTER JUDGING
39

40
APPENDIX D
INSTITUTIONAL REVIEW BOARD

41
42

43
APPENDIX E
STUDENT INFORMED CONSENT FORM

44