Embed Size (px)
Citation preview
Basic Descriptive Basic Descriptive StatisticsStatistics
Dr. YehDr. Yeh
Why?Why?
Descriptive statistics do just that: Descriptive statistics do just that: Describe Data!Describe Data!
What we’ll cover in this slidecastWhat we’ll cover in this slidecast– Mean (average)Mean (average)– MedianMedian– ModeMode– RangeRange
MeanMean
Fancy FormulaFancy Formula
µ = µ = X/NX/N
MeanMean
Fancy FormulaFancy Formula
µ = µ = X/NX/N
What this means: What this means: add up all your add up all your data, then divide data, then divide by the number of by the number of data pointsdata points
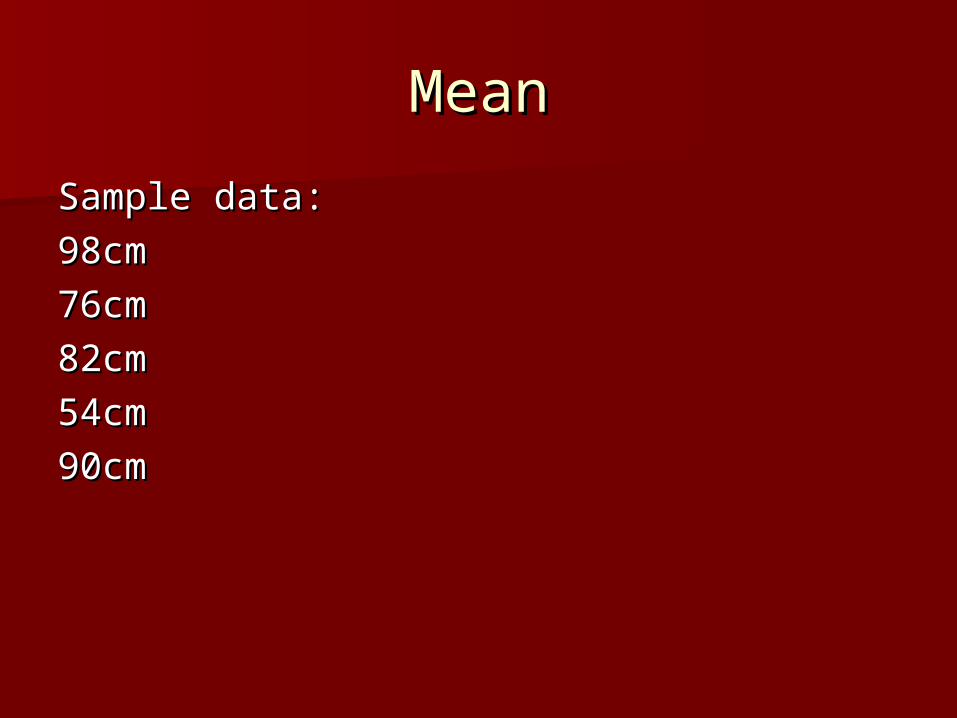
MeanMean
Sample data:Sample data:
98cm98cm
76cm76cm
82cm82cm
54cm54cm
90cm90cm
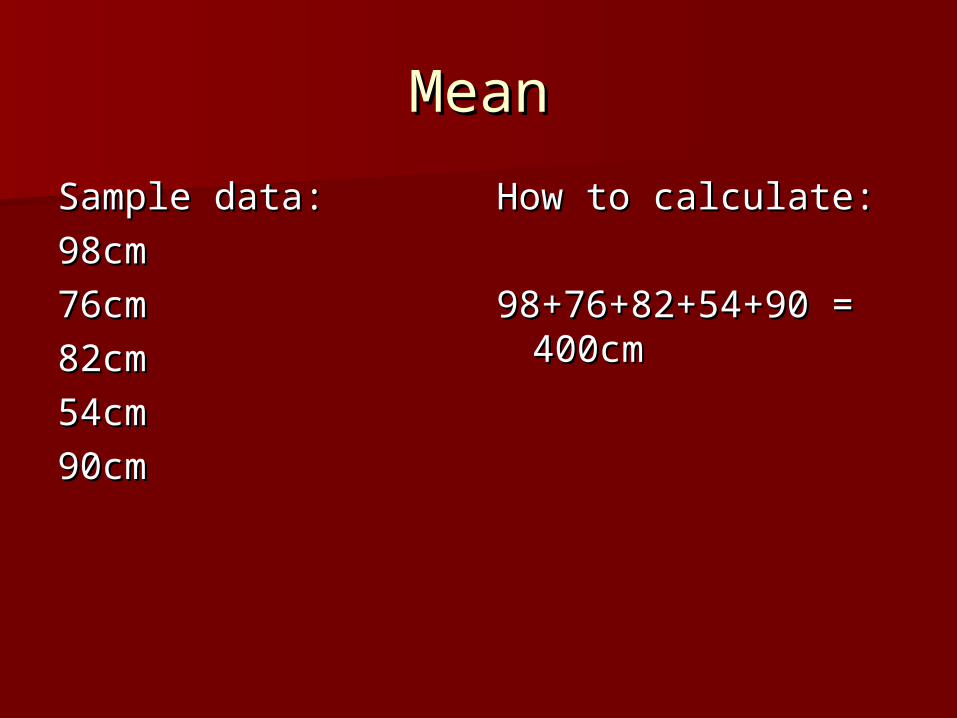
MeanMean
Sample data:Sample data:
98cm98cm
76cm76cm
82cm82cm
54cm54cm
90cm90cm
How to calculate:How to calculate:
98+76+82+54+90 = 98+76+82+54+90 = 400cm400cm
MeanMean
Sample data:Sample data:
98cm98cm
76cm76cm
82cm82cm
54cm54cm
90cm90cm
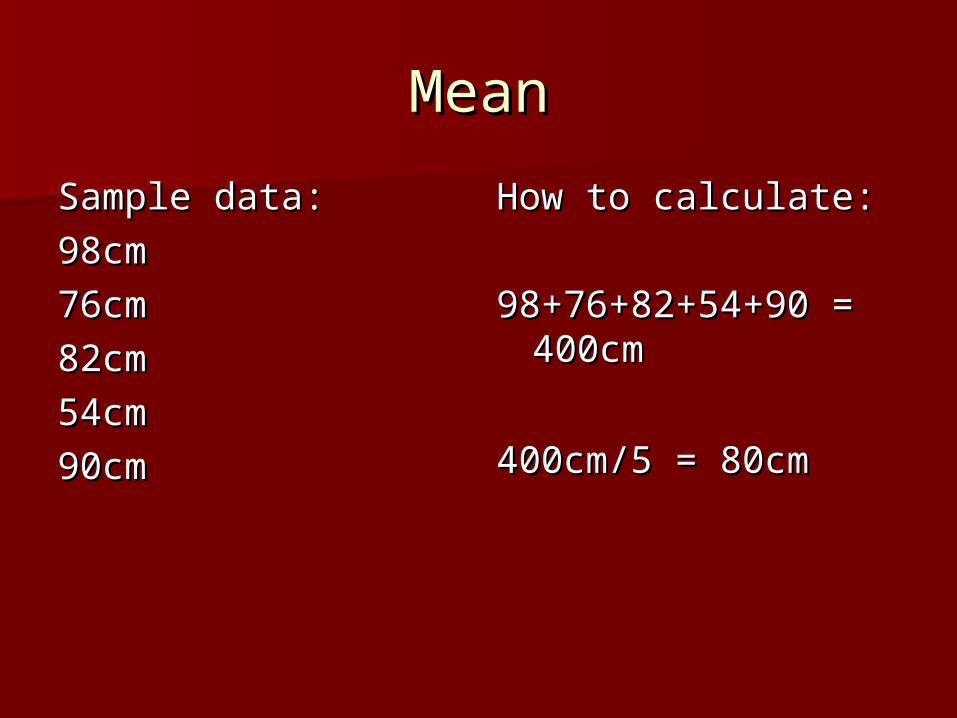
How to calculate:How to calculate:
98+76+82+54+90 = 98+76+82+54+90 = 400cm400cm
400cm/5 = 80cm400cm/5 = 80cm
MeanMean
Sample data:Sample data:
98cm98cm
76cm76cm
82cm82cm
54cm54cm
90cm90cm
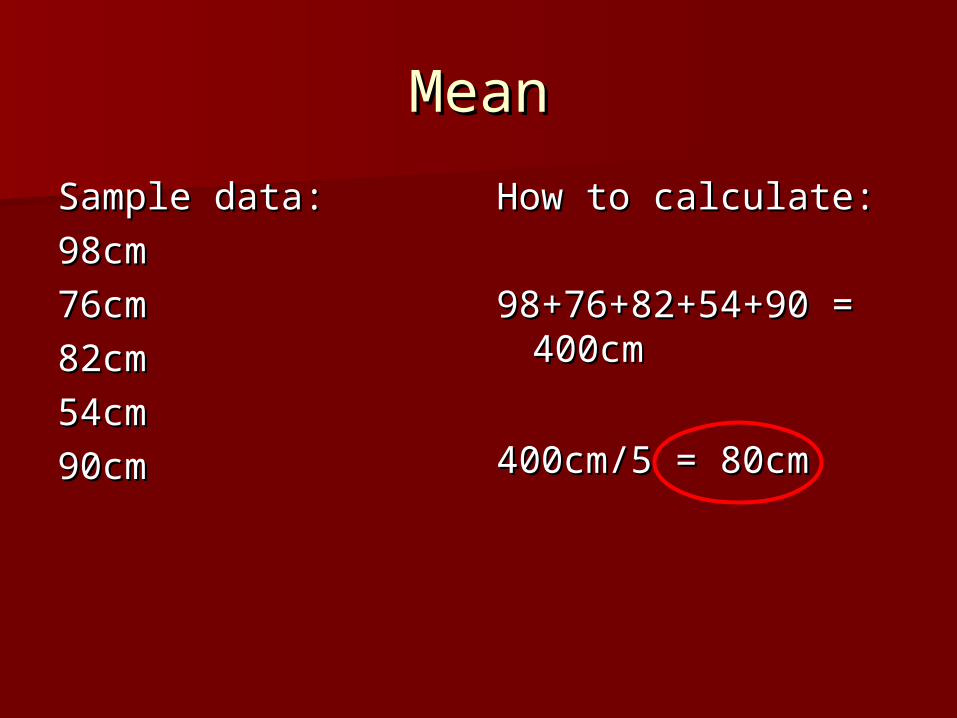
How to calculate:How to calculate:
98+76+82+54+90 = 98+76+82+54+90 = 400cm400cm
400cm/5 = 80cm400cm/5 = 80cm
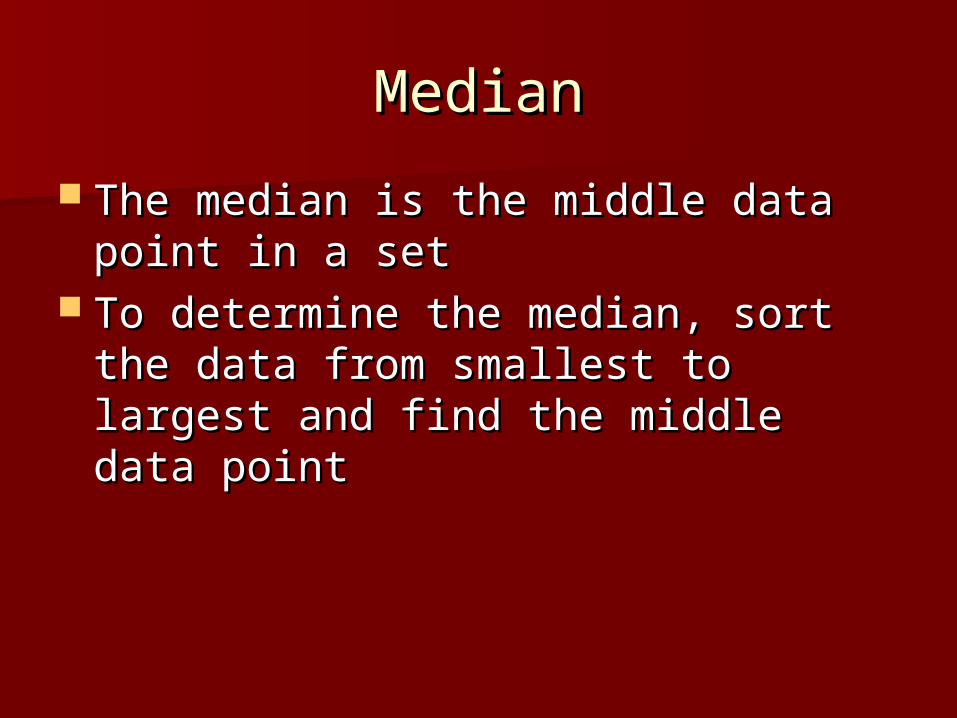
MedianMedian
The median is the middle data point The median is the middle data point in a setin a set
To determine the median, sort the To determine the median, sort the data from smallest to largest and data from smallest to largest and find the middle data pointfind the middle data point
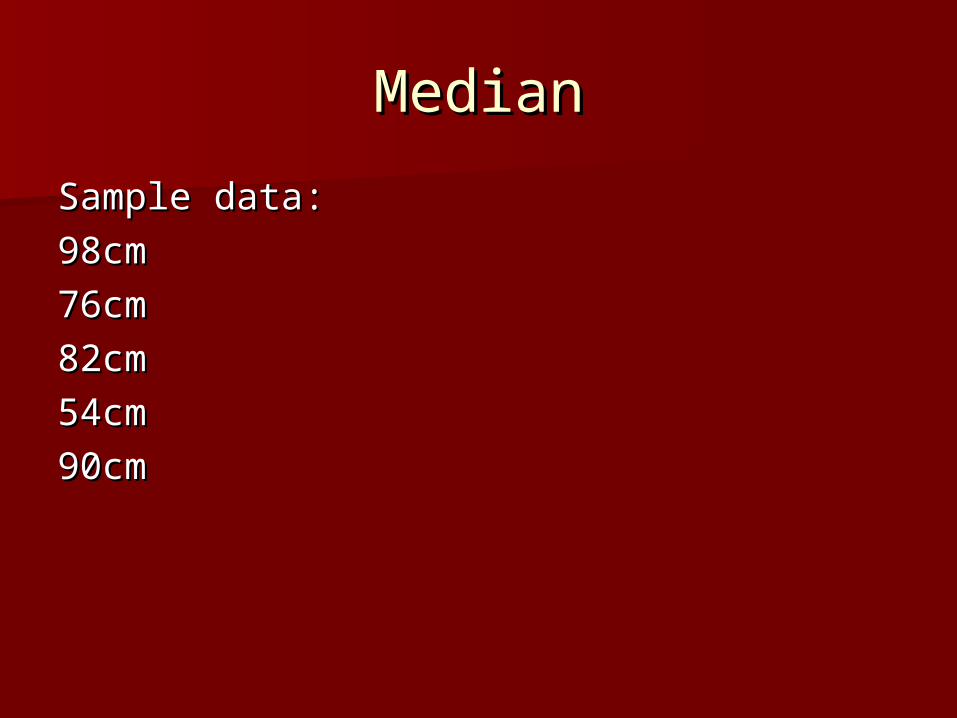
MedianMedian
Sample data:Sample data:
98cm98cm
76cm76cm
82cm82cm
54cm54cm
90cm90cm
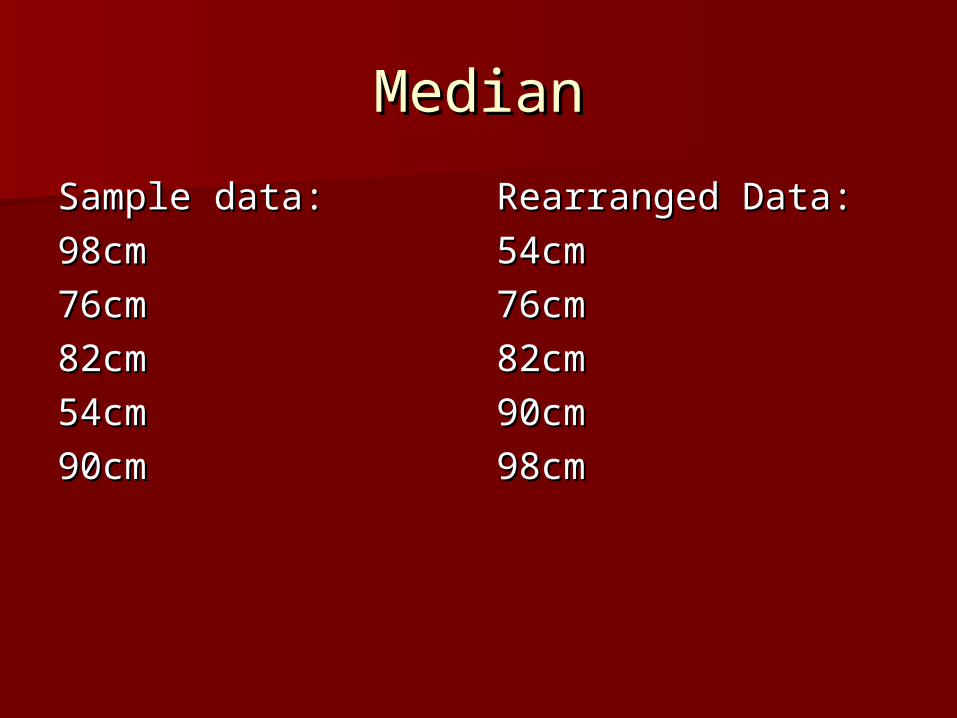
MedianMedian
Sample data:Sample data:
98cm98cm
76cm76cm
82cm82cm
54cm54cm
90cm90cm
Rearranged Data:Rearranged Data:
54cm54cm
76cm76cm
82cm82cm
90cm90cm
98cm98cm
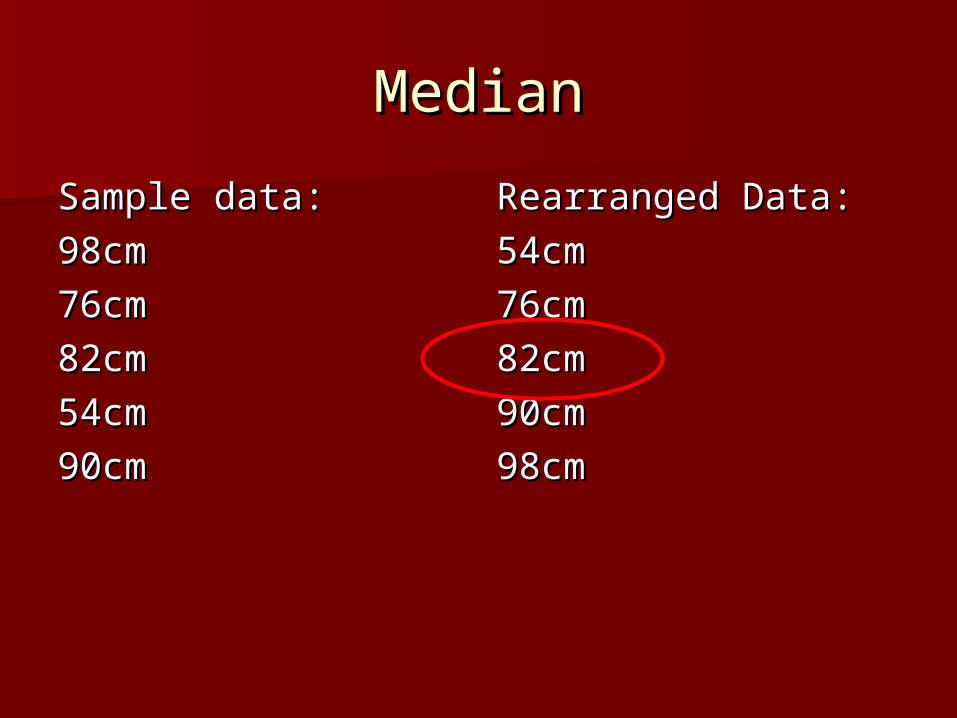
MedianMedian
Sample data:Sample data:
98cm98cm
76cm76cm
82cm82cm
54cm54cm
90cm90cm
Rearranged Data:Rearranged Data:
54cm54cm
76cm76cm
82cm82cm
90cm90cm
98cm98cm
MedianMedian
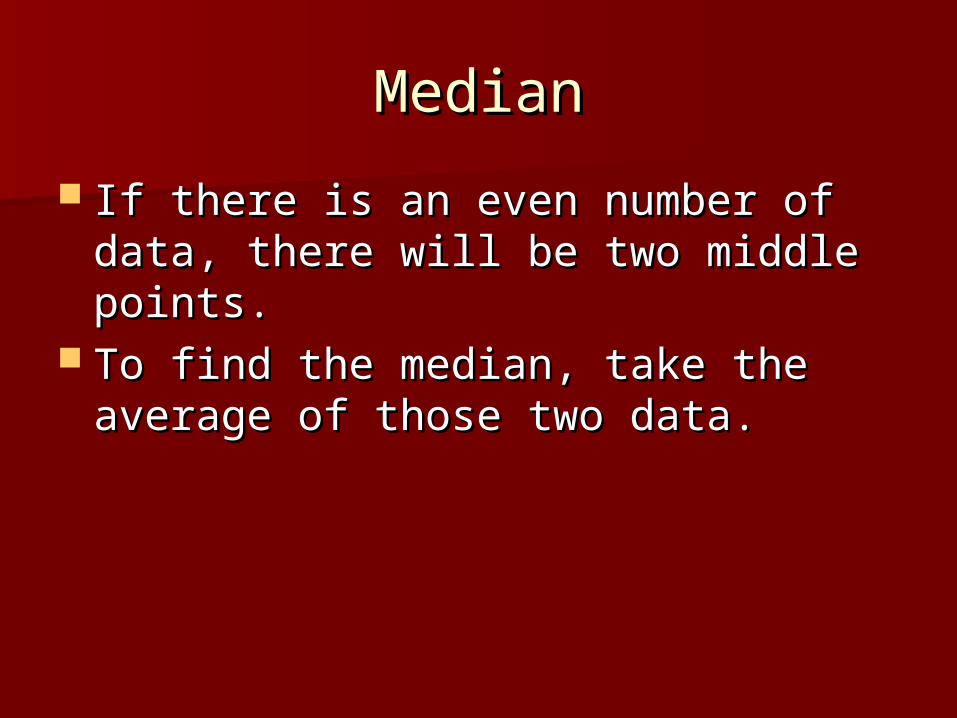
If there is an even number of data, If there is an even number of data, there will be two middle points.there will be two middle points.
To find the median, take the average To find the median, take the average of those two data.of those two data.
MedianMedian
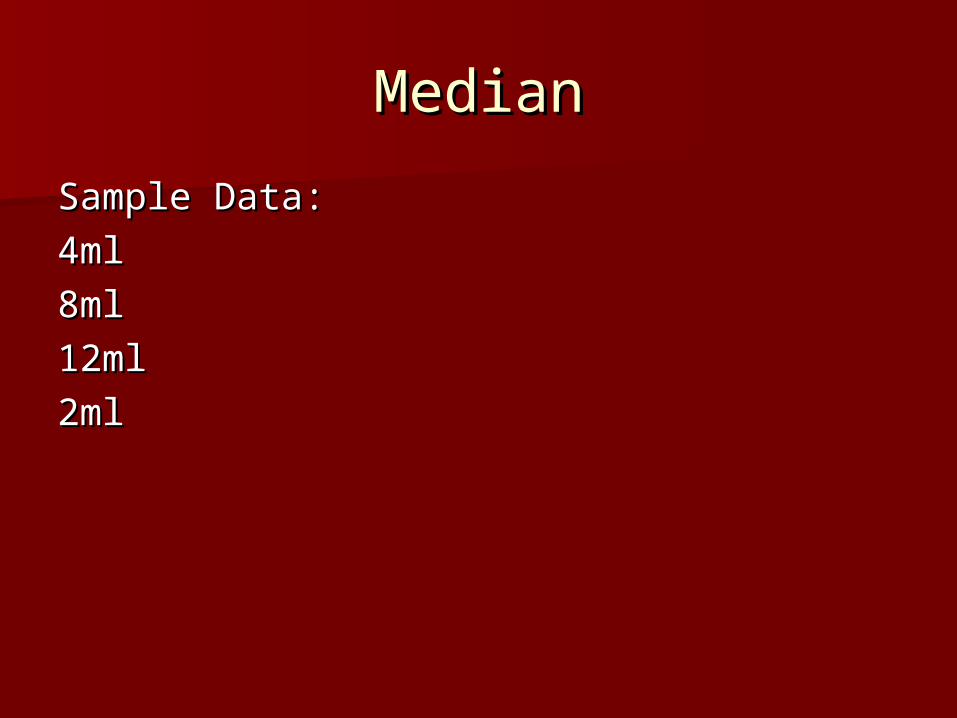
Sample Data:Sample Data:
4ml4ml
8ml8ml
12ml12ml
2ml2ml
MedianMedian
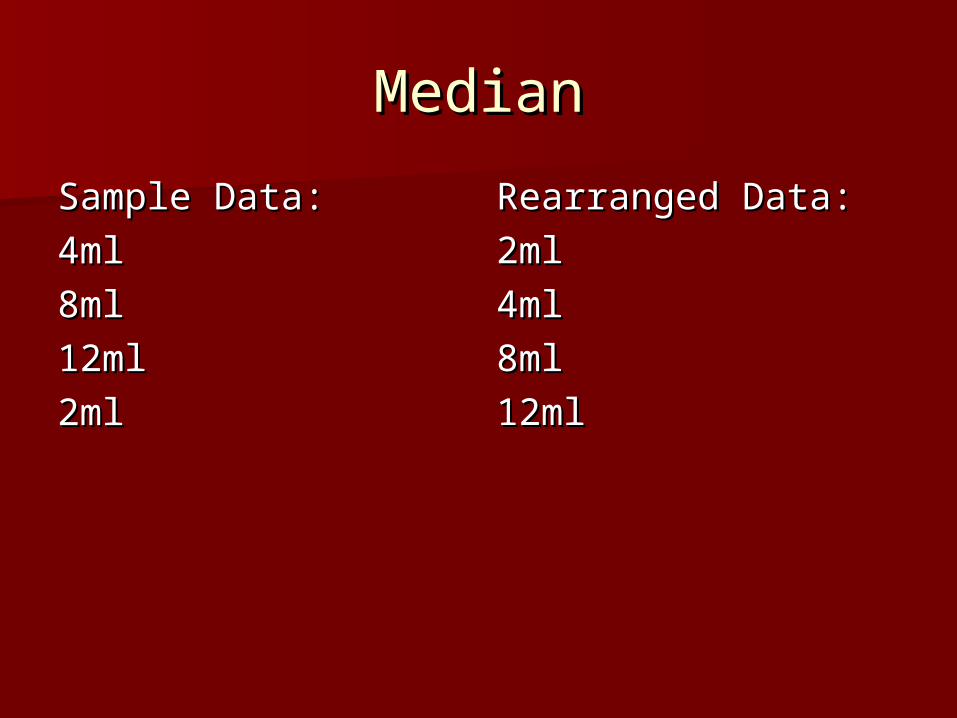
Sample Data:Sample Data:
4ml4ml
8ml8ml
12ml12ml
2ml2ml
Rearranged Data:Rearranged Data:
2ml2ml
4ml4ml
8ml8ml
12ml12ml
MedianMedian
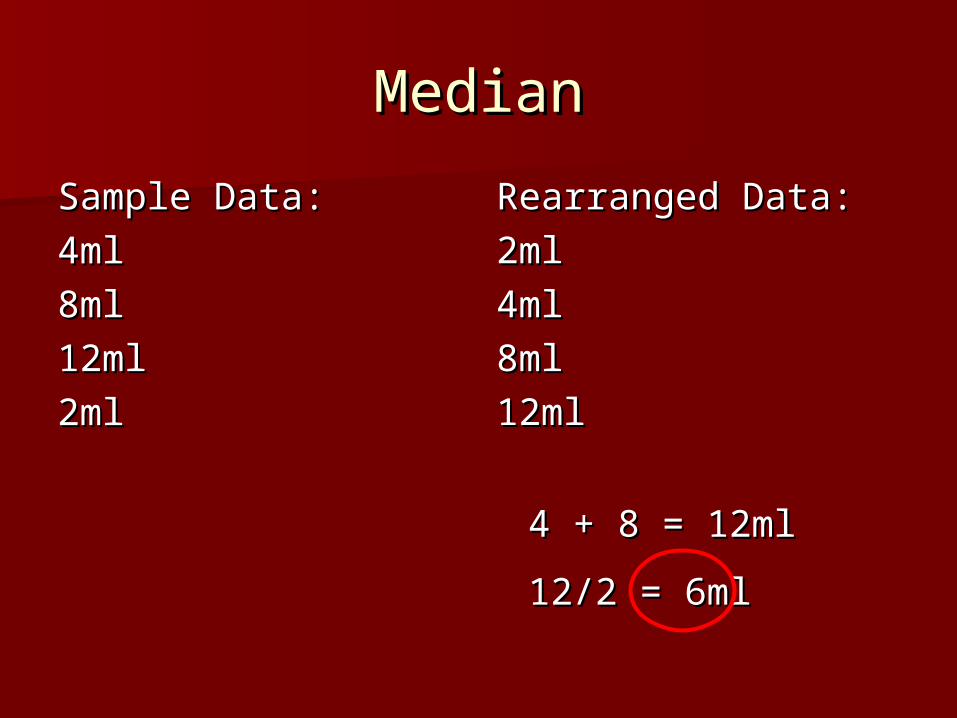
Sample Data:Sample Data:
4ml4ml
8ml8ml
12ml12ml
2ml2ml
Rearranged Data:Rearranged Data:
2ml2ml
4ml4ml
8ml8ml
12ml12ml
4 + 8 = 12ml4 + 8 = 12ml
12/2 = 6ml12/2 = 6ml
ModeMode
The mode is the most frequently The mode is the most frequently occurring data point.occurring data point.
To find the mode, arrange the data To find the mode, arrange the data from smallest to largest, and then from smallest to largest, and then determine which amount occurs determine which amount occurs most often.most often.
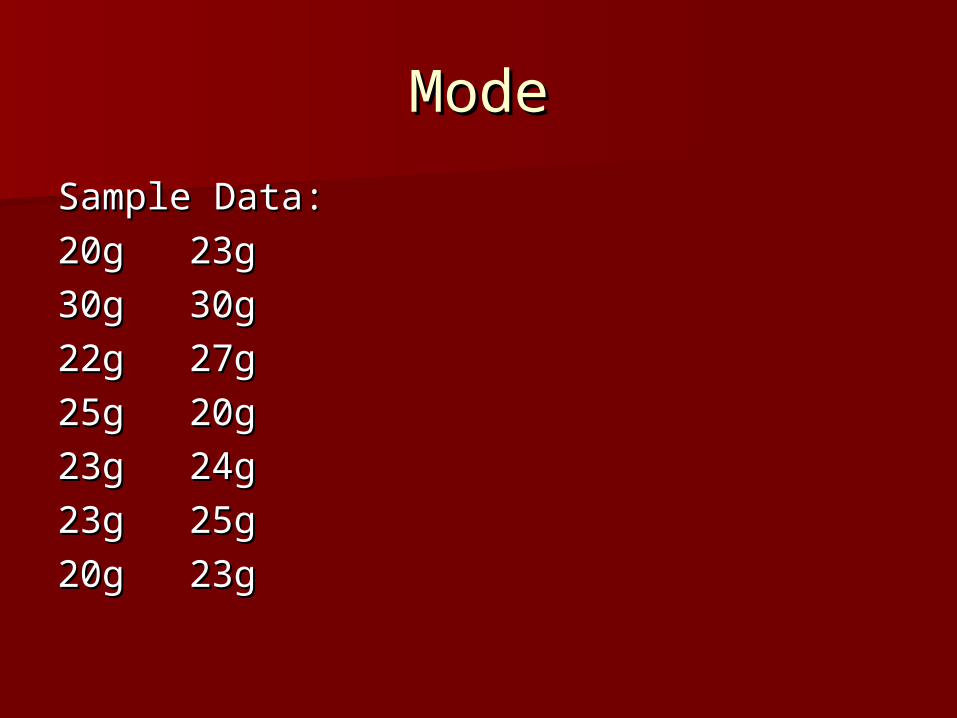
ModeMode
Sample Data:Sample Data:
20g20g 23g23g
30g30g 30g30g
22g22g 27g27g
25g25g 20g20g
23g23g 24g24g
23g23g 25g25g
20g20g 23g23g
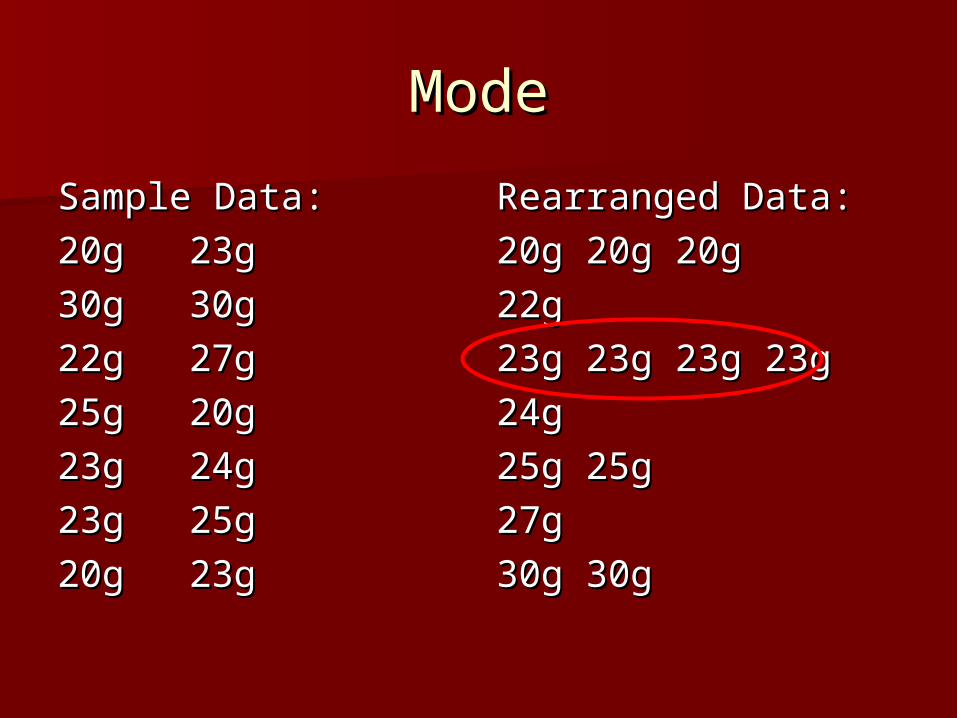
ModeMode
Sample Data:Sample Data:
20g20g 23g23g
30g30g 30g30g
22g22g 27g27g
25g25g 20g20g
23g23g 24g24g
23g23g 25g25g
20g20g 23g23g
Rearranged Data:Rearranged Data:
20g 20g 20g20g 20g 20g
22g22g
23g 23g 23g 23g23g 23g 23g 23g
24g24g
25g 25g25g 25g
27g27g
30g 30g30g 30g
RangeRange
The range is the distance between The range is the distance between the smallest and largest data point.the smallest and largest data point.
To calculate, determine the smallest To calculate, determine the smallest data point and the largest data point, data point and the largest data point, then subtract the smallest from the then subtract the smallest from the largest.largest.
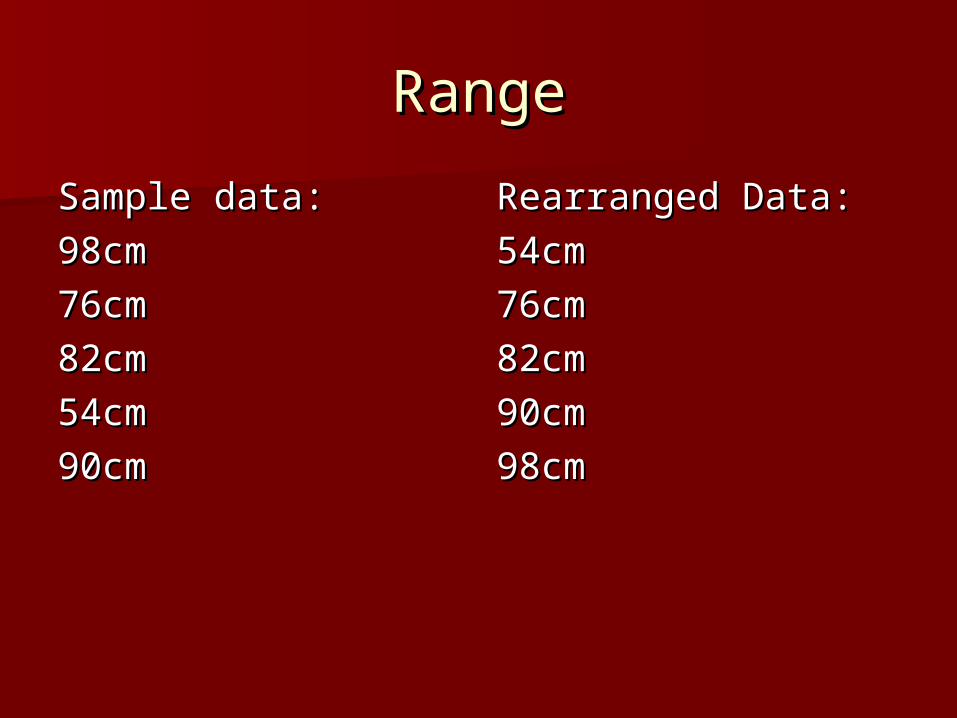
RangeRange
Sample data:Sample data:
98cm98cm
76cm76cm
82cm82cm
54cm54cm
90cm90cm
Rearranged Data:Rearranged Data:
54cm54cm
76cm76cm
82cm82cm
90cm90cm
98cm98cm
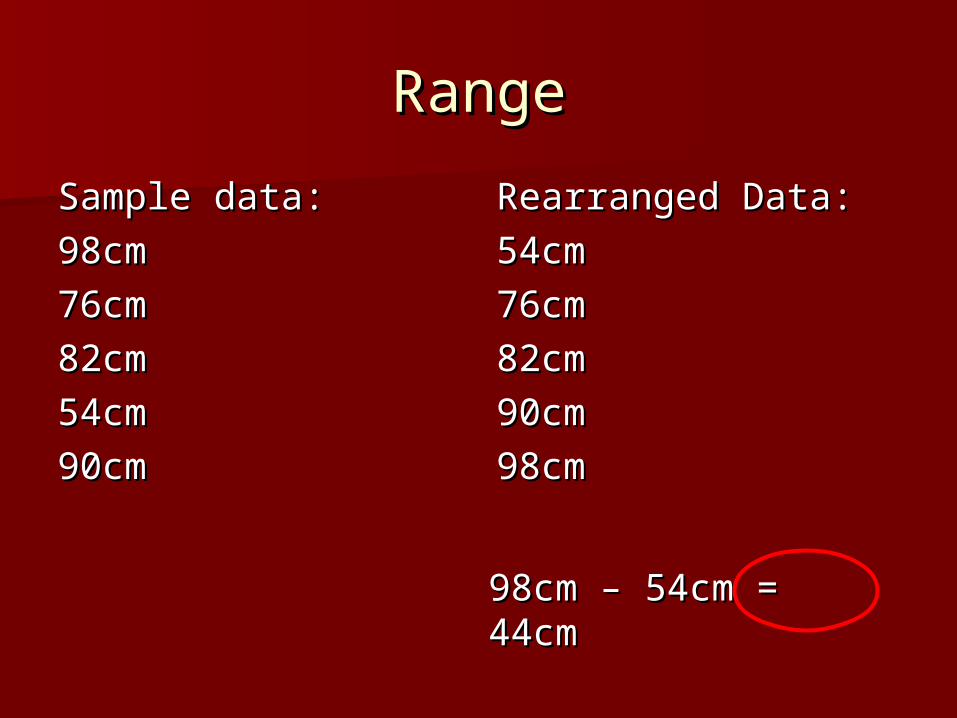
RangeRange
Sample data:Sample data:
98cm98cm
76cm76cm
82cm82cm
54cm54cm
90cm90cm
Rearranged Data:Rearranged Data:
54cm54cm
76cm76cm
82cm82cm
90cm90cm
98cm98cm
98cm – 54cm = 98cm – 54cm = 44cm44cm
RecapRecap
Mean, Median, Mode, and Range Mean, Median, Mode, and Range “describe” the data.“describe” the data.
AcknowledgementsAcknowledgements
American Chemical Society. (2006). American Chemical Society. (2006). Chemistry in the community: Chemistry in the community: ChemComChemCom (5 (5thth ed). New York: W.H. ed). New York: W.H. FreemanFreeman