Embed Size (px)
Citation preview
" I hereby declare that the project paper or thesis has been read and I have the opinion
that the project paper is appropriate in terms of scope coverage and quality as a thesis for
a degree of bachelor of Technology (Mechatronics) "
Signature .~ . -Project Supervisor : Mr. Chin
Date /1/3/ ;l.o-a3.
DEVELOPMENT OF SOFTWARE TOOL
FOR PRODUCTION PERFORMANCE ANALYSIS
LENA BT. AB. SAMAT
PROJECT SUPERVISOR MR. CHIN S.K
BACHELOR OF TECHNOLOGY(fu1ECHATRONIC) GERMAN MALAYSIAN Ii\JSTITUTE
MARCH 2003
I hereby declare that this thesis is originated from my idea and is iree of plagiarism
Signature
Name : LENA BT. AB. SA.MAT
Date
To my beloved,
Father(Ab. Samat b. 8achik) , mother (Mariam bt. Surip)
And all my sister and brother, for their encouragement and unfailing support.

ACKNOWLEDGEMENT
Alhamdulillah, with Allah blessing and willing, this thesis finally of bachelor are
completed.
I would like to express my heartfelt gratitude thanks to my supervisor, Mr. Chin S.K
for all his guidance and academic support during the preparation of this project. I am also
extremely grateful to all lecturer of department Industrial Electronic for their
encouragement and helpful discussion in carrying out this project.
Now, I would like to thanks to my entire friend for their continuous support. Lastly, I
wish to thanks to my beloved parents and all my sister and brother whom have the
confidence on me to overcome all the obstacles in my journey to success.
-IV-
DEVELOPMENT OF SOFTWARE TOOL
FOR PRODUCTION PERFORMANCE A['.JAL YSIS
Keywords: OEE, NEE, MTBA, MTBF, MTIR, MTBTF
ABSTRACT
The project describes the development of application software tool for production
performance 8n8lysis. The application software tool is designed with the features of
graphical user interface, which is user-friendly environment. The application software tool
is enabling to compute the OEE, NEE, Uptime and Downtime, MTIR, MTBF, MTBA,
MTBTF of the equipment in the production operation. The correlation studies were done
to analyze the relationship of the significant factors with the OEE of the equipment in the
production operation. Performance of the equipment in the production is dependent on the
T88, T8B, TEN, TF8D, TE8D, T88U, TFUD and TEUD. Prediction on breakdowns and
preventive maintenance scheduled could be done with the MTBA and MTBF. The software
tool data is gathered from Microsoft Excel format with applicable for all windows user.
-\"-
TABLE OF CONTENT
VERIFICATION OF PROJECT SUPERVISOR
TITLE OF PROJECT PAPER
OATH
DEDICATION
ACKNOWLEDGEMENT
ABSTRACT
TABLE OF CONTENT
LIST OF TABLES
LIST OF FIGURES
LIST OF SYMBOLS AND ABBREVIATIONS
CHAPTER
1.0 INTRODUCTIOf\J
1.1 Overview
1.2 Rationale
1.3 Problem Statement
1.4 Literature Review
1.5 Project Objective
1.6 Project Scope
1.7 Background of Company Selected
- \'1 -
ii
iii
iv
v
vi
ix
x
xiii
PAGE
1
2
3
5
5
5
2.0
3.0
METHODOLOGY
2.1 Data Collection
2.2 r,Jiethods of Data Collection
2.2 1 Definition of acronym
2.3 Data Input
2.4 Data ,A,nalysis and Discussion
2.4.1 Analysis On Equipment Perform;:mcc
2.4.1.1 Analysis on L4 (Average
Performance)
2.4.1.2 Analysis on L2 (Good
Performance)
2.4.1.3 Analysis on L4 (Poor
Performance)
2.4.2 Analysis on Trend of Equipment
Performance
DEVELOPMEf\IT OF SOFnNARE TOOL
3.1 Software Tool Description
3.2 Software Tool Development
3.2.1 Front Panel
3.2.2 Equipment Performance
3.2.3 Trend of Equipment Performance
- '. 11 -
S
. ~ !..:,
i 9
"J')
~r: .- ,)
::3
31
..
3·.
4.0 DATA PRESENTATION
4.1 Software Tool Representation
5.0 CONCLUSIONS AND
RECOMMENDATIONS
REFERENCES
APPENDIX A
5.1 Conclusion
5.2 Recommendation
- VIII -
67
76
77
78
80
LIST OF TABLES
TABLE TITLE PAGE
2-1 Acronym Used on PS-EMS 13
2-2 Data Collection From Production Floor 20
2-3 Result from Data Collection 24
2-4 OEE vs TSB 27
2-5 Input Data for WB1 35
2-6 Output Data 37
2-7 CUSUM Data 40
3-1 The Most Common Wire Types 47
- IX -
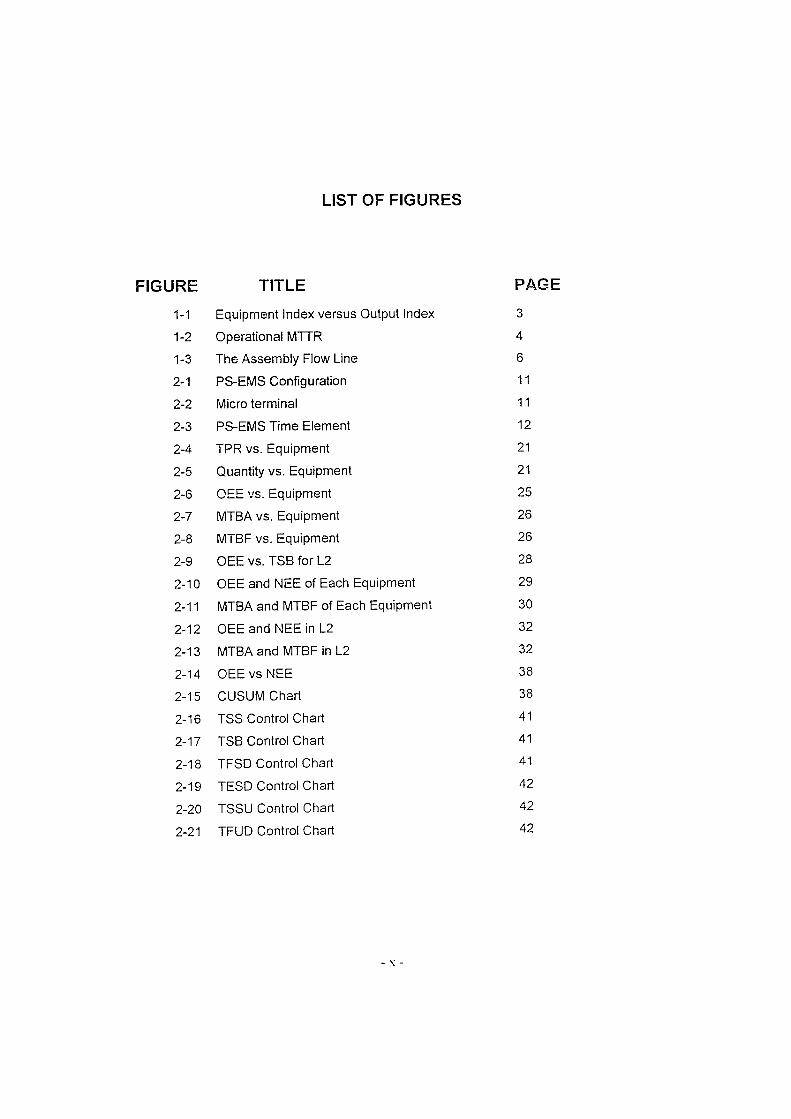
LIST OF FIGURES
FIGURE TITLE PAGE 1-1 Equipment Index versus Output Index 3
1-2 Operational MTIR 4
1-3 The Assembly Flow Line 6
2-1 PS-EMS Configuration 11
2-2 Micro terminal 11
2-3 PS-EMS Time Element 12
2-4 TPR vs. Equipment 21
2-5 Quantity vs. Equipment 21
2-6 OEE vs. Equipment 25
2-7 MTBA vs. Equipment 26
2-8 MTBF vs. Equipment 26
2-9 OEE VS. TSB for L2 28
2-10 OEE and NEE of Each Equipment 29
2-11 MTBA and MTBF of Each Equipment 30
2-12 OEE and NEE in L2 32
2-13 MTBA and MTBF in L2 32
2-14 OEE vs NEE 38
2-15 CUSUM Chart 38
2-16 TSS Control Chart 41
2-17 TSB Control Chart 41
2-18 TFSD Control Chart 41
2-19 TESD Control Chart 42
2-20 TSSU Control Chart 42
2-21 TFUD Control Chart 42
- x -
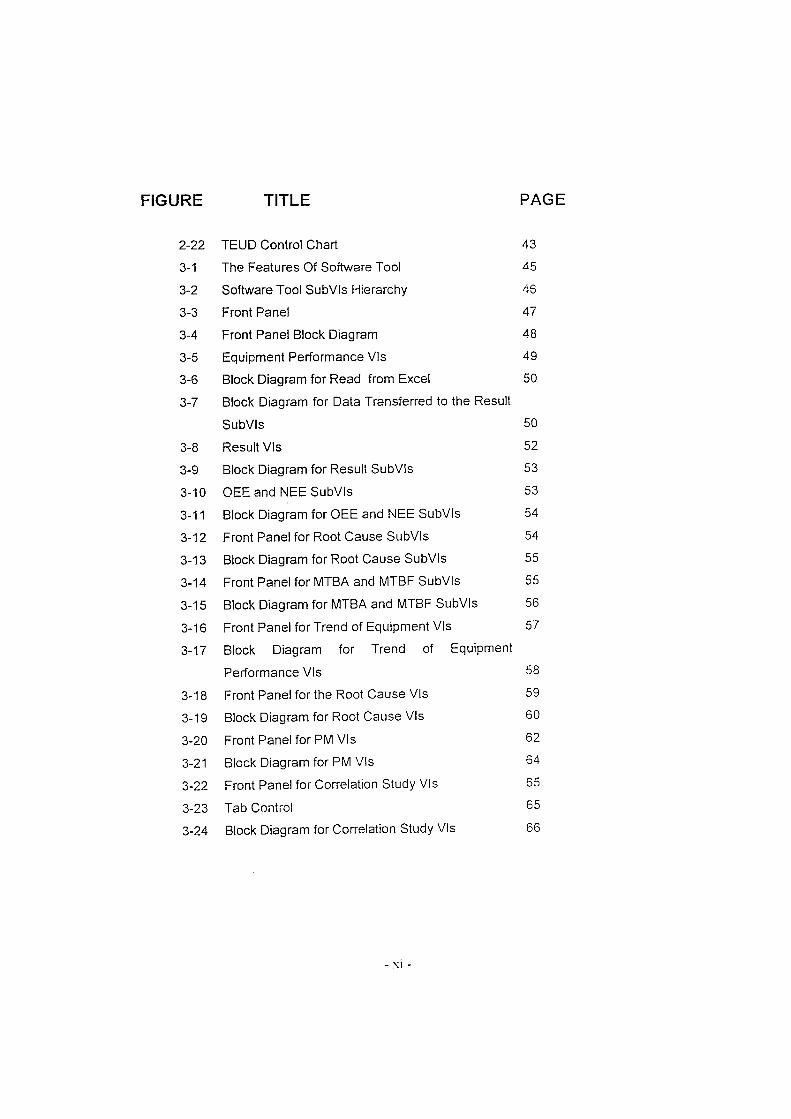
FIGURE TITLE PAGE
2-22 TEUD Control Chart 43
3-1 The Features Of Software Tool 45
3-2 Software Tool SubVls Hierarchy 45
3-3 Front Panel 47
3-4 Front Panel Block Diagram 48
3-5 Equipment Performance Vis 49
3-6 Block Diagram for Read from Excel 50
3-7 Block Diagram for Data Transferred to the Result
SubVls 50
3-8 Result Vis 52
3-9 Block Diagram for Result SubVls 53
3-10 OEE and NEE SubVls 53
3-11 Block Diagram for OEE and NEE SubVls 54
3-12 Front Panel for Root Cause SubVls 54
3-13 Block Diagram for Root Cause SubVls 55
3-14 Front Panel for MTBA and MTBF SubVls 55
3-15 Block Diagram for MTBA and MTBF SubVls 56
3-16 Front Panel for Trend of Equipment Vis 57
3-17 Block Diagram for Trend of Equipment
Performance Vis
3-18 Front Panel for the Root Cause Vis
3-19 Block Diagram for Root Cause Vis
3-20 Front Panel for PM Vis
3-21 Block Diagram for PM Vis
3-22 Front Panel for Correlation Study Vis
3-23 Tab Control
3-24 Block Diagram for Correlation Study Vis
- Xl -
58
59
60
62
64
65
65
66
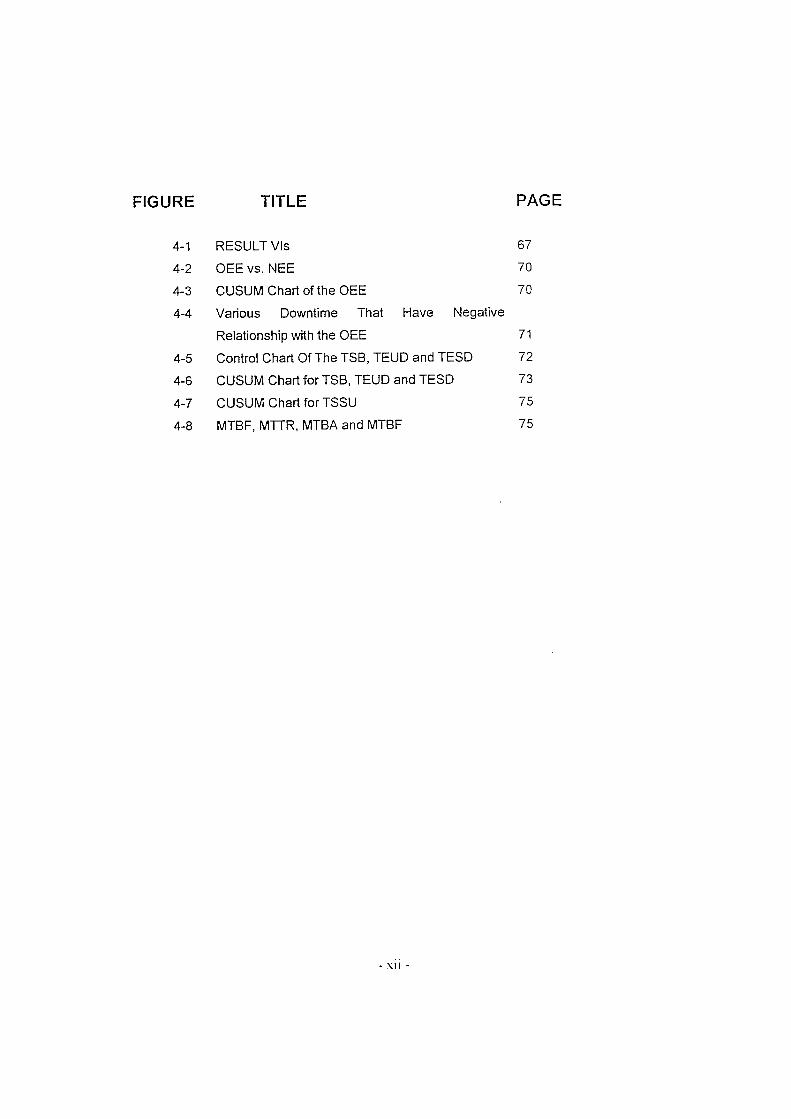
FIGURE TITLE PAGE
4-1 RESULT Vis 67
4-2 OEE vs. NEE 70
4-3 CUSUM Chart of the OEE 70
4-4 Various Downtime That Have Negative
Relationship with the OEE 71
4-5 Control Chart Of The TSB, TEUD and TESD 72
4-6 CUSUM Chart for TSB, TEUD and TESD 73
4-7 CUSUM Chart for TSSU 75
4-8 MTBF, MTTR, MTBA and MTBF 75
- XII -
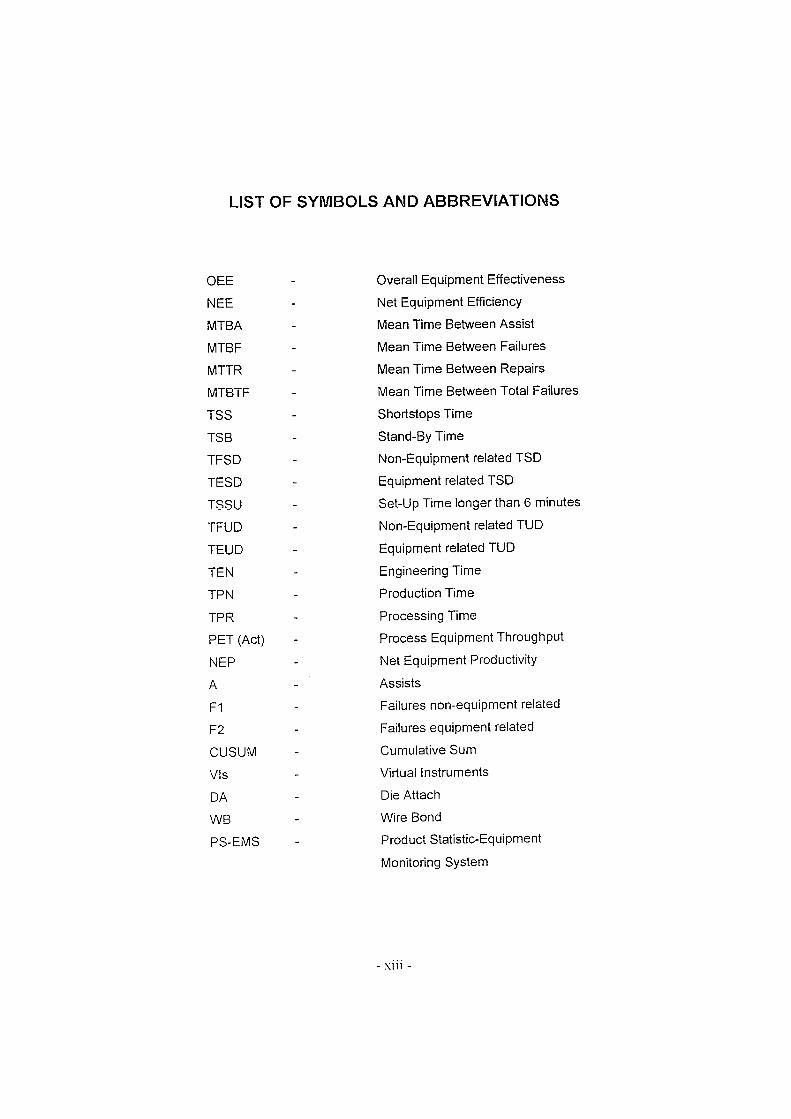
LIST OF SYMBOLS AND ABBREVIATIONS
OEE Overall Equipment Effectiveness
NEE Net Equipment Efficiency
MTBA Mean Time Between Assist
MTBF Mean Time Between Failures
MTIR Mean Time Between Repairs
MTBTF Mean Time Between Total Failures
TSS Shortstops Time
TSB Stand-By Time
TFSD Non-Equipment related TSD
TESD Equipment related TSD
TSSU Set-Up Time longer than 6 minutes
TFUD Non-Equipment related TUD
TEUD Equipment related TUD
TEN Engineering Time
TPN Production Time
TPR Processing Time
PET (Act) Process Equipment Throughput
NEP Net Equipment Productivity
A Assists
F1 Failures non-equipment related
F2 Failures equipment related
CUSUM Cumulative Sum
Vis Virtual Instruments
DA Die Attach
WB Wire Bond
PS-EMS Product Statistic-Equipment
Monitoring System
- :\:111 -
CHAPTER 1.0
INTRODUCTION
1.1 OVERVIEW
Every factory in this world are focusing on quality improvement as a method of
increasing competitiveness and achieving improved business performance. In order to
improved the quality of the product, the factory attempts to be an effective whereby they
should maintain high level productivity with excellent quality at low cost. Overall equipment
effectiveness (OEE) began to be recognized as a fundamental method for measuring
production or plant performance in the late 1980s and early 1990s by recognizing the
'hidden factory' within, whereby the improvement is done from bottom line. In other words,
OEE bring us better understanding how well manufacturing area is performing and identify
what factors would be limiting the production to achieve a higher effectiveness.
1.2 RATIONALE
Overall equipment effectiveness (OEE) is a measure used in Total Productive
Maintenance (TPM) to calculate the percentage of actual effectiveness of the equipment.
It's taking into consideration the availability of the equipment, the performance rate when
running and the quality rate of the manufactured product measured over a period of time.
Measurement of the machine OEE will allow the operator/maintainer core TPM team,
Peter Willmott and Dennis McCarthy (2001) to focus their efforts on prioritizing and then
attacking the classic six losses, which affect the machine OEE that are:
- I -
1. Breakdowns and unplanned plant shut down losses
2. Excessive set-ups, changeovers and adjustment (because the equipment is
not organized)
3. Idling and minor stoppages (Not breakdowns, but requiring the attention of the
operator)
4. Running at reduced speed (because the equipment 'is not quit right')
5. Start up losses (due to breakdowns and minor stoppages before the process
stabilizes)
6. Quality defects, scrap and rework (because the equipment 'is not quit right'
In order for the production and equipment in the production to be an effective, it
needs to have historical data about equipment failure. It's included the types of failures,
the frequency of failures, and also the root causes of the failures. Accurate data on the
equipment failures causes is very important before any adjustment or action is taken.
Without this data the equipment peiformance is only base on guesswork. There can be no
guess working root cause analysis because costly mistake will be made. In other words,
the insufficient equipment failure data can limit the production to achieve a higher
effectiveness. By doing some analysis to the classic six losses, which affect the machine
OEE, the maximum efficiency and effectiveness for the production can be achieved.
1.3 PROBLEM STATEMENT
The long waiting time for analysis of the performance of production equipment for
numerical computation and graphic plotting required an application software tool to
enhanced its effectiveness and efficiency.
The scope of this project is to develop software tool for production performance
analysis by using LabVIEW, whereby, this software tool enable to calculate Overall
Equipment Effectiveness (OEE), Net equipment Productivity (NEE), Uptime (Tup) and
Downtime (Tdn), Mean Time Between Repair (MTIR), Mean Time Between Failure
(MTBF), mean time between assist (MTBA) and Mean Time Between Total Failure
(MTBTF) of the equipment in the production. Correlation study is done to analyze the
relationship of the factors with the effectiveness of the equipment in the production
- 2 -
system. Knowing the MTBA, MTBF the user can make prediction on breakdowns and
when to scheduled preventive maintenance for machine in production.
1.4 LITERATURE REVIEW
In 1996, Investigation has been done to a factory which is highl~1 automated film
finishing work center staffed with about 140 people. In the production, there are four
similar equipment flow lines, 7 days a week, 24 hours a day. The products have different
size and format. Daily meeting were held in order to review ongoing performance of the
factory, which included the output quantity, flow lines availability, and equipment reliability
expressed as an index of the four lines.
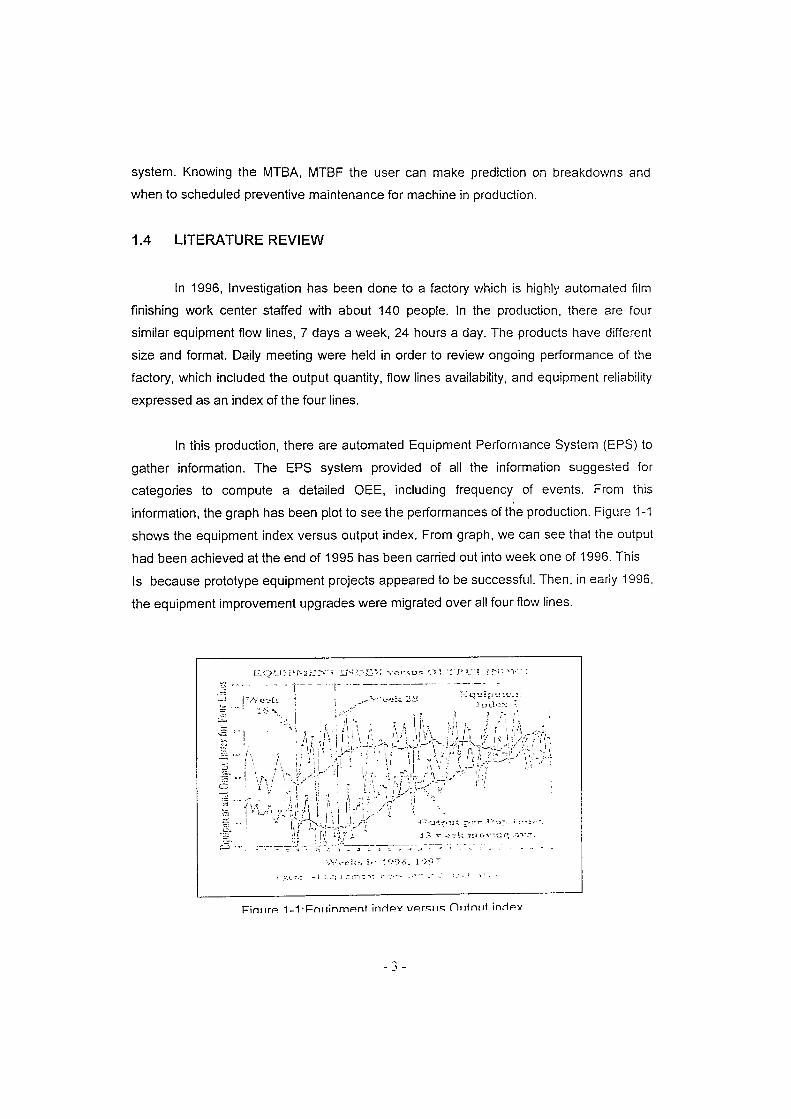
In this production, there are automated Equipment Performance System (EPS) to
gather information. The EPS system provided of all the information suggested for
categories to compute a detailed OEE, including frequency of events. From this
information, the graph has been plot to see the performances of the production. Figure 1-1
shows the equipment index versus output index. From graph, we can see that the output
had been achieved at the end of 1995 has been carried out into week one of 1996. This
Is because prototype equipment projects appeared to be successful. Then, in early 1996,
the equipment improvement upgrades were migrated over all four flow lines.
';::;'1 ~ n •• ~
~
- -' -
Almost from week one, 1996, the output began to decline from expected level..
The result from second quarters of the year has become as serious issue when the
production drops under 10 percent. By week sixteen of 1996 the investigation team had
reached a conclusion.
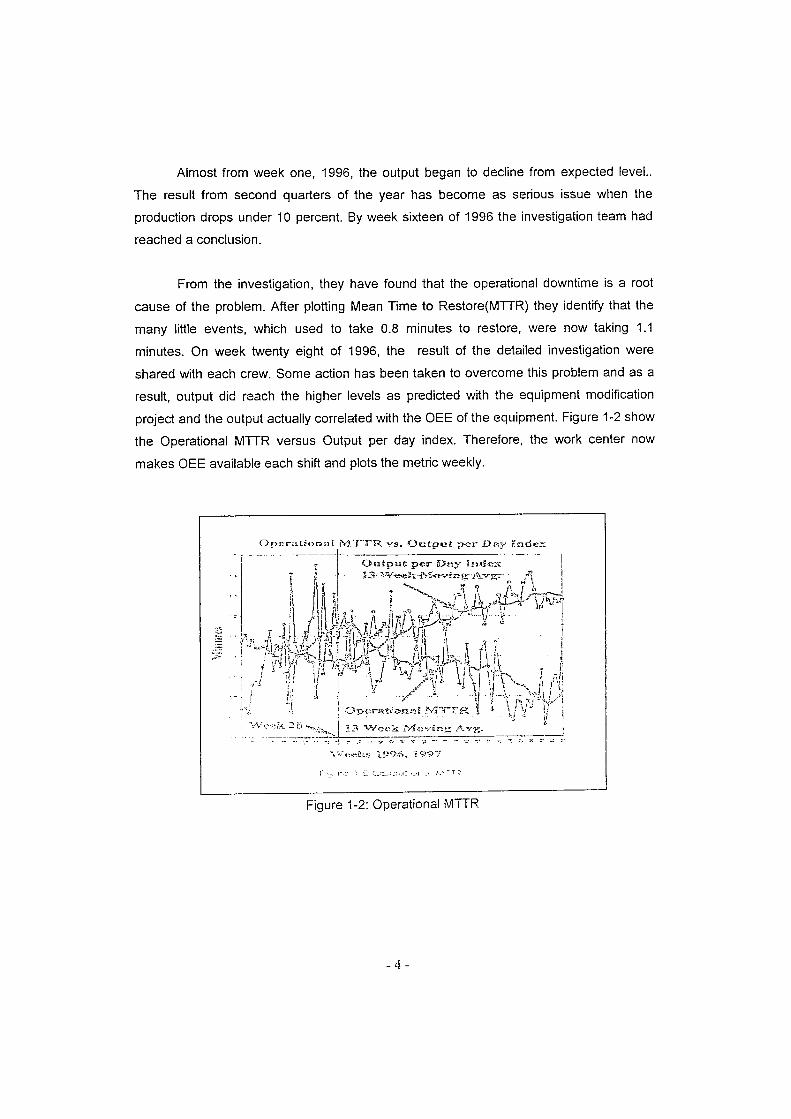
From the investigation, they have found that the operational downtime is a root
cause of the problem. After plotting Mean Time to Restore(MTTR) they identify that the
many little events, which used to take 0.8 minutes to restore, were now taking 1.1
minutes. On week twenty eight of 1996, the result of the detailed investigation were
shared with each crew. Some action has been taken to overcome this problem and as a
result, output did reach the higher levels as predicted with the equipment modification
project and the output actually correlated with the OEE of the equipment. Figure 1-2 show
the Operational MTTR versus Output per day index. Therefore, the work center now
makes OEE available each shift and plots the metric weekly.
Figure 1-2: Operational MTTR
- 4 -
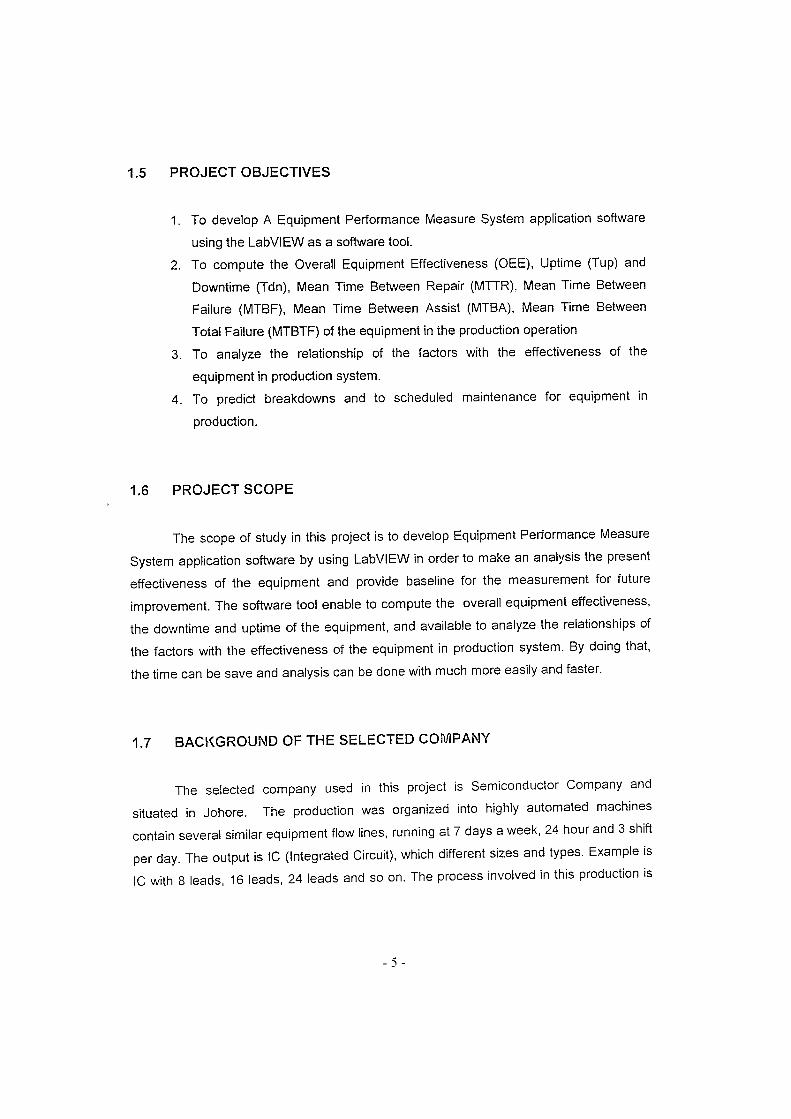
1.5 PROJECT OBJECTIVES
1. To develop A Equipment Performance Measure System application software
using the LabVIEW as a software tool.
2. To compute the Overall Equipment Effectiveness (OEE), Uptime (Tup) and
Downtime (Tdn), Mean Time Between Repair (MTTR), Mean Time Between
Failure (MTBF), Mean Time Between Assist (MTBA), Mean Time Between
Total Failure (MTBTF) of the equipment in the production operation
3. To analyze the relationship of the factors with the effectiveness of the
equipment in production system.
4. To predict breakdowns and to scheduled maintenance for equipment in
production.
1.6 PROJECT SCOPE
The scope of study in this project is to develop Equipment Performance Measure
System application software by using LabVIEW in order to make an anal~'sis the present
effectiveness of the equipment and provide baseline for the measurement for future
improvement. The software tool enable to compute the overall equipment effectiveness,
the downtime and uptime of the equipment, and available to analyze the relationships of
the factors with the effectiveness of the equipment in production system. By doing that,
the time can be save and analysis can be done with much more easily and faster.
1.7 BAC~<GROUND OF THE SELECTED COMPANY
The selected company used in this project is Semiconductor Company and
situated in Johore. The production was organized into highly automated machines
contain several similar equipment flow lines, running at 7 days a week, 24 hour and 3 shift
per day. The output is IC (Integrated Circuit), which different sizes and types. Example is
IC with 8 leads, 16 leads, 24 leads and so on. The process involved in this production is
- 5 -
Die Attach and wire bonding process Figure 1-3 sr,c;",'s U',C: c' :"':: e::::~. :'~":"': '~,',
the production. The function of each station are
1. Input Buffer- to provide Inpu::o ti~c: C:e .:·::':-:::!1 ''::~lJ .. ,~".: ... : -",.
input is frame wf1lch each frame conta:n =,,:,! to .:.: c~ :~; .... I',~ ,;0: '.':
the types and product running
2. Die Attach Equipment- To Attach ttle D:e onto ttlC c,~:j c,~ :~~C: ,:::.~." .... :'
correct orientation and accurate POSI\!on ::,us: Fas:er Pl':-Irl ':. '"
Bonding equipment because its need to supp!,';Jn Input to :h,..: fe,!:
wires bonds equipment at the same tlnV;
3. Oven - Oven is used to heat up the glue to m<Jkc sur,:: the D',::
properly attached to the pad of frame
4. Buffer - as output storage from oven Clnd as an Irlput stor2~1''; ~C':,'. Il:
bonding equipment
5. Wire Bonding - To wire bond !tie IC
6. Buffer - As an Output storage for ,,','Ire bonding ;::nd ;::5 ;::n :11;: ,J: ,:," - :,.
for the next process.
7. Conveyor track - To transport the frame to the ','.lrc t:,onclfl" , ll; !~'''''':
and buffer.
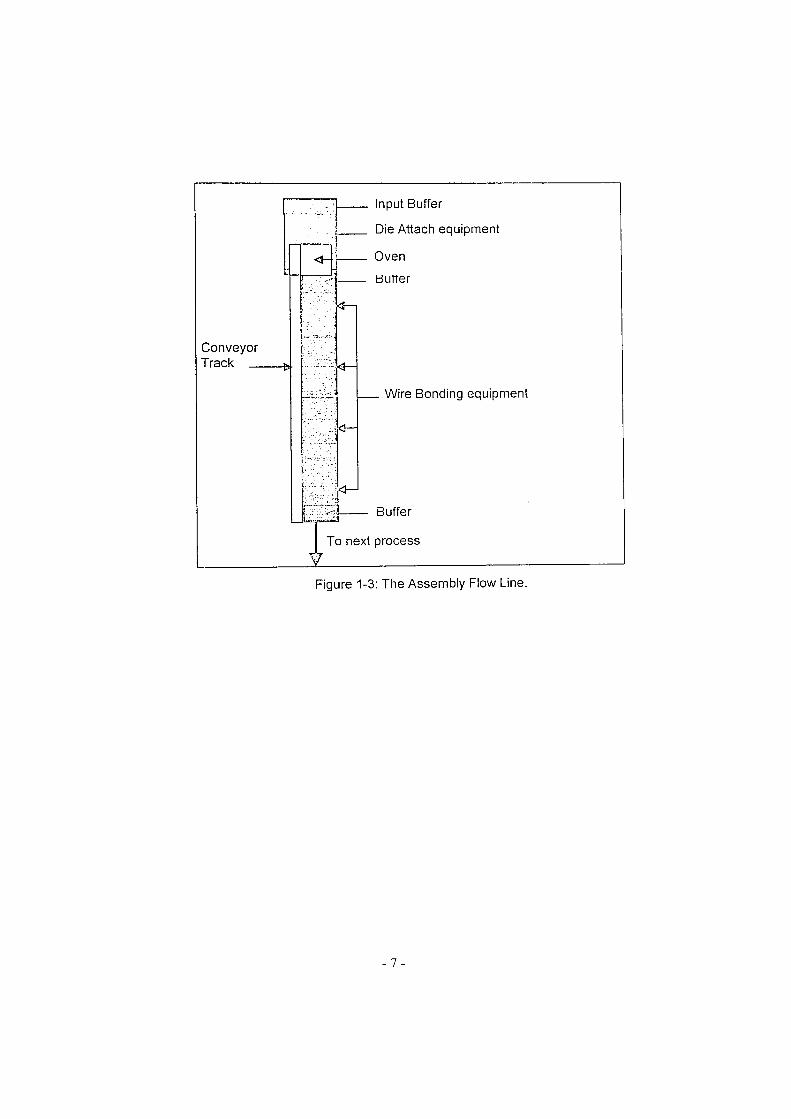
Conveyor Track
~ Input Buffer
------_j __ Die Attach equipment
, __ Oven
.. <: Clutter
[~, Wire Bonding equipment
Buffer
Figure 1-3: The Assembly Flow Line_
- 7 -
CHAPTER 2
METHODOLOGY To carry out this project there are several step need to be accomplish in order to ensure
the task is done in order. Developing the software tool for production performances
analysis by using Labview will includes the following components which are data
collection, Data Analysis AND result and discussion from the analysis. In this chapter, how
data and what types of data need to be collect will be discuss in detail.
2.1 DATA COLLECTION
The first step in defining any problem or to identify opportunities for improvement
within a process in production is to collect the data from the actual process. Before the
data are taken, three preliminary steps are required which are:
Step 1: Establish the purpose for the collection of data
The purpose of collecting data in this case is to measure how effective the
equipment uses in the production to produce the output so that we can
know how effective the production running at the certain period of time.
Step 2: Define the type of data that are to be collected
In this project, the types of data need to be collect include various
downtime causes and frequencies.
Step 3: Determine the characteristic of the data to be collected.
Data can be collected in two basic forms, which are:
- 8 -
1. Measurable data: Data that can be measured. Examples of
measurable data are length, size, weight, height, time velocity
and so on.
2. Countable data: Data that can be counted. Examples are
number of defects, problem percentage of defects, problem and
so on. Countable data are collected by counting the actual
numbers of defects or problem produced in a given sample.
In this project, the characteristic of data to be collected is measurable data
where data needed is in terms of time. But, the characteristic is changed to
countable data when number of defect or problem percentage defects is
collected.
2.2 METHODS OF DATA COLLECTION
In any data coilection activity, accuracy is the most important aspect needs to be
considered. The quality of the actions and decision taken on the data collected is good as
the quality of data collected. Collection activity can be said as a GIGO, means "Garbage
in-garbage out". If the quality data is good, the decision and the actions taken from the
data also will be good. Conversely, if the quality of data is poor, the decisions and action
taken on the data also will be poor.
One of the common tools used to collect the data is the check sheet. Check sheet
allow the data to be collected in an easy way, systematic and organized manner. A variety
of check sheets are used in the collection of data in the production. The most commonly
used check sheet is:
1. Defective item check sheets - can be used to define the problems
occurring in the department.
2. Defective location check sheets- Used to pinpoint or identify the location
of certain problem or defects.
3. Defective cause check sheets- Used to identify potential causes of a
problem or defect and to make adjustment to the process.
- 9 -