Embed Size (px)
Citation preview
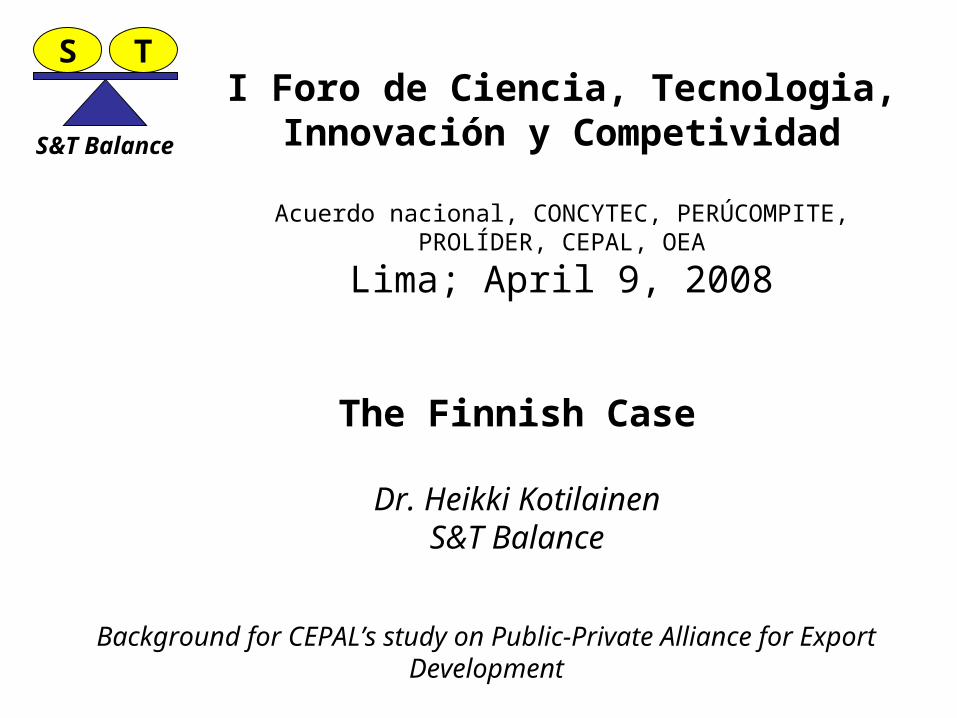
I Foro de Ciencia, Tecnologia, Innovación y Competividad
Acuerdo nacional, CONCYTEC, PERÚCOMPITE, PROLÍDER, CEPAL, OEA
Lima; April 9, 2008
The Finnish Case
Dr. Heikki KotilainenS&T Balance
S T
S&T Balance
Background for CEPAL’s study on Public-Private Alliance for Export Development

I Foro de Ciencia, Tecnologia, Innovación y
Competividad
The Finnish Case
Contents
1. Introduction, Finland as a country2. Innovation policy and respective organizations3. Funding principles4. Funding of innovation and national programs5. Conclusions
S T
S&T Balance

I Foro de Ciencia, Tecnologia, Innovación y
Competividad
The Finnish Case
1. Introduction, Finland as a country
S T
S&T Balance

Finland in Figures *Total Area: 338,000 sq km, this makesFinland the seventh largest country in EuropeNeighbouring Countries: Sweden, Norway,Russia, EstoniaCapital: HelsinkiMain Cities & Population: Helsinki(555,000), Espoo (213,000), Tampere(195,000), Vantaa (178,000), Turku (172,000) and Oulu (120,800). Approximately one million people live in the Helsinki Metropolitan Area. Population: approx. 5,3 millionPopulation Density: 17 inhabitants per square kilometre, 62 % of the population lives in towns and cities. Currency: Euro. Until 2002 markka, also known as the Finnish mark (FIM).Languages: Finnish (93 %) and Swedish (6 %) are official languages. Sami (Lappish) is the mother tongue of about 1,700 people.Climate: The climate of Finland is marked by distinctive seasonal variations. Winters are cold and summers relatively warm.National Legislature: Finland has a unicameral parliament with 200 members.Finland in the International Community:Member of EU, UN, OECD and WTO, among others.Major Exports: Electronic and electrical products, pulp and paper, machinery and equipment, metal products, transport vehicles, timber and wood, chemicalsGDP: $176.4 billion (2006)GDP per capita (PPP): $33,700 (2006)GDP real growth rate: 5.5% (2006)GDP composition by sector (2006)
Agriculture: 2.7%Industry: 30.3%Services: 67%
Unemployment rate: 7% (2006)
ECLAC Finnish Report 2007

THE POLICY DEVELOPMENTS IN FINLAND
?
1945
•LACK OF CONSUMER GOODS
•INDEPENDENT INDUSTRIES•DOMESTIC
MARKET
•RAW MATERIALS ASCOMPETITIVE FACTOR•GROWING NATIONAL
DEMAND•INVESTMENT
SUBSIDIES
MANUFACTURING DRIVEN
•INTERNATIONAL COMPETITION
•TECHNOLOGY POLICY•TECHNOLOGY
SUBSIDIES
INVESTMENT DRIVEN
•INTERNATIONALCOOPERATION
•SKILLS AS COMPETITIVEFACTOR
•INTRODUCTION OFNATIONAL INNOVATION
SYSTEM•PRECONDITIONS FOR
TECHNOLOGICAL&SOCIETAL ADVANCEMENT•RISK/VENTURE
CAPITAL
MARKET/INNOVATION DRIVEN
•TECHNOLOGY&SOCIETY
•POLICY FORSOCIAL SCIENCES
SURVIVAL POLICY
WEALTH DRIVEN ?
2000
TECHNOLOGICAL ADVANCEMENT
NATIONAL COMPETITIVENESS
© S&T Balance
Industrialization &Construction of
welfare state
Export, technology &
innovation
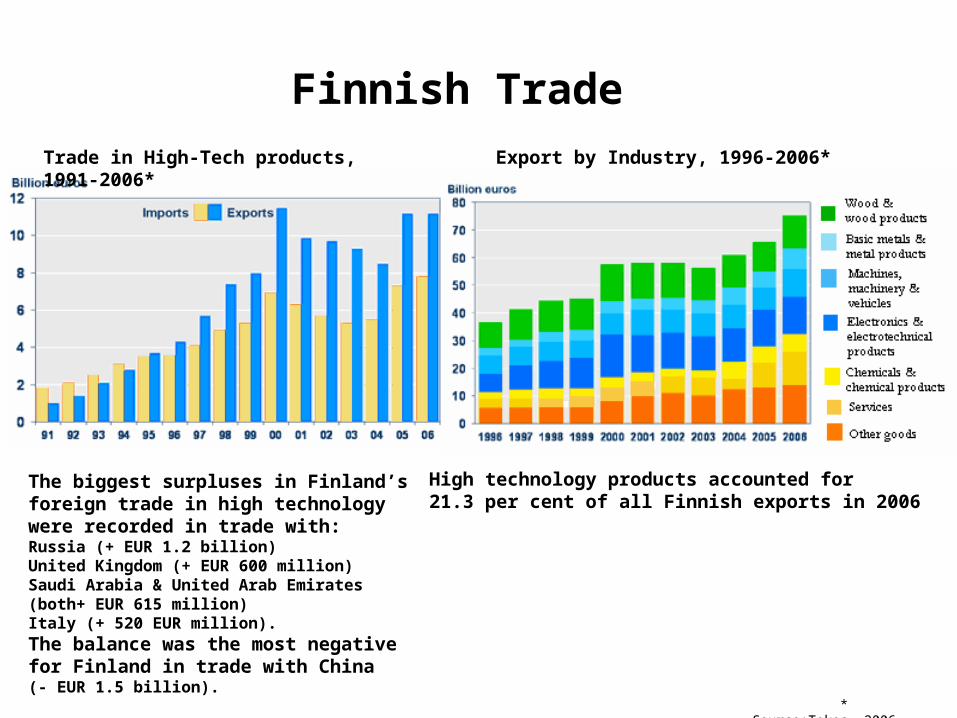
Finnish Trade
Trade in High-Tech products, 1991-2006* Export by Industry, 1996-2006*
The biggest surpluses in Finland’s foreign trade in high technology were recorded in trade with:Russia (+ EUR 1.2 billion)United Kingdom (+ EUR 600 million)Saudi Arabia & United Arab Emirates (both+ EUR 615 million) Italy (+ 520 EUR million). The balance was the most negative for Finland in trade with China (- EUR 1.5 billion).
High technology products accounted for 21.3 per cent of all Finnish exports in 2006
* Source:Tekes, 2006

Competitiveness comparison
2001
IMDWEFTechnology
2002 2001 2000 2003
Populationover
20 mill.less than20 mill.2003 2003
Populationover
20 mill.less than
20 mil.20032003
ScienceTechnologyUNDP
221
345789
101113141619
USA
TaiwanSwedenJapanSwitzerlandDenmarkIsraelEstoniaCanadaNorwayGermanyUKAustralia
FinlandFinland1
2456
117
148
101215
9
331
46
23241226
827
1510
5
332
-34--
18-8
1211
79
111-6-9----2-483
- -4-658
19-
10---
331-5-2----6-379
- -2-38
1125
-14
---
661
24976
138-
1429
51723
22
Ranking by the science and technology factorRanking by the science and technology factor
Sources: The World Competitiveness Yearbook (IMD), The Global Competitiveness Report (WEF)And Human Development report (UNDP)
DM 3605411-2003 Copyright © Tekes

Technology index (WEF)
4,0 4,5 5,0 5,5 6,0 6,5
IcelandGermany
NorwaySingapore
CanadaEstonia
IsraelDenmark
SwitzerlandKoreaJapan
SwedenTaiwanFinland
USA
DM 3605404-2004 Copyright © Tekes
Source: The Global Competitiveness Report 2003,3/4 based on quantitive material, 1/4 on query
4.0 4.5 5.0 5.5 6.0 6.5

I Foro de Ciencia, Tecnologia, Innovación y
Competividad
The Finnish Case
2. Innovation policy and respective organizations
S T
S&T Balance

Future orientation
”Prepare answers to questions, which will be asked after 5 years”
Motto:
Future orientation

The Innovation Policy of Finland• Education, science, technology and know-how have been
a conscious focus of the industrial policy and the foundation of the Finnish economy and society for a very long time.
• The results of the policy can be seen today: the transformation from a low-tech country to a knowledge based society.
• Investments in innovations are important, but as important are a consistent long term focus on national facilitating conditions, as well as operational measures to build up a well-committed, co-operative, well balanced, confidential and dynamic innovation environment.
• Regional development is a special challenge, because the birth of innovations is very centralized.
• Small countries, like Finland too, have a lot of challenges in the future.
DM 8858203-2004 Copyright © Tekes

Tasks in the Finnish Innovation System
PARLIAMENTPARLIAMENT
GovernmentGovernment
MoE MEEScience & Technology
Policy Council
Future committeeFuture committee
Academyof
Finland
TekesTE-centres Foundation
of Inventions
PublicUniversitiesResearch InstitutesCenters of Excellence
PrivateEnterprisesResearch labs
SemiprivateFinveraSitra/VCIndustrial Investment/VC
PrivateVenture CapitalBanksResearch funds
General policy
S&T&Ipolicy
S&T&Innovation policy formulation,
implementation, funding
R&Dperforming
Business funding
Tasks innov.
Sitra
© S&T Balance

IndustryIndustryIndustryIndustry
MinistriesAgencies
Patent offices, IPR
Regional centresTE-centres
Centres of ExcellenceTechnology/Science ParksKnowledge CentresSectorial InstitutesTech Transfer officesInstitutes, labs
The Triple Helix
UniversitiesResearchinstitutes
Government
Industry
Science & Technology
Policy Council
Confederations ofIndustry
BanksVenture CapitalBusiness angels
EU Commission-state aid
-regulations-FP
SemiprivateSITRA
FinveraIndustrial Invest
Clusters
© S&T Balance

R&D/GDP in FinlandR&D/GDP
0
0,5
1
1,5
2
2,5
3
3,5
4
1981 1983 1985 1987 1989 1991 1993 1995 1997 1999 2001 2003 2004 2005
%
SCIENCE POLICY
TECHNOLOGY POLICY
INNOVATION POLICY
© S&T Balance
SERVICE POLICY ?
INPUT ADDITIONALITY
OUTPUT ADDITIONALITY BEHAVIOR ADDITIONALITY
COGNITIVE CAPACITY
%

Circulation of innovation policy
Setting policy agenda
Analysing policy
Implementation
Public interest Private interest
National strategy
Sector policies
Implementation of strategies
Instrument set-up
Research
Strategic intelligence
Policy evaluation
Impact evaluation
Performance evaluation
Policy circulation
Source: Tekes
(Council, audit)
(Ministries, agencies, universities, industry)
(Ministries, agencies, universities, industry,Evaluation + outside experts)
© S&T Balance

Planning and implementing of technologyand innovation policy
3 year outlines
Ministries(Education, Employment & Economy, Finance etc.)
Annual objectives and agreements
Institutions(Academy of Finland, Tekes, Universities
VTT, Sectoral Institutes)
GovernmentScience and technology
policy council, STPC
Annual & semi-annualreports
and feedback
Plans
Operations
Tech.plocy execution© S&T Balance

BALANCE BETWEEN THE SCIENCE, TECHNOLOGY AND SOCIAL DEVELOPMENT
MAINTAIN CLEAR NATIONAL FOCUSSTPC
MANAGE KEY DEMANDSBUSINESS & SOCIAL CHALLENGES
Funding Agency forBasic Research
Funding Agencyfor Applied Research and Development
PROACTIVE VISION
(Science and University Community, Society)
BOTTOM-UP REQUESTS
ADAPTING TOCUSTOMERS
(The Business Community,
Society)
NATIONAL POLICY
© Balance
S&T Balance
The Academy
Tekes

I Foro de Ciencia, Tecnologia, Innovación y
Competividad
The Finnish Case
3. Funding principles
S T
S&T Balance

Prerequisites for administration involvement in R&D
•Business and research understanding
•Genuine interest in facilitating development
•Trust by industrial community
•Trust by research community
•Money and funding opportunities
Admini.involvement© S&T Balance

The Selection of Areas for R&D Funding
Administration•social needs•white spots on technology map•emerging technologies•globalisation challenges•emerging legislation
Industry•globalisation challenges•technology needs•clustering needs•new business models
Research•utilizing the strengths of research•improving the weaknesses of research•improving the industry cooperation•facilitating the technology transfer•improving the infrastructure of research
R&D fnding areas© S&T Balance

R&D Expenditures in Finland 20065789 M€; 3,45%/GDP
Private 4108 M€
71,0%
Public 1681 M€
29,0 %
Tekes504,3M€
(30,0%)
Academy of Finland
275,8 M€(16,4%)
Universities446,4 M€
(26,6%)
Researchinstitutes282,0 M€
(16,8%)
Others172,7M€
(10,2%)
© S&T Balance Source: Statistics Finland
Competitive funding Institutional funding
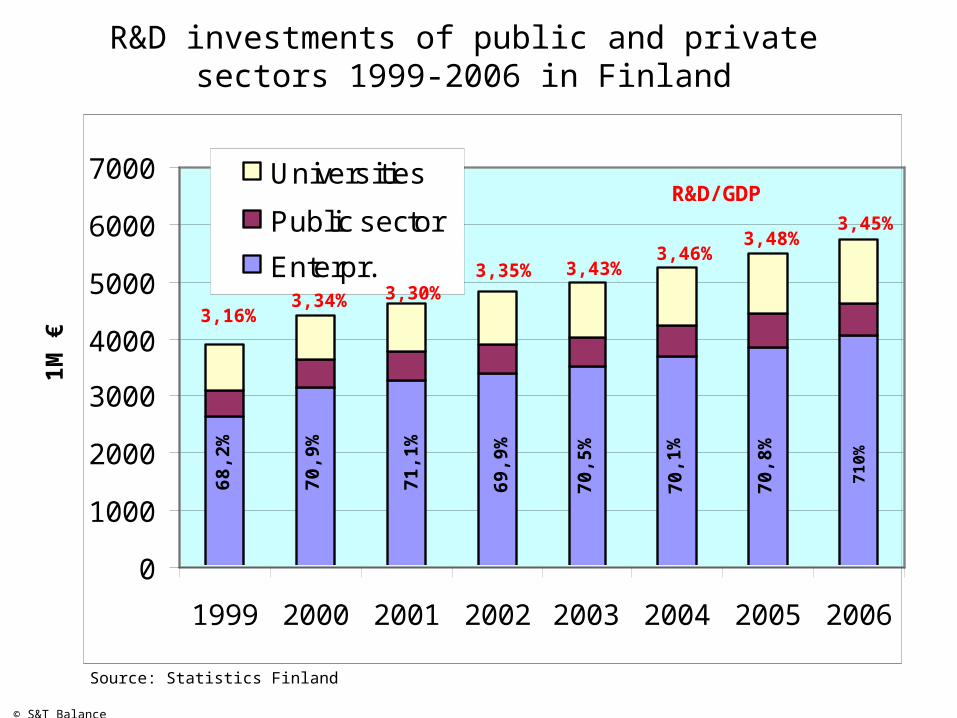
R&D investments of public and private sectors 1999-2006 in Finland
0
1000
2000
3000
4000
5000
6000
7000
1999 2000 2001 2002 2003 2004 2005 2006
Universities
Public sector
Enterpr.
1M €
Source: Statistics Finland
71
0%
70,8
%
70,1
%
70,5
%
69,9
%
71,1
%
70,9
%
68,2
%
© S&T Balance
3,16%3,34% 3,30%
3,35% 3,43%3,46%
3,48%3,45%
R&D/GDP

I Foro de Ciencia, Tecnologia, Innovación y
Competividad
The Finnish Case
4. Funding of innovations and national programs
S T
S&T Balance
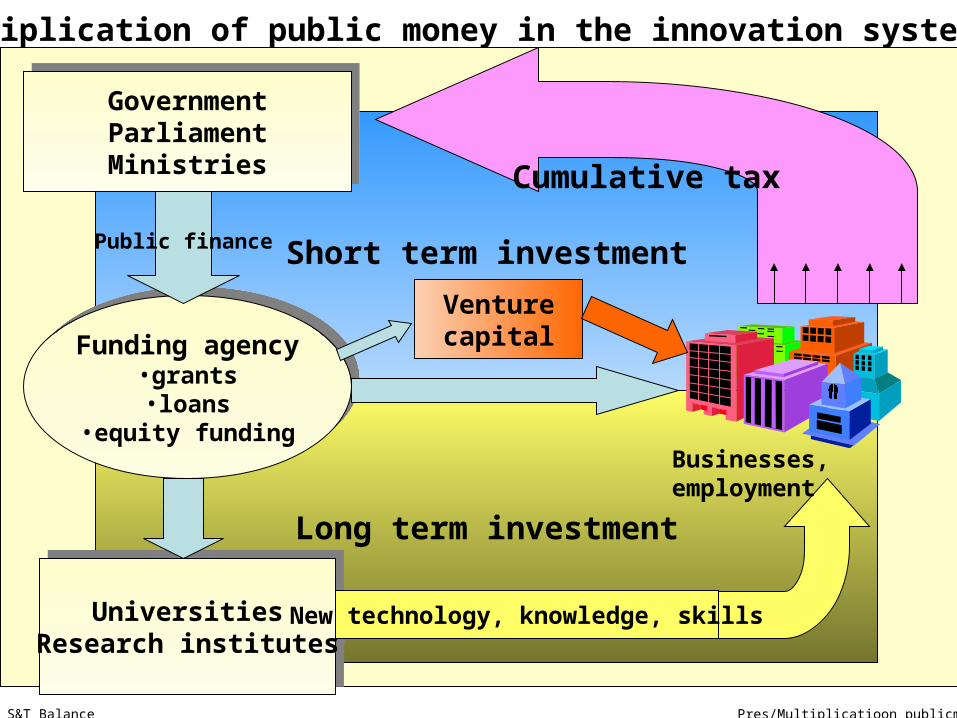
Multiplication of public money in the innovation system
Short term investment
Long term investment
GovernmentParliamentMinistries
GovernmentParliamentMinistries
Funding agency•grants•loans
•equity funding
Funding agency•grants•loans
•equity funding
UniversitiesResearch institutes
UniversitiesResearch institutes
Cumulative tax
Public finance
New technology, knowledge, skills
Businesses, employment
Venturecapital
Pres/Multiplicatioon publicmoney© S&T Balance

Innovation Trends
Innov.trends
© S&T Balance
User-based innovations
Merger of manufacturing and service
Mulitidisciplinary innovations
Public and private sector innovations
Globalisation of innovations
Small firm innovations- large firm interventions

RESEARCH PARADIGMS
Old paradigm (LINEAR MODEL)
BASIC RESEARCH APPLIED RESEARCH DEVELOPMENT
New paradigm (CONCURRENT MODEL)
DEMAND
SCIENTIFIC UNDERSTANDING
TECHNOLOGICAL SOLUTIONS
PROBLEMSOLVING
MA
RK
ET
Basic research
Applied research
Development
SO
CIE
TA
L &
BU
SIN
ES
S
C
HA
LL
EN
GE
S
© S&T Balance

The relation between the national technology programme and innovation
Technology programme, joint research with multiple participants
Company 1
Company 2
Company 3 Company 4
Company 5
INNOVATIONS ON MARKET
Re
se
arc
hP
rod
uct
dev
elo
pm
ent
pro
ject
sIn
no
vat
ion
s
© S&T Balance

THE GENERAL OBJECTIVES OF THE NATIONAL
TECHNOLOGY PROGRAMMES
•To promote the industrial competitiveness to keep up with the global market change•To give input to the industrial innovation process•To create new knowledge to fulfil the needs of research, Industry and society•To create the critical mass and centres of excellence in important technological areas•To enhance the co-operation between industry and universities and research institution•To promote international co-operation•To support research education and to educate internationally oriented research managers•To enhance the research and high-tech image of the country
Objectives natl progr© S&T Balance

PROCESS CHARACTER OF TECHNOLOGY TRANSFER
CURIOSITY
KNOWLEDGE CREATION
SCIENTIFIC EXCELLENCE
PUBLICATIONS
CUSTOMER NEEDS
MARKET&MARKETABILITY
STRATEGYPRODUCT
PORTFOLIOR&D PORTFOLIO
COMPETENCEMONEY&
FINANCINGIPR
REVENUES
RESEARCH INDUSTRYTECHNOLOGY TRANSFER
Transfer process
ADAPTATION OFSCIENTIFIC
RESULTSFOR
TECHNOLOGICAL USE
”Requirement fortechnological success”
ADAPTATION OF
TECHNOLOGICAL KNOWLEDGE
FOR INDUSTRIAL
USE
”Requirement formarket success”
What is possible ? Can we do it? How we do it? How we market it?

Cooperation between companies
Share of cooperating companies of all innovating companies
0 10 20 30 40 50 60 70
Italy
Greece
Portugal
Spain
Germany
Austria
EU
Belgium
Netherlands
France
Great Britain
Ireland
Denmark
Sweden
Finland
Source: Towards a European Research Area - Key Figures, Special Edition. EU 2001
%

Technological success rate of enterprise research projects concluded in 2002
concluded 1145 projects
611 mio. €
905 projects511 mio. €
No information 240 projects, 100 mio. €
Stopped or failed projects37 projects, 17 mio. €
Otherwise as expected, but late 188 projects
117 mio. €
Success as expected or
better525 projects278 mio. €
16 %
84 %
3 %
23 %
54 %
Number and volume of projects
Success less than satisfactory, 155 projects
99 mio. €
19 %
57305,04-2003 Copyright © Tekes

I Foro de Ciencia, Tecnologia, Innovación y
Competividad
The Finnish Case
5. Conclusions
S T
S&T Balance

Acceptability of State Aid and Other
Incentives in the Society COMPLIANCE
with national and international legislation
TRANSPARENCYof criteria and processes
EFFECTIVE Implementation
Speed is crucial!
FLEXIBLE adaptation to rapidly
changing environment
UNDERSTANDABLEand
PREDICTABLEoperation
WIDE ACCEPTANCE in the society
CONTINUOUS EVALUATIONof results and processes
CONTINUOUS EVALUATIONof results and processes
FEEDBACKFEEDBACK
© S&T Balance

Lessons learned from the Finnish Case• Invest in people
• Consistency in policies
• Clear national strategy i.e. right choices
• Long term investments in R&D; Government as facilitator and investor
• Co-operation within the ”triple helix”
• Strong national agencies with freedom to act and implement the policies
• Balanced development of basic research and industrial R&D
• Continuous evaluation of the organizations, operations and programmes and quick feedback to decision makers
• Benchmark the best performers, don’t copy any of them
© S&T Balance

Thank you for your kind attention!
S&T Balance