Embed Size (px)
Citation preview

Nutrients 2015, 7, 4638-4660; doi:10.3390/nu7064638
nutrients ISSN 2072-6643
www.mdpi.com/journal/nutrients
Article
I Eat Healthier Than You: Differences in Healthy and Unhealthy Food Choices for Oneself and for Others
Gudrun Sproesser 1,*, Verena Kohlbrenner 1, Harald Schupp 2 and Britta Renner 1
1 Psychological Assessment and Health Psychology, University of Konstanz, P.O. Box 47,
Konstanz 78457, Germany; E-Mails: [email protected] (V.K.);
[email protected] (B.R.) 2 General Psychology, University of Konstanz, P.O. Box 36, Konstanz 78457, Germany;
E-Mail: [email protected]
* Author to whom correspondence should be addressed; E-Mail: [email protected];
Tel.: +49-7531-88-2623; Fax: +49-7531-88-5226.
Received: 21 April 2015 / Accepted: 1 June 2015 / Published: 9 June 2015
Abstract: The present study investigated self-other biases in actual eating behavior based
on the observation of three different eating situations. To capture the complexity of real
life food choices within a well-controlled setting, an ecologically valid fake food buffet
with 72 different foods was employed. Sixty participants chose a healthy, a typical, and an
unhealthy meal for themselves and for an average peer. We found that the typical meal for
the self was more similar to the healthy than to the unhealthy meal in terms of energy
content: The mean difference between the typical and healthy meals was MΔ = 1368 kJ
(327 kcal) as compared to a mean difference between the typical and unhealthy meals of
MΔ = 3075 kJ (735 kcal). Moreover, there was evidence that people apply asymmetrical
standards for themselves and others: Participants chose more energy for a peer than for
themselves (M = 4983 kJ or 1191 kcal on average for the peers’ meals vs. M = 3929 kJ or
939 kcal on average for the own meals) and more high-caloric food items for a typical
meal, indicating a self-other bias. This comparatively positive self-view is in stark contrast
to epidemiological data indicating overall unhealthy eating habits and demands further
examination of its consequences for behavior change.
Keywords: fake food buffet; food choice; self-other bias; optimism in eating behavior
OPEN ACCESS

Nutrients 2015, 7 4639
1. Introduction
Headlines stating that people have unhealthy eating habits such as “The way America eats is
killing us” in September 2013 [1] are not surprising. Most people, experts as well as laypeople, seem
to agree that eating habits in the general population are unhealthy, with too many calories and too
many high-caloric foods.
However, when asking people how they gauge their own eating habits, a contrasting picture
emerges. As in other life domains, many people tend to believe that they behave more positively than
their average peers. For example, Sparks and colleagues [2] reported that respondents believed on
average that they eat less fat and sweets in relation to others (see also [3]). In a similar vein, in a
community sample, we found that only 9% believed that their own eating was less healthy than their
peers’ eating, whereas 54% rated their eating as healthier than their peers’ eating [4]. This positive
view of one’s own eating habits stands in contrast to epidemiological data which indicates that many
people in western societies eat too much as well as too many high-caloric foods and do not eat enough
fruits and vegetables. This raises the question of why we think that others eat more unhealthily than
we do.
1.1. Self-Other Biases
The phenomenon that people think more positively of themselves than others, often to an unrealistic
degree, has been demonstrated extensively (see [5–8] for reviews). This self-favoring difference in
self- and others-perception has been named as “unrealistic optimism” [9], “false uniqueness” [10],
or the “holier than thou” effect [11], depending on the judgment domain. Importantly, flattering
self-assessments can stem from three different mechanisms. First, people might perceive themselves
overly optimistically but others rather accurately (self-bias). Second, people might perceive themselves
relatively accurately but others too pessimistically (peer-bias). Third, people might perceive both
themselves and others inaccurately. Accordingly, to disentangle these three possible types of
misjudgment, self- and others-views need to be assessed separately [5,7,8]. Whereas numerous studies
have assessed self and peer related views in various judgment domains (e.g., [12]), to our knowledge,
no study has yet assessed self- and peer-views separately in respect to eating. Hence, although people
clearly demonstrate a self-flattering bias at the group level when they claim that they eat more
healthily than their peers on average, evidence to identify whether the self-view, peer-view, or both is
the source of this bias is lacking.
There are numerous psychological mechanisms underlying self-flattering biases (e.g., [5,8,13]). In
particular, general or broad personality traits and behaviors typically elicit a stronger self-favoring bias
than those which are more concrete and whose definition is more constrained [5]. In a similar vein,
people are typically asked about hypothetical habits and behaviors, that is, how they and their peers
generally behave or would behave in a given situation (see [11], see also [14]). As this represents a
rather ambiguous judgment task, people might either lack the necessary information to provide
accurate assessments or fail to integrate and weigh all relevant and available information [5].
Actual behavior observation reduces the ambiguity of the judgment task for participants and could,
thereby, provide a more accurate picture of self-other biases than hypothetical or self-report assessment
Nutrients 2015, 7 4640
methods. Interestingly, in studies in which predicted and actual behavior was observed, people were
typically more accurate in predicting others’ behaviors than in predicting their own behaviors,
indicating a self-bias ([11,14], for review see [15]). For example, Epley and Dunning [11] showed that
83% of their sample predicted that they would buy a flower at a charity event, whereas they predicted
that 56% of their peers would do so. After the charity event, 43% of the participants had actually
bought a flower. Since the average prediction for the self was more discrepant from the observed
behavior than the prediction for the peers, Epley and Dunning [11] concluded that participants showed
a greater self- than peer-bias (see also [14]). However, one could argue that the observed self-bias is
mainly due to poor prediction abilities for the self rather than biased perceptions of actual behavior.
Recent studies suggest that people base their predictions on “ideal” behavior and, for example, attach
too much weight to current intentions, whereas they fail to make realistic adjustments for situational
constraints on intended actions [16].
In order to disentangle prediction errors from self-flattering perceptions of one’s own actual
behavior as compared to others, we need to elicit separate behavioral probes for the self and for others.
However, in current study designs this is not possible since, for a single observed behavior
(e.g., likelihood of charity donation), average peer-behavior (e.g., that 43% of the sample made a
donation) is an aggregate of self-behaviors and, therefore, equal to the average self-behavior. This
raises the question, how can we measure self-other biases in actual behavior?
1.2. Measuring Self-Other Biases in Actual Eating Behaviors: Probing Behavioral Standards for the
Self and an Average Peer
A first challenge in measuring self-other biases in actual behavior is to observe behaviors that are
representative of what people do in their everyday lives [5,17]. Whereas natural environments have the
advantage of ecological validity, a disadvantage is that food choice can be confounded by, for
example, context variables such as food variety or lighting (e.g., [18]; see [19] for an overview).
In contrast, laboratories offer well-controlled settings [20]. However, laboratory research faces the
challenge of being representative of real-life situations; as Brunswik [21] put it, it has to have a
representative design (see also [22]). Simulating the diversity of available food choices in real life in a
standardized way is methodologically challenging and often conflicts with practical issues, for
example, high costs, limited infrastructure, high preparation effort, and waste. To overcome these
problems, an innovative method was recently developed: using replica food items [23]. With fake food
items, real life, such as eating in buffet style restaurants, can be simulated under well-controlled
conditions. This method has high ecological validity, has been shown to be reliable and a valid
assessment of real food choices [23]. Furthermore, it allows capturing the complexity of food choice
behavior that consumers face. On the one hand, how much people eat, that is the total energy content,
is central for energy balance and weight maintenance (e.g., [24]). On the other hand, eating behavior
comprises more than just consuming energy as an incredibly large variety of food items is available in
the western world. With the fake food method, both variety and quantity can be assessed by food
profiles and total energy content.
A second great challenge in measuring self-other biases in actual behavior is to separate behavior
observations for the two different targets: the self and others. We would like to suggest a new method

Nutrients 2015, 7 4641
for assessing self-other biases in actual eating behavior based on the observation of three different
eating situations: a typical, a healthy, and an unhealthy meal. Food choices in these three situations
give information about a range of prototypical behaviors and, thus, give information which standards
people apply, on average, for themselves and others in the different situations. Selected meals are a
proxy for meals that are regarded as exemplary for the self and others in these situations. Hence,
typical, healthy, and unhealthy behavioral standards for the self and others can be assessed.
Using a fake food buffet as standardized eating situation, it can be observed which food choices
people make when they choose a typical, a healthy, or an unhealthy meal for themselves and for an
average peer. These choices for the self versus for others enable a comparison between the average
self-behavior, that is the “actual” average behavior profile (aggregated food choices for the self), and
the average peer-behavior, that is the “assumed” average behavior profile (aggregated food choices for
the average peer). The crucial question is whether people use different standards within and between
the three different eating situations as a function of the target consumer (self vs. average peer). Hence,
the selection of a different amount of food or other food items for the peer than for the self within one
eating situation (e.g., typical meal) would indicate a self-other difference in eating standards. However,
if people systematically choose more food (i.e., energy), or different food (e.g., more unhealthy food
items) for the peer than for the self across the three different eating situations, this would provide clear
evidence of asymmetrical behavioral standards for the self and others and thereby a self-other bias in
actual behavior.
1.3. The Present Study
The goals of the present study were twofold: (a) to investigate behavioral standards within the self
and within the peer as target consumers and (b) to examine whether asymmetrical behavioral standards
are employed for the self as compared to an average peer. To this end, behavioral standards for three
different eating situations were assessed: a typical, a healthy, and an unhealthy meal. In addition,
participants were asked to compose these three different meals for two different target consumers: for
themselves and for an average peer. The present study employed a fake food buffet to simulate the
diversity of available food choices in real life within a well-controlled experimental setting [23]. It was
observed both how much people chose (total energy content) and what they chose (food item profiles).
2. Method
2.1. Participants
Sixty participants from the University of Konstanz took part in the study. Of these, 49 (82%) were
female. Participants had a mean age of 22.4 years (SD = 5.5, ranging from 19 to 58 years) and a mean
body mass index (BMI) of 22.1 kg/m2 (SD = 2.6, ranging from 17.9 to 30.0 kg/m2). Participants were
recruited via flyers and received €8 for their participation.
All participants gave written informed consent prior to the collection of data. The study was
conducted according to the guidelines of the Declaration of Helsinki. The procedures were performed
in compliance with relevant laws and institutional guidelines. We strictly followed the German
Psychological Society’s (Deutsche Gesellschaft für Psychologie) guidelines for conducting

Nutrients 2015, 7 4642
psychological studies [25] (see paragraph C.III). These are similar to those of the American
Psychological Association. Moreover, the study was reviewed by the Ethics Committee (Institutional
Review Board) of the University of Konstanz, Baden-Württemberg, Germany (project identification
code: IRB15KN007ML; 28 May 2015). The study was judged to be exempt from full Institutional
Review Board review as no threats to human health, well-being, or dignity were identified.
2.2. Material
In order to investigate participants’ food choices, a buffet with replica food items was prepared
(see Figure 1). The composition of the fake food buffet aimed to represent a typical lunch buffet.
An exploratory pilot study was conducted. Six participants were instructed to put together a lunch meal
for themselves and for an average person of the same age and gender, that is their peer, from a fake
food buffet with 55 different food items (see [26]). Participants were questioned how typical the buffet
was and which items were missing or overrepresented. Overall, they found the buffet to be realistic, to
include a large selection of foods, and found it easy to choose meals. However, they suggested adding
sauces, dessert mousses (e.g., pudding, quark), and a larger selection of salad items. In line with their
remarks, the composition of the buffet was adapted. The final fake food buffet contained a salad
buffet, a selection of main courses and side dishes, a dessert buffet, and drinks. In total, it included
72 different food items (see Figure 1 and Table A1, Appendix).
For food selection, large plates (27 cm diameter), small plates (20 cm diameter), bowls (250 mL
capacity), and trays (38 × 58 cm) were provided. All replica food items were manufactured by Döring
GmbH, Munich, Germany. Small packets of real food condiments were also offered: Salt, pepper,
mayonnaise, ketchup, and mustard. To estimate the energy content of the replica foods, the conversion
factors for the weight of fake food items to corresponding real food items were calculated. Weight data
was either derived from Bucher and colleagues [26] or gained by preparing corresponding real
food items and taking weight measures (see Table A1, Appendix). The estimation of nutrients was based
on the national database for nutritional information in Germany (Bundeslebensmittelschlüssel, [27]).
The amount of energy per meal was established by adding the caloric values of all food items
selected for each meal. Additionally, to assess the quality of food choices, all food items were
categorized based on a qualitative food hierarchy concerning the four food groups plant foods, animal
foods, oils and fats, and drinks (German Nutrition Society, [28]; see also [29]). Within these four
groups, foods were categorized as healthy, neutral, or unhealthy. The healthy food category included
foods with low energy and high nutrient density as well as the recommendation to consume in high
quantities. The neutral food category included foods with medium energy and medium nutrient
density. The unhealthy food category included foods with high energy and low nutrient density as well
as the recommendation to be consumed in small quantities. In total, 36 food items (51%) were
assigned to the healthy food category, 12 food items (17%) to the neutral food category, and 22 food
items (31%) to the unhealthy food category. Salt and pepper were excluded from the assignment as
they were classified as spices.

Nutrients 2015, 7 4643
Figure 1. Fake food buffet containing 72 different food items.

Nutrients 2015, 7 4644
2.3. Procedure
Participants were invited to the laboratory individually. In order to create standardized internal
states of hunger, they were asked not to eat and to drink only water for two hours before participation.
After giving informed consent, participants filled in a first questionnaire on demographic data. During
this stage, the fake food buffet was hidden behind a movable wall to avoid potential distractions
and influences.
Next, participants were instructed to compose different lunch meals from the fake food buffet. In
total, participants composed six meals in two serving rounds. One serving round either consisted of
successively choosing three meals for oneself (target: self) or three meals for an average peer of the
same age and gender (target: peer). Within the serving rounds, participants were asked to compose a
healthy meal (meal type: healthy), a meal they would typically compose (meal type: typical), and an
unhealthy meal (meal type: unhealthy). Exact instructions for the typical meal type were as follows:
“Please choose a lunch meal as you would typically choose for yourself in such a buffet situation.”
(target: self)
“Please choose a lunch meal as an average person of your age and gender would typically choose in
such a buffet situation.” (target: peer)
For the healthy and unhealthy meal type, instructions were the same except for replacing “a lunch
meal as … would typically choose in such a buffet situation” with “a healthy/unhealthy lunch meal”.
In order to control for possible carry-over and order effects, the order of choices was alternated
starting either with the self- or the peer-condition. Within the self- and peer-condition, the order of
meal types was alternated, too. However, the same order of meal types was applied in the two target
conditions. Participants were randomly assigned to the order of choices.
After each meal was completed, the experimenter photographed the tray and weighed each food
component or counted the single food items. Between the serving rounds, the buffet was refilled to
initial levels, and the participant filled in a brief questionnaire on food habits. Afterwards, height and
weight were measured following standardized procedures. Participants wore light indoor clothing.
Height was measured without shoes to the nearest 0.1 cm using a wall-mounted stadiometer. Weight
was measured using a digital scale (Omron Body Composition Monitor, BF511, Omron, Hoofddorp,
The Netherland) to the nearest 0.1 kg. Finally, participants were carefully debriefed.
2.4. Statistical Analysis
Statistical analysis was performed using IBM SPSS statistics software, version 22.0 (IBM
Corporation, Armonk, NY, USA). In order to test the research questions, ANOVAs including simple
main effects and simple contrasts were computed. p-Values for non-orthogonal contrasts were
Bonferroni-corrected. In case of violation of the assumption of sphericity, degrees of freedom were
corrected using Greenhouse-Geisser estimates. All tests were based on a 0.05 significance level.
Concerning the total amount of energy, dependent variables were (1) the total amount of energy per
meal and (2) the difference between the energy content of the typical meal minus the energy content of
the healthy meal as well as the difference between the energy content of the unhealthy meal minus the
energy content of the typical meal.

Nutrients 2015, 7 4645
Concerning the quality of food choices, the data set was restructured, treating the 70 food items
included in the healthy, neutral, and unhealthy categories as single observations and the number of
participants who chose each food item within each of the six meals as continuous variable
(see Figure 3). Dependent variables for these analyses were (1) the total number of participants who
chose each food item and (2) the difference between the number of participants who chose each food
item for the typical meal minus for the healthy meal and for the typical minus for the unhealthy meal.
To ensure that the mean of each difference was positive, the difference score typical-healthy was
multiplied by −1 for healthy food items and the difference score typical-unhealthy was multiplied by
−1 for unhealthy food items.
Extreme values concerning the amount of energy chosen from the fake food buffet and the total
number of participants who chose each food item were detected by interquartile range measures. These
extreme values rendered some variables as severely skewed. After excluding extreme values, the
skewness of dependent variables was acceptable (|skewness| < 1.73; |kurtosis| < 3.24; [30]). To secure
our results, all analyses were repeated excluding extreme values. These analyses confirmed results
reported below.
3. Results
3.1. Behavioral Standards for the Self and Others: How Much Did Participants Choose?
A 3 × 2 ANOVA with meal type (healthy vs. typical vs. unhealthy) and target (self vs. peer) as
within-subject factors, and the total amount of energy as a dependent variable revealed significant
main effects of meal type and target which were qualified by a significant meal type × target
interaction (see Table 1). To follow up the interaction, additional analyses were conducted for the
two factors.
Effects of meal type: Behavioral standards for the self. All simple contrasts of meal type within the
self were significant (see Table 1). As shown in Figure 2, participants chose for themselves 3929 kJ
(SE = 207; 939 kcal, SE = 49.5) for a typical meal, 2561 kJ (SE = 166; 612 kcal, SE = 39.6) for the
healthy meal, and 7004 kJ (SE = 373; 1674 kcal, SE = 89.2) for the unhealthy meal. Thus, participants
set different behavioral standards across the three different meal types when choosing for themselves.
Effects of meal type: Behavioral standards for the peer. As with the meals for the self, all simple
contrasts of meal type were significant for the peer (see Table 1). For an average peer, participants
chose 4983 kJ (SE = 269; 1191 kcal, SE = 64.2) for a typical meal, 2824 kJ (SE = 150; 675 kcal,
SE = 35.8) for a healthy meal, and 8238 kJ (SE = 460; 1969 kcal, SE = 110.0) for an unhealthy meal.
Thus, participants also set different behavioral standards across the three different meal types when
choosing for an average peer.

Nutrients 2015, 7 4646
Figure 2. Amount of energy chosen from the fake food buffet as a function of meal type
and target. Error bars indicate standard errors of the mean. *** p < 0.001, ** p < 0.01.
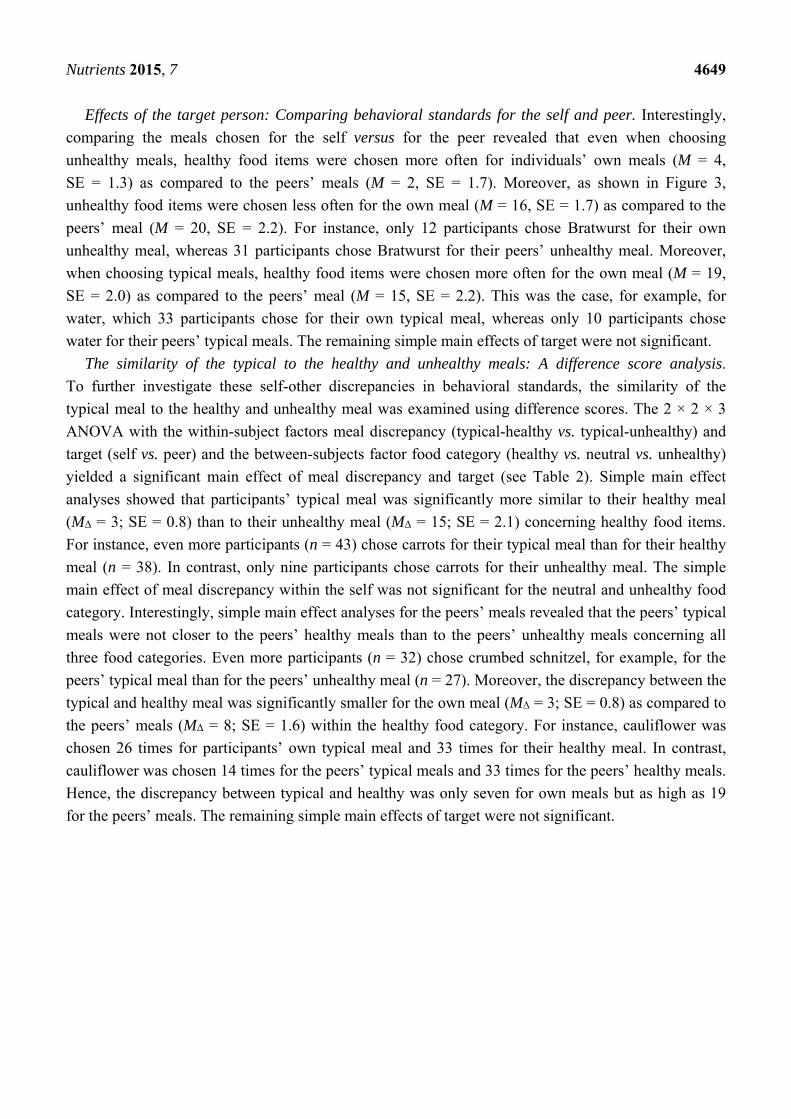
Effects of the target person: Comparing behavioral standards for the self and peer. Interestingly,
systematic differences were seen when comparing choices between the self and peer within the three
eating situations. For both the typical and unhealthy meal, participants chose significantly more energy
for an average peer than for themselves (see Figure 2). However, for the healthy meal type, the amount
of energy chosen was similar.
The similarity of the typical to the healthy and unhealthy meal: A difference score analysis.
For further comparison of the behavioral standards for the self and peer, a 2 × 2 ANOVA with the
meal difference score (typical-healthy vs. unhealthy-typical) and target (self vs. peer) as within-subject
factors was computed (see Table 1). This revealed significant main effects of meal discrepancy and
target. Specifically, within the self, the discrepancy between the typical and healthy meal was
significantly smaller than the discrepancy between the typical and unhealthy meal, MΔ = 1368 kJ;
SE = 165 vs. MΔ = 3075 kJ; SE = 326 (MΔ = 327 kcal; SE = 39.5 vs. MΔ = 735 kcal; SE = 78.0). Hence,
participants’ typical behavioral standard was more similar to their healthy behavioral standard than to
their unhealthy behavioral standard. Simple main effect analyses within the peers’ meals showed a
similar pattern to the own meals: The difference between the typical and the healthy meal was
significantly smaller than the difference between the typical and the unhealthy meal, MΔ = 2155 kJ;
SE = 229 vs. MΔ = 3255 kJ; SE = 396 (MΔ = 515 kcal; SE = 54.8 vs. MΔ = 778 kcal; SE = 94.7).
However, comparing the two targets showed a significant self-other discrepancy: When participants
chose for themselves, the difference between the typical and the healthy meal was significantly smaller
than when they chose for their peer. The difference between the typical and the unhealthy meal did not
differ when participants chose for themselves versus for their peer.

Nutrients 2015, 7 4647
Table 1. Results of the ANOVAS with total amount of energy chosen from the buffet as
dependent variable.
Effect df Effect df Error F p η2p
3 × 2 ANOVA with the factors meal type (healthy vs. typical vs. unhealthy) and target (self vs. peer)
Main effect meal type 1.38 81.34 181.36 < 0.001 0.76
Main effect target 1 59 28.28 < 0.001 0.32
Meal type × target interaction 1.59 93.87 3.85 0.034 0.06
Simple contrasts within self
Healthy vs. typical meal 1 59 68.63 < 0.001 0.54
Typical vs. unhealthy meal 1 59 88.69 < 0.001 0.60
Healthy vs. unhealthy meal 1 59 170.25 < 0.001 0.74
Simple contrasts within peer
Healthy vs. typical meal 1 59 88.53 < 0.001 0.60
Typical vs. unhealthy meal 1 59 67.49 < 0.001 0.53
Healthy vs. unhealthy meal 1 59 183.90 < 0.001 0.76
Simple main effects target
Healthy meal 1 59 2.35 0.131 -
Typical meal 1 59 24.65 < 0.001 0.30
Unhealthy meal 1 59 10.95 0.002 0.16
2 × 2 ANOVA with the factors meal discrepancy (typical-healthy vs. unhealthy-typical) and target (self vs. peer)
Main effect meal discrepancy 1 59 15.87 < 0.001 0.21
Main effect target 1 59 5.66 0.021 0.09
Meal discrepancy × target interaction 1 59 1.12 0.294 -
Simple main effects meal discrepancy
Self 1 59 19.14 < 0.001 0.25
Peer 1 59 4.64 0.035 0.07
Simple main effects target
Typical-healthy meal 1 59 9.01 0.004 0.13
Unhealthy-typical meal 1 59 0.18 0.672 -
3.2. Behavioral Standards for the Self and Others: What Did Participants Choose?
A 3 × 2 × 3 ANOVA with the within-subject factors meal type (healthy vs. typical vs. unhealthy)
and target (self vs. peer), the between-subject factor food category (healthy vs. neutral vs. unhealthy),
and the number of participants who chose the food items as dependent variable revealed a significant
meal type × food category interaction, target × food category interaction, and a significant three-way
interaction (see Table 2). Effects of meal type and target were investigated in follow-up analyses.
Effects of meal type: Behavioral standards for the self. As shown in Figure 3, within the own meals,
significantly more participants chose healthy food items for their healthy meal (M = 22; SE = 2.0)
as compared to their typical meal (M = 19; SE = 2.0) and as compared to their unhealthy meal (M = 4;
SE = 1.3). Moreover, significantly more participants chose healthy food items for their typical meal as
compared to their unhealthy meal. For instance, 53 participants chose lettuce for their healthy meal,
48 for their typical meal, and 11 for their unhealthy meal. This pattern was reversed for the unhealthy
food items: These were significantly less often chosen for participants’ healthy meal (M = 2; SE = 2.6)
as compared to their typical meal (M = 7; SE = 2.6) and as compared to their unhealthy meal (M = 16;

Nutrients 2015, 7 4648
SE = 1.7). They were also significantly less often chosen for participants’ typical meals as compared to
their unhealthy meals. In contrast, neutral food items were equally often chosen for participants’
healthy, typical, and unhealthy meals.
Figure 3. (A) Number of participants who chose the single food items for their own
healthy, typical, and unhealthy meals (actual average behavior profile); (B) Number of
participants who chose the single food items for the peers’ healthy, typical, and unhealthy
meal (assumed average behavior profile).
Effects of meal type: Behavioral standards for the peer. Inspecting simple contrasts revealed the
same effects for the peers’ meals as for the own meals: Significantly more participants chose healthy
food items for the peers’ healthy meal (M = 23; SE = 2.1) as compared to the peers’ typical meal
(M = 15; SE = 2.2), and as compared to the peers’ unhealthy meal (M = 2; SE = 1.7). Moreover,
significantly more participants chose healthy food items for the peers’ typical meal as compared to the
peers’ unhealthy meal. This pattern was reversed for the unhealthy food items: These were chosen
significantly less often for the peers’ healthy meal (M = 2; SE = 2.7) as compared to the peers’ typical
meal (M = 9; SE = 2. 8) and as compared to the peers’ unhealthy meal (M = 20; SE = 2.2) as well as
chosen less often for the peers’ typical meal as compared to the peers’ unhealthy meal. In contrast,
neutral food items were chosen equally often for the peers’ healthy, typical, and unhealthy meals.
123456789
10111213141516171819202122232425262728293031323334353637383940414243444546474849505152535455565758596061626364656667686970
0 10 20 30 40 50 60
Self Healthy Meal Type
Self Typical Meal Type
Self Unhealthy Meal Type
123456789
10111213141516171819202122232425262728293031323334353637383940414243444546474849505152535455565758596061626364656667686970
0 10 20 30 40 50 60
Peer Healthy Meal Type
Peer Typical Meal Type
Peer Unhealthy Meal Type
A) Self B) Peer
Un
hea
lth
y F
oo
d It
ems
Neu
tral
Fo
od
Item
sH
ealt
hy
Fo
od
Item
s
Tomato sliceLettuce
WaterPepper slice
CarrotsStrawberryCauliflower
PeasBlackberry
BeansCornOlive
GrapeKiwi slice
FishItalian dressing
Banana slicePeach slice
Cucumber slice
ChickenBalsamic dressing
CherryApple
SalmonPlum
Wholegrain breadBanana
Apple juiceOrange
Orange juiceWholegrain rollTomato sauce
Onion ringHerring
MustardLemon slice
Plain schnitzelQuark
Vanilla puddingCoffee
EspressoChocolate pudding
CappuccinoRaspberry quark
Herb saucePotatoes
Yoghurt dressingFeta
PastaRice
Bread rollCarbonara sauce
Chocolate marshmallowApple tart
French dressingFish stick
MuffinSugar
BratwurstCheese cakeMayonnaise
GravyBaguette slice
Burger pattyCrumbed schnitzel
ChocolatesChocolate cake
KetchupCoca-cola
Fries
Nutrients 2015, 7 4649
Effects of the target person: Comparing behavioral standards for the self and peer. Interestingly,
comparing the meals chosen for the self versus for the peer revealed that even when choosing
unhealthy meals, healthy food items were chosen more often for individuals’ own meals (M = 4,
SE = 1.3) as compared to the peers’ meals (M = 2, SE = 1.7). Moreover, as shown in Figure 3,
unhealthy food items were chosen less often for the own meal (M = 16, SE = 1.7) as compared to the
peers’ meal (M = 20, SE = 2.2). For instance, only 12 participants chose Bratwurst for their own
unhealthy meal, whereas 31 participants chose Bratwurst for their peers’ unhealthy meal. Moreover,
when choosing typical meals, healthy food items were chosen more often for the own meal (M = 19,
SE = 2.0) as compared to the peers’ meal (M = 15, SE = 2.2). This was the case, for example, for
water, which 33 participants chose for their own typical meal, whereas only 10 participants chose
water for their peers’ typical meals. The remaining simple main effects of target were not significant.
The similarity of the typical to the healthy and unhealthy meals: A difference score analysis.
To further investigate these self-other discrepancies in behavioral standards, the similarity of the
typical meal to the healthy and unhealthy meal was examined using difference scores. The 2 × 2 × 3
ANOVA with the within-subject factors meal discrepancy (typical-healthy vs. typical-unhealthy) and
target (self vs. peer) and the between-subjects factor food category (healthy vs. neutral vs. unhealthy)
yielded a significant main effect of meal discrepancy and target (see Table 2). Simple main effect
analyses showed that participants’ typical meal was significantly more similar to their healthy meal
(MΔ = 3; SE = 0.8) than to their unhealthy meal (MΔ = 15; SE = 2.1) concerning healthy food items.
For instance, even more participants (n = 43) chose carrots for their typical meal than for their healthy
meal (n = 38). In contrast, only nine participants chose carrots for their unhealthy meal. The simple
main effect of meal discrepancy within the self was not significant for the neutral and unhealthy food
category. Interestingly, simple main effect analyses for the peers’ meals revealed that the peers’ typical
meals were not closer to the peers’ healthy meals than to the peers’ unhealthy meals concerning all
three food categories. Even more participants (n = 32) chose crumbed schnitzel, for example, for the
peers’ typical meal than for the peers’ unhealthy meal (n = 27). Moreover, the discrepancy between the
typical and healthy meal was significantly smaller for the own meal (MΔ = 3; SE = 0.8) as compared to
the peers’ meals (MΔ = 8; SE = 1.6) within the healthy food category. For instance, cauliflower was
chosen 26 times for participants’ own typical meal and 33 times for their healthy meal. In contrast,
cauliflower was chosen 14 times for the peers’ typical meals and 33 times for the peers’ healthy meals.
Hence, the discrepancy between typical and healthy was only seven for own meals but as high as 19
for the peers’ meals. The remaining simple main effects of target were not significant.

Nutrients 2015, 7 4650
Table 2. Results of the ANOVAS with the number of participants who chose the food items as dependent variables.
Effect df Effect df Error F p η2p
3 × 2 × 3 ANOVA with the factors meal type (healthy vs. typical vs. unhealthy), target (self vs. peer), and food category (healthy vs. neutral vs. unhealthy)
Main effects and meal type × target interaction - - < 2.90 > 0.062 -
Meal type × food category interaction 2.60 86.93 30.48 < 0.001 0.48
Target × food category interaction 2 67 8.49 0.001 0.20
Three-way interaction 3.13 104.99 4.35 0.006 0.12
Simple contrasts within self
Healthy food category
Healthy vs. typical meal 1 67 13.54 < 0.001 0.17
Typical vs. unhealthy meal 1 67 49.02 < 0.001 0.42
Healthy vs. unhealthy meal 1 67 58.45 < 0.001 0.47
Neutral food category 1 67 < 5.22 > 0.075 -
Unhealthy food category
Healthy vs. typical meal 1 67 21.33 < 0.001 0.24
Typical vs. unhealthy meal 1 67 11.71 0.003 0.15
Healthy vs. unhealthy meal 1 67 22.15 < 0.001 0.25
Simple contrasts within peer
Healthy food category
Healthy vs. typical meal 1 67 26.19 < 0.001 0.28
Typical vs. unhealthy meal 1 67 27.20 < 0.001 0.29
Healthy vs. unhealthy meal 1 67 57.61 < 0.001 0.46
Neutral food category 1 67 < 2.17 > 0.146 -
Unhealthy food category
Healthy vs. typical meal 1 67 12.16 0.003 0.15
Typical vs. unhealthy meal 1 67 11.03 0.003 0.14
Healthy vs. unhealthy meal 1 67 24.66 < 0.001 0.27
Simple main effects target
Healthy food category
Healthy meal 1 67 2.75 0.102 -

Nutrients 2015, 7 4651
Table 2. Cont.
Typical meal 1 67 11.01 0.001 0.14
Unhealthy meal 1 67 5.58 0.021 0.08
Neutral food category < 0.35 > 0.555 -
Unhealthy food category
Healthy meal 1 67 0.32 0.573 -
Typical meal 1 67 2.61 0.111 -
Unhealthy meal 1 67 11.67 0.001 0.15
2 × 2 × 3 ANOVA with the factor meal discrepancy (typical-healthy vs. typical-unhealthy), target (self vs. peer), and food category (healthy vs. neutral vs. unhealthy)
Main effect meal discrepancy 1 67 6.42 0.014 0.09
Main effect target 1 67 7.58 0.008 0.10
Main effect food category and all interactions < 2.21 > 0.118 -
Simple main effects meal discrepancy within self
Healthy food category 1 67 30.04 < 0.001 0.31
Neutral and unhealthy food category 1 67 < 2.68 > 0.106 -
Simple main effects meal discrepancy within peer
Healthy, neutral and unhealthy food category 1 67 < 2.05 > 0.157 -
Simple main effects target
Healthy food category
Typical-healthy meal 1 67 17.91 < 0.001 0.21
Unhealthy-typical meal 1 67 2.54 0.115 -
Neutral and unhealthy food category 1 67 < 2.23 > 0.140 -

Nutrients 2015, 7 4652
4. Discussion
The present study investigated self-other biases in actual eating behavior based on the observation
of behavioral standards for three different eating situations. To capture the diversity of food choices
available in real life within a well-controlled setting, an ecologically valid fake food buffet was
employed. The results showed that, when participants chose for themselves, a typical meal was more
similar to a healthy meal than to an unhealthy meal. Hence, one’s own typical behavior was more
similar to the healthy behavioral standard than to the unhealthy standard. Importantly, self-related meal
choices differed systematically from choices made for an average peer, indicating asymmetrical
behavioral standards for the peer and self. Specifically, participants chose less “healthy” meals for
others than for themselves both regarding quantity and quality, indicating a self-other discrepancy.
The results suggest that the observed self-peer discrepancy may be driven by a peer-bias which is
displayed in the less favorable assumed average behavior profiles as compared to the actual average
behavior profiles. In addition, the difference between the typical and the healthy behavioral standards
was smaller for the self than for others. These results indicate a comparatively positive self-view
which is in stark contrast to epidemiological data indicating that many people in the western world
eat unhealthily.
4.1. Behavioral Standards for Different Eating Situations
Overall, we found different behavioral standards between the three eating situations both for the self
and others. Interestingly, the typical behavioral standard for the self was relatively similar to the
standard for the healthy eating situation. Some healthy food items (e.g., carrots, corn) were even
chosen more often in the typical eating situation than in the healthy eating situation (see Figure 3). Our
results further show relative accuracy for the healthy and unhealthy meals considering the selection of
healthy and unhealthy foods. Consequently, the typical eating standard for the self was relatively
healthy. This finding might appear to be in contrast to headlines and studies stating that children and
adults have unhealthy eating habits [1,31,32]. However, there is evidence that overall unhealthy eating
patterns result from unhealthy snacking between meals rather than main meals [33].
Another interesting result is that the similarity of the typical and healthy eating standard for the self
was larger for healthy food items than for unhealthy food items. This might reflect that it is easier to
consume healthy foods than to suppress consuming unhealthy foods. Specifically, Wegner’s [34]
ironic process theory suggests that the suppression of a thought may ironically result in this thought
becoming more prevalent. For instance, Adriaanse and colleagues [35] showed that planning not to eat
unhealthy snacks ironically resulted in increased consumption.
The finding that the unhealthy and healthy eating standards were relatively accurate is in line with
previous research showing that people’s perception of what is healthy, in general, agrees with official
recommendations. For example, in several studies, people associated healthy eating with a high intake
of fruits and vegetables [36–39]. It is important to note, however, that the number of participants who
chose healthy food items for the healthy meal and unhealthy food items for the unhealthy meal varied
across food items. For instance, fries and Coca-Cola were very often chosen for the unhealthy meal,
whereas lettuce and tomatoes were very often chosen for the healthy meal (see Figure 3). In contrast,

Nutrients 2015, 7 4653
this effect was less clear for other food items such as rice. These variations might, in part, reflect that
food items within the healthy and unhealthy category nevertheless differed in their nutritional quality
and that the categorization used in the present study is only one of several existing categorizations of
healthy and unhealthy foods. Moreover, stereotypes about unhealthy and healthy foods [40] might
account for the clear effect for fries, Coca-Cola, lettuce, and tomatoes.
4.2. Behavioral Standards for the Self as Compared to for Others
We found evidence for asymmetrical behavioral standards for the self as compared to for others
when it comes to a complex behavior, namely when choosing from 72 different food items. For
instance, there was a self-other difference of 1054 kJ (252 kcal) for a typical meal. The found
self-other bias is in line with previous findings of unrealistic optimism [9], false uniqueness [10], and
the holier-than-thou effect [11]. Furthermore, our results complement and extend previous research on
a self-favoring bias in self-reported healthy eating [2,3] and in the prediction of behaviors [11,14,16].
Specifically, our method allowed assessing separate behavior profiles for the self and others, which not
only illustrated a self-other bias at the group level but also shed light on the sources of the self-other
bias in actual behavior. Since the “assumed” average behavioral profile (aggregated food choices for
the average peer) was more negative than the “actual” average behavior profile (aggregated food
choices for the self), the observed self-other differences in our study can be attributed to a
pessimistically biased peer-perception (peer-bias) which results in a flattering self-perception
(see also [41]). As separate behavioral probes for the self and others were observed, prediction errors
due to ignoring situational constraints [16] can be excluded as a contributing factor to the observed
self-flattering bias. Moreover, observing actual behavior, rather than assessing self-reports of
hypothetical or future behavior, rules out a lack or neglect of self-information as an underlying
mechanism of the bias [5].
One potential mechanism for the observed peer-bias might be that others’ unhealthy eating behavior
is more salient than others’ healthy eating behavior. When people observe others eating, these eating
situations are often social. As research has shown that people eat more as well as more unhealthily [42]
in social as compared to solo eating situations, people’s peer-perception might rely more often
on social and thus, potentially more unhealthy eating situations. Moreover, people might engage in
self-enhancement [7,43] and attribute a less favorable behavioral standard for their peers, if their own
behavior is not in the desirable range. Conversely, if the own behavior is already in the desirable range
(i.e., the healthy eating situation), there might be no need for a behavioral social comparison standard
that is less favorable than the behavioral profile of the self. This motivational mechanism is in line
with our finding that, although people used different behavioral standards for the self than for others
within the typical and unhealthy eating situation, they did not within the healthy eating situation.
Interestingly, despite overall asymmetrical behavioral standards for the self and others in the typical
and unhealthy eating situation, “zooming” in on single food items revealed that the size of self-other
differences varied across food items. For instance, large differences in behavioral standards were found
for water and crumbed schnitzel within the typical eating situation. Water was chosen by 33 participants
for the own typical meal but only by 10 participants for the peers’ typical meal. Similarly, there was a
large difference for Bratwurst (self: n = 12, peer: n = 31) within the unhealthy eating situation.

Nutrients 2015, 7 4654
In contrast, no difference occurred, for example, for chocolate marshmallow within the typical eating
situation (self: n = 0, peer: n = 0). This differentiated pattern speaks in favor of differently salient
consumption stereotypes. Specifically, research in the domain of risk perception has found larger
unrealistic optimism when a salient stereotype is in effect. In other words, people, on average, rated
their own risk for a hazard below that of an average person when they easily pictured a clear stereotype
of a typical victim of the hazard [9,44]. In line with this, a larger self-other bias in our study might
display that people find it easy to imagine a person who eats these specific unhealthy foods or avoids
these particular healthy foods. One conclusion from this is that public health education campaigns
might facilitate instead of reducing self-other biases in eating behavior (cf., [7]). Specifically, vivid
presentations of eaters who avoid healthy and consume unhealthy foods may foster consumption
stereotypes that are perceived as dissimilar. This might lead people to the conclusion that, although
their behavior is not optimal, they eat healthily compared to others.
The observed self-other discrepancy might also result in part from the fact that our sample had a
lower BMI than their average peer (M = 22.1 kg/m2 in our sample vs. M = 23.3 kg/m2 for an average
female between 20 and 25 years [45]). Hence, our sample might consume less energy and less
unhealthy foods than their average peers and further research is required to investigate self-other
discrepancies in a sample which is representative in terms of body mass index (BMI).
4.3. Limitations
Some limitations need to be taken into account. First, our results need to be interpreted with regard
to the sample of predominantly female, young adults with a normal BMI and high education from
Germany. Second, the fake food buffet lacked the smell of real foods, and the quantity of leftovers
could not be assessed. Third, our results provide information about the relative healthiness of meals but
not about whether the meals were healthy at an absolute level. The latter requires, for example,
investigation of the agreement of the meals with dietary guidelines such as MyPlate [46].
5. Conclusions
The present study uncovered behavioral standards for the self and others within three different
eating situations by employing an ecologically valid method to capture the complexity of real life food
choices. Participants’ behaviors indicate that they assume that others typically choose more energy and
more unhealthy food items than they do. This “I eat more healthily than you” perception seems to be
caused by a negative perception of the peer and, thus, needs to be extended to “I eat healthier than you
because you are eating so unhealthily” perception. This could explain why most people agree that
eating habits in the general population are unhealthy but think that they eat more healthily than others.
Acknowledgments
We would like to thank Rosemarie Brazdrum, Katrin Ziesemer, Bettina Ott, Tamara Bucher, and
Isabella Mauro for their valuable support in setting up the fake food method and conducting the study.
This work was supported by the Federal Ministry of Education and Research within the projects
EATMOTIVE (Grant 01EA1326, granted to Britta Renner & Harald Schupp) and SmartAct

Nutrients 2015, 7 4655
(Grant 01EL1420A, granted to Britta Renner & Harald Schupp) as well as by the Committee on
Research (AFF) of the University of Konstanz (funding within the second funding period of the
Excellence Initiative of the German Federal and State Governments, granted to Britta Renner).
Publication costs are kindly covered by the DFG and open access publication funds of the University
of Konstanz.
Author Contributions
Britta Renner and Harald Schupp conceived and designed the study as well as provided materials.
Gudrun Sproesser and Verena Kohlbrenner participated in the generation of the study design.
Verena Kohlbrenner performed the study under the supervision of Gudrun Sproesser and
Britta Renner. Gudrun Sproesser and Verena Kohlbrenner analyzed the data. Britta Renner and
Harald Schupp contributed significantly to the interpretation of results. Gudrun Sproesser and
Britta Renner wrote the paper. Harald Schupp provided critical input. All authors approved the final
version of the manuscript for submission.
Appendix
Table A1. Details of the food items presented on the fake food buffet.
Food Item Real
Food (g)
Fake
Food
Fake
Food Unit
Energy Content Estimation
Method ª
Food
Category ᵇkJ/100 g kcal/100 g
Tomato slice 142 100 g 75 18 1 1
Lettuce 69 100 g 50 12 1 1
Water 200 1 200 mL Portion 0 0 1 1
Cucumber slice 92 100 g 50 12 1 1
Pepper slice 143 100 g 126 30 1 1
Carrots 130 100 g 138 33 1 1
Strawberry 18 1 Piece 134 32 1 1
Cauliflower 82 100 g 88 21 1 1
Peas 88 100 g 364 87 1 1
Blackberry 5 1 Piece 167 40 1 1
Beans 76 100 g 142 34 1 1
Corn 108 100 g 318 76 1 1
Olive 72 100 g 464 111 1 1
Grape 10 1 Piece 293 70 2 1
Kiwi slice 6 1 Piece 226 54 2 1
Fish 140 1 Piece 331 79 2 1

Nutrients 2015, 7 4656
Table A1. Cont.
Italian dressing 44 1 50 ml Portion 1247 298 1 1
Banana slice 11 1 Piece 377 90 2 1
Peach slice 14 1 Piece 172 41 1 1
Chicken 82 100 g 481 115 1 1
Balsamic dressing 44 1 50 ml Portion 347 83 1 1
Cherry 13 1 Pair 251 60 1 1
Apple 140 1 Piece 255 61 2 1
Salmon 32 1 Slice 728 174 2 1
Plum 38 1 Piece 180 43 1 1
Wholegrain bread 31 1 Slice 828 198 2 1
Banana 126 1 Piece 377 90 2 1
Apple juice 200 1 200 ml Portion 197 47 1 1
Orange 168 1 Piece 180 43 2 1
Orange juice 200 1 200 mL Portion 180 43 1 1
Wholegrain roll 35 1 Piece 941 225 1 1
Tomato sauce 148 1 150 mL Portion 184 44 1 1
Onion ring 2 1 Piece 117 28 2 1
Herring 70 1 Slice 929 222 2 1
Mustard 10 1 10 mL Portion 360 86 1 1
Lemon slice 18 1 Piece 151 36 1 1
Plain schnitzel 125 1 Piece 849 203 2 2
Quark 250 1 250 mL Portion 305 73 1 2
Vanilla pudding 285 1 250 mL Portion 519 124 1 2
Coffee 300 1 300 mL Portion 8 2 1 2
Espresso 37 1 35 mL Portion 8 2 1 2
Chocolate pudding 285 1 250 mL Portion 397 95 1 2
Cappuccino 220 1 220 mL Portion 138 33 1 2
Raspberry quark 250 1 Piece 544 130 1 2
Herb sauce 150 1 150 mL Portion 406 97 1 2
Potatoes 113 100 g 297 71 1 2
Yoghurt dressing 50 1 50 mL Portion 607 145 1 2
Feta 110 100 g 1188 284 1 2
Pasta 87 100 g 582 139 1 3
Rice 110 100 g 527 126 1 3
Bread roll 22 1 Piece 1130 270 1 3
Carbonara sauce 150 1 150 mL Portion 1402 335 1 3
Chocolate marshmallow 23 1 Piece 1485 355 2 3
Apple tart 132 1 Piece 891 213 2 3
French dressing 50 1 50 mL Portion 1548 370 1 3
Fish stick 32 1 Piece 841 201 1 3
Muffin 37 1 Piece 1180 282 2 3
Sugar 4 1 Piece 1695 405 2 3
Bratwurst 140 1 Piece 1377 329 2 3
Cheese cake 100 1 Piece 1176 281 2 3
Mayonnaise 20 1 20 mL Portion 3109 743 1 3

Nutrients 2015, 7 4657
Table A1. Cont.
Gravy 137 1 150 mL Portion 218 52 1 3
Baguette slice 24 1 Piece 1188 284 1 3
Burger patty 90 1 Piece 950 227 2 3
Crumbed schnitzel 120 1 Piece 950 227 2 3
Chocolate 10 1 Piece 1695 405 2 3
Chocolate cake 104 1 Piece 1611 385 2 3
Ketchup 20 1 20 mL Portion 460 110 1 3
Coca-Cola 200 1 200 mL Portion 197 47 1 3
Fries 82 100 g 1222 292 1 3
Salt, Pepper - 1 Portion - - - -
Note: a Estimation method of weight data: 1 indicates Comparison of fake food to real food, 2 indicates Data derived from [26]; b Food
categories were based on the German food pyramid [28]: 1 indicates Healthy foods, 2 indicates Neutral foods, 3 indicates
Unhealthy foods.
Conflicts of Interest
The authors declare no conflict of interest. The funding sources had no role in the design of the
study; in the collection, analyses, or interpretation of data; in the writing of the manuscript, and in the
decision to publish the results.
References
1. Filipovic, J. The Way America Eats Is Killing Us, Something Has to Change. Available online:
http://www.theguardian.com/commentisfree/2013/sep/26/american-diet-report-card-unhealty
(accessed on 15 April 2015).
2. Sparks, P.; Shepherd, R.; Wieringa, N.; Zimmermanns, N. Perceived behavioral control,
unrealistic optimism and dietary change: An exploratory study. Appetite 1995, 24, 243–255.
3. Paisley, C.M.; Sparks, P. Expectations of reducing fat intake: The role of perceived need within
the theory of planned behaviour. Psychol. Health 1998, 13, 341–353.
4. Sproesser, G.; Klusmann, V.; Schupp, H.T.; Renner, B. Comparative optimism about healthy
eating. Appetite 2015, 90, 212–218.
5. Dunning, D.; Heath, C.; Suls, J.M. Flawed self-assessment implications for health, education, and
the workplace. Psychol. Sci. Public Interest. 2004, 5, 69–106.
6. Miles, S.; Scaife, V. Optimistic bias and food. Nutr. Res. Rev. 2003, 16, 3–19.
7. Renner, B.; Schupp, H. The Perception of health risks. In Handbook of Health Psychology;
Friedman, H.S., Ed.; Oxford University Press: New York, NY, USA, 2011; pp. 637–665.
8. Shepperd, J.A.; Klein, W.M.P.; Waters, E.A.; Weinstein, N.D. Taking stock of unrealistic
optimism. Perspect Psychol. Sci. 2013, 8, 395–411.
9. Weinstein, N.D. Unrealistic optimism about future life events. J. Pers. Soc. Psychol. 1980,
39, 806–820.

Nutrients 2015, 7 4658
10. Goethals, G.R. Constructing and ignoring social reality: positive self-appraisal consistent
estimates of consensus. In Relative Deprivation and Social Comparison: The Ontario Symposium;
Olson, J., Herman, C.P., Zanna, M.P., Eds.; Lawrence Erlbaum Associates: Hillsdale, NJ, USA,
1986; Volume 4, pp. 135–158.
11. Epley, N.; Dunning, D. Feeling “holier than thou”: Are self-serving assessments produced by
errors in self- or social prediction? J. Pers. Soc. Psychol. 2000, 79, 861–875.
12. Perloff, L.S.; Fetzer, B.K. Self-other judgments and perceived vulnerability to victimization.
J. Pers Soc. Psychol 1986, 50, 502–510.
13. Hevey, D.; French, D.P.; Marteau, T.M.; Sutton, S. Assessing unrealistic optimism impact
of different approaches to measuring susceptibility to diabetes. J. Health Psychol. 2009, 14,
372–377.
14. Balcetis, E.; Dunning, D. Considering the situation: Why people are better social psychologists
than self-psychologists. Self Identit. 2013, 12, 1–15.
15. Dunning, D. Self-image motives and consumer behavior: How sacrosanct self-beliefs sway
preferences in the marketplace. J. Consum. Psychol. 2007, 17, 237–249.
16. Poon, C.S.K.; Koehler, D.J.; Buehler, R. On the psychology of self-prediction: Consideration of
situational barriers to intended actions. Judgm. Decis. Mak. 2014, 9, 207–225.
17. Gigerenzer, G. On narrow norms and vague heuristics: Reply. Psychol. Rev. 1996, 103, 592–596.
18. Wansink, B.; van Ittersum, K. Fast food restaurant lighting and music can reduce calorie
intake and increase satisfaction. Psychol. Rep. 2012, 111, 228–232.
19. Wansink, B. Environmental factors that increase the food intake and consumption volume of
unknowing consumers. Annu. Rev. Nutr. 2004, 24, 455–479.
20. Hagger, M.S.; Panetta, G.; Leung, C.M.; Wong, G.G.; Wang, J.C.K.; Chan, D.K.C.;
Keatley, D.A.; Chatzisarantis, N.L.D. Chronic inhibition, self-control and eating behavior:
Test of a “resource depletion” model. PLoS ONE 2013, 8, e76888.
21. Brunswik, E. Representative design and probabilistic theory in a functional psychology.
Psychol. Rev. 1955, 62, 193–217.
22. Dhami, M.K.; Hertwig, R.; Hoffrage, U. The role of representative design in an ecological
approach to cognition. Psychol. Bull. 2004, 130, 959–988.
23. Bucher, T.; van der Horst, K.; Siegrist, M. The fake food buffet—A new method in nutrition
behaviour research. Br. J. Nutr. 2012, 107, 1553–1560.
24. Kirkwood, L.; Aldujaili, E.; Drummond, S. Effects of advice on dietary intake and/or physical
activity on body composition, blood lipids and insulin resistance following a low-fat,
sucrose-containing, high-carbohydrate, energy-restricted diet. Int. J. Food Sci. Nutr. 2007, 58,
383–397.
25. Ethische Richtlinien der DGPs und des BDP. Available online: http://www.dgps.de/index.php?
id=96422 (accessed on 9 May 2014).
26. Bucher, T.; van der Horst, K.; Siegrist, M. Fruit for dessert. How people compose healthier meals.
Appetite 2013, 60, 74–80.
27. Gesellschaft für optimierte Ernährung. Optidiet Basic. Available online: http://www.goe-software.
de/WordPress/?page_id =1278 (accessed on 21 April 2015).

Nutrients 2015, 7 4659
28. Stehle, P.; Oberritter, H.; Büning-Fesel, M.; Heseker, H. Grafische Umsetzung von
Ernährungsrichtlinien-traditionelle und neue Ansätze. Ernährungs-Umschau 2005, 52, 128–135.
29. Oberritter, H.; Schäbethal, K.; von Ruesten, A.; Boeing, H. The DGE nutrition
circle—Presentation and basis of the food-related recommendations from the German Nutrition
Society (DGE). Ernährungs-Umschau Int. 2013, 2, 24–29.
30. Curran, P.J.; West, S.G.; Finch, J.F. The robustness of test statistics to nonnormality and
specification error in confirmatory factor analysis. Psychol. Methods 1996, 1, 16–29.
31. Coppinger, T.; Jeanes, Y.M.; Dabinett, J.; Vogele, C.; Reeves, S. Physical activity and dietary
intake of children aged 9–11 years and the influence of peers on these behaviours: A 1-year
follow-up. Eur. J. Clin. Nutr. 2010, 64, 776–781.
32. Krebs-Smith, S.M.; Guenther, P.M.; Subar, A.F.; Kirkpatrick, S.I.; Dodd, K.W. Americans do not
meet federal dietary recommendations. J. Nutr. 2010, 140, 1832–1838.
33. De Graaf, C. Effects of snacks on energy intake: An evolutionary perspective. Appetite 2006, 47,
18–23.
34. Wegner, D.M. Ironic processes of mental control. Psychol. Rev. 1994, 101, 34–52.
35. Adriaanse, M.A.; van Oosten, J.M.; de Ridder, D.T.; de Wit, J.B.; Evers, C. Planning what not to
eat: Ironic effects of implementation intentions negating unhealthy habits. Pers. Soc. Psychol.
Bull. 2011, 37, 69–81.
36. Lake, A.A.; Hyland, R.M.; Rugg-Gunn, A.J.; Wood, C.E.; Mathers, J.C.; Adamson, A.J. Healthy
eating: Perceptions and practice (the ash 30 study). Appetite 2007, 48, 176–182.
37. Lynch, E.B.; Holmes, S.; Keim, K.; Koneman, S.A. Concepts of healthful food among
low-income African American women. J. Nutr. Educ. Behav. 2012, 44, 154–159.
38. Margetts, B.M.; Martinez, J.A.; Saba, A.; Holm, L.; Kearney, M. Definitions of “healthy” eating:
A pan-EU survey of consumer attitudes to food, nutrition and health. Eur. J. Clin. Nutr. 1997, 51,
23–29.
39. Paquette, M.C. Perceptions of healthy eating—State of knowledge and research gaps. Can. J.
Public Health 2005, 96, 15–19.
40. Oakes, M.E.; Slotterback, C.S. Manipulations that influence stereotypes of the
weight-gain potential of foods. Food Qual. Prefer. 2007, 18, 548–554.
41. Rothman, A.J.; Klein, W.M.; Weinstein, N.D. Absolute and relative biases in estimations of
personal risk. J. Appl. Soc. Psychol. 1996, 26, 1213–1236.
42. Patel, K.A.; Schlundt, D. Impact of moods and social context on eating behavior. Appetite
2001, 36, 111–118.
43. Armor, D.A.; Taylor, S.E. Situated optimism: Specific outcome expectancies and self-regulation.
Adv. Exp. Soc. Psychol. 1998, 30, 309–379.
44. Harris, P.R.; Griffin, D.W.; Murray, S. Testing the limits of optimistic bias: Event and person
moderators in a multilevel framework. J. Pers. Soc. Psychol. 2008, 95, 1225–1237.
45. Statistisches Bundesamt. Available online: https://www.gbe-bund.de/stichworte/BMI.html
(accessed on 11 May 2015).

Nutrients 2015, 7 4660
46. USDA Choosemyplate. Available online: http://www.choosemyplate.gov/index.html (accessed on
15 April 2015).
© 2015 by the authors; licensee MDPI, Basel, Switzerland. This article is an open access article
distributed under the terms and conditions of the Creative Commons Attribution license
(http://creativecommons.org/licenses/by/4.0/).