Embed Size (px)
Citation preview

I E 7.4 - 1 0.4 7
1 E va1~abi bdbr NASA sponsorshlpIn the interest of early and wide dis.semination of Earth Resources SurveyProgram information and without liabilityfor any use made thereot." U TERY INFORMAL PROGRESS REPORT
"SYNTHESES AND ANALYSES OF EARTH RE URCES
TECHNOLOGY SATELLITE (ERTS) DATA"
FOR
NASA Headquarters
Washington, D,C. 20546
Attn: Office of Applications
Code: E
(E74-10427 ) SYNTHESES AND ANALYSES OF N74-19957
EARTH RESOURCES TECHNOLOGY SATELLITE
(ERTS) PROGRAM DATA Quarterly Informal
Proqress Report (Ecosystems International, Unclas
Inc.) 37 p HC $5.00 CSCL 02C G3/13 00427
PREPARED BY
ECOSYSTEMS INTERNATIONAL, INC.
Post Office Box 225
Gambrills, Maryland 21054
April 5, 1974
"L:70
C~J~-ji
https://ntrs.nasa.gov/search.jsp?R=19740011844 2018-07-08T21:01:09+00:00Z

VALUE OF REMOTE SENSING AGRICULTURAL CROP FORECASTING
PRESENTATION TO
BENEFIT/COST TASK FORCE
22 MARCH 1974
ECOSYSTEMS INTERNATIONAL, INC.
Post Office Box 225
Gambrills, Maryland 21054
(301) 987-4976

AGRICULTURAL COMMODITY FORECASTING
WORK FLOW
Task 2 Task I Task 6
Background Basic 'Present ERTS"Econometric Capability t6
Information Model Measure/ForecastGathering Grain production
Task 4 Task 3State of the Art Preliminary Adequateof Grain forecasts Verification
for Grain Trading Less accuratethan I present
system
-Task 5 Task 11Drivers of Im proved httS
SProduction " Capability
Price forecasts.
SDomestic ForeignSCase Case
Synthesis Synthesis
.' ., Task 10 Task 9 .
S " ' Figure of ERTS Costs
Merit of ERTS
Task 13 Task 12Figure T AmproveM erit of ;. ERTS CostsImproved.
ERTS
Task 14Verification
- ith Selected" User group
B/C of B/C of
- Domestic Trade Foreign Trade

CO
RN
o
HA
Y
-"
SOYBEANS
rW
HEA
T '-
COTTON
o
TOBACCO
SORG
HUM
POTATOES
OA
TS
C m
RIC
E O
BARLEY
SUG
AR
BE
ET
S i
C
PEA
NU
T C
)
FLA
XSEE
D
0
VEG
(COM
B)
FRU
ITS
(CO
MB)
MIS
C.

0 0
0 o
.....
....
:*
* *
..C..
...
.
....................
:...:*...*.*.......................
...
.....
.t.
......
..
....
....
...
.....
.
.--
m' I
.-
u
r -n
o z -
_.-
~ ,,C
) ,O
0a 1
C)
C-f
0u
8r 0r

o o
o 0
...
....
m:':
..:.'..:.:-:-:.:.:
o.rn
-41
.:
.'......v
.....
..
=
.-
-f-Il
mr
z
"4~f
rr'n
~~
.:rf~
:;:''
0
0
o
3>
m (
N0
a a
MR
I,
L~
-~
: ;I:
~~:~
l~f;
;~:f
~0
.~~
;;
~
;r ;
f~
zr i
SN

TOTAL WORLD STAPLE CROP VALUE (1972). AT EXPORT PRICES
Billion U.S. $S(1972)
Z -GrainsRICE
WHEAT
20 gggiiiiiiiiiiiiiiiiiiigiiiii
20 ! giiiii iiiiiBiAiiiiiiiiYii !
......... ....... .
SUGAR
0 - iiiiii:::1::::::::: .IIiii::iii:i:i:: :::: ::lIiIIii
0 - . .. '. .'I.~..' .( . - I

WORLD STAPLE CROP PRODUCTION
(1972)-
MILLION METRIC TONS .= Grains
WHEAT
CORN
300
200....
BARLEY
100 . SUGAR .
....... ......... .......................... : .. ITRUS
~iiiiiiii~i~~i~ii~i~~i~i.:SANA~T ........... ...:i~:iii~iiiiii ~iii~~iii~~~iii~i~~i~~i~~i~ii:':i:i~iiii:i~iiii~i~ii~.. ....... F -iiiiii

Percent of W C Y
WHEAT
30 . CORN
1972
I WCY= Average Yearly Caloric Requirement
of World Population (4 billion ( 2,500 CaVday)204......
RICE I WCY= ,650 Tera Calories
; ...
...... . = Grains...... .l* BARLEY
10 SUGAR
.......... ................... ::::::::::: BANANAS
CALORIC CONTENT OF WORLD .STAPLE CROPS

8
Price Demand Curve i = Decrease in consumerwelfare due to forecasterror
P' t B = increase in consumerwelfare due to carryover
". .. Net loss in social welfaredue to production forecast
P error
. . C ...
.......... .
0 Q Q"Production
OQ= True Production
OP = Price which would correspond to OQ
OQ'= Forecasted Production
OP'- Price corresponding to estimated production OQ'
QQ"= Quantity carried over to next year
OP"= Price corresponding to next period production OQ plus .stockcarryover OQ"
BASIC STRUCTURE OF HAYAMI -PETERSONECONOMIC MODEL
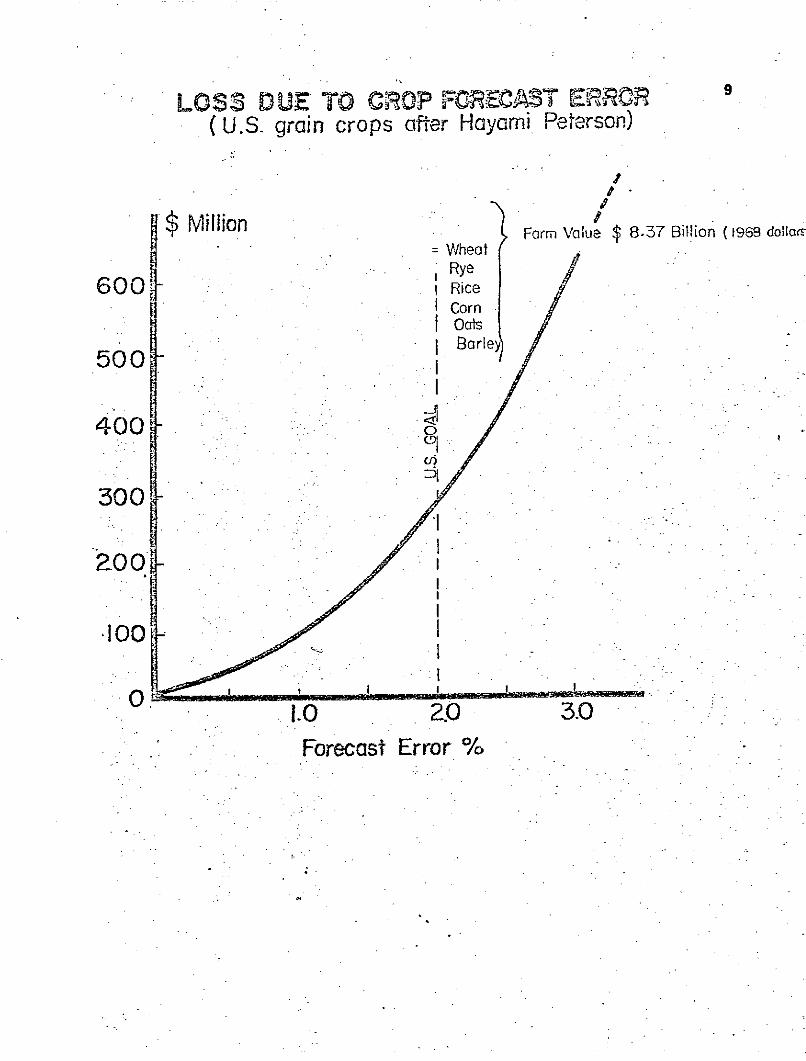
LOSS DUE TO CROP FORECA-T ERRGR "(U.S. grain crops after Hayami Peterson)
Million$ Milion Form Value 8.37 Billion (1968 dollar= Wheofat
Rye600 1 Rice
I Cornt oatso~I Barle
500 _B
400
300
00.
100
.10 2.0 3.0
Forecast Error %

COST OF SAMPLE SURVEY FOR VARIOUS toSAMPLING ERROR LEVELS
(ERS- USDA 1970)100 %-/ Sampling Error
I0
10 100
SURVEY COST Millions U.S.$

HIGHLIGHTS CropCrop March Wheat May S Prducti Agriculture
PLANTINGS creage Yield
PLANTING PRODUCTION . FINAL TE EVISEDINTENTION OUTLOOK ESTIMATE ESTIMATE
J F M A J A S 0 N D DFollowing2 years
TYPICAL USDA (CORN, WHEAT) FORECAST ANDFORECAST RELEASE CYCLE
= Reports to Public. IForecasts
d F M A d d A S0 N DD

44 State Office U.S.D.A. Hq
Iliti sl III State
Objective L 11 i ii IForecast 3 , o, C tYield Program f11 i 1 1ri a r
/ MI Query \ Crop Reporting/ io .Board
ueries
700 Enumerator Forecast to
:10,000 Yield Specialists. 3 ion Program Public
Samples Ropliies Acreage Production
000 09 0w ''r- A,
o0 , e I Aerosurvey
*;* Program* '.o . - 500
,- - Enumero ro
o'o'o Farm " . i. " ' /
16843 segments: SRS Utilization 0.6%2 to 5 forms per segments of U.S. area
SIMPLIFIED USDA. DATA GATHERING PROCEDURE

PLEASE REPORT THE CONDITION AS COMPARED WITHTHE NORMAL GROWTH AND VITALITY YOU WOULD
JUNE 1974 ACREAGE SURVEY EXPECT AT THIS TIME. LET 100 PERCENTREPRESENT A NORMAL CONDITION,
ACRES FORHARVEST
CROP THIS LAST AYR. YR. JULY I ANSWERS
HERE1. CORN REPORT FOR YOUR FARM:
2, WHEAT ACRES OF CORN HARVESTED LAST YR
3. OATS -ACRES
4, BARLEY ___ACRES FOR HARVEST ---. ACRES5. RYE .THIS YEAR
REPORT FOR YOUR LOCALITY:
ACRES FOR HARVEST THIS YEARCOMPARED WITH ACRES HARVESTEDLAST YEAR -. % .
CONDITION OF CORN ...-- -- -
PROBABLE YIELQ/CRE_____ BV.
J ABOVE (INCLUDE - - -- - -ACRES OFALLL LAD ISFARM
(INCLUDE LAND 1E1y- AfSWERPLEASE ANSWER THESE QUESTIONS HERE
NAME-------- FOR THE FARM YOU OPERATE aP
ADDRESS---- --- -------CROP PRODUCTION ANDSTOCKS
CORN PRODUCED ON THIS FARM LAST YEAR70 LEAR OR 56 LB. SHELLED BUSHELS
VDIC'At CORN ON THIS FARM JAN 1, 1974
TYPICAL REPORT FORMATS, 70 LB. EAR OR 56 LB. SHELLED BUSHELS
U.S. FARMERS ALL WHEAT PRODUCED ON THIS FARIALAST YEAR - 60 LB. BUSHELS
ALL WHEAT ON THIS FARM JAN I 197460, L. BUSHELS

USDA FORECAST MODEL GRAINS
P (A) (AXI + BX2 + cX3 + DX)
WHERE:
P = ESTIMATED PRODUCTION (BUSHELS)
A = ESTIMATED ACREAGE
X1= "CONDITION" AS OF DATE OF SAMPLING. AS REPORTED BY FARMER OR COUNTY A-GENT OR STATE
X2 INCHES OF PRECIPITATION WHICH FELL ON THE AREA IN THE LAST TWO MONTHSPRECEDING DATA OF SAMPLING
X3 = INCHES OF PRECIPITATION ESTIMATED TO OCCUR IN THE NEXT TWO MONTHS FOL-LOWING SAMPLING
X4 = CALENDAR TIME, IN WEEKS, ELAPSING FROM MOMENT OF FORECAST
A, B, C, D, = COEFFICIENTS, CALCULATED FROM REGRESSION (LEAST SQUARES) OFTHE LAST 15 YEARS EVENTS.

COUNTRIES INVOLVED IN CROP SURVEY ANALYSISSURVlY ciASSIFICANflI SURVIY CLASSIFICATION SURVIY C ASSIFICATIl SURVLY CIASSIFICATION
Areage Yield Statistical Acreage Yield Statistical Acreage Yield Statistical Acreage Yield Statistical
Country Forecast Forecast Sampling Country Forecast Forecast Sampling Country Forecast Forecast Sampling Country Forecast Forecast
EUROPE
Austria A a -- Guadalope B B a I nya A A* S Somaliland D D "
1lg in A -- Guatemala A A* -- India A B " Togo A AN ""
IDntwomrk A A S Martinique B B -- Indonesia B A " Fr.West.Africa A At
Finland A A S Mexico IB B Iran D " Gold Coast A A* S.
Gcnnvl_ N_. A RB S - Panama A A' S Iraq C C .. Kenya A A
France A D .- uerto Rico A A* S Israel B B S' Madascar C C
Greece I B USA A A S Japan A B S Nigeria D D S*
Rhodesia,Ireland A A S SoUTH ANMEFCA Jordan C C - Northern A A
Italy B B S Argentina A A S Lebanon C C ,. Nyasaland A A
Luxembourg A B -- Brazil C C S* Pakistan C C " Rhodesia,So, A C
Netherlands A B S Chile A D- F* Phillipines B B Morocco.Sp A A
Norway A B S Colabia A A 8 Syi C C Swazianld A • A' -
Portugal C C Ecuador A A* .. Thailand B B Tanzania D S
Spain A B . -- Fr, Guiana - .. Turkey B B S Tunisia A A .
Sweden A B S Paraguay A C Sm. AFMCA Union South Af A A
Switzerland A B - Peru D D. -- Algeria. B B " Uganda C C S*
United Kingdom A C S Surinam A A' -. Sudan B B .. OC~ANIA
Yugoslavia B B S Uruguay A A* S BIasutoland D D S Australia A A S*
NOnTH-CELNT FjL A A
IVenezuela I B .. chuanaland C ..C Fi A A
Csanad A nA ASIA Belgian Congo B B - Hawaii A A
Costa Rica A A S Iunrna A A -- Egpt A A* New Caledonia A At
inic A A -- Ceylon A B S Camcroons.Fr. A Am New Zealand A A S
El Salvador B B - Cyprus jk A' -- Wibrocco. Fr. C C "
Explanation of Symbols: ASampling at farm level r-Sampling at commune level 'Sampling at district level Sampling at province level L Stratified Samplingk System under development
1

THE THREE BASIC LEVELS OF CROP FORECASTING SYSTEMS
Developing Intermediate Advanced
Typical: Dominican Republic Typical: Italy Typical: United States of America
Regional 1599 sections grouped into 69 7851 Communes grouped into 1700 enumerated areas grouped into 44 States
Administra- ommunes 91 Provincestive Struc-ture
Crops Surveyed Maize, rice, beans, potatoes, Wheat, rye, barley, oats, Grains, fodder crops, tuber and root crops,
onions, garlic, peanuts, co- maize, rice, sugar beets, sugar crops, pulses, oilseeds, hay and grass
conuts, oranges, bananas, cocoa, potatoes, peas, beans, vine- seeds, vegetable seeds, fruits, nuts, veget-
sugar cane, plantains, pineapple, yards, fr4its, olives, lin- ables, tobacco, fibers
coffee (in pod), avocado, pears, seed rapeseed, vegetables,
cotton, tobacco tobacco, fibers
Methods of * Interview of producers by en- * Crop area from personal e Direct inquiry to farmer respondents
Data Gather- umerators judgement, supplemented by * Enumerators with aerial photos
ing cadastral survey 9 Objective yield measurement by specialists
o Crop yields from local in-
quiry
Sampling None Simple sampling procedure Multi-frame stratified sampling procedures
Structure
Organization Municipal Statistical Board in * Data from commune col-
each commune . lected by local correspon- * SRS HQ staff supported by 44 State offices
dent assisted by provincial comprising 9 crop regions.agricultural inspector * Refer to Figure 9* Central Institute of St-
atistics issues technicaldirectives and publishesresults
Frequency Every 3 months Two crop reports per year Multiple crop reports per year. Intentionsof Crop Re- First estimate at planting to plant-yearly per crop. Acreage, crop con-
porting time; second estimate at condition, production forecast - monthly forharvest 3-6 months. Final production and yield-yearly.
I-0)

w wa a 0 C? V?
xokok 0.
.. ... ... 0 0.. * *
'-. , 0 0 a 12 Q QQ 0.0 :c, .O6~~
Agricultural Data Gu0h0ri0g System07 oiice ,: * Meiu Complexity~o~l~l Simpleo~oo o duaD.....but... of.. Cp rs.00 1; I-.-- - ~ ~'-,-r0: 0 0.-0 0
a.- 0.0 . . . .0 .. * *''pp""3 000.0. ev1
Agrcutur IDaa athering System.000
Disribtin o Cop orcasin Acivtie W
18
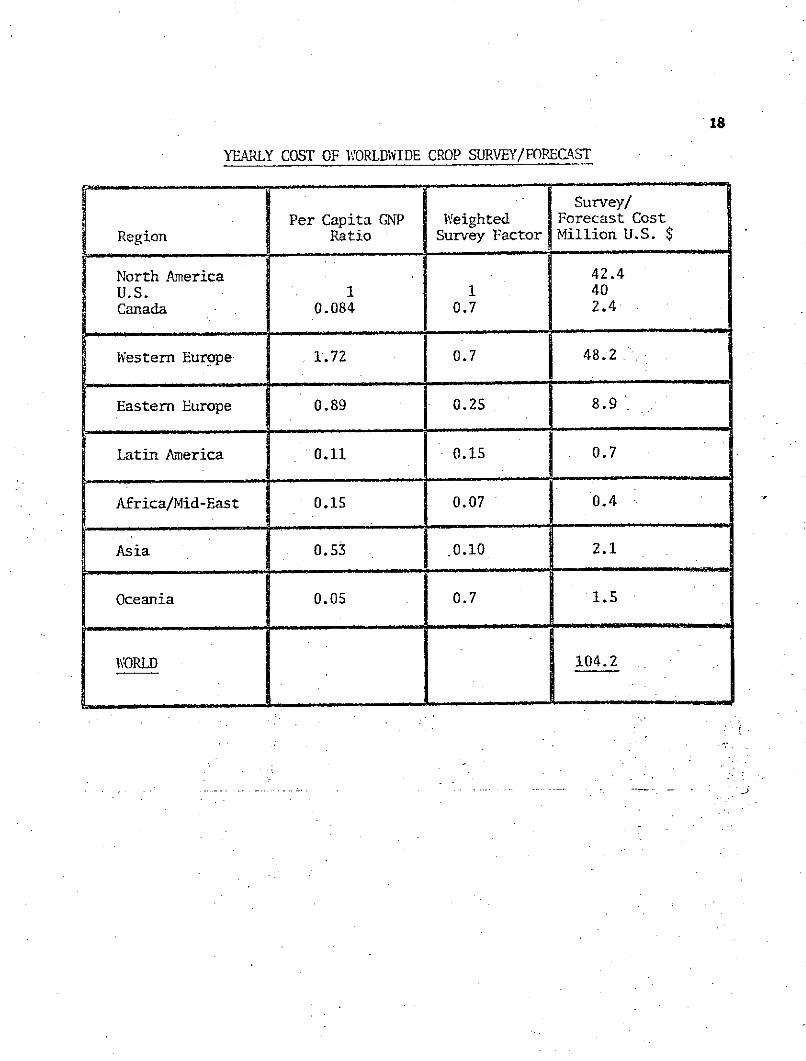
YEARLY COST OF 1W'ORLDWIDE CROP SURVEY/FORECAST
Survey/Per Capita GNP Weighted Forecast Cost
Region Ratio Survey Factor Million U.S. $
North America 42.4U.S. 1 1 40Canada 0.084 0.7 2.4
____________________----mow~-
Western Europe 1.72 0.7 48.2
Eastern Europe 0.89 0.25 8.9
Latin America 0.11 0.15 0.7
Africa/Mid-East 0.15 0.07 0.4
Asia 0.53 0.10 2.1
Oceania 0.05 0.7 1.5
wVORLD 104.2
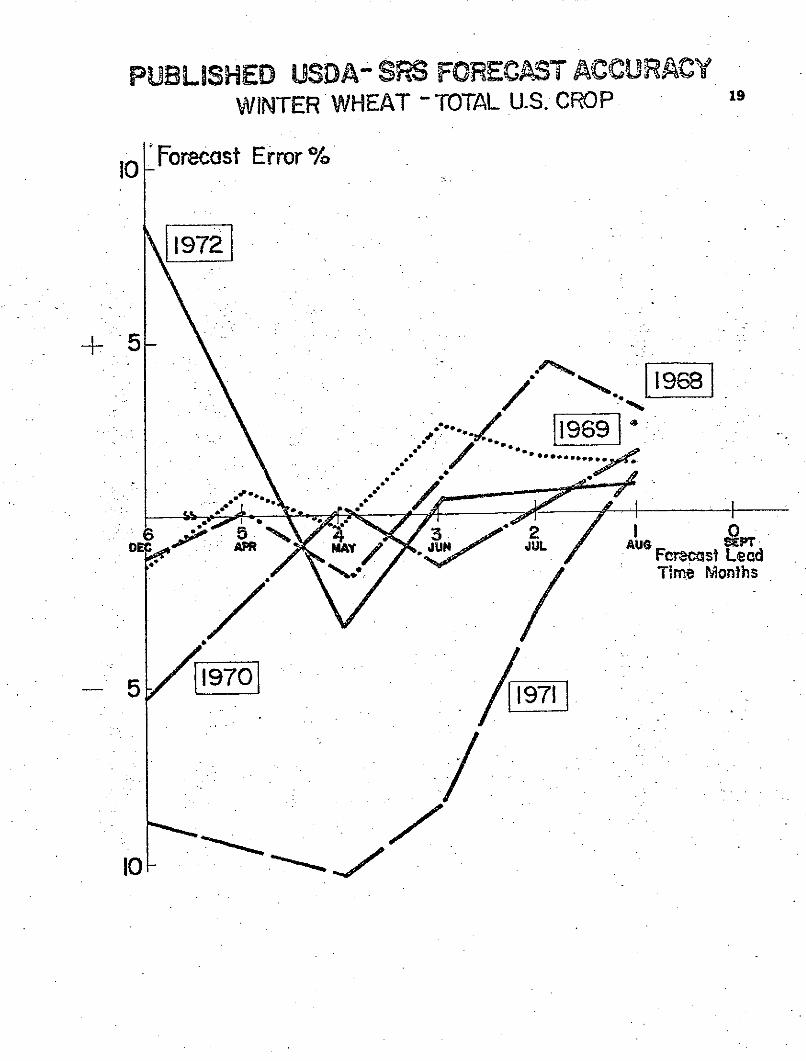
PUBLISHED USDA- SRS FORECAST ACCURACYWINTER WHEAT -TOTAL U.S. CROP 19
1Forecast Error %
1972
I5-
/.- . 1968-
. 11969
/ A Ferecast LeadTime Months
51 1971

20
USDA- SRS Average Crop Forecasting ErrorVersus Time Prior to Crop Year Close
(All Wheat)Data cover years 1957-1972
Average ForecastingI0 _Error % mean
5
Tima0 _44 Prior to
Forecast05 3 2 0 Close-
Months
10 -/o
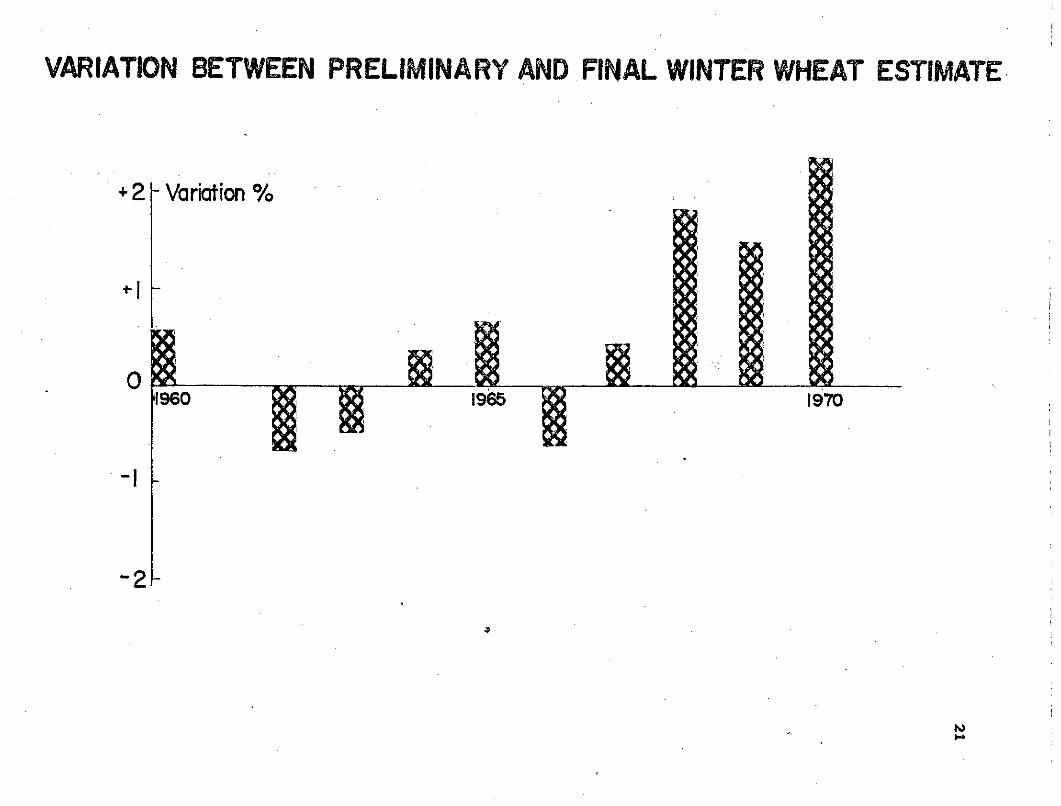
VARIATION BETWEEN PRELIMINARY AND FINAL WINTER WHEAT ESTIMATE
+2- Variation %
90 1965s 1970
- -
-2-

) CA
CD 0
f. .
e
* I
............ .... ...
'
E..
... ... "...._ ............
I&III
<*
*~*%%
* --

THE EFFECT OF CHANGES IN ACREAGE YIELDON TOTAL PRODUCTION OF WHEAT
30
20 -
I CHANGE IN PRODUCTION %
10 CHANGE IN ACREAGE %
PROD. ACREAGE10 ACREAGE L PROD
20-
30 61 62 63 64 65 6 67 68 69 70 71 72 '73 CALENDAR YEAR
0/o YIELD CHANGE COMPARED TO CHANGE IN PRODUCTION30
CHANGE IN PRODUCTION % 20
CHANGE IN YIELD % +
10-
PROD - YIELDT TYIELD PROD
20-
61 62 63 64 65 66 67 6(8 69 70 71 72 73 CALENDAR YEAR

CONTRIBUTION OF ACREAGE HARVESTED TO TOTAL WHEAT PRODUCTION
Acreace Change.as a % of
200 Total Productionchange
S0. 6 6 70 7160-zi.t *1 * Z 6 6 .* *
ACREAGE ocn
100 . aao a* *l0 . pY *p*,* *j *# V..A b .; . -..: ; . . ," ......Lg '.. ..'. d' t.. .. "r.
Aarcage/Yield Combine
.20 0. .V .'. . '-*. 7
Yild driv .s "Produc ton.LLY R S. FOR PRODUCTION CHANE.100 %0 VAS GREATER H Ao PRODUCTION GHAINGE Y ..ELDD INISHED)
20 DID NOT INLUEC PRODUCTION CHAN. G' C."T
EY: .r i:% "E. .,S ACAGE CHANS UtY sponL FO FoCTo CHANE
.-VALUES ppSITLY To PRODUCTION CHANOC. . 'I Z D. "

-i 25
0O
U .
. .........
.
LL
eAZ
Z
0 o
ur 0
--
G,-
Lii"
."
LB;;;;
.=
. ...
o
~1
CC
) 0 CC)
0 0::~
i~i~
I
c~ cJ

CROP LOSS CAUSES: WHEAT(1939-69)
% Of Total LossDROUGHT
40
30
20
HAILWINTERKILL
WIND
DISEASE EXCESSMOISTURE INSECTSFLOOD ALL OTHERS
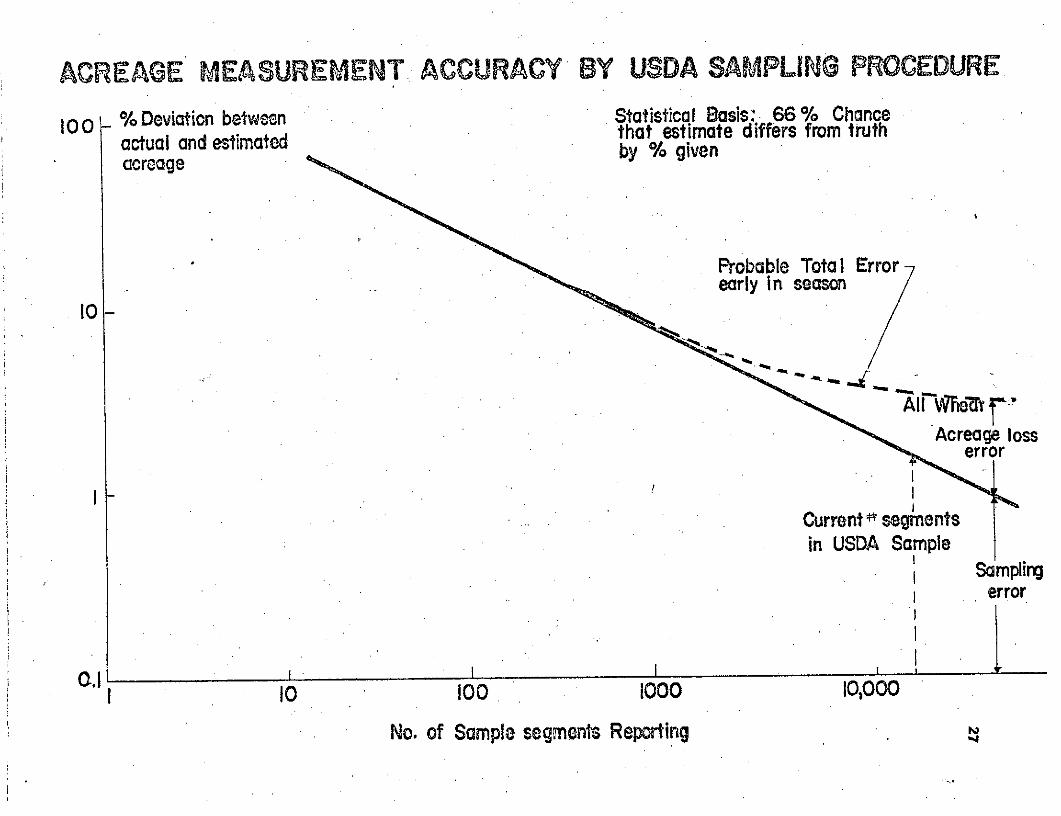
ACREAGE MEASUREMENT ACCURACY BY USDA SAMPLING PROCEDURE
0 0 % Deviation between Statistical Basis: 66 % Chanceactual and estimated that estimate differs from truthactual and estimated by % givenacreage
Probable Total Errorearly in season
10-
Acreage losserror
Current# segmentsin USDA Sample
I Samplingerror
10 1 00 1000 10,000
No. of Sample segments Reporting

28
ACCURACY OF REMOTELY SENSED CROP DISCRIMINATION
FoCorrect Identification
CROP AIRCRAFT (Scale 1:4000) SATELLITE (ERTS)
Small grains 100 --
Row crops 96 96
Pasture 96 84
Trees 100 86
Wheat 95 93"
Oats 95 85
Water 100 100
- not available
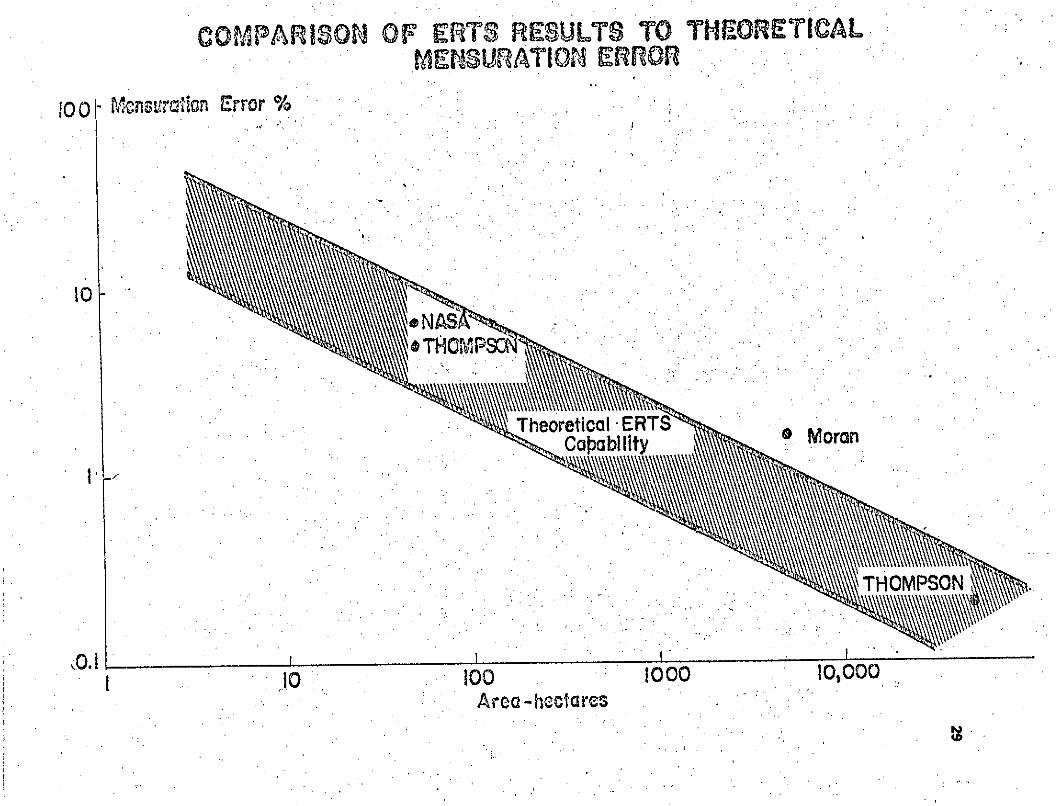
COMPARISON OF ETa R ESULT8 TO THIMORETICALMENSURATION ERROR
100 - Msnvrolatn Error %
10-
Theoretical -ERTSCaabliity or
STHOMPSON
0.1.!0 100 1000 10,000
Area -hectfares
30
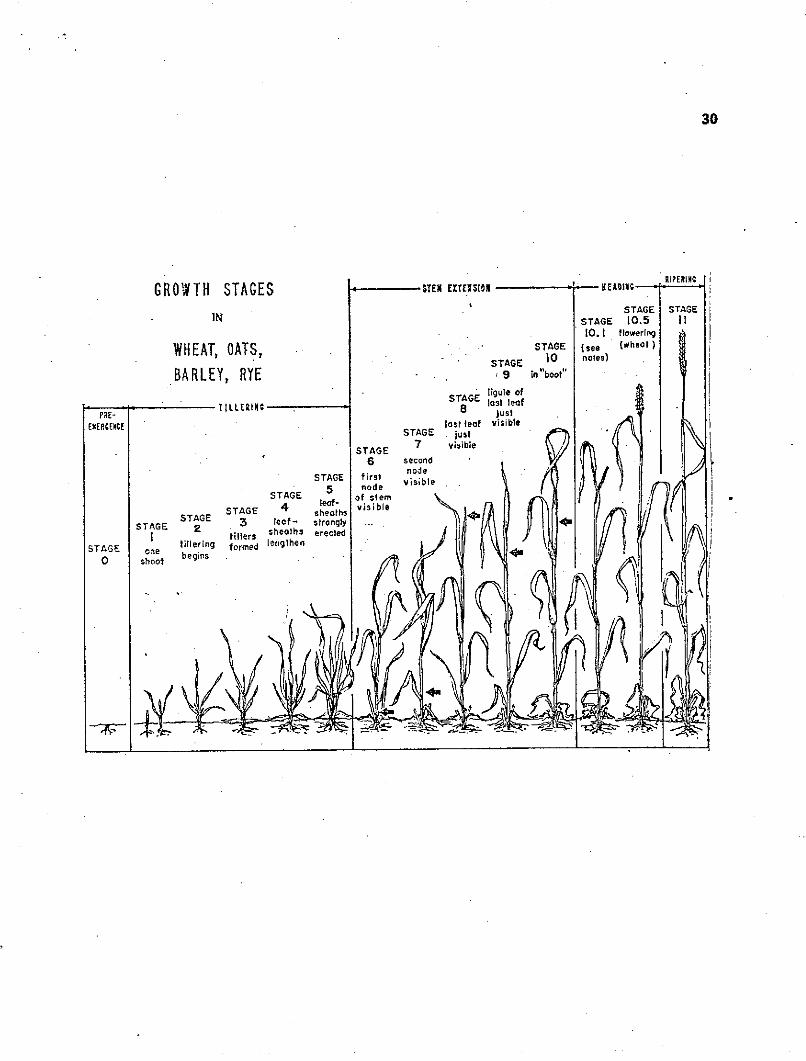
RIPEXINCGROWTH STAGES STEX EXTESSION ' HEADIN
STAGE STAGEIN STAGE 10.5 II
10.1 flowering
WHEAT, OATS, STAGE (see (wheat)
STAGE 10 notes)
BARLEY, RYE :9 in"boot"
STAGE ligule ofST last leaf
PRE. just
EtE RCECEE lst leaf visibleSTAGE just
STAGE 7 visible6 second
STAGE first node5 node vsbe
STAGE of stem
STAGE 4 leaf- visible
STAGtiE ers sheaths erected
STAGE one titlering formed lengthen
0 shoot begins
. ..
IC
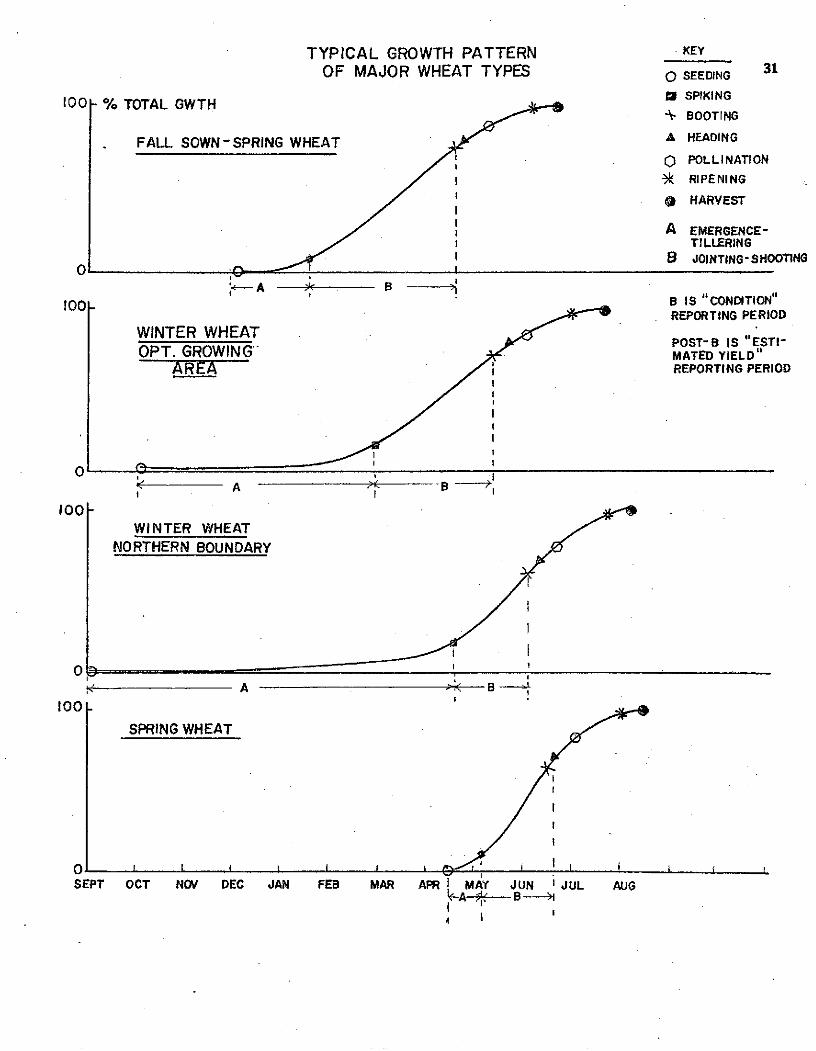
TYPICAL GROWTH PATTERN KEYOF MAJOR WHEAT TYPES 0 SEEDING 31
l SPIKING100 - % TOTAL GWTH = SPIKING
+ BOOTING
FALL SOWN-SPRING WHEAT A HEADING
O POLLINATION
SRIPENING* HARVEST
A EMERGENCE-TILLERING
B JOINTING-SHOOTING
I..--A --- t---- B ----0 O
100 B IS "CONDITION"REPORTING PERIOD
WINTER WHEAT POST-B IS "ESTI-OPT. GROWING MATED YIELD"
AREA' REPORTING PERIOD
0- ~ A
100WINTER WHEAT
NORTHERN BOUNDARY
0 laA B
100
SPRING WHEAT
SEPT OCT NOV DEC JAN FEB MAR APR I MAY JUN JUL AUGIA- ---
4 I

32
CROP AREA DISTRIBUTION
% of Total100 wAroa with
hold - than MOROCCO-. !
/ ./,
1/- I I000
Sindicated .
ARGENTINA
-ITUNIS)A
to1 100 1000Size of Holdiro -ha

33
THEORETICAL ACCURACYOF CROP ACREAGE
MEASUREMENT BY ERTS
Acreage CROP: ALL WHEATMensuration CROP: ALL WHEATError % REGION: U.S.
ESTIMATED USDA MENSURATION ERROR
Early: 4 %
Late : 2%
.I
heoretical ERTSapability
U.S TotoWheat Acreage
001 I I0.1 I .10 100
Area Million ha

THEORETICAL UNIT MENSURATION ERROR(ERROR ON THE "AVERAGE FARM")
10 0 AcreageMenstratiOnError %
8 >"a ii o Total Error c "S= - Unit Error / \JAverage Forms"Sampled
Typical Range ofDeveloping Nations
-CURRENT
USDA TARGET
Theoretica I ETS
10 100 1000 10,000 hectares
"Average Farm"Size

35
THEORETICAL "BEST" MENSURATION ERROR FORSELECTED COUNTRIES - WHEAT ACREAGE
Mensuration Error %
1.0
0.1
0.01 eration
0.001 -0.1 1 10 100
Wheat Acreage-million ha
![[XLS]static.springer.comstatic.springer.com/sgw/documents/1372031/application/... · Web view0 1972 1973 1973 1973 1973 1974 1974 1974 1974 1974 1974 1974 1974 1974 1974 1974 1974](https://img.pdfslide.us/doc/110x75/5ae3d8767f8b9a5d648e7b9b/xls-view0-1972-1973-1973-1973-1973-1974-1974-1974-1974-1974-1974-1974-1974-1974.jpg)