Embed Size (px)
Citation preview

CO
to 00
ARTHUR D. UTTLE, INC. 15 Acorn Park
Cambridge, Massachusetts 02140
TH.RMODYNAMICS OF CONDENSED AND VAPOR PHASES IN THE BINARY AND TERNARY SYSTEMS OF
Be-B-0. Al-B-0. Si-0. Al-Be-0 AND Al-B-F
By
Paul E. Blackburn
ir
^
3.00 0.7 b
For
Office of Aerospace Research
FINAL REPORT
May 31, 1965
ARPA Project Code No. 9100 ARPA Order No. 315-62
I DDC
ZQJZQILaEJ
AUG3 1965
ÜLb^LbU Ü LSI DOC-iRA E

BEST AVAILABLE COPY

TABLE OF CONTENTS
Page
ABSTRACT 1
1. INTRODUCTION 3
2. APPARATUS 3
2.1 Vacuum Balance 4
2.2 Vacuum Systems 4
2.3 Furnace and Controls 5
2.4 Mass Spectrometer 8
3. SAMPLES 8
4. PROCEDURE 10
5. RESULTS 10
5.1 Bo^o Vapor Pressure and Evaporation Coefficient 10
5.2 SiO? Vapor Pressure and Evaporation Coefficient 17
5.3 Be-B-0 System 21
5.4 Al-B-0 System 30
5.5 Rhenium 42
5.6 BeO Effusion Rate 44
5.7 ^2^3 Effusion Rate and Evaporation Coefficient ^7
5.8 Al-Be-0 51
5.9 AlF3(g) and AlF(g) 54
5.10 Preliminary Results on the Al-B-F System 58
Arthur S.^ittleJnr.

LIST OF FIGURE:
No. Page
1 HIGH VACUUM HICROBALANCE SYSTEM 6
2 VACUUM MICROBALANCE, INDUCTION FURNACE AND PUMPING SYSTEM 7
3 MOLYBDENUM-PLATIKUM CRUCIBLE 9
4 COMPARISON OF KNUDSEN AND LANGMUIR VAPORIZATION OF B203 14
5 EFFUSION AND EVAPORATION RATES OF SiO (i) 20
6 BORIC OXIDE ACTIVITY AS A FUNCTION OF COMPOSITION 23
7 B20 -BeO PHASE DIAGRAM 25
8 PLOTS OF 1+T vs l/T FOR VAPORIZATION OF B 0 (g) AND
Be(B02)/,(g) FROM THE SYSTEM Be B206(c)-B203(i) 26
9 PLOTS OF I+T vs I/T FOR VAPORIZATION OF 8203(8) AND Be(B02)0(g) FROM THE SYSTEM Be B206(c)-BeO(c) 28
10 B.O. PRESSURES OVER Al1QB.0oo + Al-0„ 2 3 18 4 33 2 3 EFFECT OF ORIFICE SIZE 33
11 Bo0„ PRESSURE OVER AI,B^O^-Al,„B.O-„ 37 2 3 4 2 9 18 4 33
12 VAPOR SPECIES OVER THE Al-B-0 SYSTEM 39
13 VAPOR SPECIES OVER THE Al-B-0 SYSTEM 40
14 EFFUSION RATE OF BeO 46
15 EFFUSION AND EVAPORATION OF AUO ^9
16 EFFUSION CURVES OF BeO-Al^ SOLUTIONS AT 24150K 52
17 AlF0(g) OVER A,.F„(c) AND AlF(g) OVER A1F- + Al 55 3 j J
arthur ZDAittlrJnr.

LIST OF TABLES
No.
I BORIC OXIDE VAPOR PRESSURE 12
II IU^AT OF VAPORIZATION OF BO- 15
III EVAPORATION COEFFICIENT OF B-O U) BY MOTZFELDT METHOD 16
IV PRESSURE OF SiO OVER LIQUID Si02 18
V EVAPORATION RATE OF Si02 FROM OPEN RHENIUM CRUCIBLE 21
VI THERMODYNAMIC VALUES FOR Be-B-0 SYSTEM 30
VII B_0o PRESSJRE OVER AlnQB,0-. + Alo0o 34
VIII SECOND-LAW HEATS OF VAPORIZATION OF VAPOR SPECIES 41 OVER THE Al-B-0 SYSTEM
IX VAPOR PRESSURE OF RHENIUM 43
X HEAT OF VAPORIZATION OF RHENIUM 44
XI EFFUSION RATE OF BeO 45
XII EFFUSION RATE OF A120 48
XIII A1F3 PRESSURE OVER AlF3(c) 54
XIV THIRD-LAW HEAT OF VAPORIZATION OF A1F3 56
XV A1F PRESSURES OVER Al + AlF3 57
XVI THIRD-LAW HEAT OF VAPORIZATION OF AlF(g) FROM Al + AlF3(c) 57
3rtJiur ZD.HittlrJnr.

THERMODYNAMICS OF CONDENSED AND VAPOR PHASES IN THE BINARY AND TERNARY SYSTEMS OF
Be-B-O, Al-B-O, Si-O, Al-Be-0 and Al-B-F
ABSTRACT
Thermodynamic properties of binary and ternary vapor and
condensed systems werf obtained by measuring pressures by the Knudsen
and Langmuir methods. Vacuum balances and a mass spectrotaeter were
used in these studies.
-2 An evaporation coefficient a = 3 x 10 was found for
Bo0 (i). A third-law heat of vaporization AH..Q = 99.2 ± 0.4 kcal/mole t J 290
and second-law heat AH9Qft = 99.6 ± 1.6 kcal/mole of B~0-(g) were
measured. Experiments on SiO„(£) gave a = 5 x 10 and AH°298 2 e f
= -22.6 ± 1.0 kcal/mole SiO(g).
In ehe Be-B-0 system only one condensed mixed phase exists,
Be3B20,(c) with a melting point of 1495 ± 50C. Be<B0o)2(g) has an
entropy at 1500oK S.500 = 127 eu and heat of formation AH°1500
= -324 kcal/mole. The same properties for Be.B.O, are S._.- = 108 eu 3 Z o IJOU
and AH°1500 = -745 kcal/mole.
In the Al-B-0 system, Al.B 09(c) has AH°(12Ü0) = -1114
kcal/mole, and S = 154 eu/mole. In Al B40 „(c), AH 1500 = -4251
kcal/mole and S. ,._- = 607 eu/mole. Only Bo0_ vapor was found over the
four pseudo-binary systems: B.O (i)-Al,B 0g(c), Al,BJOQ-AI-QB-O-OJ
B„0-(i)-Al,_B,0o„ and Al.„B-O.^-Al-O.. A mixture of B.0_ + Al-0o + 23 34 33 18 4 33 23 23 23 Al produced the previously known species: Al(g), BO, B„0-, Al 0 and
BO.. One metaborate, AlBO (g) was found with AH'1/00 ■ -140 ± 4
kcal/mole.
arthur 21.\inlr.j(nr.

Vapor pressures ci rhenium gave a heat of vaporization
AH° = 184.5 + 1.5 kcal/g-atotn.
Effusion measurements on Al„0„(i) were in excellent agreement (32)
with data calculated from Drowart et al. Langmuir measurements
above and below the melting point of Al^CL failed to produce the dis- *■ * (33)
continuity in evaporation rates claimed by Burns et al. The
evapcration coefficient of both liquid and crystalline alumina is
found to be in excess of 0.5.
Effusion measurements on BeO are in excellent agreement with (31) Chupka et al. ' confirming cheir calculation of the ratios of (^eü)
molecules to Be and 0 atoms.
Be0.3Al_0„(^) was found to vaporize cuiigruently at 24150K.
A heat of formation of this compound AHOQQ = -54 ± 15 kcal/mole from
the oxides was found. Using Efimenko's(39) mass spectrometric data
and this data we find AH° = -25 ± 13 kcal/mole of AlBeO(g).
Aluminum trifluoride vaporizes with a third-law haat
^Ho«0 =72.7+0.1 kcal/mole A1F„ and second-law heat AH° - 71.1 298 J t-yo
kcal/mole A1F„. A1F is formed from AlF,, + Al with AH0298 = 56.0 + 0.2 3 3 v
kcal/mole AlF and AH°298 = -63.3 + 0.7 kcal/mole AlF.
A preliminary value for the heat of formation of A1BF, was
found, AH°298 = -396 kcal/mole of AlBF4(g).
s^rthuv a.HittlcJnr.

1. INTRODUCTION
During the past three years thermcdynamic data have b^en
obtained on condensed and vapor systems by measuring pressures using
Langmuir and Knudsen techniques. The procedures have involved the
use of vacuum balance equipment and a high temperature mass spectro-
meter. The mass spectrometric v^rk was done on Contract No.
DA-19-020-5584 in conjunction with A. Küchler and J. L. Staffer. The
elements, compounds and mixed systems studied were B„0„, Siö„, Be-B-O,
Al-B-O, Re, BeO; Al 0-, Al-Be-0, A1F and A1F. In addi'ion to these
pressure measurements, data has been secured :>n the evaporation
coefficients of B20 (i), Si02(i) and Al-O^X). The results of those
studies are described in this final report.
2. APPARATUS
The > pparatus for the vapor pressure measurements consisted
of three vacuum balance systems and a high temperature mass spectro-
meter. Each balance system had its own automatic balance and furnace
control.
Two of the balance systems used radiant heating. A "Pyrex"
system was limited to about 1100oC by its mullite furnace tube, and a
stainless steel system with a platinum-rhodium furnace had an upper
temperature limit of about 1600oC. Both systems were designed to be
operated under vacuum or pressure. The operating temperature for the
stainless steel system using an induction furnace was limited only by
the melting point of *he container materials.
The mass spectrometer may be operated in excess of 2300oC.
Arthur ai.1U«lpJitr.

2.1 Vacuum balance
The rate of effusion or evaporation is detected by continu-
ously measuring the change in weight of a Knudsen cell or target
suspended from an automatic-recording microbalance. The balance
consists of a quartz truss beam supported vertically at the fulcrum
by fine quartz fibers. The hang downs at the end of each arm are also
quartz fibers sealed directly to the beam and to quartz hooks.
The balance is held at its null position automatically by an
electromagnet acting on a magnet rod suspended from one arm of the
balance. The null position is detected with a variable permeance
transducer which surrounds a steel rod hanging below the magnec rod.
When the balance is displaced from its null a signal is generated by
the transducer controller which drives a potentiometer through a servo
mechanism. The potentiometer changes the current flowing in the
electromagnet, restoring the balance to its null. The current, which
is proportional to the weight change, is recorded continuously. The
electronic system was patterned after that o. Conhran.
2.2 Vacuum Systems
The two stainless systems were designed to achieve pressures -7 -8
in the ultra-high vacuum range 10 - 10 torr at temperature. Each
has a consolidated PMCU 721 diffusion pump, a foreline trap, and a
5 cubic ft/min mechanical pump.
Both systems are built inside a large degassing oven capable
of reaching a temperature of 500oC. The vacuum system is made of
stainless steel, "Pyrex" glass and kovar. All joints are sealed with
metal gaskets of gold or copper. Both the electromagnet and the
transducer mentioned above are mounted outside the balance so that
they may be removed during bakeout.
3rtlmr ZP.iLlttleJm

The "Pyrex" vslem is pumped with a 100 I diffusion pump,
fcireline trap and mechanical pump. The valves and joints are sealed
with greaseless "Viton" 0-rings. Pressures in this system were
10 - 10 torr. All three systems use Dow 705 pump oil having a
varor pressure at 23° of 3 x 10 torr.
2.3 Furnace and Controls
2.3.1 I'latinun-rhodium furnace
The apparatus (Fig. 1) consists of a water cooled stainless
tube in which is placed a 10-inch long resistance-heated platlnum-40%
rhodium tube furnace with three platinum radiation shields. The
f-irnace ends are platinum flanges clainped between water-cooled nickel
flanges. The electrical leads are water-cooled tubing braced into
the furnace wall at one end. Leads at the other end are electrically
it'-.ulated by Varian high current feedthroughs which have been drilled
for water cooling. Thermocouple leads are brought through a glass
press-seal. The platinum-107o rhodium-platinum control thermocouple
is welded to the center of the platluum-A0% rhodium furnace tube. The
leads are insulated with sapphire tubes. This furnace is capable of
1600eC.
Since the chermocouple Is 1 to 2 volts ac about ground? a
filter of chokes and capacitors was used to avoid swamping the
recorder-controller.
The furnace is powered with a saturable reactor controlled
by a Leeds & Northrup recorder-controller connected to the platinum-
10% rhodium-platinum thermocouple. Temperature is maintained to better
than ± 1/20C.
2.3.2 Induction Furnace
This equipment is shown in Fig. 2. An internal work coil
is brought into the water-cooled stainless furnace with a Varian r.f.
Arthur ZH.lUttlpJnr,

Recorder
Quartz Balance
lldttery
f^<- />
G
Potentiometer Servo Mi'tor
L&N |_| ^mp
CarrttT arrltr )—f~l Amp —U
□ D
B
öakedblc Valvc
BA Gauge
Variable Permeance Transd'icer
UHV Pump
^
a 8
Hi^h Curreni Leads
1 Alpert Valve j "*
Ol-
^ Platinum 40*Rhodium .ir Tube Furnare
Knudsen Cell
3 Platinum Radiation Shields
ÖE
FIGURE 1 HIGH VACUUM JflCROBALAUCE SYSTEM
6
3rthuv ZBAittlf Jliir

QUARTZ BALANCE
Rj^.fl
TTTT" LU
Sampte -4$%
Bottary
Po»entiom«ttr
r t
.Work
Es^sza
PMCU 721
UHV Offfusion
PuRJp
-Variable Ptrmeanc« Transducer
Servo Motor
.Shu
11 m i Shutter
Window
-Zeolyte Trap
Fore pump Trap
FIGURE 2 VACUUM MICROBALANCE, INDUCTION FURNACE AND PUMPING SYSTEM
7
3rehur ZU.^mlcJinr.

feedthrough. Power from the Westinghouse 20 kw induction furnace is
maintained constant with a saturable reactor. The latter is govrrned
by a Leeds i Northrup controller fed by a rectified attenuated voltage
from a torroidal pickup coil on one of the r.f. leads. Although Lhe
magnetic field in o'- above the work coil produces an apparent weight
change at different induction power outputs, there is no significant
change in apparent weight with time while 'he power is controlled at a
fixed output. Confirmation of good power control is found in optical
pyrometer temperature readings which may vary no more than ± 2°.
2.3.3 Pyrex system
A bifiliarly wound resistance furnace heats the mullite
tube furnace in the third sysc iiu. Temperatures are controlled with a
//est proportional controller and saturable reactc
2.4 Mass Spectrometer
The high temperature mass spectrometer is a 12,,-radius,
60e sector, magnetic deflection instrument manufactured by Nuclide
Corporation. Before ne present research, extensive terts were carried
out with silver and B„0^ to establish the conditions necessary for
obtaining precise second-law heats of vaporization. It was found that
placing the thermocouple at the base of a Knudsen cell whici. -jat inside
a thick-walled molybdenum crucible yielded quite reproducible slopes
(Fig. 3). In this position the thermocouple measured tht temperature
of the vaporizing material, which was held at the bottom of the cell.
3. SAMPLES
Boric oxide from the U.S. Borax Corp. contained 4.5% H„0
which was removed by heating in vacuum. 99.977,, silica rod was
obtained from General Electric. The BeO from Nuclear Metals had no
significant impurities. Al^O-, powder from A.D. MacKay was better
than 99.9?; pure.
3rthur S.*.ittlf Jttr,
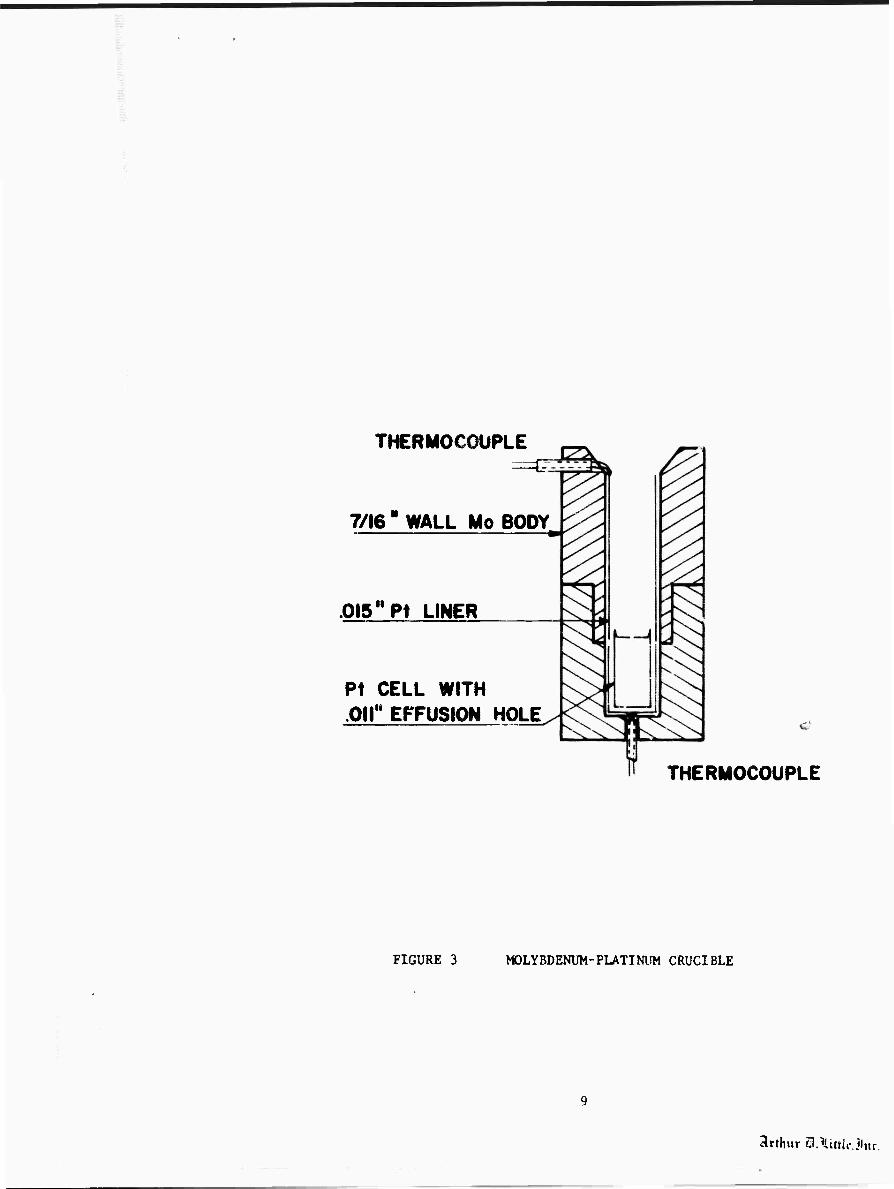
THERMOCOUPLE
7/16 ' WALL Mo BODY
.015 "Pt LINER
Pt CELL WITH Oil" EFFUSION HOLE
THERMOCOUPLE
FIGURE 3 MOLYBDENUM-PLATINUM CRUCIBLE
Arthur SUimh-jInr

Al,B-(.y„ and Al.^B.CL,. were prepared at Philco Aeronutronics H 2 9 18 4 3J
and were very kindly furnished by Dr. D, L. Htldenbrand. Each sample
contained 2 to 5% excess Al 0„. Rhenium obtained from the Remb r Co.
was 99.977o pure. Principal impurities were in ppm: Fe, 70; Mo, 25;
C, 20; N, 10; and 0, 40. Sapphire rod was secured from Linde Company.
The AlF^. from Matheson, Coleman and Bell had some volatile impurities,
probably water, which were removed by heating under vacuum. Aluminum
powder was filed from a pure single crystal.
4. PROCEDURE
In all three systems, filled Knudsen cells weighing less than 1
gram were suspended from the balance. A cell made of rhenium was too
heavy to hang from the quartz beam so a target was suspended instead. Vapor
pressures were measured by comparing the fraction of vapor sticking to
the target to that evaporating from the cell. To do this both target
and cell were measured before and after each series of experiments.
Targets were glass cover slides held in quartz frames.
5; RESULTS AND DISCUSSION
5.1 B_0„ Vapor Pressure and Evaporation Coefficient
Since this compound has been studied by a number of
investigators, it appeared to be a good substance on which to test the
apparatus. Moreover, our tests would also establish a baseline for
the later study of other systems involving B-0-.
Although the spread in the pressures found is not unusually
great, the second-law slopes vary from 77 to 93 kcal. The early and (2)
long accepted measuremünts on B-0_ were made by Speiser et al.
Subsequent investigators aave suggested that Speiser's results may have
been in error because of water adsorption during the intermittent
weighings. This would lead to relativel" higher weight losses for low
temperature measurements and thus to a lower slope. However, the
excellent agreement between the weight loss and target gain in his
10
arthur ÜXinlt3nt. Mr
measurements would appear to be inconsistent with this hypothesis.
Furthermore, some experiments undertaken by us on the rate of adsorp-
tion of water by large pieces 3f glassy B90- indicate that this
reaction is too slow to account for the low slopes.
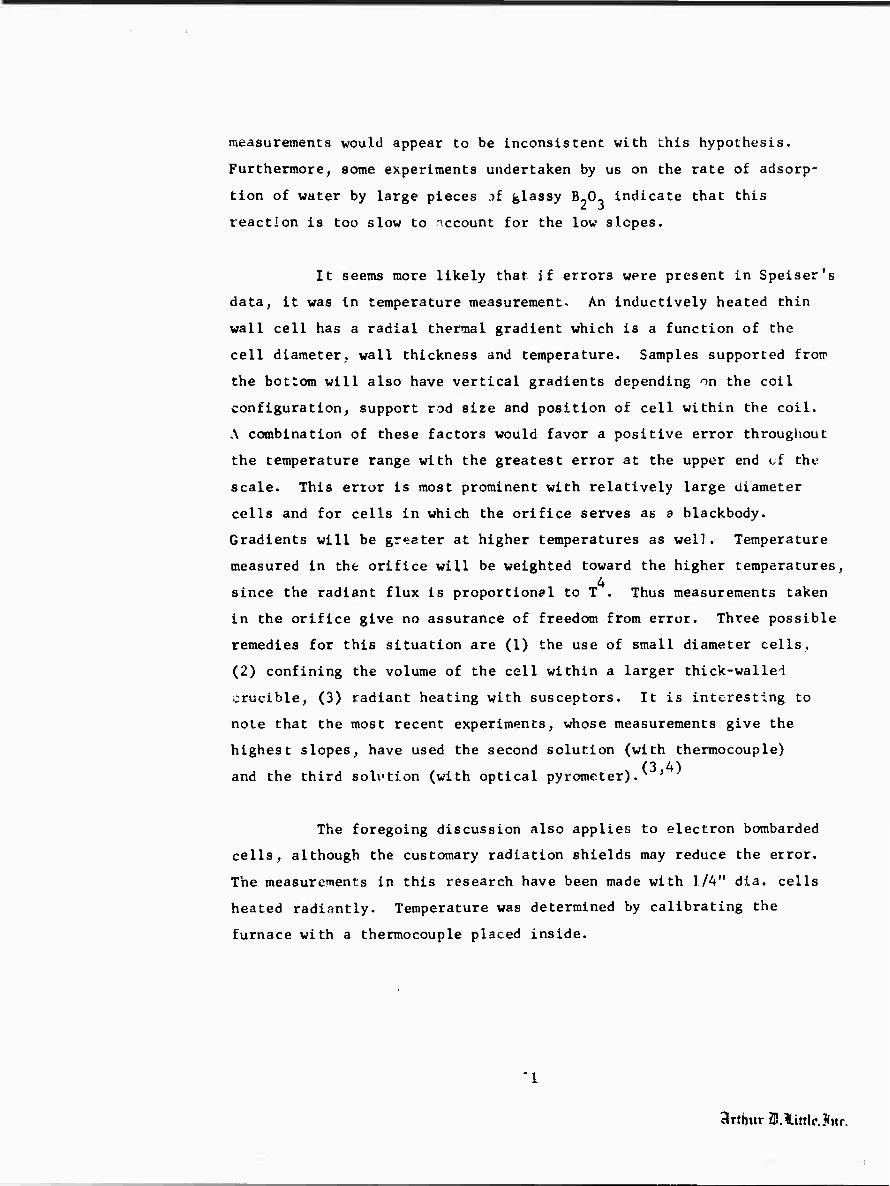
It seems more likely that if errors were present in Speiser's
data, it was in temperature measurement. An inductively heated thin
wall cell has a radial thermal gradient which is a function of the
cell diameter, wall thickness and temperature. Samples supported fron»
the bottom will also have vertical gradients depending on the coil
configuration, support rod size and position of cell within the coll.
A combination of these factors would favor a positive error throughout
the temperature range with the greatest error at the upper end cf the
scale. This error Is most prominent with relatively large diameter
cells and for cells In which the orifice serves as a blackbody.
Gradients will be greater at higher temperatures as well. Temperature
measured In the orifice will be weighted toward the higher temperatures, 4
since the radiant flux Is proportional to T . Thus measurements taken
In the orifice give no assurance of freedom from error. Three possible
remedies for this situation are (1) the use of small diameter cells,
(2) confining the volume of the cell within a larger thlck-wallei
crucible, (3) radiant heating with susceptors. It Is Interesting to
note that the most recent experiments, whose measurements give the
highest slopes, have used the second solution (with thermocouple) (3 4) and the third solution (with optical pyrometer). '
The foregoing discussion also applies to electron bombarded
cells, although the customary radiation shields may reduce the error.
The measurements In this research have been made with 1/4" dia. cells
heated radiantly. Temperature was determined by calibrating the
furnace with a thermocouple placed inside.
artJiur ZB.^ittloJnr.

B„0- pressures were measured here Co establish that the
apparatus was working properly ?nd to construct a baseline for this
compound on our equipment and using our techniques. While some
equipment faults were discovered and corrected, it was also found that
B^CL has a low evaporation coefficient not previously reported.
Evaporation coefficient measurements were made in two ways: (i) by
comparing Knudsen and Langmuir measurements, and (2) by varying the
orifice size and applying the Motzfeldt equation.
In the B?0.. Langmuir experiments an open 1/4" diameter
platinum bucket was filled with B-0- and the evapor^ ion rate measured
with the vacuum balance. In both the Langmuir and the second set of
Knudsen measurements the liquid B^O» formed a meniscus whose area was
calculated by assuming it had a parabolic shape. Effusion rates were -4 2
determined by using a very small orifice, i.e. 2.5 x 10 cm
corrected for the Clausing factor. The data are given in Table I and
a Van't Hoff plot is shown in Fig. 4. From the different pressures
P and P , where L refers to Langmuir and K to Knudsen, we calculate
a P /P L K
0.03 ± .01 (1)
TABLE I
BORIC OXIDE VAPOR PRESSURE
Langmuir Experiments
Weight Loss, T/K Time, sec
25,200
Ug
1201 48 1201 77,400 138 1339 2,304 400 1391 1,059 400 1422 443 400 1459 200 400
Evap. rate -2 -I 9
g-cm -sec x 10
3.89 3.64
355. 772.
1850. 4090.
b
x 101
Press, atm JO
3.64 3.41
353. 777.
16 50. 4210.
-1 2 a. Area = 4.89 x 10 cm b. Calculated from free evaporation - non-equilibrium pressure
12
Arthur aiAiltlrJiif.

Knudsen Experimeiits
Heat of Weir „ c Press. . „ ... Evan, rate Ar ,d Vaporization Time Loss i, , , atm., Met A„o . 1/1
T/K sec ug g-cm^-sec^xlO6 x 1Q7 cal/deg ^298 kcal/l"ole
1297 50,40C 40 3.16 3.08 46.29 98.7 1328 60,000 100 6.64 6.54 46.20 98.9 1422 4,800 72 59.8 61.0 45.84 99.1 1459 2,400 68 113.0 117.0 45.11 99.6 1502 6,600 420 254.0 266.0 45.55 99.9
Avg. - 99.2 ± 0.4
-4 2 c Orifice area corrected for Clausing factor = 2.51 x 10 cm d. .IANAF, December 1964.
The effect of water vapor on the evaporati&a was particularly
noticeable in the Langmuir study, where a large amount of B-0„ was used.
This resulted in high initial evaporation rates and rejection of early
Langmuir measurements.
A least squares fit to both Langmuir and Knudsen measure-
ments gives a common slope of AH.»-- 92.6 ±1.6 kcal/mole, in
excellent agreement with Hildenbrand, et al. and Büchler, et al.
who found 93.3 and and 93.6 ± 3 kcal/mole, respectively. A third-law
heat of vaporization AH° is 99.2 ± 0.4 kcal/mole for Knudsen
measurements. The orifice to sample area for this cell is so small
that the measured pressure should be only 1% less than the calculated
equilibrium pressure.
Our second and third-law heats may be compared in Table 11.
13
Arthur Sl.^ittlcJm

1 I I i I <L - r- -
UJ
/
-
/ ^— L
AN
6MU
IR
(CA
LC.
FR
OM
/ —
-
c
CO /
3 / Z / 2 /
/
/ -
/
-
J /
fu , / i 1 i . .
lO
o» o
z o
S M or:
2
05
fe
a; •<
I 0» cd
CO
(0 9) d 001
14
arrhur 31 HittleJnr.

TABLE II
Heat of Vaporization of B_0„
Range
1325-1547
AH 298 AHp98
Third Law Second Law
99.4 + 0.2* 92.8 ± 1.4* May 1963 -199.9
May 1965 1201-1502 99.2 ± 0.4* 99.6 ± 1.6** -200.1
Averag« of nine measurements '10)
in JAHAFV ' excluding that
of Cole and Taylor 99.5 ± 0.8 90.7 ± 8.2 -199.6 + 0.8
* Knudsen measurements only ** Knudsen and Langmuir measurements
In the Motzfeldt treatment, the platinum Knudsen cells were
one-quarter inch in diameter and three-eighths inch high. A tight
fitting removable top permitted changing the orifice area. Measure-
ments were made at several temperatures and were normalized to 1391"'K
to compute the evaporation coefficient. For this calculation, a heat of
vaporization of 92.6 kcal/mole was used. The data are presented in
Table III.
TAIJLE III
Evaporation Coefficient of B-0j(i!) by Motzfeldt Method
aW • „ io7
p atm x 1C (6
a x io2 e T.0K
P m
atm x m
normalized to 1391' JÜ
1422 3.19 37.2 1.71 5.9 1391 j.19 18.4 1.84 8.7 1359 3.19 8.18 1.80 7.7 1359 12.9 3.95 0.87 4.4 1391 12.9 10.1 1.01
i \VE. 5.7 6.4 t 2 x 10
-2
15
Arthur SMXittipJnr.

The evaporation cos.fficient was computed from Motzfeldt's
?qu.-;tion,
aW , . pB - ^e, - -r ^ -+ 5" - 2> p
m <2) e B
which may be rearranged with 1/W - 2 ' 0, to B
aW P 0 ae = "^ ( P - P > - 6 * 2 ^ 10 (3)
eq m
where a is the orifice area; W , its Clausi.ig factor; B, the sample 3
area; P , the measured pressure and P , tne equilibrium pressure. P m eq n r m
is found by using Langmuir's equation and the measured effusion rate.
P (2.34 x 10 arm at 13910K) was taken from the data given in eq ' -4 2 -4
Table I, where aW was 2.5 x 10 cm and aW /B was 4.5 x 10 . Two a _2 a
me;surements in which aW /B ■ 1.13 x 10 were not included in Table a HI. The measured pressures were too close to equilibrium to give
meaningful values for a , considering the scatter in the data. In
order to measure an evaporation coefficient of this magnitude (0.06)
by the Motzfeldt method, it is necessary to use relatively large orifice
to sample area ratios.
Within the precision of the present data, the Motzfeldt
equation appears to give satisfactory results for B 0 (i). These data
cannot be considered a test of Rosenblatt's criticism of Motzfeldt's
equation.
Rosenblatt suggests that the evaporation coefficient may be
a function of the degree of /apor saturation over the condensed phase,
In the case of liquids, however, Hirth and Pound state that the
evaporation coefficient and condensation coefficient should be equal.
16
Arthur SIAtttlrJur.

(8) (9) It has been pointed out by Wyllie, Mortensen and Eyring,
and by Hirth and Pound that polar molecules which are associated in
the liquid state should have a low condensation coefficient. The
impinging molecule must be properly oriented with respect to the liquid
molecules in order to be integrated into the liquid phase. Otherwise
the molecule will "bounce" from the surface of the liquid. Three
examples of polar liquids are methyl, ethyl alcohol, and water. These
three are associated in the liquid state by hydrogen bends and have
condensation coefficients of 0.02 to0.05. B)^v w^t^ a similar
condensation coefficient, is thought to form a network structure in
the liquid phase, with single bonds from each boron atom to three
surrounding oxygen atoms. Thus the evaporation coefficient of about
0.04 for B^G- is reasonable when compared to other associated liquids.
5.2 SiO_ Vapor Pressure and Evaporation Coefficient
Another high temperature associated liquid is Si0_. It
vaporizes as predominately SiO + 1/2 0„, with a small percentage of
SiO„ in ths vapor.
Several Investigators have measured the heat of formation of
SiO(g) by reducing SiO™ with either Si or H-. Only two sets of vapor
pressure measurements have been made on SiO„ under neutral conditions. (11) Brewer and llastick made three measurements between 1840 and 1951CK
using a platinum cell. Their tests yielded AHf298 = -30 ± 4 kcal/mole (12)
GiO(g). Poner, Chupka and Inghram measured SiO- in an alumina
lined cell. Their measurements give &H°298 = -40 ± .5 kcal/mole Si0(g).
Both measurements are more exothermic than those made under reducing
conditions. No one has measured the evaporation coefficient of SiO».
Quartz was heated in a rhenium Knudsen cell and the vapor
condensed on a target suspended from a vacuum balance. The rhenium
cell, the vapor pressure of which is given later in this report, had
an orifice in a removable lid and a hole drilled in its side for
17
Zxthur BXittleMc.

measuring temperature. All measurements were made above the melting
point of quartz. Six measurements were made vn rh the lid on and five
with an open cell. In the first three Knudsen measurements there was
a decrease in effusion rate with time, presumably because the sample
was losing water. The Knudsen measurements are given in Table TV
together with a third-law heat for the reaction
St02(i) = Siö(g) + 1/2 02 (4)
From the Knudsen measurements a heat of formation for SiO(g) is calcu-
lated as AH°298 = - 22.6 ± 1.0 kc^l/mole. This is in good agreement
with the value in the latest JANAF Tables^ ' (-24.2i 1 kcal) based on
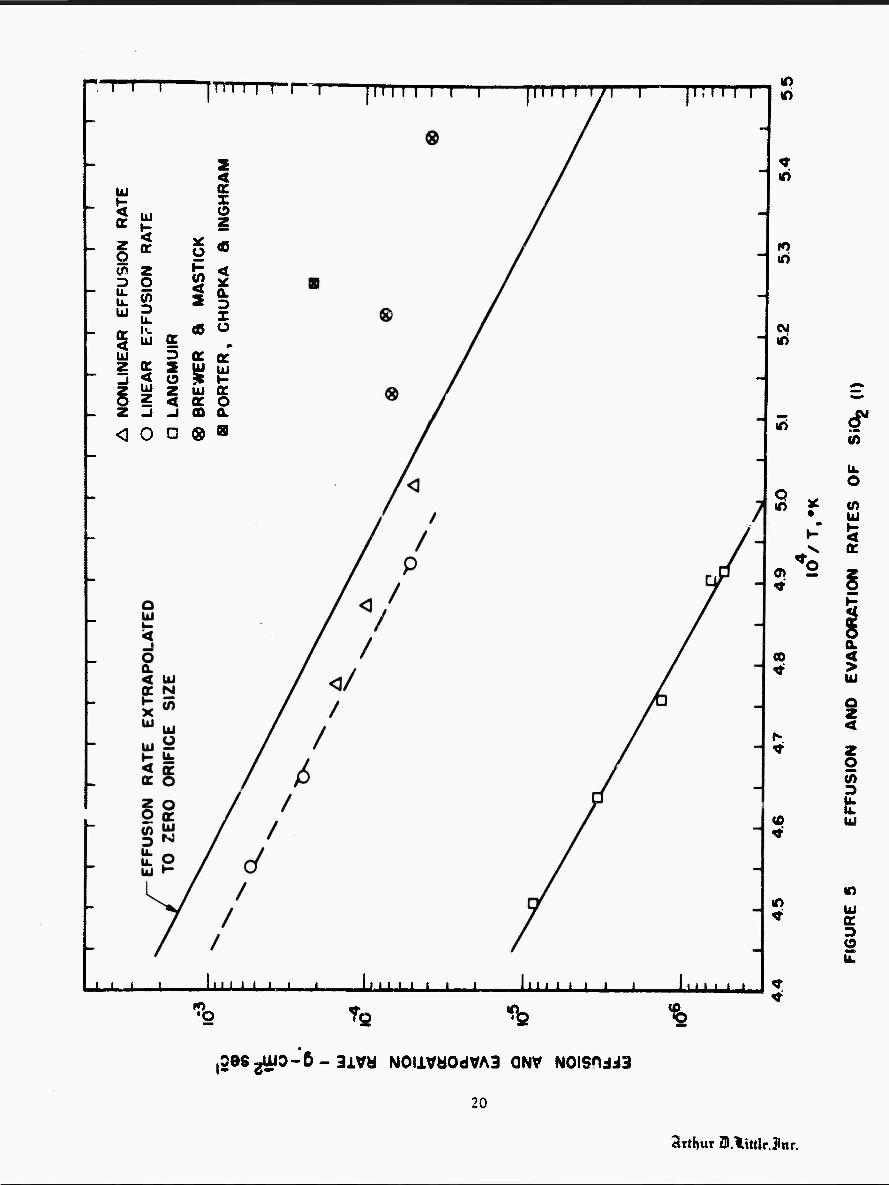
the formation of SiO under reducing conditions. These data are used
to construct a curve (Fig. 5) for effusion rates corrected for the
evaporation coefficient described below.
TABLE IV
Pressure of SIO o^/er Liquid StO„
T,0K
1993
t sec
x lo'3 Target gain Total3
Evap. Rate
4.94
Evap.brate -2 -1
g-cm -sec
3.40
SiO
x 105
Pcatm
x 105
2.40 30 1.09 205'» 3.60 88 9.65 6.59 2.13 2095 2.40 92 15.1 10.3 336 2146 6.60 410 24.5 16.6 5.48 2198 3.00 400 ^2.7 35.5 11.9 2032 4.20 55 5.17 3.54 1.14
-2 2 a. Top orifice area = 1.14 x 10 cm ; fraction striking target
= 0.0222
b. Using calculated ratios for SiO(g) and SiO^g) from JANAF
c. Extrapolated to zero orifice size, i.e. 2.14 P r m
18
ctrtlnir ÜH.lUttlrJlitr.

Heat of formation of SiO(R)
"Rln PQin -ll2 Rln PA Af d ^0293e -AH'298f SiO O2 -Afet r f
T^K cal/de^ cal/deg cal/deg kcal kcal
1993 22.71 12.21 60.93 191.0 24.9 2053 21.38 11.53 60.82 192.4 23.5 2095 20.47 11.08 60.73 193.3 22.6 2146 19.50 10.60 60.63 194.7 21.3 2198 17.80 9.75 60.53 193.6 22.3 2032 22.62 12.16 60.86 194.3 21.6
Avg. -22.6 ± 1.0
d. JANAF Tables
e. Heat of reaction for SiO (i) -4 SiO(g) + 1/2 0»
f. Heat of formation of SiO(g) with AH£298 SiO,(i) = 215.9 kcal
The open cell evaporation rates are given in Table V and
plotted in Fig. 5. The ratio of Langmuir (open cell) and corrected
Knudsen measurements,
FL/PK ae " 5 X 10'3 (5)
gives the evaporation coefficient. This value is about one-tenth that
found for B„0„. If the low evaporation coefficient is due to restricted
rotation arising from bonding in the liquid as suggested by Kincaid (13)
and Eyring, the lower evaporation coefficient for Si0„ may be
caused by its three dimensional bonding compared to B90„ which is
bonded two-diraensionally.
19
Arthur ZMi.ittlr.jJnr.
I I I |TTrrrr-r—i [in i i i i—i |m i i \}\—r"—|i!i i i i
2 <t
ÜJ (T H X < cr UJ
1- z § < cr *
Ü <c tp z >-
«n < 2
< D o ^ U.
ÜJ to
It
Q.
X
5 I«. UJ cr OB Ü
ÜJ i> tr rr Z <
2 £ Ui
I UJ z I UJ g
z -1 -i OD (L
<] O n ® B
id
in
eg id
X-1 I L i i i i i X-i. " ' ' ' ■ ■ ' HIM I
•O ^a ■ib %
id
u. O
s ^ (n • UJ
1- s V ac
0» *o 8
00 rf ^ >
UJ
o 5
f- ^ i (6 w <■
W) lO
Ui oc O
* ^
,098^0-5-3XVU N0liVa0dVA3 QNV NOISndi'J
20
3rthur ZHAitJlrJnr.

TABLE V
Evaporation Rate of SiO» from Open Rheniam Crucible
Evaporation rate Target gam ^ ^ 7
T,6K t sec ug g-on -sec x 10
2035 5400 71 5.17 2101 4800 160 13.1 215/ 18C0 154 33.6 2218 5400 1180 85.8 2039 1800 30 6.55
Fraction striking target = 0.0264 2
Area = 0.965 cm
5.3 Be-B-0 System
Until the present study of the Be-B-0 system, only one (14 15)
compound, Be„B_0,, had been identified by X-ray, ' ' and no phase J 2 o
diagram or thermodynamic data were available. A vacuum balance,
differential thermal analysis and mass spectrometry were used in our
research to establish the phase diagram and thermodynamics.
5.3.1 Microbalance Measurements
Vapor pressure as a function of composition in the BeO-B 0
system was obtained by determining the rate of effusion from a Knudsen
cell whose weight change was continuous!' measured. The first weight
change measurements were made in the temperature range between 1080° -3 -2 2
and 1250oC, with orifice areas between 2.3 x 10 and 1.8 x 10 cm .
These data indicated the existence of a two-phase region extending
from B90_(i) to at least 50 mole percent BeO, as manifested by a
constant pressure equal to that of B„0-(i). The existence of at least
one compound was revealed, for the pressure decreased in the range
from 50 to 70 mole percent BeO. In none of these measurements, huvever
was equilibrium established after the pressure dropped. This is
21
clrtlmr ZH^iittli-jfjtr.

evidenced by the lack of constant pressure regions corresponding to
other two-phase domains. To obtain consistent results, as shown by
well-defined two-phase areas, it was necessary to use very small
orifices. Two separate measurements were made, one at 15620K with -4 2
^n orifice area of 5.5 x 10 cm , a second at 13980K with an orifice -3 2
area of 1.4 x 10 rm . The larger orifice was necessary at the lower
temperature because of time limitations. Even with an orifice of this
size, the measurement required three weeks.
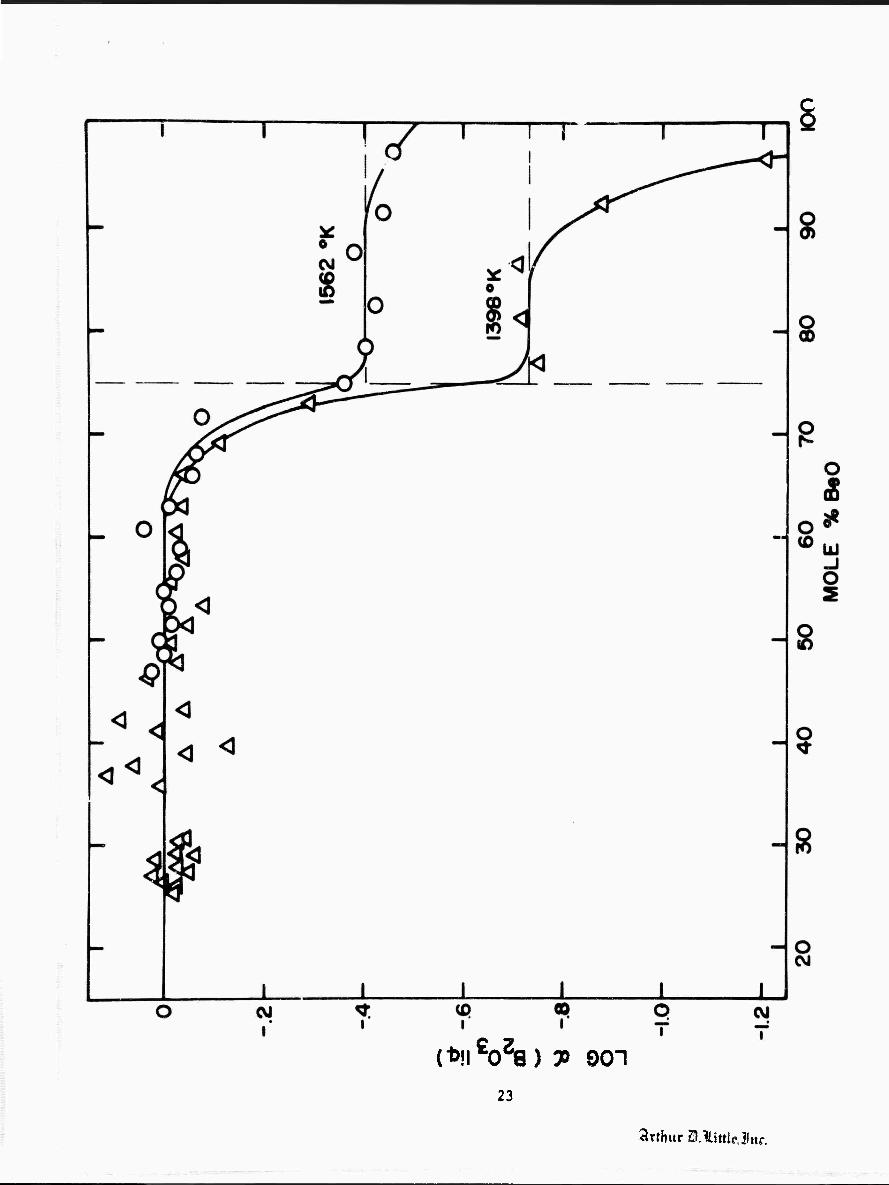
The results of the two experiments are shown in Fig. 6, in
which the logarithm of the B-0„ activity with B 0 (i) as standard state
is plotted against composition. The data of Fig. 6 indicate that the
compound Be B„0, identified earlier by low temperature X-ray studies, J
Jib
is in fact the only stable intermediate phase in this system. The
drop-off t.'.! B-0- activity as the 75% composition is approached is M617^
typical of a phase change in binary systems. ' A drop-off in
activity as pure BeO is approached may be due to a decrease in effective
evaporating surface through formation of BeO and to a low evaporation
coefficient for the vaporization of B_0- from Be_B„0£. Z J j z o
5.3.2 Differential Thermal Analysis Measurements
To construct a phase diagram for the BeG-B„0- system consis-
tent with the vaporization data, it was necessary to establish the
melting point of the compound Be-B-O,. The liquidus in the neighbor- 3 2 o
hood of this compound was found by differential thermal anclysls. In
this procedure, the difference in temperature between a sealed capsule
containing a mixture of BeO and B.O» in the ratio 3BeO:1.15B70 and
a second capsule containing aluminum oxide was measured during cooling.
The two capsules, placed side by side, were heated in a globar tube
furnace. Platinum-platinum 107. rhodium thermocouples inserted in wells
inside each capsule were used to measure temperature. One recorder
was used to indicate the temperature of the capsule containing the
experimental mixture, while a second recorder was used for the
22
arthur S.litUcJnr.
(t!i£oza) y 90i 23
arthur SUtttlf J«r.

temperature difference between the two capsules. Three inflections
were observed: (1) the point at which freezing started, 1488<'C; (2)
the temperature where freezing ceased, i.e. the eutec^ic temperature,
14A10C; (3) the point where the cooling differential between the two
capsules was re-established. No other inflections were observed in
Z the differential cu:/e, indicating the absence of other phases stable O H at lower temperatures. Our data yields a melting point for the
stoichioraetric compound Be BO of 149.' + 50C. Thus, all vapor pressure
O measurements were made over solid Be B90, and either BeO(c) or B O-(ii).
u- On the basis of the data a pha^e diagram of the B90 -BeO system can be
Z drawn as shown in Fig. ?. O
| § 5.3.3 Mass Spectrometric Studies tu — —c
<: Mass spectrometric samples were prepared in our laboratories.
< To obtain the mixed oxide Be E^O,, a mixture of BeO and BO powders
O
>
fe
was reacted in sealed platinum capsules at 1300CC for 100 hours.
< Four series of mass spectrometric measurements were made,
Q three over the two phase region Bo0„(i) + Be„Bo0,(c) and one over the M I J J i o O two-phase region Be,,B-0,(c) + BeO(c). In each case, the principal
M ionic species observed was B„0^ , corresponding to the neutral boron
S oxide B„0_(g). The principal beryllium-containing ionic species was +
Be(Bu.)? , corresponding to neutral beryllium metaborate Be(B0„) (g).
o M The three measurements on the sample containing excess B?0„
§ yielded results apparently unaffected by the quantity of sample material M
or the cell orifice areas. Two of these measurements were made with (3) nickel cells of the design described elsewhere, one containing
about 5 mg each of BeO and B.O and one containing 26 mg B 0„ and
10 mg BeoB„0,. Both cells had orifices of 7.8 x 10 cm . In the j z o
third experiment the crucible design of Fig, 3 was used with the -4 2
platinum cell having an orifice area of 4.8 x 10 cm . The results
of the three experiments were combined to give the data shown in Fig. 8,
24
Arthur ZP.litrfpJnr.

1800
o 1600 o
i
lü
^ 1400
UJ GL
1
UJ
1200
1000
—i 1 r
hrONE LIQUID
T——i 1 nr—"T
rwnc LIWUIU /
| / BtO*-
TWO LIQUIDS i ONE LIQUID /LIQUID I 1495 / i ^'---"^ir-J : Lr—___o- ! 1441
■I J J
BO (I) + 3BeO- B.C. (t) Z 5 2 o
J I I I I I I L
BeO +
3SeO B203 .
J L 20
B203
40 60 30 100
BeO
FIGURE 7 B20 -BeO PHASE DIAGRAM
25

I*T
FIGURE 8 PLOTS OF I+T vs 1/T FOR VAPORIZATION OF BjO-U) AND
Be(B02)2(g) FROM THE SYSTEM Be^O^O-B^U)
26
Arthur aLHittlpJnr.

+ + which gives the temperature dependence of the B.0-. and B'CBO^)- ion
intensities. The second-law heat of vaporization for B^O» found from
these experiments is 91 kcal/mole, in good agreement v/ith 93 i 3
kcal/mole obtained in ear1ier experiments.
To obtain data for the BeO-rich side of the diagram a
platinum-lined molybdenum crucible containing 68 mg of Be_B-0, and
12 mg of BeO was used. It had an orifice area of 4.8 x 10"^ cm . The
data obtained for hjth B„0„ and beryllium metaborate gas are shown in
Fig. 9.
The second-law heats indicated on Figs. 8 and 9, found by
a least squares fit of the data, correspond to the following reactions;
(a) B203(£)-Be3B206(c) (Fig. 8)
B203(i) -> B203(g) AH1 = 91 ± 0.5 kcal (6)
~ Be3B206(c) + | B203(u) -» Be(B02)2(g) AH2 = 118 ± 2 kcal (7)
(b) B^3B206(r)-BeO(c) (Fig. 9)
Be3B206(c) -> 3BeO(c/) + B203(g) ^ »112 + 1 kcal (8)
Be B206('/) -^ 2BeO(c) + Be(B02)9(g) AH4 = 137 ± 3 kcal (9)
From these least squares curves, the heats of formation of the
condensed phase mixed oxide, E',„B„0,(c), and the gaseous mixed oxide
Be(B09)9(g), can be o^ ined. The heat of reaction for:
3Be(Hc) + B203(.O -»Be3B206(c) (10)
can be obtained from the pairs of reactions (6) and (8), and (7) and
(9), and a third value for the heat of this reaction en be obtained
27
Arthur ÜÜ.^ittlcJur.

rr
10
10"
icP
Iö1
.620
B203 AH« 112 ± I
Be (602)2 AH = I37±3
.660 700 740
ic?/r 0K,
780
FIGURE 9 PLOTS OF T+T vs 1/T FOR VAPORIZATION OF B203(g) and
Be(B02)2(g) FROM THE SYSTEM Be3B206(c)-BeO(c)
28
arthur iZU.^ittlf.jinr.

from the B.CL activity data obtained in the weight loss experiments.
The three values are -21, -28.5 and -20 kcal respectively, which yield
a best estimate for reaction (5) of ^H,n " "23 f 5 kcal/mole. The
heat of formation of the gaseous metaborate from the oxides
BeO(c) + B203(g) -» Be(B02)2(g) (11)
can be obtained from the values above; on the BeO-rich side it is
25 kcal, and on the B„0 -rich side it is 19 kcal. From these we
as best estimate for reaction (11) AH,, =22+5 kcal/mole.
In order to obtain entropy values consistent with the
measured pressures and second-law heats, entropy changes for reactions
(6) through (9) were calculated from
AH
^1500 - -rir+ R lr"' (12)
where p is the vapor pressure of the gaseous species and AH is the i JüU
heat of reaction computed from the values in Table VI. The B„CL -5
pressure at 1500oK given by our vacuum balance data is 2.70 x 10 " attn.
Using this pressure, the ion intensities of B,,0 and Be(B0„)„ from
the mass spectrometric data, and Otvos and Stevenson's^ tonization
cross sections, the pressures were computed at 1500oK for reactions
(7) through (9). The data taken from platinum cells over the
BeO-Be B 0, system were normalized to the orifice area and sample-to-
ion source distance of the nickel cells.
Using the above procedure, the following pressures (in
atmospheres) and entropy changes were calculated for reactions (6)
through (9): (6) PB 0 = 2.7 x lo'5, AS6 = 39.6 eu; (7) p^^ )
= 2.5 x lO"7, AS = 50.3 eu; (8) pD „ = 9.3 x 10"6, ASQ = 53.0 eu; / D^U„ O
<9) ^e(B02)2=1-lxl()"7'^9 = 59aeU-
29
Arthur Sl.^ittle.ihtr.

TABLE VI
Thermodynamic Values, for Re-B-Q System
£H, (f) kcal/molc S* eu/mole 1500
Be0(c)a
i jv
-142.3 19.8
B„0„(/)S
Bo0-(g) / sb
BeoB-0,(c) 3^0 .b
Be(B02)2(8^
-294.7 61.3
-204 101
-745 108
-324 127
a. Reference 10 b. This work
The entropies for reactions (10) and y1!) were calculated from
the entropy changes for reactions (6) through (9) by the same methods
used to calculate ^Hin and ^H,,• For reaction (10) entropy changes
of -13, -13 and -12 eu/mole are combined to give ^-.^ = "13 ± 2 eu at
1500eK. For reaction (11) the values are 6.2 and 6.5 eu to obtain as
the best estimate AS,, =611 eu/mole. £S,, ÖS,n, and ^S., are 11 6- 10 11
combined with the JANAF entropies at 1500oK for B 0 (£) and BeO(c)
to give the remaining entropies in Table VI.
It should be noted that our value of S = 101 eu for
B90^(g) compares well with soniner, White, Linevsky and Mann's value
S.,. = 100.2 eu. The model assumed by these authors is that of a
V-shaped molecule.
5.4 Al-B-0 System
The alumina-boric oxide system has been examined by Mallard,
(21) (22) Scholze, and Baumann and Moore, all of whom measured optical
data. X-ray parumftters and composition of the mixed oxide. Mallard,
the first investigator, reported the constitution of the nixed oxide
to be A1,B.O,0. Baumann and Koore, and later Scholze, found the 6 / IZ
30
Stthur i.mttlcjnr.

compound to have the composition Al B.CL . Scholze detected, in id 4 Jj
addition, the presence of a second compound. Ai.B 0Q. He found that
both compounds are rhombic and melt incongruently, Al B.0_,, at 1440oC, 18 4 3J
and Al,Bo0n at 1050eC.
4 2 9
While the two condensed mixed oxides have been characterized
in X-ray studies, there is no data at all relating to gaseous species
or to thermodynamics of condensed or vapor phases. We have studied
this system by measuring vapor pressures by Knudsen effusion, using a
vacuum balance and mass spectrometer. The results of this research
and the derived thermal properties are reported here.
5.4.1 B 0„ Pressure as a Function of Composition
The B^CL pressure (B„0_ constituted over 99% of the vapor)
was measured as a furcticn of composition at constant temperature.
This was achieved by measuring the weight cnange with time of a Knuusen
cell containing B CL rich samples. As the B„0- was lost the sample
became richer in Al 0... Constant pressures • hould indicate two-^r.ase
regions, while a decrease in pressure should occur at the phase
boundary.
A number of measurements were made with mixtures of Al„0„ -2
and B90, at temperatures from 990 to 1285CC using orifices from 10 -4 2
tc 5 x 10 cm . With the temperature at 1054<,C and above, no change
in B„0_ activity was observed up to 75% A1„0„. From this composition
to 82% Al-0- the pressure of B„0~ dropped and the sample appeared to
stop losing weight. In none of these measurements was a second
plateau observed after the decrease in activity Subsequent measure-
ments aescribed below indicate that the activity should have dropped -2
to about 10 and the measurements for the largest orifices (because -3
of a low evaporation coefficient) should have decreased to about 10
times that over B90-. The rate of effusion at these lower pressures -8 -9
(10 to 10 atm) was too slow tc detect under our experimental
31
Arthur ZH.lUttlf.JInr.

conditions.
In a neasurement at 990eC. a decrease in activity was
observed at 67% Al O . The activity at 701 A^O was about 0.4. The
temperature was increased to 10570C where the activity rose to unity
and then decreased above 7 7% Al 0„ to 0.012 at ^7% A1„0 .
These experiments confirm the existence of the two mixed
oxides found previously, Al B.,0 (67% Al 0 ) and Al 8,0,- (82% Al 0.).
5.4.2 Pressure over AlioB/0«--Al-0, lo H jj ^ j
Pressures were measured over the pseudo-binary system
Al QB.OO-AI.O-. These experiments were carried out in the induction
furnace shown in Fig. 2. The platinum cell was suspended directly In
the work coil rather than using a target.
Two sets of measurements were made. First a charge of 69 mg
Al B.O and 18 mg Al-0^ was added to a 1/4" dia. platinum cell 18 4 33 Z J, „
with an orifice of 2.4 x 10 cm . Temperatures were measured on the
platinum surface and were later corrected for the measured emlsslvlty
of the cell (f = 0»31). A number of isothermal measurements were made.
These are given in Table VII and plotted in Fig. 10.
In the second set of raeasureiients, a hole was drilled in the
side of the cell without altering the remaining sar.^le. This hole
was designed to measure emissivity and to determine the effects of
orifice size. The combined orifice areas, corrected for the Clausing -3 2
factor were . 8 x 10 cm . This combined area is 32 times larger
than that of the original tope orifice. The results are given In
Table VII and plotted in Fig. 10.
32
«Uthur OAittlr.jlnr.

"4 icr
K)5
£ o
UJ QC D <n
id7
ORIFICE AREA =2.38X10 cnÄ
AH= 1221 21 ORIFICE AREA = 7.77 X10 cm2
.560 .580 .600 .620 .640 .660
id5 /T 0K H
FIGURE 10 B203 PRESSURES OVER A118B4033 + A1203
EFFECT OF ORIFICE SIZE
3J

TABLE VII
Bo0o Pressure over A1,„B,0^ + A1„CL t -> 18 4 33 2 3
T,0K Time, sec Weight loss,
ug
Effusion rate, -? -1 ,A6 g-cm -sec x 10
Press, atm.
x 106
Orifice
1638 2,400 50 87.5 9.56 1638 2,700 55 85.5 5.03 1690 975 60 285. 28.6 1663 1,650 60 158. (7.4 1603 6,600 65 41.3 4.47 1570 8,400 48 24.0 2.57 1540 10,800 25 9.72 1.03 1632 3,600 64 74.7 8.15 1728* 1,500 200 560. 62.9 1759* 2,250 510 952. IDS.
Orifice _b
1538 15.000 106 0.912 0.0966 1603 1,650 83 6.49 0.702 1568 3,450 161 6.02 0.644 1636 7,800 1260 20.8 2.28 1661 24,600 3710 19.5 2.16
-A 2 a. Area corrected for Clausing factor - 2.38 x 10 cm
-3 2 b. Area corrected for Clausing factor = l.,l x 10 cm
* Above melting point of Al,„8,0-^
In treating the data for orifice effects, use is made of (5)
the simplified Motzfeldt equation to establish the magnitude of the
evaporation coefficient. In this equation.
m « P
eq
aW
Bo: m (13)
P and P are the measured and equilibrium pressures, a and W are m eq a the orifice area and its Clausing facfor, B is the sample area and
34
Arthur üJl.iUnlf Jnr.

a is the evaporation coefficient.
The orifice area effects are quite large, indicating a very
small evaporation coefficient for this system. The value for 1/Ba r . e
in equation (13) is 800. Inasmuch as the effective area of the powdered
sample B cannot be established, it is only possible to state tbaf a -3 e
Is less than 4 x 10 . This is the upper limit for a calculated for
a solid, non-porous, plane sample. Even with an orifice area as small -4 2
as 2.4 x 10 cm , the measured pressures must be increased 207«.
From earlier measurements on this system, where the sample was heated
until no further weight was lost, the weight of the residue was that
of the Al 0 initially present. Mass spectrometric data show that
only B-O,, is present In the vapor. The data in Table VII were calcu-
lated on this basis.
The heat of reaction calculated by least squares for
1/2 All8B4033(c) -4 9/2 Al203(c) + B^Cg) (14)
is 113 ± 2 kcal/mole of B-O-, and the entropy change for this reaction
is 47 ± 1 eu/mole of 3-0 where a correction has been made for the
orifice effect. If the corresponding values for B_0. are AH,.-- Z J LDVU
=93+3 kcal/mole and AS = 40 ± 1 eu/mole, then the thermal IJOO
values for the reaction
2B20_(i) + 9Al203(c) -» Al18B409(c) (15)
are AH.c-n - -42 ± 5 kcal/mole of Al.oB.0„- and AS,,-- - -14 ± 3 eu/mole 1500 18 4 33 1500
of A118B4033.
This same system was studied with a mass spectrometer to
establish the vapor composition. At temperatures up to 1740oK onlv ■f
B-O- and its fragments were found. The second-law heat for reaction
35
arfhur a.Hittlf.lnr.

(14) was LM = 112 ! 1 kcal/mole B^O ,. in excellent agreement with the
gravimetric measurements.
No aluminum-containing species were detected. An estimate
of AHf 1500 (-504 kcal) and S1500 (158 eu) for Al(B02)3(g) indicate
that this species, if it exists, would have a pressure at 17AöeK,
below our sensitivity. Our data for AlB0_(g) below also Indicate
that it will not be detected.
5.4.3 Pressure over Al.B^O^-Al,„B.O«^ 4 2 9 18 4 33
Since Al.B„0q decomposes above its melting point of 1050 ± 20oC
i' was necessary to measure pressures below this temperature. The low -3
evaporation coefficient (< 4 x 10 ) found for Al.-B/O»- requires a lo 4 JJ
very small orifice to assure equilibrium conditions. These two condi-
tions made it necessary to use the mass spectrometer with its greater
sensitivity rather than the vacuum balance.
A series of measuremea*"s was first made in a 1/4" platinum -4 2
cell having an orifice area of 2.4 x 10 cm at temperacures below
the melting point. A second set of experiments was then carried out
both above and below 1050oC. These data are shown in Fig. 11. Past
experience has shown that Al,B?0Q disproportlonates to B90_ and
Al.jB.O»» above l050oC and the reverse reaction is exceedingly slow.
It is assumed that all measurements after the melting point has been
passed are on the two-phase system B„0 -Al, oB.O,,-. 23184 33
A least squares fit to the first set of data was forced to
intersect the second set at ••he melting point (1050oC). This gives
for
9/5 Al4B209(c) -- 2/5 Al^O^c) + B^Cg) (16)
36
Arthur fll.lUnlcJitr.

10
I+T
10°
.ö'
rvn—i—i—r T—i—r
AFTER MELTING AH * 92 ± 2 kcal
THROUGH MELTING POINT ÄHs96±3
O DATA BEFORE MELTING
I I I I I I .660 .680 .720 760 .800 .840
KAT^K1
FIGURE 11 B.0„ PRESSURE OVER Al.B.O.-Ai.oB.0,o / J 4 z 9 la 4 33
37
Arthur ZB.lUttlf Jnr.

äH = 95.9 ± 3.0 kcal/mole of BO and ^S = 43.0 eu/mole of B,0 .
A second set of data yields for
B203(i) -vB203(g) (17)
AH.. n = 92.7 t 1.7 kcal/mole and AS " 40.5 eu/mole where the entropy
change is taken from B„0_ pressures found by gravimetric experiments.
These data when combined with tha heat and entropy of formation of
AI.QB.O^- shown above give for
2Al203(c) + B 03(i) « A14B20 (c) (18)
AHloc- = -12 ± 2 kcal/mole of Al.B,^ and AS,oc/, = -4,5 ± 1 eu/mole 1250 4 2 9 1250
of A14B209.
No aluminum-containing vapor species were found over this
pseudo-binary system.
5.4.4 Pressures over B20, + AUG» + Al
A 1 ' _ -,j^m oxide Knudsen cell was loaded with Al_0_,
B_0_ and Al powder in ratios to give A1:B:0 of 1:1:2, and heated in
the molybdenum crucible using a liner of platinum to prevent reaction
between Al-0 and Mo. The aluminum oxide cell orifice area corrected -4 2
for the Clausing factor was 5 x 10 cm . The data are plotted in
Figs. 12 and 13 and second-law heats are given in Table VIII. A1B0
appears to be a fragment of A1B0„ .
Boric oxide enriched with 96% isct^pic B was used. This
was necessary to separate the species Al-0, A1B0- and B_0_, which all 11
have a mass of 70, when composed of the normally more abundant B
38
Arthur 2).l.ittlcJnr.

c~i—r
10
I*T
10 0
IO1
^t
AIBO"*'- AH>I26
I I
I ^
500 .540 .580 .620
lO3/?,^
.660 700
FIGURE 12 VAPOR SPECIES OVER THE Al-B-0 SYSTEM
39
3rthur Zü.Hittlcilnr.

TT—i—i—i—i—r
10
I+T
l(?
10'
= 115 ± 7 kcol I
AI802+
AH-(2814
J L .540 .580 620 .6<>0
lO3/!, »K1
700
FIGURE 13 VAPOR SPECIES OVER THE Al-B-0 SYSTEM
40
3rtbur SUUttlp.Üm,

TABLE VIII
Second-Law Heats of Vaporization of Vapor Species over the Al-B-0 System
^1500 Vapor Species kcal/mole
Al 115 ± 5
B202 U5 ± 7
BO 112 ± ^t
A120 139 ± 7
AlBO- 128 ± 4
B203 146 ± 5
Due to uncertainties about the condensed phases in this
system, it is not possible to write the solid vapor reactions which
were measured- However, the gas reaction may be used to determine
the heat of formation of AlbCL(g). For the reaction,
1^ Al20(g) + 1/2 B203(g) = AlB02(g) (19)
variation in the equilibrium constant with temperature is used to
determine the heat of reaction. A least squares fit gives a second-law
heat -18.2 ±3.6 kcal/mole of A1B0 for reaction (19). From the
JANAF Tables AH (1500) Is -42.6 kcal/mole of Al 0(g) and AH (1500) is
-200.8 kcal/mole of B„0 (g). Combining these values we calculate
AH (1500) = -140 ± 4 kcal/mole of AlBO .
The heats in Table VI1T may be used to eliminate as condensed
phasffiAl(jO, B„0^(i), Al P 0 and Al B,0„_. The heat of vaporization
Al(£) to Al(g) is 73 kcal(10) while BJD (g) should have a heat of 92,
96 and 1U kcal from Bo0n(i), Al B,0_ and Al. .8,0--. Our ratios of I i H £, y lo <* .3 3
^j07(g) to 3„0^(g) are higher than those found by Inghram, Porter and (23)
Chupka, and the heats of vaporization measured here are also higher,
41
3rtbur a.lUttlpJnr.

115 and 146 kcal compared to Inghr^.n, Porter and Chupka's values of
94 ! 8 and 92 + 8. Our ratios of Al(g) to Alo0(g) at 1500oK are
(24> nearly identical with those of Porter, Schissel and Inghr^m. These
autnors measured pressures over Al + Al 0 ■ In the earlier work of (2S)
Brewer and Searcy on Al + AKO.. there was less precision in the
ratios of the gases, but the ratios are within a factor of 4 of
Porter, Schissel and Ingnram. The aluminum pressures measured by
each of these authors are considerably less than that over pure Al,
indicating the existence of aluminum suboxides. Hoch's high temperature
X-ray data indicate that Al 0 is the suboxide of aluminum which
exists in the temperature range of the present work.
A calculation of the heat of reaction for
4/3 Al + 1/3 A1203 = Al90(g) (20)
with values from the JANAF Tables yields a heat of 92 kcal which
may be compared to our measured value of 139 kcal. Our higher heat
would indicate that some other reaction is involved.
5.5 Rhenium
Rhenium is the only refractory metal which has a sufficiently
low pressure and low reactivity with very stable oxides to be suitable
for their study. Only two other metals have a lower vapor pressure,
W and Ta. Both of these metals have the disauvantage of reacting with
the two oxides under study, Al 0„ and BeO, forming cither mixed
tungsten oxides or TaO(g). Tantalum may ilso dissolve oxygen as well
as forming mixed tantalum oxides. Rhenium apparently will not reduce (2 /)
either Al 0„ or BeO. Extrapolat:on of Coughlin,sv tables for
Re 07(g) and ReO- to the temperature (2500oK) where the Al-O or BeO
pressures may be measured indicate^ that the partial oxygen pressure
is too low for reaction. A fourth possible cell for the sstudy of
these oxides, iridium, is more stable but has a much higher vapor
pressure and lower melting point.
42
Arthur S.lUttlfJtu.

The rheni'un cell was fabricated by spark gap machining a
0.437 inch diameter rod supplied by the Rembar Company. A removable
lid containing an orifice was machined to fit the cylindrical base.
A hohlraum was drilled in •:he side for temperature measurements.
The 24-gram cell was d* ^assed^ losing 55 mg. Meas-ir^ments
were made by weighing a glass target at a number of temperatures with
the vacuum balance. Comparison of the target gain to the sample loss
established the fraction of vapor condensed on the target. From the
individual target weight tains, the above fraction, the sample
dimension, sample temperature and time at temperature, the pressure of
rhenium was calculated. Pressures in the vacuum system were lese than
3 ■" 10 torr with the sample at tempersture. Temperatures, measured
with an optical pyrometer, were corrected for window adsorption.
The data are summarized in Ta' '.c IX. Heats of vaporization
in Table X, were calculated using Stull and Sinke's free energy func-
tions for the solid and gas. The average heat at 298CK is 184.5 ±1.5
kcal/g-aLom wulch agrees very well with the study on rhenium by
Sherwood et al. ' These authors found AH* ft - 185.7 x 1.0 kcal/g-atom.
Sherwood measured the evaporation rate of a rhenium filament using an
optical pyrometer and the emissivity of rhenium to determine the
temperature.
TABLE IX
Vapor pressure of Rhenium
,„,■*, Evap. rate Pressure Time „ Target gain Sample loss _-r .17 o
T t0K soc x 10 uR m^ R-cm -sec xlO atm. x 10
z 28 4.53 6.78 5.86 8,59 7.47 U.9 10.3 12.6 11.1 13 2 11.7 19.0 16.8 34.0 31.1
-3 ♦Fraction of total evaporated metal condensed on target Is 1.25 x 10
♦♦Sample arsa - 8.^2 cm2
43 3nhur 2S.Vittlr.lnr
2694 9.00 50 40.0 2731 4.20 30 24.0 27J8 4.20 38 J0.4 2787 4.80 60 48.0 2821 6.00 80 64.0 2847 3.60 50 40.0 2877 3.00 60 48.0 2905 3.00 no 88.0
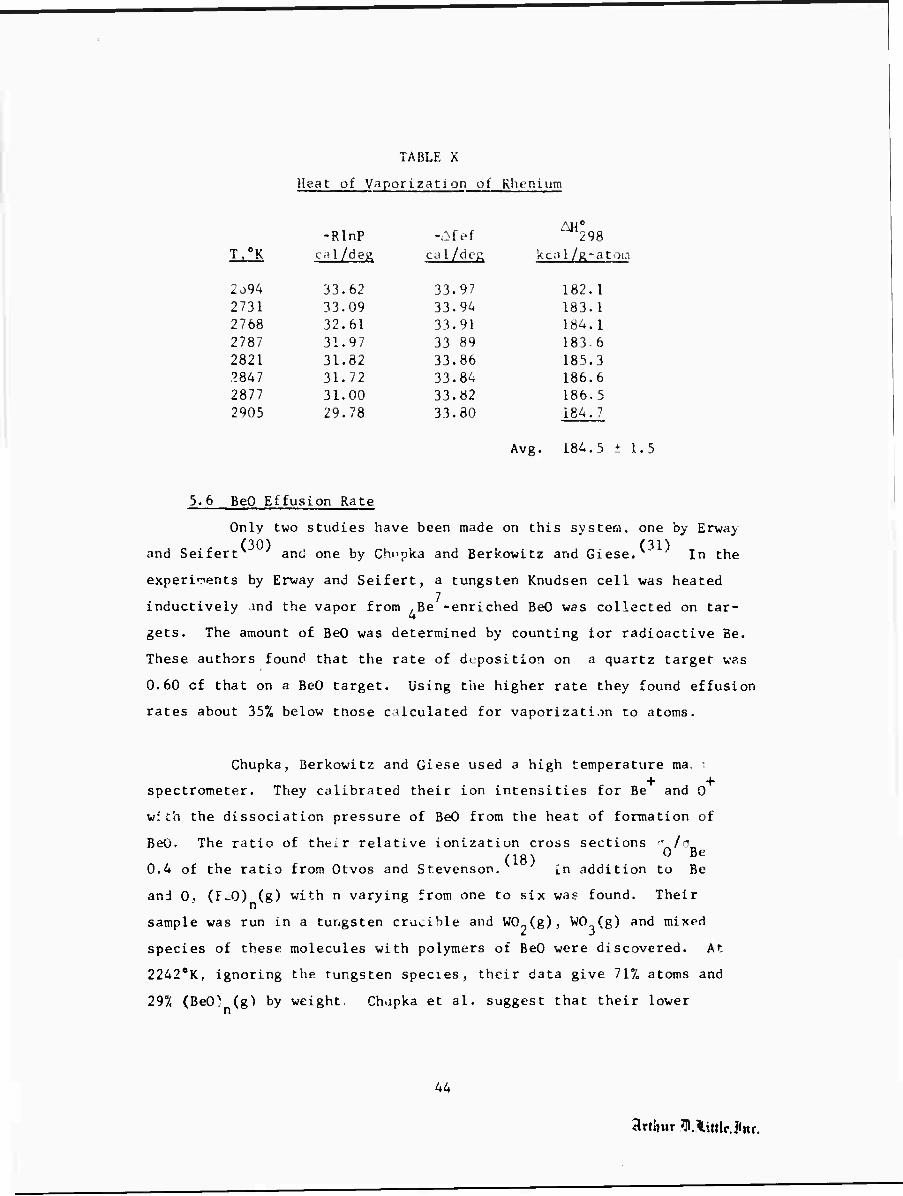
TABLE X
Heat of Vaporization of Rhenium
-Afef ^298 Tj/K cal/deg cal/dcK kcal/fi-atom
2o94 33.62 33.97 182.1 2731 33.09 33.94 183.1
-R InP cal /deS
33 62 33 09 32 61 31 97 31 82 31 72 31 00 29 78
2768 32.61 33.91 184.1 2787 31.97 33 89 183.6 2821 31.82 33.86 185.3 2847 31.72 33.84 186.6 2877 31.00 33.82 186.5 2905 29.78 33.80 184.7
Avg. 184.5 ±1.5
5.6 BeO Effusion Rate
Only two studies have been made on this system, one by Erwa>
and Seifert^ and one by Chnpka and Berkovitz and Giese. In the
experiments by Ervay and Seifert, a tungsten Knudsen cell was heated
inductively and the vapor from .Be -enriched BeO was collected on tar-
gets. The amount of BeO was determined by counting tor radioactive Be.
These authors found that the rate of di position on a quartz target v?-s
0.60 cf that on a BeO target. Using the higher rate they found effusion
rates about 35% below those calculated for vaporization to atoms.
Chupka, Berkowitz and Giese used a high temperature ma, '.
spectrometer. They calibrated their ion intensities for Be and 0
with the dissociation pressure of BeO from the heat of formation of
BeO. The ratio of their relative ionization cross sections rr^/cL. (18) 0
0.4 of the ratio from Otvos and Stevenson. [n addition to Be
and 0, (F_0) (g) with n varying from one to six was found. Their
sample was run in a tungsten crucible and W0„(g), WO (g) and mixed
species of these molecules with polymers of BeO were discovered. At
22420K, ignoring the tungsten species, their data give 717„ atoms and
29% (BeO) (g) by weight. Chupka et al. suggest that their lower
44
artlnir lAittleJttr.

relative ionization cross section ratios night be in error ^nd that
(BeO) concentration based on Otvos and Stevenson ratios could be as n
much as 2-1/2 times higher. Chupka »peculates that Erway's data may
be in erro'' berause of the latter's assumption that the vapor from BeO
will conde ise -.ith 1007o efficiency on a BeO target.
The rhenium Knudsen cell just described was also utilized
to measure the BeO effusion rate. The data are given in Table XI and
plotted in Fig. 1^. The total rate is calculated from the JANAF Tables
as is the rate to be expected if effusion were to occur only to
the constituent atoms. Weight balance calculations indicate that less
than 1% of the vapor contains rhenium species.
TABLE XI
Effusion Rate of BeO
Target gain Weight 1( through
3SS
:op Time _ Eff usion rate* 2-16
T.0K UK orifice,
3.35a _S£ sec x 10
26.4
g-cm -sec x 10
2309 111 11. 1 2358 170 5.15 21.0 21.4
2388 90 3.61b 8.4 37.7 2414 118 4.73 8.4 49.4 2232 30 1.20 25.2 4.18 2439 150 6.02 9.6 55.1
2516 226 9.40C 4.2 197 2464 122 5.08 4.3 92,9 24S0 56 2.33 1.8 114
*0ri; ire area = 1 14 -2 2
x 10 cm
The fractions striking the targets are: a, 3.21 x 10'2; b. 2.49 x 10"s; c, 2.40 x 10"2.
The JANAF data are based on the mass spectrometric data of (31)
Chupka, Berkowitz, and Giese. Our data are in excellent agreement
with the total effusion rate of these auLhors. We find no reason to
expect the (BeO) conconcration to be significantly higher. Like
Erway and Seifert, we found the vapor from BeO to have a condensation
45
Arthur O.^tttlfJur.

T—i—| r "!—i—r
JAWAF
IÖ4
To
i o
I
UJ
D U. LL UJ
Ö5
CALCULATED \ EVAPORATION RATE v \
h TO ATOr^S \ \ O
\
390 J 1—J 1 1 I I J I i i i
400 4.10 420
I04/T - «K1
430 440 450
FIGURE 14 EFFUSION RATE OF BeO
46
Arthur S.littlf Jnr,

coefficient of 0.57 on our glass targets. In experiments on
BeO 4- Al 0- the condensation coefficient was found to decrease from
1.0 for Al 03 to 0.6 for 37 l Al 0--637O BeO, remaining fairly constant
up to 1007, BeO. There is no data on mixed condensation of tungsten
and beryllium oxides. It is possible that such mixtures have low
condensation coefficients. However, our experience with BeO vapor
condensing on glass agrees with Erway's BeO condensatior. on quartz
and would seem to eliminate this as the explanation for the latter's
low pressures.
5.7 A1_0_ Effusion Rat1 and Evaporation Coefficient
Drowart et al. have established with a mass spectro-
meter that about 807=, of Al 0 vaproizes to the atoms, with the (25)
remainder vaporizing to Al?0, AIO, and Al-0 . Biewer and Searcy
studied the vapor ever Al 0. + Al to give the oxide species. Brewer's
data indicate that. AIO and 0 should constitute the bulk of the vapor
over Al 0-.
Gravimetric experiments have not established the relative
amounts of the various species, but they may be used to determine the
total effusion rate. This can be compared to the predicted rates.
Lrowart et al. used AlX_ liners in tungsten cells.
Brewer and Searcy used tungscen and molybdenum cells without liners
for Al00- vaporization. In the present study rhenium cells were used
without liners. As discussed above, the rhenium should not reduce
Al-0-. No data were found on aluminum solubility in rhenium.
To the cell described in Section 5.5 was added 20 mg of
pure Al„0_ powder. This was vaporized at several temperatures until
there was no further weight gain of the glass target. The target and
cell were weighed with an analytical microbalance at the completion
of the measurement. The fraction of vapor effusing from the top
Arthur fll.kittleJur.

orifice and condensing on the target was established from these weight
changes, and the two orifices (top and side) were corrected for the
Clausing factor.
The total weight loss of the cell was 24 mg, or 4 mg in
excess ri the Al CL added to the cell. The additional weight loss
could be accounted for from the rhenium vapor pressures described in
Section 5.5. Thus, within the precision of these measurements, Re does
not react with Al 0 . Table XII give,c ne data and Fig. 15 shows the
measured Al CL effusion rates compared to the rates computed from the (10)
JANAF Tables. There is excellent agreement with the JANAF tables,
indicating that the bulk of the oxide vaporizes to atoms of aluminum
and oxygen.
TABLE XII
Effusion Rate of Al 0„
Effusion rate
"2 -1 in6 g-cm -sec x 10
29.0 29.7 52.2 7.26
13.6 9.46 12.9
134.
-2 a. Fraction striking target = 2.95 x 10
-2 2 b. Crifice area corrected for Clausing factor ■ 1.14 x 10 cm
(33) A recent paper by Burns, Jason, and Inghram reports a
discontinuity in the evaporation rate of A1_0, at its melfng point.
These authors found '•.bss. a polycrystalline alumina rod evaporated about
one-third as fast j^-it below the melting point as it did intnediately
Weight loss Weight gain through of target top orifice
T,0K Time,sec
10,200
uK mß
2411 100 3.39 2411 4,300 48 1.63 2464 6.600 116 3.93 2320 18,000 44 1.49 2361 19,200 88 2.98 2430 27,000 86 2.91 2389 24,000 104 3.53 2542 4,200 190 7.58
48
«Irthur S.üttlfjitr.

100
50
to 9!
u I
10
lü 5.0
Id 1.0
0.5
JANAF
O I A H D ar
DECREASING TEMPERATURE RISING TEMPERATURE DECREASING TEMPERATURE KNUDSEN
4.00 4.10 4.20 4.30 440 450 4.60
kf/T «K1
FIGURE 15 EFFUSION AND EVAPORATION OF Al 0
49
?.rrliur ZH.ltittlr.jInr.
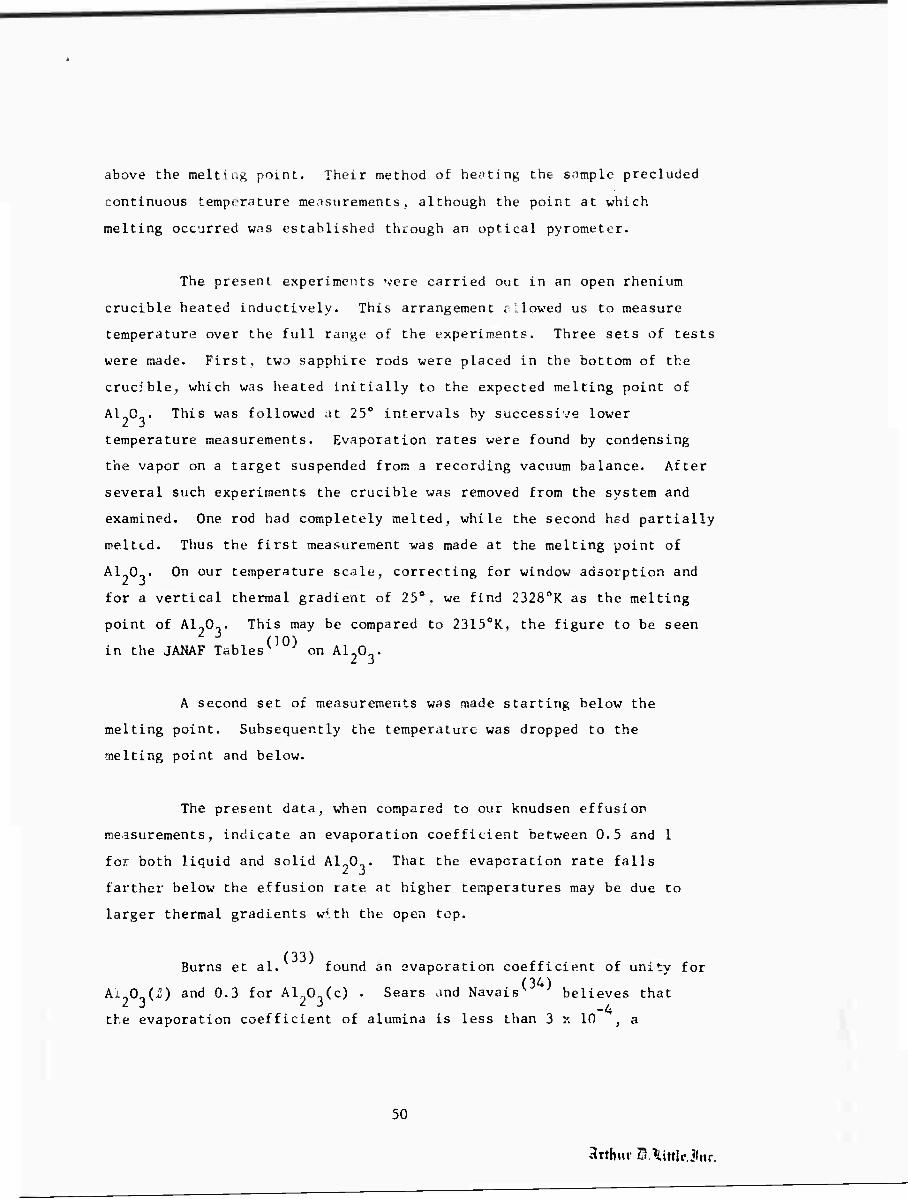
above the melting point. Their method of heating the sample precluded
continuous temperature measurements, although the point at which
melting occurred was established through an optical pyrometer.
The present experiments vere carried out in an open rhenium
crucible heated inductively. This arrangement sllowed us to measure
temperature over the full range of the experiments. Three sets of tests
were made. First, two sapphire rods were placed in the bottom of the
crucible, which was heated initially to the expected melting point of
Al CL. This was followed at 25° intervals by successive lower
temperature measurements. Evaporation rates were found by condensing
the vapor on a target suspended from a recording vacuum balance. After
several such experiments the crucible was removed from the system and
examined. One rod had completely melted, while the second hsd partially
melted. Thus the first measurement was made at the melting point of
Al CL. On our temperature scale, correcting for window adsorption and
for a vertical thermal gradient of 25°. we find 23280K as the melting
point of Al-0„. This may be compared to 23150K, the figure to be seen
in the JANAF Tables^10^ on Al 0 .
A second set of measurements was made starting below the
melting point. Subsequently the temperature was dropped to the
melting point and below.
The present data, when compared to our knudsen effusion
measurements, indicate an evaporation coefficient between 0.5 and 1
for both liquid and solid Al-0„. That the evaporation rate falls 2 J
farther below the effusion rate at higher temperatures may be due to
larger thermal gradients with the open top.
(33) Burns et al. found an evaporation coefficient of unity for
(34) Ai 0 (Ü) and 0.3 for Al 0 (c) . Sears and Navaisv believes that
3 , -4 the evaporation coefficient of alumina is less than 3 x 10 , a
30
Arthur ÜLinlcidif.

belief based on the fact that he did not find a deposit of evaporated
Alo0„ or Al after heating his sample in vacuum. He estimates that
20 A of A1„0_ or 10 A of Al wou: be visible. Although ^e have had
difficulty seeing the transparent Al-0^ on our glass cover slides with
a deposit of 50 ug/cm (about 2CJ0 A), it is possible to see some
contrast with an uncoated cover slide. It is interesting to no^e that
987P (i.e., within the precision of our measurements) of the A1„0_
calculated ati striking the target, did in fact condense.
5.8 Al-Be-0
The effusion rates of three mixtures of A1?0^ and BeO —
66% BeO-34% Al„0o, 75% 860-25'/; A1„0_ and 26% BeO-74% Al-0„ - were ^3 2 3 23 measured at 24150K until each sample had been completely evaporated.
All three mixtures are single phase liquids at 24150K according to
the p>ase diagram constructed from Lang, Fillmore and Maxwell, (37)
and from Galakhov. The total effusion rate of each mixture s
plotted versus time in Fig. 16, along with the calculated effusion
rate of BeO(c) and Al 0 (i).
It is evident that the beryllium rich samples lose BeO
initially. The 26% BeO-74% Al 0„ sample vaporizes congruently at
this temperature. From the total effusion rate and the fraction of
the pure compounds vaporizing to the elements, we may calculate the
Be, Al and 0 pressures over BeO. 3A1203(£). At 2415t'K, 60% BeO and
72?o Al90_ vaporizes to their elements; the remaining percents vaporize
as molecules.
Using the total effusion rate for this solution, 2.57 x 10
g/cm /sec, the following pressures are calculated: P ■ 2.44 x 10 -A -1
atm, P . = 1.93 x 10 atm and P,, - 1.55 x 10 '" atm. These pressures ' Al Be v
are for the reaction
Be0.3Al,0.(i) -* Be(g) + 6Al(g) + 10 0(g) (21)
51
Arthur Sl.XittleJttr.

0 Lr:
iH -T CM
H <
Z o t-l
£3 M o C/2
i s ~
o
w >
3 i
OS
a
0»f-_ttl3 -B .09 X 3iVÖ N0!Sndd3 52
^rtintr SIAittlf Jnr.

assuming AC - 0 for BeO(i-) + 3A1 0 (/) -4 BeO. 3AI 0 (i), Mef^10^ for
reaction (21) Is -56S.1 cal/deg at 24150K. This gives aH0298 » 2446
kcal. The AH*298 for BeO(i) is -.29.6 kcal^l0') and for Al 0 (i) Is
-373.4 kcal. Combining these with the heat of formation of Al(g) '/8.0
kcal/l0) 0(g) 59.56 kcal and Be(g) 78.6 kcal/10^ we calculate for
BeO(i) + 3Al00-(i) = Be0.3Al n„(i) (22)
aH0298 = -54 t 15 kcal or AH'298 =-1304 •: 15 kcal for BeO. 3Aln0„(i), and r f 2 3*
AHJ298 - -1397 ± 15 kcal for Be0.3Al 0 (c). It is assumed that the heat
of fusion of the 1:3 compound is the sum of the heats of fusion of the
indivldval oxides. The value found here does not agree wich Young
who finds -0.8 kcal for the formation of Be0.3Al 0 from the individual
oxides. His value is based on the reaction of Be0.3Al-0„ with water to
form Be(OH) (g) + 3A1203.
Our measurements indicate that samples with more BeO will not
vaporize congruently. Efimenko's ' mass spectrometric data on
chrysoberyl (BeO.Al-0„) bears this out. The vapor over the 1:1
compound was very rich in beryllium (about 6 times that for congruent
vaporization)and it slowly Increased in aluminum content with time.
From Efimenko's pressures for Al(g), Be(g), 0(g) and AlBeO(g) at
2417°, we calculate that the AlBeO pressure over Be0.3Al 07(ü) should -9
be 2.4 x 10 atm. With this pressure and those calculated above for
the elements and by using a fiee energy function of -72.2 ral/deg for
AlBeO(g) we find that for
Be0.3Al203(£) -* AlBeO(g) + 5Al(g) + 9 O^), (23)
AH0298 = 2205 ± 13 kcal. The free energy function for AlBeO(g) is r (10)
the average for that of Al 0 and Be 0. From our heat of formation
for liquid Be0.3AK0^ and from JANAF values for the elements, &H°298 2 3 f
= -25 ± 13 kcal/mole AlBeO(g). The estimated uncertainty is based on
our mean deviation for vaporizatioi. of Al-0„. Efimenko's data based
53
Arthur 21.tittleJur.

gas-phase reactions yield -17.5 ± 3.3 and -9.8 t 6.2 kcal for the- heat
of formation of AlBeO(g). Since the heats of formation of Be00(g) and
Al„0(g) are -15.0 and -31.4 kcal/mole it seems reasonable to expect
that AlBeO(g) should fall between these values.
5.9 A1F (g) and AlF(g)
The pressure over A1F and over AlF_ + Al were measured in a
1/4" dia. boron nitride cell. Thermodynamic calculations indicate that
AlF- should not react with BN. Although A1N is more stable than BN
the formation of AlF(g) is much more liable to occur. BN should not
react with BF_. These studies were initial
for the investigation of the Al-B-F system.
react with BF_. These studies were initiated as preliminary research
The BN cell was degassed at 800oC (about 100° higher than
the experiments. Of 96 mg of A1F„, about 18 mg was lost before
achieving a constant effusion rate. The high early measurements were
rejected. The results of the later A1F_ pressure measuremerc are
given in Table XIII and third-law heats of vaporization pre calculated
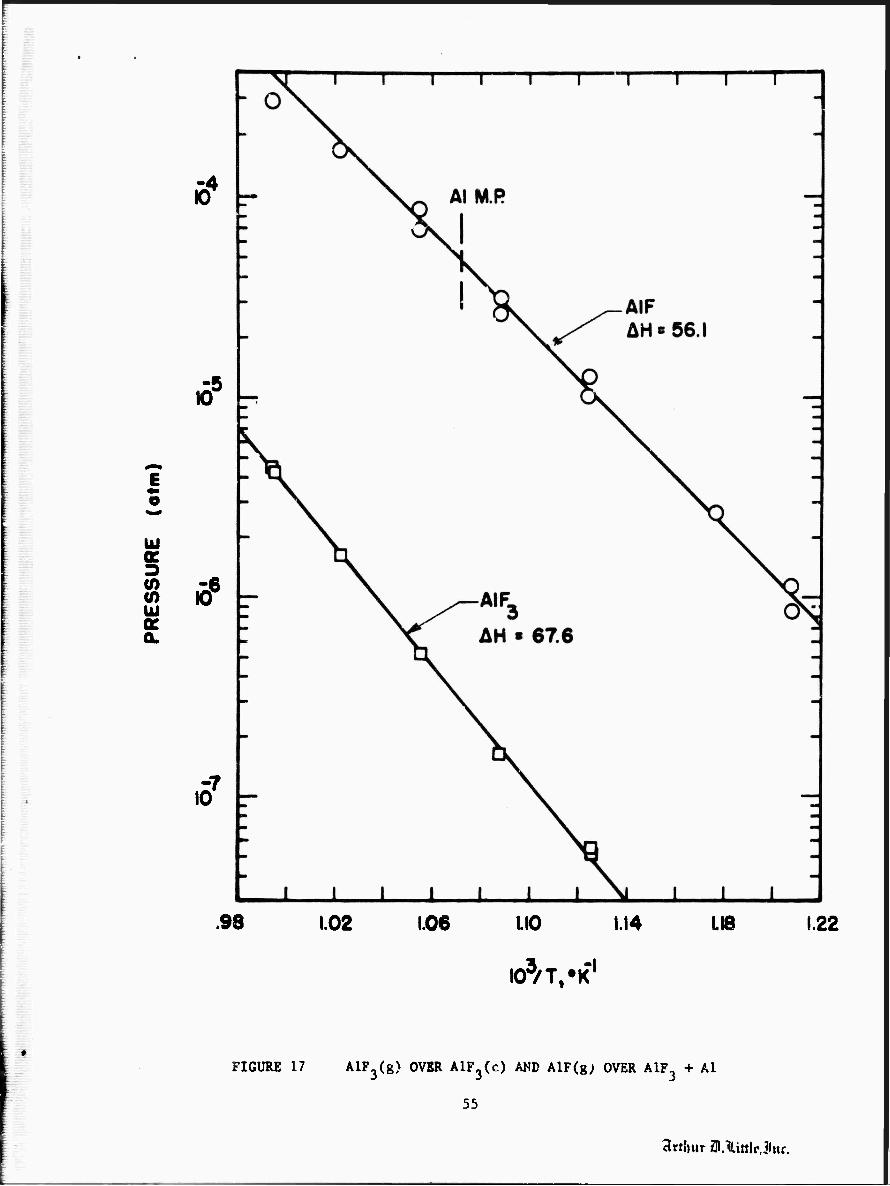
in Table XIV. The data are plotted in Fig. 17. A Ifast squares fit
to the data give a second-law heat AH-_Q ■ 71.1 kcal, in gooa agree-
ment with the JANAF value of 71.5 ± 1.5. CKir third-l,-.w value is
72.7 ±0.1 kcal..
TABLE XIII
A1F Pressure over A1F.( c)
Time -4 Weight loss a
Press. R
acm. x 10 T.0K sec x 10 R x 104
994 2.16 26. 449. 1022 3.78 16.6 162. 994 1.08 12.8 445. 1125 12.42 1.86 5.24 1125 7.02 1.04 5.20 1088 2.16 0.98 16.2 1055 1.08 1.52 51.2
-3 2 a. Orifice area corrected for Clausing factor ■ 1.66 x 10 ' cm*"
54
Sfhur ZJAinlfJnr.
I
Ui
3
V) Mi OH OL
Ö4
lö5
Ä6
.57
.98 1.02 1.06 LIO
lO^T/K1
1.14 LI8 1.22
FIGURE 17 AlF3(g) OVER AlF3(c) AND AlF(g; OVER AlF3 + Al
55
Arthur SAittlpJnr.

TABLE XIV
Third-law Heat of Vaporization of A1F,
-RlnP , A1F3 -Afefb ^'293
T,0K cal/deß cal/dea kcal/mole
994 24.47 47.84 72.74 1022 26.50 47.96 72.82 994 24.49 47.84 72.76 1125 33.32 48.30 72.56 1125 33.33 48.30 72.57 1088 31.07 48.18 72.83 1055 28.79 48.07 72.86
Avg. 7? 7 ±0.1
b. From JANAF Tables
Using the remaining AlF. sample with Al powder, A1F pressures
were measured. These results are given in Tables XV and XVI, and
Figure 17. A least squares fit to the data below the melting point
of aluminum (8320K) gives a second-law of AIU-p ■ 58.3 kcal which may
be compared to our third-law value AH0QO ■ 56.0 ±0.2 kcal for 290
1/3 A1F3 + 2/3 Al - AlF(g) (24)
From the later value and JANAF data we calculate AH*298 of AlF(g)
= -63.3 ±0.7 kcal/mole.
»
56
Srthur a.lUttlrJnr.

TABLE XV
AlF Pressures over Al + A1F.
T,0K Time _2
sec x 10 Weight loss
K x iO4
a Pressure7
atm. x 10
1006 12 55.0 2910. 889 24 5.10 127. 828 54 0.800 8.52 919 30 15.8 320. 948 12 17.0 874. 828 486 9.80 11.3 850 108 5.00 27.0 889 48 8.10 101. 919 24 10.3 260. 9^8 12 13.4 690. 978 6 16.0 1670.
a. Orifice area corrected for Clausing factor -3 2 ■ 1.66 x 10 cm
TABLE XVI
Third-law Heat of Vaporization of AlF(g) from Al + AlF-(c)
'
-RlnPAlF -Afefb AH? (298) T,0K cal/deÄ cal/deR kcal/mole of A1F(K)
1006 16.18 38.18° 56.09° 889 22.40 40.23 55.68 828 27.78 40.40 56.45 919 20.57 40.14 55.79 948 18.57 38.35"' 55.66C
828 27.21 40.40 55.98 850 25.84 40.34 55.95 889 22.86 40.23 56.09 919 20.98 40.14 56.17 948 19.04 38.35C 56.11C
978 17.28 38.26 56.02C
Avg. 56.0 ± 0.2
b. From JANAF Tables
c. Above melting point of Al - corrected for ^H, of Al
d. This value and JANAF data yield^Ht298- -63.3 ±0.7 kcal/mole AlF(g).
57
artbur ZD.littlcJnr.

5.10 Preliminai.y Results on the Al-B-F System
The BN cell containing A1F, + Al was heated in static
pressures of BF- (about 10 torr) until the sample stopped losing
weight; From the volume of the system and the weight loss, the pressure
of A1EF, was calculated. We ha-'e assumed that the free energy
functions for AlBF, are essentially the . ame as those given in JANAF
for A ^F/.« Two preliminary measurements are given below for
1/3 AlF3(c) + 2/3 Al(c) + BF3(g) = AlBF4(g) (25)
,0K
8.70
-RlnPAlBF4
14.52
-Afef cal/deg
3.90
AH0 298*
kcal
AH° 298**
kcal
760 7.4 -396.8
650
IX » » *. *
8.93
(25)
13.11 4.10 5.4
hi nn nf A1 UP
-394.8
More work is necessary to establish that no other reactions
occvir. Further experiments are also required to determine the effects
of pressure and temperature. The values found here appear to be
reasonable when compared to AlLiF,. For example heats are calculated
for
AlLiF4(g) -»LiF(g) + AlF3(g) £H298 - 72 kcal
and
AlBF4(g) -♦ BF(g) + A1F3 ^H298 - 82 kcal
The latter reaction should require more heat since B has
extra bonding electrons in contrast to Li which does not.
58
arthur ZD.littlfJnr.

REFERENCES
1. C N. Cochran, Rev. Sei. Instr. 29, 1135 (1958).
2. R. Speiser, S. Naiditch and H. L. Johnston, J. Am. Chem. Soc. 21> 2578 (1950).
3. A. Büchler and J. B. Berkowitz-Mattuck, J. Chtm. Phys. 39^, 286 (1963).
4. D. L. Hildenbrand, W. F. Hall and N. D. Potter, J. Chem. Phys. 39, 296 (1963).
5. K. Motzfeldt, J. Phys. Chem. 59, 139 (1955).
6. G. M. Rosenblatt, J. Electrochem. Soc. UO, 563 (1963).
7. J. P. Hirth and G. M. Pound, "Condensation and Evaporation," Now York, MacMillan, 1963, p. 80.
8. G. Wyllie, Proc. Roy. Soc. (London) 197A, 383 (1949).
9. E. M. Mortensen and H. Eyring, J. Phys. Chem. 64, 846 (1960).
10. JANAF Thermochemical Tables, Thermal Laboratory, Dow Chemical Company, Midland, Michigan.
11. L. Brewer and D. Mastick, J. Chem. Pnys., 1J3, 834 (1951).
12. R. F. Porter, W. A. Chupka and M. G. Inghram, J. Chem. Phys. 23. 216 (1955).
13. J. F. Kincaid and H. Eyring, J. Chem. Phys. 4, 620 (1938).
14. H. Menzel and S. Slivinski, Z. Anorg. Allgem. Chem. 249, 357 (1942); H. Menzel and J. Adams, Glastech. Ber. 22^, 237 (1949).
15. L. Ya. Mazelev, Isvest. Akad. Nauk Beloruss, S.S.R. No. 4, 105 (1953).
16. P. E. Blackburn, J. Phys. Chem. 62, 897 (1958).
17. 0. Kubachewski and E. LL. Evans, Metal Physics and Physical Metallurgy, Pergamon Press, New York, 1958, p. 66.
18. J. W. Otvos and D. P. Stevenson, J. Am. Chem. Soc. 78, 546 (1956).
19. A. Sommer, P. White, M. J. Linevsky, and D. E. Mann, J. Chem. Phys. 38, 87 (1963).
59
3rthur 5.*ittlrJnr.

20. E. Mallard, Compt. Rend. K)5, 1260 (1887).
21. H. Scholze, Z. Anorg. Allgem. Chem. 284, 272 (1956).
22. H. N. Baumann, Jr. and C. H. Moore, Jr., J. Am. Ceramic Soc. 25 391 (1942). —'
23. M. G. Inghram, R. F. Porter and W. A. Chupka, J. chem. Phys. 25, 498 (1956). y '
24. R. F. Porter, P. Schissel and M. G. Inghram, J. Chen.- Phys 23 339 (1955). ' -Jd,
25. L. Brewer and A. W. Searcy, J. Am. Chem. Soc. ?3, 5308 (1951).
26. M. Hoch and H. L. Johnston, J. Am. Chem. Soc. 76, 2560 (1954).
27. J. P. Coughlin, "Contributions to the Data on Theoretical Metallurgy, XII. Heats and Free Energies of Formation of Inorganic Oxides, Bulletin 542, Bureau of Mines, 1954.
28. D. R. Stull and G. C Sinke, Thermodynamic Properties of the Elements. American Chemical Soc, Washington, D. C , 1956.
29. E. M. Sherwood, D. M. Rosenbaum, J. M. Blocher, Jr., and I. E. Campbell, J. Electrochem. Soc. 102, 650 (1955).
30. N. D. Erway and R. L. Seifert, J. Electrochem. Soc. 98, 83 (1951).
31. W. A. Chupka, J. Berkowitz and C. F. Giese, J. Chem. Phys. 30. 827 (1959). —'
32. J. Drowart, G. DeMaria, R. P. Burns, and M. G. Inghram, J. Chem. Phys. 32, 1366 (1960).
33. R. P. Burns, A. J. Jason, and M. G. Inghram, J. Chem, Phys. 40. 2739 (1964). —'
34. G. W. Sears and L. Navais, J. Chem. Phys. 30, 318 (1959).
35. E. M. Levin, C. R. Robbins and H. F. McMurdie, Phase Diagrams for Ceramists. Ed- M. K. Reser, The American Ceramic Society, Columbus, Ohio, ' 64, p. 99.
36. S. M. Lang, C. L. Fillmore and L. H. Maxwell, J. Research Natl. Bur. Standards, 48 (4), 301 (1952); RP 2316.
37. F. Ya. Galakhov, Izvest. Akad. Nauk S.S.S.R., Otdel Khlm. Nauk 1035 (1957).
60
arthur ZD.Xittlf Jnr.

38. W. A. Young, J. Phys Chem. 64, 1003 (1960).
39. J. Efimenko, Na.l. Bur. of Standards Report 8626, p. 25,
January 1965.
61
Arthur SAittlrJnr.