Embed Size (px)
Citation preview

Reactors, Kinetics and Catalvsis
Dynamic Effects of Vaporization with Exothermic Reaction in a Porous Catalytic Pellet
Paul C. Watson and Michael P. Harold Dept. of Chemical Engineering, University of Massachusetts, Amherst, MA 01003
A single catalytic pellet reactor was used to investigate dynamic multiphase re- action-transport interactions. The experiments permitted the simultaneous meas- urement of pellet weight (liquid holdup) and center temperature under conditions which mimic the unsteady, local events within a fixed-bed multiphase reactor. In the liquid-prefilled pellet experiments, the pellet ( Pd/A1203-clay) was prefilled with liquid reactant (AMS or cyclohexene) and then exposed to a flowing gas containing hydrogen. In the gas-prefilled pellet experiments, the pellet was preflled with hy- drogen and then contacted by a liquid reactant pulse of prescribed flow rate and duration. The liquid-prefilled experiments revealed an acceleration in the drying rate due to the exothermic reaction. The pore emptying process was accompanied by a significant increase in the pellet temperature. The considerably slower dynamics observed for the AMS system compared to the cyclohexene system are attributed both to differences in liquid-phase volatility and to self-oligimerization of the AMS. In the gas-prefilled experiments, a pore filling with reaction process precedes the pore emptying step. The degree of catalyst overheating is highest for a liquid pulse of intermediate duration. A phenomenological mechanism of drying with exothermic reaction built on the well-accepted theory of drying of granular media is offered to explain the trends in the data. Implications of the findings with regards to hot spot formation in the catalytic reactor are discussed.
Introduction Catalytic exothermic reactions between gaseous and liquid
components are a particularly complex class of reactions fre- quently encountered on the industrial scale. A single, bimo- lecular reaction has the general form:
whereg (I) denotes a gas-phase (liquid phase) reaction; without any loss in generality, A represents the more volatile of the two reactants. For example, A could represent hydrogen or oxygen, D a hydrocarbon, and P the corresponding hydro- genated or oxygenated product. An important distinguishing, yet complicating, feature of these multiphase reactions is the
Correspondence concerning this article should be addressed to M. P. Harold.
interactions among phase transition, multiphase transport, and the catalytic chemical reaction. Consider, for example, reaction in a porous catalyst within a multiphase fixed-bed reactor. The combination of a sufficiently high heat of reaction and vol- atilities of reactant D and product P can lead to vaporization and recondensation phenomena. Several possible states of the catalytic pellet can result from the thermokinetic-induced va- porization of liquid both flowing over the external catalyst surface and filling the pore structure (Harold, 1993). In both cases, a gas-phase catalytic reaction occurs on formerly liquid- covered surfaces. The more rapid mass transport and less ef- ficient heat removal associated with the gaseous system can lead to significant increases in the overall rate of reaction and the catalyst temperature. Such rate and temperature increases can be detrimental in industrial reactors. Localized hot spots can damage the catalyst, initiate undesired side reactions, and lead to reactor runaways (Van Welsenaere and Froment, 1970; Jaffe, 1976; Eigenberger and Wegerle, 1982; among others).
AIChE Journal June 1993 Vol. 39, No. 6 989

Table 1. Examples of Pronounced Vaporization Phenomena and Hot-Spot Formation in Multiphase Fixed-Bed Reactors
Investigators Reaction Comments Germain et al. Hydrogenation of Observed hot-spot (1974) AMS formation in a trickle-bed
reactor Jaffe (1976) Commercial Reported hot spots in a
hydrogenation commercial hydrogenation reactor
Hanika et al. Hydrogenation of Vaporization of the liquid (1976) cyclohexene phase in parts of the
trickle-bed reactor resulted in the formation of a hot spot
Hanika et al. Hydrogenation of Followed the formation of (1981) 1,5-~yclooctadiene hot spots in a trickle-bed
reactor Eigenberger Hydrogenation of Showed a record of a and Wegerle benzene sudden reactor runaway ( 1982) with temperature rising at
100"C/min Hanika (1986) Hydrogenation and Reported hot spots in a
disproportionation trickle-bed reactor of cyclohexene
Haure et al. SO2 oxidation Cycling of the liquid flow (1 990) resulted in temperature
waves through the reactor bed
Lange et al. Hydrogenation of Showed that by cycling the ( 1990) AMS liquid flow rate, higher
conversions than steady flow were possible
Hydrogenation of Demonstrated that cyclic cyclohexene operation of the catalyst
bed could eliminate regions of complete evaporation
Hanika et al. Hydrogenation of Reported temperature vs. ( 1990) cyclohexene time data of hot spot
formation Ruzicka and Hydrogenation and Concluded that hot-spot Hanika (1990) disproportionation of formation is a result of
cyclohexene liauid maldistribution McManus et al. Hydrogenation of Reported up to 67°C ( 1992) AMS temperature spikes in a
laboratory trickle-bed reactor
On the other hand, if controlled, the rate and temperature increases may be exploited to achieve higher conversions.
The occurrence under steady-state conditions of vaporiza- tion during reaction in the multiphase fixed-bed or trickle-bed reactor is well documented. Table 1 lists several examples from the literature in which hot spots within cocurrent, downflow trickle beds were either directly identified by temperature meas- urements or inferred from the data. Several of these studies reveal that zones may exist within the reactor in which the local temperature exceeds the boiling point of the least volatile component, even though the feed temperature is well below this level. In the coolest zones of the reactor, the pellets are likely to be completely filled with liquid because of strong capillary forces. Reaction proceeds via liquid-phase catalysis. Within the hottest zones the pellets are completely dry, and the catalysis proceeds on gas-contacted catalyst surfaces. It is anticipated that in a transition zone between these two limits
there exists pellets which are partially wetted externally and internally. Progress toward understanding various transition states has been made (Harold and Watson, 1993; Watson and Harold, 1993). The reader is referred to the recent review by Harold (1993) for a detailed presentation of the use of modeling in evaluating multiphase catalyst performance.
Less understood are the mechanisms by which the hot, par- tially wetted or completely dry zones are formed within the multiphase fixed-bed reactor. The main objective of this study is to elucidate the local dynamic phenomena which occur dur- ing a multiphase exothermic reaction in a single catalytic pellet. This is accomplished by carrying out model multiphase reac- tions in a single-pellet reactor under various unsteady situa- tions. These situations are intended to mimic local scenarios within the reactor which may ultimately lead to hot spots in the reactor. Previous reactor studies provide some clues about hot spot formation. In their study of a-methylstyrene hydro- genation in a bed of Pd/y-A1203 pellets, Germain et al. (1974) reported axial temperature profiles showing hot spots. Cyclic activity of the catalyst and flow maldistribution were primary factors responsible for the nonisothermal phenomena. McManus et al. (1993) observed up to 67°C temperature ex- cursions during a-methylstyrene hydrogenation in a bed of Pd/A1203 pellets. Lange et al. (1990) carried out cyclohexene hydrogenation in a bed of Pd/charcoal pellets in a deliberate periodic fashion: the liquid was pulsed as discrete slugs over the bed. Temperature excursions up to 50°C were observed during the liquid-off period. In an earlier study, Haure et al. (1989) carried out the aqueous-phase oxidation of SO2 over activated carbon by a similar scheme. In this case, the observed higher time-averaged rates were attributed to an enhancement of external mass-transfer rates. In a subsequent study, the existence of temperature waves during the periodic operation was observed (Haure et al., 1990).
The issue of temperature rise and oscillations related to gas- liquid phase transitions in porous catalyst pellets with exo- thermic chemical reaction was theoretically addressed by Dro- byshevich and Kirillov (1982) and by Kuzin and Stegasov (1986). Drobyshevich and Kirillov (1982) suggested that the catalytic activity is the major factor in determining whether the catalyst attains a steady state or exhibits periodic behavior. For a catalyst with a low activity, the pellet fills with liquid, and a low-rate, liquid-filled, unique state results. For a high-activity pellet, the pellet fills with liquid at short times, but gradually empties. A high-rate, vapor-filled state results. Finally, for an intermediate activity pellet, the pellet fills with liquid, heats up and empties, and then fills with liquid again-this oscil- latory cycle continues, and no steady state is observed. Kuzin and Stegasov (1986) considered a highly active catalyst where liquid reacts so rapidly on contact with the catalyst that the liquid does not enter the pellet. It was shown that the catalyst surface temperature oscillated in concert with the existence of liquid (low catalyst surface temperature) and gas (high catalyst surface temperature) on the catalyst surface. While such mod- eling efforts are intriguing and instructive, there is a definite need for supporting experimental data.
The approach taken in this study is to focus on the key multiphase reaction-transport interactions at the single cata- lytic pellet level (following Funk et al., 1991). While the use of a laboratory-scale fixed-bed reactor is more closely con- nected to the industrial reactor, the use of a single pellet allows
990 June 1993 Vol. 39, No. 6 AIChE Journal

one to better control and assess the local multiphase environ- ment. Without knowing the liquid distribution on the surface and within the pores of pellets in a fixed-bed arrangement, it is difficult, if not impossible, to unravel the impact of vapor- ization and wetting on catalyst performance. The sacrifice that is made in using the single-pellet reactor is the absence of interparticle effects such as solid-phase heat conduction. Pos- sible experimental extensions of the single-pellet approach are made in the Concluding Remarks section.
Two dynamic situations involving an exothermic multiphase reaction on a single pellet are experimentally simulated in this study. The time-dependent center temperature and liquid weight are monitored. The dynamic weight and temperature provide valuable information that is unattainable in a conventional fixed-bed experiment. The pellet weight informs one of the extent of pore filling and pore emptying rates. The pellet tem- perature informs one of the thermal effects of exothermic reaction and endothermic vaporization. The notion of hot dry spot formation advanced by previous investigators is con- firmed unambiguously in this study. In the first situation, the catalytic pellet (a supported noble metal) is prefilled with liquid reactant (an olefin). The pellet is then contacted with the gas- eous reactant mixture (hydrogen with or without vaporized olefin). This situation mimics a sudden loss of liquid flow in a section of the reactor. Comparison of the pellet dynamics with reaction to the drying dynamics without reaction (inert gas) helps to elucidate the thermokinetic effects. In the second situation, the catalytic pellet is prefilled with the volatile reac- tant (hydrogen) and exposed to a liquid reactant pulse at a prescribed rate and duration. This situation mimics the rewet- ting process in an initially dry bed.
Selection of the Model Reaction Systems The two reaction systems examined in this study are the Pd-
catalyzed hydrogenations of a-methylstyrene (to cumene) and of cyclohexene (to cyclohexane). These reactions are both rep- resentative of the large class of exothermic noble metal cata- lyzed olefin hydrogenations. The key difference between the two reactions is the volatility of the less volatile reactant. Some pertinent features about each reaction system are now dis- cussed.
The Pd-catalyzed hydrogenation of a-methylstyrene to cu- mene.
C C / /
c =c c -c + H 2 - / + 109 kJ
@
has been a popular model multiphase reaction for examining multiphase reaction-transport interactions. This is evidenced by the large number of literature studies (Babcock et al., 1957; Satterfield et al., 1969; Germain et al., 1974; White et al., 1974; Morita and Smith, 1978; Herskowitz et al., 1979; Turek and Lange, 1981; El-Hisnawi et al., 1982; Funk et al., 1991; Cini and Harold, 1991; among others). These studies dem- onstrate that the liquid-phase/catalytic reaction is mass-trans- port-limited with respect to sparingly soluble hydrogen (in
Table 2. Pertinent Properties of Two-Reaction Systems
Compound Property AMS Cumene Cyclohexene Cyclohexane
Normal boiling
Vapor pres. (torr) point ('C) 165.4 152.4 83.0 80.7
at 25°C 2.4 4.6 88.8 97.6 at 40'C 6.2 11.0 169.0 185.0 at 80°C 46.0 72.5 694.0 743.0
vaporization at 25'C (kJ/mol) 40.5 37.5 30.5 30.0
Mass density (g/cm3) at 20'C 0.8094 0.7786 at 25'C 0.906 0.864
Latent heat of
AMS and cumene) under typical laboratory conditions (25- 50°C, 1 atm total pressure, excess AMS). Under such condi- tions, apparent reaction orders with respect to hydrogen and AMS are typically unity and zero, respectively. Babcock et al. (1957) and Cini and Harold (1991) observed a fractional-order dependence on hydrogen under conditions of minimal trans- port intrusion. Finally, Cini and Harold (1991) showed that for a sufficiently low AMS concentration the rate is positive- order in AMS.
Under mild conditions ( c 50°C), AMS hydrogenation rep- resents the subclass of multiphase reactions in which heat ef- fects are not expected to be important. Indeed, as Table 2 shows, AMS (cumene) boils at 165 (152)"C and has a vapor pressure of only 6.2 (11.0) torr at 40°C, for example. Never- theless, subtle features in the single-pellet experimental study of Funk et al. (1991) demonstrate that the moderate exothermic heat of reaction can lead to some vaporization from the non- wetted surface of the partially wetted pellet. Thermal effects can be quite dramatic under some conditions, as in the afore- mentioned Germain et al. (1974) and McManus et al. (1993) studies. The current study corroborates these observations.
A potentially complicating feature of the reaction system is the possible formation of oligimeric and/or polymeric styrene species. In fact, a polymerization inhibitor (such as p-tert- butylcatechol) is normally added to bulk AMS. Germain et al. (1974) reported that oligomeric species which forms in the pores of catalyst can be removed by flowing fresh AMS over the catalyst. This study provides new insight into the oligomeri- zation process.
The Pd-catalyzed hydrogenation of cyclohexene to cyclo- hexane,
o+ H 2 - O + 117 kJ
has features which are similar to the AMS reaction. For ex- ample, the reaction is moderately exothermic, the liquid-phase catalytic reaction is fast under mild conditions, and hydrogen is only sparingly soluble in the liquid-phase reactant and prod- uct. Intrinsic kinetics studies using Pd and Pt catalysts report reaction orders with respect to hydrogen between 0.5 and 1 (Segal et al., 1978; Madon et al., 1978; Gonzo and Boudart, 1978; Hanika and Ehlova, 1989). At sufficiently high tem- peratures and low hydrogen/cyclohexene feed ratio, cyclo- hexene disproportionation occurs:
AIChE Journal June 1993 Vol. 39, No. 6 991

t
Figure 1. Overall experimental setup used in the mul. tiphase, single-pellet study (not to scale).
A distinguishing feature of the cyclohexene hydrogenation re- action system is the relatively high volatility of the liquid reac- tant and product. As shown in Table 2, the normal boiling point of cyclohexene is 83"C, and its vapor pressure at 40°C is 169 torr. Thus, with all conditions equal, vaporization and associated thermal effects are expected to be more pronounced with the hydrogenation of cyclohexene compared to that of AMS. The importance of vaporization during this reaction has been demonstrated by Hanika and coworkers in several reactor studies (Hanika et al., 1974, 1975, 1976; Stanek and Hanika, 1982; Lange et al., 1990). In the current study, a direct com- parison of cyclohexene to AMS hydrogenations under dynamic conditions helps to elucidate the impact of phase transitions.
Experimental Setup and Procedure A schematic diagram of the overall experimental setup is
shown in Figure 1. The reactor chamber contains a suspended catalyst pellet, the center temperature and weight of which are measured and overall appearance of which is assessed. The setup consists of the single-pellet reactor, a bottom-loading balance, a gas saturator, a liquid saturator (bubbler), a con- denser, liquid pumps, a gas supply and electronic metering system and a data acquisition system.
Gases flowed from cylinders to the reactor and to the bub- bler. In most of the experiments reported, countercurrent flow (gas upflow) was employed. Experiments with cocurrent down- flow were carried out to check the importance of the gas flow
direction and to rule out any effects of presaturation of the feed gas with liquid effluent. In either flow configuration, the effluent gas stream passed through a condenser. Condensed organics were returned to the liquid saturator. Flow rates of reactor gases, hydrogen and helium were monitored and set using a mass-flow control system (Datametrics, Model 825 modules and model 1605 control box). An additional metered hydrogen/cyclohexene stream could be mixed with the main hydrogen/helium stream to give a prescribed hydrogedcy- clohexene/helium reactor feed. The hydrogen/cyclohexene stream was obtained by bubbling hydrogen through a pool of cyclohexene (saturator) maintained at a prescribed tempera- ture. Tubing from the pool to the reactor was heated to prevent recondensation of cyclohexene. The cyclohexene uptake was determined by measuring the pool volume loss with time. The nitrogen fed to the top of the reactor was monitored and set using a rotameter. The gas flow rates into the bubbler units were set using rotameters. Prior to entering the reaction system, both the helium and the hydrogen (prepurified and ultra-high purity) were passed through a deoxygenation and a molecular sieve/Drierite trap to remove traces of oxygen and water, re- spectively.
Care was taken to avoid contamination of the liquid feeds. For the a-methylstyrene (AMS; Kodak, 98% or higher purity) runs, the polymerization inhibitor @-tert-butylcatechol) was removed prior to use. This was accomplished by contacting the desired volume of AMS with y-alumina pellets [1/8 in. (3.2 mm) diameter] in a flask (following procedure of Germain et al., 1974). The typical contact time was 1-2 h. For the cy- clohexene runs, purified and peroxide-free liquid cyclo- hexene (Aldrich, 99% or higher purity) was placed into the bubbler. The cyclohexene (Aldrich Chemical Co.; 99% or higher purity) was stabilized with 2,6-di-tert-butyl-4-methyl- phenol. A dedicated column filled with y-alumina pellets was employed to remove any peroxides from the cyclohexene prior to its use. Helium was used to purge the bed of possible oxygen contamination.
Precision liquid pumps were used to move liquid from the bubbler to the top of the pellet inside the reactor vessel and from the exit of the reactor vessel to the bubbler [Fluid Me- tering, Inc. (FMI) model QD pumps]. The pump used to feed liquid to the top of the pellet was equipped with a precision micrometer. The micrometer was used to accurately set the liquid flow rate. A metered hydrogen/helium stream also passed through the liquid saturator. For hydrogen-prefilled pellet ex- periments, a syringe pump was used (Sage Instruments; model 341A). During the startup of the liquid flow, an initial fraction of liquid exiting the syringe pump line was diverted from the inlet to the reactor to a separate holding vessel until continuous flow was obtained. When steady flow was assured, a valve was turned to initiate the flow of the liquid to the top of the pellet.
The weight of the entire pellet and holder (described below) was measured during the course of an experiment using a bottom loading electronic balance (Mettler AE50). A data col- lection interface (Mettler 011) was used to supply a digital signal to the computer. The total liquid holdup (weight) was determined in an experiment by subtracting from the total weight with liquid present the total weight without liquid pres- ent. Because of fluctuations, this tared value was accurate to within 0.03 g.
The computer data acquisition system consisted of an An-
992 June 1993 Vol. 39, No. 6 AIChE Journal

alog Devices pMAC-1050 box, an Analog Devices 5B board with two 5B37, type K, isolated TC input thermocouple mod- ules, an Analog Devices 977 power supply (5VDC/5 amps) and a Macintosh SE/30. The software used was CENTREL, an object-oriented development system for laboratory and in- dustrial measurement control (MacGregor, 1990). The fre- quency of data collection was sufficiently rapid (for example, 1 data point per 6 s for the pellet center temperature) permitting the data shown in the figures of this article to be represented by continuous curves.
Temperatures at several locations were monitored through- out the system using thermocouples (type K) at two model 650 Omega multimeter thermometers. Figure 1 indicates where the thermocouples were located throughout the setup. Preheating of the gas and liquid feeds was not necessary in the experiments described in this article, except for the saturated gas feed ex- periments where the tubing was heated from the saturator to the reactor entrance to prevent condensation.
The single-pellet reactor is shown in Figure 2. The walls of the reactor are transparent Pyrex glass, which permitted visual observation of the pellet. The straight tube of the reactor vessel had a 3 cm inside diameter and a length of 35 cm. A water jacket surrounded a 15 cm length of the middle portion of the straight tube part of the reactor. The top and base of the reactor were removable so that adjustments could be performed. The liquid was fed to the suspended catalyst pellet from the top of the reactor. The gas was fed to the base of the reactor (as mentioned above, experiments were also carried out with gas fed to the top of the reactor). The distance from the stainless steel tube liquid inlet to the pellet was approximately 1-3 mm. The gas inlet was about 10 cm below the pellet; the gas exit was located 18 cm above the pellet (for the experiments carried out with gas fed to the top of the reactor, the gas inlet and outlets were opposite to the experiments carried out with gas fed to the base of the reactor). The liquid outlet was directly beneath the pellet, about 18 cm from the base of the pellet.
The top of the reactor was designed to permit weighing of the pellet, while preventing any leaks (in or out) with the use of a mercury seal (Figure 2). A small cup-shaped glass piece held a small bead of mercury. The harness which held the pellet and secured the thermocouple wires passed directly through the mercury seal. Nitrogen at 10 cm3/min was used to purge a small glass bulb chamber located directly beneath the mercury seal and directly above the top of the reactor vessel, preventing reactor gases from coming in contact with the mercury seal.
The stainless steel sheathed harness wire from which the pellet was suspended contained one chrome1 and one alumel thermocouple wire [0.01 in. (0.25 mm) diameter]. These were insulated from each other and the sides of the sheath with highly compacted magnesium oxide (MgO) (Omega Engineer- ing Co.). The 12 in. (305 mm) total length sheathed cable had 2 in. (51 mm) of exposed thermocouple wire on each end. The harness cable served two purposes: it held the pellet and pro- vided an access route for the center temperature thermocouple wires to exit the reactor. The thermocouple [0.015 in. (0.38 mm) diameter] which passed through the pellet was sufficiently rigid to hold the pellet in a stable position, once arranged as desired. The thermocouple wires from the pellet were con- nected to the thermocouple wires in the sheathed cable (har- ness). The opposite end of the harness was bent into a “hook” shape and connected to a flexible string. This allowed sufficient
Mercury bead \
cup !TO ( 1 cm dla.) . balance
(2 cm height)
opening
Reactor
thermocouple Liquid sheath Inlet t 1.5 mm dla) Nozzle
Center ra ture
1 \.I Thermocouple
’--- Water Jacket + Gas Inlet Liquid E x i t 4
Figure 2. Single-pellet reactor. A mercury (Hg) bead was used to seal the top of the reactor (expanded view) (not to scale).
“play” so that the effect of torsional stresses had a minimal effect on the weight measurement. The thermocouple wires at the end of the sheathed cable outside the reactor were attached to 0.001 (0.025 mm) thermocouple wires that were arranged in such a way that there was sufficient flexibility so that there was negligible influence on the weight measurement. The 0.001 in. (0.025 mm) thermocouple wires were attached to standard- size thermocouple wires and led to the data acquisition board.
Following the discussion in the Introduction, two types of experiments were carried out to investigate the dynamic be- havior of the multiphase catalytic reaction. Detailed descrip- tions of typical runs for each type provided in the results section help to clarify the procedures.
In the first type, called the liquidprefilledpellet experiments, the pellet was prefilled with the less volatile reactant (AMS or cyclohexene) at room temperature (20-25°C). The filling was accomplished by flowing liquid over the pellet at a rate of 5- 15 cm3/min for 1 h. This time period was determined to be sufficient to insure complete pore filling. The experimental setup was capable of delivering liquid either devoid of hydrogen or presaturated with hydrogen in the bubbler unit. During the filling process, room temperature helium was flowed past the pellet. The helium was then replaced using the valve system shown in Figure 1 with room temperature hydrogen at a pre- scribed rate. This switching was carried out two different ways. In the first method, the helium was replaced with hydrogen 10 min after the liquid filling commenced. The liquid flow rate was high enough to insure that negligible uptake of hydrogen occurred in the pellet (to avoid reaction). After 50 additional min the liquid flow was stopped. In the second method, the helium was replaced at the same time the liquid flow was turned
AIChE Journal June 1993 Vol. 39, No. 6 993

off. For the lower gas flow rates, the 60-min gas switch gave a slightly longer lag time before reaction commenced. This additional lag was due to the travel time from the hydrogen supply point to the pellet. In either case, after the liquid was turned off, hydrogen uptake and vaporization commenced in the pellet. In the drying-only runs helium gas flowed past the pellet at a prescribed rate during the pore filling and pore emptying periods.
In the second type of experiment, called the gas prefilled pellet experiments, the pellet was prefilled with room temper- ature hydrogen which flowed past the pellet. The pellet was then contacted by a pulse of room temperature liquid reactant (AMS or cyclohexene) with a prescribed flow rate and duration. During the liquid flow period and the subsequent drying pe- riod, pure hydrogen gas flowed over the pellet at a prescribed rate.
Catalyst Preparation The catalyst support consisted of a mixture of pseudoboeh-
mite alumina (Kaiser, Versa1 250) and attapulgite clay (En- gelhard, Attasorb LVM). Finely divided samples of the alumina and clay were mixed manually with water in the weight pro- portions a1umina:clay:water of 2.1:1:6.1. The cylindrical pellet sections were made by compressing the resulting support dough in a die. This step had to be done twice to insert the unsheathed thermocouple within the support. The thermocouple [0.015 in. (0.38 mm) diameter] was carefully inserted onto one end of the first pressed section. The thermocouple wire was positioned such that the thermocouple junction was at the center of the circular crosssection. A second batch of dough was then com- pressed onto this face. The chrome1 and alumel wires exited opposite sides but at a fixed axial position along the cylindrical pellet. Finally, the pellet was dried at room temperature for 24 h and at 200°C for 17 h. The support was then calcined at 550°C for 2 h. Two pellets were used in this study. Pellet 1 was used as described above; pellet 2 was the same catalyst pellet as pellet 1, but was shortened by 0.5 cm and was sand- wiched between two roughened glass end pieces of the same diameter as the catalyst pellet. The glass end pieces were at- tached to the catalyst pellet using epoxy. Pellet 2 was con- structed to obtain rivulet flow and to minimize end effects for a steady-state study that was simultaneously under way (Wat- son and Harold, 1993). Similar results were obtained with pellet 2 when compared with pellet 1. Dimensions of these two pellets used in this study are provided in Table 3. Unless otherwise stated, all experiments were performed with pellet 1.
The alumina-clay support was impregnated with a saturated aqueous solution of Pd(NH3)&12 (Engelhard). The support was soaked in a tube containing 6 mL of solution for 48 h and then washed with distilled water. After room temperature drying in air for 24 h, the pellet was dried further at 140°C for 12 h. A subsequent higher temperature oxidation was car- ried out for 1 h at 625°C. Finally, the pellet was reduced in flowing hydrogen at 350°C for 1 h.
Catalyst Characterization Care was taken to provide a clear assessment of the support
morphology and Pd distribution because of the expected im- portance of these variables during the dynamic transport and
Table 3. Properties of Pellets Used in This Study
Physical Properties Length Diameter Total solid geometric vol. (= u r 2 / L ) Solid density Pore vol. by liquid uptake Density Weight Avg. palladium loading for entire pellet Total pore vol. based on liquid uptake
Pellet 1
4.0 cm 0.8 cm 2.01 cm3 3.704 g/cm3 1.328 cm3 I . 13 g/cm3 2.27 g 4% 0.585 cm3/g
Pellet 2
3.5 cm 0.8 cm 1.76 cm3 3.704 g/cm3 1.74 cm3 1.13 g/cm3 1.99 g 4 % 0.590 cm3/g
BET area at different axial positions in the pellet Nitroeen BET Adsomtion Method Dynamic Method (m2/g) Static Method Avg.
Location Adsorption Desorption (m2/g) (mZ/g) Upper section 219,241’ 267,280’ 212 244 Middle section 215 215 256 229 Lower section 21 1 223 184 206
Pore size at different axial positions in the pellet Low-Pressure High-pressure Nitrogen Porosimetry Porosimetry Adsorp./Desorp. Avg. Pore Avg. Pore
Radius (pm) Radius (A) Avg. Pore Location Intrusion Extrusion Throat Pore Radius (A)
Upper section 21.81 27.66 494 581 36 Middle section 10.44 13.31 471 521 34 Lower section 13.5 13.5 476 615 33
Repeated experiments
reaction processes. A Pd/A1203/clay pellet prepared by the above methods was characterized by N2 adsorption/desorption (Omnisorp 360 apparatus), mercury porosimetry (Autoscan 500 apparatus), and scanning electron microscopy (SEM; JEOL JSM-35CF instrument). The Pd loading was determined by atomic absorption spectroscopy. The Pd metal distribution was determined by X-ray microprobe analysis (Kevex Delta Class X-ray microanalyzer). The main findings of the characteri- zation are summarized in Table 3 and Figures 3 and 4 and are described below. Additional details of the analysis methods and results are provided by Watson (1993).
The morphological measurements and SEM micrographs of the Pd-impregnated pellet reveal the expected biporous nature of the compressed particulate support. There is a slight vari- ation from what is recognized as a typical bimodal pore-size distribution. This variation will be discussed below. Because of the press method used to make the pellet with a thermo- couple mounted in the center of the pellet, several axial po- sitions of the pellet were examined to determine if the morphology was uniform. The “upper section” is the part of the pellet near the top of the pellet; the “middle section” is at the axial midpoint of the pellet; the “lower section” is the part of the pellet facing the bottom of the reactor; each of these sections is represented by shading in the pellet figures accompanying the characterization data.
Table 3 summarizes the surface area results from samples from each of the three axial sections of the palladium-im- pregnated pellet. The specific surface area determined by BET analysis was 226 m2/g. This result is typical of catalyst pellets made by compression of high surface area alumina. Significant nonuniformity was not apparent. This result supports the no- tion that the high surface area is due primarily to the mesopores
994 June 1993 Vol. 39, No. 6 AIChE Journal
p1 pcl
b
n & n
Figure 3.
-- 14 - 12 - 10 - 8 - 6 - 4 -
16 14 12 10 8 6 4 2
0 10 100 lo00
10 100
0 2I 10 100 1000
RP (Angstroms) Pore-size distribution for upper (a), middle (b) and lower (c) pellet sections determined by nitrogen desorption. Vp (cm’) is the volume desorbed from average radius Rp (A).
within the particles (see below). Compression of this high sur- face area powder should not change the surface area signifi- cantly.
The pore-size distribution was determined using both the desorption isotherm technique and the mercury porosimetry technique. The mercury porosimetry results were evaluated using the Pore-Throat Network Model (Conner et al., 1983; 1988; Lapidus et al., 1985). The average pore sizes obtained using the two techniques are reported in Table 3. The results of the two methods indicate that the pore-size distribution consists of mesopores, large macropores, and small macro- pores. The largest macropores determined using the low-pres- sure mercury porosimetry were not expected. They comprise a small fraction of the total pore volume, but were present in each of the three axial sections examined. Their existence could be a result of the pressing method used to make the pellets for this study.
There was little variation in the pore-size distribution be- tween the three axial sections. The average mesopore size de-
AIChE Journal June 1993
1.2
1.0
oa 0.6
0.4
0.2
0.0 1.0 0.5 0.0 0.5 1.0
Approximate Pd Concentrations:
B: 285% C: 3.15 $b D 4.93 % E 6.34% F 10.6 %
1.2
1.0
0.8
0.6
0.4
0.2
0.0 1.0 0.5 0.0 0.5 1.0
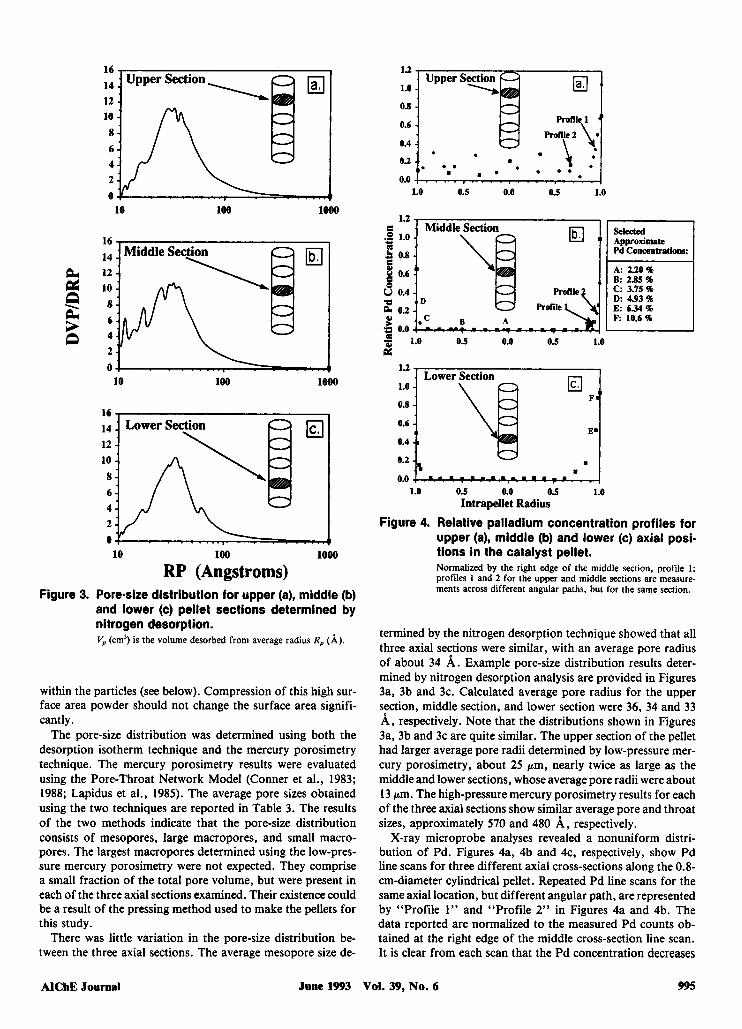
Intrapellet Radius Figure 4. Relative palladium concentration profiles for
upper (a), middle (b) and lower (c) axial posi- tions in the catalyst pellet. Normalized by the right edge of the middle section, profile 1; profiles 1 and 2 for the upper and middle sections are measure- ments across different angular paths, but for the same section.
termined by the nitrogen desorption technique showed that all three axial sections were similar, with an average pore radius of about 34 A. Example pore-size distribution results deter- mined by nitrogen desorption analysis are provided in Figures 3a, 3b and 3c. Calculated average pore radius for the upper section, middle section, and lower section were 36, 34 and 33 A, respectively. Note that the distributions shown in Figures 3a, 3b and 3c are quite similar. The upper section of the pellet had larger average pore radii determined by low-pressure mer- cury porosimetry, about 25 pm, nearly twice as large as the middle and lower sections, whose average pore radii were about 13 pm. The high-pressure mercury porosimetry results for each of the three axial sections show similar average pore and throat sizes, approximately 570 and 480 A, respectively.
X-ray microprobe analyses revealed a nonuniform distri- bution of Pd. Figures 4a, 4b and 4c, respectively, show Pd line scans for three different axial cross-sections along the 0.8- cm-diameter cylindrical pellet. Repeated Pd line scans for the same axial location, but different angular path, are represented by “Profile 1” and “Profile 2” in Figures 4a and 4b. The data reported are normalized to the measured Pd counts ob- tained at the right edge of the middle cross-section line scan. It is clear from each scan that the Pd concentration decreases
Vol. 39, No. 6 995

from the external surface to the center. There is also some nonuniformity in the external surface Pd content. These data agree with Pd distributions reported by Funk (1990) who used a similar catalyst preparation scheme. Additional X-ray micro- probe results and methods are provided by Watson (1993).
Determination of the Pd metal loading in weight percentage was carried out using atomic absorption spectroscopy. The entire pellet has an average Pd content of about 4%. For example, thin cylindrical samples of radius 4 mm and length 1 mm from the upper section and the middle section had average Pd contents of 4.68 and 3.56%, respectively. The atomic absorption spectroscopy results confirm the X-ray mi- croprobe analyses. In the center of the pellet, where the X-ray microprobe relative concentration profile is nearly constant, the catalyst loading is approximately 2.2%. In agreement with the X-ray microprobe data, the Pd concentration is highest near the outside surface of the pellet, with approximate max- imum concentrations from 5% to 10%. Some representative approximate Pd concentrations are assigned to points (A, B, C, D, E, and F) along the Pd profiles shown in Figures 4a, 4b and 4c (see the insert in Figure 4). Additional atomic ab- sorption spectroscopy results and methods are provided by Watson (1993).
Additional physical dimensions and properties of the catalyst pellets are given in Table 3. Pellet 1 was the catalyst pellet used for most of the experiments in this study; its length is 4.0 cm. Pellet 2 is the same pellet as pellet 1, but 0.5 cm shorter in length. The liquid uptake method used to estimate the total pore volume consisted of filling the pores of the catalyst and weighting the pellet. This procedure was performed with the single-pellet setup used in this study. The reported total pore volumes of 0.585 cm3/g and 0.590 cm3/g for pellets 1 and 2, respectively, were determined using pure cyclohexene as the pore filling liquid.
Results and Observations Liquid-prefilled pellet experiments: drying without hy- drogenation
To clearly assess the dynamics of the pore emptying process during reaction, experiments without the exothermic hydro- genation were carried out. In these runs, the weight vs. time data of a pellet initially filled with liquid is expected to have the characteristic features of the simple drying of a granular porous medium. For example, the existence of a constant rate and falling rate period should be evident as drying proceeds (Whitaker and Chou, 1983; Comings, 1983c; among others). Moreover, the pellet temperature vs. time data should provide useful information about the energy requirements associated with the endothermic vaporization. That is, a temperature decrease is anticipated during the drying process.
Separate drying experiments were carried out with pure AMS, cumene, and cyclohexene using room temperature helium as the sweep gas. Helium flow rates between 50 and 490 cm3/ rnin were used. Drying experiments were performed with the same Pd-impregnated A1203/clay pellet as used in the reaction experiments.
Figures 5a and 5b show the time dependencies of the tared pellet weight and pellet temperature for the cyclohexene-pre- filled pellet, respectively. Results for two different helium flow rates are shown (50 and 200 cm3/min). The time period shown
996 June 1993
MI 1.50 U
0 30 60 90 120 150 180 210
,---- \ \ /
20
18
12 - 0 30 60 90 I20 150 180 210
Time (min.) Figure 5. Time dependence of the tared pellet weight
(a) and pellet temperature (b) for the cyclo- hexene-prefilled pellet when exposed to 50- cm3/min He (-) and 200-cm3/min He (---). The pellet was wetted from time=O to time=60 min. He gas flowed past the pellet for the entire experiment.
spans 210 min. During the first 60 min, the pellet was filled with cyclohexene. As expected, the gas flow rate had no no- ticeable effect on the imbibition dynamics. Complete filling of the pellet was achieved within 10-12 min. After 60 min, the liquid was turned off. This point is noted by the small, dis- continuous drop in the weight reading, indicating that the impinging liquid stream exerted a force on the pellet. Drying proceeded from this instant. For the higher He flow rate, the time dependence of the tared pellet weight during drying (or liquid holdup in this regime) exhibits the expected two-regime feature. At short times the weight loss is essentially a linearly decreasing function of time; this is the constant drying rate period. At larger times the drying rate slows, as evidenced by the flattening of the weight vs. time curves; this is the falling rate period. The lower He flow rate case exhibited an increase in drying rate at intermediate times and then a fall-off at large times. Drying is clearly more rapid for the higher He flow rate. Complete pore emptying is considered to be established when less than 10% (by weight) of the completely liquid-filled pellet remains. Within experimental error, complete pore emptying required approximately 90 (180) rnin for a helium flow rate of 200 (50) cm3/min. Figure 5b demonstrates the endothermic demands of the drying process. The center pellet temperature exhibited a minimum at intermediate time during the drying. A temperature drop of 10°C (5°C) was observed for the high (low) helium flow rate.
Drying data without reaction are shown in Figure 6 for a- methylstyrene (AMS) and cumene at the same helium flow rate
Vol. 39. No. 6 AIChE Journal

n
2 W 5 I W .I
0 720 1440 2160 2880 3600
Time (min.) Figure 6. Time dependence of the tared pellet weight
for the AMS (-) and cumene (---)-prefilled pellet. The pellet was wetted from time=O to time=60 min. He gas flowed past the pellet for the entire experiment.
(50 cm3/min). As expected from the volatility values (Table 2), a much longer time period was required to approach com- plete pore emptying for both of these species compared to cyclohexene. However, despite the similar volatilities of AMS and cumene, the cumene-prefilled pellet emptied more rapidly than the AMS-prefilled pellet. For example, at the 1,080-min mark the cumene-prefilled pellet was approximately 70% emp- tied, but the AMS-prefilled pellet was only about 40% emptied. At the 2,160-min mark the cumene-prefilled pellet was com- pletely dry, but the AMS-prefilled pellet contained 25% of the original material (by weight). Approximately 2,100 min was required to empty the pellet prefilled with cumene. In contrast, almost 3,600 min elapsed before the pellet prefilled with AMS was essentially devoid of AMS. These differences point to the formation of an oligomeric species in the case of AMS. Further evidence for the oligomerization is in the drying with reaction runs presented later.
Visual observations were helpful in determining the state of the external surface of the pellet. For example, the qualitative appearance of the Pd/AI2O3 pellet was a light, dull-gray color when dried. When completely wetted, the external surface had a shiny, black appearance. As the liquid film (either AMS or cyclohexene) disappeared, the color of the external surface changed gradually from the shiny, black to a light, dull gray. It should be noted that the pellet appearance did not provide any information about the liquid holdup within the pellet, because a pellet completely dried had the same appearance (light, dull gray) as a pellet whose liquid film had disappeared, but still contained a large fraction of the total liquid uptake (as known by the tared weight measurement).
Liquid-prefilled pellet experiments: drying with hydro- genation
The dynamic behavior of the liquid-prefilled pellet changes considerably when helium is replaced by hydrogen in the gas phase. Figures 7a and 7b, respectively, show the tared pellet weight and center temperature for the case of a pellet prefilled with cyclohexene which was exposed to a flowing hydrogen stream. Two different flow rates of pure hydrogen are shown:
AIChE Journal June 1993
1.50
1.25
60 70 80 90 100 110 120
Ibl 120 I U I
60 70 80 90 100 110 120
Time (min.) Figure 7. Time dependence of tared pellet weight (a) and
pellet temperature (b) for the cyclohexene-pre- filled pellet at 200-cm3/min H2 (-) and 490- cm3/min H2 (-). The pellet was wetted from time=O to time =60 min. H2 gas was flowing past the pellet starting at time= 10 min.
200 and 490 cm3/min. Only the time period for which pore emptying was encountered is shown. The experimental results shown were obtained by the first method of helium-to-hydro- gen switching: that is, the switching was initiated 10 rnin after the liquid flow was started. The same qualitative trends were obtained with the aforementioned second method involving a later helium-to-hydrogen switch.
For each hydrogen flow rate the tared pellet weight de- pendence on time exhibited the same decreasing dependence which was observed for the drying experiments. Moreover, the pore emptying was more rapid for the higher gas flow rate. The pellet was essentially devoid of liquid (less than 10% of initial liquid holdup) in approximately 10-12 rnin for the 490- cm3/min flow rate and in 14-16 rnin for the 200-cm3/min flow rate. In comparison, the drying without reaction run in a 200- cm'/min stream of flowing helium the pellet took nearly 1 hour to reach the same extent of pore emptying (refer to Figure 5a). This clearly indicates that the exothermic reaction accel- erates the pore emptying process.
The impact of the reaction is especially evident if one ex- amines the pellet temperature dynamics in Figure 7b. A tem- perature increase of approximately 60-80°C was observed for each hydrogen flow rate. Repeated experiments to check for reproducibility indicated that the maximum temperature rise varied, but was typically in the range of 60 to 80°C higher than the initial temperature. In many cases the peak temper- ature exceeded the normal boiling point of cyclohexene and cyclohexane (83 and 81 "C, respectively). In comparing Figures
Vol. 39, No. 6 997

7a and 7b, the temperature maximum synchronizes quite closely with the maximum drying rate (slope of the weight vs. time curve). The pellet temperature returned to its initial level at large times as the liquid was depleted. It is evident that the more rapid initial drying obtained with the higher hydrogen flow rate resulted in a more rapid temperature rise and eventual vaporization of liquid. A mechanism for the observed dynam- ics is offered in the Discussion section. Finally, it should be noted that the direction of gas flow did not appear to have any notable impact on the results.
The pore emptying dynamics with reaction are slowed if the hydrogen entering the reactor contained cyclohexene. Pellet 2 subjected to cocurrent downflow was used in this set of ex- periments. The hydrogen gas feed was bubbled through a sat- urator containing pure cyclohexene at a constant temperature. All other procedures followed the methods described earlier. Approximately 6 and 36-cm3/min cyclohexene was delivered with the hydrogen for the 50 and 200-cm3/min hydrogen flow rate runs, respectively. The estimated cyclohexene mole frac- tions are 0.108 and 0.153 for the 50- and 200-cm3/min hydrogen flow rate experiments, respectively (based on procedure de- scribed in the Experimental Setup and Procedures section). While the mole fraction of 0.108 for the 50-cm3/min run is essentially equal to the saturation concentration predicted by dividing the vapor pressure evaluated at the satuator temper- ature by the reactor total pressure, the cyclohexene mole frac- tion in the 200-cm3/min run (0.153) exceeded the predicted saturation concentration. Visual inspection revealed the likely reason: entrainment of cyclohexene droplets as the hydrogen passed through the cyclohexene pool.
Figures 8a and 8b show the tared pellet weight and pellet temperature dynamics for two different hydrogen/cyclohexene gas feeds. The dynamics of the pore filling is similar to other liquid-prefilled pellet experiments. As for the pure hydrogen runs, the temperature rise and pore emptying were more rapid in the higher gas flow rate experiments than in the lower gas flow rate experiments. However, there are some noted differ- ences in the pore emptying processes if one compares the pure hydrogen and presaturated hydrogen experiments. First, more time was required in the presaturated hydrogen feed experi- ments for the temperature at the center of the pellet to reach its maximum value. For both the pure and saturated hydrogen feed experiments, the beginning of the temperature rise is at about 5 min after the liquid flow is stopped, only slightly longer for the saturated hydrogen feed experiment. For the 2Wcm3/ rnin saturated hydrogen run, the maximum temperature oc- curred at approximately 18 rnin after the liquid flow stopped. This compares to the corresponding 200-cm3/min pure hydro- gen run in which the maximum temperature rise occurred at approximately 12 min after the liquid flow stopped. Second, the temperature did not return to the initial temperature of the experiment, but remained elevated at large times. For ex- ample, in the 50-cm3/min run the temperature approached 35"C, while the 2Wcm3/min run stayed near 37°C. Moreover, the tared pellet weight also did not return to the initial, empty pellet value of 0. For example, the SO-cm'/min run had a steady-state liquid holdup of approximately 0.20 g, while the 200-cm3/min run had a steady-state value of approximately 0.09 g. These points are elaborated in the Discussion section below.
The observed dynamics of the same pellet when prefilled
. 200cdmin. El
1 , ~ 'I& ------------- - \ i
I 50cdmin. I
I
1.50
1.25
1.00
0.75
0.50
0.25
0.00 0 60 120 180 240 300 360
6 0 1 -
50
40
30
204 ' I . I . I . I ' I ' I 0 60 120 180 240 300 360
Time (min.) Figure 8. Time dependence of tared pellet weight (a) and
pellet temperature (b) for the cyclohexene-pre- filled pellet exposed to HP saturated with cy. clohexene at 50 cm3/min (-) and 200 cm3/ min (---). The pellet was wetted from time = 0 to time = 60 min. Saturated HZ gas was flowing past the pellet starting at time= 10 min.
with AMS and then exposed to pure hydrogen are shown in Figures 9a and 9b for 200 and 490-cm3/min hydrogen flow rates. Several features of the pellet weight and temperature dependencies are similar to those observed for the cyclohexene- prefilled pellet exposed to pure hydrogen. For example, Figures 9a and 9b show that the pellet temperature exhibited a max- imum at approximately the same time as when the pore emp- tying rate was highest. Moreover, as the hydrogen flow rate was increased, this peak rate and temperature regime move to shorter times. The intersection of the weight curves shown in Figure 9a at about 95 min, may be due to the larger temperature rise of the 200-cm3/min H2 experiment (60°C) compared to the 490-cm3/min Hz experiment (48°C). This observation may be connected to the slower dynamics associated with AMS.
Several features were encountered in the AMS experiments that were not encountered in the cyclohexene experiments. First, the observed pellet temperature rise is not nearly as large as it is for cyclohexene. For example, for the 200-cm3/min hydrogen flow rate the temperature rise is about 35°C for the AMS. This compares to a rise of almost 70°C for the cyclo- hexene at the same hydrogen flow rate (compare Figures 7b and 9b). Second, the time lag before the pellet temperature reached its peak value is much larger for the AMS at a given gas flow rate. Moreover, the temperature rise is much more gradual for AMS compared to cyclohexene. For example, with a 200-cm3/min hydrogen flow rate over the AMS-prefilled pellet, the temperature peak occurred 37 rnin after pore emp-
998 June 1993 Vol. 39, No. 6 AIChE Journal

la1 1.50
1.25
m 1.00 - 0.75
8 b 2 *s 0.50
0.25 i 60 80 100 120
60 80 100 120 Time (min.)
Figure 9. Time dependence of tared pellet weight (a) and pellet temperature (b) for the AMS-prefilled pellet at 200-cm3/min H2 (-) and 490-cm3/ min H2 (---). The pellet was wetted from time = 0 to time = 60 min. H2 gas was flowing past the pellet starting at time= 10 min.
tying commenced. This compares to a 10-min time lag for the cyclohexene-prefilled pellet at the same flow rate. Third, while pore emptying was essentially complete in the cyclohexene, pure hydrogen gas experiments, this was not the case for AMS (at least over the time frame of the experiments). This obser- vation is consistent with the drying behavior observed for the AMS-prefilled pellet (Figure 6). In part, the slower dynamics associated with AMS is a result of the low volatility of AMS and hydrogenation product, cumene. As was indicated earlier, a potential complicating feature is the existence of a competing styrene oligomerization reaction. Further evidence for this is that over half of the initial liquid weight is retained after the pellet has returned to its initial temperature. The relaxation of the transient exotherm indicates a probable depletion of re- active or accessible AMS. We return to these points in the Discussion section.
Gas-prefilled pellet experiments The dynamics are now reported of the same pellet which is
prefilled with pure hydrogen gas and then subjected to a liquid pulse of a prescribed flow rate and duration. Figures 10a and 10b show the time dependencies of tared pellet weight and temperature for the hydrogen-prefilled pellet exposed to cy- clohexene pulses. Results for liquid pulses flowing at 1 cm3/ rnin with durations 0.5,2,4 and 9 rnin are shown. Each liquid pulse was applied at approximately the 3-min mark. Data were
100
u e 80
n
i? a i?
G
* 60
40
2n
0 5 10 15 20 25
-- 0 5 10 15 20 25
Time (min.) Figure 10. Time dependence of tared pellet weight (a)
and pellet temperature (b) for the H2-prefilled pellet with cyclohexene liquid pulses of 0.5 min (-...-... ), 2 min (-), 4 min (---), and 9 min (. . . . .). The 1-mL/min liquid flow began at approximately the 3-min mark for each experiment. HI gas at 490 cm'hin was flowing past the pellet for each entire experiment.
then taken until the pellet temperature returned close to the feed gas temperature.
The tared weight data (Figure 1Oa) reveal the existence of two regimes: a pore-filling regime and a pore-emptying regime. Only partial pore filling was attained in each experiment. As expected, the degree of pore filling increased with increasing pulse duration. At the instant in which each pulse was stopped an immediate pore emptying process commenced. Figure 1Oa shows that the length of time to achieve complete pore emp- tying is an increasing function of the degree of pore filling attained by a given pulse.
Pellet temperature data (Figure lob) show two regimes: in chronology, these correspond to a regime in which the tem- perature is a slightly decreasing function of time, followed by a regime in which the temperature rises sharply, exhibits a maximum, and returns to the feed gas temperature. The former (latter) temperature regime coincides closely with the pore- filling (emptying) process. The peak temperature is a non- monotonic function of the pulse duration.
Similar trends were observed if the hydrogen-prefilled pellet was contacted by AMS pulses of the same rate (1 cm3/min) and duration (0.5, 2, 4 and 9 min) as the cyclohexene pulses. The results of these experiments are shown in Figures 1 la and 1 lb. The tared pellet weight dynamics (Figure 1 la) exhibit the two regimes of pore filling and emptying. Evident in the pore emptying regime is the aforementioned slow vaporization of
AIChE Journal June 1993 Vol. 39, No. 6 999

0.50
0.25
0.00 5 10 15 20 25 30 35
.5 p2
a . min
80- i! 4 min. I: n
El min. 100 oo
0 5 10 15 20 25 30 35
Time (min.) Time dependence of tared pellet weight (a) and pellet temperature (b) for the H,-prefilled pellet with AMS liquid pulses of 0.5 rnin (- . . . - . . . ), 2 min (-), 4 min (-), and 9 min ( - . - .). The I-mL/min liquid flow began at approximately the 3-min mark for each experiment. H2 gas at 490 cm'/min was flowing past the pellet for each entire experiment.
unreacted AMS, hydrogenation product cumene, and any oli- gimeric species. The pellet temperature (Figure 11 b) has a pro- nounced peak during the pore-emptying process. As for the cyclohexene, the peak temperature is a nonmonotonic function of the pulse duration. A new feature was observed in the short time temperature behavior in the AMS runs: during the pore- filling step the pellet temperature exhibited a relative maxi- mum, albeit significantly less pronounced than the peak ob- served during pore emptying. For example, at the start of the 4-min AMS pulse, the pellet temperature rose sharply from its initial 25°C to 36°C within 30 s. It then slowly decreased to 23°C over the remainder of the pulse. These trends are ex- plained below.
Discussion The experiments in this study demonstrate the significance
of vaporization under unsteady-state conditions during an ex- othermic multiphase catalytic reaction at the single-pellet level. In this section, several of the key findings are analyzed in some detail. Whenever possible, mechanistic pictures of the trans- port-reaction interactions are offered to explain the general trends in the data. Our data evaluation builds on the solid theoretical framework of drying of granular media, given the qualitative similarities in the data with and without reaction. Finally, possible implications of the single-pellet behavior with
regards to multiphase reactor scale behavior are discussed be- low.
Drying without hydrogenation: confirmation of drying theories
The trends in the drying without hydrogenation are con- sistent with accepted theories for granular solids. To show this, it is convenient to cast the data obtained, one of the cyclohexene drying runs, into the standard form in the drying literature: drying rate vs. time and vs. degree of saturation. The drying rate (rd) is defined as the rate of loss of liquid and is given by:
dm dt
rd= --
where m is the weight of liquid remaining in the pellet. The percent degree of saturation ( s d ) is the weight of liquid in the pellet normalized by the dry solid weight (m,) :
Figures 12a and 12b show the dependence of rd on time and s d for the cyclohexene-prefilled pellet exposed to helium flow- ing at 200 cm3/min. For comparison, also provided is the drying rate data for the same pellet exposed to a hydrogen flowing at 200 cm3/min. Figure 12c compares the center pellet temperature dynamics for the case with helium gas (no reac- tion) and the case with hydrogen gas (reaction).
Three distinct regimes were encountered during the drying process in the absence of reaction. The reader is referred to several excellent qualitative and quantitative descriptions of drying (Ford, 1964; Comings, 1983a,b,c; Whitaker and Chou, 1983).
At short times, when the pellet is mostly filled with liquid, an initial adjustment regime is encountered. This regime en- compasses the start of drying immediately after the liquid is stopped through the point in which the externally visible liquid disappears (from the point that the liquid is turned off to about the 80-min mark, in Figure 12a, for the case of helium gas). During this period, the drying rate is an increasing function of time. Correspondingly, rd increases as s d decreases (between approximately Sd=44 and 33%, Figure 12b, for the case of helium gas). Moreover, the heat transfer to and from the pellet is unbalanced. The drop in the center pellet temperature with time (Figure 12c) indicates that the sensible energy supplied to the pellet surface from the bulk gas and from the pellet core is insufficient to keep up with the endothermic demands of the vaporization of the liquid film. The vaporization rate in this regime is approximated by the transport of cyclohexene through a boundary layer:
where kG is the mass-transport coefficient, and p,( 7'') is the vapor pressure of cyclohexene evaluated at the surface tem- perature T,, and Pb is the bulk partial pressure of cyclohexene (zero in this experiment). The unbalanced rates of energy con-
1000 June 1993 Vol. 39, No. 6 AIChE Journal

Ell 1
without reaction dm
dt --
1 with I reaction
Time (min.)
--
reaction (4 gas)
0 10 20 30 40 50 % Saturation (dry basis)
60 90 120 150
Time (min.) Figure 12. Drying rate, rh dependence on time (a) and
degree of saturation, S,,, (b), and the pellet center temperature dependence on time (c) for the cyclohexene-liquid-prefilled pellet ex- posed to H2 (-) and He (----) gas at 490 cm3/min.
sumption by vaporization and of energy supply by heat con- duction from the pellet interior continue until the point in which the temperature at the pellet center reaches close to its minimum value. Finally, given the importance of the external transport processes, i d is a sensitive function of gas flow rate in this regime. This is evidenced by the decrease in initial vaporization rate as the flow rate is decreased (refer to Figure 5).
The extent to which the surface temperature is able to sta- bilize while liquid remains at the surface determines if a con- stant rate regime is encountered. The cusp-like local minimum in the center pellet temperature indicates that such a regime may not be formally encountered during the drying of the cyclohexene-prefilled pellet. This conclusion assumes, how-
ever, that the surface temperature exhibits a time dependence that is qualitatively similar to the center temperature depend- ence. In the time period between 80 and 85 min the approximate constant drying rate is a balancing of several factors. For example, as the surface temperature increases, the cyclohexene vapor pressure increases. At the same time, the interface re- cedes into the pellet. Indeed, our visual inspection revealed a gradual depletion of the surface liquid during this period. Complicating this picture of a recession of the drying front is the probable formation of disconnected pools of liquid in the smaller mesopores of the pellet (refer to Figure 3).
Eventually, the liquid front recedes a sufficient distance into the pellet. Then the intraparticle transport of the cyclohexene, which vaporizes at the drying front and at the isolated pools, becomes rate-controlling. This falling rate regime begins at about the 85-min point in Figure 12 for the case of helium gas. The drying rate drops sharply in the 85-90-min period and then continues to drop at a slower rate until the pellet is devoid of liquid. At sufficiently long times when the pellet becomes nearly devoid of liquid, the liquid in the inner core and smallest pores is the last to vaporize. For the helium gas case, the drying rate was essentially zero at approximately the 165-min point.
Drying with hydrogenation: a proposed mechanism The dynamics of the well-established picture of the vapor-
ization process in granular media is significantly impacted by a simultaneously occurring exothermic reaction. As one expects from an intuitive standpoint, the exothermic reaction accel- erates the drying process. With-reaction and without-reaction results are compared in Figures 12a, 12b and 12c, which un- derscore this point. Figure 12a indicates that the entire va- porization with reaction occurs within 90 min, compared to 165 min without reaction. The most obvious effect of reaction is the significant temperature rise compared to the temperature drop observed for drying without reaction (Figure 12c). It is clear that theenergy liberated by the hydrogenation is the major supply for the latent heat of vaporization. The maximum va- porization rate with reaction is almost 500% higher than the corresponding maximum value without reaction (Figure 12b).
Despite the acceleration of the pore emptying process due to the exothermic heat of reaction, the qualitative physical picture does not appear to be significantly changed. This is evidenced by the same qualitative shape of the drying rate dependence on time (Figure 12a) and on degree of saturation (Figure 12b). One point is worth noting before elaborating on this point: the production of cyclohexane by reaction and the presence of hydrogen instead of helium are not expected to have a significant effect on the overall dynamics because of the similar physical and transport properties of cyclohexene and cyclohexane on the one hand and of hydrogen and helium on the other. This point suggests that the nonreactive drying of a cyclohexane-prefilled pellet in a flowing hydrogen at- mosphere should not be much different than the cyclohexene- prefilled pellet in a helium atmosphere.
The following sequence of steps are postulated to occur and help to explain the associated dynamics of drying with reaction in the liquid-prefilled pellet:
1. Vaporization of liquid cyclohexene at the external surface of the pellet
AIChE Journal June 1993 Vol. 39, No. 6 1001

2. Counterdiffusion of gaseous cyclohexene away from and hydrogen toward the pellet surface
3. Supply of energy from pellet core and bulk gas to the interface between the liquid at the external surface and the bulk gas 4. Absorption of hydrogen into the liquid film 5 . Liquid-phase diffusion of hydrogen to active sites 6. Reaction between adsorbed cyclohexene and hydrogen
7. Liquid-phase diffusion of cyclohexane from active sites 8. Vaporization-induced dewetting of active sites near the
9. Transport of hydrogen and vaporized cyclohexene to
10. Reaction on gas-contacted active sites 11. Gas-phase diffusion of cyclohexane from active sites 12. Conduction of generated heat from reaction in gas-filled
13. Further recession of interface into pellet 14. Repetition of steps 8-12 until liquid is depleted.
During the very initial stages of drying there is some simi- larity between the cases with reaction and without reaction. The main reason is that the liquid film on the pellet surface of the pellet serves as a barrier to the initiation of the liquid- and gas-phase catalysis. A liquid-phase reaction cannot com- mence until sparingly soluble hydrogen arrives at the active sites by the sequence of gaseous transport, absorption and liquid-phase diffusion (steps 2, 4 and 5 ) . A gas-phase reaction cannot commence until the liquid film evaporates and gaseous hydrogen and cyclohexene adsorb on formerly wetted active sites: sequence of steps 1-3 and 8-9. Given that liquid-phase diffusion is a relatively slow process compared to say the ex- ternal supply rate of energy, it is probable that liquid-phase catalysis contributes little to the pore-emptying process. Rather, it is the dewetting of a fraction of active sites that initiates the rapid pore emptying with reaction.
Once the gas-phase catalytic reaction commences, the drying process accelerates during this time period. For example, in the drying-only case, the drying rate was essentially constant for the first 8-9 min (Figure 12a). In contrast, the drying rate with reaction increased by over a factor of 10. Thus, steps 2 and 9-14, which involve primarily the gas-phase reaction and transport processes, drive the pore-emptying process. The main effect is that a fraction of the energy produced by reaction conducts into the pellet to the drying front. (The remainder conducts to the surface and is removed by convection to the bulk gas.) Part of the inward-directed energy supplies the nec- essary latent heat of vaporization. The remainder heats the pellet and the contained liquid and gas. In many of the runs with cyclohexene, the center pellet temperature increased to a level above the normal boiling points of cyclohexene and cy- clohexane. This large temperature increase in turn increased the liquid component vapor pressures and therefore increased the overall driving force for mass transport.
As the liquid content drops, the diffusion distance increases for all three components involved in the reaction: for hydrogen, which is consumed in the gas-filled reaction zone; for vaporized cyclohexene, which is either consumed in the reaction zone or diffuses and convects to the surface where it is swept away; and for cyclohexane, which follows a path similar to the un- reacted cyclohexene. The drying rate falls in this regime because
on liquid-contacted active Pd sites
external surface of pellet
dewetted active sites
zone to gas-liquid interface
- 1.50 1
n 1.25
3 1.00
5 0.25
2 3 0.75 Y 6 0.50 .I
ann --- - 0 60 120 180
70 1
60
50
40
30
20 , . . , . . , . . , 0 60 120 180
Time (min.) Figure 13. Time dependence of tared pellet weight (a)
and pellet temperature (b) for the cyclohex- ene-prefilled pellet with pure H2 gas (-) and H2 gas saturated with cyclohexene (--) at 200 cm31min. The pellet was wetted from time = 0 to time = 60 min. The pure HI gas or saturated H2 gas was flowing past the pellet starting at time= 10 min.
of the increase in diffusion length. Eventually all the liquid is vaporized, and cyclohexene is consumed.
The intraparticle heat- and mass-transfer processes do not appear to be affected by the hydrogen gas flow rate once the external film has evaporated. Figure 7a, for example, reveals that an initial induction period exists prior to the onset of rapid pore emptying. This induction time increases with decreasing gas flow rate due simply to the decreased external heat- and mass-transfer rates. However, the shapes and slopes of the tared pellet weight vs. time are similar once the intraparticle processes take over.
Presaturation of feed gas: slowing the process The observed dynamic behavior of the cyclohexene-prefilled
pellet when reactant cyclohexene is present in the flowing gas demonstrates how the initial stages are dominated by the va- porization of the external liquid film. Figures 13a and 13b compare the tared pellet weight and center pellet temperature dynamics for the cases of a pure hydrogen gas feed and a feed containing hydrogen which was presaturated with cyclohexene. In both experiments pellet 2 was used with cocurrent flow. The total hydrogen flow rate in each case was 200 cm3/min. It is noted that the rapid pore emptying and temperature rise are delayed by about 10 min when cyclohexene is contained in the gas. This indicates that there is a reduced driving force for vaporization of the cyclohexene initially contained in the pellet
1002 3une 1993 Vol. 39, No. 6 AIChE Journal
(Eq. 3). For this particular run we also could not rule out the possible deposition of cyclohexene droplets on the catalyst surface because of the entrainment discussed earlier. The ac- celerated drying and reaction process does not commence until the external film is removed and the catalytic sites are exposed directly to gaseous components. It is interesting to note that once the accelerated drying does occur, the pure hydrogen and saturated hydrogen gas feed cases behave similarly. This in- dicates that the internal transport processes during the elevated temperature period are similar.
A second factor affecting the dynamics is the capillary con- densation of cyclohexene (and/or cyclohexane) in mesopores of the support. Evidence for this process is noted by the non-
1.50
1.25
1.00
0.75
0.50
0.25
0.00 60 70 80 90 100 110 120
I b l 120 1 h u
100- zero, long-time tared pellet weight value. Since cyclohexene is supplied in the feed gas, the steady state is not a zero-rate, completely dry pellet. Rather, reaction continues to occur pri- marily as a gas-phase catalytic reaction with a moderate tem- perature rise of approximately 10°C. The nonvanishing tared weight indicates that reactant cyclohexene and product cy- clohexane fill a fraction of the void volume because of their reduced volatilities in small pores. Similar behavior was ob- served by Kim and Kim (1981). In their study, biporous Pt/ A1203 pellets were exposed to an atmosphere of hydrogen and 60 70 80 90 100 110 120 nitrogen saturated with cyclohexene. Differences in rates were observed and attributed to differences in the extent of con- densation in the pellet void volume. In the current study, the observed temperature peak for the presaturated gas case was somewhat less than the pure hydrogen gas case, indicating that this pore filling had some influence on the dynamics as well. For example, the mesopores which remained filled during the
e f 80' Cyciohexene
h
'-------
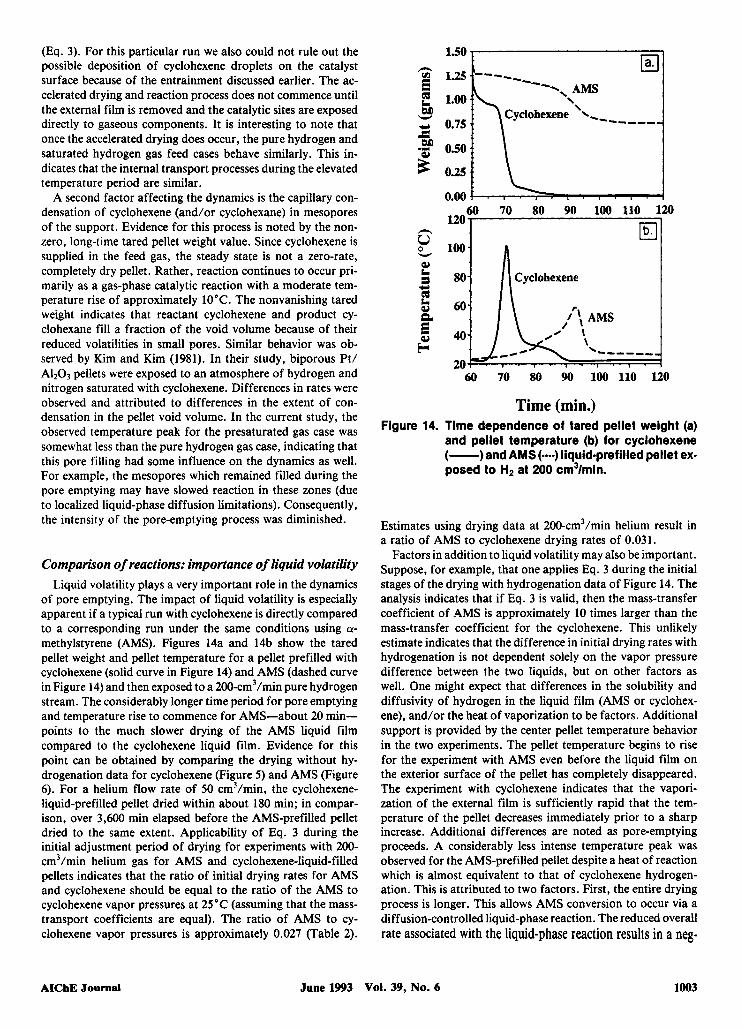
Time (min.) Figure 14. Time dependence of tared pellet weight (a)
and pellet temperature (b) for cyclohexene (-)and AMS (---) liquid-prefilled pellet ex- posed to H2 at 200 cm3/min.
pore emptying may have slowed reaction in these zones (due to localized liquid-phase diffusion limitations). Consequently, the intensity of the pore-emptying process was diminished.
Comparison of reactions: importance of liquid volatility Liquid volatility plays a very important role in the dynamics
of pore emptying. The impact of liquid volatility is especially apparent if a typical run with cyclohexene is directly compared to a corresponding run under the same conditions using a- methylstyrene (AMS). Figures 14a and 14b show the tared pellet weight and pellet temperature for a pellet prefilled with cyclohexene (solid curve in Figure 14) and AMS (dashed curve in Figure 14) and then exposed to a 200-cm3/min pure hydrogen stream. The considerably longer time period for pore emptying and temperature rise to commence for AMS-about 20 min- points to the much slower drying of the AMS liquid film compared to the cyclohexene liquid film. Evidence for this point can be obtained by comparing the drying without hy- drogenation data for cyclohexene (Figure 5) and AMS (Figure 6). For a helium flow rate of 50 cm3/min, the cyclohexene- liquid-prefilled pellet dried within about 180 min; in compar- ison, over 3,600 min elapsed before the AMS-prefilled pellet dried to the same extent. Applicability of Eq. 3 during the initial adjustment period of drying for experiments with 200- cm3/min helium gas for AMS and cyclohexene-liquid-filled pellets indicates that the ratio of initial drying rates for AMS and cyclohexene should be equal to the ratio of the AMS to cyclohexene vapor pressures at 25 "C (assuming that the mass- transport coefficients are equal). The ratio of AMS to cy- clohexene vapor pressures is approximately 0.027 (Table 2).
Estimates using drying data at 200-cm3/min helium result in a ratio of AMS to cyclohexene drying rates of 0.03 1.
Factors in addition to liquid volatility may also be important. Suppose, for example, that one applies Eq. 3 during the initial stages of the drying with hydrogenation data of Figure 14. The analysis indicates that if Eq. 3 is valid, then the mass-transfer coefficient of AMS is approximately 10 times larger than the mass-transfer coefficient for the cyclohexene. This unlikely estimate indicates that the difference in initial drying rates with hydrogenation is not dependent solely on the vapor pressure difference between the two liquids, but on other factors as well. One might expect that differences in the solubility and diffusivity of hydrogen in the liquid film (AMS or cyclohex- ene), and/or the heat of vaporization to be factors. Additional support is provided by the center pellet temperature behavior in the two experiments. The pellet temperature begins to rise for the experiment with AMS even before the liquid film on the exterior surface of the pellet has completely disappeared. The experiment with cyclohexene indicates that the vapori- zation of the external film is sufficiently rapid that the tem- perature of the pellet decreases immediately prior to a sharp increase. Additional differences are noted as pore-emptying proceeds. A considerably less intense temperature peak was observed for the AMS-prefilled pellet despite a heat of reaction which is almost equivalent to that of cyclohexene hydrogen- ation. This is attributed to two factors. First, the entire drying process is longer. This allows AMS conversion to occur via a diffusion-controlled liquid-phase reaction. The reduced overall rate associated with the liquid-phase reaction results in a neg-
AIChE Journal June 1993 Vol. 39, No. 6 1003

ligible temperature rise. Moreover, once a fraction of pores is emptied, less AMS is available to react via the more rapid and thermally intense gas-phase catalytic route. Second, an oc- curring oligomerization of AMS results in the filling of a frac- tion of the pellet with a higher molecular weight, much less volatile species. The main consequences are an alternate route for AMS which otherwise would be hydrogenated and the rendering of those active sites of the pellet that are inaccessible due to the presence of the oligimeric species. We expound on this point next.
Oligomerization of AMS The formation of the oligomeric species is suspected based
only on indirect evidence, that is, comparing drying experi- ments of an AMS-prefilled pellet and a cumene-prefilled pellet (Figure 6). The unsaturated propyl species of AMS is known to be responsible for the self-polymerization (Boundy et al., 1970a,b). Cumene, being the hydrogenated form of AMS, has a similar volatility (see Table 2), but does not have the necessary unsaturation for self-polymerization. Thus, a comparison of the drying behavior of the AMS- and cumene-filled pellets provides a sensitive, indirect probe of the oligomerization. In flowing He at 50 cm3/min, the AMS-prefilled pellet took 3,600 min to dry; the cumene-prefilled pellet took 2,100 min to dry. It is unlikely that this vast difference in drying times can be attributed to the slightly higher volatility of cumene (4.6 torr at 25°C for cumene, 2.4 torr for AMS). Rather, the likely factor is the formation of an oligomeric species with a volatility which is considerably lower than AMS. The formation of this species hinders the intraparticle transport and therefore slows the drying of the pellet. Unfortunately, composition meas- urements of material held in the pores of the AMS-prefilled pellet at long times were not attempted. Thus, an unambiguous identification of this rate-limiting process could not be made.
Liquid pulse dynamics The dynamic behavior of the hydrogen-prefilled pellet ex-
posed to a pulse of liquid is even more complex than the liquid- prefilled pellet exposed to hydrogen. In referring to the results using pulses of cyclohexene (Figure 10) and AMS (Figure 1 l), it should be noted that the total pore volume of the pellet was approximately 1.328 cm3 (see Table 3). Thus, if one assumes that all of the liquid fills the pellet pore volume without any vaporization in a pulse flowing at 1 cm3/min, then a pulse duration of 1,328 min would be sufficient to completely fill the pellet. It is evident from Figures 10a and l l a that even a pulse duration of 9 min was insufficient. This is attributed to two factors. First, the imbibition process is not an instanta- neous one; hence, a fraction of the injected liquid flowed off the pellet during the pulse. Second, some of the liquid vapor- ized during the pulse. Evidence for the former was provided by visual observation and for the latter by the pellet temper- ature during the filling process. For example, during the filling of the pellet with AMS, the temperature rose by 15°C in the 9-min pulse. This indicates that reaction occurred between hydrogen initially in the pores and AMS which vaporized. A similar temperature rise was not observed in the cyclohexene runs because of an apparent balancing between the rate of energy generation by reaction and of energy consumption by
vaporization. Indeed, a slight temperature decrease of 3-4°C occurred during the filling. This temperature drop was even more significant when the pellet was prefilled with helium.
The behavior of the pellet after the liquid pulse was stopped resembles that of the completely prefilled pellet. That is, pore emptying and temperature rise were observed. However, some new points are worth noting which are attributed to the in- complete degree of pore filling achieved once a liquid pulse is stopped. First, for both the cyclohexene (Figure 10) and AMS (Figure 11) systems there was a virtually instantaneous com- mencement in the pore emptying and associated increase in pellet temperature. This compares to the typical induction time needed in the liquid-prefilled experiments. This is most likely due to the intimate contacting between hydrogen and liquid within the pores of the partially filled pellet. That is, no drying of the external liquid film is necessary for reaction on gas- contacted active sites to commence, for example. Second, the magnitude of the temperature rise is a nonmonotonic function of the pulse size. For example, the pulse of 2-min duration gave the highest peak center pellet temperature in both reaction systems. This trend indicates that initial supplies of both hy- drogen and the liquid reactant are important factors. A suf-. ficient fraction of hydrogen-filled pores helps to initiate a gas- phase catalytic reaction. A sufficient supply of liquid reactant is necessary to react with the hydrogen.
Concluding Remarks The single-pellet reactor experiments provide fundamental
insight about multiphase reaction-transport interactions with phase transition. The data reveal a sensitive interplay between the exothermic reaction and the endothermic vaporization, coupled to the external and internal mass-transport processes. For the case of drying with hydrogenation, departure from traditional drying theory is noticed in the initial adjustment period due to the supply rate of the latent heat of vaporization, rate of heat conduction and rate of heat release by exothermic chemical reaction. In general, drying with hydrogenation is shown to be much faster than drying without hydrogenation. Reaction on dewetted sites accelerates the pore emptying proc- ess by providing an effective source of energy in the immediate vicinity of the liquid front. The local temperature increase elevates the liquid volatility and therefore increases the driving force for the transport-limited vaporization.
The single-pellet reactor approach also provides valuable information about local unsteady behavior within the fixed- bed multiphase reactor. The single-pellet experiments help to identify situations in which hot spots may form, for example. Some hypotheses put forth by previous investigators who used fixed-bed reactors are confirmed at a more local level. For example, an interruption in liquid flow over the catalyst with- out a corresponding stoppage in gaseous reactant is an ideal scenario for a local hot spot to form. The experiments dem- onstrate that without the heat removal of the flowing liquid, and with the direct contact of stagnant liquid and flowing gas, drying of the catalyst results. The rate of drying depends on the volatility of the liquid. However, if sufficient time elapses that a fraction of catalyst becomes exposed to the gas, a much more rapid gas-phase catalytic reaction occurs with an accom- panying temperature excursion. These experiments provide in- formation that may be crucial in avoiding hot spots. More
1004 June 1993 Vol. 39, No. 6 AIChE Journal

specifically, the time lag for overheating to occur and the temperature rise help one to assess the dynamics and intensity of the reaction-driven vaporization process. Within a reactor, such a local situation may propagate because of its auto- catalytic nature. That is, the formation of dry spots by va- porization leads to both higher rates and energy release. This energy is transferred to other locations by conduction and convection where more liquid is vaporized.
Future experiments should focus on communication between pellets in sustaining and promoting the local hot spot. For example, a group of catalyst pellets could be arranged so that heat- and mass-transfer processes between pellets could be examined.
The single-pellet data also provide insight into catalyst per- formance during periodic operation. The deliberate creation of a hot, dry spot clearly results in higher catalyst temperatures. While rates were not measured in this study, one may conjec- ture that the higher temperatures offer higher rates. Following the pioneering studies of Haure and coworkers (1989), an in- triguing notion is that controlled hot spot formation by pe- riodic on-off liquid flow may result in substantially higher conversions compared to continuous liquid flow. Also, control algorithms along the lines of Hanika and coworkers (1990) could be further developed to capitalize on the multiphase vaporization phenomena. The single pellet approach could provide a useful way of establishing optimal liquid flow pro- tocols.
Acknowledgment We appreciate the financial support of a National Science Founda-
tion grant (no. CTS-8920650). We are grateful for the kind assistance of Michael E. De Cheke of the University of Massachusetts Analytical Chemistry Laboratory who carried out atomic absorption measure- ments and Louis Raboin of the University of Massachusetts Depart- ment of Polymer Science who performed the SEM and X-ray microanalysis work.
Notation kc = m = m, =
Pv = r, = s, = T, =
P b =
external mass-transfer coefficient weight of liquid held up in pellet (tared pellet weight) dry weight of solid partial pressure in bulk gas vapor pressure drying rate degree of saturation, dry pellet basis surface pellet temperature
Literature Cited Babcock, B. D., G. T. Mejdell, and 0. A. Hougen, “Catalyzed Gas-
Liquid Reactions in Trickling-bed Reactors,” AIChE J . , 3(3), 366 ( 1957).
Boundy, R. H., R. F. Boyer, and S. M. Stoesser, Styrene: ItsPolymers, Copolymers, and Derivatives: I , Hafner Publishing Co., Darien, CT (1970a).
Boundy, R. H., R. F. Boyer, and S. M. Stoesser, Styrene: Its Polymers, Copolymers, and Derivatives: II , Hafner Publishing Co., Darien, CT (1970b).
Cini, P., and M. P. Harold, “Experimental Study of the Tubular Multiphase Catalyst,” AIChE J., 37(7), 997 (1991).
Comings, E. W., “Contributions of T. K. Sherwood and Associates to the Field of Drying: 1,” Drying Tech., 1(2), 249 (1983a).
Comings, E. W., “Contributions of T. K. Sherwood and Associates to the Field of Drying: 2,” Drying Tech., 2(1), 117 (1983b).
Comings, E. W., “Contributions of T. K. Sherwood and Associates to the Field of Drying: 3,” Drying Tech., 2(2), 265 (1983~).
Comer, W. C., J. Horowitz, and A. M. Lane, “Correcting Poro- simetry Data to Obtain the Actual Pore and Throat Size Distri- butions,” Diffusion and Convection in Porous Catalysts, AIChE Symp. Ser., 84(226) (1988).
Comer, W. C., A. M. Lane, K. M. Ng, and M. Goldblatt, “Meas- urement of the Morphology of High Surface Area Solids: Poro- simetry of Agglomerated Particles,” J. Catal., 83, 336 (1983).
Drobyshevich, V. I., and V. A. Kirillov, “Modeling of Multiphase Processes on a Catalyst Grain,” Real Problems of Applied Math- ematics and Mathematical Modelling, in Russian, Nauka, Sib. Otd., Novosibirsk (1982).
Eigenberger, G., and U. Wegerle, “Runaway in an Industrial Hydro- genation Reactor,” Chem. Reaction Eng. Symp., Boston, 133 (1982).
El-Hisnawi, A. A., M. P. Dudukovic, and P. L. Mills, “Trickle-Bed Reactors: Dynamic Tracer Tests, Reaction Studies, and Modeling of Reactor Performance,” ACS Symp. Ser., No. 196, 421 (1982).
Ford, R. W., Drying, Inst. of Ceramics Textbook Ser., Maclaren and Sons, London (1964).
Funk, G . A., “Effect of Wetting on Catalytic Gas-Liquid Reactions,” PhD Diss., Univ. of Massachusetts (1990).
Funk, G. A., M. P. Harold, and K. M. Ng, “Experimental Study of Reaction in a Partially Wetted Catalytic Pellet,” AIChE J., 37(2), 202 (1991).
Germain, A. H., A. G. Lefebvre, and G. A. L’Homme, “Experimental Study of Catalytic Trickle Bed Reactor,” Adv. Chem. Ser., No. 133, 164 (1974).
Gonzo, E. E., and M. Boudart, “Catalytic Hydrogenation of Cy- clohexene: 3. Gas-Phase and Liquid-Phase Reaction on Supported Palladium,” J. Catal., 52, 462 (1978).
Hanika, J., “The Appearance of Hot Spots in Trickle Bed Reactor During Cyclohexene Hydrogenation,” 5th Yugoslavian-Austrian- Italian Chem. Eng. Conf., Portorez (Sept. 16-18, 1986).
Hanika, J., and V. Ehlova, “Effect of Internal Diffusion on Kinetics of Liquid Phase Hydrogenation and Disproportionation of Cyclo- hexene on Palladium Catalysts,” Collect. Czech. Chem. Commun., 54, 3003 (1989).
Hanika, J., R. Lange, and F. Turek, “Computer-aided Control of a Laboratory Trickle Bed Reactor,” Chem. Eng. Process., 28, 23 (1990).
Hanika, J., K. Sporka, V. Ruzicka, and J. Hrstka, “Measurement of Axial Temperature Profiles in an Adiabatic Trickle Bed Reactor,” Chem. Eng. J. , 12, 193 (1976).
Hanika, J., K. Sporka, V. Ruzicka, and J. Krausova, “Qualitative Observations of Heat and Mass Transfer Effects on the Behaviour of a Trickle Bed Reactor,” Chem. Eng. Cornmun., 2 , 19 (1975).
Hanika, J., K. Sporka, Z. Ulbrichova, J. Novak, and V. Ruzicka, “The Hydrogenation of Cyclohexene in a Laboratory Trickle-Bed Reactor,” CON. Czech. Chem. Commun., 39, 210 (1974).
Hanika, J., V. Vosecky, and V. Ruzicka, “Dynamic Behaviour of the Laboratory Trickle Bed Reactor,” Chem. Eng. J., 21, 108 (1981).
Harold, M. P., “Impact of Wetting in Multiphase Catalytic Reaction Systems,” Computer Aided Design of Catalysts, 391. Marcel Dekker, New York (1993).
Harold, M. P., and P. C. Watson, “Bimolecular Exothermic Reaction with Vaporization in the Half-Wetted Slab Catalyst,” Chem. Eng. Sci., 48, 981 (1993).
Haure, P. M., S. M. Bogdashev, M. Bunimovich, A. N. Stegasov, R. R. Hudgins, and P. L. Silveston, “Thermal Waves in the Periodic Operation of a Trickle-Bed Reactor,” Chem. Eng. Sci., 45(8), 2255 (1990).
Haure, P. M., R. R. Hudgins, andP. L. Silveston, “PeriodicOperation of a Trickle-Bed Reactor,” AIChE J . , 35(9), 1437 (1989).
Herskowitz, M., R. G. Carbonell, and J. M. Smith, “Effectiveness Factors and Mass Transfer in Trickle-Bed Reactors,” AIChE J., 25(2), 272 (1979).
Jaffe, S. J., “Hot Spot Simulation in Commercial Hydrogenation Processes,” Ind. Eng. Chem., ProcessDes. Dev., 15(3), 410 (1976).
Kim, D. H., and Y. G. Kim, “An Experimental Study of Multiple Steady States in a Porous Catalyst Due to Phase Transition,” J. Chem. Eng. Jap., 14(4), 311 (1981a).
Kuzin, N. A., and A. N. Stegasov, “Low-Frequency Temperature Oscillations of Catalyst Pellets in Exothermic Reactions with Liquid- Gas Phase Transitions,” Khim. Fiz., 5(12), 1702 (1986).
AIChE Journal June 1993 Vot. 39, No. 6 1005

Lange, R., J. Hanika, and F. Turek, “Periodic Operation for Trickle- Bed Reactors,” Int. Cong. of Chem. Eng., Chemical Equipment Design and Automation, Praha, Czechoslovakia, 12 (1990).
Lapidus, G. R., A M. Lane, K. M. Ng, and W. C. Conner, “Inter- pretation of Mercury Porosimetry Data Using a Pore-Throat Net- work Model,” Chem. Eng. Commun., 38, 33 (1985).
MacGregor, S., “CENTREL,” software, Chasco Control Industries, Manomet, MA (1990).
Madon, R. J., J. P. O’Connell, and M. Boudart, “Catalytic Hydro- genation of Cyclohexene: Part 11. Liquid Phase Reaction on Sup- ported Platinum in a Gradientless Slurry Reactor,” AIChE J . , 24(5), 904 (1978).
McManus, R. L., G. A. Funk, M. P, Harold, and K. M. Ng, “Ex- perimental Study of Reaction in a Trickle-Bed Reactor with Liquid Maldistribution,” Ind. Eng. Chem. Res., 32(3), 570 (1993).
Morita, S., and J. M. Smith, “Mass Transfer and Contacting Effi- ciency in a Trickle-Bed Reactor,” Ind. Eng. Chem. Fundam., 17(2), 113 (1978).
Ruzicka, J., and J. Hanika, “Phase Transition Effect in Hydrogen- ation of Cyclohexene in the Model Trickle Bed Reactor,” Int. Cong. of Chem. Eng., Chemical Equipment Design and Automation, Praha, Czechoslovakia, 11 (1990).
Satterfield, C. N., A. A. Pelossof, and T. K. Sherwood, “Mass Trans- fer Limitations in a Trickle-Bed Reactor,” AIChE J., 15,226 (1969).
Segal, E., R. J. Madon, and M. Boudart, “Catalytic Hydrogenation
of Cyclohexene: 1. Vapor-Phase Reaction on Supported Platinum,” J. Catal., 52, 45 (1978).
Stanek, V., and J. Hanika, “The Effect of Liquid Flow Distribution on Catalytic Hydrogenation of Cyclohexene in an Adiabatic Trickle- Bed Reactor,” Chem. Eng. Sci., 37(9), 1283 (1982).
Turek, F., and R. Lange, “Mass Transfer in Trickle-Bed Reactors at Low Reynolds Numbers,” Chem. Eng. Sci., 36, 569 (1981).
Van Welsenaere, R. J., and G. F. Froment, “Parametric Sensitivity and Runaway in Fixed Bed Catalytic Reactors,” Chem. Eng. Sci., 25, 1503 (1970).
Watson, P. C., “An Experimental and Modeling Study of Phase Tran- sition and Exothermic Reaction in the Multiphase Catalyst Pellet,” PhD Diss., Univ. of Massachusetts (1993).
Watson, P. C., and M. P. Harold, “Rate Enhancement and Multi- plicity in a Partially Wetted and Filled Catalytic Pellet: an Exper- imental Study,” AIChE J . , accepted (1993).
Whitaker, S . , and W. T. Chou, Drying Granular Porous Media- Theory and Experiment, 1(1), 3 (1983).
White, D. E., M. Litt, and G. J. I. Heymach, “Diffusion-Limited Heterogeneous Catalytic Reactions on a Rotating Disk: 1. Hydro- genation of a-Methylstyrene,” Ind. Eng. Chem., Fundam., l3(2), 143 (1974).
Manuscript received July 7, 1992, and revision received Nov. 23, 1992.
1006 June 1993 Vol. 39, No. 6 AIChE Journal