Embed Size (px)
Citation preview

Department of Agriculture Fisheries and FoodAgriculture House, Kildare Street, Dublin 2, Ireland
The Marine Institute, Fisheries Science Services,Rinville, Oranmore, Galway, Ireland
An Bord Iascaigh Mhara (Irish Sea Fisheries Board),Crofton Road, Dun Laoghaire, Co Dublin, Ireland
EU Council Regulation 199/2008Concerning the establishment of a community framework for the collection, management
and use of data in the fisheries sector and support for scientific advice regarding the Common Fisheries Policy
Technical Report 2009IRELAND
28th May 2010

I. General framework...........................................................................................................3
II. National data collection organisation..............................................................................3
II.A National correspondent and participating institutes.....................................................3
II.B Regional and International coordination......................................................................5
II.B.1 Attendance of international meetings..............................................................................5II.B.2 Follow-up of regional and international recommendations..............................................5
III. Module of the evaluation of the fishing sector............................................7
III.A General description of the fishing sector....................................................................7
III.B.2 Data quality: Results and deviation from NP proposal..............................9III.B.3 Follow-up of Regional and international recommendations....................9III.B.4 Actions to avoid shortfalls..................................................................................10
III.C Metier-related variables.............................................................................................11
III.C.1 Achievements: Results and deviation from NP proposal........................11III.C.2 Data quality: Results and deviation from NP proposal............................11III.C.3 Follow-up of Regional and international recommendations..........................................14III.C.4 Actions to avoid shortfalls..............................................................................................14
III.D Recreational fisheries................................................................................................15
III.D.1 Achievements: Results and deviation from NP proposal...............................................15III.D.2 Data quality: Results and deviation from NP proposal..................................................15III.D.3 Follow-up of Regional and international recommendations..........................................16III.D.4 Actions to avoid shortfalls..............................................................................................16
III.E Stock-related variables..............................................................................................17
III.E.1 Achievements: Results and deviation from NP proposal................................................17III.E.2 Data quality: Results and deviation from NP proposale.................................................17III.E.3 Follow-up of Regional and international recommendations..........................................18III.E.4 Actions to avoid shortfalls..............................................................................................18
III.F Transversal variables.................................................................................................19
III.F.1 Capacity..................................................................................................................19
III.F.1.1 Achievements: Results and deviation from NP proposal.............................................19III.F.1.2 Data quality: Results and deviation from NP proposal................................................19III.F.1.3 Actions to avoid shortfalls...........................................................................................19
III.F.2 Effort.......................................................................................................................19
III.F.2.1 Achievements: Results and deviation from NP proposal.............................................19III.F.2.2 Data quality: Results and deviation from NP proposal................................................20III.F.2.3 Follow-up of Regional and international recommendations.......................................21III.F.2.4: Actions to avoid shortfalls..........................................................................................21
1

III.F.3 Landings.................................................................................................................21
III.F.3.1 Achievements: Results and deviation from NP proposal.............................................21III.F.3.2 Data quality: Results and deviation from NP proposal................................................21III.F.3.3 Follow-up of Regional and international recommendations.......................................21III.F.3.4 Actions to avoid shortfalls...........................................................................................21
III.G Research surveys at sea.............................................................................................22
III.G.1 Achievements: Results and deviation from NP proposal...............................................22III.G.2 Data quality: Results and deviation from NP proposal..................................................22III.G.3 Follow-up of Regional and international recommendations..........................................22III.G.4 Actions to avoid shortfalls.............................................................................................22
IV. Module of the evaluation of the economic situation of the aquaculture and...............23
processing industry............................................................................................................23
IV.A Collection of data concerning the aquaculture.........................................................23
IV.A.1 Achievements: Results and deviation from NP proposal...............................................23IV.A.2 Data quality: Results and deviation from NP proposal..................................................23IV.A.3 Follow-up of Regional and international recommendations.........................................23IV.A.4 Actions to avoid shortfalls.............................................................................................23
IV.B Collection of data concerning the processing industry.............................................23
IV.B.1 Achievements: Results and deviation from NP proposal...............................................24IV.B.2 Data quality: Results and deviation from NP proposal..................................................24IV.B.3 Follow-up of Regional and international recommendations..........................................24IV.B.4: Actions to avoid shortfalls.............................................................................................24
V. Module of evaluation of the effects of the fishing sector on the marine ecosystem.....25
V.1 Achievements: Results and deviation from NP proposal...................................................25V.2 Actions to avoid shortfalls..................................................................................................26
VI. Module for management and use of the data...............................................................27
VI.A Management of the data............................................................................................27
VI.B Use of the data...........................................................................................................28
VI.1 Achievements: Results and deviation from NP proposal..................................................28VI.2 Actions to avoid shortfalls.................................................................................................29
VII. Follow-up of STECF recommendations.....................................................................30
VIII. List of acronyms and abbreviations..........................................................................32
IX. Comments, suggestions and reflections.......................................................................35
X. References.....................................................................................................................35
XI. Annexes.......................................................................................................................36
2
I. General frameworkThe Marine Institute has been delegated responsibility by its parent government department, Department of Agriculture Fisheries and Food (DAFF) to organise and co-ordinate Irelands obligations under the DCF and the MI has therefore compiled this document as the Technical report on 2009 sampling activity for Ireland. This programme addresses the following EU Commission Regulation (199/2008/EC) (adopting a multi annual community programme pursuant to Council regulation (EC) No 199/2008 establishing a community framework for the collection, management and use of data in the fisheries sector and support for scientific advice regarding the Common Fisheries Policy), The general framework presented adheres to the most recent guidelines, (version 2009) as agreed and circulated by STECF in 2010.
II. National data collection organisation
II.A National correspondent and participating institutes
National Correspondent for Ireland Dr. Frank O’ Brien,The Marine Institute (MI)Fisheries Science Services,Rinville,Oranmore,Co. Galway.IRELANDPhone: 00353 91 387200Fax: 00353 91 [email protected]
Participating InstitutesThe Irish National Programme was conducted in close co-operation between three organisations in Ireland;
Department of Department of Agriculture, Fisheries and Food (DAFF)DAFF is the main governmental department with responsibility for sea fisheries policy, and management.
The Dept. of Agriculture, Fisheries and Food.Agriculture House,Kildare Street,Dublin 2.Phone : 00353 1 6072000 also 1890 200 510.Fax : 00353 1 6782449www.DAFF.gov.ie
3
The Marine Institute (MI) The MI is a semi state marine research organisation charged by DAFF with the collection of scientific data on the fisheries sector.
The Marine InstituteRinville,Oranmore.Co. GalwayPhone: 00353 91387200Fax : 00353 91387201www.marine.ie
An Board Iascaigh Mhara (BIM – The Irish Sea Fisheries Board)BIM is a semi state sea fisheries development agency charged by DAFF with the collection of economic data on the fisheries sector.
Board Iascaigh MharaPO Box 12Crofton Road.Dun LaoghaireCo. Dublin.Phone : 00353 1 2144100Fax : 00535 1 2144119www.bim.ie
National co – OrdinationA National co – Ordination meeting was held in The Marine Institute, Galway in 2009 to ensure all participating institutes were clear on their roles and responsibilities regarding the DCF programme.
Main Outcomes. SGRN Comments on the 2008 Technical Report Submission were
discussed and actioned. All inputs to 2009 reports: cost statement/technical report and the re
submission of the 2010 programme were discussed, coordinated and agreed. And as a consequence all 2009 reports were submitted on time.
Progress reports on tasks for the present year were discussed and corrective actions agreed if not on track.
4

II.B Regional and International coordination
II.B.1 Attendance of international meetingsDuring 2009 Ireland participated fully at the relevant ICES planning groups, study groups, working groups, regional co-ordination meetings and workshops which are directly related to data collection requirements under Commission Regulation (EC) 199/2008.
Attendance at International meetings in 2009 is described in Table II.B.1.
II.B.2 Follow-up of regional and international recommendations
Below are the recommendations of the North Atlantic RCM, which Ireland participated at in 2008, and whose recommendations were actioned in 2009. Ireland does not participate at any other RCM.
RCM recommendations and updating of the National Programmes
Considering the delayed implementation of the revised DCR regulation and the tardy RCM venues in 2008, the RCM-NA recommends that any modifications suggested by the RCM be addressed with track changes in MS’s NPs before SGRN evaluation in mid-February 2009.Action: As Requested any changes were highlighted.
Métier variables : Harmonisation and preparation of exchange data
In order to use the time of the RCM more efficient, the pre-processing of the exchange data tables, namely the merging of the data on fisheries statistics and planned sampling NP proposal tables in the NPs, for the harmonisation of the NPs, including the quality checks, should be carried out before the next RCM.Action: The NP tables were completed in accordance with the guidelines.
Métier variables : Naming conventionsThe RCM-NA recommends that all MS should follow strictly the naming conventions for reporting the sampling and statistics information. To that aim, MS are invited to investigate closely on the mesh size range actually used.The SGRN Guidelines for NP proposals should be revised in order to ensure unambiguous coding of the métiers and fishing grounds and to stress the importance to adhere to these rules.
5

Action: In 2009, Tables IIIC and IIIE were resubmitted to the commission after cross checking them with the reference tables provided. RCM gear, target species, and fishing ground codification was adhered to within table III.C.1 of the 2011-2013 submission.
6

Métier variables : Description of métiers – All areasIn the NP proposals, a short description of all métiers selected by the 90% ranking procedure should be provided. Such a table would enable RCM to identify whether a métier with the same name covers the same or different fisheries in different NP. Moreover, the RCM-NA recommends MS to investigate on the mesh size ranges actually used in their fisheries and describes more precisely the métiers operating with bottom trawls with the objectives of defining possible common métiers at the national level (level 7).Action: Descriptions are provided in the 2011-2013 submission. Actual mesh size ranges were provided for each métier where mesh size information was appropriate in the 2009 – 2010 original submission, however these were updated in accordance with the reference tables after recommendation from the 2010 RCM.
Stock variables : Sampling intensities- Sole VIIbc –need for assessment data for this stock to be reviewed.- Sole VIIhjk – Belgium and France to instigate sampling.- Sole VIIa – New agreement on international ALK see section XXX. Spain
to provide area breakdown.- Cod VIIa - Belgium to instigate sampling- Cod VIa - France to instigate sampling- Saithe - Germany to provide breakdown by area.- Saithe in area VII, VIII - need for assessment data for this stock to be
reviewed.- Pollack - All areas except IX, X - France to instigate sampling.- Pollack in IX, X - need for assessment data for this stock to be
reviewed.- Hake in VIII/ IX, X – Spain and Portugal to review sampling levels once
area split defined.- Plaice in VIIbc – need for assessment data for this stock be reviewed.- Plaice in IX – need for assessment data for this stock be reviewed.- Plaice - Belgium to provide landings breakdown for VIId / VIIe- Plaice - France to instigate sampling in VIIe, VIIfg and VIII- Dab - need for assessment data for this stock to be reviewed.
Action: No specific actions assigned to Ireland here.
Stock variables : Data quality - Case studyThe RCM-NA recommends that all MS take part in the case study on spatial aspects on growth patterns for Megrim spp. by submitting data to France using the template in Annex 7 (Megrim).Action: No request was ever forthcoming for data for this particular case study.
7

III. Module of the evaluation of the fishing sector
III.A General description of the fishing sectorThe Irish fishing fleet consists of a little over 1,400 vessels and is divided into 5 segments; polyvalent, pelagic trawl, specific bivalve, aquaculture and beam trawl. Inshore vessels (<10m) are also sampled under the DCR and are included in the polyvalent, specific bivalve and aquaculture segments. There are about 6,000 people working in the fishing fleet associated activities. The majority of Irish fishing, data collection and sampling activity is concentrated the ICES Sub-areas around Ireland VI and VII where Irish vessels are engaged in demersal, pelagic, industrial, deep water and tuna-like fishes (Table III A 1). The pelagic fishery targeting mackerel and horse mackerel also operates in the II, IIIa, IV. Some pelagic landings in those fisheries are landed in the UK–Scotland and Norway where scientists in those countries sample them. There are minor demersal and deepwater fisheries in II and IV where Ireland has a small share of an EC quota for cod and other species in Norwegian waters. The Irish European eel fishery is a relatively small inland and estuarine fishery (total annual declared catch of approximately 120t). A national vessel decommissioning scheme was introduced in 2008 and is anticipated to remove 47 vessels from the register. The decommissioning programme is aimed at vessels older than 10 years and greater than 18m, premium rates have been applied to vessels engaged in the pelagic and whitefish fisheries.
During 2008/2009 46 Irish vessels were permanently removed form the fleet register; this amounted to 6,913GT’s. The decommissioning uptake varied between metiers. Table IIIa.i shows the breakdown based on the fleet composition in 2007. Of the vessels active in 2007, 46 were decommissioned in the subsequent year, representing 18% of the total capacity expressed in gross tonnes. However, the percentage removed varied considerably across metier; with the Scottish Seine (SSC) and the Beam Trawl fleet (TBB) seeing over 50% of the 2007 levels removed. The exit of this level of effort from these metier groups will likely have resulted in reduced sampling opportunities both ashore and at sea, particularly given the comparatively small size of these fleets relative to, for example the OTB fleets, as the SSC and TBB fleets only represent 1 and 5% of the total tonnage of the entire Irish fleet.
Metier GNS_DEF OTB_CRU OTB_DEF SSC_DEF TBB_DEFDecom (GT) 1424 8525 7953 1846 4092Non-decom (GT) 3212 35393 62026 1540 5496Fleet (GT) 4636 43918 69979 3386 9588% Decom 31% 19% 11% 55% 43%
Table 111.A.1 Proportion of Irish fleet decommissioned in 2008/2009 relative to fleet structure in 2007 expressed in gross tonnage by metier (gear and target assemblage).
8

III.B Economic variablesBaltic Sea (ICES areas III b-d), North Sea (ICES areas IIIa, IV and VIId) and Eastern Arctic (ICES areas I and II), and North Atlantic (ICES areas V-XIV and NAFO areas)
III.B.1 Achievements: Results and deviation from NP proposalSee tables III.B.1, III.B.2 and III.B.3
Data sources and Results
The data sources for the implementation of the NP are: Fleet register information from the Department of Agriculture, Fisheries
and Food (DAFF), Log sheet information from DAFF, Voluntary questionnaire information, returned from vessel owners
targeted for the annual economic survey, Mandatory questionnaire information, returned from vessel owners
when applying for government grant aid, End of year accountant’s reports, from certified accountants,
containing income and earnings and balance sheet details, Voluntary questionnaire information from interviews with vessel
owners.
The target population is the “commercial fishing fleet” in accordance with Article 2.2 of the DCR. The structure of the fishing fleet, for 2007, is provided in table III.B.1 under “total population no.” and represents all vessels on the national fishing fleet register in 2008 as provided by DAFF, both active and inactive as given in the NP for 2008. The target population segments are defined by the overall length of the vessels and main fishing methods, in accordance with Appendix III of Commission Regulation EC 1639/2001, and hence, are fully compliant with the DCR regulations. Discrepancies between the 2007 fleet segments and those from the most recent information, are due, in part, to differences in segmentation of the <12m fleet.
To identify the sample sizes, necessary to achieve the required level of precision for each of the fleet segments, as defined in Appendix III, BIM employed analytical methods recommended by independent statistical consultants, using historical, economic data in conjunction with the fleet structure. The sampling frame is reported in Table III.B.1 under the column heading “planned sample no”. On the recommendation of statistical consultants, all vessels over 12 meters in length, regardless of their level of activity in 2008, were polled in order to maximise the return rate from the postal survey. Economic data on inshore vessels from DCR fleet segments, less than 12 metres overall length, were obtained under the co-funded Sentinel Vessel Programme, to collect biological and economic data from these fleets. The number of vessels in this programme was increased in 2009.
Following on from lessons learned from previous years’ economic surveys, and in the knowledge that compliance with the survey was not going to be a condition of fishing licence renewal, it was made mandatory from 2006, for all
9

vessel owners to submit economic data to qualify for vessel related EU and National grant aid in excess of €6,500. In an effort to increase the number of returns, all EU and National grants aid applications, from 2010 onwards, are required to complete an economic survey form.
Following advice and input from the industry, the timing of the 2009 survey was scheduled to coincide with the final date for submission of tax returns for the previous financial year. This was intended to encourage the active participation of fishermen and their accountant’s in providing the relevant data at a single and convenient time of the year.
Gross value of landings for the offshore fleet was determined as the product of the landings by volume (logbook data) and contemporary fish prices, as provided by DAFF.
III.B.2 Data quality: Results and deviation from NP proposal
Due to the voluntary nature of the survey, it is not possible to guarantee that the sampling levels of the national programme are achieved. As a result and due to the non-return of voluntary, economic survey forms by vessels owners, in 2009 (which collects data for 2008), only 6.5% of the proposed sample design has been achieved, to date. This is a significant underestimation of the returns rate predicted in the 2008 Technical Report. The return of 2007 data is also lower than expected due to the voluntary nature of the economic survey.
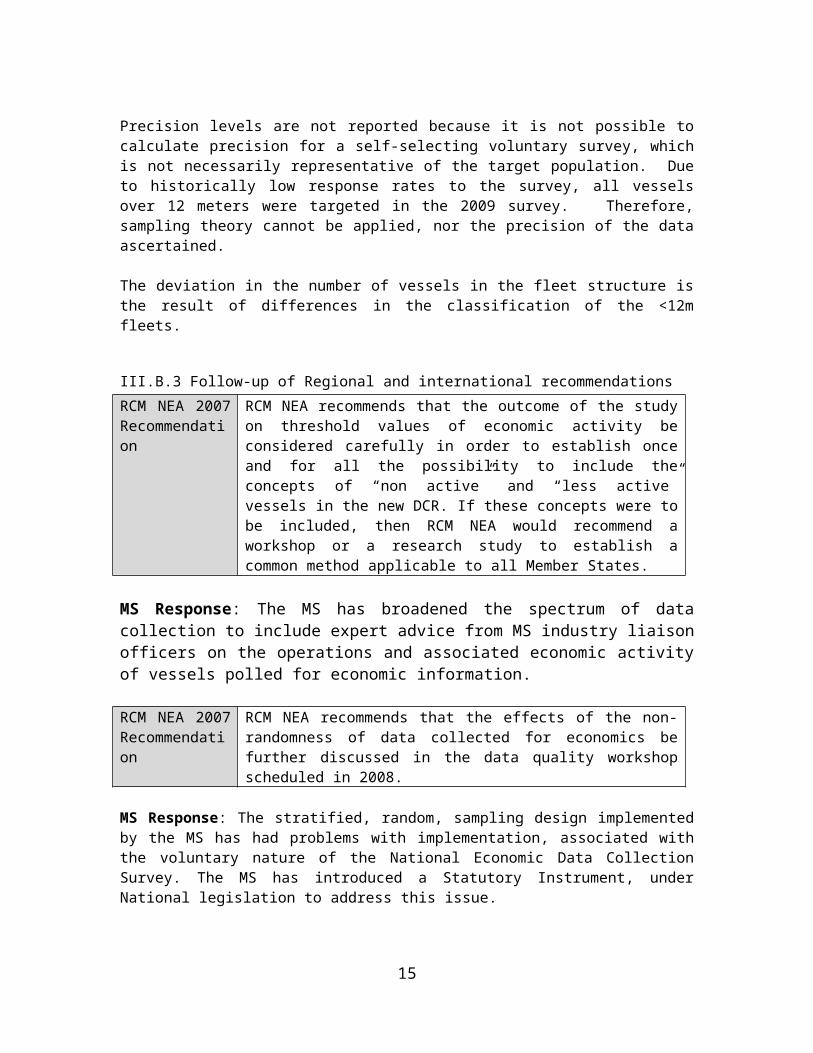
Precision levels are not reported because it is not possible to calculate precision for a self-selecting voluntary survey, which is not necessarily representative of the target population. Due to historically low response rates to the survey, all vessels over 12 meters were targeted in the 2009 survey. Therefore, sampling theory cannot be applied, nor the precision of the data ascertained.
The deviation in the number of vessels in the fleet structure is the result of differences in the classification of the <12m fleets.
III.B.3 Follow-up of Regional and international recommendationsRCM NEA 2007 Recommendation
RCM NEA recommends that the outcome of the study on threshold values of economic activity be considered carefully in order to establish once and for all the possibility to include the concepts of “non active” and “less active” vessels in the new DCR. If these concepts were to be included, then RCM NEA would recommend a workshop or a research study to establish a common method applicable to all Member States.
MS Response: The MS has broadened the spectrum of data collection to include expert advice from MS industry liaison officers on the operations and associated economic activity of vessels polled for economic information.
RCM NEA 2007 Recommendation
RCM NEA recommends that the effects of the non-randomness of data collected for economics be further discussed in the data quality workshop
10
scheduled in 2008.
MS Response: The stratified, random, sampling design implemented by the MS has had problems with implementation, associated with the voluntary nature of the National Economic Data Collection Survey. The MS has introduced a Statutory Instrument, under National legislation to address this issue.
III.B.4 Actions to avoid shortfallsThe Member State is fully aware of its obligations under the DCR in relation to population coverage and the reporting of precision. However, as it is a voluntary survey, success is dependent on industry cooperation to achieve the required level of sampling as described in the National Programme. Mindful of the limitations of a voluntary survey, the following actions have been taken to increase the response rates to present and future surveys:
In the 2008 Technical report it was stated that ‘In 2009 it is anticipated that national legislation will be introduced that will make the provision of economic data mandatory for all enterprises involved in the seafood sector that come under the remit of the DCR, which will guarantee compliance with all future DCR National Programmes for collection of economic data; This legislation was introduced under S.I. No. 132/2010 — European Communities (Data Collection in the Fisheries Sector) Regulations in 2010. This provides for data collection officers who, in order to carry out his or her duties shall have access to all records, commercial documents including contracts, log books and any other material as is necessary to fulfil the information requirements under the Commission Decision This will provide for full compliance for the 2010 survey.
Infrastructural issues are been addressed and there are plans to appoint new staff to work on DCR matters.
It will remain mandatory for any grantee receiving EU and National grant aid to complete an economic assessment form.
The economic assessment forms have been designed to mirror an accountant’s end of year financial accounts to improve the quality of the data received and ease the burden on industry to comply with the survey;
The 2009 economic assessment form requests financial data for 2007 and 2008 in an attempt to increase the achieved sampling level for 2007. In previous years, this has doubled the number of returns. Due to the low response from the 2009 survey, the predicted number of returns for 2008 was not met.
Finally, discussions are continuing with our parent body, the Department of Agriculture, Fisheries, and Food, to put in place a data transfer protocol that will ensure all data requests are met with in an efficient and timely manner.
EU Query 29-9-10 and Ireland Response Oct13th, 2010III.B Economic variables
Tables III.B.1 and III.B.2 do not comply with NP and the guidelines in many respects. Ireland shall resubmit corrected tables.
Response: The NP explained that non-transversal variables, collected through the annual economic survey, would be validated and available approximately 15 months from the end of the reference year: data for a particular reference year is collected at the start of November of the following year (to coincide with the final submission date for tax returns for the previous year). Therefore the 2009 NP incorrectly states that the ‘2009 data collection programme will collect 2008 economic data from fleet segments based on the EU register as it was on the 1st January 2008. Similarly, the 2010 programme will be based on the fleet register on the 1st January 2009’. The 2009 data collection programme collected data for the reference year 2007. Therefore Tables III.B.1 and III.B.2 refer to the
11
sampling rates achieved in 2007 for the active fleet in that year. These data have been updated to include supplementary data collected during the 2010 data collection programme. The time lag in data collection will be rectified in future work programmes and the annual economic survey conducted in 2011 will collect economic data for the reference years 2009 and 2010
In Table III B.3 the reference year should be 2008. Variable groups should be named in accordance with the regulation. In case of a census, the type of error should be bias; "None" is not an appropriate accuracy indicator.
Response: In Table IIIB.3 the variable groups have been corrected to reflect the naming structure in accordance with the regulation. Information relating to the; type of data collection scheme, type of error, and accuracy indicators have been corrected.
12

III.C Metier-related variablesNorth Atlantic ( ICES areas V-XIV and NAFO areas) andNorth Sea ( ICES areas IIIa,IV and VIId and Eastern Arctic ( ICES I and II)
III.C.1 Achievements: Results and deviation from NP proposalFor details of identified métiers, merges and planned sampling trips per métier please see Tables IIIC1 – 3.
Overall 100 at sea discard trips were achieved in 2009 and the table below breaks down the percentage of trips achieved by gear.Gear PTM TBB GNS SSC OTB%trips achieved 93% 28% 37% 75% 68%
The Irish 2009 national sampling programme did not include identified and defined sampling frames prior to its commencement. Therefore, Table III.C.4 has not been completed. The use of sampling frames evolved from the recommendations of the ICES WKPRECISE workshop (September 2009) and developed by the ICES WKMERGE workshop (January 2010). The use of sampling frames was introduced into the DCF in 2010 for sampling taking place from 2011 onwards.
The precision of the numbers at age estimates for both landed and discarded proportions were estimated using a bootstrap technique (Efron and Tibshirani, 1993). For each metier a minimum number of 10 length-frequency samples, each comprising 25 or more fish is required, along with ageing information.During the calculation, 1000 bootstrap iterations were carried out, re-sampling with replacement the length-frequency and aged samples. The number of fish in each age class was estimated by multiplying the age-length key from the re-sampled aged information by the re-sampled length distribution. From these 1000 estimates of number at age a CV at age was calculated. The final CV for the metier as presented in table III_C_5 is a weighted mean of the CV at age.
III.C.2 Data quality: Results and deviation from NP proposal
Within the North Atlantic, two metiers have been merged for sampling purposes (Table III.C.2), mid-water otter trawls and mid-water pair trawls for small pelagic fish. The majority of Irish effort directed towards small pelagic fish within the North Atlantic is carried out by mid-water pair trawls, although both gear types occur within the top 90% of landings/effort/value. Two groups of metiers have been merged for sampling purposes within North Sea and Eastern Arctic. Small pelagic fish directed mid-water other trawls and mid-water pair trawls in area IV, and small pelagic fish directed mid-water other trawls and mid-water pair trawls in areas I and II (Table III.C.2). As within the North Atlantic, mid-water pair trawls account for the majority of effort directed toward small pelagic fish. Within these North Sea and Eastern Arctic merged metiers, only mid-water pair trawls are ranked within the top 90%. Investigation into the length frequencies of each of the four main species targeted by Ireland, namely herring, mackerel, horse mackerel and blue whiting, show great similarity between the two gear types, supporting the merging of these metiers for sampling.
13

Further analysis of the Irish Metiers has shown that there are a number of instances of Gear Mis-recording, where gear specifications are incompatible with catch composition data, for example pelagic trawls associated with demersal species or demersal trawls associated with pelagics. These metiers have now been merged into existing metiers, based on analysis of reported landings, and will be sampled within the existing programme. See Table IIIC2.
Additionally, the multivariate metier analysis also highlights a number of distinct metiers that have strong similarities with others in terms of gears and target assemblage, but may have relatively low effort making it difficult to identify and target for sampling purposes; the area of activity is spatially discrete but part of a wider area e.g. Celtic Sea. Based on gear/area/target similarities and a priori knowledge of the fisheries, these metiers have been merged into existing metiers currently being sampled or collapsed to form a new metier for sampling purposes. The list of merged metiers is provided in Table III.C.
This approach was also supported by the SGRN National Programme Review Meeting (SGRN-09-01) “The MS has made significant effort to comply with the new regulation. In common with other MS there is no statistical evidence put forward to justify merging métiers, but nevertheless the mergers that are proposed are sensible.”
As previously highlighted the Irish Beam trawl fleet has reduced in numbers due to the national de-commissioning programme therefore reducing the numbers of vessels available for sampling. In addition the main beam trawl fleet is operated by one fishing company and there have been difficulties in getting agreement from this company to put observers aboard their vessels.
The Gillnet métier is a new métier to the NP and the majority of the effort takes place in Quarter1, due to operational problems we were unable to send observers on to this métier.
The Otter trawl fleet has the highest numbers of trips and generally the MS has no problems in reaching these targets, however this year one segment of the fleet has refused to take observers and this comprised 20% of the trips planned. In addition the OTB_CRU fishing in 7bcjk had a lower effort this season so we were unable to get trips in this area.
Table IIIC5 reports on the sampling intensity for length compositions of species across all métiers combined.
Any sampling in excess of the DCF minimum required levels have been sampled at national expense.
In general the focus in 2009 shifted from stock based sampling to the new concurrent métier based sampling approach. It was anticipated that this new sampling regime would be very resource hungry and as such a major effort was made to fulfill our concurrent sampling targets for length of all species. Concurrent sampling for length was relatively successful in 2009 but to the detriment of stock based sampling. However this balance will be redressed in the 2010 programme, to ensure 100% achievement of targets for both concurrent and stock based variables.
Additionally, two of the métiers identified for sampling in 2009 were OTB_DEF_0_0_0 VIIa and OTB_DEF_0_0_0 VIIg. These two métiers were merged based on A priori knowledge of the fishing activities as the main whitefish fisheries occur in the southern Irish Sea. Therefore measurements taken from this métier are reported as VIIg. Due to the time efforts put into
14

sampling concurrently less emphasis could be put into stock based measurements and therefore sampling targets were not met for some species in VIIa.
It was envisaged that Ireland would sample 4400 Anguilla anguilla, however the commercial eel fishery was closed in 2009 and no sampling occurred.
In addition the main fishery in the Irish Sea (Area VIIa) is the OTB_CRU_0_0_0. In this métier some of the boats were fitted a Swedish Grid to gain additional effort under the provisions of Article 13 of 1342/2008 with a view to gaining effort exemption under Article 11 of said regulation. This grid meant that there was no demersal fish landed from those boats as part of this fishery.
Furthermore there was a 20% reduction in effort in vessels targeting Nephrops in VIIa due to the decommissioning scheme.
Sole and plaice in VIIhjk and sole in VIIbc had very low landings in 2009; 60t, 71t, and 45t respectively. These small landings are very difficult to track and sample. The sampling targets for future work programmes have been reduced in line with the landings.
The original sample targets for Cancer pagurus and Homarus gammarus were totally over estimated in 2009, in terms of numbers of expected trips and total numbers of carapace measurements (10,000 was entered in the table as opposed to 1,000). This mistake will be rectified in later National Programme proposals. However the sampling achieved resulted in precision estimates of 3.25% for Cancer pagurus and 2.48% for Homarus gammarus indicating that the achieved sampling levels are reasonable targets for future programmes.
Landings for Herring in VIIa fell significantly from 3329t (average landings from 2006 – 2008) on which the 2009 targets were based, to 305t in 2009 itself, resulting in reduced sampling, as there was no directed herring fishery in this area.
In the DCF, Clupea harengus stocks are to be reported by divisions VIa, VIaN and VIaS, however vessels report their catches as area VI, which is why there are no length samples reported in Table IIIC5 for Herring VIaN.
Pollachius virens sampling levels fell short of the target in 2009. The majority of the saithe landings are from the GNS fleet operating a targeted cod fishery in Q1. The Gillnet métier is a new métier to the NP and the majority of the effort takes place in Quarter1, due to operational problems we were unable to send observers on to this métier, and therefore missed sampling opportunities. This target will be achieved in 2010.
Issues regarding precision estimates.Precision estimates for both landings and discards are presented in table IIIC5. From this table it can be observed that there are a number of stocks for which no precision estimates are available. There are three main technical reasons for the lack of precision data;
1) The fish species in question is not aged, this category includes species such as Cancer pagurus, Nephrops norvegicus, Merluccius merluccius, & Homarus gammarus which cannot be routinely aged, and others such as Glyptocephalus cynoglossus, Anguilla anguilla and Raja stocks for which no age readings are available.
2) The age reading cycle for the stock is out of sync with the Technical report cycle, this category includes primarily Scomber scombrus, and Trachurus trachurus for Q4. The reason for the lack
15
of synchrony is that the ICES WG for assessing these stocks (WGWIDE) is in September and due to work load these species are not aged until June.
3) The sample size is too low to estimate precision by bootstrapping. Ireland has used a threshold of at least 10 length-frequency samples containing at least 25 fish (250 fish minimum) each as a minimum level from which to estimate precision by bootstrapping. For various reasons (see section on sampling levels) certain stocks were sampled at levels below this threshold. This category affects mainly discard fish which tended to have fewer samples and smaller numbers per sample.
In addition to these issues, which are explained by a variety of technicalities, there are a few stocks for which the precision is particularly low (i.e. high CV), these stocks include Lophius budegassa in IV and VI, Lophius piscatorius in VIIb-k and VIIIabde and Solea solea in VIIbc; in all of these cases the reason for the low precision is related to the high variability in length at age from the sampled catch. This in turn reflects a fishery with a relatively large proportion of larger (older) fish, and high variability in size at age amongst these bigger fish. This issue would indicate that landings from the Irish fleet for these stocks would need to be sampled more intensively.
III.C.3 Follow-up of Regional and international recommendationsNA
III.C.4 Actions to avoid shortfallsAt sea samplingIreland will continue to recruit contractors to implement the at sea sampling programme. A number of the current contractors ceased working and a new recruitment drive was commenced. On-going consultation with the fishing industry to improve relations will assist in getting better observer coverage.
Overly ambitious sampling targets will be readjusted to more accurately reflect the landings for a number of species. Every effort will be made to ensure sampling across concurrent and stock based variables is more evenly balanced and efficient in 2010. To ensure this happens, quarterly sampling reviews will be completed highlighting potential under sampling and immediate actions will be taken as necessary to correct this. EU Query 29-9-2010 and Ireland Response Oct 13th , 2010 . Biological métier-related variablesThe following issues require proper justification/correction by Ireland:
> Ireland has filled column D in Table ПI.С.5 with Supra - region elements instead of Regions. The evaluators stated that it was not possible to distinguish between North Atlantic, North Sea and Eastern Arctic (fishing grounds combined) so that it was impossible to evaluate achievement of length sampling.
Response: While Table III.C.5 did not strictly comply with the guidelines, it did however contain all the necessary data in a clear and concise format, and mirrored the way the data was presented in the National programme. This was done to allow ease of comparison between what was originally planned and what was achieved. It was assumed that the data could be read and the achieved sampling could be identified as this is a minor formatting issue. However in order to comply with the comment raised, table III.C.5 has been edited accordingly, and will be submitted as requested in future Annual Reports.
> Only 6% of the métiers and sampling strategy combinations planned were achieved.
16

Ireland justifies this shortcoming with operational problems (namely human resources) but this is not considered as a valid explanation. No explanation is given in case of FPO and SSC métiers.
Response: FPO_Cru_0_0_0: The number of trips that is achieved in this small scale coastal potting metier is dependent on weather conditions and the activity of the fleet. Although resources allocated to sampling were adequate to achieve the target number of trips this number was not realised because of very low fleet activity in the summer of 2009 due to poor weather and market conditions.SSC_DEF_70-99_0_0: 75% of the planned trips at sea were achieved for this métier; however the planned market sampling was not reached as the landings were sold through a fisherman’s Co – Op that would not allow us access to sample for 2009. This issue has been resolved in 2010 and FSS is now sampling full time again in this Co – Op. 2009 was the first year of the implementation of the metier based approach to sampling, however the stock assessments are all still stock specific, therefore the crucial element of the programme is still the delivery of good quality stock specific data to support stock assessments. With this in mind, 74% or 32 out of a planned 43 stocks met or exceeded the planned targets in 2009. A further 3 stocks were sampled to between 75 – 78% of their planned sampling targets. Where issues arose with achieving metier related targets, comprehensive explanations were presented in the text of the annual report for the evaluators and are again presented here:As previously highlighted the Irish Beam Trawl fleet has reduced in numbers due to the national de-commissioning programme therefore reducing the numbers of vessels available for sampling. In addition the main beam trawl fleet is operated by one fishing company and there have been difficulties in getting agreement from this company to put observers aboard their vessels.The Gillnet métier is a new métier to the NP and the majority of the effort takes place in Quarter1, due to operational problems we were unable to send observers on to this métier.The Otter trawl fleet has the highest numbers of trips and generally the MS has no problems in reaching these targets, however this year one segment of the fleet has refused to take observers and this comprised 20% of the trips planned. In addition the OTB_CRU fishing in 7bcjk had a lower effort this season so we were unable to get trips in this area. It was envisaged that Ireland would sample 4400 Anguilla anguilla, however the commercial eel fishery was closed in 2009 and no sampling occurred. In addition the main fishery in the Irish Sea (Area VIIa) is the OTB_CRU_0_0_0. In this métier some of the boats were fitted a Swedish Grid to gain additional effort under the provisions of Article 13 of 1342/2008 with a view to gaining effort exemption under Article 11 of said regulation. This grid meant that there was no demersal fish landed from those boats as part of this fishery.Furthermore there was a 20% reduction in effort in vessels targeting Nephrops in VIIa due to the decommissioning scheme.Sole and plaice in VIIhjk and sole in VIIbc had very low landings in 2009; 60t, 71t, and 45t respectively. These small landings are very difficult to track and sample. The sampling targets for future work programmes have been reduced in line with the landings. The original sample targets for Cancer pagurus and Homarus gammarus were totally over estimated in 2009, in terms of numbers of expected trips and total numbers of carapace measurements (10,000 was entered in the table as opposed to 1,000). This mistake will be rectified in later National Programme proposals. However the sampling achieved resulted in precision estimates of 3.25% for Cancer pagurus and 2.48% for Homarus gammarus indicating that the achieved sampling levels are reasonable targets for future programmes.Landings for Herring in VIIa fell significantly from 3329t (average landings from 2006 – 2008) on which the 2009 targets were based, to 305t in 2009 itself, resulting in reduced sampling, as there was no directed herring fishery in this area. In the DCF, Clupea harengus stocks are to be reported by divisions VIa, VIaN and VIaS, however vessels report their catches as area VI, which is why there are no length samples reported in Table IIIC5 for Herring VIaN.Pollachius virens sampling levels fell short of the target in 2009. The majority of the saithe landings are from the GNS fleet operating a targeted cod fishery in Q1. The Gillnet métier is a new métier to the NP and the majority of the effort takes place in Quarter1, due to operational problems we were unable to send observers on to this métier, and therefore missed sampling opportunities. This target will be achieved in 2010.
17

III.D Recreational fisheriesNorth Atlantic ( ICES areas V-XIV and NAFO areas)
III.D.1 Achievements: Results and deviation from NP proposal
Recreational fisheries in Ireland occur in freshwater and at sea. Salmon and Eel are targeted in freshwater and in estuarine waters. In the marine environment shore based and sea-based angling targets a wide range of species including cod.
EelIreland does not have a commercial fishery for Eel. Recreational eel fishing is only carried out by a minority of rod anglers and there is no legal, or voluntary, declaration of catch which is small. Length and age composition of the recreational catch of eels were not sampled in 2009.
SalmonThere are approximately 150 salmon rivers in Ireland. All recreational fisheries take place in freshwater. The recreational catch and quota in 2009 was 17,521 salmon and 56,542 salmon respectively. There are 53 rivers which will have an identifiable surplus over the Conservation Limit and a harvest fishery proceeded in 2009. In addition, there are 13 rivers with 2 Sea Winter or “spring salmon” stocks where there will be a surplus over the 2SW Conservation Limit and therefore a harvest of spring fish is possible. In addition there are approximately 70 small rivers where the annual average rod catch has been less than 10 salmon since 2001. The combined rod catch from these rivers is less than 0.5% of the current estimated national rod catch.
Each fisherman must record all details of their catch in their logbook immediately after tagging the fish to include a description of the fish i.e. one or two sea winter, river and effort even if the fish is released. 500 salmon were sampled in 2009 for length and age.
CodAn 8 year time series of catch and effort of cod in the sea angling sector in the Irish and Celtic Seas has been compiled.A register of sea angling charter vessels was also been maintained during 2009.
III.D.2 Data quality: Results and deviation from NP proposalSalmonAs the recreational fishery is licensed the volume of landings as recorded in logbooks provides an estimate of the total recreational catch.
Length composition of the catch originates from voluntary data provided by recreational fishermen in the logbook and from private fishery owners who monitor the number and size of fish captured in their rivers, as well as sampling carried out by staff of the Central Fisheries Board. There are no specific sampling or precision targets associated with this process.
18

CodSea angling returns from vessels participating in the Central Fisheries Board voluntary logbook programme and the register of sea angling vessels from 2000-2008 provide data on
- Number of cod captured per boat per day- Number of cod captured per angler per day- Total number of angling days and rod days covered by the sample- Estimates of weight of fish landed by vessel day- Raising factors (to fleet) for the sampled vessels for Irish sea and Celtic Seas- Estimates of the total number of cod landed by the vessel based sea angling sector- Weight of cod landed by the vessel based sea angling sector
III.D.3 Follow-up of Regional and international recommendationsNA
III.D.4 Actions to avoid shortfalls
There were no shortfalls; therefore no remedial actions were required.EU Query (29-9-10) and Ireland Response 13th October
III.D Recreational fisheries> Although Ireland mention in the AR that there were no shortfalls under this section, there is no reference at all to the sea bass recreational fishery and this has to be documented.
Response: A sampling programme has been designed for 2011-2013 to attempt to sample recreational bass fishing. Some retrospective data from 2009-10 may be possible from participating anglers and clubs. It should be clear however that there is no formalized recreational sea bass angling group in Ireland. An appropriate budget insertion has been made to the Fin Forms to cater for the pilot programme.
19

III.E Stock-related variablesNorth Atlantic (ICES areas V-XIV and NAFO areas), North Sea (ICES areas IIIa, IV and VIId) and Eastern Arctic (ICES areas I and II).
The planned stocks requiring sampling are highlighted in Table III E1 and III E 2
III.E.1 Achievements: Results and deviation from NP proposalThe achieved sample numbers and precision levels are listed in table III E 3.
The use of the field “Fishing ground” unnecessarily confuses the table because the fishing grounds do not correspond to the stock areas. The targets are set by stock area, not fishing ground, therefore the inclusion of this field is less than helpful.
The field “Achieved number of individuals” was interpreted as the number of individuals for which age, weight, sex or maturity sampling was performed, not the number of individuals measured.
General derivations from sampling targetsIn all cases where more than 150% of the target sample numbers were collected, this was done at the expense of the member state. Unless specific comments are provided, cases where sampling targets were not achieved are the result of the fact that the sampling targets are set on a length-stratified basis. Therefore, the actual sampling numbers depend on the length distributions of the samples. In any case, the number of samples is more influential in determining the precision than the number of individuals samples (WGPRECISE).
Specific derivations from sampling targetsEels were not sampled because in the absence of commercial or recreational fisheries for eel, Ireland does not have the obligation (nor the possibility) to collect data. No weight-at-length data were collected for crustaceans because their weight is constrained by their external carapace, reducing the need for routine monitoring of length-weight relationships. No landings samples were available for herring in VIaN. No witch were aged during 2009. Few samples of saithe, blonde ray and sole in VIIbc and VIIhjk were available and no samples of cuckoo rays were available. Age reading is not completed for mackerel.
III.E.2 Data quality: Results and deviation from NP proposalePrecision estimatesThe precision levels were estimated using COST tools. Numbers-at-age were estimated using the “bootstrap samples” procedure unless the number of samples was less than 10, in which case the analytical approach was used. For species that cannot be aged or for which age data is not available at the time of writing, the parameters were expressed on a length-basis. For most species the data were binned in 10mm length classes except for Nephrops (1mm) crab and lobster (5mm) and spurdog (10cm). For Nephrops, maturity was only estimated for females.
ShortfallsAs pointed out in the National Programme 2009-2010, annex 3 and 4. The precision targets are generally not achievable, even with very high sample numbers as can be seen from table III E 2.
20

III.E.3 Follow-up of Regional and international recommendationsNA
III.E.4 Actions to avoid shortfallsIn 2009 much effort was focused on the change to concurrent sampling strategies, as a result of this, less effort could be spent on the collection of age data. Improved monitoring of sampling targets will address this by redressing the balance of sampling effort.The lack of availability of samples for certain stocks was related to low landings of these stocks, there is little to be gained from increasing the sampling effort if the landings are minimal.EU Query 29-9-10 and Ireland Response 13th October, 2010IП.Е. Biological stock-related variables
Ireland has filled column F in Table IIIE.3 with Supra - region elements instead of Regions. The evaluators stated that it was not possible to distinguish between North Atlantic, North Sea and Eastern Arctic (fishing grounds combined) so that it was impossible to evaluate achievement of biological sampling.
Response: While Table III.E.3 did not strictly comply with the guidelines, it did however contain all the necessary data in a clear and concise format, and mirrored the way the data was presented in the National programme. This was done to allow ease of comparison between what was originally planned and what was achieved. The data should have been readable in the table as this is a minor formatting issue. However in order to comply with the comment raised, table III.E.3 has been edited accordingly and will be submitted as requested in future Annual Reports.
21

III.F Transversal variablesBaltic Sea (ICES areas III b-d), North Sea (ICES areas IIIa, IV and VIId) and Eastern Arctic (ICES areas I and II), and North Atlantic (ICES areas V-XIV and NAFO areas)
III.F.1 Capacity
III.F.1.1 Achievements: Results and deviation from NP proposalFleet capacity data has been updated and maintained during 2009 in the national register of sea fishing vessels.
III.F.1.2 Data quality: Results and deviation from NP proposalData from the national register can be used to report exhaustively on
- Total Fleet capacity (kws, GTs)- Fleet capacity by licencing segment - Length distribution of vessels in the fleet and by segment
III.F.1.3 Actions to avoid shortfallsThere were no shortfalls in 2009.
III.F.2 Effort
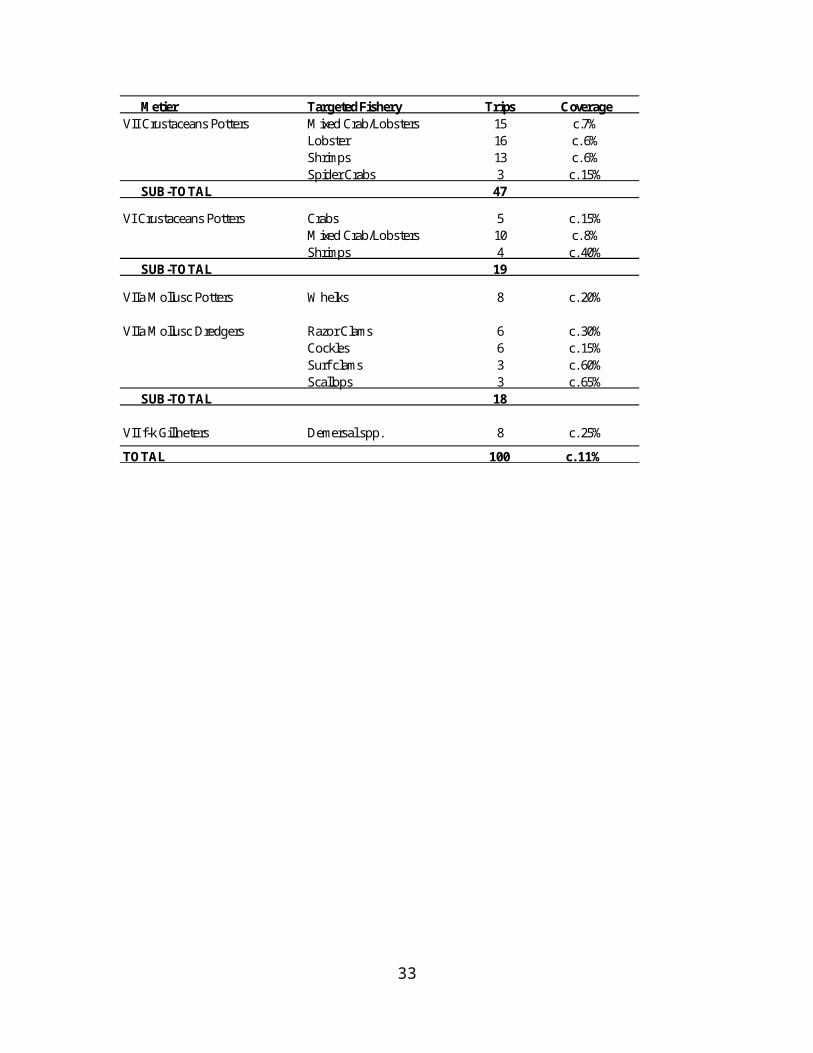
III.F.2.1 Achievements: Results and deviation from NP proposalSampling StrategyIn 2009 the sampling strategy laid down in Irelands DCF proposal targeted a specific number of vessels within each of the sub-metier of the pot (FPO) and dredge (DRB) métiers as outlined below.
22

Metier Targeted Fishery Trips CoverageVII Crustaceans Potters Mixed Crab/Lobsters 15 c.7%
Lobster 16 c. 6%Shrimps 13 c. 6%Spider Crabs 3 c. 15%
SUB-TOTAL 47
VI Crustaceans Potters Crabs 5 c. 15%Mixed Crab/Lobsters 10 c. 8%Shrimps 4 c. 40%
SUB-TOTAL 19
VIIa Mollusc Potters Whelks 8 c. 20%
VIIa Mollusc Dredgers Razor Clams 6 c. 30%Cockles 6 c. 15%Surf clams 3 c. 60%Scallops 3 c. 65%
SUB-TOTAL 18
VII f-k Gillneters Demersal spp. 8 c. 25%
TOTAL 100 c. 11%
23

Results
Vessel <12m LOA:
Effort for vessels under 12m LOA (Metier FPO, DRB and Gill net) was sampled by the sentinel vessel programme. Effort indicators include
- Number of nominal effort units (pot hauls, dredge hours, net length) per vessel per year
- Number of standardized effort units (pot hauls, dredge hours, net length) per vessel per year
- Number of days at sea per vessel per year
In addition effort census in a number of DRB sub-metier for vessels <12m LOA was achieved
- A specifically designed VMS and logbook monitoring programme was completed for the cockle sub-metier resulting in a census of effort (dredge hours) and its spatial distribution (VMS)
- Logbook census of effort and landings was completed for the surf clam sub-metier (dredge hours)
- An historic time series on the distribution of effort was compiled for the razor clam sub-metier (dredge hours mapped in GIS)
Vessels 10-12m LOALogbook data provided a census of effort for all active vessels. The effort indicator is
- Days at sea per vessel per year- Kw days at sea
The proportion of the fleet between 10-12m LOA that was active in 2009 was estimated by comparing the number of such vessels in the national register and the number in the national logbook database. This proportion was used as a raising factor for the sentinel vessel programme data for vessels 10-12m in LOA.
DeviationsAlthough vessels can be identified as belonging to a particular sub-metier in a given year and a given number of vessels in each sub-metier can therefore be sampled vessels may switch métier unpredictably depending on market conditions.
III.F.2.2 Data quality: Results and deviation from NP proposal
ResultsA census of effort for all vessels over 10m has been obtained. Various effort indicators can be developed from these data
24

In the case of vessels <10m LOA detailed daily effort information has been obtained for sampled vessels and a census of high resolution effort data has been obtained for some sub-metier
25

DeviationsNone other than the addition of exhaustive sampling of some DRB sub-metier, which was carried out at national expense.
III.F.2.3 Follow-up of Regional and international recommendationsNA
III.F.2.4: Actions to avoid shortfalls
There were no Shortfalls
III.F.3 LandingsSampling StrategyLandings by vessels <10m LOA metier were sampled in the same way as effort is sampled as outlined above. The landings indicator from the sampling programme is
- Total live weight per vessel- Total value per vessel- Unit value per species per vessel
These indicators can be disaggregated to live weight or value per day, per kw*day or per effort unit.
III.F.3.1 Achievements: Results and deviation from NP proposalFor vessels over 10m LOA a census of landings was obtained in 2009 from the national logbook data and, in the case of vessels less than 10m LOA, from port reports. The port report is an estimate of the landings of all vessels less than 10m LOA landing into each port aggregated to the fleet level at that port.
III.F.3.2 Data quality: Results and deviation from NP proposalResultsLandings data by species and métier have been exhaustively sampled by the national logbook programme and from national port report programmes for vessels under 10m LOA.
DeviationsNone
III.F.3.3 Follow-up of Regional and international recommendationsNA
III.F.3.4 Actions to avoid shortfallsThere were no shortfalls.
26

EU Query 29-9-2010 and Ireland Resposne 13th October, 2010III.F Transversal variables
Ireland is requested to provide all variables as in Appendix VIII of the regulation. In addition is asked to fill in "none" for variability indicators in the future in the case of a census.
Response: The Table has been updated with the missing variables and “None” has been entered in the case of a census.
27

III.G Research surveys at sea
III.G.1 Achievements: Results and deviation from NP proposal
All surveys were completed as planned with the exception of the UWTV Celtic sea survey in 2009. The main objective of the Celtic Sea UWTV survey was to obtain data at the priority stations on the Nephrops grounds the “Smalls” and this was achieved successfully in 2009 where 67 stations were completed. The indicator stations in the Labadie Banks, Nymphe Banks and Seven Heads were not surveyed due to bad weather.
6 of the planned 170 hauls on the Western IBTS 4th Quarter survey could not be completed due to bad weather.
III.G.2 Data quality: Results and deviation from NP proposal
As stated above the indicator stations at the Labadie Banks, Nymphe Banks and Seven Heads were not surveyed due to bad weather during the Celtic Sea UWTV survey. However this does not have a detrimental effect on the data quality of the survey as the UWTV abundance estimate is derived from the stations at “The Smalls”, where the majority of the Nephrops directed fleet operate.
As mentioned above 6 out of 170 planned hauls for the Western IBTS 4th Quarter survey could not be completed due to bad weather. This does not represent any significant issue in terms of Data Quality.
III.G.3 Follow-up of Regional and international recommendations
Pre – Spawning Herring Acoustic Survey 2010The 2010 pre-spawning herring acoustic survey will collect detailed herring samples for use in determining population dynamics as requested by SGHERWAY. The sampling protocol is a continuation of sampling established during the WESTHER project and data will be used to determine stock components in the Malin Shelf stock complex.
UWTV Surveys 2010.The 2010 UWTV surveys will collect data to determine the “edge-effects” in Nephrops burrow counting method as requested by SGNEPS 2009 and WKNEPH2009.
28

III.G.4 Actions to avoid shortfallsThe shortfall in the UWTV Celtic Sea survey does not affect the data provided for assessment, and while every effort is taken to ensure all the peripheral Nephrops grounds are covered the impact of bad weather is beyond our control.
IV. Module of the evaluation of the economic situation of the aquaculture and
processing industry
IV.A Collection of data concerning the aquacultureIreland has a relatively diverse aquaculture sector operating across a number of different sub sectors. The main species produced in Ireland are blue mussel (Mytlus edulis), native oyster (Ostrea edulis), Pacific (gigas) oyster (Crassostrea gigas), salmon (Salmo salar) and rainbow trout (Oncorhynchus mykiss).
In Ireland, all aquaculture operations must be licensed under the Fisheries (Amendment) Act 1997 by the Minster for the Department of Agriculture, Fisheries and Food (DAFF). Licences are issued on a site-by-site basis, which means that one aquaculture producer may hold several licences.
In 2006, a total of 264 farmers were active in the sector, operating 523 aquaculture licences around the coast of Ireland, with an additional 181 licences lapsed or due for renewal by the end of 2006 (total of 704 licences). The majority of the licences were for shellfish farming with a breakdown of 43% and 38% for oysters and mussels respectively.
IV.A.1 Achievements: Results and deviation from NP proposalIn respect to this Module, it was the firm intention of BIM to complete this aspect of the DCR and two staff members were allocated to this project. Unfortunately, the employment contracts of both of these staff members expired and owing to a Government directive, BIM was not permitted to renew the contracts of the two staff members, namely an economist and a data base developer.
This serious loss of two specialists who were both familiar with the requirements of the Data Collection Framework and the need to design, complete, analyse and report as required, meant that it was not possible to address the whole area of this Module. Therefore all aspects of this module deviated completely from that in the NP. Some economic data concerning the aquaculture sector had begun to be collected, a summary of which is given in table IV.A.3. Table IV.A.1 gives a general overview of the aquaculture activities.
IV.A.2 Data quality: Results and deviation from NP proposalPlease refer to the text above.
IV.A.3 Follow-up of Regional and international recommendationsNA
29

IV.A.4 Actions to avoid shortfallsInfrastructural issues have been addressed and new staff, dedicated to the DCF, are due to commence work by the end of 2010.
IV.B Collection of data concerning the processing industryFor the reasons stated in IV.A.1, no data collection was possible for this module in 2009.
IV.B.1 Achievements: Results and deviation from NP proposalNo data was collected.
IV.B.2 Data quality: Results and deviation from NP proposalNA
IV.B.3 Follow-up of Regional and international recommendationsNA
IV.B.4: Actions to avoid shortfallsInfrastructural issues have been addressed and new staff, dedicated to DCF are to commence work by the end of 2010.
EU Query (29-9-10)and Ireland Response October 13th ,2010IV. Module of the evaluation of the economic situation of the aquaculture and processing industryIV.A Collection of data concerning the aquaculture
No data has been collected in 2009. The explanation provided by Ireland is not acceptable.
Response: Data was collected by Ireland in 2009. This was reported in Tables IV.A.1, IV.A.2 and IV.A.3.
IV.B Collection of data concerning the processing industry > No data has been collected in 2009. The explanation provided by Ireland is not acceptable.
Response: Whilst Ireland acknowledges the Commission’s observation, Ireland has collected aquaculture data in 2009 and has implemented, operational changes to redress data deficits in this and previous reference years.
30
V. Module of evaluation of the effects of the fishing sector on the marine ecosystem
V.1 Achievements: Results and deviation from NP proposal
Indicators 1-4: Conservation status of fish species Proportion of large fish Mean maximum length of fishes Size at maturation of exploited fish species
Data for the Indicators for this module were collected by survey. The Western IBTS Fourth Quarter Groundfish Survey collected data for Indicators
1- 4 in waters up to 200m deep from Divisions VI and VII, with the exception of VIIa and VIIf. (Years 2003-Present)
The Spawning Herring Acoustic Survey collected data for Indicators 1-4 from VIIb, VIIj, VIIg and VIIaS in Q4 each year.
The Pre-spawning Herring Acoustic survey collected data for Indicators 1-4 in VIa and VIIb in Q2.
The Blue Whiting Acoustic Survey collected data for Indicators 1- 4 in VIa and VIb in March-April 2009.
Underwater TV surveys collected data for Indicators 1- 4 in VIIb (Aran survey – Q2) , VIIa (Irish Sea survey – Q3), and VIIg (Celtic Sea Survey – Q3). (Years 2002-Present)
Indicators 5-7: Distribution of fishing activities, Aggregation of fishing activities, Areas not impacted by mobile bottom gears.
The Marine Institute was granted access to VMS data by SFPA for the purposes of the DCF. Currently, vessel position data is collected hourly or every two hours for all Irish vessels over 15 m. It has already proven possible to link daily VMS positional data with logbook information for the Irish fleet thus allowing all positional data to be classified to level 6. The distribution of fishing activities, aggregation of fishing activities and areas not impacted by mobile bottom gears can be mapped and provided as required.
Ireland continued to manage and analyse all of the relevant resulting data sets from the DCF process and made these data available to ICES STECF and other expert groups.
Indicator 8: Discarding rates of commercially exploited species
Metier based discard sampling is conducted as part of the concurrent sampling at sea programme. Details of this programme are described in III.C.2 with sampling effort by metier outlined in table III.C.3. and details on data collected by species shown in section III.C.5 and III.C.6 of the Technical Report 2009. Trip specific discard rates by species measured in weight are raised to discard rates by quarter and metier using species landings data.
Indicator 9: Fuel efficiency of fish capture
The calculation of fuel efficiency is also described in section IIIB. Fuel efficiency of fish capture is defined in Appendix XIII of Commission Decision (2008/199/EC) as the ratio between value of landings and cost of fuel, and must be estimated by quarter and by metier. The inshore components were estimated from the following data collected on a daily basis under the sentinel vessel programme;
31

Landings per species, Price per species, Fuel costs, Fuel prices.
These data, can be raised to the total active population of vessels <10 metres in length (LOA) and will be included in their respective national metier, by quarter.
Fuel costs received from vessels >10 meters length (LOA), targeted in the annual economic survey, are apportioned equally on an effort basis to their relevant metiers and quarters, and raised to the active population. Effort was based on a log-book analysis that apportioned each fishing trip to a particular metier (see Section III.F for more details).
V.2 Actions to avoid shortfallsThere were no shortfalls.
32

VI. Module for management and use of the data
VI.A Management of the dataData from port sampling is warehoused in the STOCKMAN system, which is a client-server relational database in SQL2005 with a VB6 graphical user interface (GUI). This database also houses data on biological variables collected under Module IIIE. In the past the port sampling information stored in Stockman has been collected by stock gear and area, however as a result of a modification to the database in 2009 this information is now collected at the vessel trip level as required from the metier based sampling programme. The Discard database was enhanced to improve security measures. Both these databases with their companion extraction and reporting functionality were continually improved in 2009 to fix reported bugs and improve efficiency.
Transversal information is collected via Logbooks. A view of the logbooks database is maintained on the Marine Institute’s network. This view is housed in a secure SQL Server 2000 database. The logbooks database has been managed according to protocols relation to production databases at the Marine Institute, these protocols ensure security, integrity, and backup of the information.
Survey information is stored on individual databases. In 2009 the IBTS survey database was upgraded to SQL server 2008, this upgrade has improved the validation checks on the data and improved the quality. The new database also has a Dataras export facility which as automated the upload facility of the Irish IBTS data for the first time in 2009.
Socio-economic data are stored in a SQL Server 2005 database, located on a secure server within the BIM network. Development of the database schema to allow for storage of any additional economic parameters collected in the 2009/2010 National Programme, was deferred to 2010 due to infrastructural changes at BIM.
The thrust of the data management programme is to consolidate data where possible, and centralize on more robust and secure enterprise-wide databases while continuing to enhance and further develop the suite of analysis and reporting tools available. Significant progress continues to be made to consolidate the range of databases and data management solutions for fisheries datasets. Data archiving is now formalized, and the integration of survey datasets is well underway. The merging of the Discard and Stockman Databases has been deferred to 2010.
Data exchange to the EU is still via Excel templates as supplied by the JRC. The data is pre-validated prior to submission by the import procedures (described below), but undergo additional validation and quality checks. The key shortcoming to supplying data via this route currently (to meet the format of STECF requests for data) is the manual integration required between the Logbooks and Stockman databases. Although integration of these 2 datasets commenced in 2009, the process has not been completed. It is envisaged that further progress on this issue will be made in 2010
Quality control and validation procedures.
Data on biological variables from port sampling are collected according to documented SOP’s. These SOP’s cover areas such as data quality and checking and are follow closely PGCCDBS (2009) discussions regarding international best practice. At the database front end there are validation procedures ensuring the integrity of data entered from biological sampling events. The
33
database itself has a dedicated DBA (data base administrator) who checks for inputs on a regular interval for range date and sum cross checks.
Views of the logbooks data required for the DCF are generated dynamically and downloaded periodically. The access to the Logbooks data changed in 2009 from the web based Oracle Discoverer, to secure FTP transfer. The new transfer method is much more efficient than the http web based interface.
In 2009 socio-economic data from the annual DCF economic survey was submitted electronically in XML format via interactive PDF forms, for the first time. Initial validation is thus carried out on submission of the form data. Financial forms are now signed off by a qualified accountant. In 2009 the economic survey was timed to coincide with the final submission date for mandatory self-assessment tax returns to the Office of the Revenue Commissioners, thus ensuring that the required financial data were both readily available, and validated and processed in advance by the vessel’s accountant.
Ireland has developed a program that automatically imports the XML data into the Socio-economic database. However although the programme has been developed it still requires testing and is thus considered as a beta version which has yet to be released into production.
Irelands plan to create a secured web based work space in 2009, has been deferred to 2010. This deferral is due to the timing of the rollout of sharepoint services at the Marine Institute. An interim solution using Joomla, an open source web content management system, is in place as temporary measure.
VI.B Use of the dataThe IBTS groundfish survey and acoustic surveys are now stored on SQL server databases, and these automatically generate output to internationally coordinated survey databases such as that in PGNAPES, PGHERS (now PGIPS) and Datras.
Biological data from commercial fish sampling is transmitted to ICES for international stock assessment. These data are either raised by Ireland, or sent to the ICES stock coordinator. In most cases Ireland uses either the Fishframe or Intercatch format to transmit these data.
In 2009 for the first time Ireland produced an atlas of fishing activity, which required an analysis of logbooks and VMS data. This atlas was published by the Marine Institute and is available at http://www.marine.ie/NR/rdonlyres/43BF1F38-A158-4882-9DA8-8962FDC52DB5/0/AtlasofCommercialFisheriesAroundIreland09.pdf
VI.1 Achievements: Results and deviation from NP proposalIreland has achieved much of what it set out in the NP for 2009-2010. The improvements to the Irish IBTS database and upgrade of discards and logbooks download method are notable achievements. Some aspects planned for the period 2009 have been deferred to 2010. These deferrals have happened for a variety of reasons (e.g. infrastructural changes, alignment with rollout procedures agreed at an institute level), but it is envisaged that they still be completed within the timeframe for the biannual programme (2009-2010).
34

VI.2 Actions to avoid shortfallsThe application of sound data management practices, alongside a continuing effort for upgrade and consolidation of databases and exploration tools, has helped to avoid many shortfalls with the Irish DCF data. However as with many EU MS access to logbooks and VMS data (which is not managed or owned by the primary fisheries lab involved with the DCF) has the potential to adversely affect Ireland’s ability to comply with the DCF. To this end the Marine Institute has gone to great efforts to build and maintain good relationships with the fishing industry, and the State authorities who have primary responsibility for logbooks and VMS data, and this has provided a framework for improved cooperation and data transfer between these elements.
35
VII. Follow-up of STECF recommendations
Recommendations from SGRN for 2009 NP
Actions Taken
SGRN recommends MS to carry out necessary analysis to ensure that the quality of self sampling does not provide biased estimates
As of End of September only 2 self sampling data sets has been collected, this was due to delays in getting the programme started. Once further data sets arrive analysis will be carried out.It has been decided to drop this self sampling programme due to quality issues, data will now be collected by MI personnel.
SGRN acknowledges the effort made by the MS regarding precision analysis of the historical data but requires more information about methods for quality assurance during the period 2009 – 2010.
Data are collected in line with best practice and the minimum sampling scheme as outlined by PGCCDBS, and according to internally agreed standard operating procedures. All species aged have a primary and secondary age reader for QC purposes, and inter reader checks are performed quarterly, reporting on CV and % agreement. Thresholds are set for each species below which re – training is initiated. Age readers participate in international age reading workshops. All data is checked, and is validated after being entered into the database.Once the data are in the database a range of quality checks are in place, ranging from visual inspection of the length frequency distributions, identification of outliers in the length-weight relationship and outliers in the age-length keys. Length distributions are also examined using the delta calculation COST tool and outliers are investigated by comparing the trip characteristics (catch composition, fishing area) with that of other trips in the same stratum. Age-length keys of different quarters and areas are compared using COST tools. The sample stratification is examined by comparing the number of samples in each stratum with the landings in those strata.
The derogation asked for DRB_MOL can lead to a similar situation as the Tuna farming inthe Mediterranean; a similar approach is promoted by SGRN. SGRN refers MS to the generalcomments on Tuna farming.
The catch is composed of ‘seed mussel’ (age 0+) only and the targeted ‘populations’ are ephemeral in nature as they suffer catastrophic natural mortality during winter storms due to shear stress on the sea bed which washes out the seed mussel bed. There is, therefore, no scope to use size or age data of mussels from this metier in stock assessment or in management of the fishery. Stock biomass is assessed annually in a number of seed mussel beds using a combination of acoustic mapping and dredge sampling. These assessments do not require data on size composition other than that which is obtained during dredge sampling at the time of survey.
36
SGRN recommends that table IIIC4 be amended.
Amendments were sent to the commission
MS does not provide information on Ecosystem indicators 8 and 9
Information provided in NP revision
MS does not provide information on Ecosystem indicators 8 and 9
Information now provided
37
VIII. List of acronyms and abbreviations
Acoustic surveys Acoustic surveys use sound waves emitted from a "transducer" to estimate the density of plankton and fish shoals. The transducer is attached to a drop keel on the survey vessel, which is linked to an echo sounder in the vessel which records the shoals of fish as "marks" on a screen or paper trace. The density of these marks is used to calculate total biomass of a stock.
Age The number of years of life completed, here indicated by an Arabic numeral, followed by a plus sign if there is any possibility of ambiguity (age 5, age 5+).
BIM An Bord Iascaigh Mhara, The Irish Sea Fisheries Board, charged with responsibility for development of the fishing and aquaculture industries in Ireland. (see www.bim.ie)
By-catch Refers to discarded catch (see Discards) plus incidental catch not purposely targeted by the fishermen.
CFB Central Fisheries Board (www.cfb.ie)
CPUE /Catch Per Unit of Effort The catch of fish, in numbers or in weight, taken by a defined unit of fishing effort. Also called catch per effort, fishing success, or availability.
DAFF Department of Agriculture Fisheries and Food (see www.daff.gov.ie)
DCENR Department of Communications Energy and Natural resources (see www.dcenr.gov.ie)
DCF / Data Collection Framework EU Council Regulations 1543/2000, 1639/2001, 199/2008 established a community framework for the collection and management of the data needed to conduct the common fisheries policy. Each member state must collect data on the biology of the fish stocks, on the fleets and their activities and on economic and social issues
Discard Discards are defined as that part of the catch returned to the sea as a result of economic, legal or other considerations.
Discard rate The percentage (or proportion) of the total catch which is discarded.
FAT Fisheries Assessment Technician – regionally-based sea-going staff employed by FSS.
Fishing Effort The total fishing gear in use for a specified period of time. When two or more kinds of gear are used, they must be adjusted to some standard type
Groundfish Species of demersal fish dwelling on, or close to the sea floor, as targeted in the annual Western IBTS 4th quarter survey around the Irish coast.
IBTS International Bottom Trawl Survey Working group
ICES International Council for the Exploration of the Seas –Ireland shares the Total Allowable Catches TACs for many stocks we exploit with our European Union partners. Because of this international dimension many stocks need to be assessed in international fora such as ICES.
ICCAT International Commission for the Conservation of Atlantic Tuna
Marine Institute The Marine Institute is Ireland's national agency with the following general functions: "to undertake, to co-ordinate, to promote and to assist in marine research and development and to provide such services related to marine research and development, that in the opinion of the Institute will promote economic development and create employment and protect the environment." Marine Institute Act, 1991 (see www.marine.ie)
IFIS Integrated Fisheries Information System .Database held by DAFF with landings, effort and first sale value of fish species
38

FSS / Fisheries Science Services – One of seven service areas of the Marine Institute, FSS’s mission is to assess, research and advise on the marine fisheries resource in Irish waters
HAWG Herring Assessment Working Group
LA Laboratory Analyst.
Latt Laboratory Attendant
MS Member State.
Nemesys Nephrops measuring system.
NP National Programme.
WGWIDE Working group on Widely distributed stocks
RCM Regional Co-ordination Meetings.
PGCCDBS, Planning group commercial catch discards and Biological sampling
WGCSE Celtic seas eco region working group
WGHMM Working group Hake Monk and Megrim
WGIPS ICES Working Group International Pelagic Surveys
WGNAPES ICES Working Group on North East Atlantic Pelagic Ecosystem Surveys
WGNEACS ICES Working Group on the North-east Atlantic Continental Slope Survey
Recovery Plan This is a multi-annual plan to recover seriously depleted stock. The plans generally involve agreed Harvest Control Rules, Technical Measures, Effort Controls and various control and enforcement measures.
Recruitment The amount of fish added to the exploitable stock each year due to growth and/or migration into the fishing area. For example, the number of fish that grow to become vulnerable to the fishing gear in one year would be the recruitment to the fishable population that year. This term is also used in referring to the number of fish from a year class reaching a certain age. For example, all fish reaching their second year would be age 2 recruits.
Sample A proportion or a segment of a fish stock which is removed for study, and is assumed to be representative of the whole. The greater the effort, in terms of both numbers and magnitude of the samples, the greater the confidence that the information obtained is a true reflection of the status of a stock (level of abundance in terms of numbers or weight, age composition, etc.)
SFPA Sea Fisheries Protection Agency
STECF The Scientific Technical and Economic Committee on Fisheries was established by the European Commission and comprises fisheries scientists and economists from the Member States. The role of STECF is to advise the European Commission on scientific, technical and economic issues related to the management of fisheries resources that are exploited worldwide by members of the European Union.
STO Scientific and Technical Officer
Stock A "stock" is a population of a species living in a defined geographical area with similar biological parameters (e.g. growth, size at maturity, fecundity etc.) and a shared mortality rate. A thorough understanding of the fisheries biology of any species is needed to define these biological parameters.
39

SSB / Spawning stock biomass The total weight of all sexually mature fish in the population. The size of SSB for a stock depends on abundance of year classes, the exploitation pattern, the rate of growth, fishing and natural mortality rates, the onset of sexual maturity and environmental conditions.
STOCKMAN A custom developed relational database which houses the Marine Institute Fisheries Science Services sampling data.
TAC / Total Allowable Catch is the total regulated catch from a stock in a given time period, usually a year.
TL Team Leader
WKDRP Workshop on Discard Raising Procedures
WGMEGS ICES Working Group on Mackerel and Horse Mackerel Egg Surveys (WGMEGS)
40

IX. Comments, suggestions and reflectionsThe use of the field “Fishing ground” in tables III.C.1, III.C.3, III.C.5 and III.C.6 is unhelpful as many metiers take place in multiple fishing grounds. This requires the data to be disaggregated to a point where it becomes meaningless.
X. References
Efron, B. and Tibshirani, R.J., 1993. An introduction to the bootstrap. Chapman & Hall. CRC, 436pp. pp.
ICES. 2010. Report of the Workshop on methods to evaluate and estimate the precision of fisheries data used for assessment (WKPRECISE), 8-11 September 2009, Copenhagen, Denmark. ICES CM 2009/ACOM:40. 43 pp.
ICES. 2010. Report of the Joint ICES - STECF Workshop on methods for merging métiers for fishery based sampling (WKMERGE), 19–22 January 2010, Copenhagen, Denmark. ICES CM 2010/ACOM:40. 94 pp.
41

XI. Annexes
Figure 1. Western IBTS Q4 Groundfish survey cruise haul positions 2009. Valid hauls as red circles, with invalid station marked as a cross.
42

Figure 2 Blue whiting survey cruise track and haul position 2009.
-18 -16 -14 -12 -10 -8 -6 -4 -2 0 2 4
Longitude
49
50
51
52
53
54
55
56
57
58
59
60
61
62
63
Latit
ude
12345 6 7
89
1011 12 13
141516 17
18192021 22 23
23
C TD Station
H aul positionTotal track leng th : 2 ,475nm i
Transect spacing: 30 nm iDepth con tours 200-1000m
43

Figure 3 Pre-spawning herring acoustic survey cruise track and haul position 2009.
D e p t h c o n t o u r s 2 0 0 - 1 0 0 0 m
- 1 2 - 1 1 - 1 0 - 9 - 8 - 7 - 6 - 5
L o n g i t u d e
5 2 . 5
5 3
5 3 . 5
5 4
5 4 . 5
5 5
5 5 . 5
5 6
5 6 . 5
5 7
Latit
ude
1 2 3 45 6
7 891 0 1 11 2
1 3 1 41 51 6
1 7 1 81 9
2 02 1 2 2 2 32 4
2 52 6 2 72 8
2 93 0
3 1
V I a S
V I I b
E 2 E 3 E 4E 1E 0D 9
4 2
4 1
4 0
3 9
3 8
3 7
3 6
3 5
3 4
D 8
44

Figure 4 Herring spawning acoustic survey cruise track and haul position 2009.
- 1 2 - 1 1 - 1 0 - 9 - 8 - 7 - 6
L o n g i t u d e
5 0
5 0 . 5
5 1
5 1 . 5
5 2
5 2 . 5
5 3
Latit
ude
45

Figure 5 Nephrops UWTV Survey, Irish Sea survey cruise track and haul positions 2009.
46

Figure 6 Nephrops UWTV Survey, Aran Grounds survey cruise track and haul positions 2009.
47

Figure 7 Nephrops UWTV Survey, Celtic Sea survey cruise track and haul positions 2009.
48