Embed Size (px)
Citation preview
Report of theRegional Co-ordination Meeting for the North Sea and Eastern
Arctic(RCM NS&EA)
2013
final report
European Fisheries Control Agency (EFCA)Vigo, Spain
09/09/2013-13/09/2013
Table of Contents
Table of Contents..........................................................................................................................21. Executive summary............................................................................................................42. Introduction........................................................................................................................6
2.1 General............................................................................................................................62.2 Background & legal requirements....................................................................................62.3 Terms of Reference..........................................................................................................6
2.3.1 Additional terms of reference.............................................................................72.4 Structure of the report.....................................................................................................72.5 Participants:.....................................................................................................................82.6 European Fisheries Control Agency (EFCA)......................................................................8
3. Review progress in regional co-ordination since the 2012 RCM.......................................103.1 Follow-up of recommendations from the 2012 RCM NS&EA..........................................103.2 Follow-up of recommendations from the 9th LM meeting...............................................133.3 Feedback and recommendation from data end users....................................................19
3.3.1 STECF EWGs.....................................................................................................193.3.2 ICES..................................................................................................................21
Ângela Canha, Portugal and Lotte Worsøe Clausen, Denmark.......................................................................284. Regional coordination.......................................................................................................33
4.1 Regional databases: update since RCMs 2012...............................................................334.1.1 RDB-SC.............................................................................................................334.1.2 Status from the ICES Secretariat......................................................................344.1.3 Concerns about lack of funding for further development.................................34
4.2 Regional coordination under DC-MAP.............................................................................354.2.1 Comment by participants from MS on regional coordination............................36
5. Data Quality issues...........................................................................................................375.1 Review progress on quality control, validation etc. in NP proposals..............................375.2 Upload to RDB, Data gaps and incomplete uploads.......................................................39
5.2.1 Incomplete uploads..........................................................................................425.2.2 Regional Data Base administration and data management..............................445.2.3 Quality Assurance checks.................................................................................46
5.3 RDB data extraction and analysis..................................................................................525.3.1 Reference lists of metiers and species and data inconsistencies.....................525.3.2 Definitions of samples and trips.......................................................................555.3.3 Quality Assurance checks.................................................................................56
5.4 Quality indicators of surveys..........................................................................................616. Revision of the DCF (DC-MAP)..........................................................................................63
6.1 Feedback on the draft DC-MAP2014-2020.....................................................................636.1.1 Comments made by participants from different MS on the draft DC-MAP........64
6.2 Data Sampling for eel and salmon under the DC-MAP...................................................646.3 Cost sharing model for joint research vessels surveys under DC-MAP...........................666.4 Road-map towards a regional sampling programme – process of RCGs........................66
6.4.1 Need for a road-map.........................................................................................686.4.2 Preliminary road-map.......................................................................................69
6.5 Guidance for MS to implement the National Programme for 2014 under the EMFF.......717. Studies and pilot projects.................................................................................................72
7.1 Proposal for coordination and cooperation activities that could be funded under the EMFF article 85,2e...................................................................................................727.1.1 Title: “Exploration and Development of new facilities in RDB-FishFrame
5.0”..................................................................................................................727.1.2 Title: “Support design based regional data collection programmes”................737.1.3 Title: “WebGR 2 - Web services for support of Growth and Reproduction
Studies”...........................................................................................................757.2 Proposal for studies and pilot projects that could be funded under the EMFF
article 85,2a...................................................................................................................777.2.1 Title: Study on European anglerfish (Lophius piscatorius and Lophius
budegassa) in all ICES areas and megrim (Lepidorhombus whiffiagonis) in VII and VIIIa,b&d...........................................................................................77
7.2.2 Proposed title: Defining sampling scheme and collecting diet data for multispecies evaluation and management in the English Channel and the Celtic seas..................................................................................................80
7.2.3 Proposed title: Tagging program for validation of Baltic Sea cod age estimation and migration rates........................................................................81
7.2.4 Proposed title: Age Determination and Maturity Staging of species not previously subjected to biological sampling for analytical assessments..........82
Page 2 of 176
8. Other business..................................................................................................................868.1 Consequences of the landing obligation in 2015 introduced by the CFP for the
DC-MAP..........................................................................................................................868.2 Analysis of data from 2013 RCM data call......................................................................86
8.2.1 Quality of the response to the 2013 RCM data call...........................................868.2.2 Comments from participants of the MS on the data upload in the RDB............898.2.3 Needs to modify the NP for 2014 based on updated information on
metier ranking.................................................................................................918.3 Regional Sampling Design for DC MAP...........................................................................92
8.3.1 Principles of design based sampling.................................................................928.3.2 Regional Sampling Design................................................................................938.3.3 The analysis......................................................................................................938.3.4 Sampling protocols.........................................................................................1008.3.5 Implications for data collection and Regional Coordination Groups................1018.3.6 End user interactions......................................................................................1018.3.7 Structuring National programs under regional designs..................................1018.3.8 Collection of variables....................................................................................1028.3.9 Estimation......................................................................................................1028.3.10 Species and stock based sampling protocols..................................................1028.3.11 Challenges for the RDB...................................................................................102
9. Additional terms of reference.........................................................................................1059.1 terms of reference a): Update NP2014-2016 state of play...........................................105
9.1.1 Cost sharing model for joint research vessels surveys...................................1059.2 terms of reference b) 'how to understand and interpret the NP2014-2016'.................1069.3 terms of reference c) Do we need a list of meetings in the DC-MAP comparable
with the eligible meetings in the DCF?.........................................................................10610. Summary of recommendations......................................................................................10711. Glossary..........................................................................................................................11112. References......................................................................................................................114Annex 1: Comments made by the participants of MS on the draft DC-MAP2014-2020.............115Annex 2: Proposal for data collection for eel and salmon assessment in UK as part of the
DC-MAP...........................................................................................................................126Annex 3: Ranking of 2012 metiers............................................................................................135Annex 4: Regional ranking of top 10 metiers by year...............................................................147Annex 5: Overview of potentially required bilateral agreements..............................................149Annex 6: Comment by participants from MS on regional coordination.....................................152Annex 7: Future of PGCCDBS....................................................................................................155Annex 8: Agenda of the meeting..............................................................................................160Annex 9: Data range check.......................................................................................................165Annex 10: A comparison between RCM 2010 species reference list and contents of the
RDB 2013.......................................................................................................................170
Page 3 of 176
1. Executive summaryThe Regional Coordination Meeting for the North Sea & Eastern Arctic (RCM NS&EA) was held in September 2013 in Vigo (Spain). The main task of the RCM’s is to coordinate the National Programmes (NP), which propose the national data collection to be carried out by the Member States (MS) under the EU Data Collection Framework (DCF). It was envisaged that, from 2104 onwards, data collection by the MS would be carried out under a new framework (DC-MAP). However, the legislation for this framework is not ready yet. Therefore the Commission has decided to extend the present DCF for the time being and the most recent NPs have been adopted for 2014. Since these NP have been adopted without any changes, there is no need for major coordination. This was reflected in the t.o.r. and the agenda of the meeting and more time was taken to look into the future and explore the Regional Data Base (RDB).
Recurring items on the agenda were the consideration of the follow up of relevant recommendations made last year by Liaison Committee. These recommendations are not always clear when they are considered in isolation. Therefore the format of the recommendations was adapted this year, including a justification for the recommendation. Further, the ICES observer presented feed back from expert groups on data needs, projected benchmark meetings in 2014, ICES comments on the DC-MAP approach, and changes in the structure of the role of PGCCDBS. Also participants reported on progress made by a number of ICES expertise groups which are relevant for (the quality) of data collection.
An introduction was given to the changes in the new CFP and the consequences for data collection. The most prominent change is the introduction of the landing obligation. The RCM expressed great concern about the lack of clarity in the CFP on this subject and concluded that this potentially could lead to chaos in catch reporting. The announced extension of areas of data collection was received with some sceptics as an expansion of data collection for most MS would be impossible within more limiting budgets
A summary was presented of the process in STECF that lead to proposed wording of the DC-MAP by STECF EWG 13-05. It is clear that this process has not ended and needs to be continued. In fact, no formal decisions on the content of DC-MAP have been taken yet. Therefore, elaboration on the future of coordination of data collection, as been done by RCM NS&EA in this meeting are somewhat speculative.
Earlier in 2013, the chairs of the RCM Baltic, RCM NS&EA and RCM NA had send out a call to all MS to populate the RDB with low aggregated transversal (catch, effort, metier, port) data and biological data from the period 2009-2012. All MS responded positively and this is great progress compared to previous years. Also the quality of the data upload has improved. Data from Spain and Portugal were available but could not be uploaded in the RDB for technical reasons. The data in the RDB were explored in three subgroups to:
1. check whether there have been major changes in the fisheries (metiers) in the last 4 years which may compromise the Commission Decision to transfer the 2013 NPs unchanged to 2014.
2. exercise the design of regional designed sampling following (WKPICS) guidelines of a sound statistical approach
3. develop new approaches of investigating quality of data on a regional scale by designing diagnostics
The check (1) concludes that on a regional scale, the metiers in the top of the ranking are relatively stable and will be covered with data collection as in previous years. There is therefore no need to change the coordination of data sampling compared to previous years.
The exercise (2) indicates that efficiency can be improved if biological sampling would be carried out in a selection of fishing ports. The 2012 data present in the RDB includes landings for 430 species into 601 harbours. These species can be classified in groups such as gadoids, flatfish, pelagics, etc. If sampling of gadoids could be based on access to 95% or 90% of the landings only the major ports, in this case 46 or 24 need to be sampled. The major ports for roundfish landings are in the UK and Denmark. This mean that they would be the major data collectors for this group, while other MS may reduce or stop sampling for roundfish. It is clear that the analyses of the RDB data need to be further developed in order to optimise sampling design of data collection as much as possible to the needs of end-users. Also changes were proposed to the data fields in the RDB. The exercise clearly demonstrates that changes are needed in the future coordination of data collection and these need to be addressed in the near future.
Page 4 of 176
The development of new approaches (3) to data quality is a continuation of the process started in last year’s RCM. There is a legal need to report on the quality of data but also it is mostly important that end-users are aware of the quality of data used for providing advice. Examples of diagnostics have been developed or explored to compare reported catches from different sources, to check data ranges (length, age) in the RDB, goodness of fit indictors comparing sampling effort with the sampled populations. In summary there are simple ways to review both the quality of the data and the quality of sampling schemes but currently there isn’t a process for reviewing and reporting on quality.
The group considered that coordination is likely to change considerably under the DC-MAP. In the present situation - under the DCF - obligations to collect data are defined for each MS and these are coordinated by the RCM on the basis of provisional NPs. It is considered likely that, under the DC-MAP, part of the obligations will be defined at a regional level and need to be allocated to the MS before they produce their NP. RCM NS&EA considers that the allocation of regional priorities to MS may conflict with national priorities and available resources and therefore may become problematic in the future. Other changes foreseen are more involvement of the end-user in defining data needs, a regional approach to sampling design and another approach to data quality measurement. A well functioning RDB plays here prominent role. A roadmap towards the implementation of the DC-MAP was considered mostly after the meeting and was further considered by the RCM NA. It is clear that regional coordination in the future is more extensive and difficult, involving more parties and require good communication and information. Roles and mandates of the different stake-holders in the process need to be clearly defined. Future Regional Coordination Groups (RCG) need to prepare for their more extended role and this should be part of the road map.
Page 5 of 176
2. Introduction
2.1 General
The RCM NS&EA 2013 was held at the premises of the European Fisheries Control Agency (EFCA) in Vigo (Spain) from the 9th of until 13th of September 2013.
RCM NS&EA appreciates the good facilities offered by the EFCA. The availability of SharePoint offered by ICES proves to be very efficient in organising the work before, during and after the meeting. The RCM Regional Database, maintained by the ICES secretariat, proved to be a great facility for coordination, planning and managing the recommendations.
2.2 Background & legal requirements
The EU Data Collection Framework (DCF; EC 2008a, 2008b, 2008c, 2010) establishes a framework for the collection of economic, biological and transversal data by Member States (MS). This Framework provides the basic data needed to evaluate the state of fishery resources and the fisheries sector and the impact of the fisheries on the marine ecosystems.
The Regional Coordination Meeting for the North Sea & Eastern Artic (RCM NS&EA) proceeds from the present Data Collection Framework (EC Regulation no. 199/2008) establishing a community framework for the collection, management and use of data in fisheries sector for scientific advice regarding the CFP. According to this regulation and without prejudice to their current data collection obligations under EU law, Member States (MS) shall collect primary biological, technical, environmental and socio-economic data within the framework of a multi-annual national programme drawn up in accordance with the EU programme.
According to EC Regulation 665/2008, laying down detailed rules for the application of Council Regulation (EC) 199/2008, and its technical Decision 2010/93/UE specifying practical aspects for data collection, actions planned by MS in their national programme shall be presented according to the predefined regions.
The coordination of the data collection are carried out at a regional level and specific Regional Coordination Meetings (RCMs) are in charge of facilitating this and these meetings aim to identify areas for standardisation, collaboration and task sharing between MS. RCMs are held annually and involve participants from each MS involved in the DCF.
2.3 Terms of Reference
1. Review progress in regional co-ordination since the 2012 RCM (follow-up of recommendations) and 9th Liaison Meeting report. Evaluate the outcomes of the RCMs that took place in 2012 & of any other RCMs that took place in 2013, pending availability of outcomes, in terms of complementarities and actions to be carried out by MS in the RCM region of competence.
2. Review feedback and recommendations from data end users (STECF EWGs, ICES assessment WGs and benchmark meetings, GFCM Subcommittees and relevant WGs, and ICCAT assessment WGs) and PGCCDBS.
3. Regional coordination Regional databases: update since RCMs 2012. Identify needs of the RCMs that could be
addressed by the SC-RDB and suggest any new features/reports to be developed. Make proposals for ways in which the work of RCMs could be expanded under the DC-MAP, to
become Regional Coordination Groups (i.e. what new tasks to deal with at regional level, which tasks should take place during a meeting, which tasks could be carried out intersessionally).
Proposals for cooperation activities between Member States that could be put forward for funding under the EMFF.
4. Data Quality issues Review progress on quality control, validation etc. in NP proposals.
5. EU Multiannual programme (MAP) for data collection for 2014-2020
Page 6 of 176
Provide feedback on the draft EU MAP2014-2020. Prepare a roadmap for the development of a regional sampling programme.
6. Studies and pilot projects7. Any other business
Analyse data from 2013 RCM data call (TBC).
2.3.1 Additional terms of reference
a. complete the table on NP2014-2016 state of play, building on the version with info on Baltic MS. Concretely, the RCM Med&Bs should update the file next week, then Constantin should send the file to Frans before the end of the Med&Bs meeting. Then the RCM NS&EA countries (who were not in the RCM Baltic…) should complete the table and Frans can send it to Kelle for the outstanding MS to add their info.
b. review & develop further the document prepared by the RCM Baltic on 'how to understand and interpret the NP2014-2016', both for MS and for STECF wen they will need to evaluate how MS implemented these NPs. Again, if possible, the RCM Med&Bs would work on the Baltic document (add comments in track changes), then send it to the RCM NS&EA, and then on to the RCM NA so we end up with a single file, with comments of all RCMs.
c. Every RCM to give their opinion on whether it would be useful for MS to still have a list of 'recommended' DCF meetings for 2016 (equivalent to the list of eligible meetings) but realizing that under the EMFF, and shared management, it is up to MS to decide on how they allocate their funding to meetings, and there will no longer be a list decided by the Commission, on which meetings are eligible or not for EU co-financing.
2.4 Structure of the report
The following table lists the sections in the report where the various t.o.r. have been addressed.
t.o.r section
1 sections 3.1 and 3.2
2 section 3.3, Annex 7
3 sections 4, 8.3 and Annex 6
4 section 5
5 sections 6.1 and 6.4, Annex 1 and 2
6 chapter 7
7 chapter 8,
a section 9.1
b section 9.2
c section 9.3
Page 7 of 176
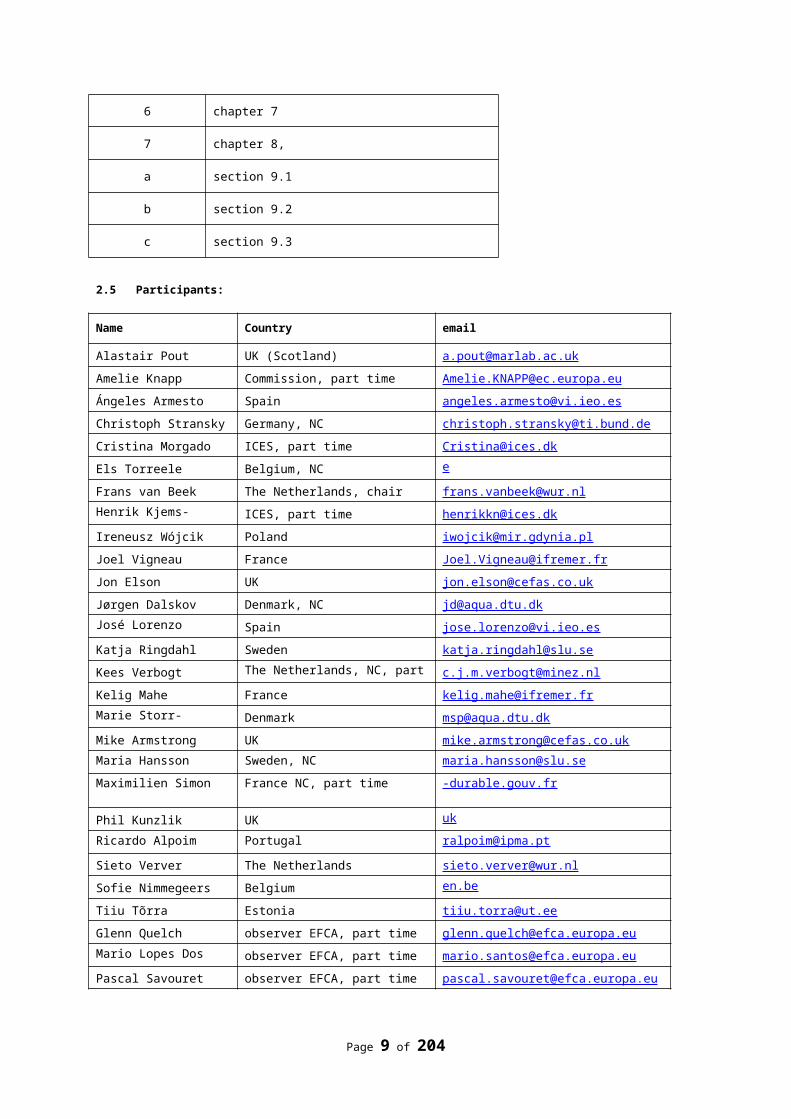
2.5 Participants:
Name Country email
Alastair Pout UK (Scotland) [email protected]
Amelie Knapp Commission, part time [email protected]
Ángeles Armesto Spain [email protected]
Christoph Stransky Germany, NC [email protected]
Cristina Morgado ICES, part time [email protected]
Els Torreele Belgium, NC [email protected]
Frans van Beek The Netherlands, chair [email protected]
Henrik Kjems-Nielsen ICES, part time [email protected]
Ireneusz Wójcik Poland [email protected]
Joel Vigneau France [email protected]
Jon Elson UK [email protected]
Jørgen Dalskov Denmark, NC [email protected]
José Lorenzo González Spain [email protected]
Katja Ringdahl Sweden [email protected]
Kees Verbogt The Netherlands, NC, part time [email protected]
Kelig Mahe France [email protected]
Marie Storr-Paulsen Denmark [email protected]
Mike Armstrong UK [email protected]
Maria Hansson Sweden, NC [email protected]
Maximilien Simon France NC, part time durable.gouv.fr
Phil Kunzlik UK [email protected]
Ricardo Alpoim Portugal [email protected]
Sieto Verver The Netherlands [email protected]
Sofie Nimmegeers Belgium [email protected]
Tiiu Tõrra Estonia [email protected]
Glenn Quelch observer EFCA, part time [email protected]
Mario Lopes Dos Santos observer EFCA, part time [email protected]
Pascal Savouret observer EFCA, part time [email protected]
Also invitations were send to Norway, Iceland and the Faroe Islands to participate in the meeting as observers. Norway replied that this was not possible this year. No response was received from Island and the Faroe Islands. One MS, present in previous year, refrained from participations due to lack of resources.
2.6 European Fisheries Control Agency (EFCA)
The meeting was hosted by the European Fisheries Control Agency, This Agency was founded in 2005 as the Community Fisheries Control Agency by an act of secondary legislation – Council Regulation (EC) No. 768/2005.
Page 8 of 176
This founding regulation was later amended by Council Regulation (EC) No. 1224/2009 (the so-called Control Regulation’), which broadened the mandate of the Agency and introduced additional tasks.
The Agency was renamed the European Fisheries Control Agency from 01 January 2012 following changes introduced by the Treaty of Lisbon.
The primary role of the Agency is to assist Member States to better meet their obligations under the Common Fisheries Policy (CFP); thus contributing to the cultivation of a culture of compliance and the establishment of a level playing field in EU fisheries.
The principal tool of the Agency is the Joint Deployment Plan (JDP), which is designed to give effect to the requirements of Specific Control and Inspection Programmes (SCIPs), which in turn are associated with recovery plans for certain stocks. JDPs are also adopted to help the Union meet its obligations arising by virtue of membership of Regional Fisheries management Organisations (RFMOs).
JDPs are currently active for the North Sea, Baltic Sea, western waters, Mediterranean and Black Seas and the NAFO, NEAFC and ICCAT RFMOs.
The Agency is also active in certain elements of the external policy of the Union in the context of fisheries.
A developing role of the Agency is assisting the European Commission and Member States in a range of fisheries control related matters. Currently, key initiatives under development are tools for compliance evaluation, risk management and cost-effectiveness.
Page 9 of 176
3. Review progress in regional co-ordination since the 2012 RCMBetween this year’s and last years meeting there were only limited activities of the RCM NS&EA. The activities were restricted to coordination between the chairs of the different RCMs regarding the harmonisation of the agenda’s of the RCM meetings in 2013, the format of the RCM report and launching a harmonised data call for the RDB. The data requested in the call were needed for coordination the data collection between MS in 2014 and for the evaluation of quality of data in the 2013 meeting. Between last year and this year’s meeting at least one bi-lateral meetings was held between MS.
Progress has been made with the RDB and its use. Although no funds were available for further development of the database, progress has been made in maintaining the database and to give technical support and training to the MS. The activities carried out around the RDB are described in section 4.1 of this report and have resulted in a better compliance with the data call compared to previous years. For the first time, all countries in the region have supplied data to the RDB and this is considered to be a great progress. In order to prepare the RDB for future tasks under the DC-MAP, faster progress needs to be made in further development of the RDB.
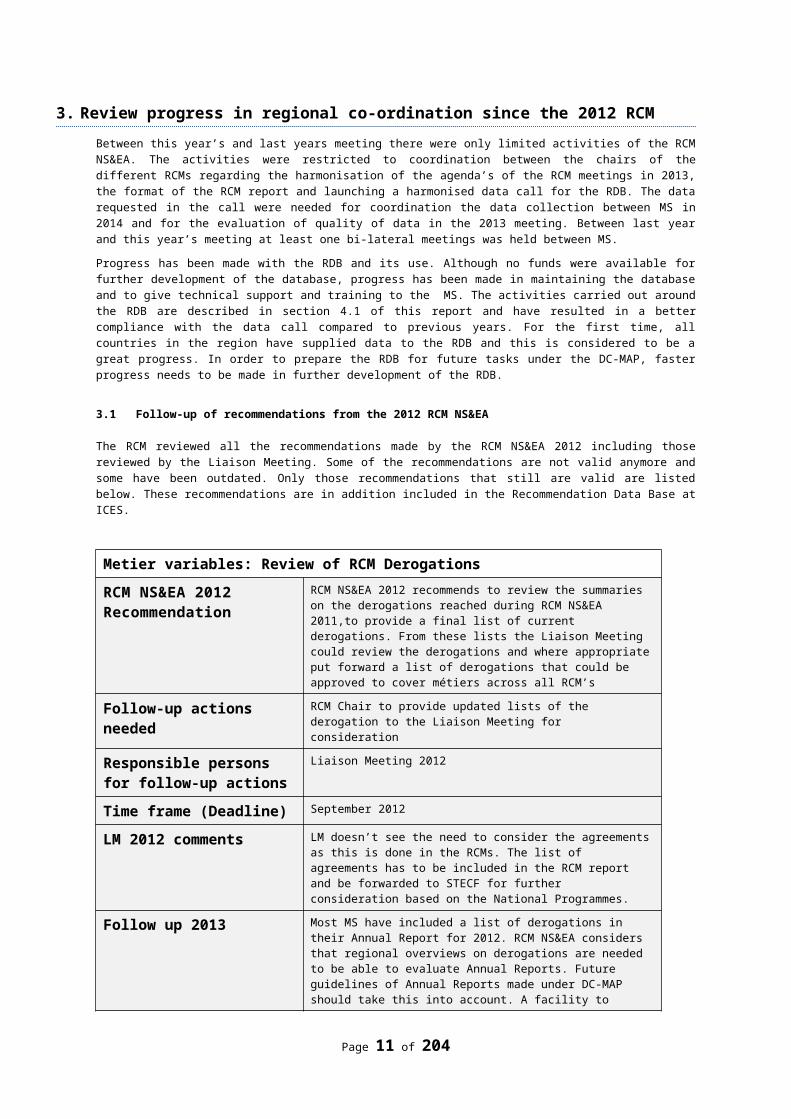
3.1 Follow-up of recommendations from the 2012 RCM NS&EA
The RCM reviewed all the recommendations made by the RCM NS&EA 2012 including those reviewed by the Liaison Meeting. Some of the recommendations are not valid anymore and some have been outdated. Only those recommendations that still are valid are listed below. These recommendations are in addition included in the Recommendation Data Base at ICES.
Metier variables: Review of RCM Derogations
RCM NS&EA 2012 Recommendation
RCM NS&EA 2012 recommends to review the summaries on the derogations reached during RCM NS&EA 2011,to provide a final list of current derogations. From these lists the Liaison Meeting could review the derogations and where appropriate put forward a list of derogations that could be approved to cover métiers across all RCM’s
Follow-up actions needed RCM Chair to provide updated lists of the derogation to the Liaison Meeting for consideration
Responsible persons for follow-up actions
Liaison Meeting 2012
Time frame (Deadline) September 2012
LM 2012 comments LM doesn’t see the need to consider the agreements as this is done in the RCMs. The list of agreements has to be included in the RCM report and be forwarded to STECF for further consideration based on the National Programmes.
Follow up 2013 Most MS have included a list of derogations in their Annual Report for 2012. RCM NS&EA considers that regional overviews on derogations are needed to be able to evaluate Annual Reports. Future guidelines of Annual Reports made under DC-MAP should take this into account. A facility to maintain an overview of derogations in a database (for example a Regional Data Base) should be considered.
Page 10 of 176
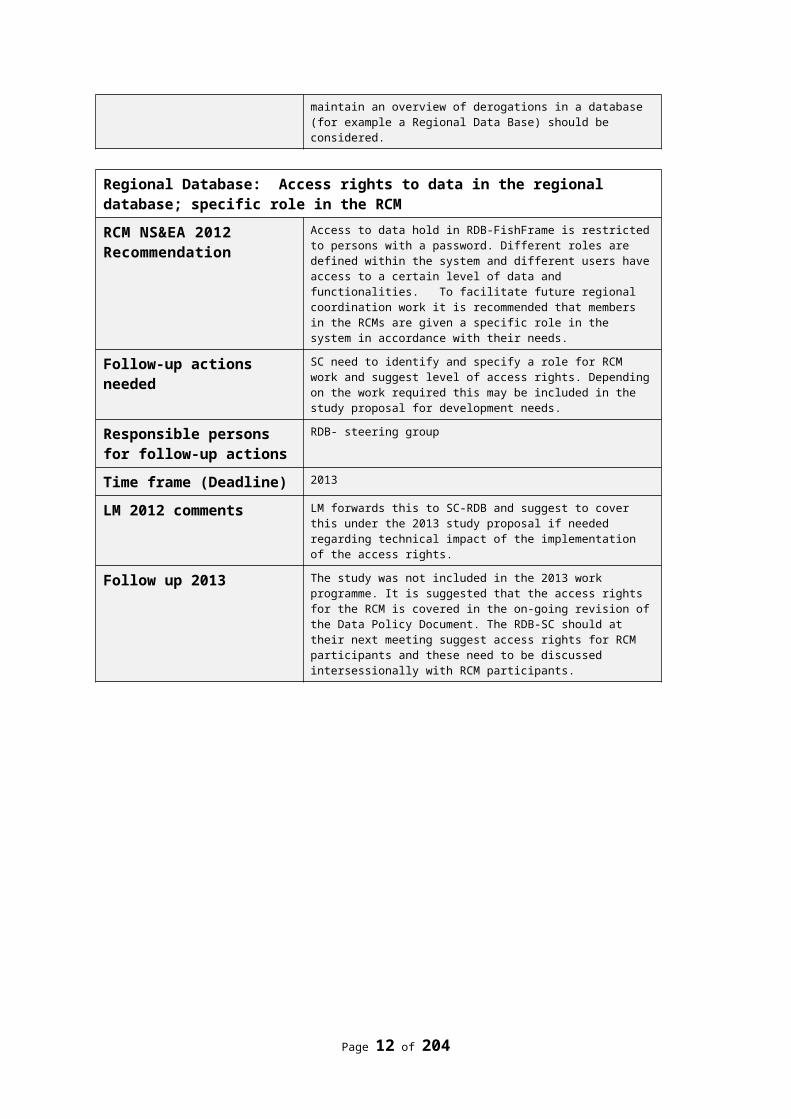
Regional Database: Access rights to data in the regional database; specific role in the RCM
RCM NS&EA 2012 Recommendation
Access to data hold in RDB-FishFrame is restricted to persons with a password. Different roles are defined within the system and different users have access to a certain level of data and functionalities. To facilitate future regional coordination work it is recommended that members in the RCMs are given a specific role in the system in accordance with their needs.
Follow-up actions needed SC need to identify and specify a role for RCM work and suggest level of access rights. Depending on the work required this may be included in the study proposal for development needs.
Responsible persons for follow-up actions
RDB- steering group
Time frame (Deadline) 2013
LM 2012 comments LM forwards this to SC-RDB and suggest to cover this under the 2013 study proposal if needed regarding technical impact of the implementation of the access rights.
Follow up 2013 The study was not included in the 2013 work programme. It is suggested that the access rights for the RCM is covered in the on-going revision of the Data Policy Document. The RDB-SC should at their next meeting suggest access rights for RCM participants and these need to be discussed intersessionally with RCM participants.
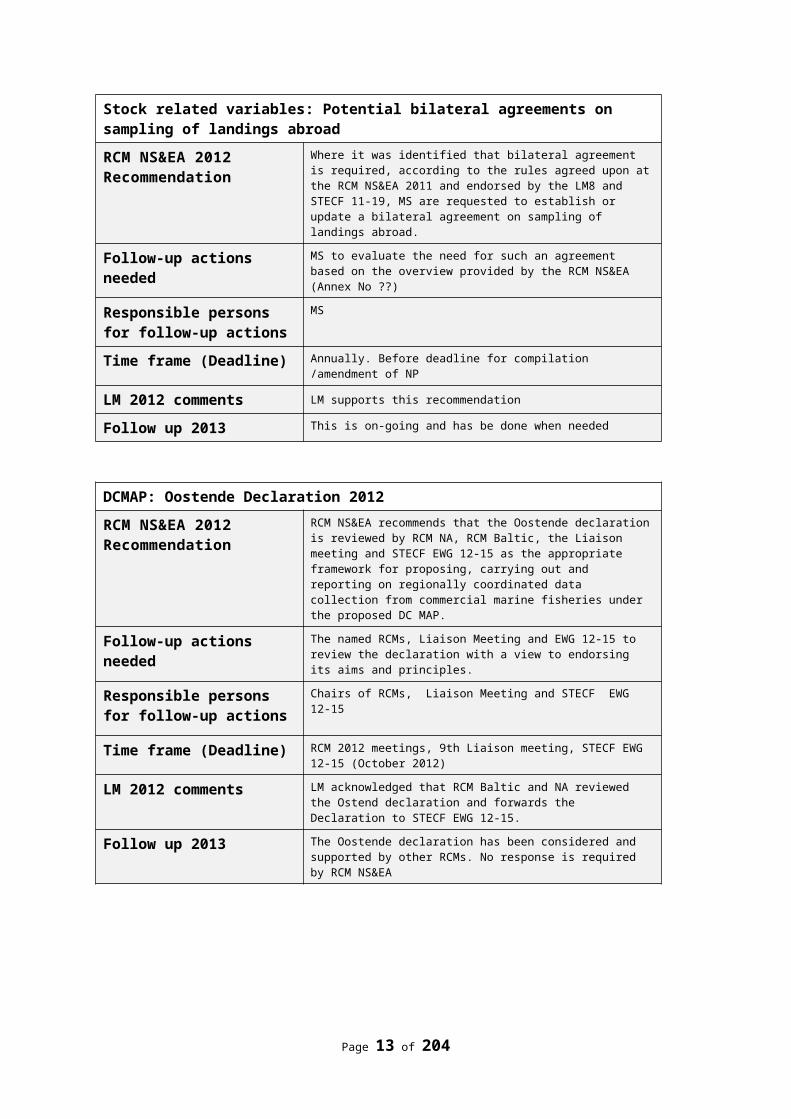
Stock related variables: Potential bilateral agreements on sampling of landings abroad
RCM NS&EA 2012 Recommendation
Where it was identified that bilateral agreement is required, according to the rules agreed upon at the RCM NS&EA 2011 and endorsed by the LM8 and STECF 11-19, MS are requested to establish or update a bilateral agreement on sampling of landings abroad.
Follow-up actions needed MS to evaluate the need for such an agreement based on the overview provided by the RCM NS&EA (Annex No ??)
Responsible persons for follow-up actions
MS
Time frame (Deadline) Annually. Before deadline for compilation /amendment of NP
LM 2012 comments LM supports this recommendation
Follow up 2013 This is on-going and has be done when needed
Page 11 of 176
DCMAP: Oostende Declaration 2012
RCM NS&EA 2012 Recommendation
RCM NS&EA recommends that the Oostende declaration is reviewed by RCM NA, RCM Baltic, the Liaison meeting and STECF EWG 12-15 as the appropriate framework for proposing, carrying out and reporting on regionally coordinated data collection from commercial marine fisheries under the proposed DC MAP.
Follow-up actions needed The named RCMs, Liaison Meeting and EWG 12-15 to review the declaration with a view to endorsing its aims and principles.
Responsible persons for follow-up actions
Chairs of RCMs, Liaison Meeting and STECF EWG 12-15
Time frame (Deadline) RCM 2012 meetings, 9th Liaison meeting, STECF EWG 12-15 (October 2012)
LM 2012 comments LM acknowledged that RCM Baltic and NA reviewed the Ostend declaration and forwards the Declaration to STECF EWG 12-15.
Follow up 2013 The Oostende declaration has been considered and supported by other RCMs. No response is required by RCM NS&EA
Regional Database: Review of the Data Policy Document
RCM NS&EA 2012 Recommendation
In respect of the development of the RDB and the protection of the data and the ownership of the data, a draft Data Policy Document has been established. The data policy document is based on the current situation but need to reviewed in all its aspects in order to be satisfactory for all MS. The data policy document is a “flexible” document and must be updated as the needs and the development of the RDB are changing. For example, a new data policy document will be prepared if there are changes to the exchange format (update is needed). The document is available in Annex 5 of the RCM report or through link: https://groupnet.ices.dk/rcm2012/nsea/Report%202012/Forms/AllItems.aspx?RootFolder=%2frcm2012%2fnsea%2fReport%202012%2fToR6%20%2d%20RDB&FolderCTID=&View=%7b3B9FD9D2%2d7943%2d41B0%2dAE26%2d53E95ED5D50A%7d)
Follow-up actions needed The National Correspondents (NC) from all MS are requested to read through the document, and sent all remarks and/or suggestions for improvements to the chair of the relevant RCM and to the RDB Steering Group (RDB-SG). Even if the NC has no specific remarks or suggestions, it is recommended to send a notification that the document has been read. Based on the input from the NCs, an updated version will be presented at the next NC Coordination meeting organized by the EC.
Responsible persons for follow-up actions
Chair RCM & RDB-SG, National Correspondents of all MS, EC
Time frame (Deadline) Before the 15th of November 2012
LM 2012 comments LM agrees with this recommendation and recommends the Commission to forward the request to the NC’s
Follow up 2013 This has been done.
Page 12 of 176
3.2 Follow-up of recommendations from the 9th LM meeting
The 9th Liaison Meeting between the Chairs of the RCMs, the Chair of ICES, PGCCDBS, the Chair of PGMED, the ICES representative, the Chairs of STECF DCF EWG’s and the European Commission, joined for the first time also by the Chairs of PGECON and Regional Database Steering Committee, was held in Brussels on 24/09/2012 - 26/09/2012.
The main tasks for the 9th LM were: to analyse the RCM reports in order to ensure overall coordination between the RCMs, Overview of use of the Regional Databases for RCMs in 2012, including the RCM data call, and
problems identified Feedback from data end users Advice on the principles of the DC-MAP development, including future role of RCMs and the
appropriate process to deal with by-catch and discards issues To review the list of DCF eligible meeting in 2013 and proposed workshops and studies
The 9th LM discussed and reviewed the follow up of the 8th LM recommendations. The main on-going recommendation supported by both 8th LM and 9th LM include:
Maintain and keep updating the LM Recommendations Database facilitated by ICES Online access to national logbook data and national VMS data (in order to ensure possibilities for
adequate sampling of biological and metier related data including landings in foreign MS) One coordinated data call shall take place each year, instead of many data calls taking place so
far with the same set of data required more than once in the same year and in different formats every time.
A summary of the reports and main outcomes of all RCMs, PGECON, PGMed and SC-RDB held in 2012 as well as key recommendations were presented by the respective Chairs.
Reminder of the recommendation of the 8th LM, supported by the 9th LM
“ … In order to deliver an effective and efficient meeting, the LM recommends that for future presentations of RCM reports, the chairs present no more than 5 key recommendations for consideration and discussion by the LM.
The chairs should also give a short overview of the report raising any general issues for the LM. The entire list of recommendations from each RCM report will be attached to future LM reports as an ANNEX to assist National Correspondents in compiling National Programmes and Annual Reports.
The 9th LM also discussed the development in the area of Regional Database (FishFrame) utilization and outcomes from the RDB Workshops held in 2012. MS participating in the RCM Baltic, RCM NS&EA and RCM NA uploaded data in the RDB-FishFrame as a response of a data call launched by the RCM chairs. The purpose of the data call was twofold:
To facilitate analyses for regional sampling strategies at the upcoming 2012 RCMs. To gain experience in uploading data to RDB-FishFrame and to discuss these experiences at the
RCMs
In particular the data uploaded by MS to the RDB facilitated analyses on: Landings in foreign countries – were do we need to have bilateral agreements in place Ranking of metiers to sample Regional overviews of sampling intensity Data quality at a regional level- simple plots of e.g. length at age reveal if there are differences in
countries or not
Only two MS did not uploaded any data. Most MS managed to upload at least part of the requested data. There were several reasons for MS failing to deliver all the requested data. These reasons are described in the RCM reports and include:
Some MS were unable to load specific data types because of coding issues (reference tables in FishFrame)
Problems to convert data in national databases into the FishFrame format in an efficient way
Page 13 of 176
Impossibility to report missing values on mandatory field leading to entire sets of valid data not to be uploaded.
Privacy issues; The fields Vessel_length, Vessel_power, Vessel_size are mandatory in the TR file, MS expressed concerns that these values could matched with fleet registers and individual vessels be identified.
With regard to the data call launched by RCMs chairs and the response received from MS, the LM concluded that it would be beneficial if the results of the data call are presented at a meeting between National Correspondents. The RCM chairs should compile the information and one of them should present the result at the meeting.
Reflecting on the outcomes of RDB workshops, the LM encourages MS to participate in forthcoming RDB workshops. As regards the future work related to RDB, the LM recommends the SC-RDB to develop a timeline for user objectives and developments in the RDB-FishFrame. There should be two scenarios, one with money and one without.
In a discussion on the feedback from the end-users, the LM noted that, the ICES feedback on DCF data transmission is primarily prepared by the ICES stock coordinators. Stock coordinators are not aware of the data that was being collected and available for scientific use. Therefore, the option not transmitted to ICES could be used, when a given set of data was:
i) not collected due to derogations or minor landings and ii) collected by another Member states after bilateral agreements.
The RCM-NA proposed changes for the current report on data transmission to ICES, and this proposal could be analysed by ICES and the European Commission.
With regard to data transmission failures, the LM noted that it is widely agreed that some perceived data failures are of minor importance and do not have any effect on the ability of the assessment working groups (AWG’s) to complete their stock assessments. However in some cases non transmission of data from key players involved in a fishery have major consequences for the quality of an assessment and perhaps hampers the ability of the AWG from completing a stock assessment successfully.The 9th Liaison Meeting recommended that :
the degree of financial penalties issued by the EU Commission should be weighted to reflect the seriousness of the impacts of the data failure, in order to encourage those member states to provide the relevant data in future.
it would appear to be more productive, to tackle the high impact data failures as a priority in the first instance, and then look to the minor data failures after these issues have been resolved.
this is perhaps an issue that should be reflected in the new DC-MAP.
With regard to the progress towards the DC-MAP, the feedback was provided to the LM by the Commission.
An iimportant steps were taken by the Council in June 2012 where they considered and agreed with the future direction of the DC-MAP. The first plenary vote was taken in mid September 2012. Embedded in the EMFF negotiations is the financial framework budget planning which has not yet been decided.
In terms of the Data Collection, there is good support from the Council and the Parliament for what is proposed in the basic regulation, Article 37. This article outlines the data collection set-up and Member State obligations. The idea of the DC-MAP providing stability for a seven year period is not designed to create inflexibility. Decisions need to be taken in consultation with Member States and end users to establish what is valid for the seven year period and what requires and element of flexibility.
There are on-going discussions with Member States on how detailed the Operation Programs needs to be. However the general consensus regarding the AWP is that they should not be resubmitted except where major change is necessary. If no substantive changes need to be made it will be sufficient to e mail the Commission confirming this.
The philosophy regarding the levying of fines, as a consequences for Data Failures is that in the first instance, all attempts will be made to ensure that each MS has the capacity and skills available to them to successfully fulfil their obligations under the DC-MAP.
Page 14 of 176
Ex-ante conditionality seeks to ensure that the necessary preconditions for investments to flourish are in place. Four types of preconditions can be identified:
(i) regulatory,(ii) strategic, (iii) infrastructural-planning and (iv) institutional.
The Commission will be conducting a review regarding the status of each Member State’s ability to deliver on the DC-MAP. If the conclusion of this review is that improvement is required in one area or another, an action plan will be agreed. This action plan could include additional training, support for database development etc… and if necessary can be supported beyond the 65% finance threshold, in order to allow the Member State build up the necessary capacity. If however, the action plan is not implemented during the life time of the programme, this could form the basis for an interruption of payments or the Commission may stop payments altogether.
The 9th LM invited the Commission to comment on the content and status of the Oostende Declaration. The Oostende Declaration was initially proposed by the Regional Coordination meeting (RCM) RCM NS&EA (held in Oostende 3-7 September 2012) as a reflection on the need for a new philosophy and approach to data collection, in the DC-MAP. The principles of that new approach were described in a document named the “Oostende Declaration” which was then circulated for comment and support to other RCM’s. The RCM’s supported the spirit of the Oostende Declaration and as a result the declaration was submitted to the Commission for its consideration.
The Commissions reaction to the Oostende Declaration was very positive and it would appear that all parties are aligned in their aspirations to ensure that the DC-MAP ensures:
greater end-user consultation and involvement, a more regionalized approach to sampling, and task sharing, with an expanded role for the
RCM’, a move towards more statistically robust sampling schemes.
There is also common ground on the appreciation of the importance of the Regional Data Base (RDB) as a tool to facilitate the move towards regionally coordinated sampling programmes.
The Commission and the members of the Liaison Meeting highlighted that they are anxious to avoid the allocation of prescriptive values as measures of data quality as was done in the DCF (i.e. using cv targets alone as an indicator of data quality).
A draft list of eligible meeting prepared by the European Commission was available to the LM for a revision. The LM made also a review of the study proposals 2013 prosed by different groups such as the ICES PGCCDBS, survey planning groups and the various RCM’s, as well as RCM 2013 Terms of Reference.
The LM acknowledged the ICES secretariat for setting up a recommendations database on the RCM Share Point for all areas. It is accessible by all RCM members in read-only format and the RCM chairs have read/write access. All recommendations, as well all strategic comments and suggestion, are available in the recommendations database, providing the possibility of tracking all. The history of the recommendations will also be kept in the database allowing the RCMs to keep track of the history of recommendations as well as strategic comments and reflections. RCM chairs are requested to complete the RCM recommendation database with all recommendations, suggestions and reflections.
It was recommended by the RCMNS&EA 2012 to review the summaries of the derogations reached during the RCMS 2011, to provide a final list of current derogations. From these lists the Liaison Meeting could review the derogations and where appropriate put forward a list of derogations that could be approved across all RCM’s. To keep track and have a transparent system of the approved derogations, a derogation database, similar to the one set up for the recommendations, could be an efficient solution. The setting up and coordination of a derogation database should be available on the DCF-JRC website.
It was scheduled for the RCM Chairs to provide an updated lists of the derogations to the Liaison Meeting for consideration. However, due to the lack of sufficient time left, this was not possible to achieve.
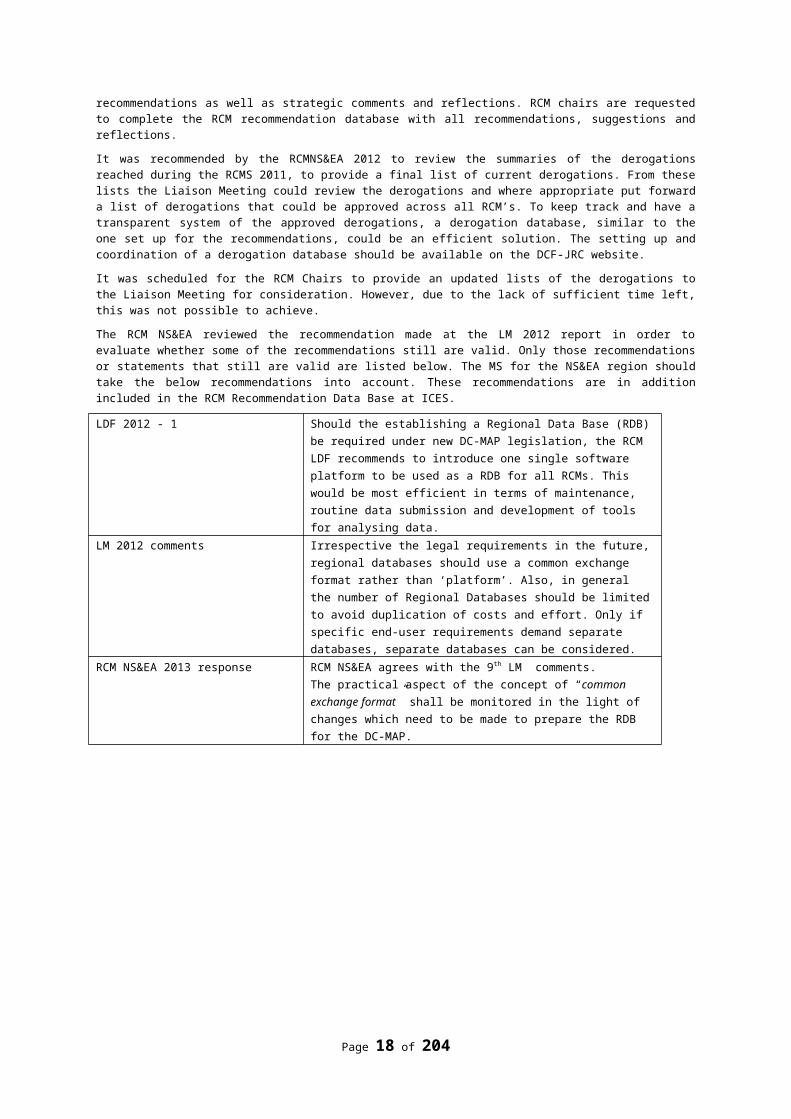
The RCM NS&EA reviewed the recommendation made at the LM 2012 report in order to evaluate whether some of the recommendations still are valid. Only those recommendations or statements that still are
Page 15 of 176
valid are listed below. The MS for the NS&EA region should take the below recommendations into account. These recommendations are in addition included in the RCM Recommendation Data Base at ICES.
LDF 2012 - 1 Should the establishing a Regional Data Base (RDB) be required under new DC-MAP legislation, the RCM LDF recommends to introduce one single software platform to be used as a RDB for all RCMs. This would be most efficient in terms of maintenance, routine data submission and development of tools for analysing data.
LM 2012 comments Irrespective the legal requirements in the future, regional databases should use a common exchange format rather than ‘platform’. Also, in general the number of Regional Databases should be limited to avoid duplication of costs and effort. Only if specific end-user requirements demand separate databases, separate databases can be considered.
RCM NS&EA 2013 response RCM NS&EA agrees with the 9th LM comments.The practical aspect of the concept of “common exchange format” shall be monitored in the light of changes which need to be made to prepare the RDB for the DC-MAP.
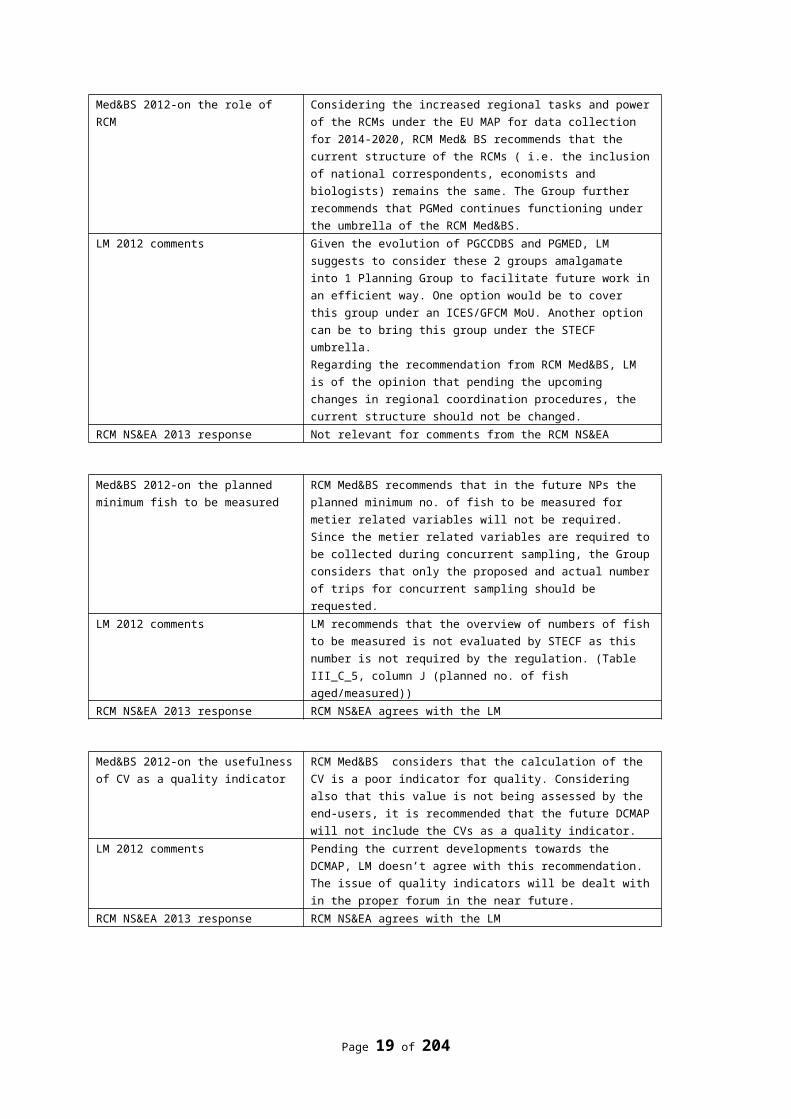
Med&BS 2012-on the role of RCM Considering the increased regional tasks and power of the RCMs under the EU MAP for data collection for 2014-2020, RCM Med& BS recommends that the current structure of the RCMs ( i.e. the inclusion of national correspondents, economists and biologists) remains the same. The Group further recommends that PGMed continues functioning under the umbrella of the RCM Med&BS.
LM 2012 comments Given the evolution of PGCCDBS and PGMED, LM suggests to consider these 2 groups amalgamate into 1 Planning Group to facilitate future work in an efficient way. One option would be to cover this group under an ICES/GFCM MoU. Another option can be to bring this group under the STECF umbrella.Regarding the recommendation from RCM Med&BS, LM is of the opinion that pending the upcoming changes in regional coordination procedures, the current structure should not be changed.
RCM NS&EA 2013 response Not relevant for comments from the RCM NS&EA
Med&BS 2012-on the planned minimum fish to be measured
RCM Med&BS recommends that in the future NPs the planned minimum no. of fish to be measured for metier related variables will not be required. Since the metier related variables are required to be collected during concurrent sampling, the Group considers that only the proposed and actual number of trips for concurrent sampling should be requested.
LM 2012 comments LM recommends that the overview of numbers of fish to be measured is not evaluated by STECF as this number is not required by the regulation. (Table III_C_5, column J (planned no. of fish aged/measured))
RCM NS&EA 2013 response RCM NS&EA agrees with the LM
Page 16 of 176
Med&BS 2012-on the usefulness of CV as a quality indicator
RCM Med&BS considers that the calculation of the CV is a poor indicator for quality. Considering also that this value is not being assessed by the end-users, it is recommended that the future DCMAP will not include the CVs as a quality indicator.
LM 2012 comments Pending the current developments towards the DCMAP, LM doesn’t agree with this recommendation. The issue of quality indicators will be dealt with in the proper forum in the near future.
RCM NS&EA 2013 response RCM NS&EA agrees with the LM
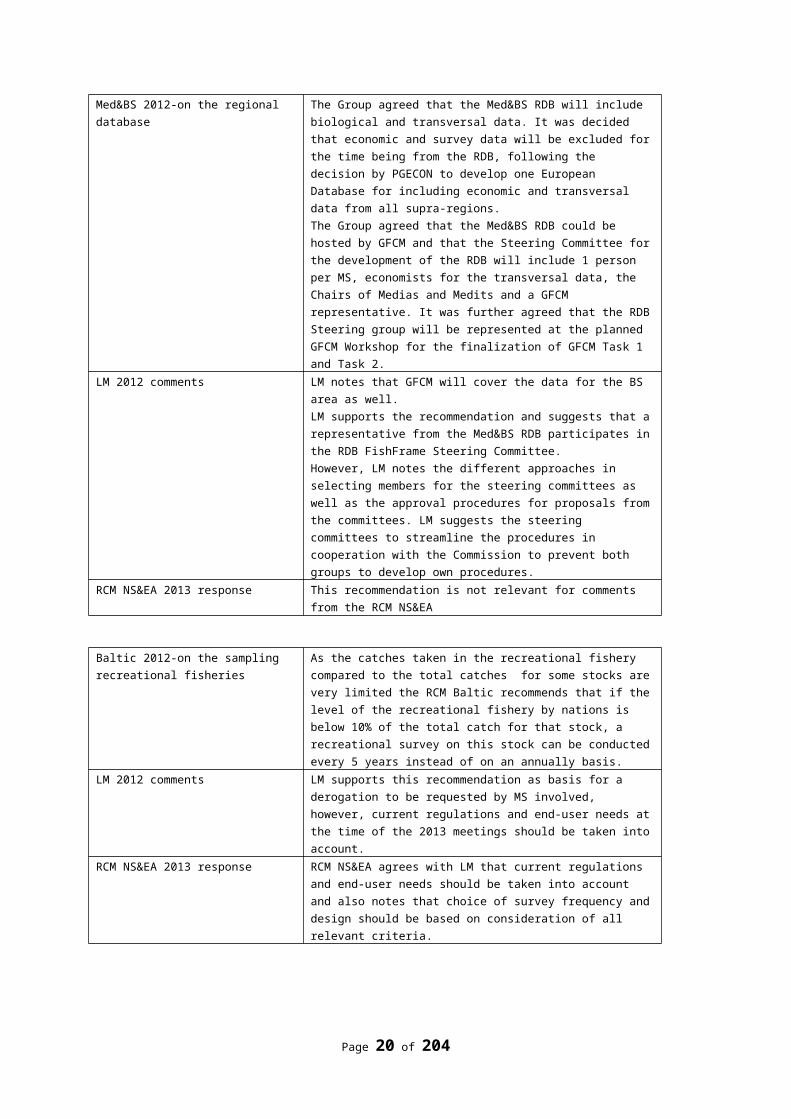
Med&BS 2012-on the regional database
The Group agreed that the Med&BS RDB will include biological and transversal data. It was decided that economic and survey data will be excluded for the time being from the RDB, following the decision by PGECON to develop one European Database for including economic and transversal data from all supra-regions.The Group agreed that the Med&BS RDB could be hosted by GFCM and that the Steering Committee for the development of the RDB will include 1 person per MS, economists for the transversal data, the Chairs of Medias and Medits and a GFCM representative. It was further agreed that the RDB Steering group will be represented at the planned GFCM Workshop for the finalization of GFCM Task 1 and Task 2.
LM 2012 comments LM notes that GFCM will cover the data for the BS area as well.LM supports the recommendation and suggests that a representative from the Med&BS RDB participates in the RDB FishFrame Steering Committee.However, LM notes the different approaches in selecting members for the steering committees as well as the approval procedures for proposals from the committees. LM suggests the steering committees to streamline the procedures in cooperation with the Commission to prevent both groups to develop own procedures.
RCM NS&EA 2013 response This recommendation is not relevant for comments from the RCM NS&EA
Page 17 of 176
Baltic 2012-on the sampling recreational fisheries
As the catches taken in the recreational fishery compared to the total catches for some stocks are very limited the RCM Baltic recommends that if the level of the recreational fishery by nations is below 10% of the total catch for that stock, a recreational survey on this stock can be conducted every 5 years instead of on an annually basis.
LM 2012 comments LM supports this recommendation as basis for a derogation to be requested by MS involved, however, current regulations and end-user needs at the time of the 2013 meetings should be taken into account.
RCM NS&EA 2013 response RCM NS&EA agrees with LM that current regulations and end-user needs should be taken into account and also notes that choice of survey frequency and design should be based on consideration of all relevant criteria.
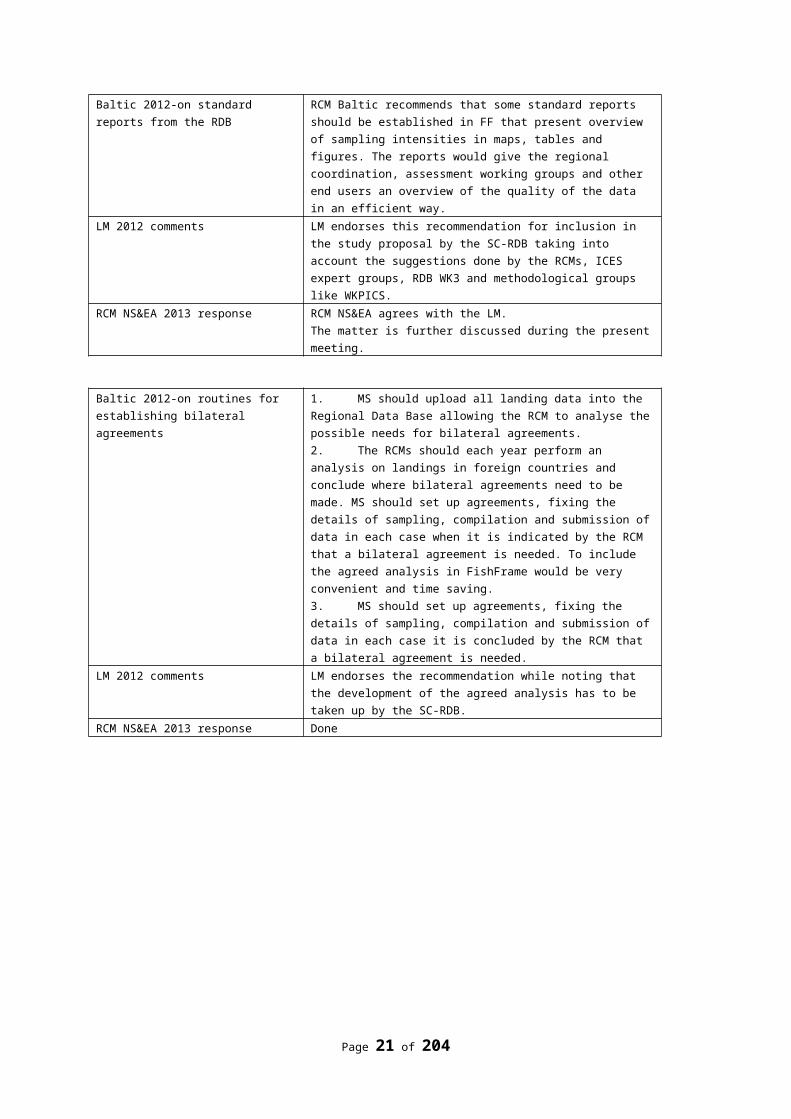
Baltic 2012-on standard reports from the RDB
RCM Baltic recommends that some standard reports should be established in FF that present overview of sampling intensities in maps, tables and figures. The reports would give the regional coordination, assessment working groups and other end users an overview of the quality of the data in an efficient way.
LM 2012 comments LM endorses this recommendation for inclusion in the study proposal by the SC-RDB taking into account the suggestions done by the RCMs, ICES expert groups, RDB WK3 and methodological groups like WKPICS.
RCM NS&EA 2013 response RCM NS&EA agrees with the LM.The matter is further discussed during the present meeting.
Baltic 2012-on routines for establishing bilateral agreements
1. MS should upload all landing data into the Regional Data Base allowing the RCM to analyse the possible needs for bilateral agreements.2. The RCMs should each year perform an analysis on landings in foreign countries and conclude where bilateral agreements need to be made. MS should set up agreements, fixing the details of sampling, compilation and submission of data in each case when it is indicated by the RCM that a bilateral agreement is needed. To include the agreed analysis in FishFrame would be very convenient and time saving.3. MS should set up agreements, fixing the details of sampling, compilation and submission of data in each case it is concluded by the RCM that a bilateral agreement is needed.
LM 2012 comments LM endorses the recommendation while noting that the development of the agreed analysis has to be taken up by the SC-RDB.
RCM NS&EA 2013 response Done
Page 18 of 176
Baltic 2012-on sampling of metier related variables in foreign landings
The RCM Baltic 2012 recommends that landings should not be sampled abroad by landings countries as these data cannot be used but should be compensated by the flag countries by a higher sampling level in the flag country.
LM 2012 comments LM supports the recommendation for 2013 under the conditions that:1 The data needs of the end-users are sufficiently covered under the current standards.2 MS involved specify the approach through a derogation or a bilateral
RCM NS&EA 2013 response RCM NS&EA finds this recommendation to generic. Obligations for sampling of foreign landings are included in 2010/93. Data should be collected in a way that it can be used and this need to be assured in the bilateral agreements. Sampling of foreign landings needs to be considered in future regional sampling plans and within the context of statistically sound sampling.
Baltic 2012-on Standard reports in the Regional database
The RCM Baltic recommends that in order to facilitate the data upload process it should be possible to download the look up tables.In addition, for the purpose of the RCM-Baltic report with non-processed data should be developed. As a start very simple reports where it is possible to tabulate the results are needed, see “Overview of used data" for data needed by the RCM-BalticPure ‘Data dump’ as raw as the data policy allows could also be a quick way to enable work with the uploaded data.More sophisticated reports with maps and graphs should also be developed, see RCM Baltic 2012 report for inspiration.
LM 2012 comments LM endorses this recommendation and forwards this to SC-RDB to take into account the suggestions done by the 2012 RCMs.
RCM NS&EA 2013 response Not relevant for comments from the RCM NS&EA
NA 2012-on bilateral agreements RCM NA recommends MS put in place bilateral agreements for sampling of landings abroad where applicable.
LM 2012 comments LM endorses this recommendationRCM NS&EA 2013 response RCM NS&EA agrees with the LM
3.3 Feedback and recommendation from data end users
3.3.1 STECF EWGs
A series of 4 consecutive STECF Expert Working groups meetings was held in 2012-2013 to review the proposed changes in the European Data collection Framework. The outcomes of these meetings are reviewed by STECF plenary. The outcomes of the following meetings were considered:
- EWG 12-01, March 2012, Ispra (reviewed by STECF 12-07)- EWG 12-15, Oct 2012, Brussels (reviewed by STECF 13-01)
Page 19 of 176
- EWG 13-02, Mar 2013, Ispra (reviewed by STECF 13-06),- EWG 13-05, Jun 2013, Varese (reviewed by STECF 13-12)
The meetings started off with the SWOT analysis of the DCF carried out at EWG 11-02 and 11-19. A number of points relevant to the RCMs are highlighted in this SWOT. Amongst the strengths are co-ordination and co-operation by MS and regional approach. Weaknesses are e.g. the limited use of metier data; DCF is output driven, rather than result driven; poor access to data sets and concurrent sampling. Opportunities are considered to be, amongst others: Centralized regional database; regional co-ordination and driven by end-users and managers. Threats are e.g. the limited use of metier information by end-users.
The presentation highlighted a couple of important items relevant to the RCM like flexibility of the programme. Currently fixed annexes describe sampling details and requirements. The idea is to transfer this to a more flexible Master Reference Register (MRR). However, the legal status of this MRR is limited, thus this can’t be used as legal basis for the data collection programme. The intention of the Commission is to have a Commission Decision detailing all the requirements, which can relatively easily be adapted. The MRR then remains the repository for descriptions of methodologies, glossaries and definitions.
The EWGs also provide proposals for definitions of end-users, the process to include the main end-users in the decision making process and how new variables can be added based on requirements. The idea is to have 3 type of end-users, while only the main end-user (end-user for whom the DCF/DC-MAP is designed) have direct influence on the specifications of data needs and requirements.
Regarding the role of the RCM in the future, it is proposed to transform the RCM to Regional Coordination Groups to “Increase the usability of data for end-users, improving the efficiency of the collection in the MS, coherent with the regionalized management of fish stocks proposed in the new CFP” To facilitate this, the RCG shall be a on-going process (including dedicated subgroups where needed), rather than one fixed meeting a year.
The EWGs also proposed procedures to review the current list of surveys for eligibility, as well as on how to include new surveys in the future. Crucial element in this process is the mandatory contribution to surveys by MS that have an interest (stock share) in the survey.
Other issues considered during the EWs are sampling design (MS shall apply design-based sampling as described by various specialist groups), metier approach (metiers remain for classification and comparison purposes, but not as primary sampling stratum), glossaries, key definitions and concurrent sampling on shore (not mandatory any more, but optional at discretion of MS).
One of the vital and crucial elements within the entire data collection process is the definite implementation and support for a regional database (RDB). All expert groups agree that having a centralized DB, be it regional for biological data, or supra-regional for economic data is absolutely paramount for regional coordination, reporting and analysis purposes.
3.3.1.1 PGECON
A short presentation was given on the Planning Group on Economic Issues met in Salerno, from 16 th to 19th April 2012.
PGECON is an operative meeting with a general aim to compare different approaches and to share different experiences. Participation is open to national experts involved in the implementation of the economic modules of the DCF.
The meeting dealt with a broad range of issues considered relevant for the improvement of the collection of economic data and for the evolution of the DCF.
A key topic for the meeting was the discussion on the revision of the data collection framework. for the economic modules of the DCF, a certain degree of flexibility would be advisable.
However, this flexibility should not exclude the necessity to also have stability in terms of the core of the economic data requirements.
the utility to implement a European database for the delivery and the access to economic data for the fleet, the aquaculture and the fish processing sector. Most of the participants were in favour of this proposal. A specific workshop should be convened to discuss the practical implementation of such database.
Page 20 of 176
3.3.2 ICES
3.3.2.1 ICES feed back to DC-MAP
In Spring 2012, ICES provide a generic feedback on data need to the European Commission. Four main item were recommended to be taken into account in the new DC-MAP: a) to be framed in regional basis; b) to considered the integration of data to assess the fisheries impacts on marine ecosystems and the implementation of the ecosystem approach to marine management; c) to have an improve user access; and d) to be more flexible and allow the inclusion of new types of data if needed.
In May 20013, ICES provided an more detailed feedback with: a) comments on previous STECF-EWG report on DC-MAP; b) other comments that were not been addressed yet, mainly on by-catch; c) overview of surveys used for basis of the ICES scientific advice and stocks with no fisheries independent data; d) overview of salmon data needs; e) overview of all the other stocks (except eels) data needs considering the short -term target category. The document provided by ICES was available to the RCM-North Sea and Eastern Arctic.
The data need for each stock depends of the respective category. Not all stocks should be under category 1 (stocks assessed with an analytical assessment and therefore using assessment model that are more data demanding).
The feedback from ICES was provided under the assumption that DC-MAP will be more flexible and will easily deal with additional requests for data, in case stocks are upgraded in the “stocks categories” (moving towards category 1). Therefore, this feedback is not static and should evolve throughout the years. DC-MAP should be able to cope with this dynamic aspect, within the legal framework.
3.3.2.2 Feedback from ICES Experts Groups
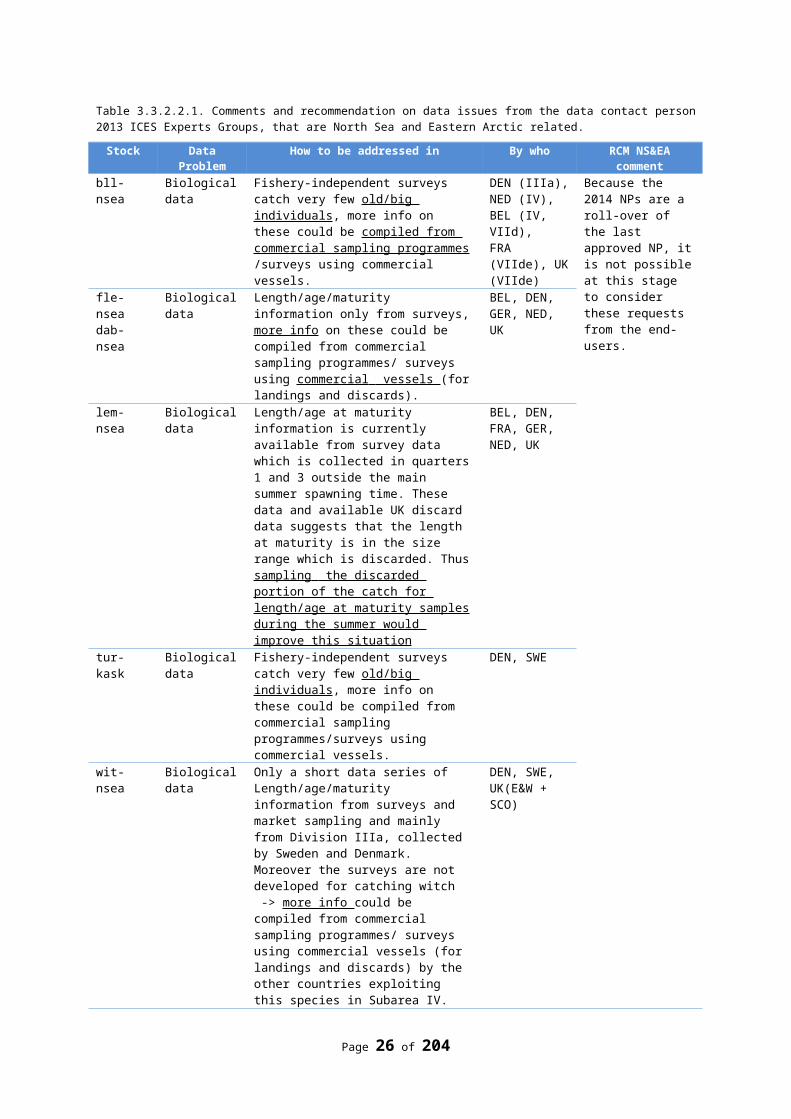
A list of recommendations from ICES Expert Groups (EGs) concerning data issues were presented to the RCM-North Sea and Eastern Arctic (see Tables 3.3.2.2.1 and 3.3.2.2.2). Data issues pointed out by EGs could be in the form of sampling data deficiency, needs for specific studies related with data collection, and comments on the actual data collection programmes that should be improved. The majority of these issues are related with increase of sampling intensity. Because the 2014 National Programmes are a roll-over of the last approved National Programmes it is not possible at this stage to consider these requests from the end-users.
ICES presented the comments from the EGs related to RCMs in general, RCM North Sea and Eastern Arctic, and ICES member countries that are exploring stocks under this RCM area (Tables 3.3.2.2.1 and 3.3.2.2.2). Some comments required actions while other are for information only. RCM North Sea and Eastern Arctic commented on the recommendations.
Page 21 of 176
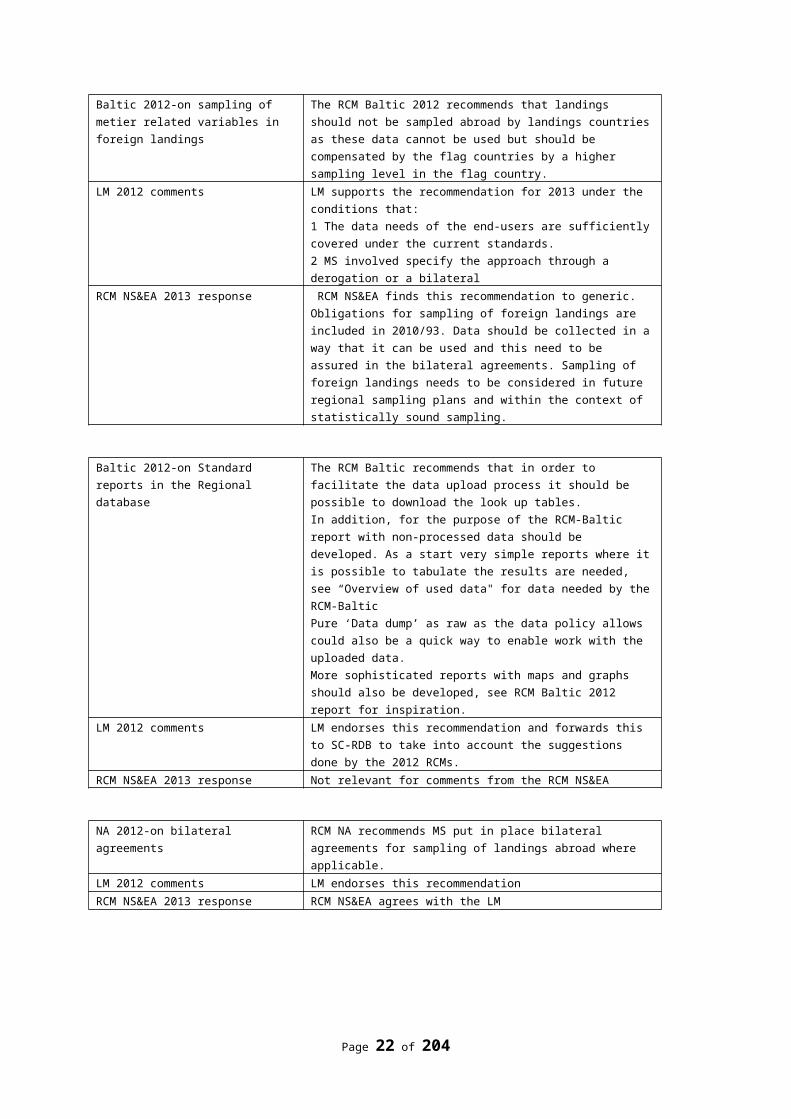
Table 3.3.2.2.1. Comments and recommendation on data issues from the data contact person 2013 ICES Experts Groups, that are North Sea and Eastern Arctic related.
Stock Data Problem
How to be addressed in By who RCM NS&EA comment
bll-nsea Biological data Fishery-independent surveys catch very few old/big individuals, more info on these could be compiled from commercial sampling programmes /surveys using commercial vessels.
DEN (IIIa), NED (IV), BEL (IV, VIId),FRA (VIIde), UK (VIIde)
Because the 2014 NPs are a roll-over of the last approved NP, it is not possible at this stage to consider these requests from the end-users.
fle-nseadab-nsea
Biological data Length/age/maturity information only from surveys, more info on these could be compiled from commercial sampling programmes/ surveys using commercial vessels (for landings and discards).
BEL, DEN, GER, NED, UK
lem-nsea Biological data Length/age at maturity information is currently available from survey data which is collected in quarters 1 and 3 outside the main summer spawning time. These data and available UK discard data suggests that the length at maturity is in the size range which is discarded. Thus sampling the discarded portion of the catch for length/age at maturity samples during the summer would improve this situation
BEL, DEN, FRA, GER, NED, UK
tur-kask Biological data Fishery-independent surveys catch very few old/big individuals, more info on these could be compiled from commercial sampling programmes/surveys using commercial vessels.
DEN, SWE
wit-nsea Biological data Only a short data series of Length/age/maturity information from surveys and market sampling and mainly from Division IIIa, collected by Sweden and Denmark. Moreover the surveys are not developed for catching witch -> more info could be compiled from commercial sampling programmes/ surveys using commercial vessels (for landings and discards) by the other countries exploiting this species in Subarea IV.
DEN, SWE, UK(E&W + SCO)
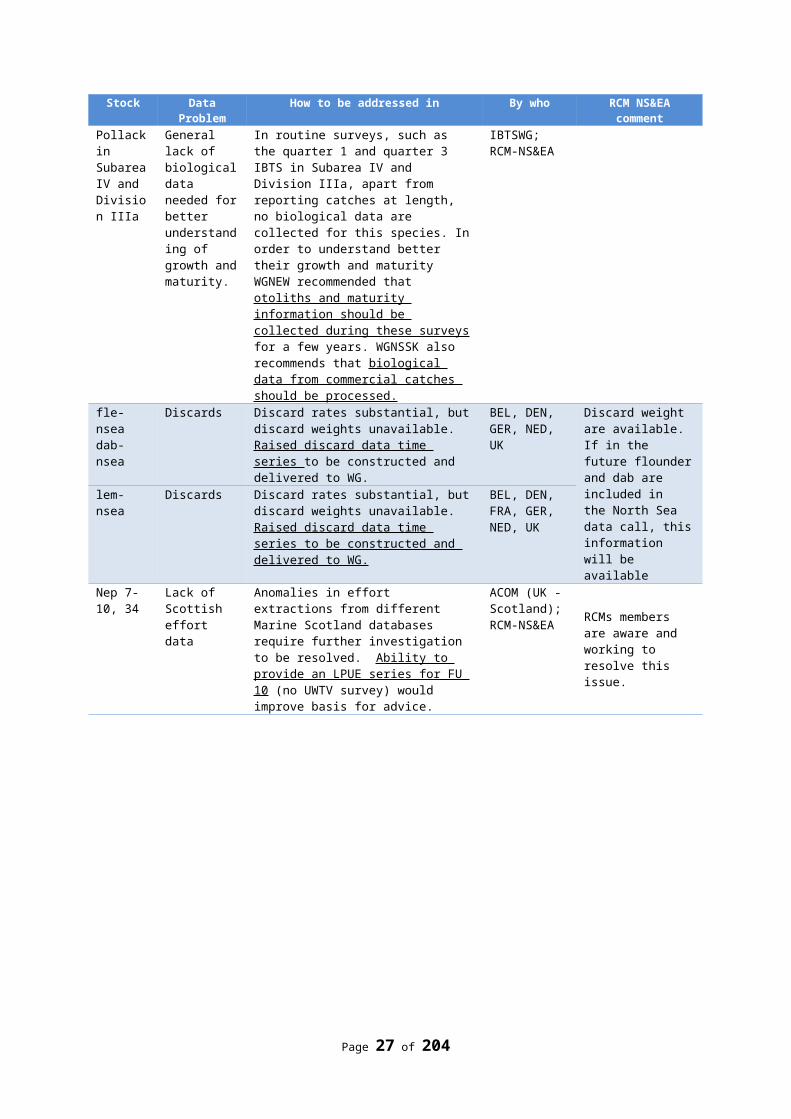
Pollack in Subarea IV and Division IIIa
General lack of biological data needed for better understanding of growth and maturity.
In routine surveys, such as the quarter 1 and quarter 3 IBTS in Subarea IV and Division IIIa, apart from reporting catches at length, no biological data are collected for this species. In order to understand better their growth and maturity WGNEW recommended that otoliths and maturity information should be collected during these surveys for a few years. WGNSSK also recommends that biological data from commercial catches should be processed.
IBTSWG; RCM-NS&EA
fle-nseadab-nsea
Discards Discard rates substantial, but discard weights unavailable. Raised discard data time series to be constructed and delivered to WG.
BEL, DEN, GER, NED, UK
Discard weight are available. If in the future flounder and dab are included in the North Sea data call, this information will be available
lem-nsea Discards Discard rates substantial, but discard weights unavailable. Raised discard data time series to be constructed and delivered to WG.
BEL, DEN, FRA, GER, NED, UK
Page 22 of 176
Stock Data Problem
How to be addressed in By who RCM NS&EA comment
Nep 7-10, 34
Lack of Scottish effort data
Anomalies in effort extractions from different Marine Scotland databases require further investigation to be resolved. Ability to provide an LPUE series for FU 10 (no UWTV survey) would improve basis for advice.
ACOM (UK - Scotland); RCM-NS&EA
RCMs members are aware and working to resolve this issue.
Ple-nsea, sol-nsea
An increasing number of beam trawlers (in the Dutch fleet) are using ‘Pulse trawl’ gear. There is no recognised gear code for this gear and catches etc. are still registered as TBB, grouping them with the traditional twin beam trawl fleet.
It is felt that this gear is likely to have different selectivity (for discards and landings) as well as different catch per unit effort as the traditional beam trawl gears. This has implication for the assessment of sole and plaice. In the first case, for the raising of discards and landings data. In the second case for the determination of the CPUE index used in the sole assessment. It is necessary to create a separate gear code / gear type category for pulse trawls. This would allow for improved raising of data and prevent a discontinuity in the CPUE index used for sole.
RCM-NS&EA,RBD-SG
The RCM-NS&EA endorse this recommendation
Table 3.3.2.2.2. Comments and recommendation from 2013 ICES Experts Groups, concerning data issues.
ID1 EG Recommendation Recipient RCM NS&EA comment234 PGCCDBS RCMs/RCGs provide measures of
achievement both as numbers of sampling events and as numbers of fish measured or aged.Clarifications: The number of fish measure by itself is not a useful measure. It is more relevant to considered the number of fish measure relative to the number of sampling events.
RCMs The RCM-NS&EA considered that this should be a product of the standard management report of the RDB.Action: forward this suggestion to the SC-RDB.
75 WGRS Involve more countries in the Irminger and Norwegian Seas surveysClarifications: this recommendations concerns Spain and Portugal. Also concerns Portugal but not part of the RCM-NS&EA.
RCM-NS&EA The Portuguese and Spanish members informed about the lack of available research vessels to conduct this survey.
STECF EWG 13-05 proposed that in the future MS should take part in surveys on stocks in which their fisheries have a major interest (by providing scientists, vessels or financially)
230 WKMSEL Promote calibration workshops for maturity staging of elasmobranch inside and between laboratories.
National laboratories
For information
229 WKMSEL Analyse maturity stage data according to the scales proposed by WKMSEL 2 in order to validate its application for stock assessment modelling
National laboratories
For information
1 For future feedback and communication to ICES secretariat keep the ID of the recommendations.
Page 23 of 176
ID EG Recommendation Recipient RCM NS&EA comment232 WKMSEL Increase the geographical range of the
data collection, including information from the Atlantic, North Sea, Baltic and Eastern and Southern Mediterranean countries. Information from long distance fisheries (e.g. Pacific, Arctic etc.) exploited by European fleets would also be welcome.
National laboratories
For information
111 WGNSSK For next year, WGNSSK recommends that the list is expanded to other North Sea demersal species covered WGNSSK and WGNEW, and that better coordination is done with WGCSE for the inclusion of straddling stocks such as saithe, megrim, monk etc.
National laboratories
For information
215 WGNEW Relevant Member States to include market sampling for turbot in their National Programs, thus generating requirement for funds through the DCF.
RCM-NS&EA RCM-NS&EA clarifies that turbot is already include in the DCF.
25 WKSPRAT Multispecies natural mortality depends heavily on the knowledge of stomach content surveys – the last of which took place in 1991. Update of this information is particularly important for the sprat assessment in the North Sea, and would provide novel information in VI and VII.
RCMs Since 2014 National Programmes re a role over of previous accepted National Programmes, additional data collections will not considered. However, stomach sampling should be considered in DC-MAP
As oppose to previous years, when the ICES feedback on data transmission was provided for all stocks (independent of having or not problems on data transmission / data use) in the form of the so-called “data-tables”, in 2013 this feedback will only be focus on stocks where a problem exist and will be specified in the ICES advice, under the “Quality Considerations” section.
3.3.2.3 ICES Benchmark workshops in 2014
The ICES proposal for 2014 benchmark workshops was presented (Table 3.3.2.3.1). From 2014 onwards the aim is to move towards Ecoregion Benchmarks. The relevant workshop for the RCM-North Sea and Eastern Arctic is the Benchmark Workshop on Haddock stocks (WKHAD), where the stocks to be benchmarked are: the North Sea haddock and the west of Scotland haddock. The aim is to improve the single stocks assessment methods for both stocks and also evaluate the assessment of a combined west of Scotland and North Sea stock together.
Page 24 of 176
Table 3.3.2.3.1. ICES proposal for 2014 benchmark workshops2
Benchmark Workshop
Stocks
WKBALFLAT Dab in Subdivisions 22 – 32Plaice in Kattegat, Belts and Sound (Subdivisions 21-23)Flounder in Subdivisions 22 – 32
WKBUT Greenland halibut in Subareas I and IIGreenland halibut in Subareas V, VI, XII and XIV
WKCELT Sole in Divisions VIIf, g (Celtic Sea)Whiting in Division VIIe-kNephrops in the FU 20 (Labadie, Baltimore and Galley), FU 21 (Jones and Cockburn)Nephrops off the south-eastern and south-western coasts of Ireland (FU 19)
WKPELA Mackerel in the Northeast Atlantic (combined Southern, Western and North Sea spawning components)Herring in Division VIIa South of 52° 30’ N and VIIg,h,j,k (Celtic Sea and South of Ireland)Anchovy in Divisions VIIIa,b,d (Bay of Biscay)
WKSOUTH Four-spot megrim (Lepidorhombus boscii) in Divisions VIIIc and IXaMegrim (Lepidorhombus whiffiagonis) in Divisions VIIIc and IXaHake in Division IIIa, Subareas IV, VI, and VII, and Divisions VIIIa,b,dHake in Divisions VIIIc and IXa
WKHAD Haddock in Subarea IV (North Sea) and Division IIIa West (Skagerrak)Haddock in Division VIa (West of Scotland)
WKDEEP Blue ling in Division Vb, and Subareas VI, VIILing in Division VaBlack scabbardfish (Aphanopus carbo) in Subareas VI, VII and Divisions Vb and XIIbBlack scabbardfish (Aphanopus carbo) in Subareas VIII and IXBlack scabbardfish (Aphanopus carbo) in other areas (Subareas I, II, IV, X, XIV and Divisions IIIa, Vb)
3.3.2.4 Possible new structure on PGCCDBS and related ICES expert groups
The ICES observer gave a presentation on ICES intention to restructure the work of PGCCDBS and provided a number of options. These are presented in Annex 7 and will be discussed at the Annual Science Conference of ICES in Reykjavik (September 2013). Over the years the “PG” has played an important role in setting, maintaining and improving quality standards in data collection carried out under the DCR and DCF.
The RCM-North Sea and Eastern Arctic recognizes the progress made by PGCCDBS. This EG provided important tools for the quality assurance of coordinated data collection programmes through standardisation, calibration and enhancement of well-established and new methodologies. The RCM NS&EA also recognizes the need to evolve to a different setup and has the following comments on the options presented above:
- Option 1 should be avoid given the recognized need to change for a new setup;- Option 3 should be avoid, because the LM will have an unbalance input from ICES- Option 2 is the preferable one;- RCM NS & EA endorses the involvement of the surveys groups as well as the WGRFS in the
PGCCDBS successor.- RCM NS&EA stresses the role of PGCCDBS as a useful information group on the main outcomes
for the different PGCCDBS sub-groups. This role shouldn’t be lost in the new setup.- RCM NS&EA is of the opinion that a new structure does not necessarily lead to a better
performance. Also attention should be given to the process as it might lead to duplication of tasks and more overhead. This also means that in the new structure the right people, having a
2 The benchmarks workshops and respective list of stocks is a proposal not approved yet.
Page 25 of 176
helicopter view as well as decision making power, need to be involved in the PGCCDBS successor.
3.3.2.5 PGCCDBS meeting in 2013
The Planning Group on Commercial Catches, Discards and Biological Sampling [PGCCDBS] (Co-Chairs: Mike Armstrong, UK, and Gráinne Ní Chonchúir, Ireland) met in Belfast, Northern Ireland, 18th February – 22nd February 2013, in parallel with the Mediterranean Planning Group for Methodological Development (PGMed).The meeting focused on work completed since last year, and planned work for 2013 and 2014, in the following topics which formed the basis of the Terms of Reference:
- Stock-based biological parameters from sampling of fishery and survey catches (age, growth, maturity, fecundity, sex ratio)
- Fleet/metier related variables (discards estimates and length/age compositions of landings and discards) and statistical design of sampling schemes
- Data collection technology (hardware, and software such as WebGR and the Regional Data bases).
- Implementation of the ICES Quality Assurance Framework- Addressing recommendations and requests for advice from ICES expert groups (including
through PGCCDBS data contact persons), and RCMs.During 2013, the PGCCDBS was requested to address an additional Term of Reference to identify reasons for differences between raised discards estimates provided by ICES and STECF, and make recommendations on how to resolve this problem in the short and longer term.
The PGCCDBS met in plenary with PGMed to review the outcomes of a wide range of workshops and age exchanges conducted in 2012 after PGCCDBS 2012, summarised in the tables below:
Page 26 of 176
(a) PGCCDBS age and maturity workshops: 2012.
Workshop name 2012 Acronym Brief outcomeWorkshop on practical implementation of statistical sound catch sampling programmes WKPICS2 See separate RCM NS&EA summary
Workshop on eel and salmon DCF data WKESDCF See separate RCM NS&EA summaryStudy Group on practical implementation of discard sampling plans SGPIDS 2 See separate RCM NS&EA summary
Workshop on age Determination of Atlantic salmon WKADS-2 Broad review and recommendations. Proposes inter-
laboratory calibration exercises in next 2 to 4 years
Workshop on Age Reading of Horse Mackerel, Mediterranean Horse Mackerel and Blue Jack Mackerel
WKARHOM
Review on current procedures, common criteria for ageing; update of ageing manual, otolith reference collection. Age exchange agreement was only around 50% which is of concern. Further exchanges/workshop proposed.
Second Workshop on Age Reading of Red Mullet and Striped Red Mullet WKACM-2
Review of age validation studies and state-of-the-art on ageing the two Mullus species. Some issues with identifying first growth ring and the false ring, and setting nominal birthdate.
Workshop on the Sexual Maturity Staging of Turbot and Brill. WKMSTB
Proposes six point scale. Calibration results: 94% agreement for fresh material and 73-79% for images. Material validated using histology.Recommends a maturity-stagers forum, (like the age-readers forum).
Workshop for maturity staging chairs WKMATCH 2012-
Recommends a six-stage maturity key based on all ICES WKs. Reviewed use of maturity ogives in Assessment EGs. WKMATCH recommends EGs provide more information on use of maturity data.
Workshop on Sexual Maturity Staging of Elasmobranchs WKMSEL2
Review of new maturity scales proposed by the WKMSEL in 2010. Proposals::Improved species coverage especially the larger species such as pelagic elasmobranchs, and all the different viviparous modes of reproduction, and over an increased geographic scale.Maturity stage data should be analysed according to the scales proposed by the WK, once agreed by ICES (PGCCDBS, IBTSWG, WGBEAM, WGEF).Future calibration workshops should be promoted.
(b) PGCCDBS otolith and maturity exchanges: 2012.
Exchange name 2012 Year Outcome
Turbot, brill, megrim and North Sea sole. Planned for 2012 but not completed
-
North Sea cod otolith small scale exchange 2011-2012
follow up from 2009 – 2010 exchange; 10 readers, 6 labs; % agreement 40-100%; CV 0-28% results considered not satisfactory though improved over 2009/10 exchange. Errors mainly overestimation of age. More work needed to improve ageing – further consideration in 2013
PGCCDBS 2013 also updated the list of national age readers and co-ordinators, and this updated list was uploaded onto the European Age Readers Forum (EARF).
PGCCDBS developed work plans for intersessional work related to development of Quality Assurance reports for fishery sampling, including testing a prototype QA report with selected ICES stock assessment expert groups, and circulating a questionnaire to collect information on national approaches to the construction and application of age-length keys.
Page 27 of 176
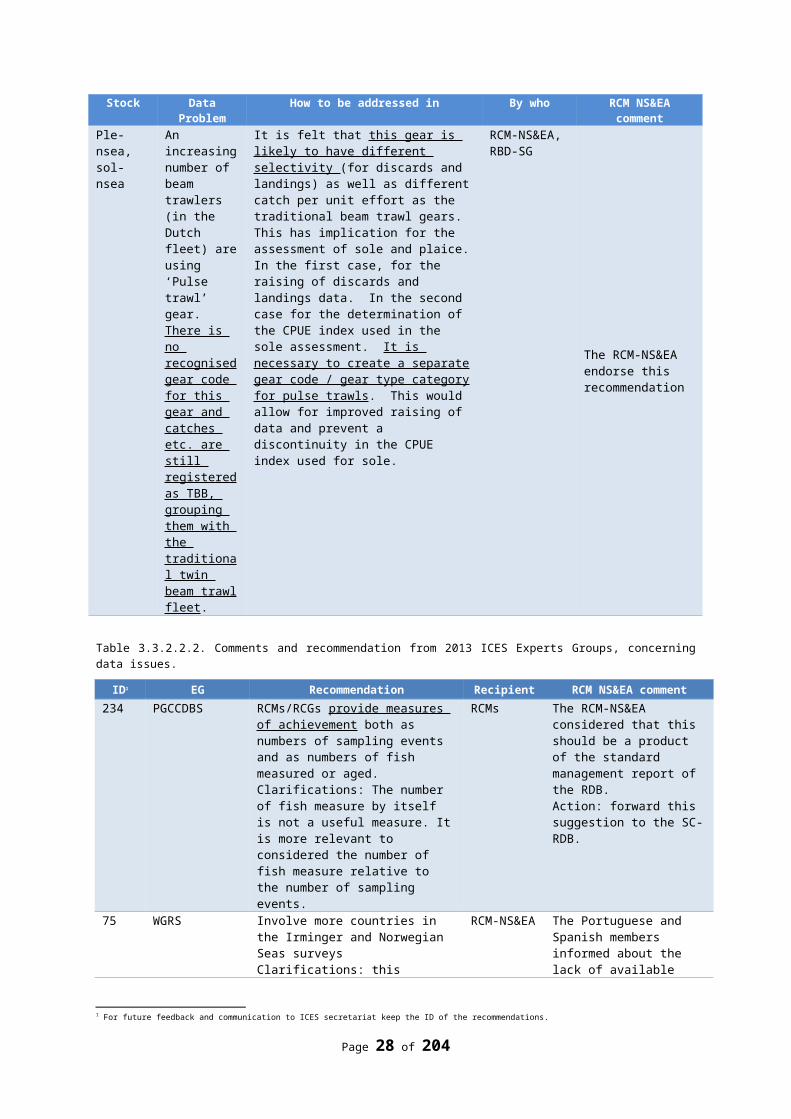
Other proposals for workshops and exchanges, developed by PGCCDBS are given below:
(a) PGCCDBS Workshops taking place in 2013.
ACRONYM DATES CHAIRS VENUE
WKAVSG Workshop on age validation studies of Gadoids
6-10 May 2013 Karin Hussi , Denmark and Beatriz Morales-Nin, Spain
Mallorca, Spain
WKNARC2 Workshop of National Age Readings Coordinators
13-17 May 2013 Ângela Canha, Portugal and Lotte Worsøe Clausen, Denmark
Horta, Portugal
WKARBLUE Workshop on the Age Reading of Blue whiting
10-14 June 2013 Manolo Meixide, Spain and Jane Amtoft Godiksen, Norway
Bergen, Norway
WKMIAS; Workshop on Micro increment daily growth in European Anchovy and Sardine
21–25 October 2013
G. Basilone, Italy, B. Villamor, Spain and M. La Mesa, Italy
Mazara del Vallo, Italy
WKAMDEEPWorkshop on Age Estimation Methods of Deep Water Species
21-25 October 2013
Ole Thomas Albert, Norway, and Beatriz Morales Nin, Spain
Esporles, Spain
WKMSGADWorkshop on sexual maturity staging of cod, whiting, haddock, saithe and hake
14-18 October 2013
Francesca Vitale, Sweden, and Maria Korta, Spain
San Sebastian, Spain
WKPICS3Third workshop on practical implementation of statistical sound catch sampling programmes
19–22 November 2013
Mike Armstrong, UK andJon Helge Vølstad, Norway
ICES, Copenhagen
SGPIDS
Study Group on Practical Implementation of Discard Sampling Plans
24-28 June 2013 Alastair Pout, UK, and Marie Storr-Paulsen, Denmark.
SLU Aqua IMR, Lysekil, Sweden
(b) Small scale and full scale age exchanges taking place in 2013
SPECIES/STOCK TYPE OF EXCHANGE
COORDINATOR
Sprat (North Sea and Celtic Sea) Full-scale Lotte W. Clausen (DK - DTU aqua)Mackerel Small scale Jens Ulleweit (Germany)Herring (Norwegian spring spawning)
Small scale Jane Amtoft Godiksen (Norway)
Saithe Full exchange of images
Kélig Mahe (France).
Capelin Small exchange between Iceland and Norway
Gróa Þóra Pétursdóttir (Iceland).
Dab (postponed from 2012) Holger Haslob, Hamburg, Germany.
Sea bass Large scale Kélig Mahe (France).
(c) PGCCDBS proposals for 2014 and beyondProposed workshops for 2014
WKSABCAL, the Workshop on the Statistical Analysis of Biological Calibration Studies. The ToRs for this WK are available in Annex 4 of the PGCCDBS 2011 report. [Postponed until 2014]
WKARA, workshop on age reading of anglerfish Lophius spp. [Priority 1]Proposed large-scale age exchanges in 2014:
Page 28 of 176
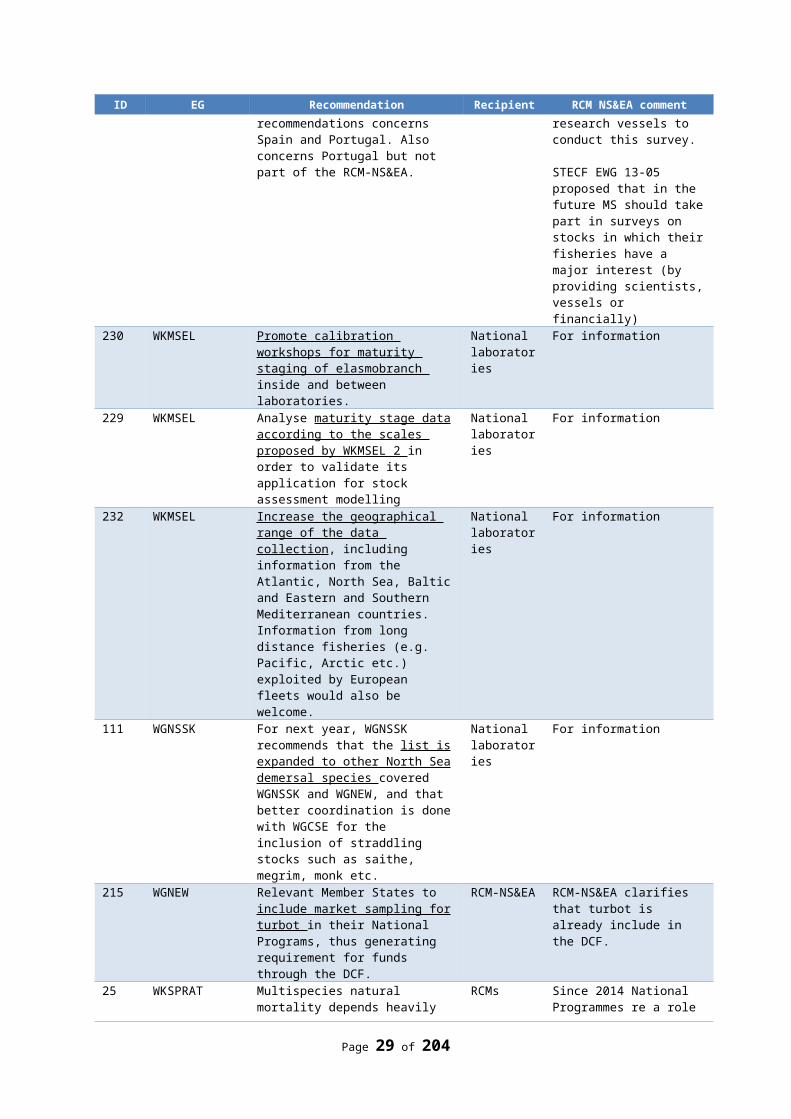
Whiting (Merlangius merlangus) Megrim (Lepidorhombus spp) Sole(Solea solea) Sprat (Sprattus sprattus, all areas) Horse mackerel and Mediterranean horse mackerel (T. picturatus and T. mediterraneus)
Proposals for age exchanges in 2015 (to be evaluated by assessment working groups)
(a) Priority 2 exchanges: Witch (Glyptocephalus cynoglossus) Lemon sole (Microstomus kitt) Gurnards (Aspitrigla cuculus, Eutrigla gurnardus, Chelidonichthys lucernus) Pollack (Pollachius pollachius) Sandeel (Ammodytes spp) Boarfish (Capros aper) Ling and blue ling (Molva molva and Mola dypterigia)
(b) Priority 3 exchanges Conger eel (Conger conger) Norway pout (Trisopterus esmarkii) Pouting (Trisopterus luscus) Wolf fish (Anarhichas lupus)
Proposals for Priority-2 maturity exchanges (to be evaluated by assessment working groups)
Mackerel and Horse mackerel (Scomber scombrus and Trachurus trachurus) Eel (Anguilla anguilla)
Proposal for collaborative studies contracts
PGCCDBS 2013 makes two proposals for study contracts, one of which is a repeat proposal from the PG 2012 meeting (See Section 3.8 of PG report for full details)
1 A collaborative study on anglerfish (Lophius piscatorius) Priority 1 [SEE RCM NS&EA 2013 PROPOSAL]
2 Study proposal on age determination and maturity staging of species not previously subjected to biological sampling for analytical assessments. [SEE RCM NS&EA 2013 PROPOSAL]
Proposal for ICES Cooperative Research Report
PGCCDBS has proposed an ICES cooperative research report (CRR) on the Protocols on the ageing of different fish species in the ICES area. More details can be found in Section 3.9 and the full draft resolution for this CRR is available in Annex 7 of PGCCDBS 2012.
Proposal for ICES training course
PGCCDBS recommends that ICES provide a training course covering the design of statistically sound catch sampling for fisheries monitoring programmes. The full proposal is detailed in Section 4.3.3
Proposal for new ICES Working group on commercial catches - WGCATCH
PGCCDBS recommends setting up a new working group on commercial catches to take over existing PG work on fleet based biological sampling.
PGCCDBS 2013 recommendations:
RECOMMENDATION ADDRESSED TO
RCMs/RCGs provide measures of achievement both as numbers of sampling events and as numbers of fish measured or aged.
Regional Coordination Meetings / Groups
3.3.2.6 SGPIDS meeting in 2013
SGPIDS 3 met 24 June – 28 June 2013 in Lysekil, Sweden attended by 19 participants from 12 different nations, and chaired by Alastair Pout (UK Scotland) and Marie Storr-Paulsen (Denmark). The study group focused on practical aspects of implementing sampling plans with participants providing case studies, worked examples, and progress reports that covered three main themes: sampling frames based on
Page 29 of 176
vessel lists; random vessel selection procedures; on-board sampling and estimation. The chair of WKBYC (Bram Couperus) attended and continued the liaison with this group.
Setting up sampling frames based on vessels lists was explored through different national case studies. The EU fleet register can provide the basis for a national vessel list but the SG stressed the need for additional information from logbooks, sales notes and other sources to further inform the stratification. Stratification criteria considered included: vessel size; the use of passive or active gears; and geographical location of fishing or observer locations. These gross distinctions within national fleets enabled national programmes to define a small number of sampling strata into which national vessel lists could be divided.
The implementation of random vessel selection procedures were reviewed for six national observer programmes with four programmes being able to calculate non-response rates (and industry refusals) from 2011-12 data. Direct comparison between non-response rates of different programmes is not yet possible due to differences between national programmes in the time window over which individual vessel selection attempts operate, and the relative effort expended trying to secure a trip on a fishing vessel. The SG recommends that a vessel’s “next trip” be used as the criteria to define the selection attempt and that the effort to secure a trip is the same for all attempted contacts. The SG recommends that national programmes should summarize their vessel contact attempts using (at least) the 6 contact categories (Not available, No contact details, Observer decline, No answer, Industry decline, Successful sample) to ensure standardization and comparability. In the absence of comparable non-response and refusal rate, these would be appropriate to include in the QI table. The QI table should not be considered out of context of the scheme to which it relates.
The SG emphasised the considerable advantages of operating a random selection system both in improving the statistical robustness of the data, and in fostering dialogue and securing cooperation with industry.
Various case studies presented comparisons between realised sample data and the wider population of vessels being sampled (e.g. of the spatial-temporal distribution, gear types, landing categories, and catch composition). Particularly where non-response rates and refusal rates are high it is suggested that national programmes use such comparisons to examine potential bias in the sample data.
Furthermore, the calculation of on-board sample weights was explored for seven national case studies. Sample weights for numbers at length could be calculated in all cases though for numbers at age this was possible for only one case using existing collection protocols. Aggregated ALK are used at various levels and the use of sample weights for age samples would represent a considerable departure in estimation methodology, if not sampling protocol, for most national programmes. Linking an age sample to the haul or set is required if sample weights for age are to be calculated. Weight estimates were obtained in a variety of ways, through on-board measures of individual fish or groups of fish, or derived from length weight relationships. Uncertainties in discard estimates were greatest where catches were large and diverse, and protocols that involve quantifying, rather than estimating the total discard can be recommended to improve estimates. The practical difficulties of achieving probability based selection of a discard sample on-board were recognised.
The SG noticed that data exchange format of RDB-FishFrame would require a number of additional new fields and modification to the estimation procedure to enable at-sea sample weights to be calculated correctly.
3.3.2.7 WKPICS2 meeting in 2013
WKPICS2 is the second workshop in a series of three that deals with design and implementation (including estimation) of Statistical Sound Catch Sampling Schemes. The work of the group is of high relevance for the RCMs since provides guidance on how national and regional sampling schemes can be designed and how decision makers and end-users need to play a part in the design process.
Page 30 of 176
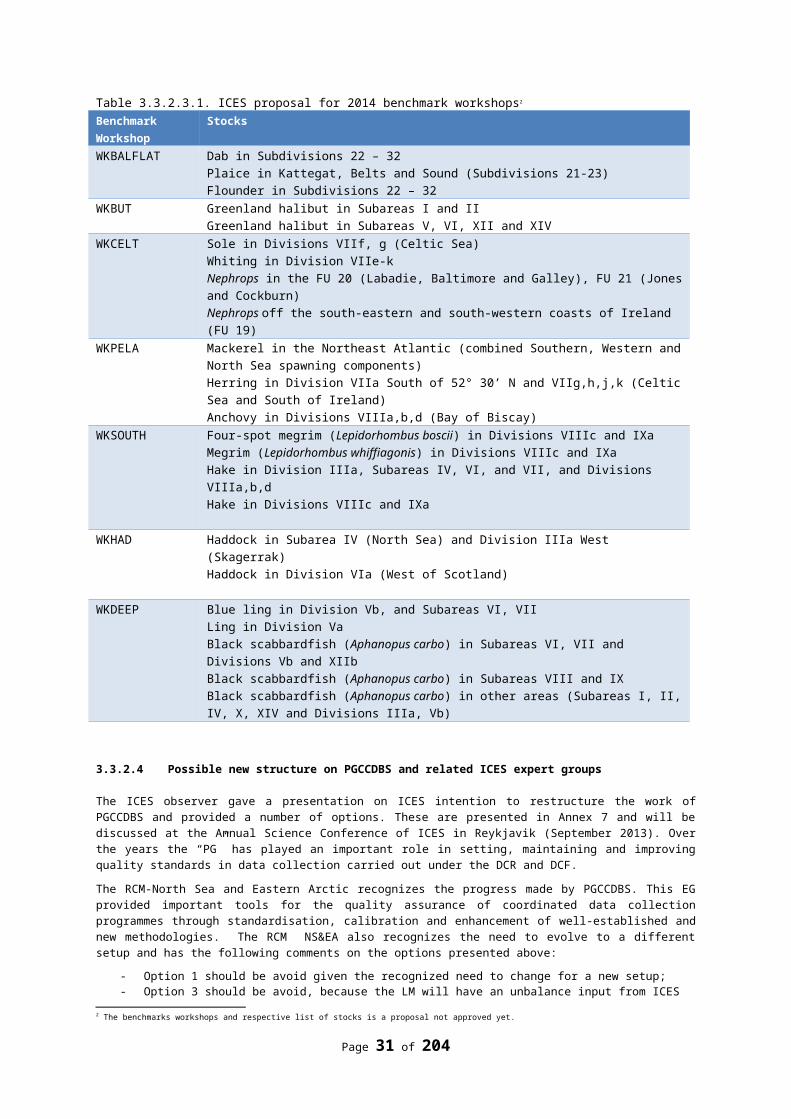
WKPICS2 outlines four principal classes of probability-based sampling schemes, and discusses how sampling frames, primary sampling units and strata can be developed and optimised to deliver the required estimates for species, fleet metiers, fishing grounds or other variables of interest. Methods for design-based estimation procedures are described. Detailed description of design-based estimation is provided for an at-sea sampling programme where vessels are primary sampling units and for an on-shore catch sampling programme where site-days are primary sampling units. In the latter, vessel-trips are sampled for a random selection of ports and days. These two design classes result in a clustered sample of trips, and in general it is not reasonable to assume that a simple random sample of trips is obtained from the fleet. Detailed advice on estimation procedures for all principal design classes will be finalized in WKPICS3.
WKPICS2 has developed guidelines for “best practice” that covers the design, implementation and analysis stages of catch sampling schemes, assuming that regional objectives and data needs are clearly defined. Ideally, all national surveys should clearly document the sampling frame, sample selection procedures, response rates (e.g. refusals to take observers), imputation methods for missing data and weighting procedures employed to derive national estimates. Best practice can be defined as sampling designs, implementation and data analysis that lead to minimum bias and an accurate estimate of precision, and which make the most efficient use of sampling resources.
WKPICS2 also proposes revised data quality indicators, including a simple one-page form that can be used to evaluate quality of data used for stock assessments. It is recommended that the quality indicators be further refined through practical testing by Regional Coordination Groups and stock assessment working groups, based on several case studies.
3.3.2.8 WGRFS meeting in 2013
The ICES Working Group on Recreational Fishing Surveys (WGRFS) is a forum for the planning and coordination of recreational fisheries data collection and analysis, for sharing knowledge, and discussing new ideas. In 2013, 17 scientists from 13 countries attended the meeting with the aim of sharing current national surveys methods and estimates, reviewing the use of recreational fishing data in stock assessments, developing a tool to assess the quality of recreational fishing surveys, providing guidance on the development of requirements for the Multi-Annual Data Collection Programme (DC-MAP), and production of agreed definitions for recreational fishing surveys. A glossary of recreational fishery was
Page 31 of 176
also produced to help common understanding and sharing of information. The WGRFS reviewed progress in implementing recreational fishing surveys across Europe, including results of existing surveys, design of new ones, and consideration of potential sources of bias and how to minimise future biases in the estimates produced. “Best practice” guidelines for recreational fishery sampling were developed based on WKPICS2, covering the design, implementation and analysis of sampling schemes whilst also providing information on the existence and possible magnitude of biases. WGRFS concluded that there was no single way to document data quality that is suitable for all end users, and a “toolkit” of reporting systems is needed to provide different end users with the information they require.
WGRFS assessed the use of recreational fishing data in benchmark assessments of western Baltic cod and Atlantic sea bass. The data on bass indicate that recreational fishery removals could be as much as 20% of total removals, so data should continue to be collected and included once available. (Annex 5). Proposals for frequency and precision of recreational fishery surveys in the new DC-MAP were reviewed. WGRFS continues to advise that requirements to collect recreational fishery data in DC-MAP should be driven by end-user needs and that WGRFS should be closely involved in this process and should have appropriate Terms of Reference to provide Regional Coordination Groups (RCG) with advice on how end-user requests for recreational fishery data can be addressed.
Page 32 of 176
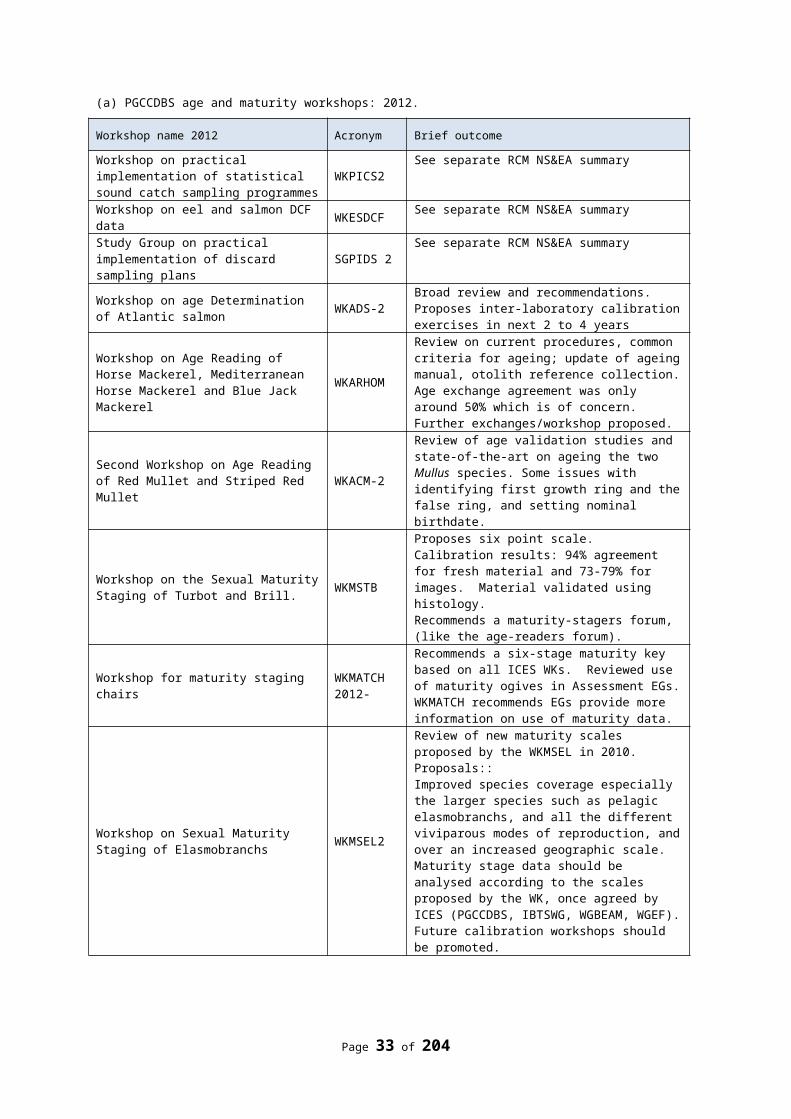
4. Regional coordination
4.1 Regional databases: update since RCMs 2012
All MS but one uploaded data to the Regional Database following a data call from the chairs of the RCMs 3rd of April 2013 . A summary of the uploaded data is shown in section 8.2. Requests by the MS to the ICES secretariat during the uploading process were answered very fast, suggestions were helpful and MS appreciate the support they received.
The accessibility to data resulted in that the meeting time could be used more effectively and it was relatively fast and easy to produce the common RCM outputs such as ranking of fishing activities in the region (see annex 3). The meeting time could instead by utilized to analyse the quality of the regional data and suggests areas for improvement to the RDB-SC. Such areas were means to assess the completeness of the data and harmonization in coding (metiers, harbours,..)(see section 5). The RCM NS&EA could were also able to get overviews of were, in a regional context, samplers have access to fish and thereby start to elaborate on how true regional sampling schemes potentially could work (see section 8.3).
4.1.1 RDB-SC
The RDB-SC has had one meeting since the 2012 RCMs. The main items on the agenda was a revision (which is on-going) of the data policy document and an inventory on development needs following the recommendations of the 2012 LM. The short term strategy for the RDB-SC is to support all counties in importing data into the RDB-FF, so the RCMs can use the RDB-FF as the main source for gaining information of the national sampling and fisheries on-going. This means for example that the problems some countries have regarding mandatory fields for which there is no national data, needed to be solved. The long term strategy is to make the RDB work according to the principles of the statistical sound sampling schemes. The following approach for the development of the RDB was embraced, with focus on harmonisation, standardisation, security and being able to document and audit, see figure below.
Page 33 of 176
Processes: Standardised raising and aggregation methods and algorithms
Harmonised national landing, effort and sample data
Raising of national detailed catch data
National experts raise data (could be the data submitter)
National data submitters import
data
Raising of data using international
samples
Aggregation to international stock
level
Stock coordinators raise ‘not raised’ data and aggregate to stock level
Standardised stock data for assessment EG
Process documentation
Expert group members export data
Se cu r i t y & Logg i ng
Standardised reports for RCM
Check and import national detailed
catch data
Export of sampling planning data or
stock data
Data at any level for analysis
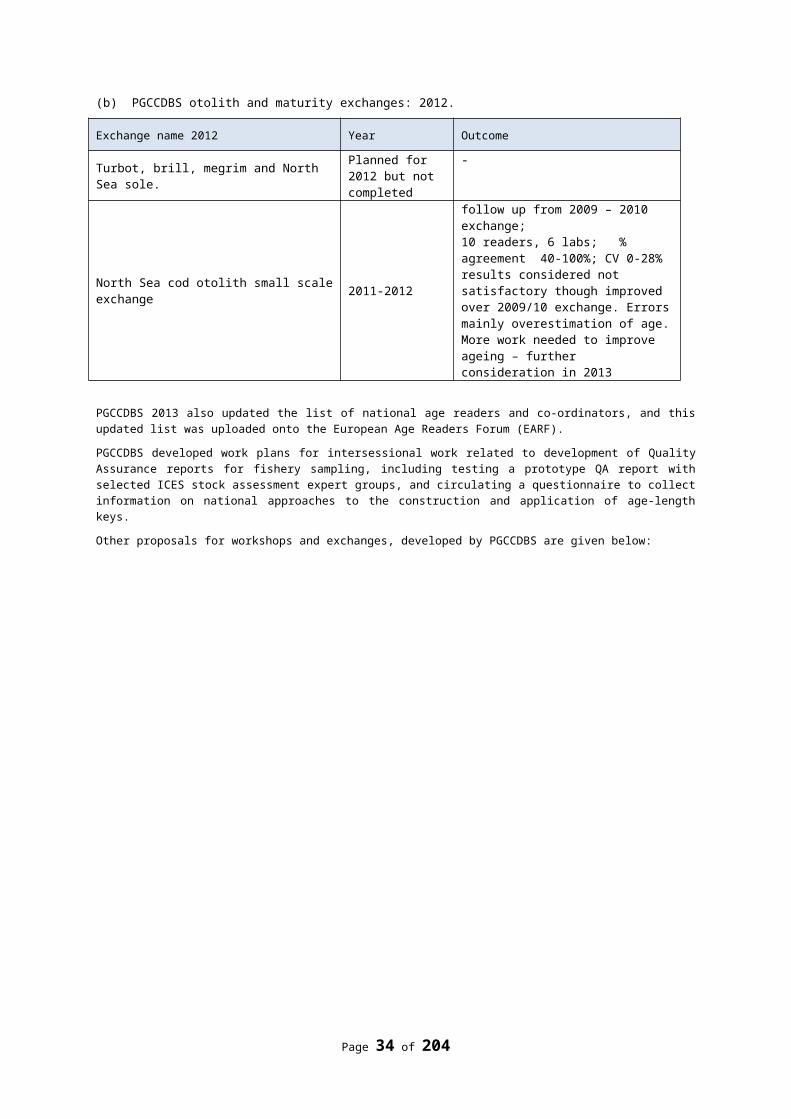
4.1.2 Status from the ICES Secretariat
The Regional DataBase (RDB) have now been hosted and maintained by ICES Secretariat for a year, during that year ICES Sec. have successfully solved the issues raised. The ICES Sec. have focused on fixing errors and inappropriate format constrains, which was identified at the WKRDB 3 2012, to ensure countries could upload data. ICES Sec. have worked together with DTU-Aqua regarding the WKRDB 1 2013 in June and in specific cases where it was not obvious how to comply with the RDB format.
In the future the RDB will work together with InterCatch, which is the standard tool for stock coordinators to raise and prepare data to the stock assessment expert groups. The aim is to let the detailed data imported into the RDB be raised by the national data submitter. Then transfer the data automatically to InterCatch where they will be raised on an international regional level by the stock coordinator. Since ICES Sec. have both systems it will be easy to streamline the integration of these two central systems.
When the design based sampling/statistical raising method have been standardised and specified by WKPICS, SGPIDS and WGCATCH. These methods will be implemented into the RDB and InterCatch to support best practice of raising data for the stock assessment expert groups.
4.1.3 Concerns about lack of funding for further development
The RCM was informed that the study proposal on “Exploration and Development of new facilities in RDB-FishFrame 5.0” that was put forward by the 9th liaison meeting (2012) was not included the 2013 work programme of the Commission. Several member states highlighted that they think that further funding for the enhancement of the RDB should have highest priority and should take place as soon a possible. The RCM emphasizes that the absence of further development funds for FishFrame is problematic for several reasons.
Further development is a key issue to support the RCM work in general and the establishment of regional data collection program based on a design based approach in particular. The latter is foreseen to be a core element in the DC-MAP and will allow for more a cost-efficient data collection. Further funding of the RDB is probably the one of the most cost-effective investments into data collection.
All MS have gained experience with FishFrame and a substantial list of important suggestions for practical improvement and advancements is available which could be implemented with relatively small efforts in a relatively small time period. Once implemented this would significantly reduce the work load of the data collection scientists involved in preparing and processing of the national and regional data.. The less time scientists have to deal with data compilation issues, the more time is available for detailed data analyses which will again further improve our understanding of patterns in the DCF data and hence enhance the quality of the newly collected data.
The enhancement of the data processing modules within and/or in conjunction with the RDB could further increase the transparency of and comparability between national estimates, which is a key element for assessing the quality of the final assessment data. Improved analysis of DCF data will improve regional sampling approaches and is likely to reduce costs. If funds are not made available in due time, progress can only take place at reduced speed and it will continue to be difficult to coordinate, collect, raise and analyse data at a regional level in a cost-effective way. It is important to note that the ways of data collection and the calculation of estimates is under constant change since objectives evolve and the underlying science is advancing. Development of the RBD needs to follow this constant change. This is best achieved in close and constant interaction and cooperation with experts on design of data collection programs, data collectors and end-users. There are foreseen changes in the data collection legislation; the metier-based approach (ad-hoc sampling) will be replaced by a design-based approach (randomized sampling) and it is of vital importance that the RDB can meet the new
Page 34 of 176
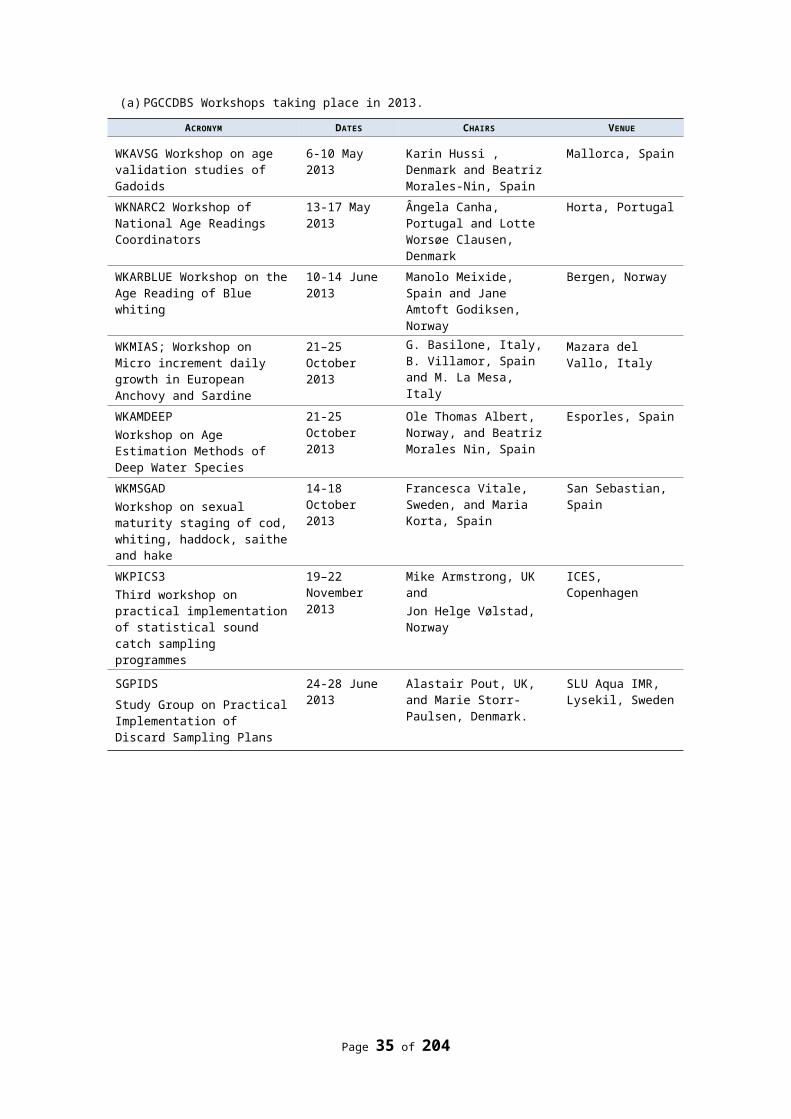
requirements. Otherwise we risk loosing the present momentum towards more regionalized design-based data collection programs.
It is particular important that the development process interacts with expert groups dealing with a design-based regional data collection approach should be implemented (including e.g. the estimation processes). ICES expert groups, in particular WKPICS2 (ICES 2012) and SGPIDS (ICES 2013) have given the RDB-SC important guidance on how the RDB will need to be further developed to meet the new standards. The PGCCDBS recently suggested the expert working group WGCATCH which should provide advice and support in documenting, developing, implementing and using the data collected from statistically sound catch sampling schemes. WGCATCH may also provide a forum for the further enhancement of the RDB.
4.2 Regional coordination under DC-MAP
The regional coordination under the DC-MAP is foreseen to be carried out by Regional Coordination Groups (RCG) which will replace the RCM. The tasks of the future RCGs will depend on the structure of the DC-MAP and their role defined in the DC-MAP. Since the DC-MAP is still under development, the possible future roles of RCGs are still speculative.
In the DCF, sampling obligations of the MS are defined at a national level following rules defined in the Decision. The role of the RCM under the DCF structure is to harmonise the proposed NPs. This is done by checking whether the NPs together fulfil most regional requirements. Gaps or insufficient coverage of data collection on a regional scale can be identified by the RCM and measures are taken to correct the situation. Also national sampling obligations can be exchanged between MS through bi-lateral agreements. This is often the case when the other MS has better access to the resource to be sampled or when this is considered more effective. The present system is expected to be continued in the transfer period towards the DC-MAP when the DCF is still operative. The coordination of the NP by the RCM takes place after proposed NP are available
It is considered likely that, under the DC-MAP, data requirements will no longer be defined on a national level but on a regional level. In that situation the task of the RCG will be to allocate the regional requirements between the MS. It demands participation of Membership that has the authority to consent to the decisions made by the group. In contrast to the RCM, the RCG process will take place before the AWP of the MS are made.
The coordination by the RCG must lead to a cost effective data collection. However, the allocation of work to the MS by the RCG is likely to be a long and very difficult process of negotiation between the MS, taking into account national resources (budgets) and national priorities. There is a danger that this may lead to situations where no compromise are reached.
Also decisions need to be taken on sampling strategies which can be supported by the participating MS.
RCGs must have a role in the process of revision of the MRR. Data requirements and priorities may differ by region. The flexibility in adjusting data requirements on request of end-users encompass the danger of expanding the requirements beyond the available resources. RCG can advice on the feasibility to implement new data requests and provide and estimate of the costs of implementing these. Also advice can be given on prioritisation of data collection when resources become limiting. STECF has proposed a role of RCG in this process. In addition to that, RCGs could also advice end-users directly on the probability of success of granting requests to collect new parameters, before submitting such a request. The RCM NS&EA propose to start a project in 2014 in which develops the communication with the end-users.
More in general, RCGs should identify what goes wrong in the data collection and what can they do about that.
Another responsibility of the RCG would be to address the quality of the data collected in the region. Collected data should be evaluated frequently on their quality. For this purpose, data of all MS should be available in a Regional Data Base (RDB). The actual work should be carried out by designated groups of experts , steered by the RCG. In addressing the quality of the data, the RCG should liaise with other RCGs and end-users like ICES. Actions would need to be taken if the quality of the data collection is insufficient.
Page 35 of 176
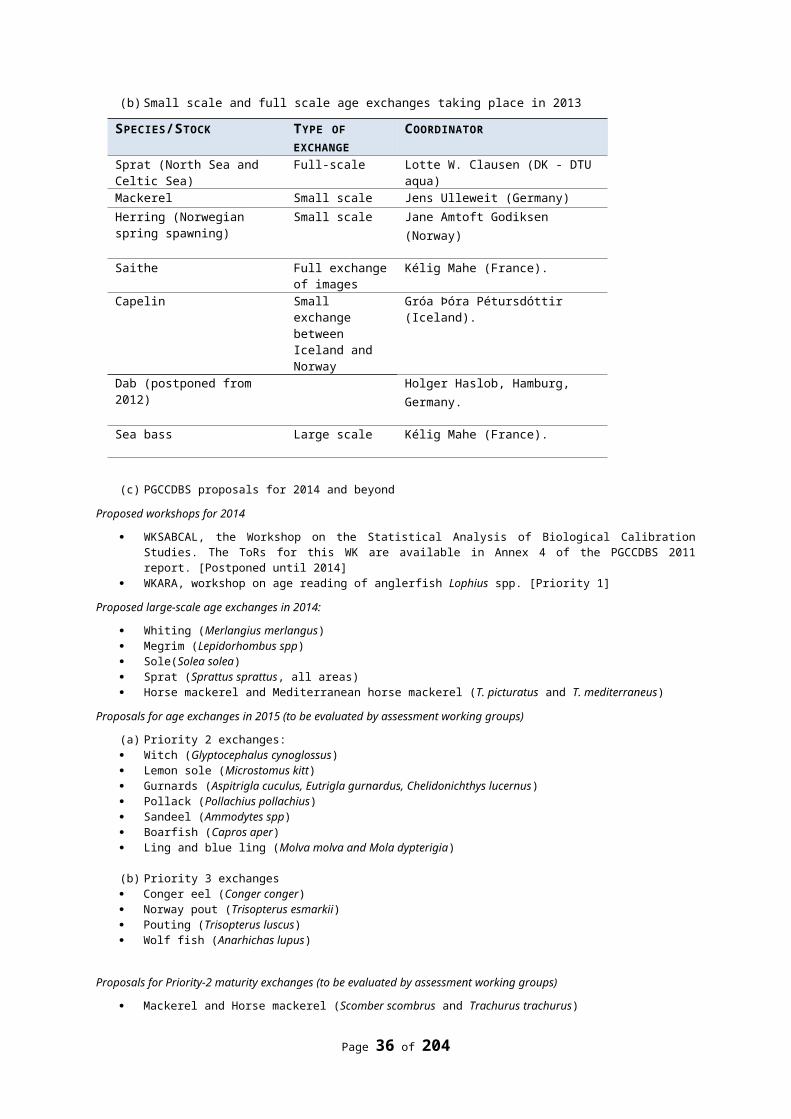
For an efficient regional coordination it is required that there is a clear administration of regional data requirements and the allocation of data collection tasks to the MS. Also a administration is required of the data collection which has been carried out. In order to enable an efficient coordination, it is necessary that a RDB should play and important role in this administration and that information in the database is stored in such a way that comparison between needs and work proposed or carried out is comparable.
It is likely that, under the DC-MAP, there will be an expansion of areas where data will be collected. Examples are data on bycatches of birds and sea mammals in fisheries, and data to support MSFD. This means that, apart from fishery experts, other expertise’s need to be included in the regional coordination process. Also, in order to promote ‘transparency’ observers could be given a role. The question is who will need to be on the table and could a workable situation be created?
As the RCG is the primary user of the RDB for coordination the data collection programme and evaluating the quality of the data on a regional basis, it must make sure that the RDB is kept updated to enable to assist the coordination and evaluation processes.
Under a regional data collection programme, coordination is essential in order to be able to carry out data collection. Most coordination needs to be carried out intersessionally. The resources needed of coordinating a regional programme would be much and much larger than the present coordination of national programmes.
4.2.1 Comment by participants from MS on regional coordination
Individual comments by participants from the different MS are compiled in Annex 6 (section 7).
Page 36 of 176
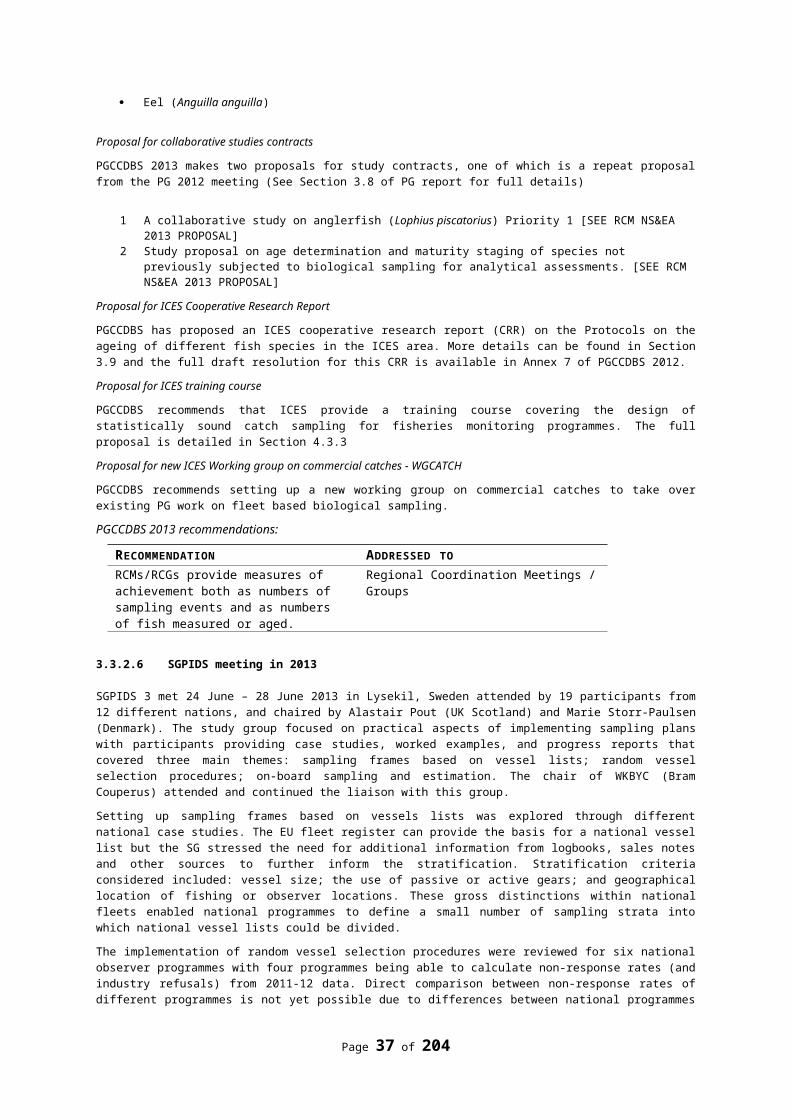
5. Data Quality issues
5.1 Review progress on quality control, validation etc. in NP proposals.
The Data Collection Framework Regulation 199/2008 Article 14 requires Member States to adopt the following actions for data quality control and validation:
1. Member States shall be responsible for the quality and completeness of the primary data collected under national programmes, and for the detailed and aggregated data derived there from which are transmitted to end-users.
2. Member States shall ensure that:(a) primary data collected under national programmes are properly checked for errors by
appropriate quality control procedures;(b) detailed and aggregated data derived from primary data collected under national
programmes are validated before their transmission to end-users; (c) the quality assurance procedures applied to the primary, detailed and aggregated data
referred to in (a) and (b) are developed in accordance with the procedures adopted by the international scientific bodies, regional fisheries management organisations and STECF.
The important topic of quality of data collected by Member States as part of their DCF obligations has been addressed in a wide range of ICES meetings dealing with the ICES Quality Assurance Framework and by RCMs. The first step in quality assurance is evaluation of national sampling programmes. WKPICS2 (2013) and WGRFS (2013) developed guidelines for best practice in the design and implementation of surveys to estimate catches and catch composition (for non-census data) and the analysis of the survey data. ICES WKACCU (ICES, 2008) provided guidance on how to document bias in sampling surveys and WKPRECISE (ICES, 2009) advised on the estimation of precision. In subsequent years, the concept of a “bias scorecard” proposed by WKACCU has been revisited by PGCCDBS (2011), WKPICS (2011, 2012), SGPIDS (2011, 2012, 2013) and WGRFS (2012, 2013) to try and develop data quality reports for national and internationally combined data and estimates that could meet the needs of different end users such as stock assessment expert groups and planning/coordination groups such as RCMs. In 2012, the RCMs began to use diagnostics from data extracted from the Regional Data Base to evaluate aspects of data quality.
In Table 5.1, RCM NS&EA summarises the quality issues, example diagnostics and example mitigation procedures at different stages from sampling design through to supply of processed data and estimates, for the process leading to uploads to RDB and subsequent regional data analysis. Similar quality issues arise in direct supply of processed data and parameters from individual countries to Expert Groups, either through InterCatch or by other means. A range of diagnostic tools to explore quality issues in terms of coverage and sampling rates have been developed, for example through the COST project, and have been used by groups such as SGPIDS to explore data coverage issues. Other diagnostic tools may exist using bespoke software developed by individual countries for their own purposes. RCM NS&EA considers that the ability of RCGs to deliver regional coordination of data collection activities will depend fundamentally on the availability of accurate, quality controlled and validated data through the Regional Data Base, and the use of diagnostic tools for evaluating the quality of data combined over countries, fleets or stocks. There is a need to provide guidance and diagnostic tools to the RCGs to evaluate and respond to regional data quality issues in relation to (a) errors in RDB related to quality assurance and control at national level and errors during RDB data uploading; (b) quality of fleet-based biological data in terms of coverage and numbers of samples for length and age by stock, fleet and area as needed for coordinating national data collection activities, and (c) quality of stock-based biological data such as for estimating growth parameters, maturity ogives and sex ratios in terms of data sources, coverage of the stock and numbers of samples. RCM NS&EA was not able to provide comprehensive guidelines in the time available and therefore recommends that this be developed by ICES WKPICS3 and continued where necessary by the proposed WGCATCH and WGBIOP. The RCM therefore provides a recommendation to WKPICS3 to provide detailed guidance on diagnostic methods to evaluate these aspects of data quality to facilitate the work of Regional Coordination Groups in coordinating regional data collection and analysis, to provide any additional Terms of Reference for the proposed WGCATCH and WGBIOP to continue this development during the transition phase of DC-MAP, and to provide advice to SC-RDB on development requirements for the RDB related to data quality assurance and reporting.
Page 37 of 176
Specifying data quality diagnostics for fleet-based and stock-based biological data
RCM NS & EA 2013 Recommendation 1
RCM recommends that WKPICS3 provides detailed guidance on diagnostic methods to evaluate aspects of data quality to facilitate the work of Regional Coordination Groups in coordinating regional data collection and analysis, and provide any additional Terms of Reference for the proposed WGCATCH and WGBIOP to continue this development during the transition phase of DC-MAP. In addition recommends that WKPICS3 provides advice to SC-RDB on development requirements for the RDB related to data quality assurance and reporting.
Justification A suite of diagnostic tools will be needed by RCGs to evaluate and respond to regional data quality issues. These include but are not limited to errors in RDB related to quality assurance and control
at national level and errors during RDB data uploading quality of fleet-based biological data in terms of
coverage and numbers of samples for length and age by stock, fleet and area as needed for coordinating national data collection activities,
quality of stock-based biological data such as for estimating growth parameters, maturity ogives and sex ratios in terms of data sources, coverage of the and numbers stock of samples
Follow-up actions needed ICES to add Term of Reference to WKPICS3Responsible persons for follow-up actions
ICES WKPICS3
Time frame (Deadline) November 2013 WKPICS3 meeting.
To illustrate a number of data quality issues with the content of the RDB, the RCM NS&EA performed a range of diagnostic analyses of the data supplied following the 2013 data call for data up to 2012. These aspects of data quality relate to errors at stages 5 & 6 in Table 5.1, and the RCM makes recommendations on quality control and validation procedures at these stages to help WKPICS3 address their additional Term of Reference on data quality diagnostics.
Page 38 of 176
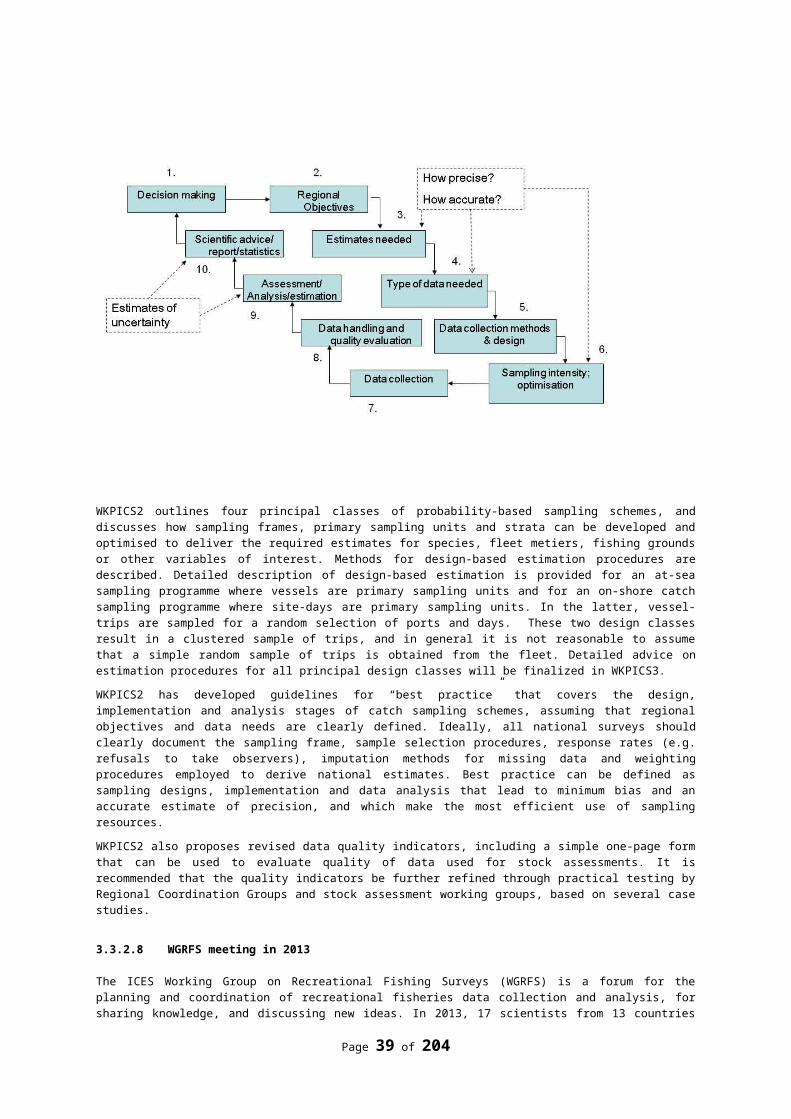
Table 5.1. Quality issues, example diagnostics and example mitigation procedures at different stages from sampling design through to supply of processed data and estimates (examples are given – not exhaustive). Based on PGCCDBS; WKPICS; SGPIDS; WGRFS reports.
Stage Quality issues QA/QC procedures Example diagnostics1 Sampling design Statistical sound design (bias) Description of national survey
design against best practice guidelines
Evaluation against best practice guidelines
2 Sampling implementation
e.g. sampling levels (precision);
data gaps, non-response, observer effects (bias)
Description of national survey implementation against best practice guidelines. e.g. Ensure adequate samples within strata; record refusal rates and details;
data quantity and coverage from RDB data summaries; use of COST diagnostic tools; comparison of other data from observed & non observed trips
3 National data capture
Transcription errors; data entry errors; incomplete entry; ancillary data missing (e.g. missing link between a length sample and vessel data)
Electronic data capture; range checks and other error traps in input software; cross checking of DB content and independent inventory or metadata; cross checking biological and fleet data.
Outlier detection; data values beyond range checks; Differences between DB content and independent inventory or metadata; inconsistencies between biological and fleet data.
4 National data processing
incorrect allocation of trips to metiers or strata;use of weight-length relationships;errors or undetected changes in analysis software;
Quality assurance of data processing procedures and codes;checking analysis routines using standard test data sets;
Unexpected changes in processed data from previous years;Length-weight diagnostics
5 Upload to RDB Incomplete uploads; undetected errors in national database.
Range checks and other error traps in RDB; cross checking of RDB and national DB content and ICES landings etc.
Outliers; data values beyond range checks; Differences between RDB content and national DB content.
6 RDB data extraction and analysis
Compatibility of national data sets (e.g. metier definitions; different forms of bias); imputation or other handling of missing data; national sampling design or cluster effects not properly reflected in data analysis; errors or undetected changes in analysis software
Suite of diagnostic checks for RDB data;
Full documentation of national sampling programmes;
Cross checking data analysis procedures and national sampling design;
Test data sets for analysis software.
Gaps / inconsistencies revealed in RDB diagnostic outputs or other data quality reports.
Proportion of catch comprising strata with missing or imputed biological data.
Differences between national survey design descriptions and analysis hierarchy.
Unexpected changes in processed data from previous years.
7 Supply of data / estimates to end users
Transmission of data quality indicators to end users for data and estimates at stock / fleet / region scale.
Compilation of data quality reports.
Precision & bias indicators;Nos. of primary sampling units achieved by country / stratum; effective sample sizes; other diagnostic plots
Page 39 of 176
5.2 Upload to RDB, Data gaps and incomplete uploads
Following the data call all member states attempted to upload landings to the RDB with reasonable success (See section 8.2.1). ICES were very pleased with the outcome of the call although a number of countries were unable to put all their data on to the system - ICES were consulted in all instances.
Tables 5.2 to 5.4 provide summary overviews of the landings data, length data and age data on the RDB on the 28/08/2013. In this instance the RCM NS&EA were reliant on ICES providing downloads of this data.
Following issues during the upload process, delays meant that MS only completed some of their data uploads during the week of the meeting. These data, which include, for example, the English observer data and French sample data for 2010 to 2012, are therefore missing from these summaries.
Table 5.2 Summary of the landings records (number) held on the RDB as of the 28/09/2013.
FlagCountry 2009 2010 2011 2012BEL 14314 13584 14007 13732DEU 3602 15801 14859DNK 141359 146704 139788 145999ENG 28248 30132 27328ESPEST 22 26 17 28FRA 55460 56818 54850IRL 57 38 23 66LTU 21NIR 526 542 424NLD 14665 27178 25732 27043POL 58 47 10 26PRTSCT 13365 13870 13268SWE 38261 38144 29703 28706WLS 32 37 87
Page 40 of 176
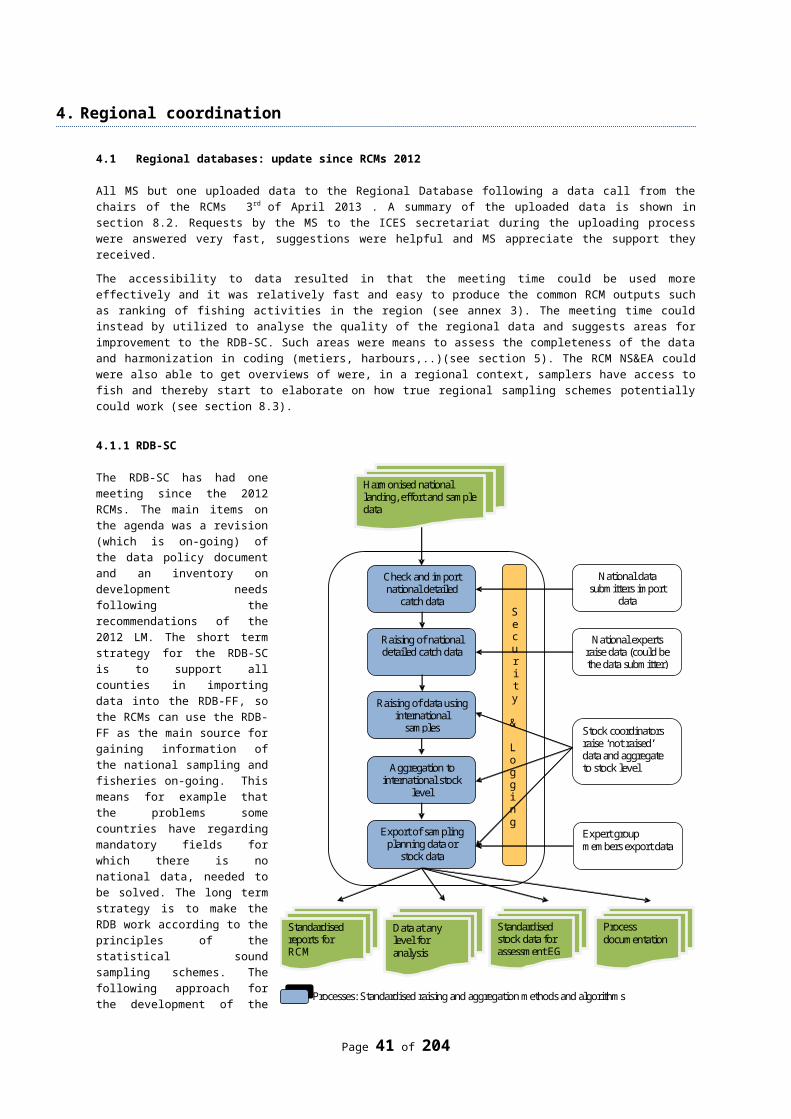
Table 5.3 Summary of the number of Species sampled for length by trip collected from flag vessels.Flag country Catch category 2009 2010 2011 2012Belgium Catch 0 0 0 0
Discards 94 110 82 90Landings 138 155 112 112
Denmark Catch 0 0 0 0Discards 1236 1228 1562 1921Landings 1783 2025 1570 2156
England Catch 45 40 33 36Discards 0 0 0 0Landings 1100 801 1043 1159
Germany Catch 0 0 0 0Discards 0 0 323 407Landings 0 0 195 217
Guernsey Catch 0 0 0 1Discards 0 0 0 0Landings 0 0 0 0
Ireland Catch 0 0 0 0Discards 0 0 0 0Landings 13 13 11 14
Latvia Catch 0 0 0 0Discards 0 0 0 0Landings 4 0 3 3
Lithuania Catch 0 0 0 0Discards 0 0 0 0Landings 0 0 2 0
Netherlands Catch 0 0 0 0Discards 111 131 73 39Landings 379 239 380 95
Northern Ireland Catch 1 3 1 1Discards 0 0 0 0Landings 5 10 42 0
Poland Catch 0 0 0 0Discards 15 18 0 12Landings 6 3 3 5
Scotland Catch 1 2 11 15Discards 0 394 520 564Landings 20 1663 1741 1789
Sweden Catch 0 0 0 0Discards 0 1218 975 1028Landings 307 903 680 552
United Kingdom Catch 0 0 0 0Discards 0 0 0 0Landings 84 170 106 16
Wales Catch 0 0 0 0Discards 0 0 0 0Landings 0 0 0 1
Page 41 of 176
Table 5.4 Summary of the number of Species sampled for age by trip collected from flag vessels.
Flag country Catch category 2009 2010 2011 2012BEL Discards 81 76 63 59
Landings 53 51 49 61DEU Discards 0 0 13 19
Landings 0 0 35 42DNK Discards 261 316 429 532
Landings 291 321 284 352ENG Discards 0 0 0 0
Landings 372 430 463 386FRA Discards 0 0 0 0
Landings 0 0 0 344GBR Discards 0 0 0 0
Landings 51 105 23 3IRL Discards 0 0 0 0
Landings 13 11 10 2NIR Discards 0 0 0 0
Landings 2 10 16 0NLD Discards 0 6 3 0
Landings 147 83 157 93POL Discards 2 0 0 0
Landings 2 2 3 1SCT Discards 0 162 145 156
Landings 9 810 863 966SWE Discards 0 133 136 134
Landings 302 311 298 239
The cells highlighted in grey in these summary tables are not indicative of countries failing to meet the data call – it is only indicative of missing data or null returns. ICES, Spain and Portugal were unable to resolve data issues before this round of RCMs - this stopped them from uploading data in time. Some MS have documented their experiences of uploading to the RDB in section 8.2.2. As well as these more obvious data gaps some of the more successful uploads are incomplete. The UK landings data is discussed in section 5.2.1 to illustrate some of the perceived limits on what the RDB would accept and how this affects the final figures available on the RDB.
5.2.1 Incomplete uploads
Quality checks of data solely within the RDB implicitly would assume that complete data are uploaded by Member States prior to those checks taking place. Consequently, and where possible, it is helpful to examine the consistency of the uploaded data with the other data repositories. For example, landed weights by species and area can be checked against ICES’ records of landed weights as used by its expert working groups and/or the official statistics from Eurostat (See section 5.2.3).
This process would be facilitated if Member States provided some basic information on the consistency of their uploaded data compared with the corresponding ICES or official statistics. This would also help the Member State to identify and, where possible, to resolve any inconsistencies. An example is provided below for the UK administrations where the scale of inconsistencies between the control authority landings and effort data and the corresponding data uploaded into the RDB is shown and the causes of the inconsistencies are identified. This alerts the RCM to the scale of the problem and identifies to the UK administrations where a fundamental problem must be resolved.
UK example:
Landings and effort data for the four UK administrations are taken directly from the official UK control agencies’ database, individual trip data are attributed to metiers and trips are then aggregated according to the RDB specifications. They are then formatted into FishFrame/COST format and passed through the RDB upload checking routine. Where the checking routines flags errors, some can be
Page 42 of 176
resolved by making additions to the RDB code tables or by substituting a control agency code with the equivalent RDB code. In other cases the errors cannot be resolved and the individual record has to be removed from the data file before it is uploaded into the RDB. The deleted records and the reasons for deletion are recorded for QA purposes.The following text table illustrates the scale of deletions from the 2012 UK data and the cause.
Source of error VariableEffort (days) Landings (weight) Landings (value) Effort (trips)
Zero landings for non-zero effort (days) 0.37% unknown unknown 0.65%
Unknown species 0.85% unknown unknown 0.20%Landing presented as liver or roe 0.01% 0.01% 0.03% 0.03%
Unknown country of landing 0.02% 0.01% 0.02% 0.01%
Zero value for non-zero landings (weight) 0.53% 11.37% unknown 0.37%
Zero effort (days) for non-zero landings (weight)
unknown <0.01% <0.01% 0.01%
The totals from the deleted records are presented below and partitioned between the separate UK administrations. From the text table and the chart it can be seen that data uploaded to the RDB will be missing in excess of 11% of the UK vessels’ landed weight and this is due mainly to missing data on the value of landings made by English vessels.
0%
2%
4%
6%
8%
10%
12%
Effort (days) Landings (weight) Landings (value) Effort (trips)Data type
UK percentage censored data (North Sea)
SCO
NIR
ENG
The missing data on the value of landings from English vessels is predominantly attributable to landings made into other countries:
Page 43 of 1760%1%2%3%4%5%6%7%8%9%
NLD DEU NOR ENG FRA SCOPerc
ent o
f U
K ve
ssel
land
ed w
eigh
t
Country of landing
UK (Eng) vessels: % landed (weight) with missing value
This indicates that improvements to the UK landings will be facilitated by investigations into why the ‘value’ field of trip records for UK vessels landing abroad into these countries is missing from the control agencies’ database. If that issue cannot be resolved then it would be helpful if such records could nevertheless be uploaded into the RDB and a flag set to highlight the incomplete record field or whether a value is based on a best estimate.
Quality assurance – RDB additional fields and managing data gaps
RCM NS & EA 2013 Recommendation 2
The RCM recommends that a policy on how missing data values for MS are accounted for in the database and this decision communicated to RDB users.
Justification Proper consideration needs to be given to how to account for empty data values. Missing data could devalue summary information and if estimates are derived how they are derived could change over time.An example is provided in the RCM report where landing information for a MS does not have both value and weights for some of their records. If this data is uploaded then the sum of the landings would not equate to the sum of the value (€).This could also occur in relation to missing fishing effort.
Follow-up actions needed SC-RDB to consider the impact of missing data values and to provide clear guidance on how MS should manage these data.
Responsible persons for follow-up actions
SC-RDB
Time frame (Deadline) Next SC-RDB meeting
5.2.2 Regional Data Base administration and data management
Status Reports
Although tables 5.2 to 5.4 show the availability of data to the RCM, they do not show how complete the data is. In this instance RCMNS&EA is aware that the data is incomplete. These tables serve to highlight a fundamental limitation to the current RDB - the system does not and currently cannot provide us with a reference of what data was not uploaded. There currently is no repository for recording or cataloguing successes and data issues that occur during upload. This information as a reference is crucial for interpreting the data for member states and for assessing the completeness and quality of data.
As a minimum, data status reports for the upload procedures should be available for data users to properly assure the quality of their estimates, any data assessments or sampling achievements. This report could simply be a table of what data is expected for upload checked off against actual data. Who completes this table and how it is completed would form part of a data management system or plan – but a ready reference of what is incomplete is required.
Page 44 of 176
Quality assurance - Managed repository for RDB upload successes and data status reports
RCM NS & EA 2013 Recommendation 3
The RCM recommends that a system for administering and recording upload successes by Member States and a facility to provide a clear reference for data users on how complete the data is.Therefore, it recommended that a repository is implemented for giving data users direct access to: Up to date status reports on the contents of the
database. These reports need to be live and available for data users so that
data calls can be properly audited DB content can be properly interpreted.
Up to date guidance notes Up to date reference lists
Justification Knowing the status of the data is crucial for auditing purposes, for quality control and to determine how the data can be used. It also allows users, within reason, to account for missing data in their estimates or reports.Changes to guidance and reference lists can be communicated to data users with reference to the repository.
Follow-up actions needed SC-RDB to review and incorporate ‘off the shelf’ or develop an application to provide end-users with this functionality and a reference repository.
Responsible persons for follow-up actions
SC-RDB
Time frame (Deadline) Next SC-RDB meeting
It is clear that there is data collected by MS from foreign vessels but with no reference to the port sampled it is not clear who collected or provided the data. Country of landing fields and flag country fields, currently available, do not indicate which administration actually sampled the landing or trip, provided the catch and effort data or even uploaded the data. For auditing purposes, for quality control and to limit the opportunities for replication of landings data an additional field is necessary, in each of the core tables, identifying the administration or MS from which the data came.
Quality assurance – RDB additional fields and managing data gaps
RCM NS & EA 2013 Recommendation 4
RCM recommends an additional field in the core tables to identify the administration that has collected and or uploaded the data.
Justification Currently the country of landings or flag country is the only reference to the source of the data. But with bilateral agreements and most MS now sampling foreign vessels within their sampling schemes it is not always clear which country collected the data. This is crucial for auditing purposes, for quality control and to limit the opportunities for replication of data. This field is also required to allow data to be raised according to national sampling schemes.
Follow-up actions needed SC-RDB to insert a field to identify the source or origins of the uploaded data.
Responsible persons for follow-up actions
SC-RDB
Time frame (Deadline) Next SC-RDB meeting
Data limits and fixes
There will be some references in section 8.2.1 to what Member States had to add to their data to complete the data uploads. Missing values had to be accounted for and in some instances nominal values were created so that the RDB would accept their data. There currently is no reference to the how
Page 45 of 176
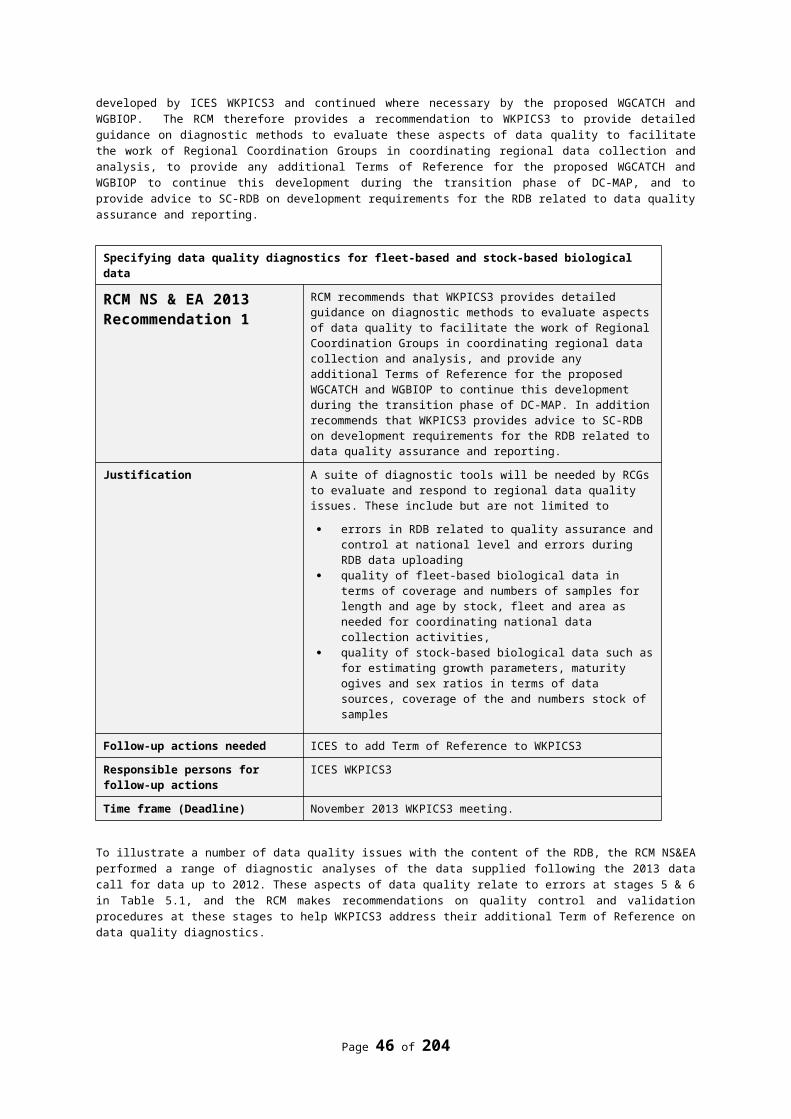
Member States interpreted the current data limits and the ‘fiddles’ required and as a consequence there is a devaluing of the content of the RDB. ICES have attempted to keep the guidance notes on uploading data to the RDB up to date. However with the number of MS attempting to upload data at the same time and the number of issues ICES had to deal with it has been impossible for MS to be consistent and ICES to account for each unique problem and solution in the time and as a consequence the appendices to these guidance notes (which define all the data fields in the RDB and the data limits to these fields) are currently out of date. If there was a catalogue of these issues which lists the problem and solutions complete with a flag as to whether data limits and guidance notes needed updating and the date that they were - that would go a considerable way to helping maintain consistencies in the data. See Recommendations 2 and 3 above.Central Repository
A central repository which holds this catalogue of solutions, the latest version of the guidance notes and the data status reports, could provide all RDB users with a ready reference for up to date information. In setting up this data management system some consideration also needs to be given to how to effectively inform users of any recent changes See Recommendation 2 above
5.2.3 Quality Assurance checks
The missing data limited what the RCM can do in quality checking regional sampling and MS contributions in this instance but the successful uploads did allow the RCM to investigate the tools that could be used for reviewing sampling achievements, sampling plans and quality assurance systems.
Quality Assurance (QA) checks of the uploaded data might be simply comparisons of RDB content against expected values – for example the landings data could be checked against the landings data reported to other sources and overviews or summaries of the biological data – diagnostic tools in each of these instances are demonstrated in the following sections.
5.2.3.1 Landings checks
Through the RDB data call 2012, data for landings from period 2009-2012, were uploaded to the RDB by all MS.
As an example for an initial quality check within the RDB, the landing figures for some selected stocks are compared against the landing figures from other official databases EUROSTAT and ICES InterCatch as well as the landing figures used and recorded in the ICES assessment working group reports. The species cod, plaice and Nephrops in area IV were chosen as examples for this comparison (Tables 5.5 to 5.7).
Initially herring was included in the list of species but was removed from the exercise as it soon became obvious that it was far to complex to compile comparable figures for the area 347d stock as the landings figures covering several areas and were collated differently for the assessments than they were for official landing figures.
Results
When comparing the databases, it is seen that the area coding in the North Sea is presented differently in the different databases both in coding and level of detail.
Eurostat RDB InterCatch ICES WG ReportsNorth Sea 27_3_A 3an IIIaN n.a1
3as IIIaS n.a1
27_4 4a IVaE, IVaW n.a1
4b IVb n.a1
4c IVc n.a1
27_7_D 7d VIId n.a1
n.a1: not defined in a database and handled differently in different assessment working groups.
Some data is still missing for some MS in the RDB and InterCatch for the example species.
Page 46 of 176
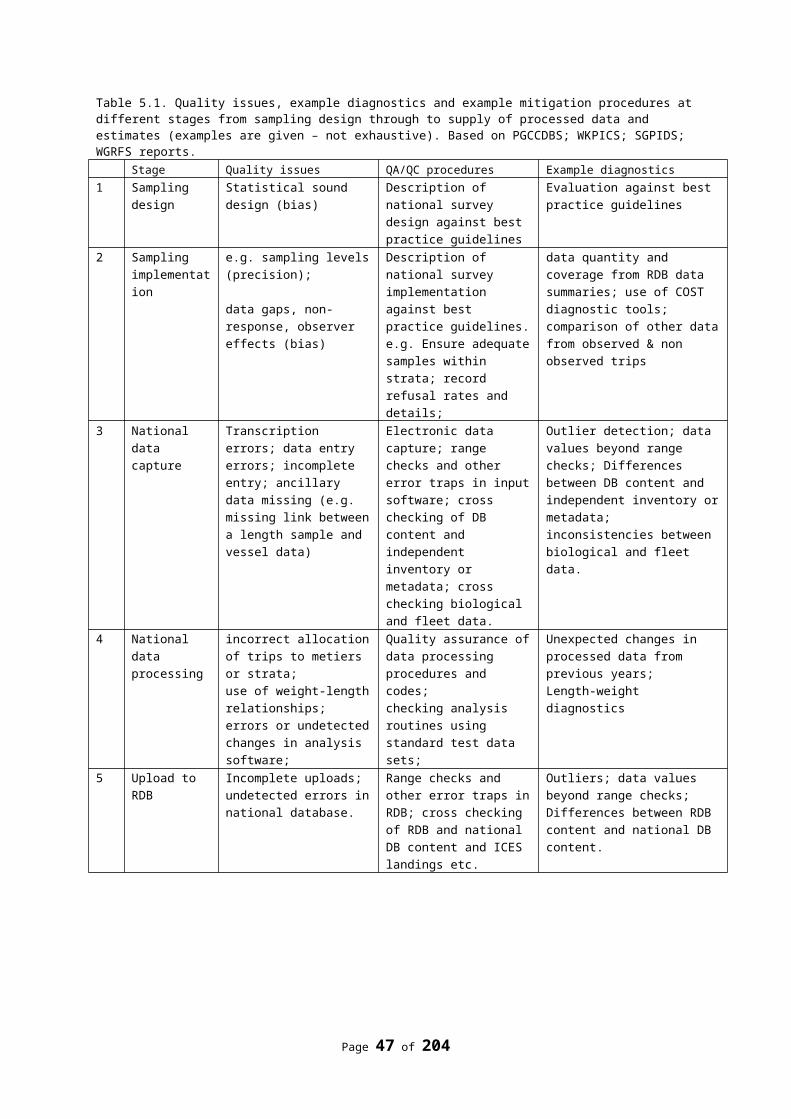
In general, it is a good match between landings reported in EUROSTAT and landings reported in the tables in the Assessment working groups (See tables 5.5 to 5.7).
For cod and plaice, in general, there is a good match between all data sources for all MS and years, but not many examples of a perfect match are seen. For Nephrops, the discrepancies between the data sources are more frequent.
Since the data is uploaded to the RDB and InterCatch in parallel by all MS, and the databases the aims of the databases are different, the discrepancies might be easily explained and might be correct for some species. However, the results show that if the data were first uploaded to the RDB only and the proposed link to InterCatch was in place (which has been proposed for the RDB) the assessment working groups would have had a different set of data for most of the stocks. In most cases the landings are higher in InterCatch compared to the RDB.
The discrepancies in the data could be due to limited quality control of the uploaded data by MS, since, often there are different administrative bodies involved in delivering data from different data sources. A basic data quality check list would help to harmonise the data.
Page 47 of 176
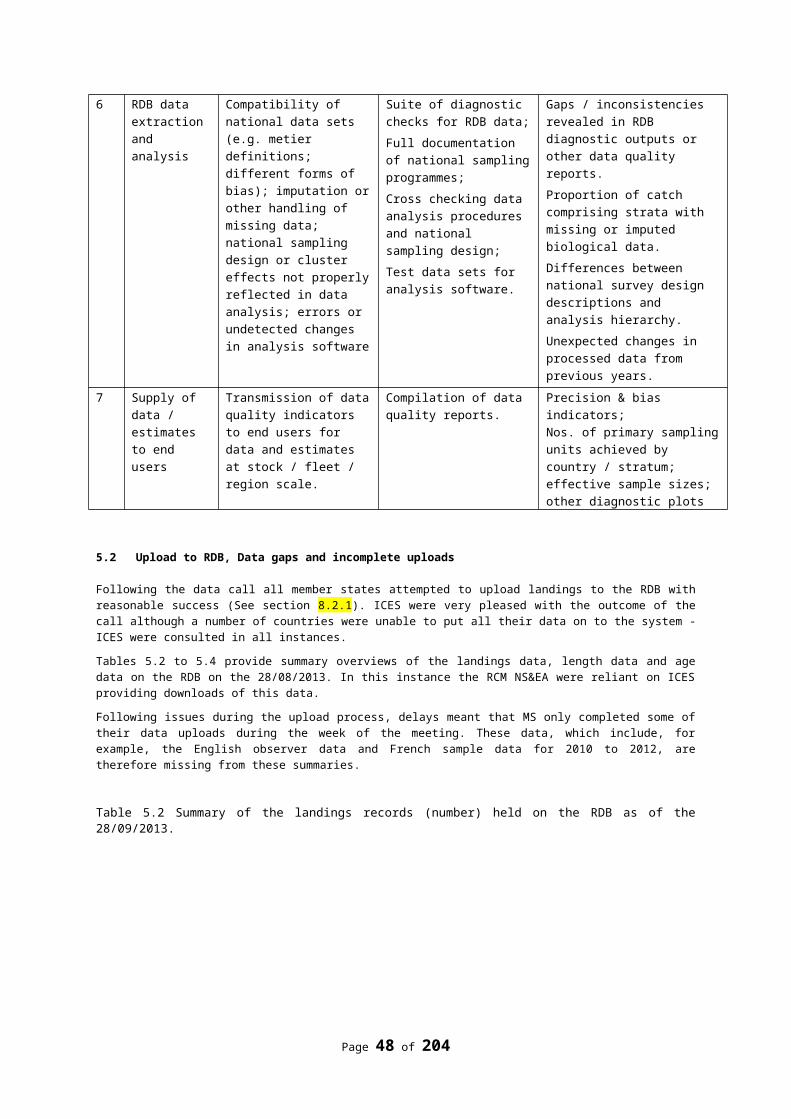
Table 5.5 Comparison of landing figures (tonnes) from different data sources by MS for COD in area IV
COD Year EUROSTAT ICES WG reports InterCatch RDB FFBEL 2009 946 946 922
2010 666 666 666
2011 653 653 655 633
2012 846 846 865 815
DEN 2009 4 402 4 402 4 405 4 402
2010 5 686 5 686 5 910 5 684
2011 4 863 4 863 5 049 4 862
2012 4 805 4 805 4 983 4 805
FRA 2009 950 781 0
2010 782 781 543
2011 563 563 480 619
2012 369 369 369 377
GER 2009 2 374 2 374 0
2010 2 844 2 844 2 927 2 112
2011 2 211 2 211 2 223 2 211
2012 2 292 2 292 2 112 2 112
NLD 2009 2 649 2 649 2 609 2 610
2010 2 657 2 657 2 593 2 593
2011 1 928 1 928 1 952 1 951
2012 1 951 1 951 1 918 1 918
POL 2009 3 0 3
2012 0
SWE 2009 378 378 378
2010 362 363 362
2011 316 315 277 315
2012 471 471 471 471
UK 2009 11 435 11 436 1 952 0
2010 14 120 14 120 13 639 14 102
2011 12 309 12 309 12 128 12 306
2012 12 187 12 187 12 193 12 182
Page 48 of 176
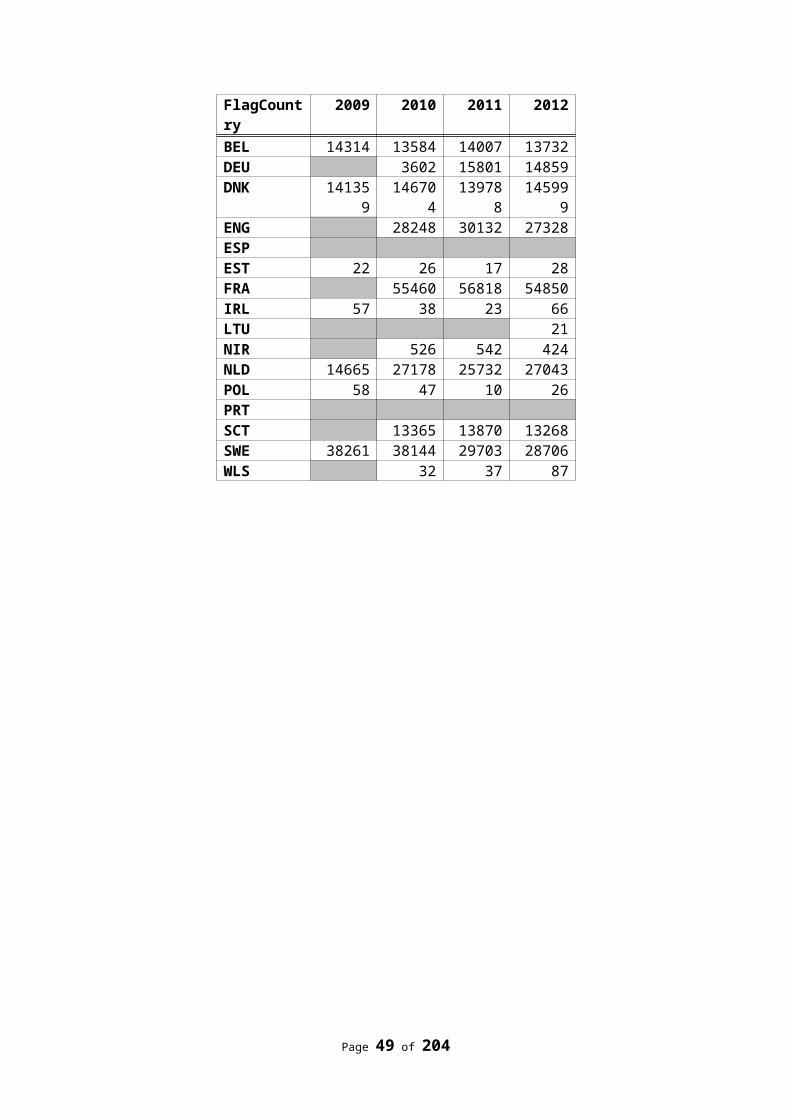
Table 5.6 Comparison of landing figures (tonnes) from different data sources by MS for Plaice in area IV (2012 preliminary data)
PLAICE Year EUROSTAT ICES WG reports InterCatch RDB FFBEL 2009 3 474 3 515
2010 3 699 3 699 3 782
2011 4 588 4 466 4 597 4 469
2012 4 862 4 862 5 061 4 909
DEN 2009 8 156
2010 9 369 435 9 722 9 365
2011 11 636 11 634 12 053 11 625
2012 12 245 12 245 12 639 12 242
FRA 2009 272
2010 385 383 360
2011 334 344 329 375
2012 281 281 245 282
GER 2009 2 931 2 931 0
2010 3 787 3 601 3 728 2 742
2011 3 812 3 812 3 826 3 823
2012 3 742 3 742 3 871 3 871
NLD 2009 23 152 29 142 22 897
2010 26 707 26 689 26 297
2011 29 274 29 272 29 857 28 777
2012 32 201 32 201 32 343 31 608
SWE 2009 1 1 1
2010 5 5 5
2011 3 3 3 3
2012 5 5 5 5
UK 2009 13 143 13 143
2010 14 789 14 765 0
2011 15 500 15 169 15 497 15 478
2012 16 888 16 888 17 101 16 908
Page 49 of 176
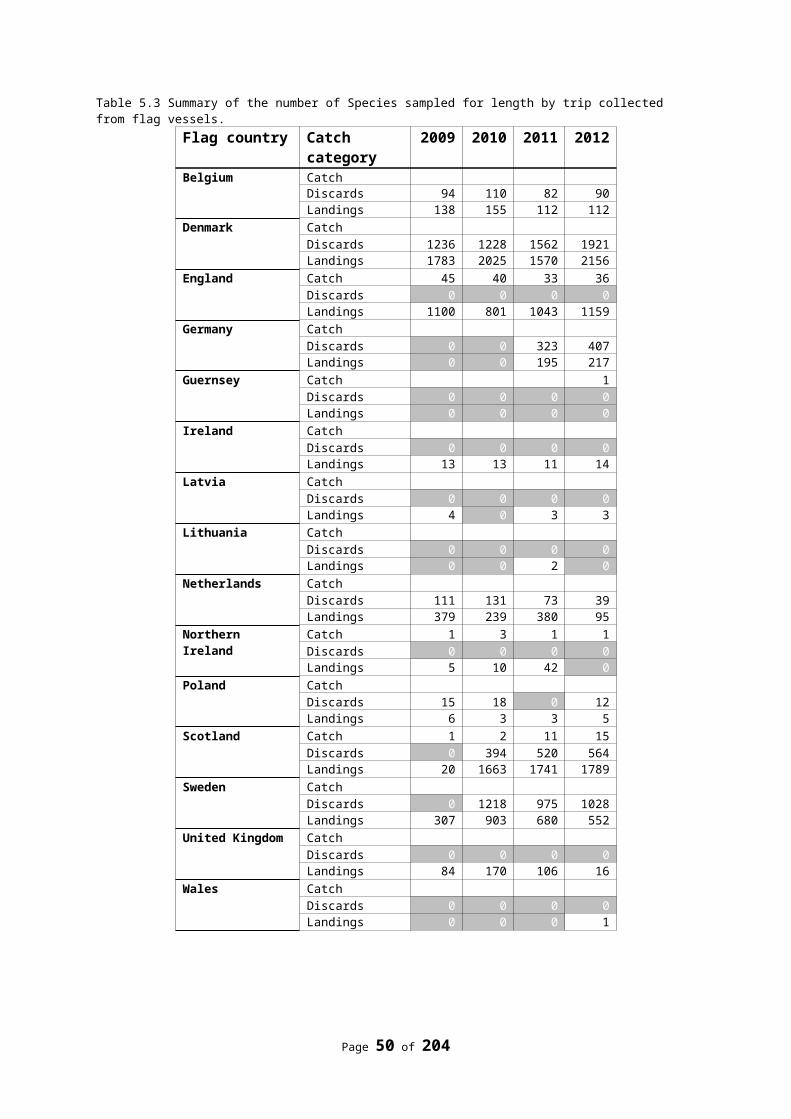
Table 5.7 Comparison of landing figures (tonnes) from different data sources by MS for Nephrops in area IV (2012 preliminary data)
NEPHROPS Year EUROSTAT ICES WG reports InterCatch RDB FFBEL 2009 265 265 261
2010 115 115 215
2011 295 471 60 306
2012 367 129 306
DEN 2009 875 875 875
2010 603 604 603
2011 828 457 460 825
2012 723 825
FRA 2009 0
2010 0 0 1
2011 0 0
2012 0 0
GER 2009 410 410
2010 373 373 327
2011 552 313 346 551
2012 371 121 552
NLD 2009 882 882
2010 701 701
2011 1 012 631 898 0
2012 1 023 524
SWE 2009 2 2 2
2010 1 1 1
2011 1 1 1
2012 1 1
UK 2009 22 023 22 024
2010 18 941 18 914 1 879
2011 14 190 14 041 13 251 13 756
2012 10 967 10 524 14 147
5.2.3.2 Data range checks
Comparing ranges in the data can highlight departures from what would be expected particularly in relation to some of the biological parameters like length and age where there are natural limits.
Table 5.8 below is an abridged version of a table available in annex 9. The table summarises biological data uploaded to the RDB. The full version lists all the sampled species and summarises all the data spanning the four years and all member states. Reviewing all the data in this way allows the user to compare values and ranges against what would be expected. If there is any cause for concern about some of these values the user can then look at the underlying data in more detail by filtering on Flag country and year to determine which data needs correcting.
The parameters chosen in this instance are the data from the length samples and age samples. The table provides the minimum and maximum length in millimetres recorded and the number of length measurements for that species. The next five columns relate to the age samples and provide the range of length measurements with associated ages.
Page 50 of 176
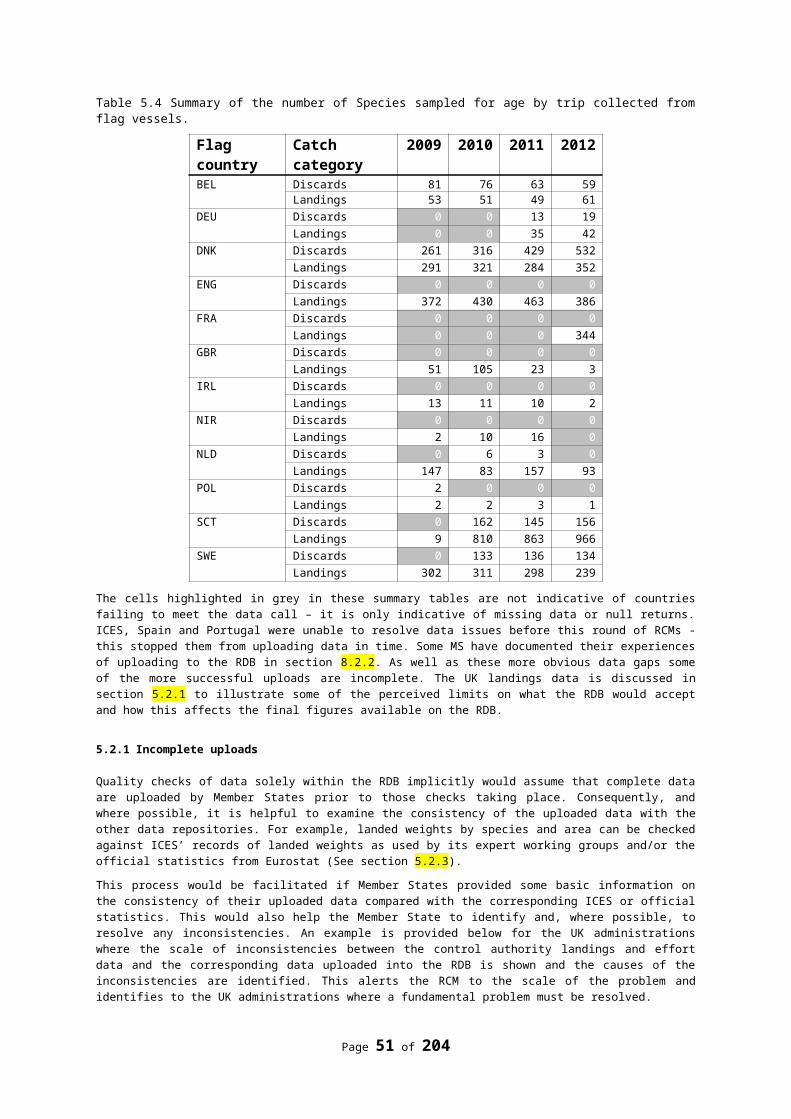
This table not only serves to highlight outliers (99 year old Clupea harengus) but also highlights - for example:
inconsistencies in species nomenclature (Ammodytes sp. versus Ammodytidae sp.) and Lumpenus lampretaeformis and Lumpenus lumpretaeformis)
some potential errors in the species coding (Macropodia). age samples collected for a species group rather than individual species (Lophius sp.). fewer lengths samples than expected (Anguilla anguilla and Salmo salar).
Species coding and nomenclature are discussed in the section 5.3.1. There was insufficient time for the RCM to investigate these potential errors but the RMC recommends that MS provide some assurance that their data is fully validated before upload.
Table 5.8 Data range check – an abridged table from Annex 9 showing data ranges and sum for biological data stored on the RDB.
Length Samples (mm) Age SamplesLength Ages
Species Min Max Numbers Min Max Min Max Numbers
Abramis brama 360 360 1 9999 9999 9999 9999 9999…….. ….. ….. ….. ….. ….. ….. ….. …..
Amblyraja radiata 30 770 13676 9999 9999 9999 9999 9999Ammodytes marinus 40 250 199720 80 215 0 4 971Ammodytes sp. 110 160 4 9999 9999 9999 9999 9999Ammodytes tobianus 40 170 26 9999 9999 9999 9999 9999Ammodytidae sp. 120 250 40 9999 9999 9999 9999 9999Anarhichas denticulatus 470 1300 475 9999 9999 9999 9999 9999Anarhichas lupus 150 1260 3015 9999 9999 9999 9999 9999Anarhichas minor 300 1210 49 9999 9999 9999 9999 9999Anguilla anguilla 360 930 5 9999 9999 9999 9999 9999……….. ….. ….. ….. ….. ….. ….. ….. …..
Clupea harengus 15 420 215057 15 393 0 99 54865……….. ….. ….. ….. ….. ….. ….. ….. …..
Gadus morhua 50 1570 310805 40 1570 0 32 94941……….. ….. ….. ….. ….. ….. ….. ….. …..
Lophiidae sp. 300 910 127 9999 9999 9999 9999 9999Lophius budegassa 590 650 2 9999 9999 9999 9999 9999Lophius piscatorius 80 1560 12675 160 1100 0 12 719Lophius sp. 140 1460 26832 200 1460 1 18 2531Lumpenus lampretaeformis 110 330 235 9999 9999 9999 9999 9999Lumpenus lumpretaeformis 80 260 56 9999 9999 9999 9999 9999………. ….. ….. ….. ….. ….. ….. ….. …..
Macropodia 138 138 1 9999 9999 9999 9999 9999………. ….. ….. ….. ….. ….. ….. ….. …..
Salmo salar 170 170 1 9999 9999 9999 9999 9999Sardina pilchardus 100 260 565 220 220 2 2 1………. ….. ….. ….. ….. ….. ….. ….. …..
Page 51 of 176
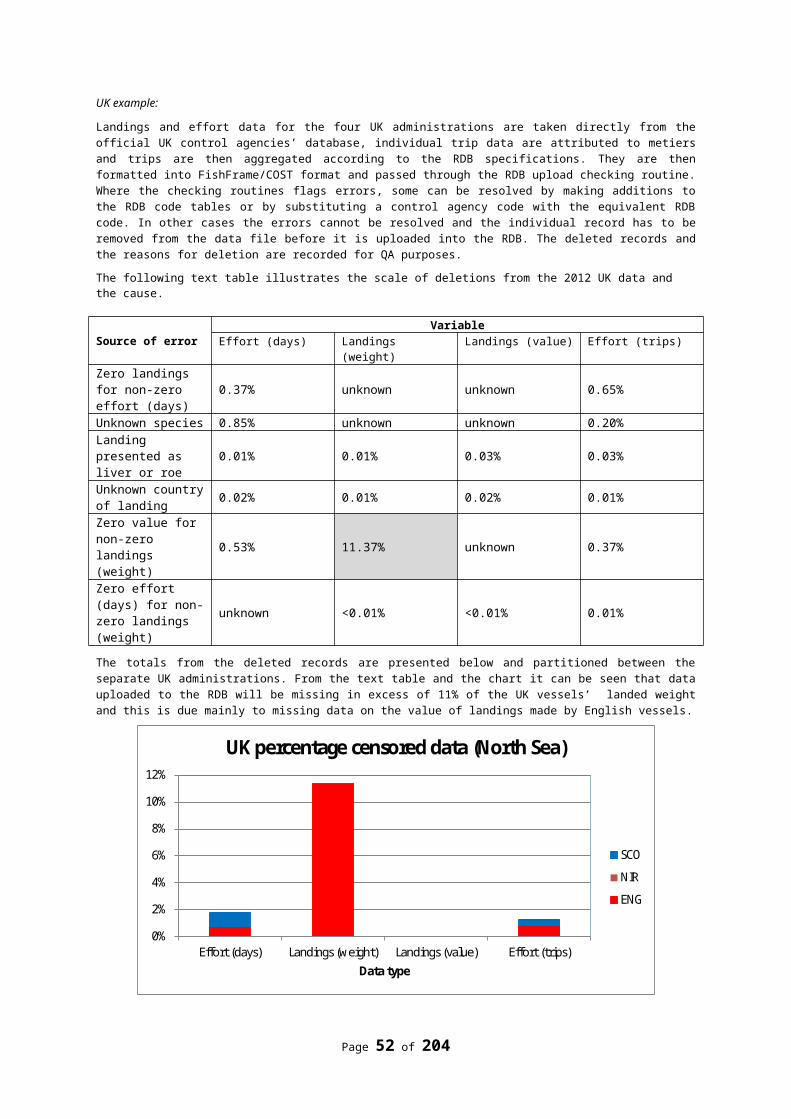
5.3 RDB data extraction and analysis
The data on the RDB should be available for the RCGs to coordinate sampling schemes, audit and review sampling successes and review potential biases and MS contributions. This section reviews the analytical tools and diagnostics that might be used by RCGs. However, as the data was incomplete and there were some inconsistencies in some of the crucial fields RCMNS+EA had to resolve these issues first.
Over the history of these RCMs data consistency has always been an issue whether combining data from MS for ranking Metiers or investigating sampling achievements by species. A lot of time was always spent during the meetings resolving inconsistencies in these crucial identifiers (metiers and species) before the data could even be used. RCMs in the past have drawn up definitive and limited lists and provided strong recommendations that these lists are adhered to but still the problems persist. The RDB provides the means for ensuring MS are more consistent in the values they use in these data fields but further development of the RDB is required to ensure this. MS are currently able to add to these definitive lists as there are no procedures for managing these lists within the DB or protocols in place to limit these additions or instructions on communications and consultation. A process for managing these lists needs to be adopted.
5.3.1 Reference lists of metiers and species and data inconsistencies
During the process of harmonisation and coordination of sampling activities in relation to key metiers at regional level, it is fundamental that there is a reference list of e.g. species, metiers (other such as harbour?) that is to be used by the RCGs, the RDB and the MS.
In previous RCMs a reference table was provided to be used for Tables III_C and III_E. Based on a limited metier and species reference list, RCM NS&EA 2010 recommended MS to use this reference tables in the future in revision of the NP 2011-2013 and in compiling new NP’s.
Through the RDB data call 2012, data for landings period 2009-2012, are uploaded in the RDB.
As an example for an initial quality check within the RDB, the metiers and the species in the RDB were compared to the last available version of the reference list of metiers and species.
Métiers
Outputs from the RDB compared to the reference list, shows inconsistencies in naming of the métiers sampled in the region. (Table 5.9)
Page 52 of 176
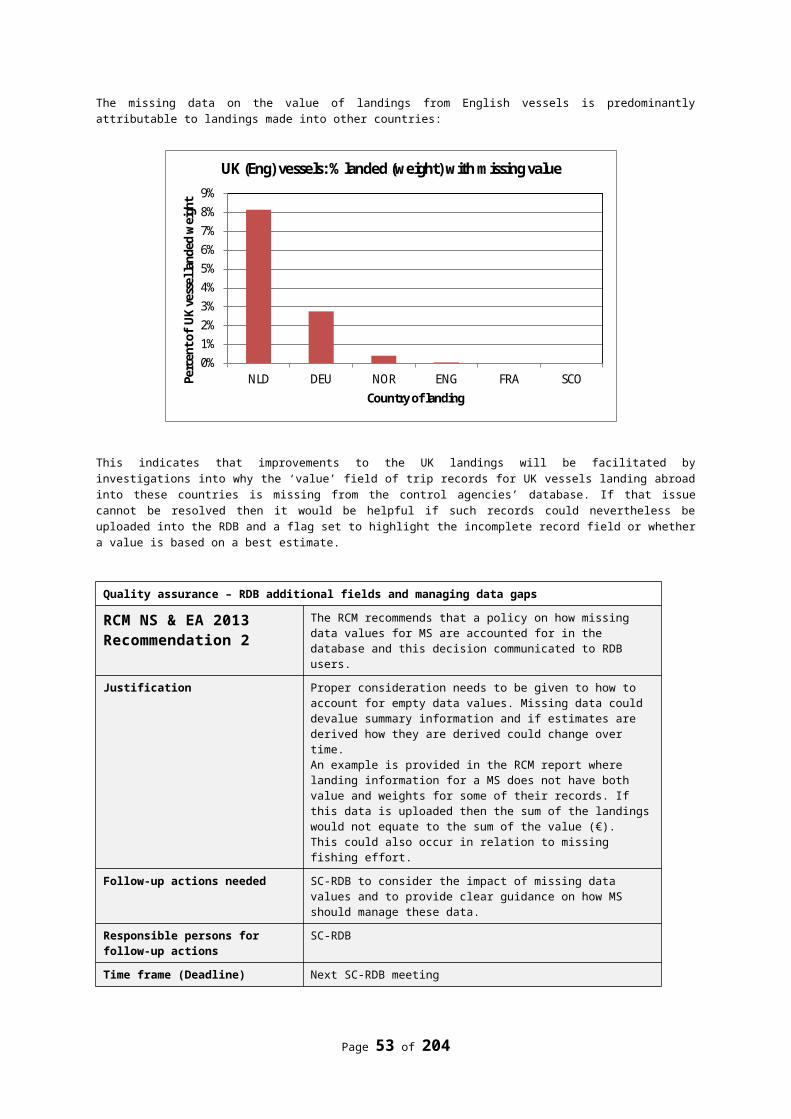
Table 5.9: Comparison métiers in RCM reference list and RDB (1 = in RDB and Reference table 2 = in RDB, not in reference table, 3 = new métier).
MetierNo. MS
CodeComments
DRB_MOL_>0_0_0 5 1 none
DRB_MOL_0_0_0 6 2 MS need to correct according to reference table
FPO_CRU_>0_0_0 7 1 None
FPO_CRU_0_0_0 4 2 MS need to correct according to reference table
FPO_FIF_>0_0_0 3 1 None
FPO_FIF_0_0_0 1 2 MS need to correct according to reference table
FPO_MOL_>0_0_0 4 1 None
FPO_MOL_0_0_0 1 2 MS need to correct according to reference table
GNS_CRU_>0_0_0 2 1 None
GNS_CRU_0_0_0 1 2 MS need to correct according to reference table
GNS_DEF_0_0_0 2 1 None
GNS_DEF_90-109_0_0 1 3 To be added in reference list
GNS_DEF_90-99_0_0 7 1 None
GNS_DEF_UND_0_0 1 2 MS need to correct according to reference table
GTN_UND_120-219_0_0 1 2 MS need to correct according to reference table
GTR_DEF_>0_0_0 1 2 MS need to correct according to reference table
GTR_DEF_0_0_0 1 2 MS need to correct according to reference table
HMD_MOL_>0_0_0 2 2 MS need to correct according to reference table
HMD_MOL_0_0_0 1 2 MS need to correct according to reference table
MIS_UND_UND_0_0 1 2 MS need to correct according to reference table
No_logbook6 3 2 MS need to correct according to reference table
No_Matrix6 2 2 MS need to correct according to reference table
OTB_DEF_>=120_0_0 8 1 None
OTB_DEF_>=120_1_120 1 3 To be added in reference list
OTB_DEF_0_0_0 2 2 MS need to correct according to reference table
OTB_SPF_32-69_0_0 8 1 None
OTB_SPF_32-89_0_0 1 2 MS need to correct according to reference table
OTM_SPF_32-54_0_0 1 2 MS need to correct according to reference table
OTM_SPF_32-69_0_0 9 1 None
OTM_SPF_32-89_0_0 1 2 MS need to correct according to reference table
OTM_SPF_UND_0_0 1 2 MS need to correct according to reference table
PS_SPF_>0_0_0 4 2 MS need to correct according to reference table
PS_SPF_0_0_0 1 2 MS need to correct according to reference table
PTM_SPF_32-89_0_0 1 3 To be added in reference list
To avoid these types of fundamental errors and to guarantee the harmonisation within the region, RCM NS&EA recommends that the list of metiers allowed for the region are used by all MS (table 5.9) and also restricted within the RDB. When MS need to add a new metier this should be verified and accepted by the RCG before changes are made in the RDB. To improve the flexibility of the DCMAP process, RCMNS&EA recommends setting in place a process within the RCG and the intersessional work (Figure 5.0). A similar process may need to take place when new species are to be added in the RDB. RCMNS&EA 2013 compared the latest actualised list of species with the species in the RDB. From this comparison, there were 16 spp present in the reference list which were not used, 59 spp present in both lists, and
Page 53 of 176
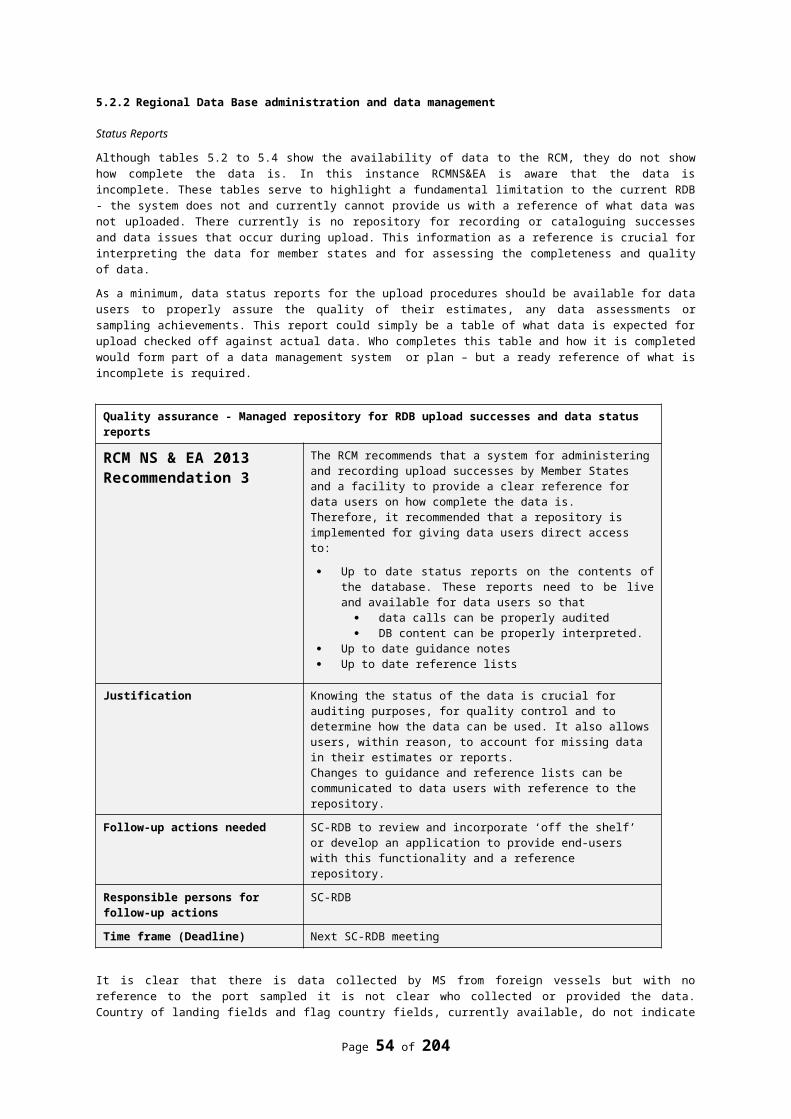
262 spp present in the RDB but NOT in the reference list. A full table of the species listed in the most up to date reference table combined with the RDB is available in Annex 10.
Figure 5.10: A flow diagram describing a possible 6 stage process for intersessionally adding new species and metiers to the agreed reference lists.
To accommodate this process, an update and actualised reference lists of metiers and species need to be available and accessible to all users of the RDB. A database, for example similar set up as the RCM-Recommendations database (ICES) is recommended by the RCMNS&EA2013. The SC-RDB can look into this and bring forward some scenario’s to accommodate the reference list.
In intersessional work, the use of i.e. a metier-database can be tested. The database can host all available information regarding metiers in one “place” e.g.:
level 4 level 5 Fishing Activity lvl 6 I, II IIIaIV, VIId NAFO
XII, XIV, Va
Description of métier
OTB OTB_CRU OTB_CRU_70-89_2_35 1
OTB OTB_CRU OTB_CRU_70-99_0_0 1 1Info to be found in métier description RCM2010
OTB OTB_CRU OTB_CRU_90-119_0_0 1OTB OTB_CRU OTB_CRU_90-119_1_120 1OTB OTB_CRU OTB_CRU_90-99_0_0 1 1
The development of the actual and updated reference list and putting into place a repository (database?) should be part of the roadmap as described in section 6.4.
The sub-group spent a considerable amount of time linking the métiers as listed in 2010 with the métier descriptions provided by the MS. These descriptions are expected to be kept up-to-date but as yet there is no common repository for them. The spreadsheet which contains a summary of these description is held on this RCM SharePoint but a means of keeping these up to date and more easily referenced is recommended.
Page 54 of 176
RCG intersessional
work
every two months update
communicated to RCG & SC-RDB
agreement within RCG and
reference list updated
To ICES as host of RDB
in RDB and communicated to all MS & SC-RDB
MS propose a new métier code
or species
1
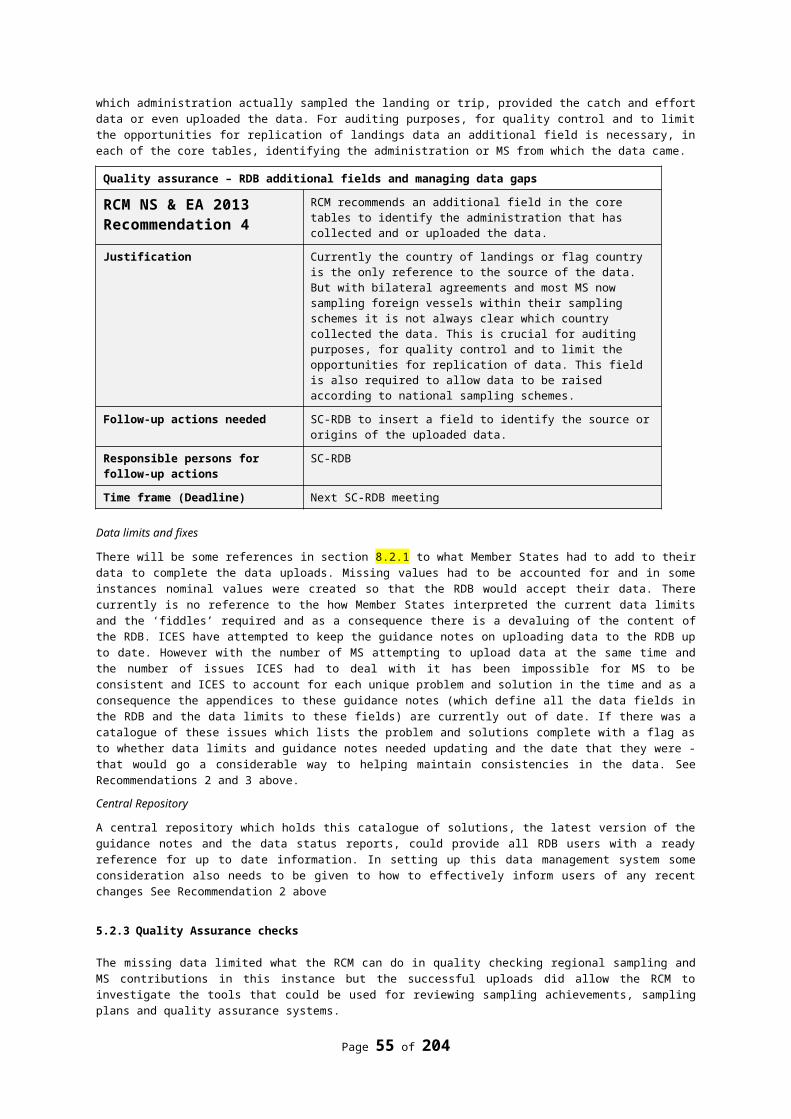
Regional Database: Code lists and Reference tables for regional data base
RCM NS & EA 2013 Recommendation 5
It is recommended that code lists and reference tables in the regional data base are comprehensive, unambiguous. Fields and appropriate standardized code lists are needed for: Harbour, Species, metier, sale location, sampling location (in the CS data), fish presentation (e.g. whole or partial), and data provider (i.e. who did the sampling and uploaded the data). In addition it is recommended that means of linking effort measures more directly with landed species is needed. Presently the CL and CE can only be linked by metier.
justification The design and implementation of design based sampling requires consistent coding of the data in all fields, and appropriate fields and relationships to be available in the RDB.
Follow-up actions needed RCMs and RCGs need to update reference listsThese lists should be implemented in the RDB. It should not be possible to upload data for ports and metiers outside the list without permission from the RCM chair. The updated table of metiers should take all metiers standardized and accepted by RCMs over the last years into account. Reference tables for species should match current standards as implemented for ICES databases like WoRMS.
Responsible persons for follow-up actions
Actualize the reference table ports-Marie Storr-PaulsenActualize the reference tables species: ICESReference table metiers - Els TorreeleSC-RDB to ensure implementation by ICES Secretariat as host of the RDB
Time frame (Deadline) End 2013
5.3.2 Definitions of samples and trips
There are differences in how trips and stocks are sampled by MS and as a consequence the counts of SampleIDs and TripIDs for each member state are not directly comparable. To be able to use this data for auditing sampling successes and effort at a regional level these differences either need to be resolved or another reference table required so data users can properly interpret these fields. MS need to provide the RCGs and SC-RDB with clear definitions of what the TripID and SampleID represents in their uploads.
Page 55 of 176
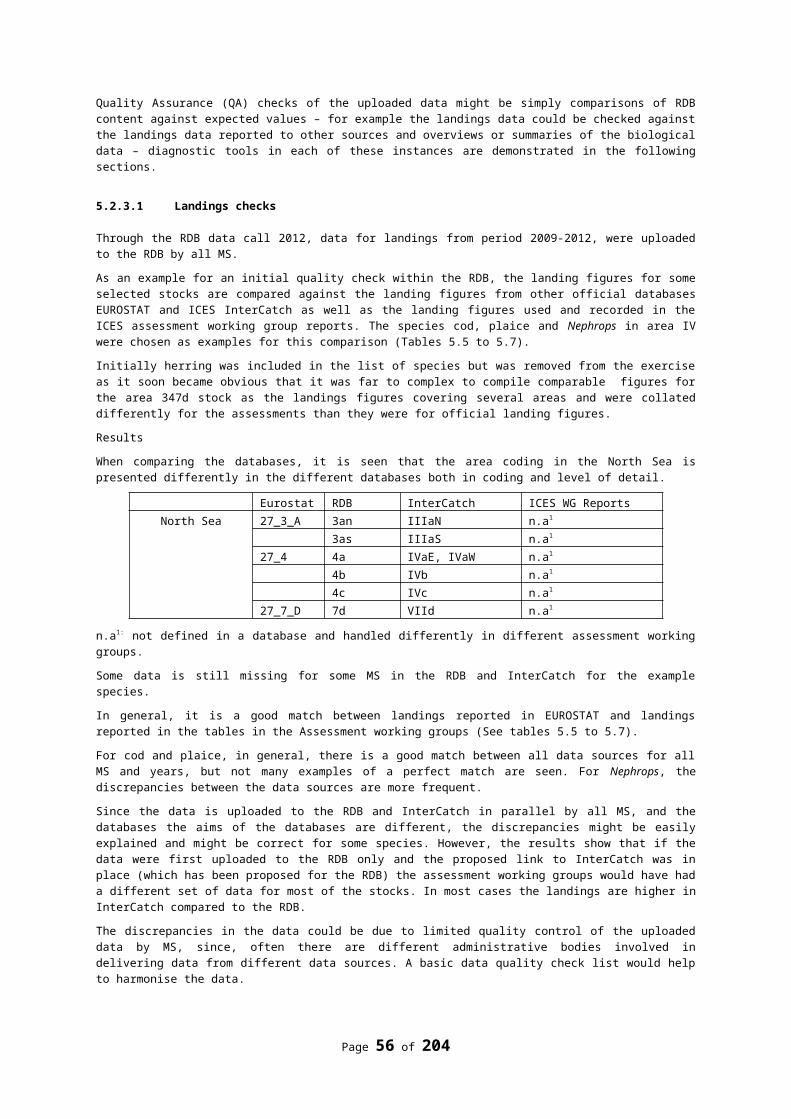
Quality assurance - Managed repository for RDB upload successes and data status reports
RCM NS & EA 2013 Recommendation 6
RCM recommends that MS document their interpretation of trips, samples and sampling events and describe what the TripID and SampleID represent in there uploaded data.
Justification The key identifiers for the biological data refer to trips and samples in most instances, for example on a discard trip each event is quite distinct but ashore where sampling might only focus on components or categories of a landing then this can lead to a different interpretation and achievements are therefore not directly comparable.Sampling events, trips and samples are crucial for auditing and monitoring sampling design and key to significant quality indicators.
Follow-up actions needed MS to provide a summary document of their interpretation of these key fields in the upload data formats.RCG to collate these documents for storing in the RDB repository (see earlier recommendation)
Responsible persons for follow-up actions
MS, SC-RDB
Time frame (Deadline) Next SC-RDB meeting
5.3.3 Quality Assurance checks
WKPICS and SGPIDS provide a clear reference to quality indicators for sampling schemes. WKPICS and WGRFS provide examples of Quality Assurance (QA) reports that would be used and could be produced from the data held on the RDB as part of the Regional Management process. Although there was consensus at PGCCDBS 2013 and plan to trial the WKPICS QA report it became clear intersessionally, that further work on these reports is required by WKPICS before a trial is adopted. Some of the diagnostics demonstrated below could form part of these reports.
RCMNS+EA has used what analytical tools are currently available to reproduce these quality indicators with the data currently on the RDB to provide examples of the different quality indicators essential for monitoring the successes of a design based sampling scheme.
Currently the RDB does not contain the means of linking the effort data to the number of landings of a particular species. A trip is a simple sampling unit and to be able to review the distribution of these across stratum for different species or species groups would help with regional sampling design and providing other simple quality indicators listed at WKPICS and SGPIDS – see Recommendation 5.
5.3.3.1 Goodness of fit indicators.
Tools developed in R as part of the COST project provide comparisons between samples and the sampled population. Figures 5.1 to 5.3 were produced using these tools on 2012 data and provide quality indicators on goodness of fit. They indicate the distribution of sampling effort relative to fishing activity and landings and how well the regional or national sampling schemes are working.
5.3.3.2 Proportional plots.
In Figure 5.1 the weight of cod samples in 2012 as a proportion of the sum of the samples for the region is compared against each countries share of the landings. This suggests that the sampling appears to roughly follow the distribution of the landings. Looking to the future and a new regional sampling strategy, in the long term, if this pattern persists and taking all other signals into account, there might be scope for Denmark to do more at the expense of Germany. These figures should never be used in isolation. As well as signals from other diagnostics simple practical aspects like availability of and access to samples needs to be considered as well.
Page 56 of 176
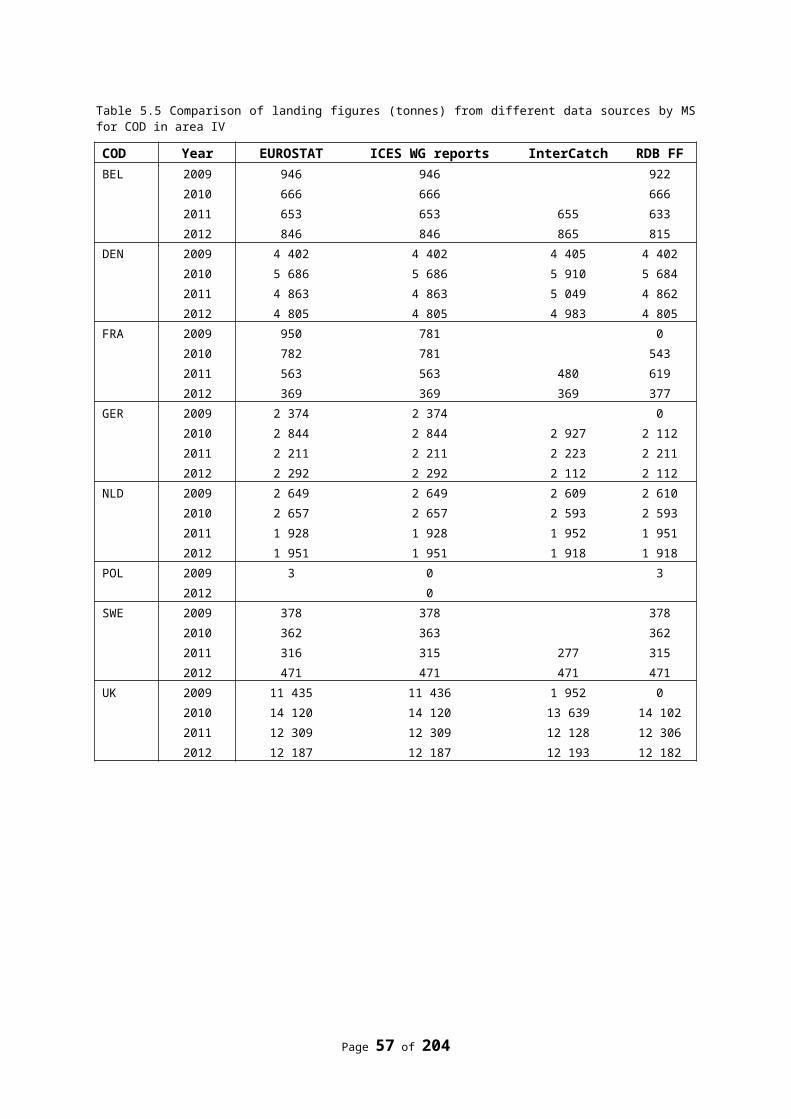
In this instance the data is incomplete – see France sampling and Norway’s sampling – and there is also the assumption that the definition of a sample for each member state is the same. If the missing data were included and the definition of a sample standardised then the relative distribution might better reflect the landings than these figures suggest (See recommendations on definitions - Section 5.3.1)
Figure 5.1 Plot of the proportion of the sum of MS sample weight of length samples for cod (blue line) against the relative proportions of the landings of cod from NS and EA in 2012
The x axis can be changed to review the relative proportions of the sampling and landings temporally as well as spatially. These proportional plots could also be produced at a national level looking at the distributions of sampling relative to their sampling frames and stratifications. These plots can also be used to see how the random sampling design might be meeting other objectives in relation to post stratifications. Figure 5.2 shows a similar plot to that above with the relative proportions of sample weights for Plaice in 2012 against landed weights for different metiers.
Again the sampling seems to demonstrate a reasonable distribution of sampling across most of the ‘important’ level 6 metiers. If this data was complete (which it is not) and all data descriptors consistent and well defined then this plot might suggest potential biases in the sampling (See circle and arrow).
Page 57 of 176
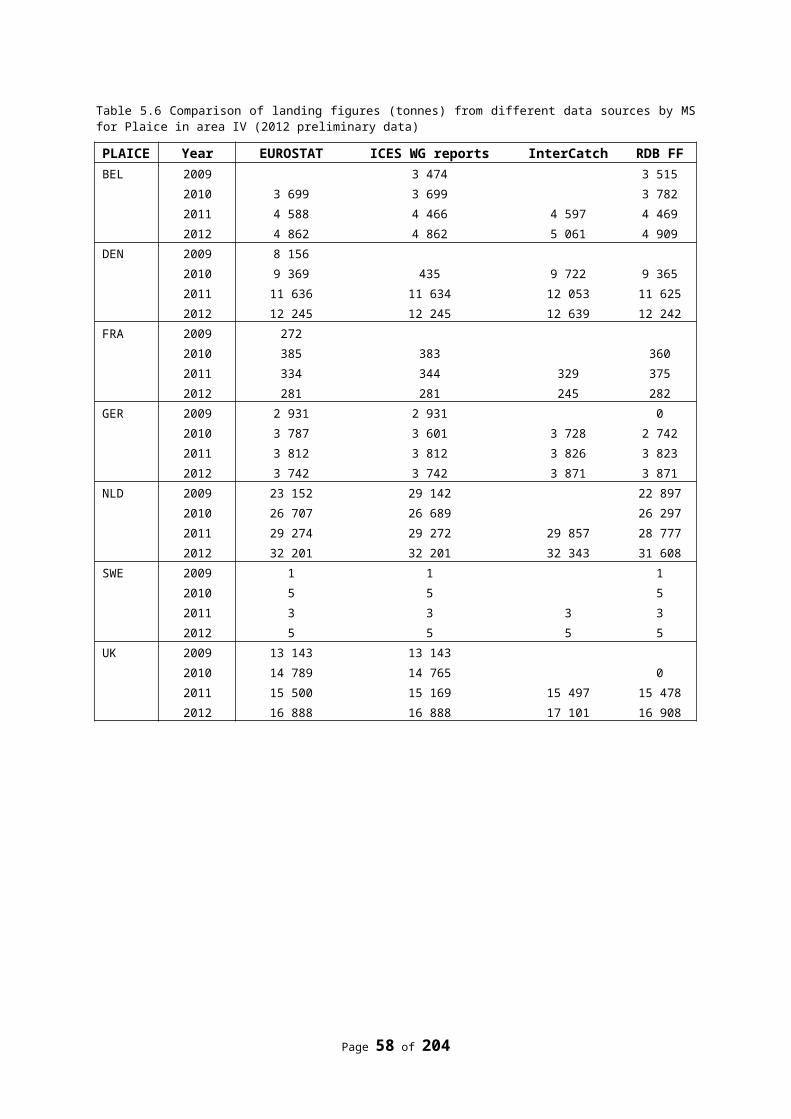
Figure 5.2 Plot of the proportion of the sum of sample weight of length samples for plaice (blue line) against the relative proportions of the landings by metier NS and EA in 2012. Circle shows significant sampling for a metier with low landings and the arrow shows significant landings with no sampling.
The values of these proportions might be used to provide a score or indicator of quality of the sampling. The absolute value of the differences for each category added up across categories and then divided by the number of categories might provide a simple statistic and measure or indication of goodness of fit. This has only been discussed briefly and further work or consultation would be needed to evaluate this theory.
5.3.3.3 Spatial plots
Figure 5.3 shows the distribution of where most of the landings of Plaice came from. The RDB contains rectangle information for both samples and landings so combining both these figures in the same plot whether in terms of number of trips or weight would provide a visual signal of how representative the sampling by the Netherlands might be. AS Plaice are migratory creating seasonal distributions of the relative sampling activity would also provide a good visual indication of how the sampling scheme is meeting its objectives.
Page 58 of 176
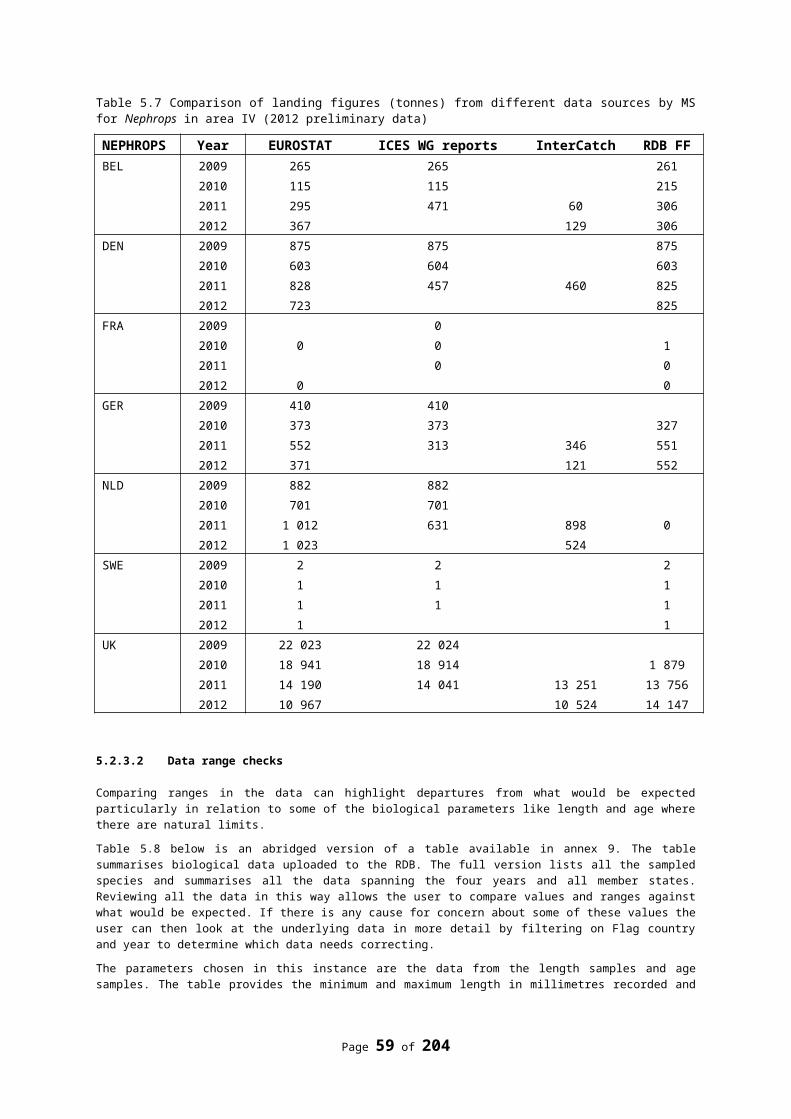
Figure 5.3 The ICES rectangles that Plaice were landed from by the Netherlands in 2012.
5.3.3.4 Biological variables
COST tools were used to produce Figures 5.4 to 5.6. Figures 5.4 compares the length samples and 5.5 to 5.6 the age samples of NS cod collected by MS. These figures show significant differences between them – these samples are un-raised but they could be indicating a) biological and regional differences in the components of the stocks these MS are sampling, b) differences in the selectivity of the fisheries that contribute to each member states plots or even c) differences in the sampling or processing of these data. Both a) and b) might have an impact when compared to the significance of the landings and the relative contributions of each to the Regional Sampling Scheme. Category c) sampling and processing differences is more of a concern however work of the PG and international ageing workshops and working groups looking at standardising sampling techniques has exposed an appetite for standardising processes looking for consensus on techniques etc. – these will improve if indeed these are an issue.
Page 59 of 176
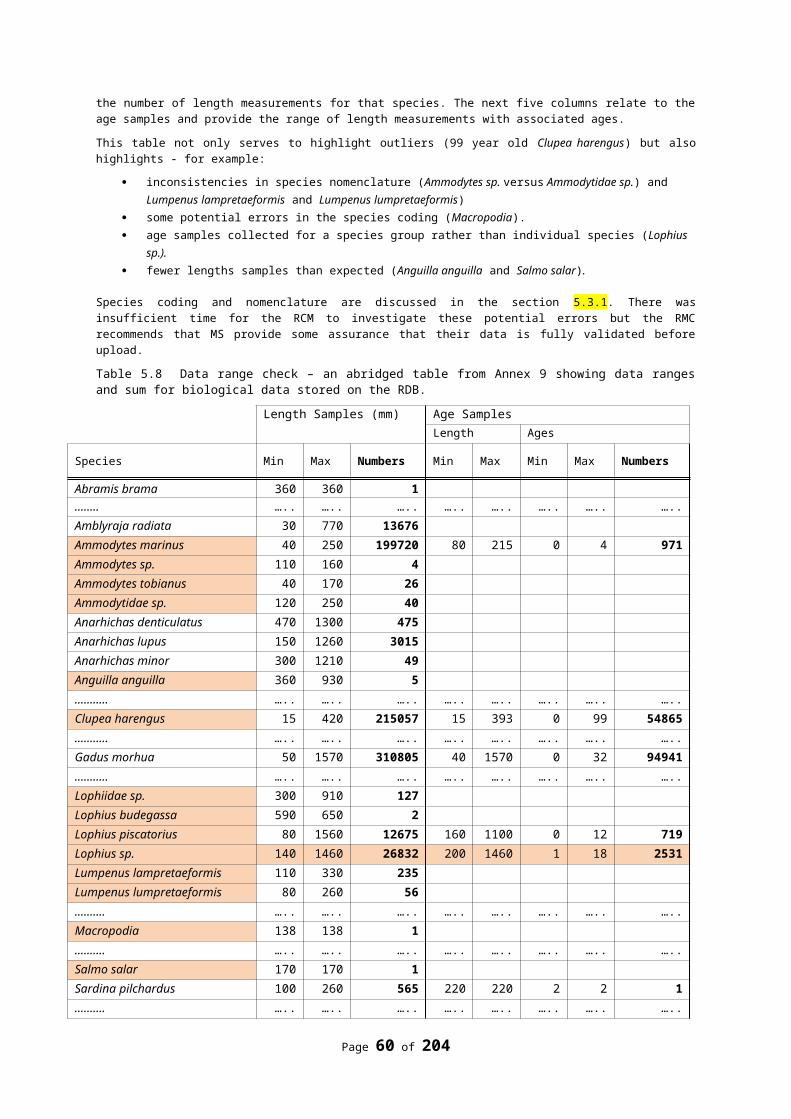
Figure 5.4 Summed un-raised length frequency distributions from samples collected for NE Atlantic Cod by MS in 2012.
Figure 5.5 Age plotted against length for all age samples collected for NE Atlantic Cod by MS in 2012
Page 60 of 176
Figure 5.6 Comparison of MS age length relationships for NE Atlantic Cod calculated from samples collected in 2012.
In summary there are simple ways to review both the quality of the data and the quality of sampling schemes but currently there isn’t a process for reviewing and reporting on quality. MS need to ensure the data meets the requirements of the DB and will need to provide documentation of what error traps and QC they have in place. The Database administrators with further development of the RDB need to ensure controls are in place to filter and check data as it comes in and provide status reports on the data within the RDB. At a regional level qualitative statistics are needed and could be calculated with more information available through the RDB. The RDB could provide meaningful measures at a regional level of CVs, precision estimates and relative standard errors with further development.
5.4 Quality indicators of surveys
The DC-MAP will require quality indicators for all data collected under the programme. In the previous paragraphs of this chapter an attempt was made to develop some diagnostics of quality for sampling of the catches landings, discards, biological parameters and transversal variables on a regional level. These need to be further developed and implemented in the near future in order to meet future quality requirements of the DC-MAP.
Also fishery independent data such as surveys need to be subject of routine quality evaluation. Most surveys are carried out by more than one MS sometimes in cooperation with other non EU nations. These surveys. if operating under the DCF and DC-MAP, need to be internationally coordinated in order to be eligible. The quality evaluation of the survey results, as presented to the end-user, needs to take into account the contribution of all the participants to the survey and should therefore be evaluated routinely on the international level.
The RCM NS&EA acknowledges the efforts already made by ICES to attempt to estimate the quality of the survey estimates and stimulates ICES and other organisations which coordinate DCF survey, to develop a suite of diagnostics from which the quality of the survey can be estimated.
It is necessary to make the results of these quality evaluation available to the MS and the RCG, in order to enable them to report these (or refer to these) in their Annual Reports.
Page 61 of 176
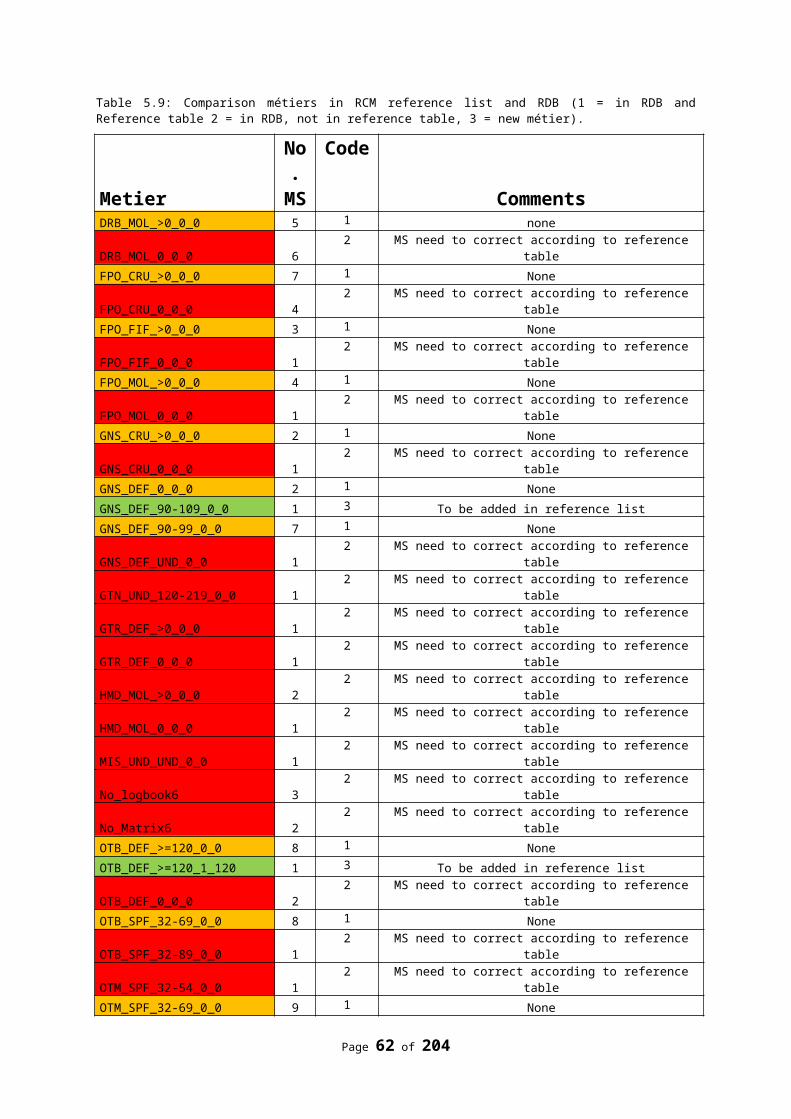
Quality assurance – surveys at seaRCM NS&EA 2013 Recommendation 7
The RCM recommends to develop a suite of diagnostics from which the quality of the (inter)national results of surveys at sea can be assessed.
Justification MS and RCGs have a legal requirement to report on the quality of data collection carried out under the DC-MAP to the European Commission.
Follow-up actions needed Develop a toolbox with survey quality diagnostics, establish a process which applies and reports those.
Responsible persons for follow-up actions
ICES and other international organisations which coordinate DC-MAP surveys
Time frame (Deadline) before the implementation of DC-MAP (2016)
Page 62 of 176
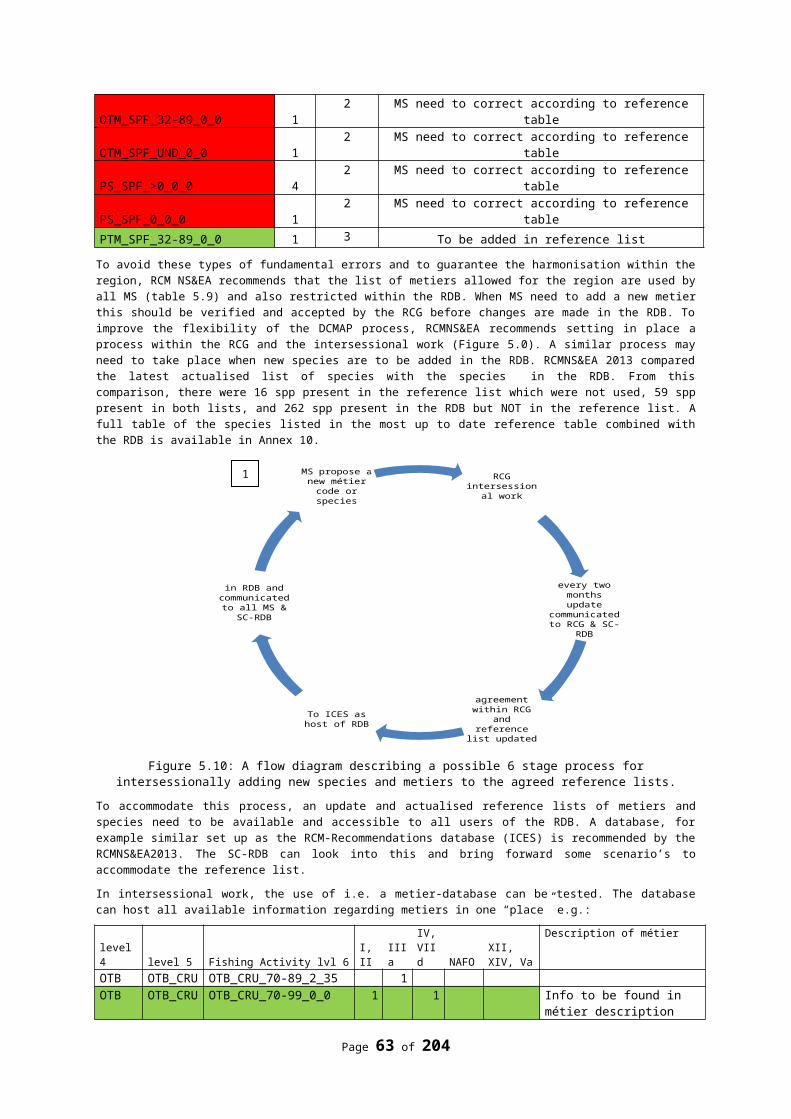
6. Revision of the DCF (DC-MAP)
6.1 Feedback on the draft DC-MAP2014-2020
Initially, it was envisaged that, from 2104 onwards, the CFP Basic regulation would contain an Article providing the legal basis for data collection, which would be complemented by a Data Collection multiannual programme (DC-MAP). However, Council and Parliament decided that the CFP Basic Regulation would not act as the legal basis for data collection, but would instead set out the key principles for future data collection, and that Regulation 199/2008 would be maintained, and should be revised to align it with the principles in the CFP basic Regulation. In order to avoid a gap in data collection, the Commission has extended the present EU Multiannual Programme (Commission Decision 2010/93/EU) for 2014-2016, and to roll-over the Member States' National programmes 2011-2013 for the period 2014-2016.
At present no legislative text for the DC-MAP is available. However, the requirements of future data collection programmes have been discussed by various STECF expert working groups (EWG). In June 2103, STECF EWG 13-05 has proposed a structure for the DC-MAP, including proposals for legislative text, which could be a basis for the DC-MAP.
A summary of the EWG 13-05 report was given to RCM NS&EA in plenary, along with a brief summary of EWG 13-02 (DC-MAP 1) and of the Commission Consultation Document “EU Data Collection for Fisheries 2014-2020 (4 June 2013). This was followed by discussion in plenary.
EWG 13-05 covered only building blocks B and D in the Commission Consultation Document. Block B defines the contents of the Common Core Data Collection programme applicable for the next 7 years (these provisions will be the basis for the Data Collection Multi-Annual Programme DC-MAP) and Block D defines the contents of the Master Reference Register (MRR), the flexible part of the data collection programme. The view of the Commission on the MRR had changed between EWG 13-02 and 13-05, having determined that the MRR could not constitute a legal instrument, and that a Commission Decision would still be required to define detailed MS obligations for data collection.
The RCM NS&EA considered the report of STECF EWG 13-05 and has the following comments. The comments are restricted to the collection of transversal and biological data.
The transition period of the first 7-year period of DC-MAP will require considerable work to establish regionally-coordinated data collection programmes based around the progressive attainment of statistically-sound sampling schemes delivering end-user needs for data. The Regional Coordination Groups may propose adjustments to National Programmes, and task sharing or other collaborations between MS, to help achieve desired data quality across the wide range of sampling programmes. However this must be based on analysis of existing DCF /DCMAP data to evaluate precision and/or other quality indicators and to evaluate the impact of changes to some areas of data collection on the quality of other data. Skills to carry out such work are limited, and there would be advantage in establishing a project to develop methods and approaches that RCGs can adopt in future. The Commission representative suggested that this could be considered for funding under the EMMF Regulation (July 2013) Article 85-2(a) “studies and pilot projects needed for the implementation and development of the CFP2” or Article 85-2(e) “cooperation activities between the Member States in the field of data collection”, but there was urgency to provide the Commission with proposals by the week following RCM-NS&EA as they are finalising their work programme for 2014. Decisions would be made mid-2014 following final adoption of EMFF. Such Direct Management funds would lie outside the ring-fenced national EMFF budgets. The Commission representative and RCM NS&EA proposed re-cycling the PGCCDBS 2012 proposal for a 2-year collaborative study contract on “Support design based regional data collection programmes”, which had not been funded. This project was to develop an operational framework for establishing and coordinating design-based sampling programmes at a regional scale for the most cost-effective delivery of fishery and biological data required by the revised DCF and any specific additional needs to support assessment and fishery management.
Under present DCF, national obligations for data collection are created through a clear decision process, for example following métier ranking. Other than for surveys, this has not been proposed yet for DC-MAP and it is not decided for example how end user needs will be split between MS to create obligations. The Commission representative suggested RCM consider this under the role of the new RCGs, noting that
Page 63 of 176
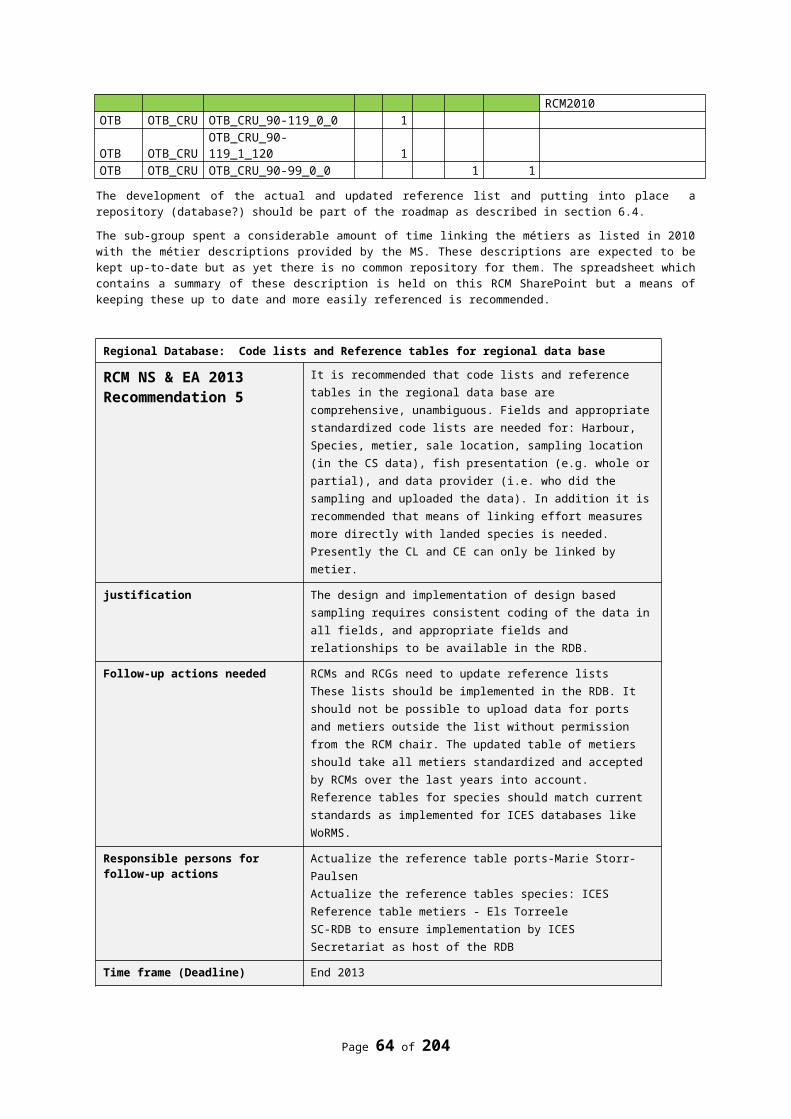
RCGs can make recommendations but do not have legal power which resides in the Commission through changes to the DC-MAP Decision, as at present.
An individual view was expressed within RCM NS&EA that shared management may actually lead to less flexibility in funding, and MS may therefore be less inclined to follow recommendations of RCGs. The Commission representative suggested that RCMs must reflect and propose on the roles and responsibilities of RCGs including their decision making powers. RCM noted that the DC-MAP will lead to a large increase in the responsibilities and tasks of RCGs, for example agreeing on data collection schemes and sharing of sampling. However, once the RCGs start looking at data and resolving the big issues, it will make it easier to deal with the many smaller ones. Again it was emphasized that the starting point will be the analysis of current data.
An issue of monitoring of by-catch of marine mammals and seabirds was raised. Such data collection can be costly and there are clear advantages in coordinating the collection of both types of data where possible, to reduce costs.
Participants raised the issue of the linkage between data collection requirements under the Control Regulation and the DC-MAP. One example was shown for transversal variables where discards data collected through CR requirements had much lower species diversity than collected through DCF. Bias also exists in CR data through the exemption for reporting discards quantities below 50kg per trip. A second example was for small-scale fisheries where the Control Regulation Article 16 allows the use of sales slips to record catches where no EU logbooks are required, but Article 65 provides an exception to land up to 30kg per trip for personal use without reporting. In Sweden, where a separate national logbook is completed, sales slips account for only about half the landings recorded in the logbooks. The CR data are therefore substantially biased. RCM noted that if CR does not provide the required data quality, the data should be collected through DC-MAP. RCM members suggested the need for a Commission meeting, involving people dealing with DCF and CR data, to discuss how best to record accurate catch data. MS are not controlling the 50kg threshold for discards reporting, for example, because they do not think the data will be used.
6.1.1 Comments made by participants from different MS on the draft DC-MAP
Some participants prepared comments to the documents of the Commission on the proposed DC-MAP. Also comments were given to the draft report of STECF EWG 13-05. The comments were not discussed in plenary and are given in Annex 1.
6.2 Data Sampling for eel and salmon under the DC-MAP
The UK presented a document summarising outline proposals for data collection for eel and salmon in accordance with the recommendations that came from the ICES Workshop on Eels and Salmon DCF Data 2012 (WKESDCF) and the STECF review. The full document is available in Annex 2. Currently the data collection for these pan European stocks is not internationally or regionally coordinated except through the respective ICES Working Groups. The data needs and requirements for assessments of these stocks are not the same as for most of the regularly assessed marine species however there is a clear appetite for these International Scientists to adopt the current cooperation and consensus on regional planning and task sharing emerging from the international community on sampling marine species. Although Salmon and Eel straddle the boundaries of the current RCMS there is already cooperation between these groups with member states also straddling the boundaries and linking these Regional Groups.
STECF agrees that DC-MAP should cover eel and salmon assessment data, and should include data from inland waters. This needs to be clear in the text of the DCMAP, particularly in the chapter on stock based variables.
For salmon and eel, data for assessment purposes shall be collected from fisheries in both marine and inland waters. The rivers where monitoring data are collected as well as variables which are to be collected in each of the rivers will be decided in Regional Coordination Groups.
Although there was concern expressed within this RCM that deciding on Census Rivers might not form part of the RCGs role, the process is not that dissimilar to the task sharing that is being proposed for the Regional Sampling Schemes for marine stocks. With the appropriate expertise included within the RCGs
Page 64 of 176
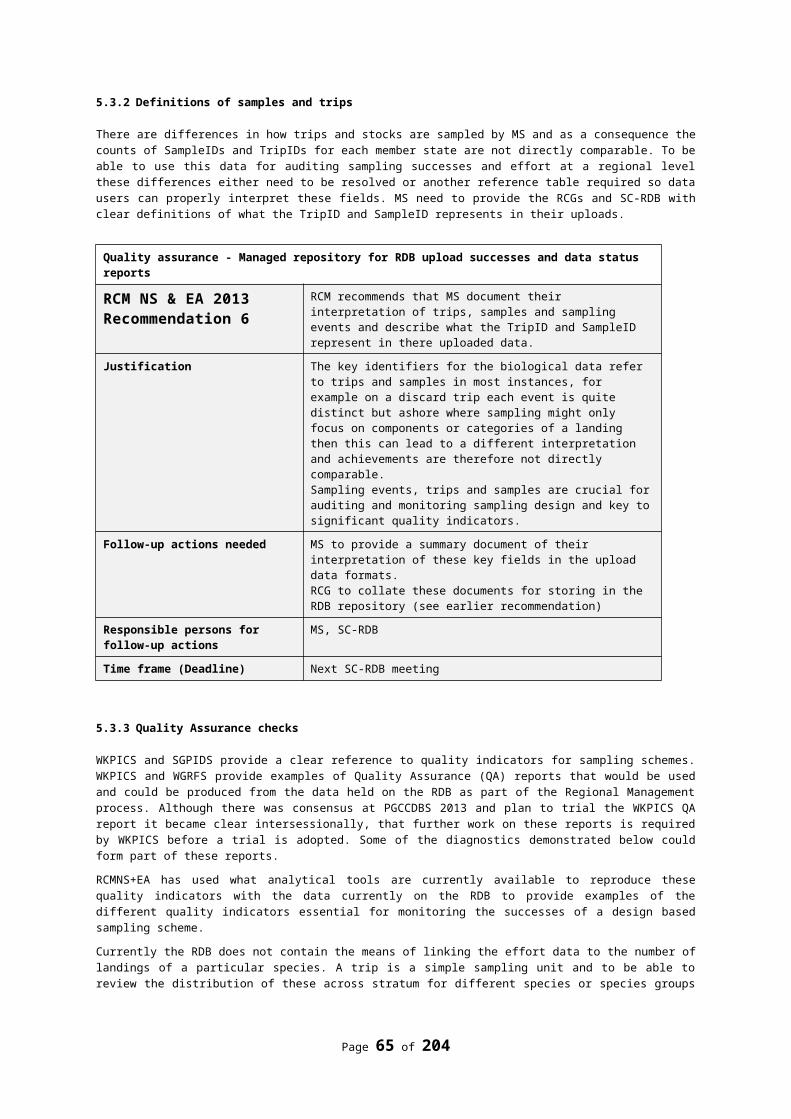
there is no reason why these stocks should not be considered in the same way. From the DCMAP 2 meetings it stated that it will be the role of RCGs to prioritise sampling in the most effective way.
The proposal includes a number of recommendations common to both Eels and Salmon – details are provided in the paper:
1. Meet the standards of precision required for marine species, or develop these from pilot studies; 2. Habitat data collection should be included, and harmonised with the Habitats Directive; 3. Data collection for eels and salmon should be harmonised, where practical.
Specific recommendations are listed below but again further detail is provided in the paper.
For Eel:1. Need pilot studies for sampling eel in open waters2. Fisheries data , standard – annual3. Fisheries data to estimate mortality rate –management plan period (3yr)4. Index rivers – annual – recruitment, standing stock, pre-spawner stock, fishing- and non-fishing
mortality rates5. Recruitment time series used for international stock assessment6. Standing stock surveys used for national assessments7. Biology, diseases and contaminants – per Eel Management Unit8. Establish mortality rates from non-fisheries factors9. Economic data
For Salmon:1. Include ICES Areas IIIa and VIId 2. West Greenland fishery should be included3. Fisheries data (standard) – annual4. Mixed stock fisheries – stock discrimination every 5 years5. Census rivers – adult counts6. Salmon index rivers – juveniles, emigrating smolts, returning adults7. Juvenile abundance surveys in rivers8. Include data on sex ratio and fecundity9. Exclude data on maturity – returning adults are all mature10. Economic data
From the outset these requirements appeared ambitious to the RCM and there was concern expressed that it was not clear whether some of the points in each case could be prioritised. Example costs are provided in the paper but that assumes some task sharing is already agreed amongst the administrations within the UK and they do include FECs with some of the funding already sourced (so they would include costs which will be in-eligible for funding under DCMAP).
The West Greenland fishery falls outside the remits of these RCMs and at the time of the presentation it was not clear if this proposal was looking for sampling or looking to source data already collected by states outside the EU. Clarification was sought after the meeting. The West Greenland sampling programme is organised and agreed by the international management organisation, NASCO; its aim is to sample the West Greenland fishery (which exploits European salmon stocks) to provide input data for the assessments undertaken by ICES. EU signs up to the programme and commits UK and Irish scientists to it (with MS agreement) but does not provide funding because it is outside EU waters. WKESDCF recommended that funding should be provided under DCMAP to support the assessment, which is for the general benefit of EU.
The RCM agreed with the scope of these proposals and is happy to support, within the DCMAP, the regionalised approach proposed but expressed concerns that there is little comment about Salmon and Eel in the EWG 13_05 report and that STECF should include Salmon and Eel experts.
6.3 Cost sharing model for joint research vessels surveys under DC-MAP
At present two research vessels surveys are conducted as joint Member States financed surveys; the International Ecosystem Survey in the Nordic Seas and the Blue Whiting Survey in the Atlantic.
Page 65 of 176
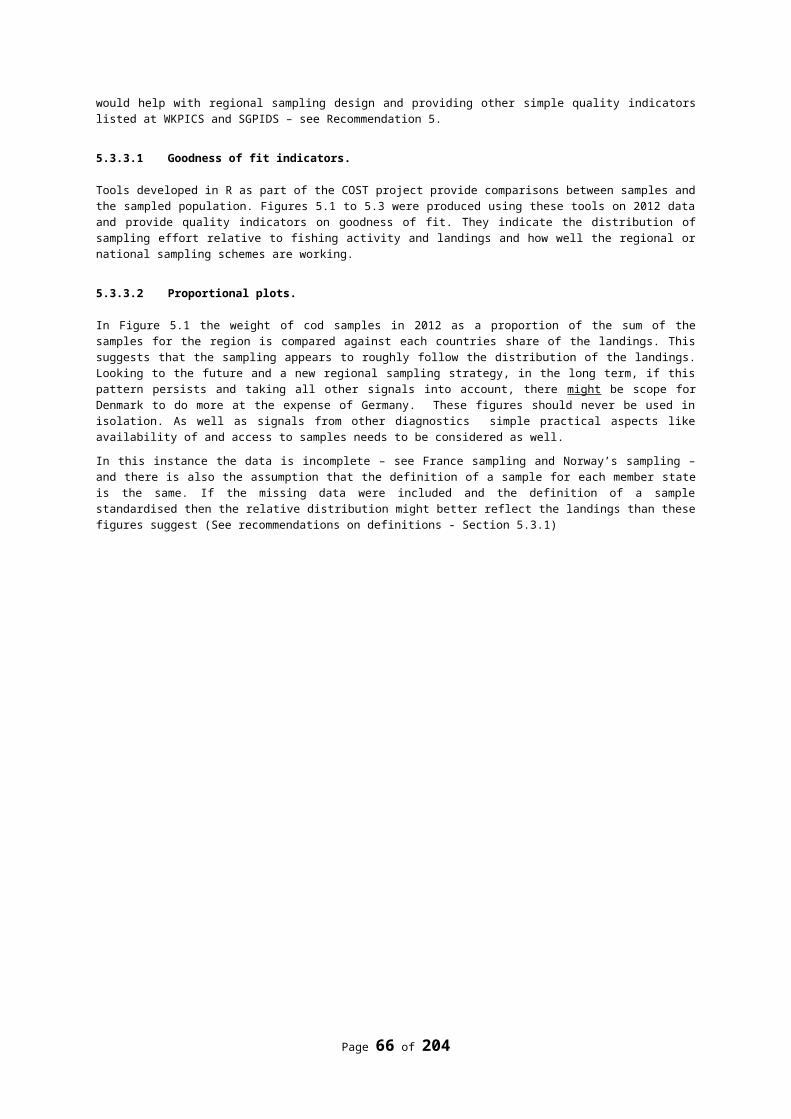
In the International Ecosystem Survey in the Nordic Seas the Danish R/V Dana is representing the EU in cooperation with research vessels from three third countries. The costs of the survey and scientific crew are shared by Member states and in this case proportional with the MS TAC share of Norwegian Spring Spawning Herring which are the main targeted species at this survey. Only those MS’s that are having a quota share of 5% or more are included in the cost sharing. Denmark, Germany, Ireland, the Netherlands, Sweden and UK are all having a share of 5% or more. The survey has been conducted successfully since 2004 and in a cost effective way. This survey, under the acronym ASH, is included in the list of research surveys at sea under the current DCF (D10/93 Appendix XIV).
The Blue Whiting Survey is carried out the Irish R/V Celtic Explorer and the Dutch R/V Tridens representing the EU in cooperation with research vessels from two third countries. The costs of the survey and scientific crew are shared by Member states and in this case proportional with the landings of blue whiting. Only those MS’s that are having a landing share of 5% or more are included in the cost sharing. Denmark, Germany, Ireland, the Netherlands, Spain and UK are all having a landing share of 5% or more. The survey has been conducted successfully since 2008 and in a cost effective way. As the Nordic survey, this survey is included in the list of research surveys at sea under the current DCF (D10/93 Appendix XIV).
Until now the total research vessel cost for conducting the surveys have been included in National Programme for the “vessel Member State” and the Commission have funded 50% of that cost. The other 50% has been shared according to the above mentioned cost sharing model, either TAC share or landing share. The costs for the scientific staff have been included in the respective MS NP.
For the future under the DC-MAP where funding of the data collection is made available under the EMFF (article 79) the cost sharing model has to be changed as the MS providing the research vessel will not be able to include the total research vessel cost in their Operational Programme nor in the Annual Work Plan.
RCM NS&EA proposes the following cost sharing model under the DC-MAP/EMFF for both surveys:
All involved MS include a description of the surveys in their OP and AWP. The “vessel Member State” submits a research vessel cost budget forecast for the coming year by an agreed date (e.g. 1st December) to the involved MS. The total research vessel cost for conducting the survey (national and EU funding) is shared according to the TAC share for the main species concerned; i) the International Ecosystem Survey in the Nordic – the Norwegian Spring Spawning Herring, ii) the Blue whiting survey – the blue whiting. Only those MS’s that are having a TAC share of 5% or more are included in the cost sharing. The involved MS include their share of the total research vessel cost in their AWP budget forecast. When the survey has been carried out the vessel MS will send an invoice to the MSs concerned based on the cost share model.
The general approach of this cost sharing model can also be applied to new surveys to be included in the DC-MAP.
The implementation of the cost sharing model requires approval by the NCs, prior to the establishment of the 2014 AWP. The vessel Member States involved in the surveys mentioned above will take the initiative to inform the NCs and the Commission on the proposed model. RCM NS&EA will forward this proposal to the 2013 RCM NA, as blue whiting officially falls within the remit of the RCM NA (RCM NEA, 2004).
6.4 Road-map towards a regional sampling programme – process of RCGs
The regional coordination meetings have so far primarily, had the task to coordinate data collection activities within a region. The future DC-MAP aims at stronger incentives for MS to cooperate within a region. It is further foreseen that requirements on a design based approach and sampling in accordance with best practice will be pillars in the new regulation. This approach will allow a more thoroughly evaluation of data quality on a national and regional scale. It will as well result in a more effective use of available sampling resources within a region. The regional database is a backbone in the regional approach, with the possibility to enable transparent data collection, estimation and submission of national and regional data, (given that funding is provided to meet new requirements. The LM 2012 did strongly support the movement towards a regional design based approach in the Oostende declaration 2012.
Page 66 of 176
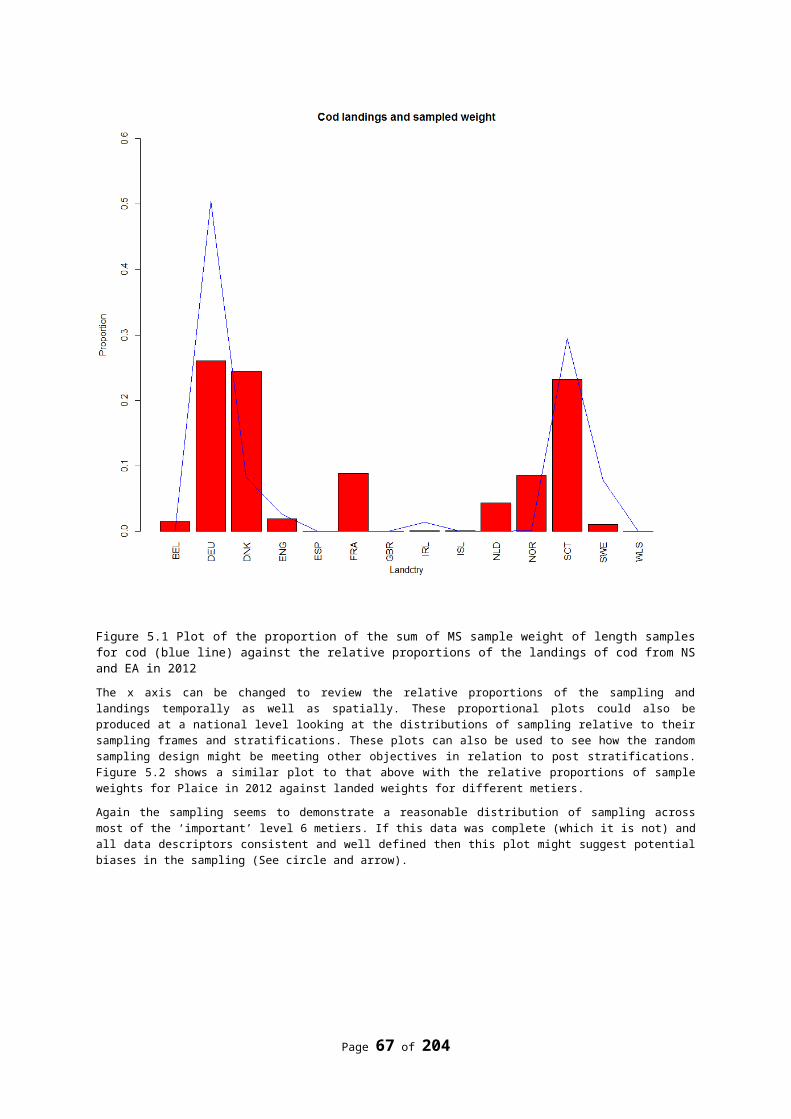
It is important to realize that regional programmes can be implemented in different ways and that people managing national data collections schemes most likely have different understandings on what a regional data collection program is. Regional data collection programs have been discussed from a more theoretical point during WKPICS and SGPIDS meeting, but so far are there few attempts to implement such approaches. It is further of importance to realize that not all MS have experience on a design based approach. It is not a simple task to move from a traditional national ad-hoc based sampling approach to a regional design based one and that is why a transition period was stated in the Oostende declaration. It is important to utilize the transition period in a way that as much knowledge as possible is gained to iron the way for an implementation phase.
There are several “processes” that need to be supported and kept at speed during the transition phase in order to get a successful implementation phase. These include:
- Population, maintenance and development of the regional database. – The RDB is the backbone in regional coordination and cooperation. Without a regional database will it be very difficult to implement regional programs.
- Development of a regional design based approach o Design of regional sampling programso Estimation processeso Practical sampling – e.g. impact of different sampling protocols on resultso Development of best practice
- Development of tools for quality checking and QA reports- End user interactions by setting up End User Consultation Meetings
Experiences are building up, primarily as a consequence of the work done in ICES WKPICS and SGPIDS but also as a consequence of the usage of the RDB in the RCMs. There will also be a theme session “What’s the catch?” during the ASC 2013. It is important to build on this in order to not lose the momentum.
RCM recommends that a ‘dry-run’ on the full-circle from end-user participation to defining data needs and designing a regional sampling scheme is carried out during the roll-over years 2014-2015. This will gain experience on the entire process as laid out by STECF EWG 13-02, including fine tuning the future role of RCMs and LM, as well as set up a preliminary regional sampling scheme.
Towards a regional sampling scheme
RCM NS & EA 2013 Recommendation 8
RCM recommends that a ‘dry-run’ on the process from end-user participation to defining data needs and designing a regional sampling scheme is carried out during the roll-over years 2014-2015. The process itself, participating meetings and end-user specification can be used as specified by STECF EWG 13-02.
Justification Before adapting the current data collection management to a full regional approach, experience needs to gained on the future process. This will allow fine-tuning of the process prior to the full implementation and will thus allow for a quick start once DC-MAP is fully implemented.
Follow-up actions needed Commission to initiate and steer the processResponsible persons for follow-up actions
Commission and RCMs
Time frame (Deadline) 2014-2015
6.4.1 Need for a road-map
In line with the Oostende declaration, the aim is to have a mid term review of the progress in implementing new sampling design by MS in a region in 2017 and thereafter fully implement a regional design based sampling scheme. To achieve this and to spend our time and money in the most efficient way, we need to investigate what needs to be done, use available meetings in an efficient way, secure funding for key projects, gain experience in the different MS and maybe most important, get a common
Page 67 of 176
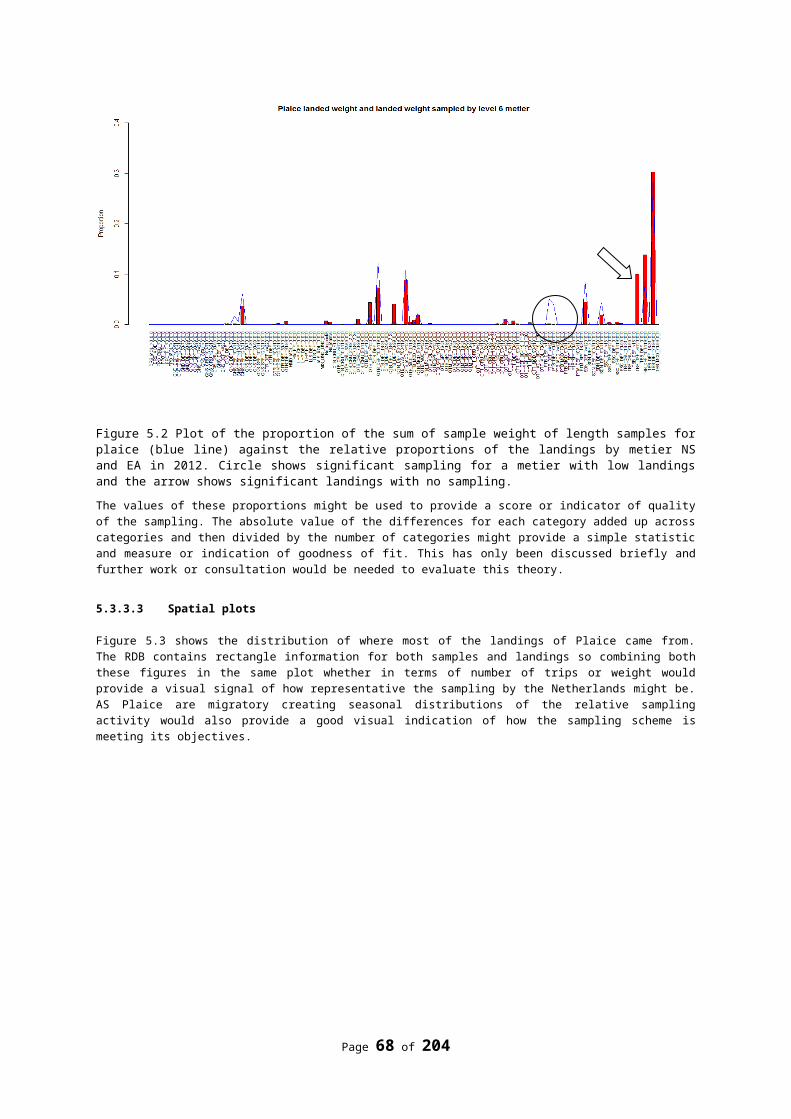
picture on what we want and need to achieve and which steps we have to take to do this. It is therefor essential that we produce a road map. During the RCM NS&EA2013 there was no time available to finalize such a road-map. Instead, it is suggested to have a dedicated sub-group meeting (across RCMs) to do this at the end of 2013, early 2014.
The RCM did however start to work on an outline for a road-map which is presented below (but should be considered as preliminary). The road-map might need to be adjusted as experience is building up and this could be done within the remits of future RCMs. Future STECF EWGs can also suggest actions and adaptations to the road-map.
Objectives – regional sampling programme- Set up and implement a regional sampling program, based on a statistically sound sampling
design ,- that enables transparent preparation of regional estimates of variables of interest - by cost effective utilization of the sampling resources available in the region.
What is needed to achieve this? (preliminary list)1) The RDB to be developed to accommodate the design based approach, including transparent
estimation procedures within or in conjunction with the RDB.2) Guidance from expert groups on how regional programmes can be implemented including how
estimates should be produced.3) Support from experts on sampling levels to meet regional precision targets. How many samples
and how many fish to be measured/aged within a sample.4) Investigate how different sampling protocols impact estimates (e.g. sea-sampling programmes)5) Time to learn how MS practically can implement regional design based sampling programmes.
Page 68 of 176
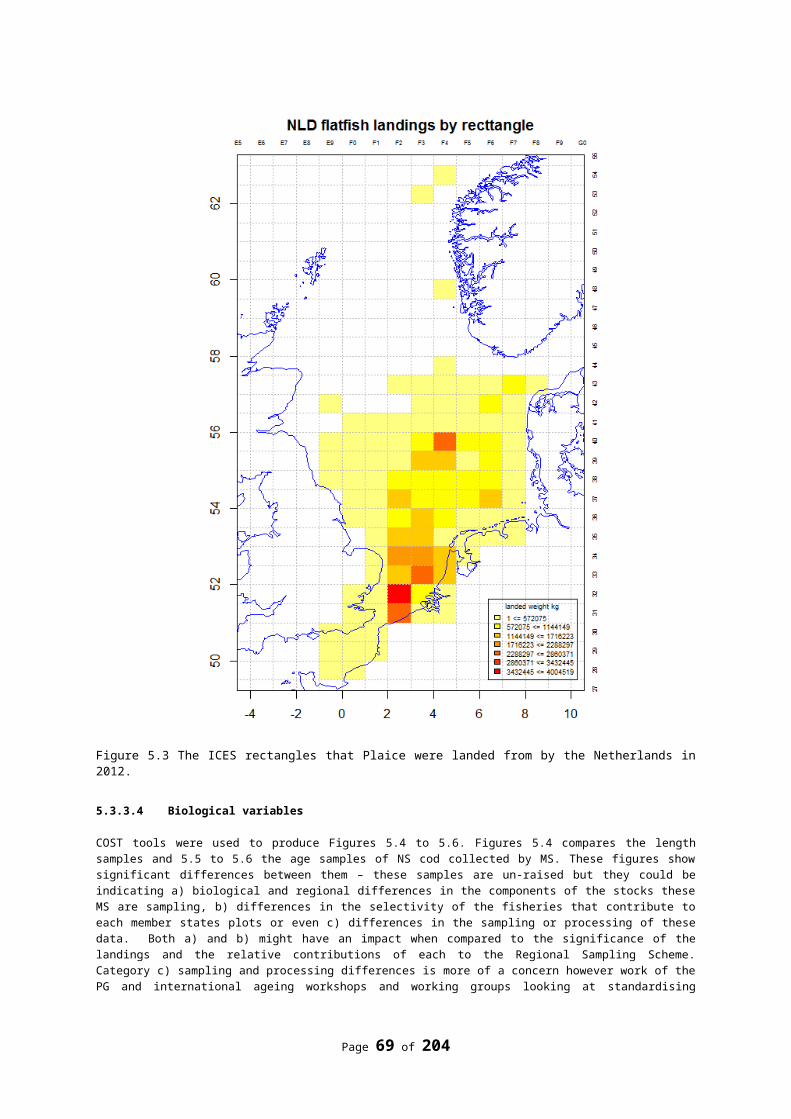
6.4.2 Preliminary road-map
Timing Suggested action RDB and data analysis
Design of regional sampling schemes
Implementation of regional data collection scheme
Analysis of regional data and review of implementation
Related RCG coordination tasks
Relevant associated non-RCG input
2013 Develop and agree on a road-map.
WKPICS3
2014 RDB maintenance; data uploads and extractions;Development of routine diagnostics for data clean-up.RDB development through SC-RDB to ensure validated international data and diagnostics.Start EMFF funded RDB project (if funded)
Develop proposals for regional sampling schemes.Start EMFF pilot project on regional design (if funded); start review of national schemes against best practice.Develop test data sets from RDB for testing designs
RCMProgress reviews on regional sampling design and testingPlenary meetings Sept. – transition to RCGs
ICES SSG-DC formation; input of ICES data expert groups.Liaison Meeting Oct.Commission end-user consultation and proposals for changes to data requirements in DCMAPSC-RDB
2015 Roll over Develop RDB –continuation of EMFF project (if funded) and input from RCM/RCG;
RDB maintenance and development; data uploads and extractions;Routine diagnostics and data clean-up.
EMFF pilot project on regional design (if funded): continued interaction with MS on sampling designs and data.
Testing of options for regional sampling design using test data from RDB .
Develop detailed preliminary guidelines for regional data collection implementation
Smaller pilot projects in MS.
RCG evaluation of new end-user data needs.
Progress reviews on regional sampling design and testing
Plenary meetings
ICES SSG-DC steering DCMAP related work in data EGs; outcomes of ICES data expert groups.Liaison Meeting Oct.Commission end-user consultation and proposals for changes to data requirements in DCMAPLM – first conclusions on work 2014 and “way to go forward”?
Page 69 of 176
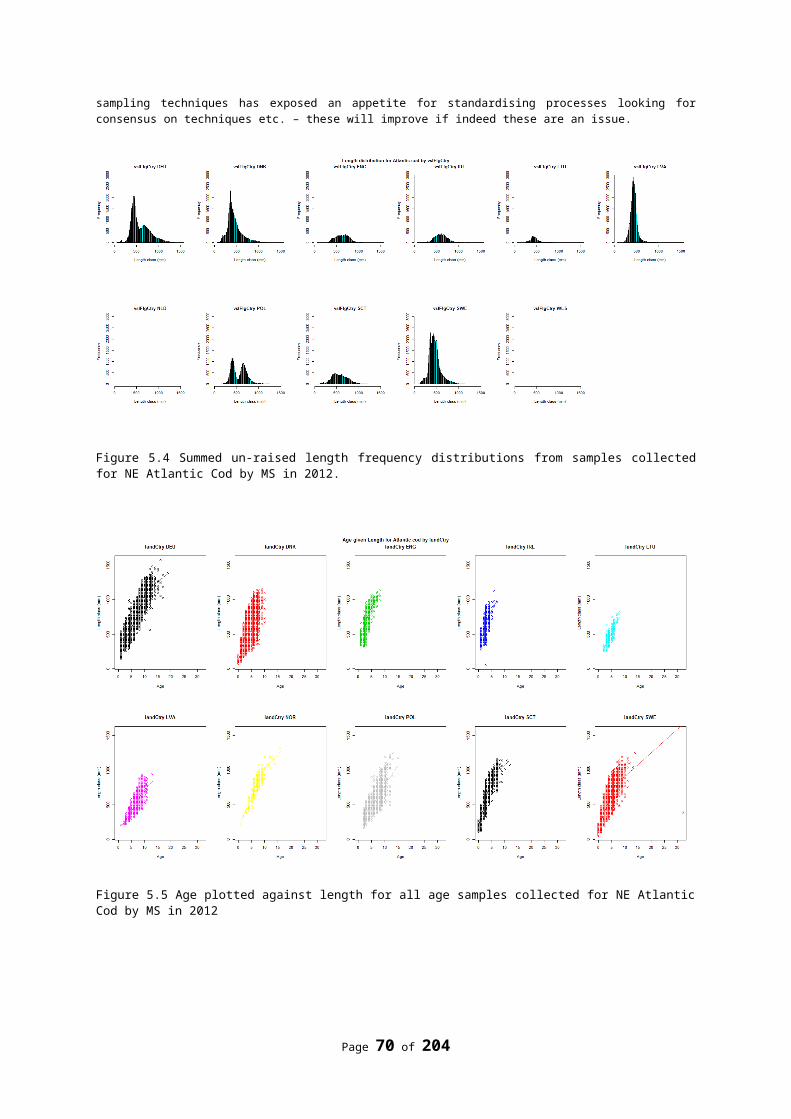
Timing Suggested action RDB and data analysis
Design of regional sampling schemes
Implementation of regional data collection scheme
Analysis of regional data and review of implementation
Related RCG coordination tasks
Relevant associated non-RCG input
2016 RDB maintenance; data uploads and extractions;Routine diagnostics and data clean-up.
EMFF pilot project on regional design (if funded): completed and recommendations produced.Report with proposals and evaluation of regional data collection schemes.Organize a workshop with a panel of design experts to discuss possible solutions.
Set up a preliminary regional data collection scheme
2017 (MID TERM REVIEW TIME!)
Develop detailed final guidelines for regional data collection implementation
Analysis of trial regional data collection schemes and feedback to proposals
RCG mid term review
2018 Full implementation by all MS in all regions
Design the regional sampling plan.Divide tasks between MS – intersessional work
2016 Finalize designfeed in to the legislative processDevelop RDB –
2017 Start to implement the regional design by all MS in all regionsGuidance to the MS to adjust
2018 Full implementation by all MS in all regions
Page 70 of 176
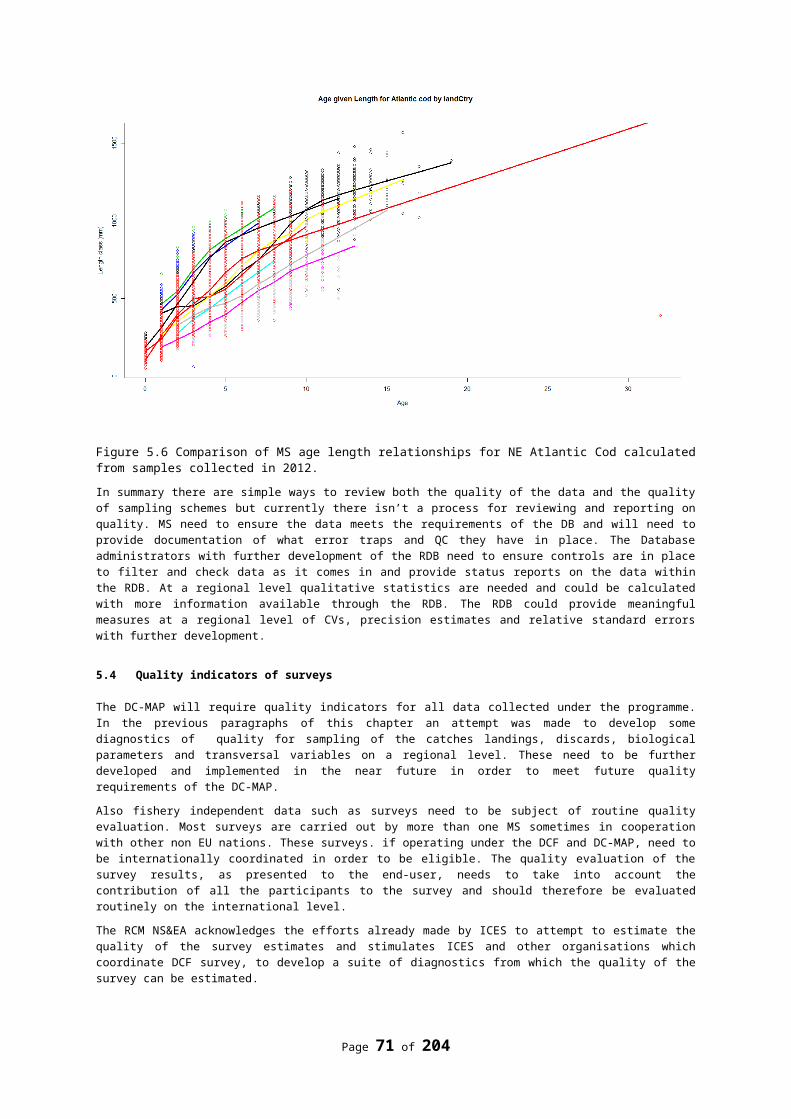
6.5 Guidance for MS to implement the National Programme for 2014 under the EMFF
Due to the delay in the implementation of the DC-MAP, the DCF will be extended for a period of at least 2 years (2104-2015). The NPs of 2013 have been rolled over to 2014 unchanged and are adopted as the AWP for 2014. Guidance to the Commission and STECF on how to interpret the years in this programme (which are outdated now) for the period 2014-2016 is given in section 9 (additional tor b). The evaluation of the Annual Reports by STECF in the interim period will follow the existing procedures.
During the meeting, the representative gave a presentation on the changes in the transition period between the DCF and the DC-MAP. An updated document of ‘frequently asked questions’ provides answers to most questions. The updated document (2013-09-04 MFAQ on Data Collection.pdf) is available on the RCM NS&EA 2013 SharePoint in the working documents folder.
For the short term, the following points are relevant
The financial support for the AWP in 2014 and 2015 will be under the EMFF. No budget proposal has to be made.
There will be no list of eligible meetings anymore and MS should decide themselves on their priorities
Page 71 of 176
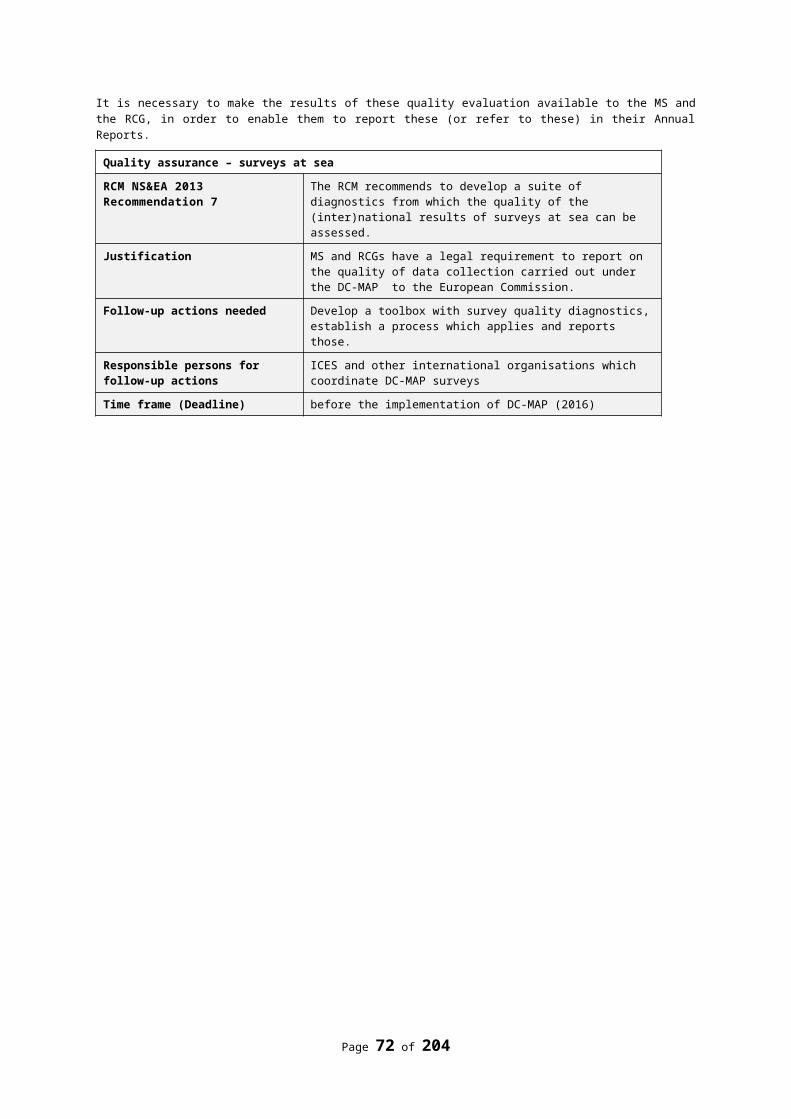
7. Studies and pilot projectsDuring the latest three years very few study proposals, proposed by the RCM’s, the PGCCDBS and the PGMED have been funded by the DCF. Although they have been endorsed by the Liaison meeting they could not be financed due to financial constraints. The RCM NS&EA reconsidered some of these studies again in its 2013 meeting and decided to resubmit them. The study proposals are classified into two groups:
i) those important for the cooperation that will benefit regional and superregional cooperation data collection (EMFF article 85,2e) and
ii) studies and pilot projects important for the implementation and development of the CFP (EMFF article 85,2a).
The RCM NS&EA is of the opinion that coordination and cooperation projects that are overarching all regions (RCM’s) and are important for the implementation phase of the DC-MAP, should be prioritized the highest. Furthermore, the RCM NS&EA would also like to stress that if these projects are not prioritized by the Commission, it may slow down the implementation of the DC-MAP which again will have a negative effect on the quality of the collection of fisheries dependent data.
The RCM NS&EA considered 3 study proposals which classify under EMFF article 85,2e. These are presented in section 7.1. The study proposals, 4 in total, which classify under EMFF article 85,2a, are presented in section 7.2.
7.1 Proposal for coordination and cooperation activities that could be funded under the EMFF article 85,2e
7.1.1 Title: “Exploration and Development of new facilities in RDB-FishFrame 5.0”
Background:
The demands from the users to a regional Database is under constant change; in the first hand, because the users discover new possibilities in the use of the data as they get more familiar with the use of the database and secondly because the data collection, fish stock management and modelling environment changes and new data types and processing facilities become important. The first one mostly requires design of new output reports to tabulate new combination of the existing variables, while the second one quite often requires adding of new variables and processing functionality. A central point is the design based approach in data collection, and eventually regional data collection programs, which is foreseen in the DC-MAP. Furthermore, RDB- FishFrame has now been introduced to additional regions. This has given rise to additional requests how data should be centrally processed due to new sampling stratifications practiced in the member states included compared to the existing. It is essential that a database reflects on new demands and not act as a straightjacket preventing new progressive initiatives. A constant development is therefore very important in order to keep the momentum.
The development will be outsourced to the extent that external expertise is necessary in order to follow the time schedule.
Indicative budget: € 450,000
Development
The main fields for development in 2013-14 are identified by the RDB-Steering Committee and presented in no specific order of priority:
1. Development of additional tools for analysis and data tabulating to support regional coordination. (20% of total budget)
Outputs: Technical report, programming developmentDevelopment of output reports which provide: Overview of data status by region; data coverage; Support the planning of future regional based sampling schemes; Overview of potential areas for task sharing between member states.
Page 72 of 176
2. Testing of trial stocks from different expert groups for national raising, by borrowing age-length keys from own and/or other countries and correct functionality according.
All data submitters for the selected stocks raise data in the RDB Output compared and corrections made where needed
3. Stream line the interfacing with InterCatch Develop functionalities which when data have been raised to a certain level automatically
will move data to InterCatch 4. Explore options and cost implications of implementing of external tools (i.e. COST) in the RDB-
FishFrame. (35% of total budget)Outputs: Technical report, Technical Workshop(s), programming developmentSuch analysis should include the following elements:
An inventory to collate and examine the tools present but also tools missing What level of documentation/quality controls would be required of a tool to be accepted
into the RDB? What exports should the RDB provide to other formats/tools? What changes need to be made to the COST format/coding to comply with the RDB? Is COST sufficiently documented (methods, quality controls etc.)? Which level of integrating should the RDB.-FishFrame provide to COST (just export to COST
or an interface that allows users to manipulate RDB data using COST tools/functions)? Proof of concept of programmatic interface to RDB-FishFrame
5. Requirements and automation of Data calls procedures. (20% of total Budget)Outputs: Technical report, programming development
What is formally required from the regional database to reply to data calls? What data calls can we respond to at present/future? (The present functionalities and
documentations in the regional database need to be compared with most common data calls)
Alignment with FLUX developments6. Development of more flexible structure to handle correct processing of design based sampling
schemes to address regional differences in approach. (25% of total budget)Outputs: Technical report, Technical meetings/workshops covering all regions
What changes need to be made in the Exchange Formats in order to comply with design based sampling schemes?
Which additional processing functionality need to be developed in order to comply with design based sampling schemes?
7. Development of procedures to ensure confidentiality on individual vessel level for CL, CE and on value.
RCM NS&EA comments
The RCM NS&EA 2013 classifies this study as priority 1. This study has been supported by the PGCCDBS, the RCM Baltic, RCM NS&EA and the RCM NA has been endorsed by the 9th Liaison Meeting.
7.1.2 Title: “Support design based regional data collection programmes”
Objective of proposed study
The Study will develop an operational framework for establishing and coordinating design-based sampling programmes at a regional scale for the most cost-effective delivery of fishery and biological data required by the revised DCF and any specific additional needs to support assessment and fishery management.
Duration of project
It is anticipated that the project would run for two years, and cover two periods of RCM and Liaison meetings to allow consultation and discussion of proposals.
Page 73 of 176
Indicative budget: € 450,000
The need for the proposed study
A design based sampling strategy is a prerequisite for transparency in the data collection-assessment-advice process since it allows for straightforward estimation processes, assessment of bias as well as variance associated with different estimates. In particular, it supports estimators that do not depend on complex models and assumptions about the underlying stochastic process of the catching operations of the fleet. It also enables the use of DCF data in the wider scientific/management community since data are collected in a transparent way following sound statistical procedures including documentation of sampling protocols and sampling designs.
Due to severe logistical constrains in sampling of fisheries, many national sampling programmes may in reality be more or less ad hoc based. Recent ICES workshops including WKPICS and WKMERGE have started to examine how sampling schemes can be adapted to deal with different types of logistical constrains without compromising the basic requirements of statistical design. Within these workshops it has become evident that countries need support to design and implement such statistically-sound sampling schemes.
Currently, the DCF Regional Coordination Meetings (RCMs) focus heavily on “task sharing” for metier and stock based sampling. It is foreseeable that in the new DCF, the role of RCMs may evolve more towards establishing and coordinating statistically-sound programmes of data collection to deliver the estimates for stocks and fleets required at the regional scale. This could include agreement of sampling frames, allocation of sampling effort amongst Member States, documentation of sampling schemes, and review of achievements and data quality. To adopt this role, RCMs would require guidance and a system of support because the sampling problems already encountered by individual countries will remain at the regional scale. If true progress should be made towards regional data collection programmes, it is crucial that sufficient resources and expertise are available for Member States and RCMs to carry out the necessary tasks.
Study specifications
The study will require setting up a core project team to work out principles for regional sampling designs, and to work closely with RCMs, ICES PGs, European Commission and Liaison meeting to review how the structure and operation of RCMs should be adapted to best serve the needs of the revised DCF. The project team will focus particularly on:
Understanding the fleet-based and stock-based estimates that are required to support assessments and advice at a regional scale.
Defining an operational framework for RCMs to coordinate annual or multi-annual regional sampling programmes to deliver the estimates.
Identifying logistical constraints to national sampling schemes within a region, and proposing solutions for how these could be handled in regional sampling plans and within the component national strata (ref: WKMERGE; WKPICS1–3).
Establishing procedures for optimising sampling schemes and allocation of sampling amongst Member States in relation to regional objectives and available resources.
Identifying the procedures for estimation and sample raising at the regional scale. Developing Quality Indicators for regional datasets. Identifying developments needed in the Regional Databases to support regional sampling
programmes. Propose future support systems to help RCMs implement and evaluate regional sampling
programmes.
RCM areas to be covered
The project will initially scope out the problem across all DCF regions in consultation with RCMs, European Commission and PGs, but depending on resources may then focus on one or two regions as case studies.
Project tasks
Subject to discussion with the European Commission, it is anticipated that a two-year Study would involve the following tasks:
Page 74 of 176
Initial workshops and WebEx meetings with key RCM, ICES Planning Group and European Commission representatives, and invited external experts, to agree the basic principles of implementing and optimising a regional programme of sampling to deliver the required estimates.
Identification of the structure of a regional sampling programme allowing a fully coordinated international approach to delivering the required data and estimates, including documenting the characteristics of the fisheries and stocks to be sampled in each country, development of sampling frames, stratification schemes, sample selection procedures, optimal allocation of sampling effort amongst countries, estimation procedures and production of quality indicators.
Presentation of proposals to RCMs, ICES PGs, European Commission and Liaison Meeting, for discussion and further development.
Development of final proposals and report.
RCM NS&EA comments
The RCM NS&EA 2013 classifies this study as priority 2. This study has been proposed by the PGCCDBS and supported by the RCM Baltic, RCM NS&EA and has been endorsed by the 9th Liaison Meeting.
7.1.3 Title: “WebGR 2 - Web services for support of Growth and Reproduction Studies”
Objective
The objective of this study is to substantially improve the first version of WebGR developed with-in an EU tender project in 2008. WebGR is a set of web services to support fisheries scientists in the organization and data analysis of calibration workshops for biological structures classification and provide means to analyse the results of such exercises.Aim
The project aims to improve the Open Source software previously developed to support studies of fish growth and reproduction. This will contribute to improve the quality of growth and reproduction studies, by guaranteeing a consistent application of age reading protocols and maturity scales, ultimately influencing fisheries management advice. However the use of this tool is not necessarily limited to age and maturity studies. In principle WebGR can be applied to all situations, where individual scientists need to discuss the interpretation of a protocol, for the identification of the status of biological material.
Indicative budget: € 100,000
Study specifications
Presently, the WebGR consortium provides the Internet service in http://webgr.azti.es. The service is provided freely but without any warranties and the tool has not been developed since 2010.
Nevertheless, since 2010 several workshops and exchanges have used WebGR with variable success. Unanimously, the members of these expert groups saw a great potential in using this soft-ware and its tools. However they experienced different problems while using it and at the same time had several requests on how to improve this tool and obtaining more complex outputs. This feedback highlighted the strong need for further improvement of WebGR and is the basis for this study proposal.
The desirable improvement of WebGR is 2-folded. On the one hand it is necessary to upgrade the user interface, improve picture uploading and enhance exploring tools, in terms of new measuring tools. Moreover, at the moment the most basic features are implemented and the easy export procedure allows users to use the data on a standard statistical package or spread sheet. The original idea is to develop an R package and implement a set of statistical methods. An extended statistical output will give a more complete evaluation of potential differences among readers/stagers, i.e. a step forward towards the standardization.
Concerning the hosting institute, it would be beneficial both for ICES and the users, if ICES could host the server. This would guarantee a wider dissemination of this useful tool and ensure a better site management.
Page 75 of 176
Furthermore, an offline access to the workshop is to be aimed for. This features needs to be implemented so that all individual users’ annotations will be synchronized with the server as soon as one goes online again.
The project will be conducted by the participating laboratories and will consist in 4 Units:WP 1: Training and disseminationWP 2: DevelopmentWP 3: Statistical methodsWP 4: Site management
Specific work packages
Work Package 1. Training and dissemination
The objective for WP1 is to disseminate WebGR, train users and channel feedback to others. It will divided into the following two subtasks: WP 1.1. Training by the means of a widely used web conferencing tool (i.e.Webex). This will include
at least three online meetings, one for coordinators and two open trainings. WP 1.2.Dissemination through the drafting of working documents or flyers to be distributed to
different fora. Furthermore, review and maintenance of the WebGR website is also essential. The use of this tool will continuously produce feedback that needs to be organized and distributed internally
Work Package 2. Development
This WP has two objectives WP 2.1. Implement new features in terms of developing new measuring procedures. WP 2.2. Resolve issues with the detected bugsWork Package 3. Statistical methods
This WP has the objective to extend and improve the present statistical analysis and it is divided into the following subtasks: WP 3.1 Review literature WP 3.2 Test methods with R and develop R package WP 3.3 Support implementation in WebGR WP 3.4 Promote reproducible researchWork Package 4. Site management
The final work package has the objective to update and maintain the site.
The increasing amount of pictures uploaded and stored on the server during each exercise intensifies the demands for the site maintenance. Moreover, WebGR has a wiki-page that requires as well be reviewing and keeping updated.
RCM NS&EA comments
This study has been proposed by the PGCCDBS. The RCM NS&EA 2013 classifies this study as priority 3.
7.2 Proposal for studies and pilot projects that could be funded under the EMFF article 85,2a
7.2.1 Title: Study on European anglerfish (Lophius piscatorius and Lophius budegassa) in all ICES areas and megrim (Lepidorhombus whiffiagonis) in VII and VIIIa,b&d
Objective
Improvement of the assessment and management of three important demersal stocks in western waters: Megrim (L. whiffiagonis) in VII and VIIIa,b,d and White and Black anglerfish (L. piscatorius and L. budegassa) in all ICES areas IIa to IXa, including Va,b for accomplishing sound scientific advice. Based on reviewing data collected under DCF and industry related variables and parameters to be included in the assessment.
Page 76 of 176
Base line
ICES deployed a Benchmark in March 2012 to solve data and methodological problems detected in megrim and angler assessment. The result of an intensive work previous and during the ICES Benchmark did not accomplish the objectives of obtaining analytical assessment for these stocks and thus provide sound scientific advice.Main drawbacks detected in Megrim VIIb, c, e-k and VIIIa, b, d data and assessment during ICES Benchmark1. Incorporate annual estimates of discards (France) to explain some possible recruitment, also to
obtain consistent data along the series. 2. A complete revision and in depth analysis for checking changes detected in the data homogeneity of
three time period identified: 1984-1989; 1990-1998 and 1999-2010. 3. The distribution of megrim stock does not include ICES Division VIIa and VIId. Further work is needed
to assess the stock identity of megrims in this area.Main drawbacks detected in Anglerfish data and assessment during ICES Benchmark1. No clear evidence of the current stock or population definition. There is a lack of information
concerning their biology, movements and possible migratory patterns. This information is fundamental to reduce uncertainties regarding stock boundary,
2. No accepted ages are used in the assessment since more growth studies are necessary for validation of growth estimates.
3. The incorporation of good discard estimates in order to have information about individuals less than 0.5 kg in weight.
4. Better maturity estimates are needed in order to have a good S/R relationship, it is clear that with the sampling level from DCF and using the data from surveys the information for larger females is not available.
Objectives and action required based on data drawbacks.
Objective 1. Improvement of catch data (Megrim and Anglerfish)
It is necessary to develop catch data series (landings, discards) for evaluating historical fishery impacts. There are major uncertainties in accuracy of reported landings, and estimated discards in many areas. This aspect of the project will extract and review existing data, and consult with stakeholders to agree data series or alternative possible catch histories for use in assessments, with suitable quality indicators. Some specific tasks will include:1. Historical discards data (2000-2011): a. Data recovery; b. Review and analyse data.2. Quality of historical landings data including splitting catches for combined-species categories.3. Onwards: a. Workshops with Advisory Councils to review data quality issues and explain the
importance of obtaining discard data.Objective 2. Development of commercial tuning fleets (Megrim and Anglerfish)
For both actions: data availability and results of the analysis will be reviewed in consultation with the industry. This is linked with objective 1 in terms of historical data quality. A specific example is revision of the French trawling data series in Subarea VII and of the Basque “Baka” Otter trawl fleet to check for suitability in being included as new commercial abundance indices.Objective 3. Improved biological parameters of anglerfish
There are large uncertainties in important biological parameters particularly ageing, growth, and maturity, which have considerable impact on estimates of stock productivity and biological reference points, and ability to fit models to data. Large discrepancies in the interpretation of age from otoliths and illicia remain a concern, and validation studies are needed. Natural mortality rates are poorly understood. Impacts of sexual dimorphism on assessments also need consideration. 1. Reproductive parameters: a. Scientific work: will focus on revision of the maturity ogives.
b. Industry involvement from all countries collecting data. Support in the collection of biological data. Development of a simple “on board sampling method” which is required due to landing of fish gutted.
2. Growth parameters (Anglerfish): scientific work will focus on methods to validate ages derived from otoliths and illicia, developing agreement on approaches for ageing fish from each stock, and agreeing growth parameters and age composition data for use in assessments. Validation methods may include: a. Indirect growth validation e.g. cohort tracking; b. Direct growth validation studies, for example from tagging–recapture studies. Some detailed information on previous studies on ageing anglerfish and validation methods is given below.
Page 77 of 176
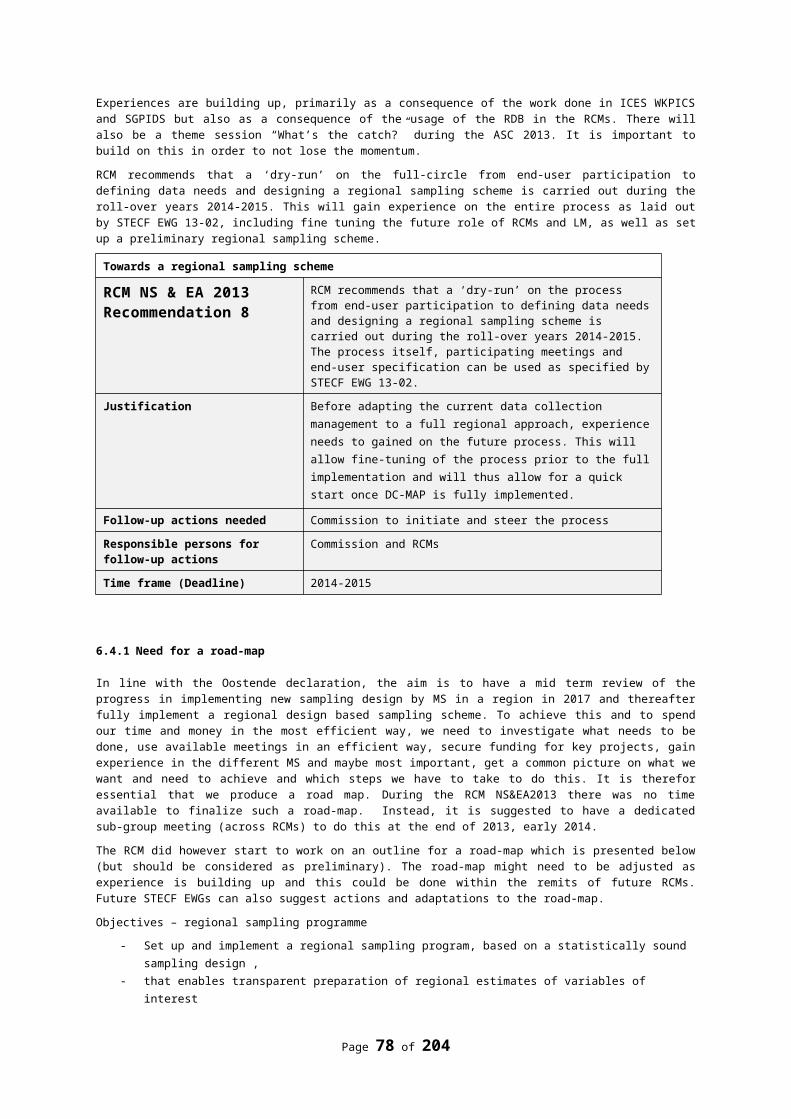
3. Natural mortality. A better understanding of potential rates of natural mortality will be obtained from better knowledge of life history parameters. Tag-recapture data may also provide some insights.
The age estimation of anglerfish in the ICES area for stock assessment has been traditionally based on two different calcified structures (CS), the illicium (used by the majority of the European countries) and the sagitta otolith (used only by two countries). Growth studies alternative to the age estimates on CS of white anglerfish, such as tagging-recapture (Laurenson et al., 2005; Landa et al., 2008a), daily growth (Wright et al., 2002) and length frequency distributions of catches (Dupouy et al., 1986; Thangstad et al., 2002; Jónsson, 2007), showed that the growth pattern estimated using the traditional standardized age estimation criterion based on illicia (Duarte et al., 2002) was underestimated and that criterion was not accurate, although it was standardized and used in several age estimation anglerfish workshops (Anon 1991, 1997, 1999; Landa et al., 2002; Duarte et al, 2005). The age estimation using illicia of a decadal time-series was performed for the southern stock assessment of white anglerfish using the traditional standardized age estimation criterion (Duarte et al., 2002). A catch-at-age by year matrix was built, but inconsistencies in cohort tracking were found (Azevedo et al., 2008).
Modifications in the methodology of illicia preparation and in the traditional standardized age estimation criterion have allowed obtaining a new age estimation criterion on illicia (Landa, pers. com.). Using it, the catches-at-age have been able to be more successfully tracked. Therefore this new criterion was judged to be more accurate and it was used for the age estimation in the “Anglerfish (Lophius piscatorius) illicia and otoliths exchange 2011” (a working document presented to the 2012 PGCCDBS Meeting). The results of this exchange have showed similar results to those from the 2004 workshop (Duarte et al., 2005):
i. Illicia and otoliths age readings comparison. Strong discrepancies be-tween illicia and otoliths readings were found. It is not possible to use the age estimates of both CS together, illicia and otoliths, for stock assessment purposes.
ii. Illicia. Although the relative bias values among the assessment readers can be considered good, the agreement values and precision suggest that they are not still sufficiently acceptable for building a valid ALK. The search for a reliable criterion for age estimation of anglerfish based on CS is more advanced in illicia than for otoliths. There is an illicia age estimation criterion that allows cohort tracking (indirect age validation) but only in the Porcupine Bank of the Atlantic.
iii. Otoliths. The age estimation of anglerfish, based on otoliths, is difficult mainly due to the occurrence of confusing false annuli and to the increase of opacity with age. The location of the first annulus is also a problem, even among expert readers, in the last and present exchanges. There have also been advances in daily growth studies (Wright et al., 2002; Woodroffe et al., 2003) that can help locate the first annulus more precisely. Analysis of age composition data from the Scottish industry-science partnership trawl survey in Area VI and IVc show tracking of cohorts in data derived from otolith readings (ICES WKROUND meeting 2013).
Further research should enhance our knowledge of the true growth of anglerfish by developing and using methodologies that allow validation, before the attempt to standardize reading criteria. It is unproductive to go further in estimating anglerfish growth patterns and age without progress being made in age validation (Duarte et al., 2005). Improving the precision in the absence of accuracy cannot, under any account, guarantee data quality (de Pontual et al., 2006).
The proposed collaborative study among several European countries could be based on the following tasks:
i. Indirect growth validation based on the ability to clearly track cohorts in time series of catch-at-age data or progression of length modes in survey data.
ii. Direct growth validation studies. Tagging is a direct method of validating the growth of a fish during its time at liberty, including for large specimens, where validated in-formation is very scarce. Two tagging programs have been undertaken for white anglerfish, one on the Atlantic northern shelf stock (Laurenson et al., 2005) and another on the two stocks of the Atlantic southern shelf (Landa et al., 2008b). Recovery rates the two studies were 3.8–4.5%. Given the difficulty of tagging a large number of specimens of this species, it was not possible to obtain information from specimens which had spent much time at liberty. Most of the available information from those tagging-recapture programs corresponded to information from small and medium specimens, but not from large specimens. Despite this, invaluable information was obtained to advance on the validation of the growth pattern of white anglerfish, and to obtain more information on the movements and interaction be-tween stocks (Laurenson et al., 2005; Landa et al., 2008b).
Page 78 of 176
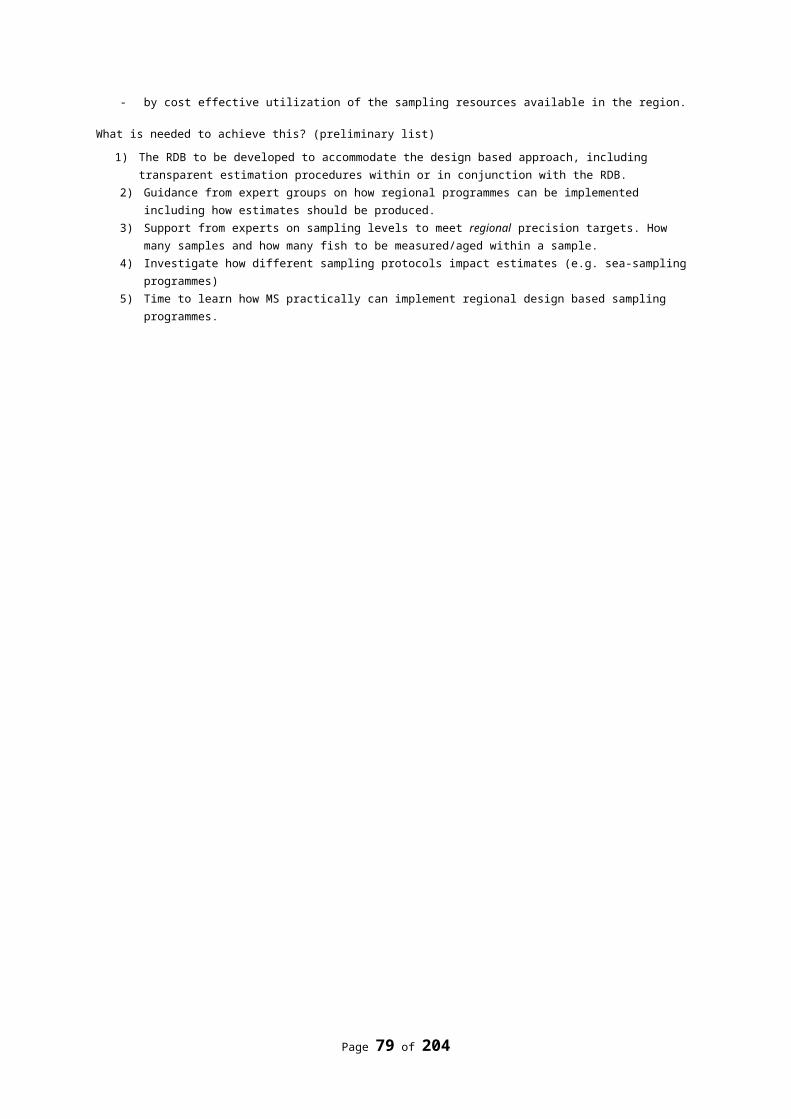
Objective 4. Compilation of high-resolution catch and effort data
Scientist and Advisory Councils will require from national administrations high resolution spatial data (VMSs/AIS). The importance of this objective is based on the actual situation of all data being transmitted electronically and the rapid disappearance of the hand-written logbooks. However, some administrations appear to be reluctant to provide of these data to scientist for assessment and management purposes.Objective 5. Exchange of knowledge with scientist assessing other Megrim and Anglerfish stocks
This objective will involve collaboration with scientists involved in biological studies and assessment of other megrim and anglerfish stocks to identify common problems, data deficiencies, methodological possibilities and proposal of solutions.Objective 6. Exploring alternative methodologies not fully dependent on resolving the biological issues (ageing and reproduction). Choosing the most suitable assessment models.
Based on the results of work addressing Objectives 1 – 5, the project will evaluate how the stocks may be assessed using a range of approaches suitable for stocks characterised by types and quality of data (as defined by ICES). The relative performance of the resulting assessment for different stocks and methodologies, and the likely impact on the form and quality of advice, will be evaluated. The impact on future data requirements in the DC-MAP will be evaluated. Justification of why a dedicated research project is needed
No progress can be expected if there is no international commitment from countries exploiting these stocks to carry out the necessary work on data and methods to assess these stocks. However it appears unlikely that time between possible future Benchmarks and Working Groups would be enough for: i) solving data availability, ii) reviewing their quality, iii) new model trials and even iv) exchange of experiences between researches working in same species but different stocks. That is why it would be recommended that resources could be made available for a real improvement in the assessment of these stocks. The present study is proposed for in a depth treatment of data quality, improvement in data collection and interpretation, and model selection.
Proposal of research team: AZTI-tecnalia (Basque Country Spain); IEO (Spain); IPMA (Portugal), IFREMER (France); Marine Institute (Ireland); CEFAS (United Kingdom); Marine Scotland; Advisory Councils.
This study should include the anglerfish stocks in all ICES areas, and megrim in VII and VIIIa,b,d, and therefore other institutes might also be involved.
Indicative budget: €500 000, 3 years duration.
Note: this study was already endorsed by the 9th Liaison Meeting.
RCM NS&EA comments
This study was already endorsed by the 9th Liaison Meeting.
7.2.2 Proposed title: Defining sampling scheme and collecting diet data for multispecies evaluation and management in the English Channel and the Celtic seas
Brief description of the study
In 2011, the Advisory Committee (ACOM) of ICES produced a roadmap for Provision of Integrated Advice by ICES on the request of the EU. This roadmap foresaw, among others, that multi-species (i.e. including biological interactions) advices and management plans will be developed for all eco-regions by 2017 at the latest. Multi-species assessments are already available for the North Sea and the Baltic but are still to be developed for the other eco-regions. Existing methodological tools such as the Stochastic Multi Species (SMS) model developed by DTU-Aqua (Lewy and Vinther, 2004) and used for the Baltic and the North Sea could be transferred to other eco-regions provided two main steps are taken beforehand: first, defining the structure of the multi-species model in terms of species composition based on a review of
Page 79 of 176
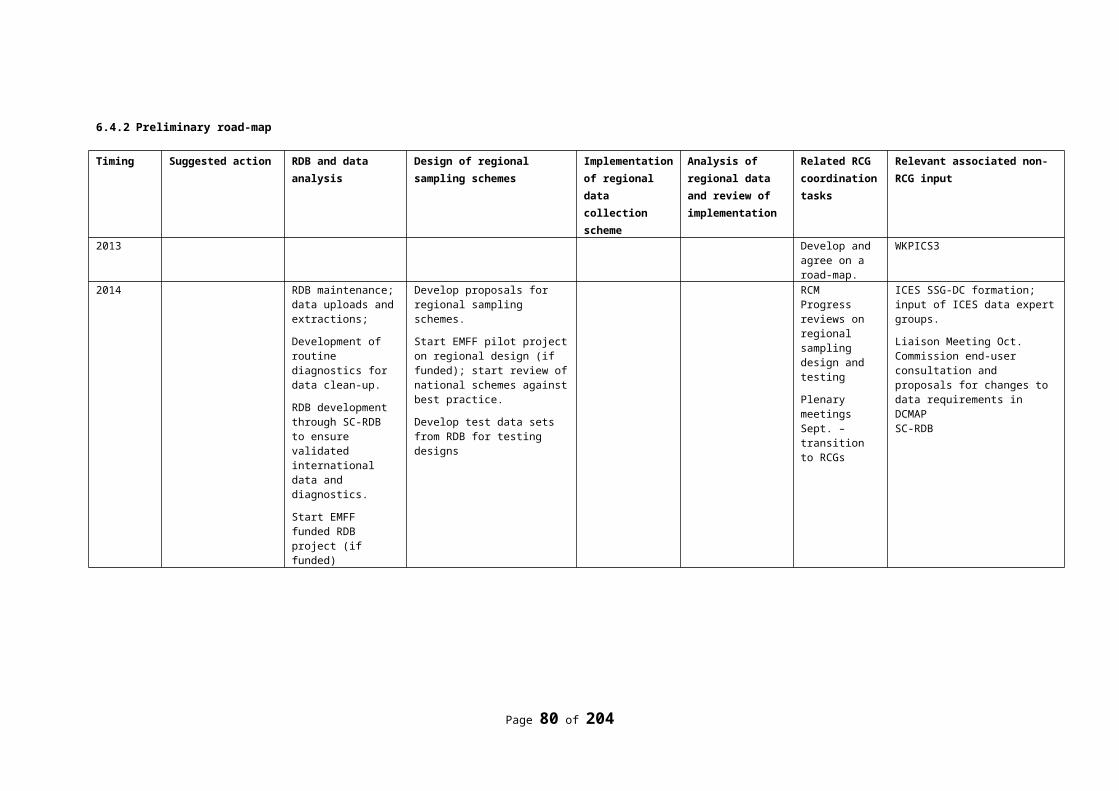
existing knowledge on the food web in the focal eco-region and, second, collecting diet data on the species identified in the first step by stomach content analysis.
The objective of this project is to take these two steps forward for the eastern and western English Channel and the Celtic sea eco-region in order to move towards multispecies assessment in these areas. The three main outputs of this study will be (i) recommendations regarding the species composition of the multispecies model to be implemented for the various concerned areas, (ii) sampling protocols for the collection of diet data for the relevant species and (iii) the resulting database of stomach content data.
Background
Since its reform of the Common Fisheries Policy (CFP) in 2002, the European Commission endorsed an ecosystem approach to fisheries in agreement with international commitments at The World Summit on Sustainable Development in Johannesburg (WSSD 2002) and the recommendations of the FAO Code of conduct for responsible fisheries. Since then, European maritime policies, including the CFP and the Marine Framework Strategy Directive (MFSD), converged towards common objectives, among which (i) developing an ecosystem approach towards maritime activities management, (ii) reaching good ecological status of European waters, (iii) reaching maximum sustainable yield for most fisheries, and (iv) protecting marine biodiversity, notably through a network of marine protected areas. Within this context, there is a growing need for integrated ecosystem assessment and advices. Such integrated approach is currently pushed forward by the ICES scientific community through dedicated groups or workshops such as the Workshop on Ecosystem Overviews held in January 2013 (ICES 2013). Among others, integrated ecosystem assessment requires the development of the multiannual multispecies management plans based on multi-stock assessment models including biological interactions (competition and predation) as well as technological interactions.
Although methodological tools are available (e.g. SMS model), the move towards generalized multispecies assessment is impeded by the fact that for most eco-regions, including the English Channel and the Celtic seas, there is currently no guidance as to which species should be included in a multispecies assessment nor is there the necessary diet data available to implement the multispecies models. A way to move forward to develop multispecies management plans is therefore, for each area, to provide clear guidance, coordinated by the RCM, on the species to be considered within multispecies assessment models, on the sampling protocols to be implemented for diet data collection and to start building a database of stomach content data.
Terms of reference
The main outputs of this study will aim at enabling the development of multispecies assessment and management plans in the English Channel and the Celtic seas eco-region. These will include guidance regarding the structure of the multispecies model to be implemented as well as sampling protocols for the relevant species together with stomach content data.
More precisely, for each area, the main tasks will consist in compiling existing knowledge on the structure of the ecosystem and its food web compiling existing knowledge on target species of fisheries in the different areas combining previous information, identifying the structure of the multispecies model in
terms of species composition compiling historical stomach content data, if any, for the identified species defining sampling protocol in space and time for collecting (complementary) diet data sampling identified species according to the previous protocols and carry on stomach
content analysis
Timetable and Final Report
The duration of the study shall not exceed 36 months from the signature of the contract. An interim report of the study should be made available after 18 months of the signature of the contract and a final report should be made available within one month of the termination of the project.
BudgetThe indicative budget for this study is € 1.000.000 covering all expenses, including personnel, sampling, laboratory consumables and overheads.
Page 80 of 176
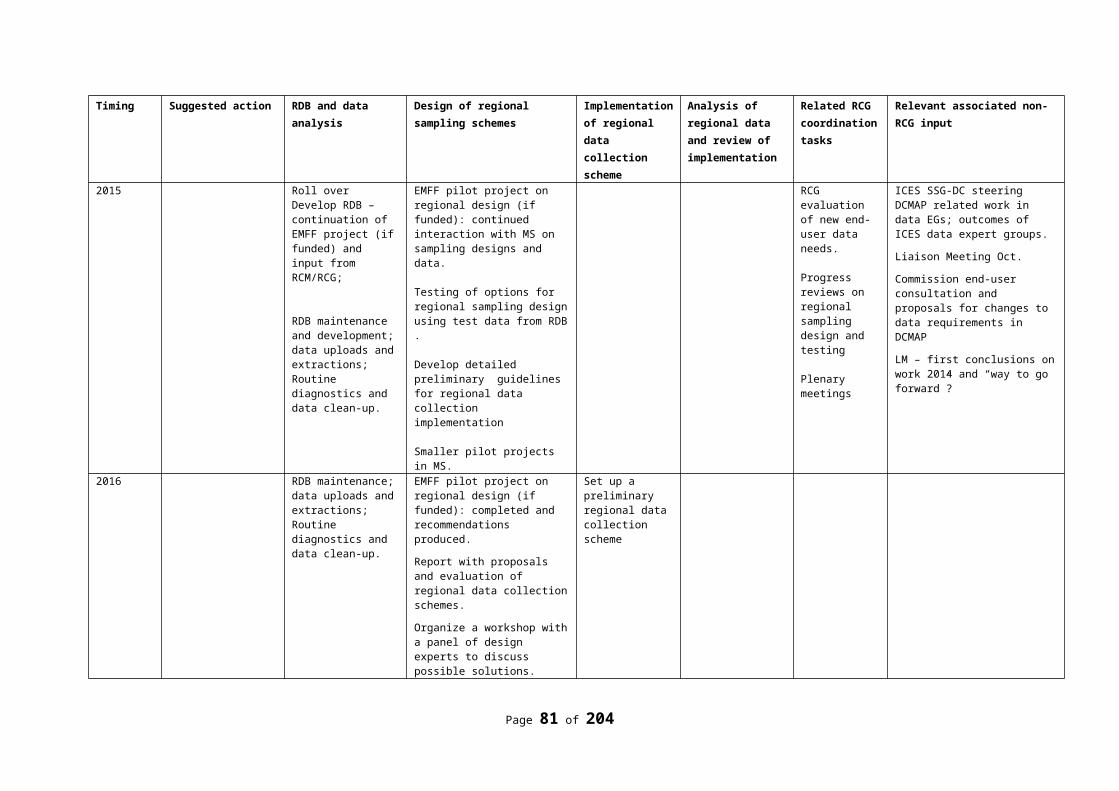
References
Lewy and Vinther, 2004. ICES C.M. 2004, FF:20, pp 1-33.
RCM NS&EA comments
Collection of stomach data for multispecies consideration is presently considered to be included in the DC-MAP. If stomach sampling is not an integrated part of the DC-MAP the support of this proposal will be reconsidered by the RCM NS&EA.
7.2.3 Proposed title: Tagging program for validation of Baltic Sea cod age estimation and migration rates
Brief description of the study
The assessment of the Baltic Cod stocks is becoming increasingly difficult. The well-known inconsistencies in age determination of the Eastern stock persist despite a wide range of efforts. Two main factors contribute to further complicate the management of the two stocks, i.e. the increasing age determination problems in the Western stock as well as the considerable, however not yet quantified migration rates between the two stocks. These inconsistencies result in poor quality of the catch-at-age composition, the abundance indices obtained from surveys at sea and possibly local depletion of the Western stock.
The objective of this study is to validate age structure and migration rates with a large-scale tagging program including all Baltic cod stock components. This is agreed by the age reading experts to be the best option to improve the quality of the assessment and the scientific advice for the two cod stocks.Background
The age of Baltic cod is at present determined by the traditional method of annual ring interpretation. It is well known that this method is not an optimal method for the Eastern Baltic cod stock since no clear annual rings are deposited. Severe inconsistencies in age readings between readers and institutes have existed since the beginning of age determination. A wide range of less subjective methods have been evaluated. Even though some attempts do look promising, it is impossible to implement these without proper validation with an appropriate “known-age” sample.
For unknown reasons, this problem now also seems to extend well into the Western Baltic cod stock. This may be the result of changes in environmental conditions, but it may also be related to the migrations across management area boundaries observed by genetic analyses and tagging studies. The extent of these migrations is unknown, but preliminary observations indicate that they may be extensive.
External marking of fish is a cost efficient method that is used worldwide to evaluate migration patterns, growth and mortality rates and validate otolith structures in a wide range of species, including cod. Coupling this external marking with chemical marking of the otolith in a release/recapture program provides the most reliable method to validate fish age and at the same time quantify the extent of migrations.
Terms of reference
The study will be based on the preliminary results that have been achieved within the EU Call for Tender DECODE: ImproveD mEthodology for Baltic COD age Estimation (FISH/2006/15; Studies and Pilot Projects for carrying out the common fisheries policy), the EU-funded R&D project CODYSSEY: Cod spatial dynamics and vertical movements in European waters and implications for fishery management (QLRT-2001-00813) and the ICES Study Group on Ageing Issues in Baltic Cod (ICES SGABC) and the ICES Working Group on Baltic Fisheries Assessment (ICES WGBFAS) with spin off into the ICES Baltic International Fish Survey Working Group (ICES WGBIFS) and the ICES Study Group on Multispecies Assessment in the Baltic (ICES SGMAB).
Page 81 of 176
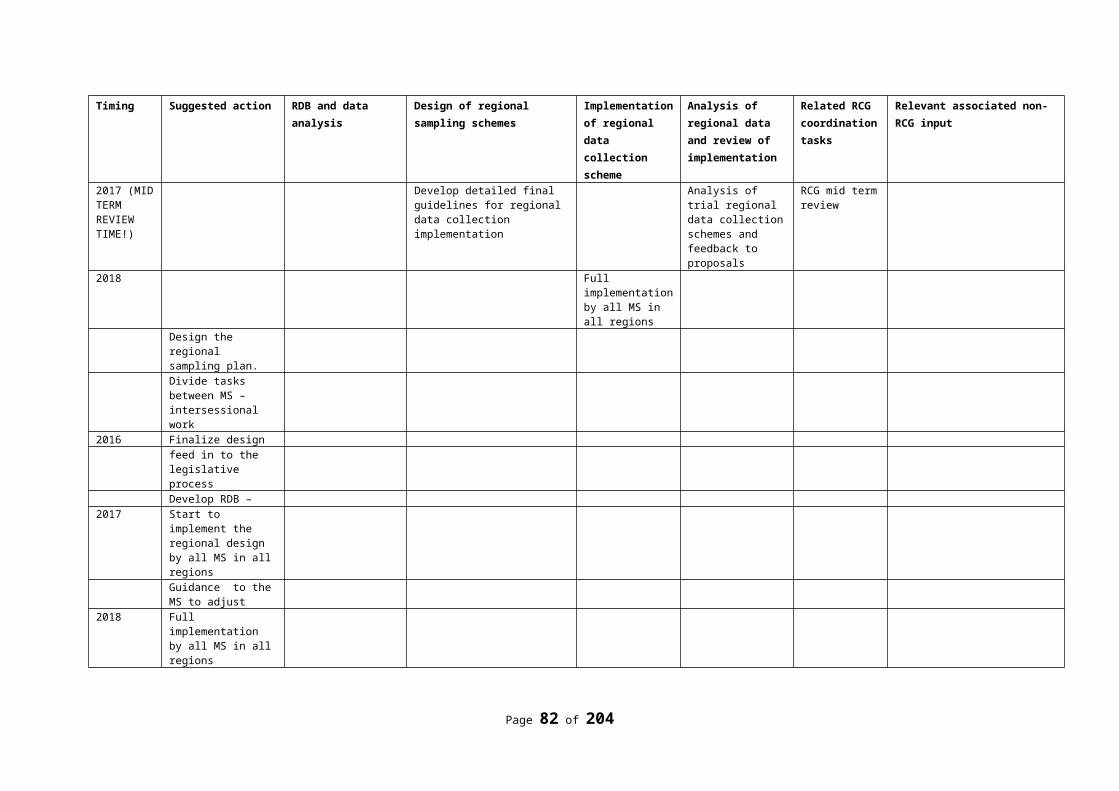
The main product would be to carry out a tagging program with external and internal marking of the fish, comprising all stock components within the Baltic Sea. The main tasks to be undertaken by the contractor are the following:
1. Conceive optimal design of the tagging program to cover all stock components 2. Carry out the tagging programme3. Analysis of results (age validation and migration pattern delineation)
Timetable and Final Report
The duration of the study shall not exceed eighteen months from the signature of the contract. An interim report of the study should be made available after nine months of the signature of the contract and a final report should be made available within one month of the termination of the project.Budget
The indicative budget for this study is € 500.000 covering all expenses, including personnel, transport, charter of vessel, consumables and overheads.Estimated allocation of resources in percentage of total: Charter of vessel 22Consumables 5Reward 11Travel 15Personel 48
RCM NS&EA comments
This study was already endorsed by the 8th Liaison Meeting.
7.2.4 Proposed title: Age Determination and Maturity Staging of species not previously subjected to biological sampling for analytical assessments
Duration: 18 months
Objective: The new DCF generates the need for biological information on species not previously subjected to biological sampling, in order to establish parameters for application in analytical assessments. The development of a methodological protocol on how to handle a new species, laying out a general procedure to achieve sound parameters for analytical assessment is highly warranted to enable the community to be proactive when alerted of a new stock appearing in the fishery.
When handling a new stock, a ‘toolbox’ needs to be consulted, encompassing base-lines on ageing procedures, growth parameters, sex-ratio, age at maturity, spawning time, and potential stock identification structures.
Based on existing validation techniques and further development of applied method-ology, ageing and maturity staging techniques must be developed and these should be stated in agreed manuals through a network of excellence. The manuals will then form the general protocol (the ‘toolbox’) that subsequently will be used in selected case-study stocks to test the applicability of the protocol and achieve sound parameters for analytical assessment for the particular stocks.
PGCCDBS 2011 used the following criteria for the selection of species for this project-proposal: No previous internationally coordinated work has been done with respect to age determination and
maturity staging for these species, but the required biological material and some experience (and view on potential problems) is already available in at least one national institute (all species).
The species are included in the MoU between ICES and the EC (all species except tub gurnard and John Dory) OR were included in the NESPMAN-project but not subject to age determination and maturity staging studies (tub gurnard and John Dory).
No ICES-advice was given for these species before 2011.
Page 82 of 176
No elasmobranch and deep-water species were included in the proposal since these are subject to specific research by dedicated expert groups making separate requests and recommendations. Species/area-combinations were selected on the basis of species/area-combinations for which advice is requested by the EC for the first time under the MoU 2011 (all species except tub gurnard and John Dory), extended with areas not in the MoU where the selected species occur, and where current or potential future fisheries for these species exist. A good spatial coverage of the DCF-area was developed this way. Following these criteria, PGCCDBS 2011 identified the following species/area-combinations as the most appropriate for this project-proposal.
Pollack (Pollachius pollachius) (MoU 2011 in all three areas) Greater North Sea
- Celtic Seas - Bay of Biscay and Iberian Coast
Grey gurnard (Eutrigla gurnardus) (MoU 2011 in first four areas / NESP-MAN) - Greater North Sea - Celtic Seas - Bay of Biscay and Iberian Coast - Azores - Mediterranean
Red gurnard (Aspitrigla cuculus) (MoU in first four areas / NESPMAN) - Greater North Sea - Celtic Seas - Bay of Biscay and Iberian Coast - Azores - Madeira and Canary Islands - Mediterranean
Tub gurnard (Chelidonichthys lucernus) (NESPMAN) - Greater North Sea
Boarfish (Capros aper) (MoU 2011 in first two areas) - Celtic Seas - Bay of Biscay and Iberian Coast - Azores - Madeira and Canary Islands - Mediterranean
John Dory (Zeus faber) (NESPMAN) - Greater North Sea - Celtic Seas - Bay of Biscay and Iberian Coast - Madeira and Canary Islands - Mediterranean
Lemon sole (Microstomus kitt) (MoU 2011 in first area / NESPMAN) - Greater North Sea- Celtic Seas
Witch flounder (Glyptocephalus cynoglossus) (MoU 2011 / NESPMAN) - Greater North Sea
Ballan wrasse (Labrus bergylta) - Greater North Sea - Celtic Seas - Bay of Biscay and Iberian Coast
WORK PACKAGES: Work Package 1. Stock Identity and Age Determination Material
The objective for WP1 is to compile an inventory of available CS for the selected species through various channels. The WP will collate otoliths and other calcified structures from material already in store at national laboratories; port sampling; fish auction sampling (buying fish) and concurrent sampling on already decided scientific cruises. Then all available material will be the basis for WP 3 for the selected species.
As much as possible otoliths will be taken from the same specimens as gonads (WP2.1)
Work Package 2. Maturity Staging Material
WP 2.1. To collect a sufficient amount of gonads (ovaries and testes) for the selected species in each proposed area. This collection should consider temporal variation, i.e. sexual cycle of each species, so the collection of material will be distributed along the year to determine the optimal sampling period,
Page 83 of 176
normally the spawning period. In the case of males, the majority of the collected data will be based on macroscopic determination of maturity, although a limited number of testes will be collected for histological analysis for the maturity ogive validation. Ovaries of females will be regularly collected and stored in formaldehyde. Macroscopic determination will always be recorded.
WP 2.2. Histological analyses of the selected males and all females will be conducted in this WP. Only histology produces accurate maturity staging, and this will be the basis for WP4. Considering the use of this methodology, it is important that institutes with relevant skills on histology and microscopic determination of maturity are being involved here.
Work Package 3. Revision and validation of methodology for Stock Identity and Age Determination
WP 3.1. Compile inventory of age determination practices used in different institutes, and compare results obtained from different methodologies.
WP 3.2. Review and summarise stock identity literature using CS and genetic information for the selected species.
WP 3.3. Validate age determination and stock identity methodologies applying avail-able methods such as known-age CS if available, otolith microstructure analysis of marginal increments, otolith shape and modelling exercises (length distributions, otolith weight distributions, etc.)
Work Package 4. Revision and validation of methodology for Maturity Staging
WP 4.1. Review of maturity staging protocols and methods developed in latest years in the context of ICES Workshops and the COST Action Fish Reproduction and Fisheries.
WP 4.2. Microscopic determination of maturity, ovarian developmental stage and definition of key periods of sexual cycle, particularly spawning.
WP 4.3. Definition of optimal sampling strategy for maturity on the selected species based on the results on WP 4.1 and WP 4.2; Work Package 5. Collation of the ‘Toolbox’
The final work package will synthesize the results from WP 3 and WP 4 in terms of what biological information that is deemed necessary to subject a species to an analytical assessment and the recommended methodology to achieve such knowledge when dealing with a ‘virgin’ species. The ‘Toolbox’ will be in the shape of a roadmap guiding any new species through the necessary analyses in order to uncover the bio-logical parameters of the species in question. EXPECTED RESULTS
The expected outcome of the Study is a ‘Toolbox’ encompassing a roadmap based on existing validation techniques and further development of applied methodology for ageing and maturity staging techniques. These will be stated in agreed manuals through a network of excellence. The manuals will then form the general protocol (the ‘toolbox’) that subsequently can be used in order to achieve sound parameters for analytical assessment on any stock not previously subjected to an analytical assessment. The ‘Toolbox’ will be available to the public through the upload of the documents in selected document repository.
The results of the project should allow to managers to implement basic regulations based on sound biological information of currently unregulated species. This will reduce the risk of over-exploitation in species where their status is ignored.
Also it is expected to produce an optimal sampling scheme that will ease the collection of key biological information for the future implementation of analytical assessment for these species. DISSEMINATION OF RESULTS
The results from the Study will be disseminated through various channels providing information to stakeholders (the EC, the Science community, the Fishery Industry):
The National Correspondents in the DCF system will be informed on the Study progress by a News Letter every 6 months of the duration of the Study.
Page 84 of 176
Specific species information will be reported in ICES Working Documents and presented to the relevant Expert Groups within the ICES system and more broadly at the ICES Annual Science Conference. For the Mediterranean stocks, relevant GFCM ex-pert groups will be addressed. If so evaluated by the participating partners, peer-review papers will be produced on relevant parts of the Work Packages, however, this is not a success criterion for the Study.
Finally the ‘Toolbox’ will be made fully available on the internet by uploading the Final Scientific Report in a selected document repository which will provide a DOI (digital object identifier). In this way, the results are always available for the entire scientific community.RCM NS&EA comments
This study was recommended by the PGCCDBS 2013.
Page 85 of 176
8. Other business
8.1 Consequences of the landing obligation in 2015 introduced by the CFP for the DC-MAP
The Basic Regulation of the reformed Common Fisheries Policy (compromise text of 11 June 2013; document 10629/13), Article 15, foresees an obligation to land catches of regulated species in a step-wise approach, starting in 2015.
Although providing a clear roadmap for introduction of fisheries to the landing obligation, the text in Article 15 is formulated with insufficient clarity in several instances and contains complex exemption rules that make appropriate monitoring as well as control and enforcement of the landing obligation difficult or even impossible. The measures introduced could potentially lead to reduced discards and improved or new gear technology in order to
avoid unwanted catches. Considering that the roles of scientific observers versus control inspectors in monitoring the catches and/or implementation of the landing obligation are not clearly differentiated, a bias in catch estimates and limited access to vessels at sea could be expected. In addition, it is not clear how and where catches are being recorded exactly. Furthermore, the RCM NS&EA would like to stress the importance that the MS authorities are implementing adequate monitoring programmes and means to monitor compliance with the discard ban, as inadequate compliance is causing uncertainty about the quality of future catch data for stock assessment purposes and subsequently the advice on exploitation of the fish stocks.
Article 14 (new), however, offers possibilities for pilot projects and overviews on discards, and Articles 15.1(ter) and 15.3 provide some scope for regional co-operation in implementing discard plans and expanding the landing obligation to non-regulated species.
Notwithstanding the lack of a complete evaluation of all possible impacts of the landing obligation on data collection, it can be anticipated that at-sea sampling of commercial catches will still be necessary to record the complete catch composition including non-regulated by-catch species on a haul-by-haul basis.
Similar conclusions can be drawn from a control and enforcement point-of-view, as data of high quality are required to monitor compliance. There are a couple of recent improvements in electronic reporting systems that allow efficient cross-checking of landings data (e.g. via sales notes), and risk management is applied to evaluate the likelihood and magnitude of a vessel discarding.
Note that an STECF Expert Working Group took place in the same week as the RCM NS&EA to discuss the implementation of the Landing Obligation (STECF EWG 13-16, Varese/Italy, 9-13 September 2013).
8.2 Analysis of data from 2013 RCM data call
All subsections of this section are dealing with analysis using the RDB. If possible, use tables and graphics to demonstrate the power of the RDB.
8.2.1 Quality of the response to the 2013 RCM data call
The quality of the RCM data call must assessed as good, all countries have responded to the data call. All countries except one have uploaded data in the Regional DataBase (RDB) as requested. Only Spain provided the data in a spread sheet and did not upload data into the RDB.
Page 86 of 176
ICES Secretariat has hosted and maintained the RDB for a little more than a year. ICES Secretariat has responded fast and solved all issues brought forward. In the future the RDB and InterCatch will be fully integrated to stream line the data flow to the stock assessment expert groups.
I the following four tables the data uploads per country (vessel flag country) and year (data year) are shown for the landings statistics, effort statistics and length sampling statistics.
Table 8.2.1.1 Number species in commercial landings statistics per country (vessel flag) and year (data year)
Number species in the landings statistics per country (vessel flag) 2009 2010 2011 2012
Belgium 47 48 49 50
Denmark 79 73 73 84
England 121 124 118
Estonia 1 1 1 2
France 93 94 88
Germany 33 62 61
Ireland 19 13 6 18
Lithuania 9
Netherlands 43 48 46 44
Northern Ireland 37 43 39
Poland 9 9 9 10
Scotland 94 92 92
Spain (provided but not uploaded)
Sweden 57 71 67 68
Wales 12 17 24
Grand Total 255 653 683 707
A few countries have not uploaded the 2009 landings data, but the focus is also more on the recent years. Beside that there seem to be stable number of uploaded species over the years, which indicate all landings data have been uploaded.
Page 87 of 176
Table 8.2.1.2 Number of metiers in the effort statistics per country (vessel flag) and year (data year).
Number of metiers in effort statistics per country (vessel flag) 2009 2010 2011 2012
Belgium 16 20 20 19
Denmark 51 49 53 49
England 100 104 95
Estonia 1 1 1 1
France 33 36 32
Germany 42 32 35
Ireland 5 4 8 6
Lithuania 4 8 3
Netherlands 64 66 67 62
Northern Ireland 15 16 15
Poland 2 1 1 1
Portugal 1 1 1
Scotland 57 57 59
Spain (provided but not uploaded)
Sweden 48 41 40 49
Wales 4 7 9
Grand Total 188 438 451 435
Again the same few countries have not uploaded the 2009 effort data. That there seem to be stable number of uploaded metiers over the years, which indicate all effort data have been uploaded.
Table 8.2.1.3 Number species in sampling statistics per country (vessel flag) and year (data year)
Number species in the sampling statistics per country (vessel flag) 2009 2010 2011 2012
Belgium 35 42 46 38
Denmark 102 100 103 101
England 110 99 102 115
France 1
Germany 87 126
Guernsey 1
Ireland 2 2 2 2
Latvia 1 1 1 1
Lithuania 1
Netherlands 22 22 28 14
Northern Ireland 4 6 16 1
Poland 14 22 6 17
Scotland 28 33 27 32
Spain (provided but not uploaded)
Sweden 8 90 93 97
United Kingdom 11 23 26 16
Wales 1
Grand Total 337 440 538 563
Page 88 of 176
A few countries are missing the length sample data for some of the first years. Again there seem to be stable number of uploaded species over the years, which indicate all length sample data have been uploaded.
Table 8.2.1.4 Number of samples at sea and at shore per country (vessel flag) and year (data year)
Number of Samples At Sea Number of Samples At ShoreCountry vessel flag\Year of data 2009 2010 2011 2012 2009 2010 2011 2012
Belgium 10216 10017 6556 6789 19 26 14 0
Denmark 5129 5471 5122 6296 1206 1545 731 1111
England 6113 8180 5969 7865 1489 1341 1682 1640
France 0 21
Germany 3965 5390 0 0
Guernsey 0 1
Ireland 0 0 0 0 13 13 11 14
Latvia 100 84 77 93 0 0 0 0
Lithuania 59 0
Netherlands 263 356 208 82 1070 621 1267 153
Northern Ireland 0 0 0 0 7 14 57 1
Poland 356 230 129 115 0 0 0 0
Scotland 260 4087 4591 4281 26 3365 3296 3557
Spain (provided but not uploaded)
Sweden 0 4009 3211 3316 365 379 354 276
United Kingdom 0 0 0 0 88 259 195 26
Wales 0 1
Grand Total 22437 32434 29887 34227 4283 7563 7607 6801
In the table above ‘one sample’ is defined as the information from a species at a station, so each species list record with its belonging length data is seen as ‘one sample’. From the table above it can be seen, if the uploaded data are the complete existing data set, that the countries are split in three categories. Countries which have conducted; only at sea sampling, only at shore sampling or both. It is very important to know if the uploaded data is the complete existing data or parts are missing. This was discussed at the RCM meeting and it was agreed that developments of functionalities, which support the process of indicating whether the uploaded data are the complete data set or not, have high priority.
From the four tables above it can be concluded that all countries have responded well to the data call and made it possible for the RCM to work with and draw conclusions from the uploaded data.
Never before have the countries provided and uploaded so much fisheries statistic data, this is a very positive and important development. This will make the RCM meetings much more effective, since the data is harmonised and there is direct access to the data for the RCMs.
Since the RCMs draw conclusions and do planning based on fisheries statistic data, it is crucial for the RCMs to have the well-functioning Regional DataBase for planning the sampling of the commercial fisheries regionally.
8.2.2 Comments from participants of the MS on the data upload in the RDB
Netherlands
The Netherlands uploaded a full data set for landings and effort data. Regarding biological data, as last year, only samples from 28 main commercial and by-catch species were uploaded. A few technical problems still have to be corrected or completed in the national data base to be able to fully comply with RDB FishFrame. These include standardised species names, maturity stages for Crangon crangon. The
Page 89 of 176
Netherlands currently works towards a fully integrated database system to connect logbook, biological and reference databases. Once this integration is fully mature, all variables necessary for RBD FishFrame can be delivered, while this would require manual data entry at the moment. E.g. in case of number of hauls during a discard trip, it was decided to leave this variable for the moment as it would require a lot of manual work to complete the data.
Coding issues as well as comments to the exchange format (and description) will be taken up with the RDB FishFrame team at ICES.
While analysing the data at the RCM, data omissions due to programming issues in the data preparation software were discovered. These issues will be solved after the 2013 RCMs.
Portugal
IPMA (Portugal) reported on the difficulties experienced while uploading data to FishFrame 5.0 in "Report on Upload Issues to FishFrame 5.0: Portuguese Commercial Fisheries Sampling (PNAB/DCF)" dated 15 July, 2013. While acknowledging the substantial progress achieved by the RDB support during 2012 and 2013 in solving many of the difficulties previously identified, in the latter report IPMA identified ~20 issues that required solving for accurate upload of its data to the RDBFF. Among these, three were considered of major importance since they hampered the upload of data. The latter were a) security flaws in the RDBFF webserver (no https//*), b) Metier Level 6 lookup table not harmonized according to the latest RCM decisions and c) vendor type samples could not be uploaded. Up to date, only the issues on security and those related to the upload of vendor type samples (type "V") have been resolved. The chair of SC - RDB is aware of the issues and resolutions so far.
Spain
As regards uploading problems in the database, we started the uploading and when we arrived at step four (Exchange format data upload), the process stopped but we do not know why.
We do not know if the problem is actually a problem in the database, or if on the contrary, we have some incompatibility with the computer and required formats.
By other side, the manual does not match in many cases with the requirements and more clear explanations are need, for example fields appearing as "optional (to be checked)" have not a clear meaning and are subject of different interpretations.
As for the database, from our part we can say that: the first thing to do is to have a single format, with clear fields that should be the same in all
'data calls', and clearly differentiating those optional and mandatory fields in the text of the data call.
in addition the required fields should match with what is stated in the Regulation about Data Collection and do not go further and also only ask for data to the level of aggregation established therein.
The responsibility of the Member State ends by sending those flat files, without loading in specific programmes.
If at any time a higher level of aggregation is needed, we can make a commitment to do something not habitual and to remove the data after analysing them.
UK Scotland and UK England
UK Scotland experienced relatively minor problems relating to specific fields, (range checks for vessels power, number of hauls being greater than one, stipulations that sample weight had to equal total weight, stock being mandatory). Speed of the upload was slow and the biggest handicap was lack of confirmation that the procedure had worked or an easy way to check the status of the uploaded data.
UK England required new codes for gear types, and species, range checks and maximum limits to haul numbers, new size category codes, and had problems uploading data that does not have an associated length frequency, e.g. skate wings, counts of benthos and seabirds. Both UK England and UK Scotland experienced problems with upload permissions being limited.
Page 90 of 176
For both UK Scotland and UK England Species specific sample weight requirements mean that mixed species samples and counts can only be uploaded by converting to a weight based on weight length relationships. This derived data cannot be flagged as such and, in the case of UK Scotland, it limits the species applicable to upload to those for which a WL relationship is available.
The uploading of the combined UK landings and effort data was hampered by some uploaded landings data apparently not appearing in the database requiring it to be re-uploaded. Relaxing of the mandatory field for landing value was not well communicated and resulted in some UK data not being uploaded.
Extraction of the cl and ce data for analysis at the RCM was relatively problem free once the procedure was established and appropriate permissions set. The extraction of the CS data is more problematic because of the divergence of the data exchange format used in the RDB and the COST data exchange format. The addition of new fields in the RDB exchange format compromises the unique key fields expected in the COST format.
8.2.3 Needs to modify the NP for 2014 based on updated information on metier ranking.
8.2.3.1 Ranking following regional harmonization of the metiers at level 6.
Ranking of the metiers, by fishing ground, was undertaken by RCM NS&EA 2013 using outputs from the RDB. The data were extracted by the RDB manager of ICES and were available prior to the meeting.
Not all MS were able to submit the data prior to the deadline of the 2013 RCM data call and some MS were unable to load specific data types because of coding issues (see Portuguese Report: “FishFrame Data Call IPMA_15 Jul”). Therefore the metier ranking procedure by the total official catch weight, total official value or total days at sea, could not be done for the NAFO areas, the Eastern Arctic (ICES Sub-areas I and II) and Iceland-Greenland-Irminger Sea (ICES Sub-areas XII, XIV and Division Va). Nevertheless this exercise is not important in those areas, since TACs and fisheries were relatively stable from 2011 to 2012. Overall, the magnitude of fishing activities of the countries operating in these metiers has remained stable. At present, in the Iceland-Greenland-Irminger Sea area, a major fishery directed to pelagic redfish (Sebastes mentella) exists. This resource is wide-spread across ICES Sub-areas XII, XIV and Division Va and NAFO Divisions 1F, 2HJ and 3K. The existing mesh size conservation and enforcement measures are the same in the NAFO and NEAFC area (100 mm minimum mesh size). As the non-EU countries Norway and Russia are the major players in the Eastern Arctic, the catches taken by vessels of EU MS do only constitute a minor part of the total catches. Consequently, all catches and sampling effort in the areas I and II, should be considered when evaluating the MS fishing activities and sampling coverage (See catches data from the ICES AFWG).
As not all data were available in the RDB, the rankings for Skagerrak and Kattegat (ICES Sub-area IIIa), North Sea (ICES Sub-area IV) and Eastern Channel (ICES Sub-area VIId) (Annex 3) are not necessarily correct in terms of landings and value by fishing ground. This illustrates the need for a reference within the DB that provides the user with an inventory of the dataset that are complete.
As the NPs of 2013 have been rolled over to 2014 unchanged, the RCM NS&EA considered that there was no need to explore whether the main metiers identified by the ranking are sufficiently covered by the intended sampling in the NP 2014.
To look at the annual variability of the regional ranking, the ranking procedure based on the 2012 data was repeated using the 2011 and 2010 data that were also provided by the 2013 RCM data call. The table provides an example of the changes in the positions of the top 10 metiers in the 2012 ranking by the landings for the last 3 years. It also indicates whether the metier was ranked or not. Similar tables for the ranking according to effort and value are presented in Annex 4. In this example, the top 10 metiers of the 2012 ranking cumulate to 77,8% of the total landings in Skagerrak and Kattegat (area IIIa). The metier that accounts for the largest part of the total landings in 2012, OTB_MCD_90-119_0_0, is also the first one picked up in the ranking of 2011 and the second one picked up in the 2010 ranking. This analysis clearly demonstrates the high stability of the fishing activities and let us conclude that there is no need to modify the NP 2014-2016. Furthermore, it points out the strength of the RDB, to do exploratory analysis in a less time consuming way.
Page 91 of 176
Rankings Comparison for 2010 - 2012. Top 10 Metiers in 2012 - Landings in IIIa (cum% in 2012 = 77,8%)
2012 2011 2010 2012 Ranked 2011 Ranked 2010 RankedOTB_MCD_90-119_0_0 10391.46 11433.10 11801.29 1 YES 1 YES 2 YESPTM_SPF_32-69_0_0 8681.07 7335.38 21445.09 2 YES 2 YES 1 YESOTM_SPF_16-31_0_0 8341.66 3605.87 6009.64 3 YES 6 YES 4 YESOTM_SPF_32-69_0_0 7786.50 5500.04 3307.81 4 YES 3 YES 6 YESPS_SPF_16-31_0_0 4844.12 4693.55 3119.31 5 YES 4 YES 7 YESSDN_DEF_>=120_0_0 3085.05 2148.11 834.53 6 YES 8 YES 17 YESSDN_DEF_90-119_0_0 2467.34 3275.59 4197.37 7 YES 7 YES 5 YESPTM_SPF_16-31_0_0 2338.07 4298.93 2040.27 8 YES 5 YES 10 YESMIS_MIS_0_0_0 2255.03 1882.60 1518.25 9 YES 11 YES 13 YESOTB_MCD_>=120_0_0 2011.21 1467.62 2287.52 10 YES 12 YES 9 YES
Top 10 Metiers in 2012Offi cial landing catch weight (tons) Position in ranking
8.2.3.2 Potential bilateral co-operation
Based on the approved procedures (RCM NSEA 2012,2011) to identify whether bilateral agreements on sampling foreign landings have to be established, RCM NSEA evaluated the 2012 landings data as uploaded to the RDB. Based on these procedures, annual landings exceeding 200t into a foreign country and accounting for more than 5% of a MS landing, several occasions where bilaterals might be needed where identified for each area. The complete result of the evaluation is presented in Annex 5, the table below shows and example of the result for area 27.IIIa. The table indicates e.g. that Denmark, as so called flag country, is landing 10% of its herring from area IIIa into Sweden. Hence, there is a potential requirement to set up bilateral agreements on sampling.
However, whether a MS has already set up a bilateral agreement or not is not indicated here. MS might also have other means to cover these landings, like at-sea observer programmes, eliminating the requirements for a bilateral agreement.
DNK SWEDEU Gadus morhua 347479 2929 350408 98% 0%DEU Pollachius virens 308087 75018 383105 80% 0%DNK Clupea harengus 1150098 7997913 9148011 0% 10%SWE Clupea harengus 3835993 13028899 16864892 23% 0%SWE Trachinus draco 684500 24482 708982 97% 0%
SpeciesFlag Country
Total landings abroad (kg)
Total landings into flag country (kg)
Total flag landings (kg)
Landing country
Similar evaluations where carried out at RCM 2012, but as the data delivery by MS differs between these years, direct comparisons between the years can’t be done. MS are advised to take the latest insights into account for their sampling programmes where possible and feasible, as the current NP roll-over might not facilitate new bilateral agreements in terms of budgets and planning.
8.3 Regional Sampling Design for DC MAP
8.3.1 Principles of design based sampling
Survey sampling involves selecting elements from a population according to a sampling design by the use of probability based selection protocols. Various estimates can be made from the data obtained from the selected samples; these estimates are used to make inferences about the population.
The crucial element in design based sampling is the probability selection. During the sampling event the observer selects which element to sample using a predetermined protocol involving random or systematic random selection. The observer does not make subjective or ad-hoc decision about which sampling element to select. Probability selection ensures that in a perfect world, the estimates will be unbiased, in an imperfect world, the documentation of the selection process enables biases that exist can be assessed.
A second important element of probability selection is that the sampling units have equal probability of selection and therefore the samples obtained can be considered replicates. A measure of the variability
Page 92 of 176
within the collected samples can be calculated and so the precision of the estimate about the population can be derived.
This can be contrasted with quota based, ad hoc or opportunistic sampling widely adopted under the DCR and DCF. Here the observer was able to select a sample if it fulfilled certain criteria. There was no randomness in the selection and as a consequence there was no ability to estimate variability between samples or the precision of estimates. Bias in the selection process could not be easily measured nor controlled.
8.3.2 Regional Sampling Design
A regional catch sampling scheme has been proposed and considered by various groups PGCCDSB 2011 WKPICS 2 SGPIDS 2. A regional scheme would seek to achieve regional goals in data collection and deliver catch estimates to end users, such as the assessment working groups and STECF whose remit covers regional fisheries. The elements of a sampling design for fisheries data are the at-sea and on shore sampling frames (as set out at WKPICS 2). These sampling frames consist of the primary sampling units (PSU) which provide the means of access to the population. WKPICS set out four potential types of PSU for fisheries sampling. For at-sea sampling the sampling frame is a list of vessel or vessels x trips, for on-shore sampling the sampling frame is a list of ports, or ports x days. Ports is used in a general context and refers to all on-shore sampling locations, ports, auctions and processors where the landed catch can be sampled.
Here we present an exercise in planning a regional sampling design for on-shore sampling using data from the RDB. We stratify by groupings of species and stocks with a gross optimisation based on the landed weight for 2012. We envisage that sampling of the ports identified in the regional list would be carried out by the observers operating in the nations in which the ports are situated.
8.3.3 The analysis
The analysis carried out considers only the landings information uploaded to the RDB for the Sept 2013 RCM NS& EA. The 2012 data present in the RDB includes landings for 430 species into 601 harbours. The objective of the analysis was to assess the extent to which it would be possible to optimize the sampling of ports in a regional context in order to cover the landings of the stocks needed for the relevant ICES assessment groups. To achieve this a stratification based on four species groupings was considered, the species composition of these grouping was:
1. Small pelagics and industrial species (Norway pout and sandeel included)2. Gadoids, Nephrops, anglerfish and elasmobranches 3. Flatfish4. All other remaining species
The first three strata covered 89 species in the main taxonomic groupings of importance to commercial fisheries. The fourth strata covered all the remaining species landings recorded in the RDB for 2012 (349 species?). The landing port of these species groups provide the sampling frames that collectively covers all landings of all species in the RCM area including landings from vessels outside the EU; the stratification by species groups thus enables the sampling frame of ports to be determined for each stratum in the regional design. The groupings used here were considered to be the most appropriate based on the type of species, the broad geographical location of the main fishing activity within the region, and similarities in landing pattern, though further refinement would of course be possible.
The sampling frames by stratum were then optimized by including only those harbours that collectively accounted for 95% of the total landings for all the species for each strata. As 100% coverage of the landings of any species can only be achieved if all 600 harbours are sampled, the proportion of each species’ total landings that would be covered if sampling were confined to these major ports was then determined. This proportional coverage is an indication of which species/stocks may be poorly covered if sampling where to be optimized on the ports with the major landings. This exercise was then repeated using 90% of total landings as the threshold. The lower the threshold the fewer ports would need to be sampled to cover the landings, however this will increase the risk of a low sampling coverage for certain stocks.
Page 93 of 176
The analysis should be conducted by stock rather than species, but stock is presently not recorded in the landings data in the RDB. Because the subarea information (III, IV, VII) within the RCM NS geographical boundaries (IIIa, IV, VIId) match the geographical extent of the main flatfish stocks, a proxy of stock was used for the flatfish strata by concatenating species and area.
If landings data is uploaded to the RDB with the harbour field unpopulated then this appears as “unknown”, and unfortunately this category appears in all the sampling frames and in rather large numbers. A complete analysis could only be conducted when harbour was available for all landings data.
For the proposed design the number of ports needed to be sampled by strata, to achieve coverage of 95% and 90% of the landings is given. Tables 1 to 4 show the landed weight by harbour and species (decreasing from top left) for the 95% threshold case. Figures 1 – 4 show the proportion of the stock covered were sampling effort to be concentrated on these major ports using the 95% threshold.
8.3.3.1 Small pelagics and industrial species
The small pelagic and industrial frame includes 18 species with the largest landings being for herring, mackerel, sprat and sandeel into ports in Denmark and the Netherlands.
95% of landings is presently landed in 28 harbours (Table 8.3.3.1), if a threshold of 90% of landings are used then this will correspond to 22 harbours.
Table 8.3.3.1 : Harbours accounting for 95% of the landings of small pelagics in the RCM NS&EA area of competence.Species/Stock DKTHN DKSKA Unknown NL-IJM DKHVS NLIJM DKHIR UK-1509 DENMK DESAS DKHAN UK-2205 NL-SCE NL-VLI GBPHD UK-9512 UK-9505 UK-9523 SERNG GBLER DKSTD UK-5001 NO999 UK-1607 UK-9508 SEELO UK-6003 NLSCEClupea harengus 6551 47528 27086 38681 2466 20157 9950 11925 21812 20876 1377 11445 18503 15159 12078 5523 13 13 7471 2035 3550 73 31 1324 2899 5170 4874 360Scomber scombrus 206 562 36907 5545 27 4537 17697 13107 12 24 24 8591 137 261 2524 5012 8812 8285 20 5324 10 6439 6306 4792 2379 2 22 37Sprattus sprattus 37480 3156 22 3002 18047 66 70 6 8315 667 648 3558 3 2796Ammodytidae spp 18805 9343 11460 509 8565 185 2Trisopterus esmarkii 18324 1467 118 6 15 2071 100 0 4 9Ammodytes spp 496 5802 405Trachurus spp 34 5347Trachurus trachurus 3 2 1130 3 2 1 75 154 3 2 2 1433Sardina pilchardus 4 0 468 409 1 46 1 168 22 46Engraulis encrasicolus 19 2 0 2 4 0Belone belone 10Scomber japonicus 2Mallotus villosus 1Trachurus mediterraneusCoryphaena hippurusMola molaBrama brama 0Sardinella aurita
Page 94 of 176
Figure 8.3.3.1. Percentage of landings of small pelagics and industrial species in the top 28 harbours ac counting for 95% of the total landings.
Page 95 of 176
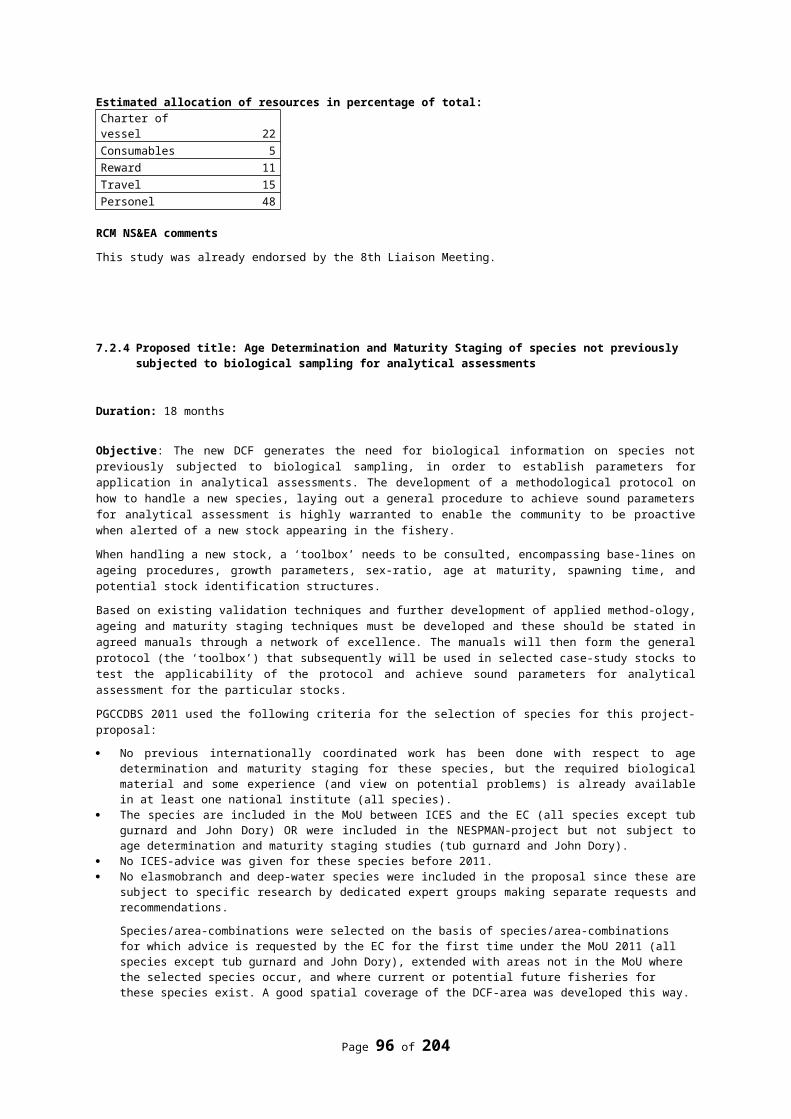
8.3.3.2 Gadoids, Nephrops, Anglerfish and Elasmobranches
The gadoid Nephrops Anglerfish and Elasmobranches strata consists of 53 species the largest landings being for saithe haddock, cod, whiting and Nephrops into Scottish and Danish ports.
If 95% of landings is to be sampled this would correspond to 46 harbours (Table 8.3.3.2), however if only 90% of landings should be covered this would correspond to 24 harbours.
Table 8.3.3.2 The main harbours (out of 46) cumulating 95% of the landings of gadoids, Nephrops, anglerfish and elasmobranches in the NS&EA area.Colonne1 UK-1509 Unknown DKHAN UK-2205 UK-1607 DKTHN UK-2035 DKHIR UK-0101 UK-2217 DKSKA DECUX UK-2409 UK-5009 UK-2223 UK-1003 UK-0118 DKSTD DKHVS UK-9504 …Pollachius virens 4100 11775 9170 1098 164 1091 266 871 1 163 530 2137 212 1078 133 0 0 118 36 …Melanogrammus aeglefinus 17903 308 1679 2219 2302 594 1157 821 324 1244 304 27 426 76 355 170 157 105 43 11 …Gadus morhua 7163 2228 4967 1655 229 2152 752 1690 124 480 510 34 356 96 214 3 50 172 440 775 …Merlangius merlangus 4916 5292 199 1564 1057 836 354 14 561 358 77 2 112 35 200 16 213 114 103 …Nephrops norvegicus 1600 369 524 40 4140 155 17 575 1729 0 752 1 0 775 507 365 92 …Merluccius merluccius 2356 558 1635 156 40 707 479 119 10 37 90 26 28 28 22 0 1 22 59 …Lophius spp 981 279 1012 499 1355 59 93 335 9 113 4 11 …Molva molva 711 137 431 632 65 50 264 33 7 97 22 17 120 19 62 2 5 7 …Selachii spp 2489 4 0 1 0 …Trisopterus spp 1837 …Raja clavata 9 922 4 1 17 9 1 1 1 …Lophius piscatorius 2 752 267 143 62 15 69 …Pollachius pollachius 229 25 237 56 7 39 51 106 29 62 9 17 9 32 7 2 …Scyliorhinus canicula 250 …Micromesistius poutassou 5 6 48 137 20 …Trisopterus luscus 240 …Rajidae spp 300 16 0 6 6 2 …Raja montagui 2 36 13 0 3 30 9 …Lophiidae spp 11 4 4 …Raja brachyura 0 106 4 …Mustelus mustelus …Raja spp 43 38 11 6 15 6 1 1 …Brosme brosme 17 17 28 24 1 1 4 1 16 3 1 …Leucoraja naevus 4 1 57 1 11 2 20 5 13 …Squalus acanthias 16 4 10 1 10 5 …Mustelus asterias …Rajiformes NA 0 0 …Gadiculus argenteus 1 6 …Galeorhinus galeus 0 …Phycis blennoides 3 1 1 …Chimaera monstrosa 5 …Molva dypterygia 4 …Mustelus spp 4 …Lamna nasus 2 …Leucoraja circularis 3 …Raja microocellata …Scyliorhinidae NA …Coryphaenoides rupestris 2 …Centrophorus squamosus 1 …Phycis phycis 1 …Centrophorus granulosus 1 …
Page 96 of 176
Figure 8.3.3.2. Percentage species coverage of gadoids, Nephrops anglerfish and elasmobranches in the harbours accounting for the 95% of the landings.
Figure 8.3.3.2 shows that over 80% of the main species are covered and about 70% of the main rays. Collecting representative samples of smooth-hound (Mustelus mustelus) and tope shark (Galeorhinus galeus) would be impossible under this scheme.
8.3.3.3 Flatfish
The flatfish frame consisted of 41 stocks (derived from species area combinations) with the main landings being of plaice, sole and dab into ports in the Netherlands (UK-6012 = NL Harlingen)
If 95% of landings it to be sampled this would correspond to 41 harbours (Table 8.3.3.3), and if 90% landings is sampled this would equal to 26 harbours.
Page 97 of 176
Table 8.3.3.3. : 20 principal harbours (out of 41) cumulating 95% of the landings flatfish proxy of stocks in the RCM NS&EA area of competence.
Species Unknown UK-6012 NL-DHR NL-IJM DKTHN NL-HAR NL-VLI DKHVS DKHIR NL-STD DKHAN NL-EEM NL-SCE NL-LAN NLLAN DK-THY UK-1509 NLHAR NLDHR UK-2205 …Pleuronectes platessa - 4 5190 11710 6782 5237 5336 5689 2408 4337 6 2103 1426 2308 1873 1889 1643 1440 453 837 687 155 …Solea solea - 4 1231 187 1887 1463 15 337 2017 42 0 1372 2 638 654 135 29 0 0 110 196 …Pleuronectes platessa - 3 219 531 10 3951 1466 0 10 …Limanda limanda - 4 577 440 391 692 270 266 685 143 0 487 120 404 331 106 72 262 0 60 28 …Solea solea - 7 3480 …Pleuronectes platessa - 7 3089 0 0 0 …Microstomus kitt - 4 419 204 78 56 432 106 139 417 1 13 152 7 23 79 24 20 240 5 8 52 …Psetta maxima - 4 177 204 377 259 111 206 174 205 0 143 47 210 80 95 54 26 17 43 34 5 …Platichthys flesus - 4 358 7 289 319 2 21 316 17 251 2 42 284 2 1 0 6 9 …Scophthalmus rhombus - 4 121 65 178 196 50 83 146 49 0 173 12 99 64 32 14 22 1 21 14 …Lepidorhombus whiffi agonis - 4 4 2 0 30 0 328 583 …Limanda limanda - 7 1026 1 2 …Glyptocephalus cynoglossus - 3 0 3 0 319 137 …Limanda limanda - 3 11 42 2 271 163 0 1 …Glyptocephalus cynoglossus - 4 0 9 4 1 55 8 52 1 132 2 1 1 147 0 0 81 …Microstomus kitt - 3 24 32 3 218 155 0 0 …Microstomus kitt - 7 349 0 0 0 …Psetta maxima - 7 417 …Solea solea - 3 4 3 0 79 16 0 …Scophthalmus rhombus - 7 224 …Hippoglossoides platessoides - 4 1 145 4 25 …Psetta maxima - 3 5 37 2 33 69 0 0 …Platichthys flesus - 7 120 0 …Platichthys flesus - 3 0 10 1 …Scophthalmus rhombus - 3 2 6 0 12 8 0 0 …Hippoglossus hippoglossus - 4 0 0 11 2 0 15 0 36 6 …Reinhardtius hippoglossoides - 4 14 0 0 …
Figure 8.3.3.3. Percentage of landings of flatfish proxy of stocks in the harbours accounting for 95% of the total landings.
Figure 8.3.3.3 shows that the sampling scheme would not suit the collection of representative samples for sole (Solea solea), witch flounder (Platichtys flesus) and brill (Scophtalmus rhombus) in IIIa
Page 98 of 176
8.3.3.4 Remaining species group
The remaining species were mainly shellfish, the greatest landed weights being for brown shrimp, scallops, brown crabs, whelks and mussels with the landings being into the UK and the Netherlands.
If 95% of landings is to be sampled this would correspond to 116 harbours (Table 8.3.3.4, however if only 90% of landings is sampled this equals to 83 harbours
Table 8.3.3.4 : 20 principal harbours (out of 116) cumulating 95% of the landings of other species in the RCM NS&EA area of competence.Species Unknown DEHRM UK-0639 NL-LAN DEBUM NOTOS UK-0225 UK-0635 DENOE UK-0654 UK-0326 NL-WRG UK-5010 NL-HAR DEGRE DKHNB DKEBJ DECUX UK-2035 UK-1509 ….Crangon crangon 1030 286 4763 4162 977 841 1806 1575 1543 1469 1422 1345 …Pecten maximus 16383 4195 0 1904 286 238 136 594 ….Cancer pagurus 1849 7 17 3 2263 10 30 28 1 58 1 1064 221 …Buccinum undatum 1706 716 438 432 1154 0 ….Mytilus edulis 4996 1206 0 …Pandalus borealis 3846 ….Sepia offi cinalis 3410 …Chelidonichthys lucerna 501 37 4 3 45 ….Homarus gammarus 83 3 0 368 3 12 0 0 23 9 …Cerastoderma edule 11 746 ….Dicentrarchus labrax 1228 33 0 1 45 34 3 1 …Capros aper 1745 ….Aspitrigla cuculus 1018 0 4 0 0 0 3 14 28 …Macropipus puber 0 28 0 25 28 ….Trachinus draco 0 0 …Loligo spp 81 7 14 0 0 14 108 ….Eutrigla gurnardus 67 17 1 1 8 1 59 0 1 12 19 …Mullus surmuletus 203 1 0 5 0 1 2 0 0 ….Decapodiformes NA 150 21 90 0 77 ….Triglidae spp 14 12 1 1 8 17 …Anarhichas lupus 37 0 2 4 195 ….Sebastes mentella …Bivalvia NA 309 0 ….Osteichthyes NA 1 4 18 …Carcinus maenas 0 1 ….Conger conger 202 1 0 0 0 4 3 …Mugilidae spp 56 6 0 3 13 0 0 ….Spondyliosoma cantharus 82 24 0 …Ostrea edulis 0 74 ….Sebastes spp 22 0 10 1 …Solen spp ….Illex spp 102 …Mya arenaria ….Thunnus alalunga 80 …Sepiidae sepiolidae 78 ….Cyclopterus lumpus 0 0 …Crassostrea gigas 10 ….Zeus faber 50 0 0 0 0 2 3 ….Necora puber 62 …Argentina sphyraena ….Littorina spp 10 …
Page 99 of 176
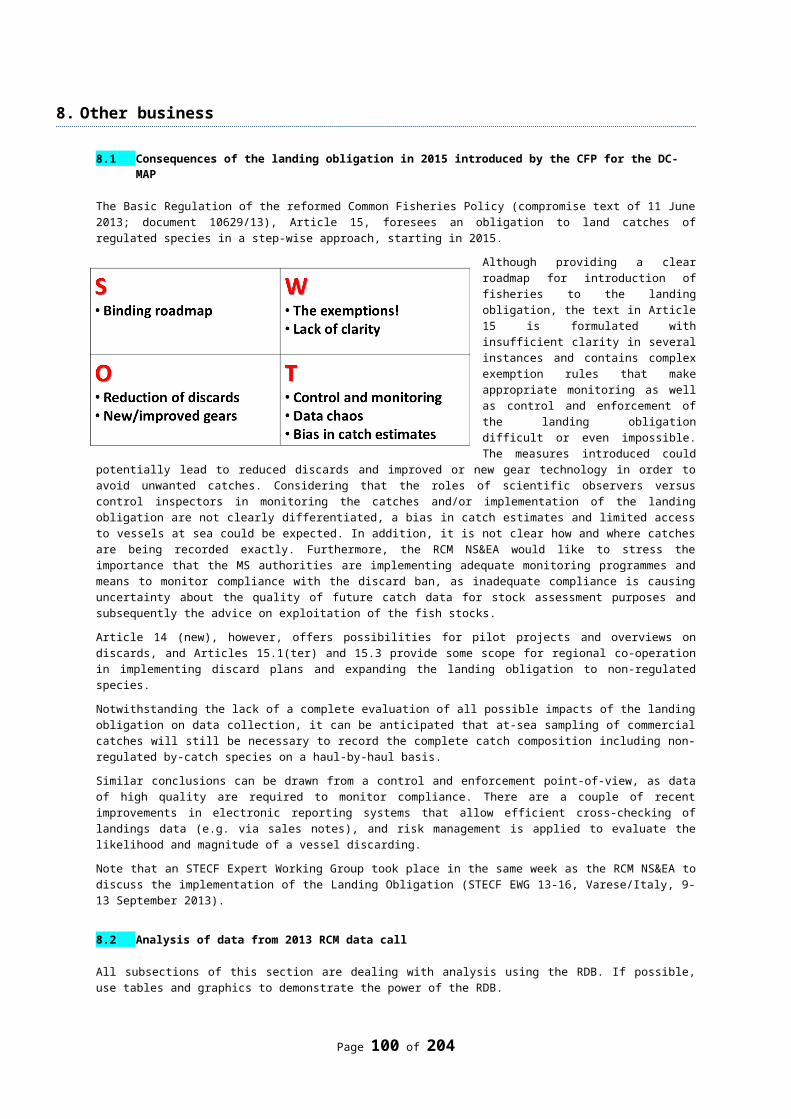
Figure 8.3.3.4 : Percentage of landings of other species in the selected harbours. (left panel : in harbours cumulating 95% of the total landings. Right panel : in harbours cumulating 90% of the total landings).
This strata corresponds to more than 100 harbours, it is thus unsurprising that probabilistic sampling would give a representative view for most of the species (Figure 8.3.3.4).
8.3.3.5 Additional stratum
The presented generic scheme is optimized for 3 major fish groups small pelagic, gadoids, and flat fishes and a stratum for the shellfish and remaining fish species for the entire region. It is clear that for the vast majority of the species and stocks the coverage is high. However, it may still be the case that for some stocks with relatively poorly coverage a complementary stratum could be used for regional schemes which may need to be adopted for the particular sampling needs of those stocks/groups of stocks. This needs to be done at the RCG level if the stocks are of interest for more than one MS. At a national level there is scope to have separate strata for stocks or species of particular national interest or local distribution.
8.3.4 Sampling protocols
It is assumed that the sampling of ports would be conducted by observers within the country that the port was situated, using a design appropriate to the temporal distribution of landings into the port. This would involve systematic or random systematic coverage over time. Probability based selection protocols should be used to select the landing of the vessels to be sampled. Simple and robust ways that this can be achieved for the region could best be addressed by means of a workshops and case studies. The landings of all vessels, regardless of the vessels’ flag country should be sampled in such regional sampling program.
8.3.4.1 Estimation and Post stratification
The sampling probabilities used for selection would be used to generate estimates from the sample data. These estimates would be raised to the port total and national and regional estimates would be generated by summing over port totals and where necessary, raising these totals to the final regional total to account for any final unsampled components.
Page 100 of 176
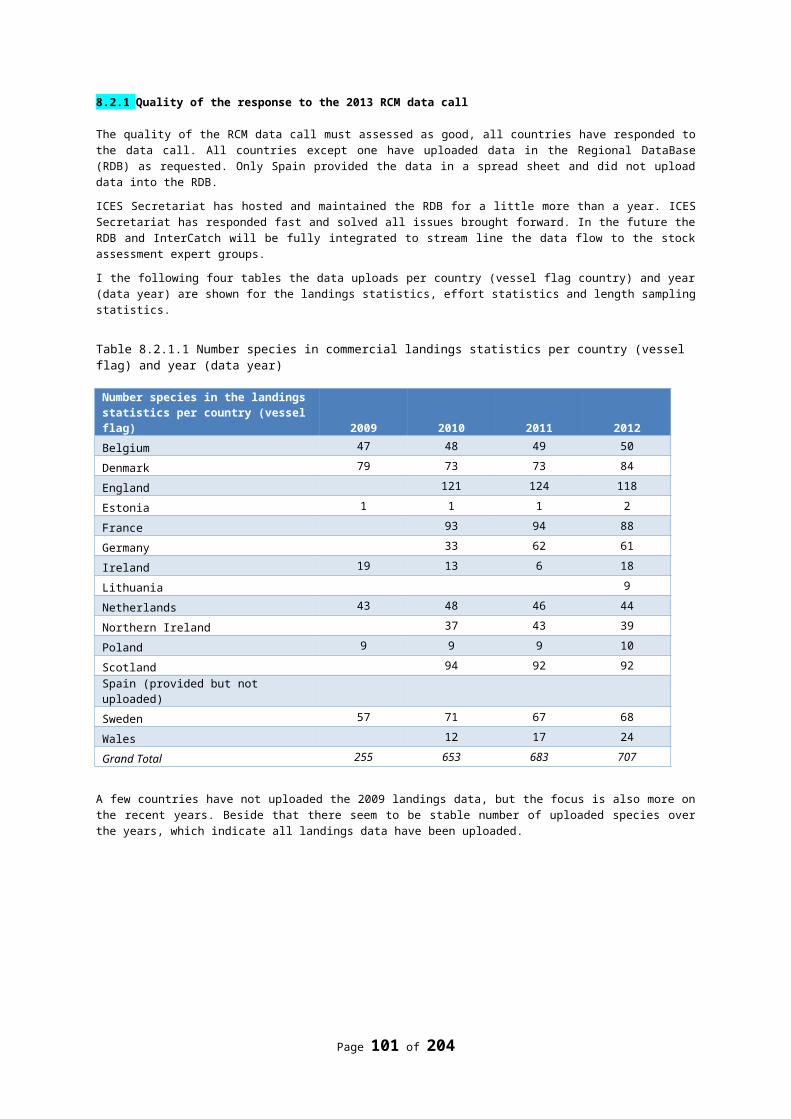
Poststratification of samples, for example by species, by stock, by areas, by metier, or by STECF effort categories, would be used to generate estimates for any of these domains. Estimates from these samples would be raised to the domain total for that port, and aggregated over ports and nations for example by the stock coordinator using INTERCATCH/ RDB. In this way estimates could be provided to serve the differing requirements of different end users such as assessment working groups, STECF and for management purposes. The only requirement for poststratification is that the samples obtained can be ascribed to a unique domain, and the risk is that small strata receive too few samples for raising. A schematic diagram is shown in Figure 8.3.4.1.
Figure 8.3.4.1. A general scheme of a regional sampling design optimized to cover major regional fish groupings flatfish, gadoids, pelagics and others (mainly shellfish). Additional stratum can meet specific Collectively these cover all landings in the region. The samples collected under such a scheme can be poststratified to generate estimates for different end user requirements.
8.3.5 Implications for data collection and Regional Coordination Groups
The generic regional port sampling scheme put forward by the subgroup highlights some of the implications of data collection using statistically sound designs; what is performed and how the regional coordination groups need to work.
8.3.6 End user interactions
Broad regional sampling schemes, stratified according to commonalities in major fisheries and stocks would have the advantage of mirroring the structure of end-user groups both on the advisory side (e.g. ICES AWG), and on the management (e.g. EC, MS) and industry (e.g. RACs) side. This hopefully would facilitate the interactions between end-user and data collection and make feed-backs loops more smooth and easy to achieve. The RCGs would have a clear role in facilitating this process.
8.3.7 Structuring National programs under regional designs
Designing a regional sampling frames by optimizing on the coverage for the species and stocks in all ports in the region diminishes the role that member states play in determining the priorities of their sampling. The worked examples show that only relatively few ports need to be sampled to cover 95% of the overall landings of a large list of stocks. The implications of this are that not all MS may need to carry out port sampling programs, while other MS may need to expand theirs. Regional cooperation may
Page 101 of 176
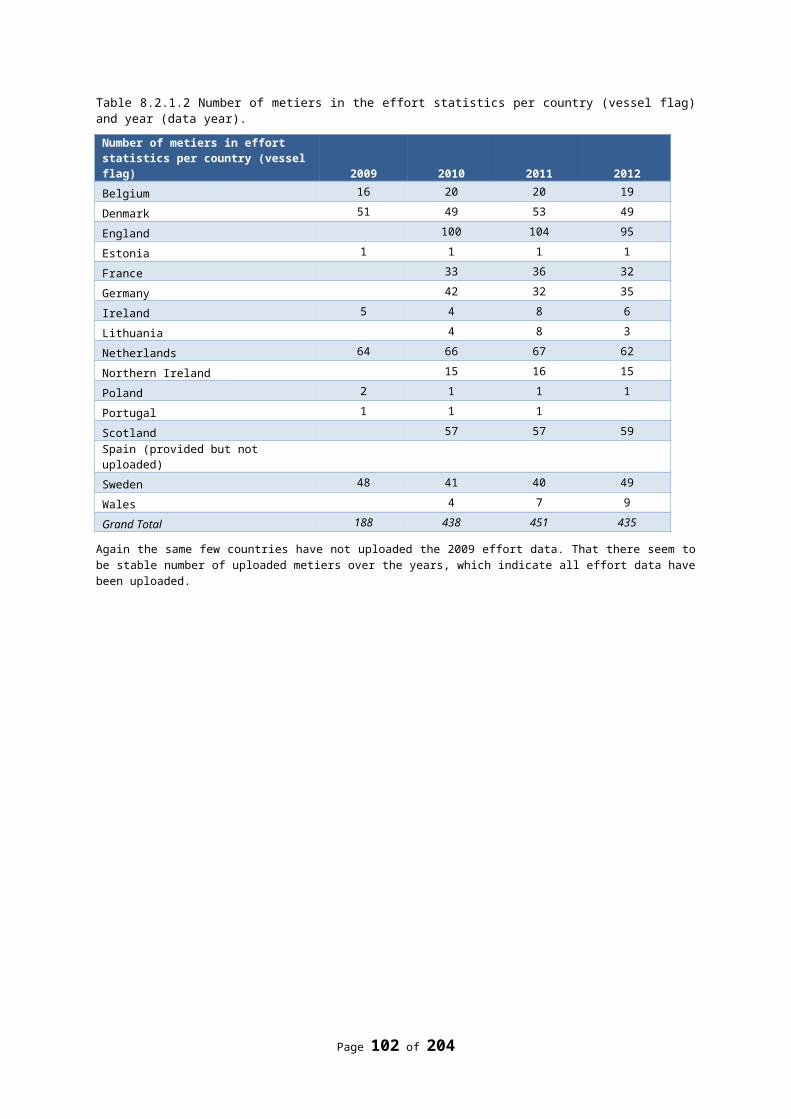
thereby operate over different dimensions with, for example, countries that have little harbour sampling commitments taking on age sampling obligations from others or having increased participation in surveys, if the costs of the different national programs should be kept neutral. A further consideration in a regional plan is that of a national strata that can be used to cover fisheries of national interest. The RCG would have a pivotal role in determining the appropriate balance between regional responsibilities and national commitments. All MS would of course benefit from the improved overall coverage of species and stocks of national interest that would be achieved under the regional design.
8.3.8 Collection of variables
The RCG has a clear role in determining which variable are to be collected for which stocks. The needs of data on ages, lengths, weights and maturity can differ considerably depending on the species and stock and the types of assessment models in operation. The ability to gather data on particular variables may in some situations be limited and these situations need to be managed in the most appropriate way to ensure data quality and transparency is maintained. That RCG has a role in coordinating advise of expert working groups with collections practices and a role in developing data collection protocols appropriate for mixed species assessment models, and advising on what variables can be collected on species that are presently considered data poor stocks.
8.3.9 Estimation
The estimation process needs to be in accordance with the design, and would take into account the selection procedures used in each market and would require the landings totals into the sampled ports. These estimates can be generated by the nations and there is also the potential for estimates may be produced by regions. The clear responsibility for determining whom is responsible for the production of the estimates at the regional level need to be decided in the RCG. There is also a clear need to utilise the individuals with the appropriate skills and ability to design and implement a regional scheme.
8.3.10 Species and stock based sampling protocols
The sampling protocols for selecting species landings in the ports has an important role to play if the appropriate balance is to be achieved between species of commercial importance and species for which the ecosystem approach to fisheries management will be more appropriate. It will also be the case that with an effective probability based sampling design for regional data collection the emergence of new stocks and fluctuations in the catch of existing species and stocks will be mirrored in the data collection far more readily than with the existing quota based data collection methods. This has the potential to present new challenges to the role of assessment groups and fishery managers.
8.3.11 Challenges for the RDB
The regional data base is the backbone of a regional sampling scheme. It is the depository for the landings effort and sampling data and provides the only means by which regional sampling schemes can be designed and by which data quality and sampling design for the region can be effectively assessed. Coordinated regional sampling is not possible without the RDB and its use by the nations in the region and the paralleled development of the RDB with the evolving role and needs of the RCGs is essential.
The stratification and optimization performed for the North Sea region presented here was based on the landings data (CL data) uploaded to the RDB for the Sept 2013. The regional database (RDB), formerly FishFrame, has a data exchange format for commercial landings data (CL) commercial effort data (CE) and commercial sampling (CS) data. These are tables with fields for data entry some of which are numeric, some for characters, some are mandatory, some optional. The CS data exchange format consists of linked tables relating to the trip (TR) the haul (HH) the species (SL) the length distribution (HL) and the age and weight of individual fish (CA) (Jansen et al 2008). The data exchange format underpins the data model and reference tables within the database.
The data collection within a regional sampling design operates within this structure Here we list some of the limitations to the analysis due to problems originating with the uploads to the RDB or the data
Page 102 of 176
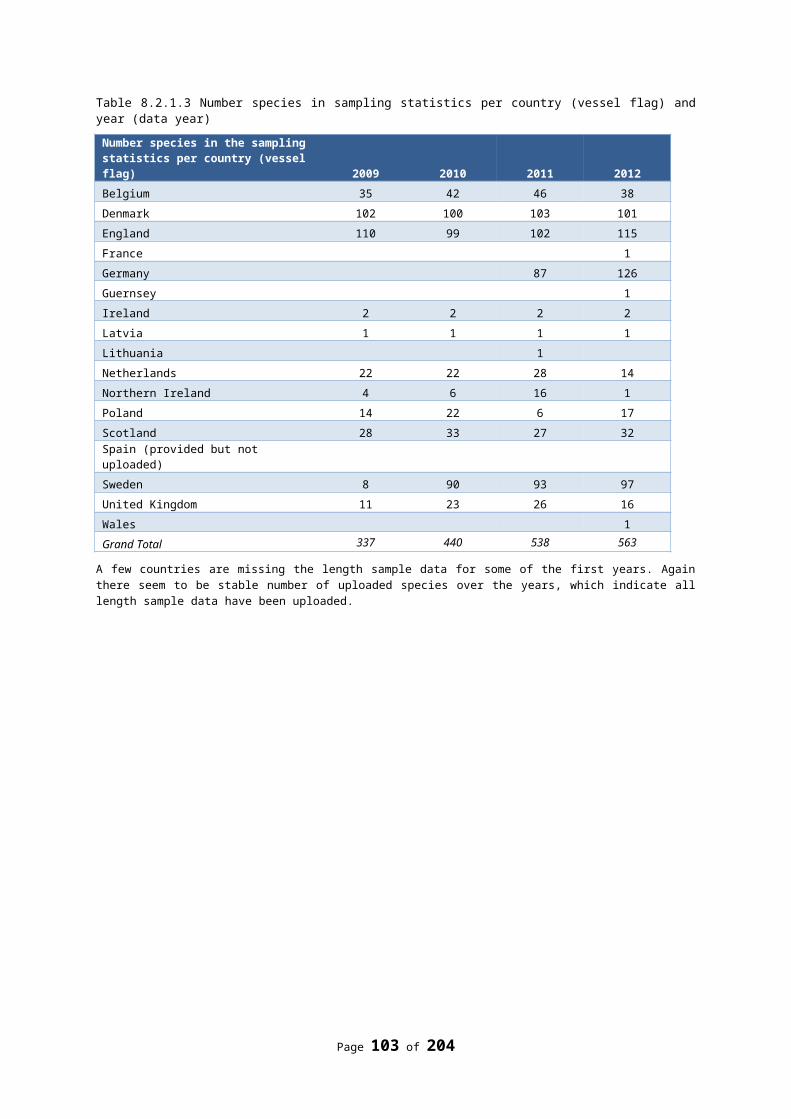
exchange format. First we consider specific modifications needed that relate to individual fields, secondly more far reaching structural modifications.
8.3.11.1 Modifications relating to specific fields within the RDB
Harbour
The harbour field code list in the RDB is not a unique set for example DEBUM, DE-BUM, DECUX, DE-CUX are duplicate harbour codes. This problem has been partly solved by creating a port code list with geographic position, however this list has to be further developed and maintained. Furthermore, it is recommended that individual data uploaders do not have access to create harbour codes but have to choose from a predefined list managed by the RDB host. A number of the harbour codes in the data extraction (mainly in the Baltic) were listed in several different landing countries, despite being uploaded belonging to a single landing country. This should of course not be possible and suggests there are data processing bugs within the RDB. This will also be solved by including the positions of the harbour in the list. For an analysis based on harbours the harbour field needs to be mandatory in the data call, and all data up loaders have to provide the data.
Species codes
An effective way of mapping hierarchical taxonomic species codes within the RDB would be advantageous. For example codes for Trachurus spp. and Trachurus trachurus exist within the CL taxon field but would not need to be considered as independent for this exercise.
Sale location
The analysis was based on landing harbour but in many instances the sampling of fish occurs at the sale location. The inclusion of this field in the landings data and a corresponding field in the CS data is required, particularly if the sampling locations derive landings from multiple landing locations. Biased estimates can result if sampled totals are raised to inappropriate port landing totals.
Data provider
A filed for data provider would be a considerable advantage; at present it is not clear if the data originates with the landing country, or the vessel flag country, and which institute in a country provided the data.
Stock field
The inclusion of a stock filed in a combined CLE data format would facilitate the linking of stock information for landings and samples. Even if this data were not available in the landings data a proxy could be devised and this field would be of considerable benefit in facilitating adequate sampling level of minor stocks within a species group.
Fish presentation
Information on the processed state of the fish would be important if the fish has to be sampled in the harbours this information should be available but presently not included in the CL.
Vessels fields linking fleets with landings.
Integrating on-shore sampling designs with at-sea sampling designs is a crucial part of the design and estimation process for regional sampling design. Appropriate fields for fleet grouping used for at-sea sampling need to be in the CL and CE (and combined CLE format) and need to link to fields in the CS tables. In a discard ban regime, the main part of the discard is expected to be sampled within the harbours. However, if this is to be done in a probability based sampling program information on vessels has to be incorporated in the RDB on a CL level. This is presently not feasible as the data at this level is considered confidential.
8.3.11.2 Structural modifications within the RDB exchange format
Linking the CL and the CE table
Page 103 of 176
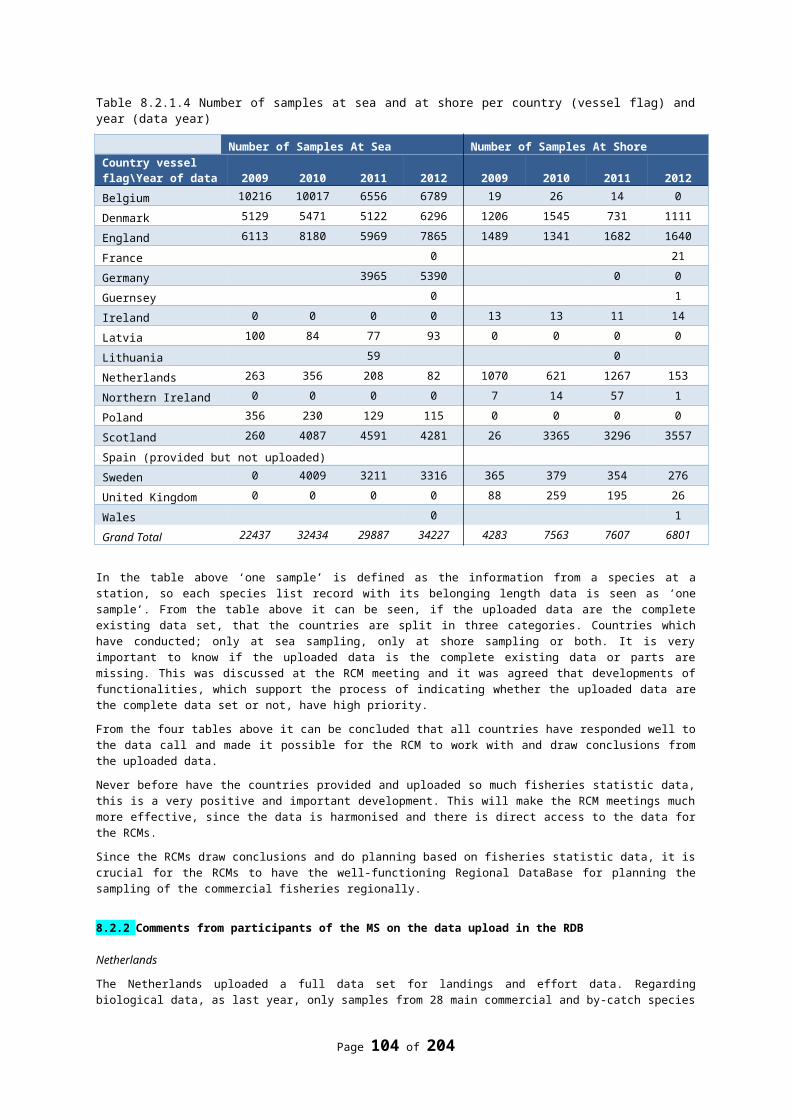
To achieve a probability based sampling design based on on shore and at sea sampling frames it is important to have the ability to have trip information at a low resolution and combine this with measures of effort. Presently the landings data CL files and effort CE data are separate tables and it is not possible to generate any effort indices that are related to species or stock landings. This is a very considerable handicap in the design of any effective regional scheme. For example it is not possible to determine how many trips are landed into a port. A combined CLE data format was considered, and some of the envisaged new fields required were proposed at the RDB workshop III in November 2012 (ICES 2012). This needs to be further taken up by the SC-RDB. A combined CL and CE data structure could complement the existing CL and CE tables, and IT WOULD NOT mean that individual trip information would be uploaded into the RDB. It would however provide the facility to aggregate landings data in a more flexible way. For example a data call could be made for landings and effort data aggregated by fleet groupings and landing port.
The CS data format and on-shore sampling.
The CS data structure works well where the primary sampling unit PSU is a fishing trip by a single identifiable vessel. For on-shore based port and market sampling the PSU is usually the location and the day. Modifications and new fields needed within the CS data structure so that it can accommodate the on-shore PSU need to be considered. Some of the envisaged new fields required for recording on-shore sampling in the CS data format were considered at the RDB workshop III in November 2012 (ICES 2012).
Linking RDB output with R and COST exchange format
The analysis presented here was undertaken using R and it is only possible to link RDB data with R functions and the R tools developed in the COST project if the data exchange format between the two is compatible and extractions of RDB data can be read into the COST data exchange format easily and in a timely and efficient way. There has been some divergence since the end of the COST project in the two exchange formats and funding for development of the R- tools and COST within the RDB context is required to maintain and progress the analysis under a probability based sampling program. The study proposal “Exploration and Development of new facilities in RDB-FishFrame 5.0” presented in this report would support this development.
Page 104 of 176
9. Additional terms of reference
9.1 terms of reference a): Update NP2014-2016 state of play
In order to assist in setting the guidance document regarding how to implement the NP2014, the Commission requested the RCMs 2013 to update the document ‘2013-08-30 State of play MS NP 2014-2016’. This need comes from the fact that the NP2014-2016 currently refer to 2011, 2012 and 2013 respectively, given that the NP2011-2013 were recently rolled over for NP2014-2016 by the Commission Decision C(2013) 5568 of 30 August 2013. Thus, a clear guidance is desirable on how the years in the NP2014-2016 should be ‘read’ - should 2011 actions be done in 2014 or should MS carry out the actions that were planned for 2013 (because most up to date) in 2014? Such a guidance is also needed to specify how the STECF meeting 2015 will evaluate MS compliance with their NP2014. Therefore, clarification is required from MS on which NP is regarded by MS as the ‘reference’ NP for NP2014 – based on the NP recently approved for that MS by the Commission.
The document ‘2013-08-30 State of play MS NP 2014-2016’ has already been revised by the RCM Baltic, the RCM Med&BS and the RCM LDF which held prior to the meeting of the RCM NS&EA.
Following the above request from the Commission, the participants to the RCM NS&EA meeting analysed and updated the table contained in the document ‘2013-08-30 State of play MS NP 2014-2016’ for their respective MS indicating:
1. version of the NP2011-2013 that was rolled over for NP2014,
2. most recent existing version of NP2011-2013,
3. difference between the NP version mentioned above,
4. additional comments from MS.
The version of document ‘2013-08-30 State of play MS NP 2014-2016’ updated during the RCM NS&EA shall be passed by the Chair of the RCM NS&EA to the Chair of the RCM NA having its meeting a following week for further update.
9.1.1 Cost sharing model for joint research vessels surveys
At present two research vessels surveys are conducted as joint Member States financed surveys; the International Ecosystem Survey in the Nordic Seas and the Blue Whiting Survey in the Atlantic.
In the International Ecosystem Survey in the Nordic Seas the Danish R/V Dana is representing the EU in cooperation with research vessels from three third countries. The costs of the survey and scientific crew are shared by Member states and in this case proportional with the MS TAC share of Norwegian Spring Spawning Herring which are the main targeted species at this survey. Only those MS’s that are having a quota share of 5% or more are included in the cost sharing. Denmark, Germany, Ireland, the Netherlands, Sweden and UK are all having a share of 5% or more. The survey has been conducted successfully since 2004 and in a cost effective way. This survey, under the acronym ASH, is included in the list of research surveys at sea under the current DCF (D10/93 Appendix XIV).
The Blue Whiting Survey is carried out the Irish R/V Celtic Explorer and the Dutch R/V Tridens representing the EU in cooperation with research vessels from two third countries. The costs of the survey and scientific crew are shared by Member states and in this case proportional with the landings of blue whiting. Only those MS’s that are having a landing share of 5% or more are included in the cost sharing. Denmark, Germany, Ireland, the Netherlands, Spain and UK are all having a landing share of 5% or more. The survey has been conducted successfully since 2008 and in a cost effective way. As the Nordic survey, this survey is included in the list of research surveys at sea under the current DCF (D10/93 Appendix XIV).
Until now the total research vessel cost for conducting the surveys have been included in National Programme for the “vessel Member State” and the Commission have funded 50% of that cost. The other 50% has been shared according to the above mentioned cost sharing model, either TAC share or landing share. The costs for the scientific staff have been included in the respective MS NP.
Page 105 of 176
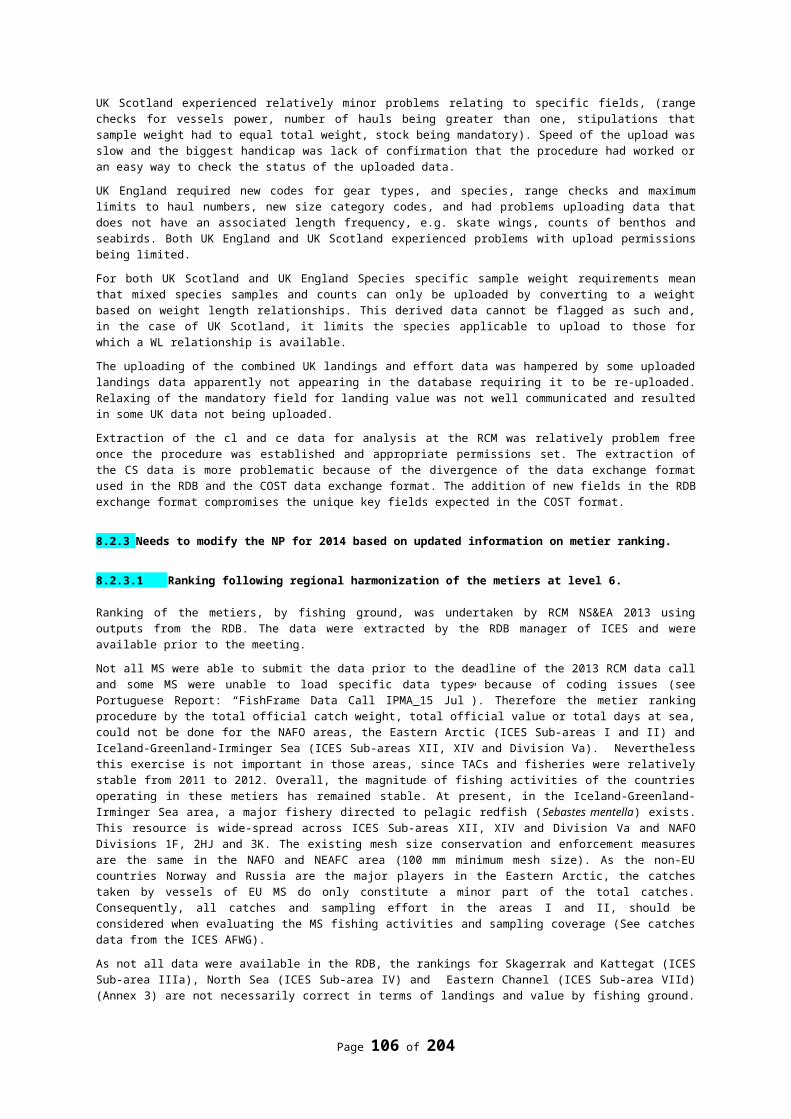
For the future under the DC-MAP where funding of the data collection is made available under the EMFF (article 79) the cost sharing model has to be changed as the MS providing the research vessel will not be able to include the total research vessel cost in their Operational Programme nor in the Annual Work Plan.
RCM NS&EA proposes the following cost sharing model under the DC-MAP/EMFF for both surveys:
All involved MS include a description of the surveys in their OP and AWP. The “vessel Member State” submits a research vessel cost budget forecast for the coming year by an agreed date (e.g. 1 st
December) to the involved MS. The total research vessel cost for conducting the survey (national and EU funding) is shared according to the TAC share for the main species concerned; i) the International Ecosystem Survey in the Nordic – the Norwegian Spring Spawning Herring, ii) the Blue whiting survey – the blue whiting. Only those MS’s that are having a TAC share of 5% or more are included in the cost sharing. The involved MS include their share of the total research vessel cost in their AWP budget forecast. When the survey has been carried out the vessel MS will send an invoice to the MSs concerned based on the cost share model. A recommendation will be provided by RCM NA 2013.
The general approach of this cost sharing model can also be applied to new surveys to be included in the DC-MAP.
The implementation of the cost sharing model requires approval by the NCs, prior to the establishment of the 2014 AWP. The vessel Member States involved in the surveys mentioned above will take the initiative to inform the NCs and the Commission on the proposed model. RCM NS&EA will forward this proposal to the 2013 RCM NA, as blue whiting officially falls within the remit of the RCM NA (RCM NEA, 2004).
9.2 terms of reference b) 'how to understand and interpret the NP2014-2016'
For the transition period between the DCF and the DC-MAP, the Commission has transferred the NP 2011-2013 to NP 2014-2016 with the request to make no changes if possible The NP 2014-2016 is a multi-annual plan for three years.
In the reading of the report the years should be interpreted as the year indicated +3. Of course this does not apply to pilot studies which were carried out under the DCF between 2011 and 2013. In principle these pilot studies will come to an end after 2013.
During the period 2011-2013 some MS have made no changes in their NP. Other MS have proposed minor changes for 2012 and/or 2013. RCM NS&EA is informed that the most recent adopted version of the NP has been adopted by the Commission and rolled over to 2014-2016.
For some MS the changes in the 2013 programme are related to the reduction in financial assistance from the DCF implemented by the Commission. Although the allocation of the budget available for data collection is not available yet, it is assumed that the reduction only applies to 2013 and it can be expected that under the EMFF, MS would be able to carry out their original programme.
The latest versions submitted by the MS to the Commission are listed in ’2013-08-30 State of play MS NP 2014-2016’ .
9.3 terms of reference c) Do we need a list of meetings in the DC-MAP comparable with the eligible meetings in the DCF?
The RCM NS&EA is of the opinion that a list defining eligibility of meetings is not required under the EMFF. However, some MS have expressed concern, that without such a list, indication which meetings are important for coordination, quality assurance, training and analyses of data for providing advice, it would be problematic to get permission to send experts to these meetings. The RCM NS&EA suggests that the Commission annually distribute a list of meetings which the MS should consider when prioritising their participation in meetings.
Page 106 of 176
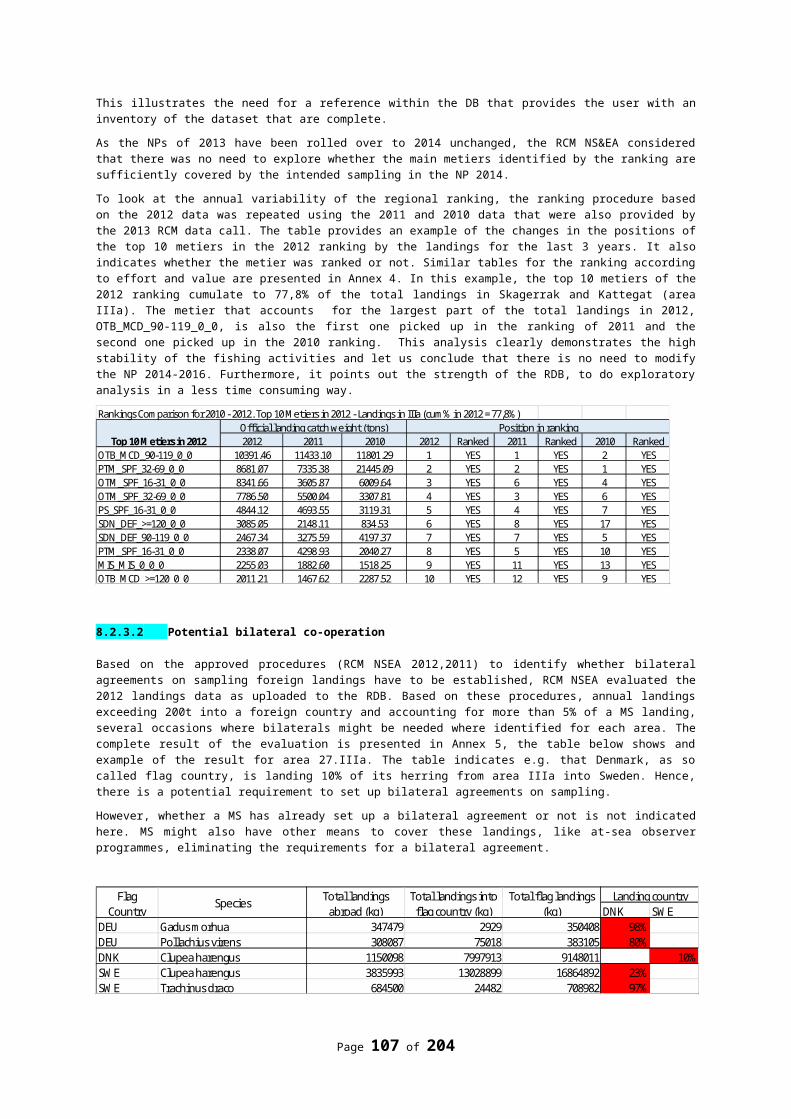
10. Summary of recommendations
Specifying data quality diagnostics for fleet-based and stock-based biological data
RCM NS & EA 2013 Recommendation 1
RCM recommends that WKPICS3 provides detailed guidance on diagnostic methods to evaluate aspects of data quality to facilitate the work of Regional Coordination Groups in coordinating regional data collection and analysis, and provide any additional Terms of Reference for the proposed WGCATCH and WGBIOP to continue this development during the transition phase of DC-MAP. In addition recommends that WKPICS3 provides advice to SC-RDB on development requirements for the RDB related to data quality assurance and reporting.
Justification A suite of diagnostic tools will be needed by RCGs to evaluate and respond to regional data quality issues. These include but are not limited to errors in RDB related to quality assurance and control
at national level and errors during RDB data uploading quality of fleet-based biological data in terms of
coverage and numbers of samples for length and age by stock, fleet and area as needed for coordinating national data collection activities,
quality of stock-based biological data such as for estimating growth parameters, maturity ogives and sex ratios in terms of data sources, coverage of the and numbers stock of samples
Follow-up actions needed ICES to add Term of Reference to WKPICS3Responsible persons for follow-up actions
ICES WKPICS3
Time frame (Deadline) November 2013 WKPICS3 meeting.
Quality assurance – RDB additional fields and managing data gaps
RCM NS & EA 2013 Recommendation 2
The RCM recommends that a policy on how missing data values for MS are accounted for in the database and this decision communicated to RDB users.
Justification Proper consideration needs to be given to how to account for empty data values. Missing data could devalue summary information and if estimates are derived how they are derived could change over time.An example is provided in the RCM report where landing information for a MS does not have both value and weights for some of their records. If this data is uploaded then the sum of the landings would not equate to the sum of the value (€).This could also occur in relation to missing fishing effort.
Follow-up actions needed SC-RDB to consider the impact of missing data values and to provide clear guidance on how MS should manage these data.
Responsible persons for follow-up actions
SC-RDB
Time frame (Deadline) Next SC-RDB meeting
Page 107 of 176
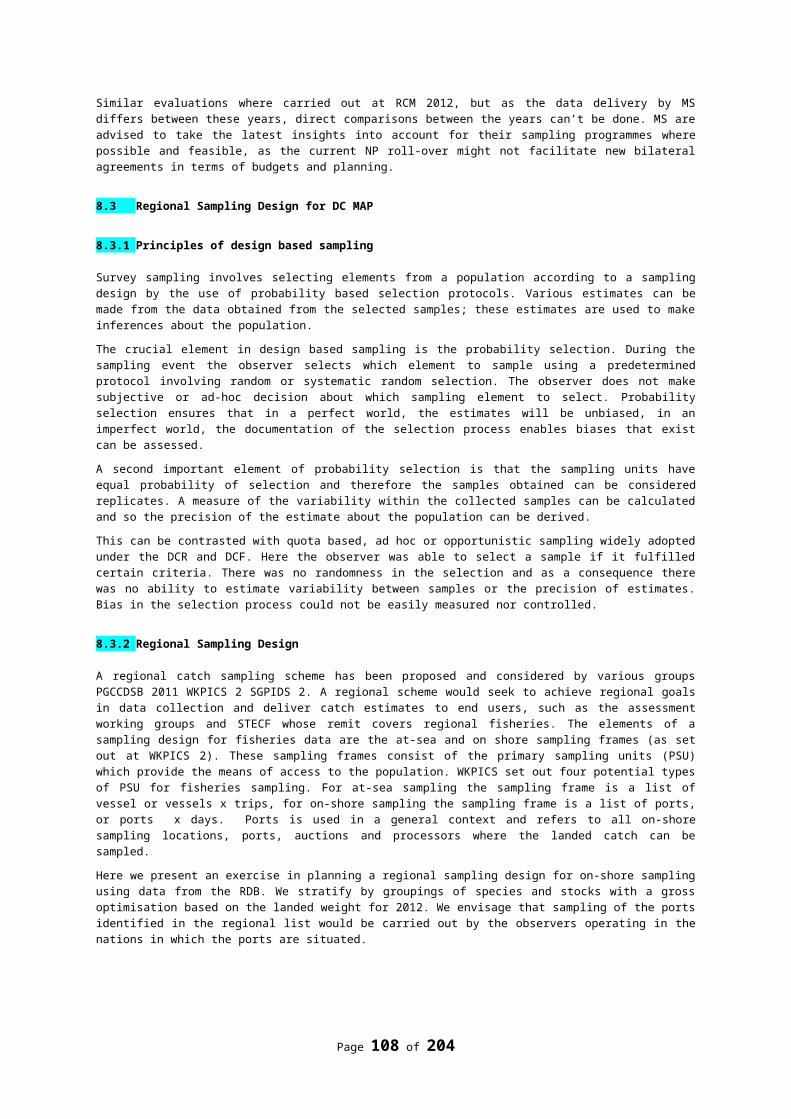
Quality assurance - Managed repository for RDB upload successes and data status reports
RCM NS & EA 2013 Recommendation 3
The RCM recommends that a system for administering and recording upload successes by Member States and a facility to provide a clear reference for data users on how complete the data is.Therefore, it recommended that a repository is implemented for giving data users direct access to: Up to date status reports on the contents of the
database. These reports need to be live and available for data users so that
data calls can be properly audited DB content can be properly interpreted.
Up to date guidance notes Up to date reference lists
Justification Knowing the status of the data is crucial for auditing purposes, for quality control and to determine how the data can be used. It also allows users, within reason, to account for missing data in their estimates or reports.Changes to guidance and reference lists can be communicated to data users with reference to the repository.
Follow-up actions needed SC-RDB to review and incorporate ‘off the shelf’ or develop an application to provide end-users with this functionality and a reference repository.
Responsible persons for follow-up actions
SC-RDB
Time frame (Deadline) Next SC-RDB meeting
Quality assurance – RDB additional fields and managing data gaps
RCM NS & EA 2013 Recommendation 4
RCM recommends an additional field in the core tables to identify the administration that has collected and or uploaded the data.
Justification Currently the country of landings or flag country is the only reference to the source of the data. But with bilateral agreements and most MS now sampling foreign vessels within their sampling schemes it is not always clear which country collected the data. This is crucial for auditing purposes, for quality control and to limit the opportunities for replication of data. This field is also required to allow data to be raised according to national sampling schemes.
Follow-up actions needed SC-RDB to insert a field to identify the source or origins of the uploaded data.
Responsible persons for follow-up actions
SC-RDB
Time frame (Deadline) Next SC-RDB meeting
Page 108 of 176
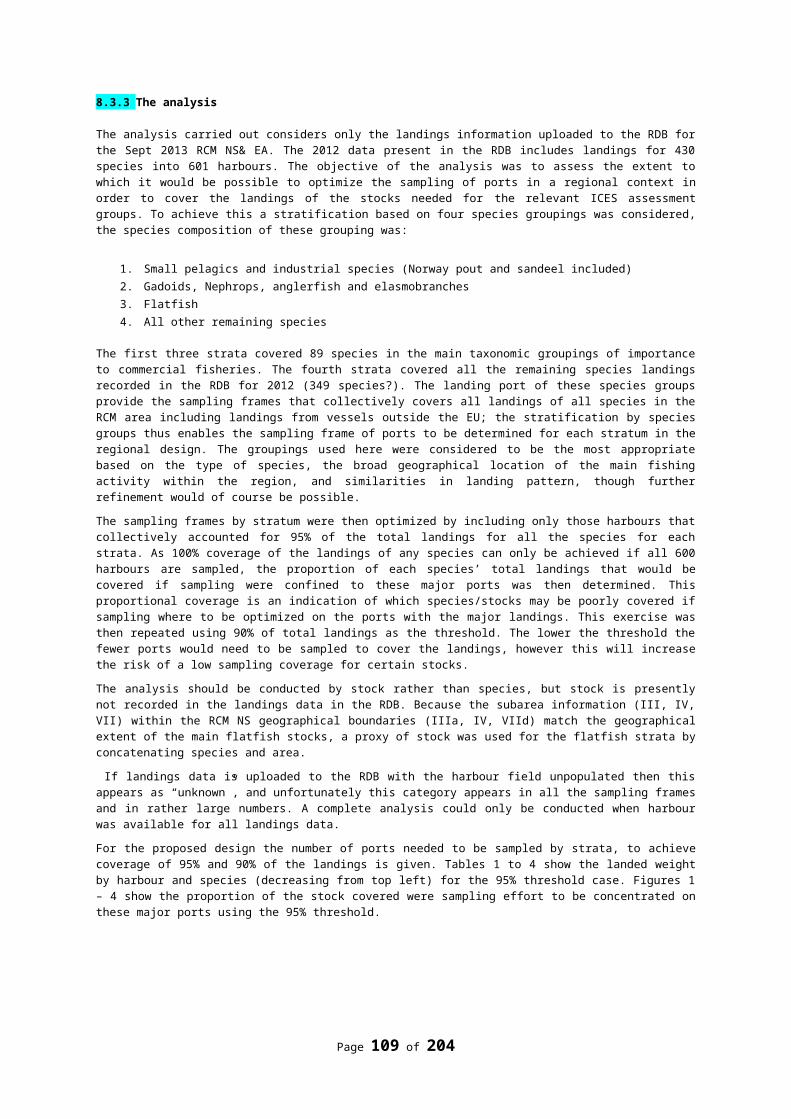
Regional Database: Code lists and Reference tables for regional data base
RCM NS & EA 2013 Recommendation 5
It is recommended that code lists and reference tables in the regional data base are comprehensive, unambiguous. Fields and appropriate standardized code lists are needed for: Harbour, Species, metier, sale location, sampling location (in the CS data), fish presentation (e.g. whole or partial), and data provider (i.e. who did the sampling and uploaded the data). In addition it is recommended that means of linking effort measures more directly with landed species is needed. Presently the CL and CE can only be linked by metier.
justification The design and implementation of design based sampling requires consistent coding of the data in all fields, and appropriate fields and relationships to be available in the RDB.
Follow-up actions needed RCMs and RCGs need to update reference listsThese lists should be implemented in the RDB. It should not be possible to upload data for ports and metiers outside the list without permission from the RCM chair. The updated table of metiers should take all metiers standardized and accepted by RCMs over the last years into account. Reference tables for species should match current standards as implemented for ICES databases like WoRMS.
Responsible persons for follow-up actions
Actualize the reference table ports-Marie Storr-PaulsenActualize the reference tables species: ICESReference table metiers - Els TorreeleSC-RDB to ensure implementation by ICES Secretariat as host of the RDB
Time frame (Deadline) End 2013
Quality assurance - Managed repository for RDB upload successes and data status reports
RCM NS & EA 2013 Recommendation 6
RCM recommends that MS document their interpretation of trips, samples and sampling events and describe what the TripID and SampleID represent in there uploaded data.
Justification The key identifiers for the biological data refer to trips and samples in most instances, for example on a discard trip each event is quite distinct but ashore where sampling might only focus on components or categories of a landing then this can lead to a different interpretation and achievements are therefore not directly comparable.Sampling events, trips and samples are crucial for auditing and monitoring sampling design and key to significant quality indicators.
Follow-up actions needed MS to provide a summary document of their interpretation of these key fields in the upload data formats.RCG to collate these documents for storing in the RDB repository (see earlier recommendation)
Responsible persons for follow-up actions
MS, SC-RDB
Time frame (Deadline) Next SC-RDB meeting
Page 109 of 176
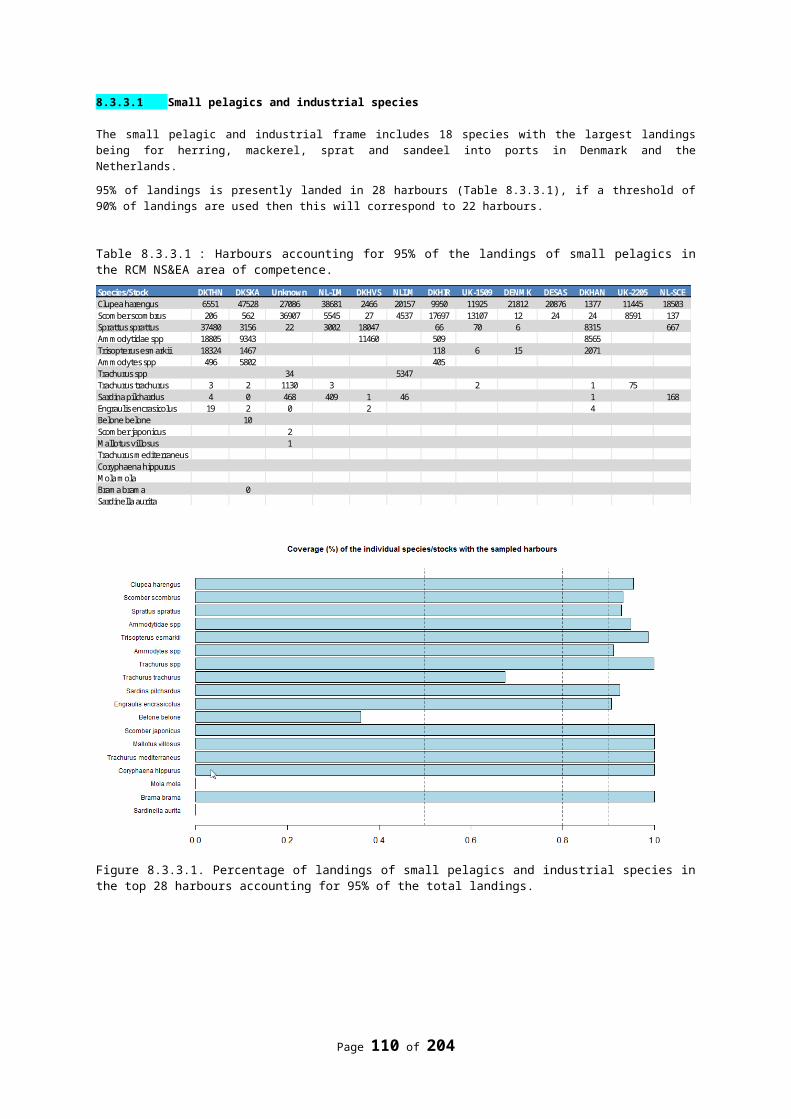
Quality assurance – surveys at seaRCM NS&EA 2013 Recommendation 7
The RCM recommends to develop a suite of diagnostics from which the quality of the (international) results of survey at sea can be assessed.
Justification MS and RCGs have a legal requirement to report on the quality of data collection carried out under the DC-MAP to the European Commission.
Follow-up actions needed Develop a toolbox with survey quality diagnostics, establish a process which applies and reports those.
Responsible persons for follow-up actions
ICES and other international organisations which coordinate DC-MAP surveys
Time frame (Deadline) before the implementation of DC-MAP (2016)
Towards a regional sampling scheme
RCM NS & EA 2013 Recommendation 8
RCM recommends that a ‘dry-run’ on the process from end-user participation to defining data needs and designing a regional sampling scheme is carried out during the roll-over years 2014-2015. The process itself, participating meetings and end-user specification can be used as specified by STECF EWG 13-02.
Justification Before adapting the current data collection management to a full regional approach, experience needs to gained on the future process. This will allow fine-tuning of the process prior to the full implementation and will thus allow for a quick start once DC-MAP is fully implemented.
Follow-up actions needed Commission to initiate and steer the processResponsible persons for follow-up actions
Commission and RCMs
Time frame (Deadline) 2014-2015
Page 110 of 176
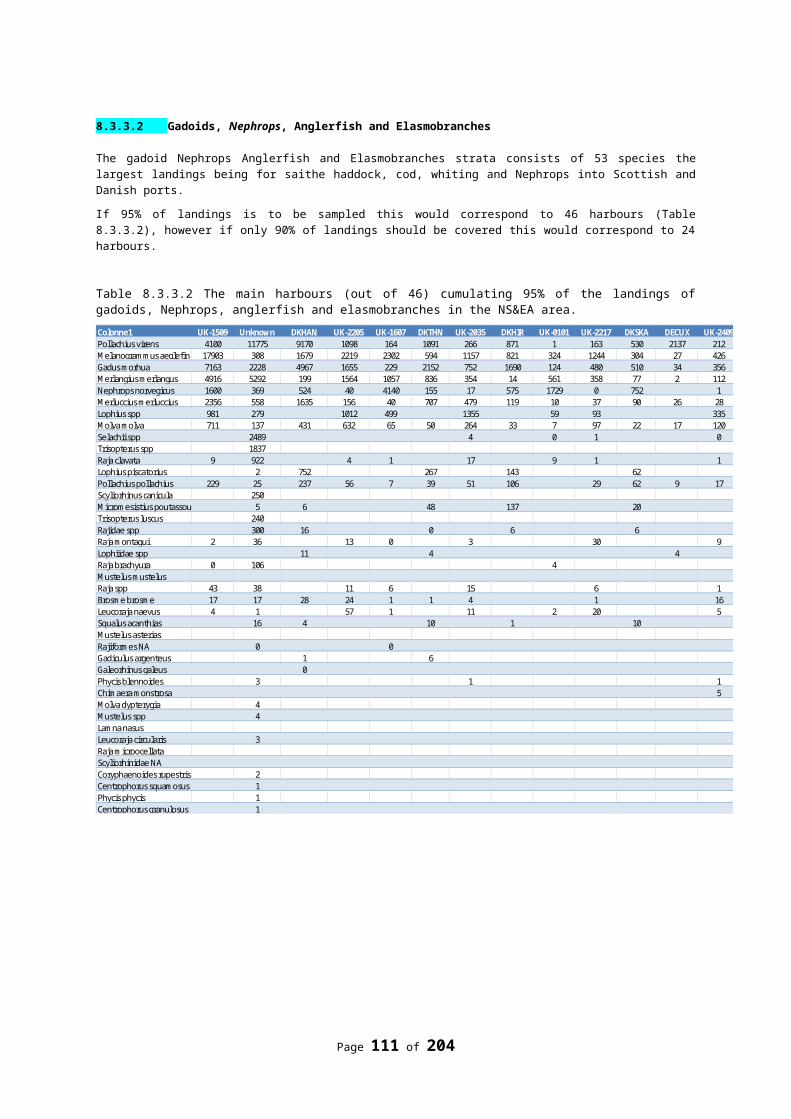
11. Glossary
AR Annual Report (of activities carried out by MS under the DCF)ACOM Advisory Committee of ICESASC Annual Science CommitteeAWP Annual Work PlanCE data exchange format for commercial effort dataCFP Common Fisheries PolicyCL data exchange format for commercial landings dataCOST toolbox for quality evaluation of fisheries dataCR Council ResolutionCRR ICES Cooperative Research ReportCS data exchange format for commercial sampling data; calcified structuresCV Coefficient of VariationDCF Data Collection Framework (follow up of DCR)DC-MAP Multi Annual Programme for Data Collection (follow up of DCF)DCR Data Collection RegulationEAFM Ecosystem Approach to Fisheries ManagementEC European CommissionEFCA European Fisheries Control AgencyEMFF European Maritime and Fisheries FundEUROSTAT Directorate-General of the EC which provides statistical information to the EUEWG STECF Expert Working GroupFAO Food and Agriculture Organisation of the United NationsFishFrame RDB softwareGFCM General fisheries Commission for the MediterraneanIBTSWG International Bottom Trawl Survey Working GroupICCAT International Commission for the Conservation of Atlantic TunasICES International Council for the Exploration of the SeaInterCatch ICES DatabaseJDP Joint Deployment PlanLM Liaison MeetingMFAQ Most Frequently Asked QuestionsMoU Memorandum of UnderstandingMRR Master Reference RegisterMS Member StateMSFD Marine Strategy framework DirectiveNA North AtlanticNAFO Northwest Atlantic Fisheries OrganizationNE North East
Page 111 of 176
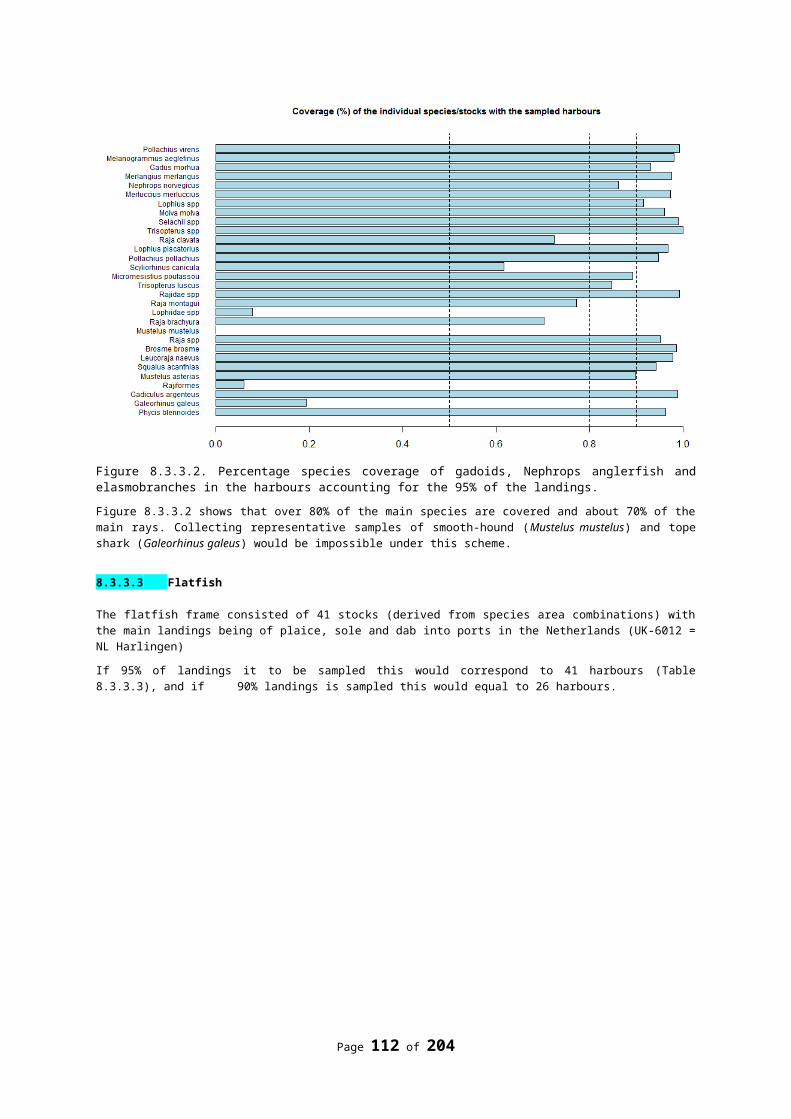
NEAFC North East Atlantic Fisheries CommissionNP National Programme (of activities carried out by MS under the DCF)NS & EA North Sea and East ArcticPG see PGCCDBSPGCCDBS Planning Group on Commercial Catches, Discards and Biological SamplingPGECON Planning Group on Economic IssuesPGMED Mediterranean Planning Group for Methodological DevelopmentPSU primary sampling unitsQA Quality AssuranceQC Quality ControlRCG Regional Coordination GroupRCM Regional Coordination MeetingRDB Regional Data Base (of the RCM)RFMO Regional Fisheries Management OrganisationSCIP Specific Control and Inspection ProgrammeSC-RDB Steering Committee Regional Data BaseSG Study GroupSGABC Study Group on Ageing Issues in Baltic CodSGMAB Study Group on Multispecies Assessment in the BalticSGPIDS Study Group on Practical Implementation of Discard Sampling PlansSTECF Scientific, Technical and Economic Committee for FisheriesTAC Total Allowable CatchVMS Vessel Monitoring System, satelite based system to locate vesselsWG working groupWGBFAS Working Group on Baltic Fisheries AssessmentWGBIFS Baltic International Fish Survey Working Group (ICESWGBIOP Proposal for new ICES Working groupWGCATCH Proposal for new ICES Working group on commercial catchesWGNEW Working Group on new MoU species
WGNSSK Working Group on the Assessment of Demersal Stocks in the North Sea and Skagerrak
WGRFS Working Group on Recreational Fisheries SurveysWGRS Working Group on Redfish Surveys
WKACCU Workshop on Methods to Evaluate and Estimate the Accuracy of Fisheries Data used for Assessment
WKACM-2 Second Workshop on Age Reading of Red Mullet and Striped Red MulletWKADS-2 Workshop on age Determination of Atlantic salmonWKAMDEEP Workshop on Age Estimation Methods of Deep Water SpeciesWKARBLUE Workshop on the Age Reading of Blue whiting
WKARHOM Workshop on Age Reading of Horse Mackerel, Mediterranean Horse Mackerel and Blue Jack Mackerel
WKAVSG Workshop on age validation studies of GadoidsWKBALFLAT BENCHMARK WORKSHOP
Page 112 of 176
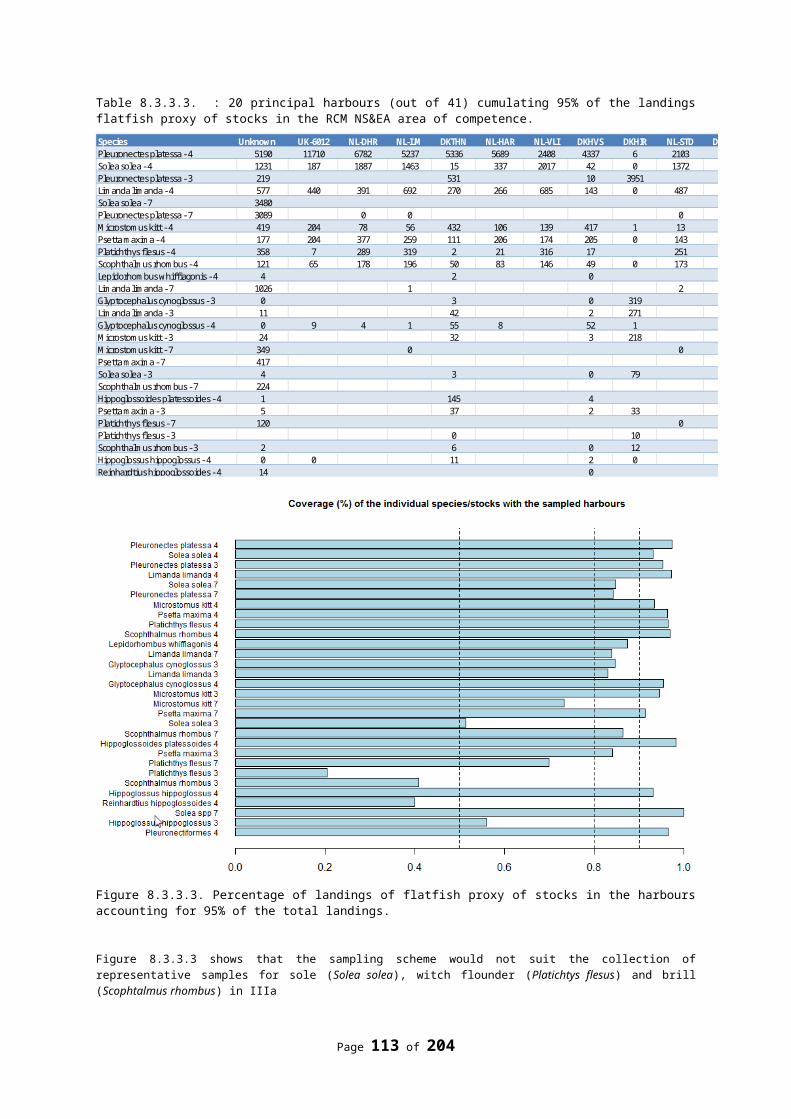
WKBUT BENCHMARK WORKSHOPWKCELT BENCHMARK WORKSHOPWKDEEP BENCHMARK WORKSHOPWKESDCF Workshop on eel and salmon DCF dataWKHAD Benchmark Workshop on Haddock stocksWKMATCH 2012- Workshop for maturity staging chairsWKMATCH 2012- Workshop for maturity staging chairsWKMERGE Workshop on methods for merging metiers for fishery based samplingWKMIAS Workshop on Micro increment daily growth in European Anchovy and SardineWKMSEL Workshop on Sexual Maturity Staging of ElasmobranchsWKMSGAD Workshop on sexual maturity staging of cod, whiting, haddock, saithe and hakeWKMSTB Workshop on the Sexual Maturity Staging of Turbot and Brill.WKNARC Workshop of National Age Readings CoordinatorsWKPELA BENCHMARK WORKSHOP
WKPICS Workshop on practical implementation of statistical sound catch sampling programmes
WKPRECISE Workshop on methods to evaluate and estimate the precision of fisheries data used for assessment
WKSOUTH BENCHMARK WORKSHOPWKSPRAT BENCHMARK WORKSHOPWP Work PackageWSSD World Summit on Sustainable Development in Johannesburg
Page 113 of 176
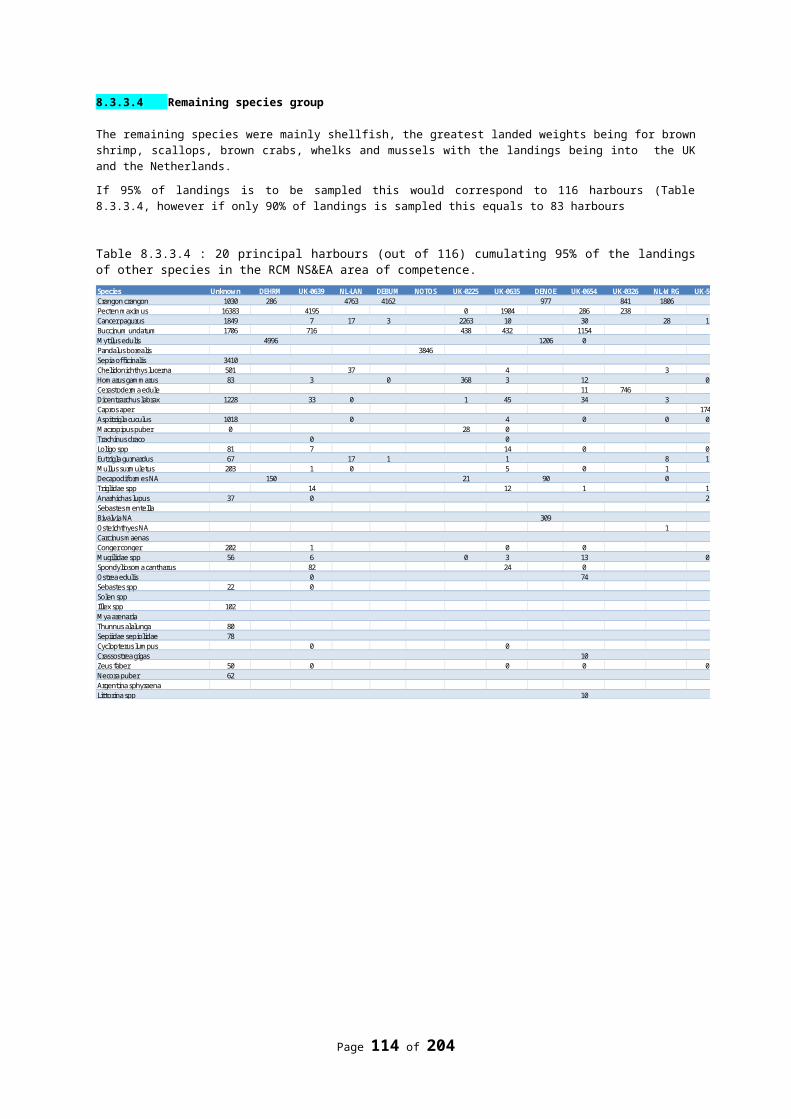
12. ReferencesCouncil Regulation (EC) 199/2008 of 25 February 2008 concerning the establishment of a Community Framework for the collection, management and use of data in fisheries sector for scientific advice regarding the Common Fisheries Policy
Commission Regulation (EC) No 665/2008 of 14 July 2008 laying down detailed rules for the application of Council Regulation (EC) No 199/2008 concerning the establishment of a Community framework for the collection, management and use of data in the fisheries sector and support for scientific advice regarding the Common Fisheries Policy
Commission Regulation (EC) No 1078/2008 of 3 November 2008 laying down detailed rules for the implementation of Council Regulation (EC) No 861/2006 as regards the expenditure incurred by Member States for the collection and management of the basic fisheries data
Commission Decision (EC) No 2010/93/EC of 2010 adopting a multi annual Community programme pursuant to Council Regulation (EC) No 199/2008 establishing a Community framework for the collection, management and use of data in the fisheries sector and support for scientific advice regarding the Common Fisheries Policy.
ICES. 2012. ICES Implementation of Advice for Data-limited Stocks in 2012 in its 2012 Advice. ICES CM 2012/ACOM 68.42 pp.
RCM NS&EA 2010. Report of the Regional Co-ordination Meeting for the North Sea and Eastern Arctic (RCM NS&EA) 2010. FINAL VERSION. DTU-Aqua Charlottenlund, Denmark. 17,21 May 2010.
RCM NS&EA 2011. Report of the Regional Co-ordination Meeting for the North Sea and Eastern Arctic (RCM NS&EA) 2011. Johan Heinrich von Thunen Institute (vTI), Hamburg, Germany. 26,30 September 2011.
RCM NS&EA 2012. Report of the Regional Co-ordination Meeting for the North Sea and Eastern Arctic (RCM NS&EA) 2012. Institute for Agricultural and Fisheries Research (Ilvo), Oostend, Belgium. 3-7 September 2012LM 2011: Report from the 8th Liaison Meeting 2011.LM 2012: Report from the 9th Liaison Meeting 2012.STECF 12-02 Review of the Revised 2012 National Programmes and on the Future of the DCF (EWG 11-09). Report EUR 25308 EN
STECF 12-07 Review of Proposed DCF 2014-2020 – Part 1 (EWG 12-2) Report EUR 25338 EN
STECF 13-01 Review of Proposed DCF 2014-2020 – Part 2 (EWG 12-15) Report EUR 25825 EN
STECF 13-06 Review of DC MAP- Part 1 (EWG 13-02) Report EUR 26095 EN
STECF 13-12 Review of DC MAP- Part 2 (EWG 13-05) Report EUR xxxxx EN
Page 114 of 176
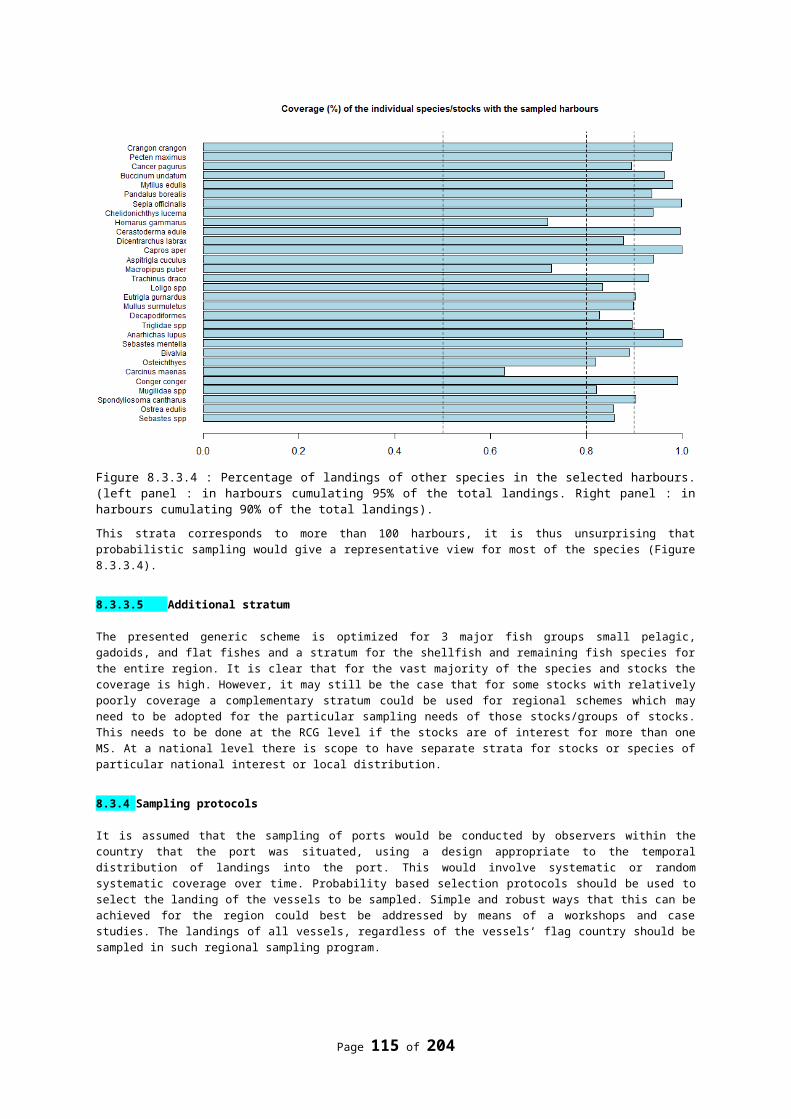
Annex 1: Comments made by the participants of MS on the draft DC-MAP2014-2020
Belgium
B2. Stock-related variablesThe recent ICES feedback should be fully considered in the further development of DC-MAP.
In an attempt to define the data needs that should be covered by the new DCMAP, it was advised and decided to take a top-down approach and to ask experts from the different regional advisory bodies to make an inventory of the 'advisory bodies' data needs. In so doing, attention will be paid, not only to the data requirements for the existing types of management advice that the advisory bodies are giving, but also to the likely future types of advice and their associated data needs.
In the SGRN 2006-03 Report, there was a first inventory of:5. The different advisory bodies6. The current and expected data needs as reviewed by advisory body, viz.:
- ICES, International Council for the Exploration of the Sea. - STECF, the European Commission's Scientific, Technical and Economic Committee on
Fisheries. - NAFO, Northwest Atlantic Fisheries Organisation. - GFCM, General Fisheries Commission for the Mediterranean. - CECAF, Fishery Committee for the Eastern Central Atlantic. - ICCAT, International Commission for the Conservation of Atlantic Tunas, and IOTC, Indian
Ocean Tuna Commission. - CCAMLR, Commission for the Conservation of Antarctic Marine Living Resources.
This list could be asap reviewed to accommodate the current end-users, as such the RCMs/RCGs are end-users as well.
CHAPTER III - REGIONAL COORDINATIONCoordination and cooperation
1) Member States shall coordinate their national programmes with other Member States in the same marine region and make every effort to coordinate their actions with third countries having sovereignty or jurisdiction over waters in the same marine region. For this purpose; Member States shall establish Regional Coordination Groups consisting of the relevant Member States, RFMOs, advisory bodies, other end users, third countries, and independent experts. The regional Coordination Groups shall assist Member States in coordinating their national programmes and the implementation of the collection, management and use of the data in the same region.
Remarks:
Commission is the body responsible to establish a regional coordination group, not the MS.
“The ….. For this purpose the Commission shall establish Regional Coordination Groups in order to assist Member States in coordinating their national programmes and the implementation of the collection, management and use of the data in same region. “
Suggested Members of the RCGs
EU representative Member states End user type 1, on invitation type 2 or type 3 Observers (industry, NGO): 1-2 Third countries: on invitation Independent expert: on invitation (topic related: topics can be
- Quality- Ranking
Page 115 of 176
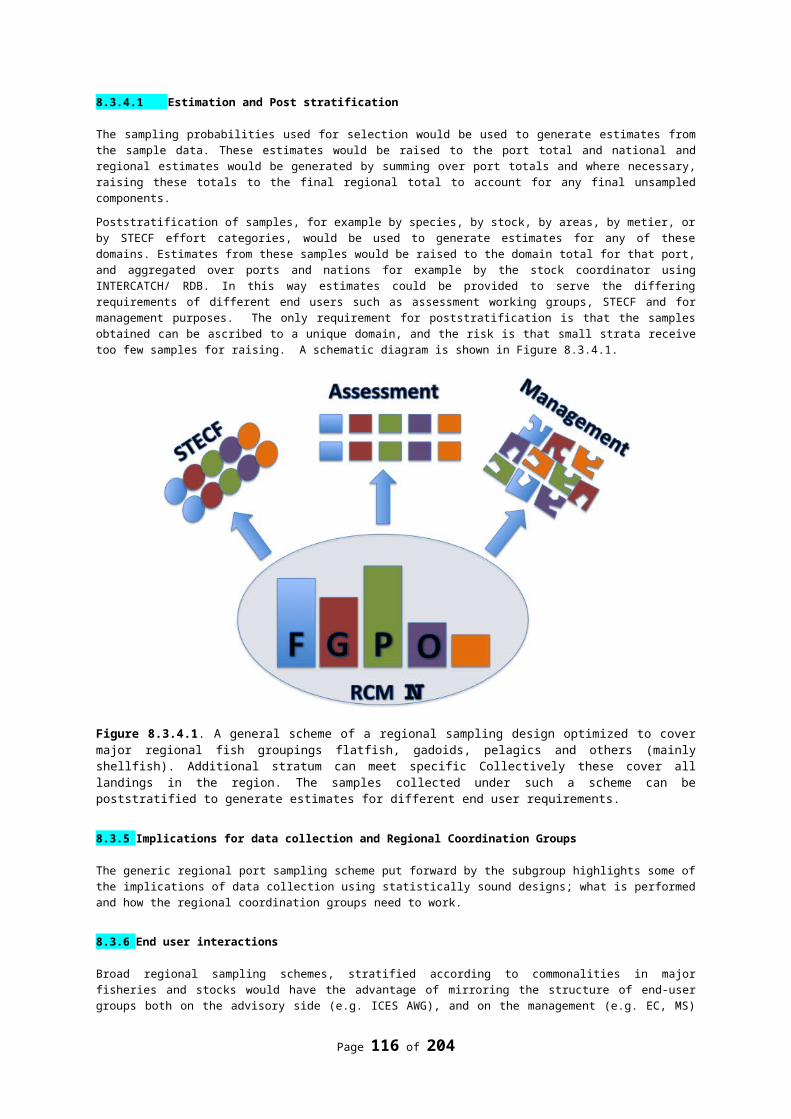
- Statistical sound sampling schemes et al
Role and set-up of RCG & intersessional work – link to RDB
- To design a full regional data collection programme is not achievable and not to recommend, for several reasons. The RCGs may rather try to improve the harmonization between MS. A regional target or objective can be defined.
- Sampling programme: the new RCG to evaluate and coordinate national sampling designs and their development. Protocols and methods should be open to discussions and improvements, through the RCGs and specific WGs. At present the methodology is described and written in the national programmes of the MS, but not discussed on a regional level. Need to be looked at in respect of the regional approach and the regional cooperation.
- Data quality assurance should initially be done on a national level. For several MS this is in progress and a document with the traceability and quality of the data will be available. All MS should do this and in the scope of the RCGs to be looked at/compared?
An annual meeting on data-storage could be organized in the near future. Such a meeting must have the following experts:
- scientists- end-users (type 1 on regular basis, type 2 and 3 when relevant on invitation)- database maintainers/database manager.
Such an annual meeting can be good tool to improve the compatibility between national data-systems, the quality of the data, the required formats for international databases like RDB, the exchange of expertise and knowledge.
At present: little bits and pieces of data storage in different WG. Every WG has at present a one-day discussion on the data used. Would be better if all data discussion is organized in an annual data storage meeting. If data are compatible, data can be “borrowed” to fill gaps and data shortages. An annual data storage meeting can be done under the umbrella of the RCGs??
RCGs – what to do in a RCG?- Evaluate the proposed National work plan (NWP) 20XX -2020 in relation to the required
biological parameters- Propose and agree modifications to the NWP to achieve the regional requirements - Evaluate the proposed Annual Work Plans (AWP) in relation to the regional requirements - propose and agree modifications to the AWP to achieve the regional requirements. - Share the views and advise MS on their proposed Annual Work Plans in relation to application of
rules of good practice - advise MS on their proposed Annual Work Plans in relation to application of rules of good
practice- Discuss on compilation of indicators to assess the importance of fishery and related activities at
the level of administrative areas - Produce an annual (?) data-call to the MS to upload data in the Regional Data Base (RDB)- Evaluate the data call RDB, identify gaps, feed back to the MS, and deliver guidance to MS- Rank the fishing activities on a regional level according to agreed criteria, in order to assess the
sampling responsibilities and agree on exemption rules - Contribute to the evaluation of the quality of the data uploaded in the RDB by MS . - Advice to further developing the RDB - Manage and evaluate bilateral agreements between MS - Update reference tables- Update database recommendations- Advice WGs/steering group on studies/project proposals- Different groups dealing with different regional topics are established and work intersessional.
Members of these groups are relevant experts from MS.
Road map RCG & RDB,
Page 116 of 176
To achieve the implementation of the role of RCGs, the RDB and the new processes with interaction of the end-users, a gradual implementation – stepwise approach is needed. The final objective and time frame can be defined within a road map. Different MS will have a different speed to adjust
A regional data collection programme should be possible. But this requires analyses, preparations, regional coordination and time to establish sampling procedures among national institutes. A stepwise approach seems recommendable. RCMs/RCGs are a good platform to develop a road map (e.g. requirements, steps to be taken, pilot projects, timing, mile-stones, ….).
Different sampling methodology, agreed upon by all MS in a region involved, could then be tested within the RCGs. As such, the harmonization between MS can be improved.
BUILDING BLOCK C : COLLECTION, STORAGE AND USE OF DATA BY MEMBER STATES
CHAPTER I - MULTI-ANNUAL NATIONAL PROGRAMMES
National co-ordination and co-ordination between the Commission and Member States
Role NCs:
Part of RCGs or outside RCGs?
The tasks and responsibilities of the National Correspondents need to be reviewed under DCMAP
NCs are at present participating in RCMs but it is not always clear what their “added value” is to the meeting; Initially NC needed to attend the RCM in respect of decision taking regarding bilateral agreements, exchange, derogations. For the future, the attendance of the NCs should be organized differently.
The NCs could have a separate two-day meeting (“NC Liaison meeting”),following up the LM meeting:
Day 1: regional and items related to the MS. The chairs of RCGs, PGECON, PGMED, PGCCDBS, SC-RDB et al present their items, topics et al. Bi-lateral or multi-lateral agreements could be finalized here.
Day 2: plenary session where all items are discussed and communication with EC.
As such, the NC will be informed properly about the regional program and the obligations for the respective MS.
Landing obligation:
Landing obligation to be introduced gradually over the number of years - there still is a need to continue data collection through the at sea observer program in order to obtain reliable discard data – as not all species fished will be covered by landing obligation (e.g. protected species) and there is no obligation to record in the logbooks all discards, even if legally allowed. In this context, the discard data obtained through DC-MAP could not be used as compliance and surveillance means under the Control Regulations, in order to maintain the data collection observer program separate and independent from fisheries inspection and thereby not undermine the trust between the industry and scientific community
Denmark
Denmark is welcoming and supports the DC-MAP approach and the suggestions given in the STECF EWG 13-05 report. This report in combination with the Commissions services Consultation Document is a good starting point for further work on establishing the new DC-MAP. The idea of establishing of regional sampling programmes is fully supported by Denmark. Furthermore, any initiative to promote task sharing in terms of e.g. collection of biological samples, otolith age determination, bilateral- or multilateral research vessel surveys will be welcomed by Denmark.
The suggestion on more open access to DC-MAP data will probably improve the use of the data and thereby improve the quality insurance of the data. To have more open access to data and at the same time that the confidentiality insurance have to be strict will be a challenge for all MS as it requires that data from one cannot under any circumstances be extracted from the data base without being aggregated with at least 3 or more vessels. This will be very challenging.
Denmark finds it important that data to be used for the DC-MAP work but collected or recorded according to other regulations should be at a quality required. If the quality of these data does not meet the
Page 117 of 176
required level double data collected should not be accepted. Instead the regulation concerned should be amended or revised. Otherwise double work will be the consequence.
The implementation of the landing obligation (Basic Regulation article 15) will without any doubt have significant consequences for DC-MAP work. How the landing obligation will be implemented in the various MS as well as the level of compliance to this obligation is not known. Denmark is having concerns that this may jeopardize or postpone further development of the DC-MAP.
Estonia
In general, Estonia is welcoming the progress made in the movement towards DC-MAP. Observations and remarks on the documents ware presented in more detail during RCM Baltic. One of them relates to North Sea and Eastern Arctic and concerns the placement of NAFO areas. We want to keep it together with this RCM and not with North Atlantic. Otherwise Estonia would have to participate in both RCMs – North Sea and Eastern Arctic for Barents Sea and RCM North Atlantic for NAFO areas.
Concerns are about RDB-FishFrame 5.0 being the best fit or cost effective solution for regional data collection.
Netherlands
Consideration should be given to the balance between obligations in DC-MAP and the available resources in the MS. The budgets to carry out data collection in most MS are constraint and have been or will be reduced as a consequence of the economic crisis. Also the financial support by the EMFF is fixed for the period 2014-2020 and is reduced compared to the support in the DCF. The flexible approach in the DC-MAP in redefining sampling needs requested by end-users encompass the danger that sampling demands will increase without consideration of the resources. Eventually this will lead to a situation that MS will need to prioritize themselves. This will have consequences for the quality of the data on a regional scale. Attention needs to be given to continuity and priority.
The DC-MAP needs to address the approach to data collection for eel and salmon. These data needs for these species differ from most marine species. Part of the data collection for these species is carried out in fresh water. Also, the European eel stock is subject to a national recovery plans which are different in all MS. Consequently, data needs supporting the recovery plan differ between MS.
The DC-MAP should give the regional data base a legal status. The RDB has a prominent role in coordination of the data collection, planning sampling strategies and evaluation of the quality of the data on a regional basis. Also attention should be given to the access rights to the RDB. Although there are general principles to be respected to the access of information, these do not have to apply through all sources where data are stored.
The DC-MAP should identify the tasks of the RCG, the membership of the RCG and the role of the different type of members in the RCG. Starting point should be that coordination of data collection can be carried out in a efficient way.
Poland
The ICES feedback on DC-MAP is a very important input to the process of setting new data collection scheme and shall be given full consideration in designing DC-MAP.
Consultation Document prepared by the Commission and STECF EWG 13-05 Report are both very welcomed by Poland as a good starting point in the process of transferring from current DCF to future DC-MAP. There are still a lot of issues to be solved and clarified as we are just on the beginning of the process.
Setting the sampling program at regional level is a preferred option.
Issues, which could be MS-specific but require careful attention include: Extending aquaculture data collection to freshwater – given the number and variety (in terms of
legal status, size, target production) of freshwater inland aquaculture sites in some MS, the potential increase in workload and overall cost of data collection raises concern,
Introduction of EMFF as funding source for data collection through the Paying Agency can create a number of problems due to a complex internal procedures applicable for programs co-financed by the EU,
Page 118 of 176
It is still unclear the format of Annual Workplans and Annual Reports and what procedure will apply with regard to the adoption/acceptance of Annual Reports (who will have the final say – EC or funds provider?),
Landing obligation to be introduced gradually over the number of years - there still is a need to continue data collection through the at sea observer program in order to obtain reliable discard data – as not all species fished will be covered by landing obligation (e.g. protected species) and there is no obligation to record in the logbooks all discards, even if legally allowed. In this context, the discard data obtained through DC-MAP could not be used as compliance and surveillance means under the Control Regulations, in order to maintain the data collection observer program separate and independent from fisheries inspection and not to undermine the trust between the industry and scientific community.
By-catch of protected non-fisheries species – the option one provided in the STECF EWG 13-05 Report, to cover the monitoring of this by-catch within the framework of DC-MAP, seems more practical to apply given the resources available as compared with option two providing for dedicated sampling program.
Germany
In the STECF EWG 13-05 report (Annex 1, Chapter I: 4. Catch data, 5. Effort data), additional data collection under the DC-MAP is suggested in cases where the quality of the data recorded according to the Control legislation is deemed not to meet the DC-MAP requirements. It is, however, not clear yet what the DC-MAP requirements exactly are and who will decide on the match or mismatch of these requirements with data collection or recording systems. Particular concern exists about the financial effort of additional data collection, considering that Article 37 of the CFP Basic Regulation prescribes that duplication of data collection for different purposes should be avoided. In this sense, it should be emphasized that the EWG 13-05 report (section 4) notes: ‘Before such a step is taken it should be investigated if it is possible to improve the quality in the primary data source.’
Eel and salmon data collection: An expert group should be set up to filter the ICES WKESDCF recommendations and to suggest data collection requirements in relation to end-user needs.
Further detailed comments on the EWG 13-05 report and the Consultation document are given in the RCM Baltic 2013 report.
Spain
This text compiles the position of the various units involved in the collection of basic data of the fisheries sector in our country, under the coordination of the Fisheries Resources Unit as “DCF National Correspondent”.
We highlight the financial resources that the European Union intended to cover DC-MAP proposal, under new European Maritime and Fisheries Fund (EMFF) will determine the scope of statements and the Spanish position in the debates.
Therefore the proposal presented should adapt realistically available budget, ensuring the best fit between the priorities and objectives of the new CFP and financial availability.
We support the need to ensure harmonization in the collection of data, avoiding duplication of them, taking into account that the standardization will allow streamline work and reduce administrative burdens
Transversal variables
We should avoid any duplication in the collection of the information. The data obtained from the Control Regulation are sufficient to meet the requirements of the data collection. Internal coordination in each Member States should ensure the availability for scientific purposes. However and in order to ensure the proper use of available resources and avoid duplication in the tasks of obtaining, these variables should be removed, with the level of aggregation which guarantees the principles of confidentiality, of the control regulation.
We reminded that as established in Control regulation, for those Member States with a system of sales notes is not necessary to have control plan for vessels without logbook obligations.
Biological Variables:
Page 119 of 176

The EWG 13-05 bases their comments in this point on the ICES’ consultation response on end users needs. GFCM and others end users would have to specify their own needs.
Metier related variables
Documents do not delve into the establishment and definition of quality objectives that will be used in the size samplings due to the lack of consensus in last years. Therefore a wide consultation to all actors on the objectives and the indicators selected is required. Guidelines for best practice in design and implementation of statistically sound catch sampling schemes must be developed in an Expert Working Group.
Discards
it will be an important issue in the next period, therefore obligations in this regard should be clarified within the framework of data collection.
It seems that the level of precision in the case of discards remains as level 1. However this level cannot be achieved in the majority of species without an increase in the number of sea days. So it is necessary to check this value.
This issue has been discussed in the SGPIDS (ICES) proposed the use of "quality indicators" instead of CVs.
Research Surveys at Sea:
Flexibility in campaigns according to needs is compulsory, but in any case with enough planning, which perhaps not may be ensured with annual reviews.
We support the existence of lists of research surveys proposed by regional groups as a first step. However, it is essential to ensure that the campaigns of that initial list, addressed to equitable distribution that allows obtaining different stocks data, avoiding the concentration of such campaigns in unique regions. The Group would consider if the proposed campaigns comply with previously established objective criteria and meet the needs of end users, and having a cost- efficiency analysis.
However, the final decision on eligible campaigns should be taken by an independent Committee (STECF).
Aquaculture and recreative fisheries:
Possible extensions in this regard should be based on regional considerations. Member States must have the choice for planning pilot studies on species or regions with greater impact of this activity.
Any other alternative, especially in the case of continental aquaculture would mean a cost increase not avoidable. The variability of species, exploitation and distribution models would in our case extremely complex for the compilation of detailed information, apart from those compulsory by other regulations.
In addition it is necessary to know the real needs of the end – users.
By-catch
If the studies of by-catch should comprise all type of species (mammals, birds, invertebrates….) the cost will be very high. Commission, end users and MS should clarify the limits of these studies.
On the other hand, we agree with the option I on monitoring by-catch (to sample by-catch of mammals, birds and turtles in existing sampling programs of observers on board)
End users:
It seems that the needs of the end-users can direct the future DC-MAP, it is therefore necessary to define those needs. Member States should be able to express their opinion about the needs of the end users and, when duly justified, modify them.
End-users and their access level to information must be clearly defined. It is compulsory to ensure confidentiality and anonymity of information thus requires it, taking into account the type of data and the level of aggregation, and imposing resources that guarantee the security and access to information, mechanisms for granting access, profiles and permissions definition of end-users and acceptance of them and review criteria.
Page 120 of 176
Also must be specific provisions to define time limits for specific information, respecting as far within three years in the case of information susceptible of scientific publication and also establish a minimum time to provide data since they have been compiled in order to guaranteeing a correct analysis.
Economical and Social Data.
Close contact with EUROSTAT is essential to avoid duplication. The statistical processes of the future DC-MAP must have precise and uniform definitions and fix frameworks, populations, sampling units, variables... The sample design must be done in order to achieve the objectives, and for that it is essential to define populations and the used stratifications. All classifications used must be perfectly defined and consistent with existing international classifications (ex: level 5 Metiers).
Other criteria to take into account:
Stratification used in biological and economic data must be compatible to allow comparisons. Clearly define the difference between "indirect subsidies" and "direct subsidies" taking into
account the provisions of the European system of accounts (ESA-95). While it is intended to emphasize in employment issues with new variables, is not taken into
account all activities in fishing companies (example: land staff). The economic data are collected annually in the year following the period of reference, so it will
be available at the end of it. In Spain continental fishing is recreational, non-professional. Only it is possible to collect the variables of aquaculture species if the study population is
classified by species of production. Many establishments produce different species with different life cycles. This means differences in conversion factors and that therefore the products only can be accumulated by monetary terms.
In the case of variables related to industry, information collected by Eurostat should be taken into account.
Sweden
The report is easy to read and gives, for the first time in the review process, a clear indication on what the DC-MAP may look like, including details listed in appendices.
It´s also nice to see that the ideas and recommendations from meetings held the last years in the review process has been included and somewhat concretized. In particular is it nice to see that details on how sampling should be carried out has been replaced by references to good practice and design based sampling. However, it is not straight forward to comment upon the report and the main reasons are:
The report cover only parts of the foreseen DC-MAP and it is unclear how the suggested text fits with approaches on end-user interactions on what data to be collected, flexibility in data collection and a regional approach to data collection since these parts of the DC-MAP are not covered by the report.
It is not clear if the text in annex 1 is a suggestion for a legal text or suggestions for contents that should be in DC-MAP, i. e should the comments cover what is not covered by the text or not?
CHAPTER I – TRANSVERSAL DATA
In general, the overall intentions in this chapter, to make data available and avoid duplication of collection of data are of cause fine.
However, the control regulation which is suggested to be the main source for collection of transversal variables do not match the present DCF in all it´s details, it is also unclear how the control regulation will be amended as a consequence of the new CFP. For example, Discards needs only to be registered if they exceed 50 kg by species and trip.
In the Swedish Skagerrak fishery this means that there is a requirement to report less than 1/5 of the encountered species. This may have implications for the availability of data on protected species, elasmobranches and stocks of small sizes.No of species DCF CR
No of hauls mean max min mean max minSWE_OTB_CRU_32-69_0_0 104 17 31 4 3 7 0SWE_OTB_CRU_32-69_2_22 30 13 27 6 1 4 0SWE_OTB_CRU_70-89_2_35 72 13 22 5 1 3 0SWE_OTB_MCD_>=90 91 15 22 6 2 6 0
Page 121 of 176
The overall weight of discards is not impacted the same way as the obligation to report covers the species that constitutes the bulk of the discards.
-50
0
50
100
150
200
250
300
350
400
0 50 100 150 200 250 300 350 400
CR
DCF
Kg discards - sea-sampling
Another example is that limited information is required for vessels that do not carry logbooks. In the present DCF MS are obliged to collect information on effort and catches for vessels not carrying logbooks. In the control regulation (article 16) MS are obliged to set up a sampling plan. Submitted sales notes may however be used as an alternative of a sampling plan. In article 65 there are however exemptions from requirements for sales notes (e.g. people are allowed to buy 30 kg fish for personal use). In Sweden where there is a national logbook for vessels not carrying a logbook, less than half of the catches are from those vessels found in the sales notes. In the sales slips, no information are required on gears etc.
The suggested text releases MS from collecting a lot of the information that is required in the present DCF. To collect information on small vessels on the basis of the CR may affect the accuracy/ availability on data needed to the assessment of species caught by this part of the fleet and to perform socio economic assessments for this part of the fleet
Remarks:
1. In cases when catch data is not sampled by EU logbook, we suggest that it should be stated that the MS is responsible for present the quality of the data collected. The End- users are responsible for specifying the data needs.
2. In text (CH I 2.a and 3.a) it is stated that some data …”are made available” . The question is – made available to who ? Is it end-users, Commission. Institutes involved in DC-MAP, anyone ? This should be more explicit in the text.
3. Catch, effort, VMS data should be compiled and made available on a metier basis. It is not mentioned in the text and should be included in all sections.
4. Access to “vessels” is missing in text in 1.a
CHAPTER II - DATA REQUIRED FOR ASSESSING THE STATE OF EXPLOITED MARINE BIOLOGICAL RESOURCES AND THE IMPACT OF FISHING ACTIVITIES ON THE MARINE BIOLOGICAL RESOURCES
A. Biological variables
In general, the suggestions giving for this section in the appendices is promising. It becomes clearer how the new tables could look like. The recent ICES feedback should be fully considered in the further development of DC-MAP.
However, some important parts are missing. We would expect to find a text which clarifies how regional coordination and flexibility should work in the DC-MAP and some clarification of the difference between core – and optional variables. Is the flexibility based on optional variables ?
Page 122 of 176
We suggest further that a section is included where the benefits for the MS of establishing good regional cooperation are stated. (e g to establish minimum levels of sampling on MS level which can be taken off the MS responsibility if regional cooperation is set up… )
The interactions between RCG and end-users should be clarified and stated in the text
1. Variables to collected – Commercial fisheries 2. a Does it refer to landings or catch ?2. Exemptions 2. e The threshold of 200 tonnes should go out (to avoid non sampling of stocks like
cod Kattegat) 3. Exemptions 2. e) Text about foreign landings should not be included in the legal text….4. 2.f consideration of métiers is not linked to the rest in an appropriate way.
Salmon and eel
The data needs for eel and salmon is not addressed in the report because of time constraints. ICES workshop on eel and salmon DCF data (WKESDCF) held in July 2012 had the key tasks to determine data requirements, describe adequate monitoring and survey programs, and consider options for integrating salmon and eel data collection. The WKESDCF report explains needs and provides important recommendations for improvements and coordination of the data collection of salmon and eel in both the Baltic Sea and the Arctic. Very little coordination or cooperation has been achieved and very little data are available for considerable parts of the area; It is generally acknowledged that international coordination and standardization are urgently required, and for this, further initiatives will be required .
CHAPTER IV – DATA REQUIRED FOR ASSESSING THE SOCIAL AND ECONOMICAL PERFORMANCE OF FISHING, AQUACULTURE AND PROCESSING SECTOR
B. Economic and social data required for assessing the performance of the aquaculture sector
In general the text in the report reflects the discussions and the suggestions made by PGECON and STECF EWG, which is fine. We support the idea of conducting pilot studies before introducing new variables (social variables) and set periodicity of sampling to every three years. No major comments to add.
Outstanding issues:
Since the direction of the new fisheries fund (EMFF) will be different in different MS, it is important to include” investment subsidies” among the variables, to create a link to the policy outlined in EMFF.
Some MS may choose to keep the structure of the current fund with all the different types of investment subsidies available. Other MS (e.g. Sweden) may choose to reform the type of investment subsidies in the policy package. A pilot study on the comparability between different investment support schemes is suggested.
C. Economic and social data required for assessing the performance of the processing industry
In general the text in the report reflects the discussions and the suggestions made by PGECON and STECF EWG. It is still unclear if and on what level the sampling of processing industry will be included in DC-MAP.
Portugal
Since PT participate in 3 RCMs and this item concerns the general aspects of the DC-MAP, cross all RCMs, PT will present its comments at the RCM NA (16-20 Sep), in which it will participate with its NC.
UK
BUILDING BLOCK B : COMMON CORE DATA COLLECTION PROGRAMME
(1) Module of evaluation of the fishing sector:
(a) Section for the collection of economic variables
UK information in collected by the Seafish Industry Authority (Seafish) and they are actively involved in review of DCF data through STECF participation. No particular issues with DCMAP are highlighted.
Page 123 of 176
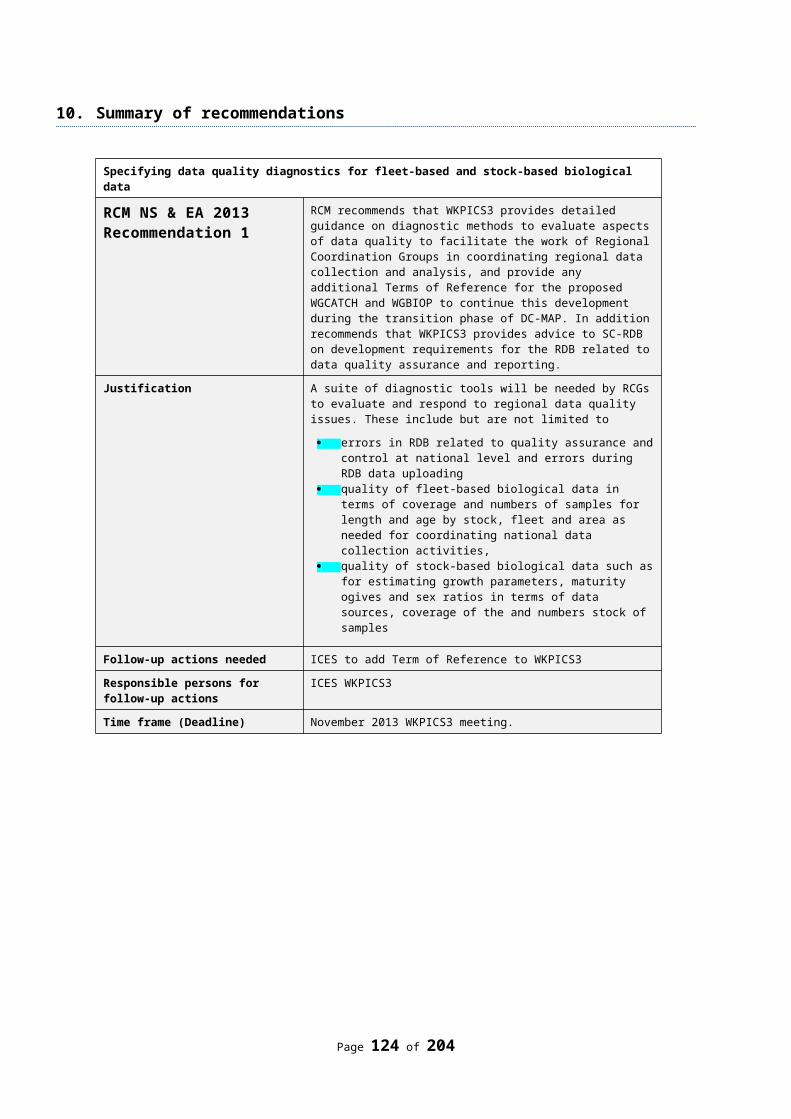
(b) Section for the collection of transversal variables
There’s a clear need to ensure that DC-MAP, Control Regulation and statistical reporting requirements are harmonised, that data collection is not duplicated, that common data standards and formats are used wherever possible (including for other areas)
Coherence between the Control regulation and DCMAP requirements is of significant importance for the UK. It has not always been possible to provide complete information for data calls, notably on various effort measures. There is some suggestion that whilst some of these data were requested by the STECF they have not been used. The UK intends fill in gaps in data collection under the extant programme through surveys and modelling.
The assertion made in the EWG-13-12 report that DCMAP should avoid prescribing what transversal data should be collected, but concentrate on data availability is welcome. Less welcome is the suggestion that where Control Reg. data availability/quality is insufficient to meet DCMAP needs, the requirement can be included under DCMAP. This does not appear to represent an improvement over the current situation.
(c) Section on metier-related variables
The UK welcomes the move to design-based sampling that was apparent midway through the current DCF programme and away from quota-based sampling of metiers, so it is of great concern to see emphasis in the consultation document being placed on the latter. A large part of Block B seems to have been ‘lifted’ straight from Decision 2010/93 which is widely recognised to be inappropriate and in conflict with the move towards design-based sampling. In fact, most of Block B and D seem to have been derived directly from Decision 201/93 and are thus deemed to be inappropriate in terms of the biological data collection requirements under DC-MAP
(2) Module of evaluation of the economic situation of the aquaculture and processing industry sectors:
(a) Section for the collection of economic data for the aquaculture sector
The UK has had difficulty meeting the current requirements for aquaculture economic data collection and is undertaking a study to inform the best way to do this. Early results indicate problems with data supply as there is no legal requirement to provide this. The study looked at marine aquaculture principally but it is expected that experience gained can be applied across the industry.
We recognise the increasing importance of aquaculture within the EU and the rationale for extending economic data collection to freshwater production. However this is likely to add a significant data collection burden to the industry, particularly in England where the majority of UK freshwater production occurs and with a relatively large proportion of smaller producers.
Data collection should continue to be through at business level. Provision of information on numbers and location of production units may be possible but splitting economic data by these (if required) will be more problematic.
Data collection thresholds, as applied through the Farm Accountancy Data Network, will help ameliorate any impacts of changes to requirements.
As regards provision of spatial information, this should be addressed in the context of information required under the INSPIRE directive. There appear to be unresolved confidentiality issues which may prevent this being made available.
(b) Section for the collection of economic data for the processing industry
UK information in collected by the Seafish Industry Authority (Seafish) and they are actively involved in review of DCF data through STECF participation. No particular issues with DCMAP are highlighted.
Fiche - By-catch of non-fishery species
Whilst the stated aims of inclusion of this requirement under DCMAP, as a consolidation and reinforcement of existing requirements, seems supportable we are concerned that previous data collection has not been enforced. We are unclear on how moving the requirements into DCF will increase compliance.
Page 124 of 176
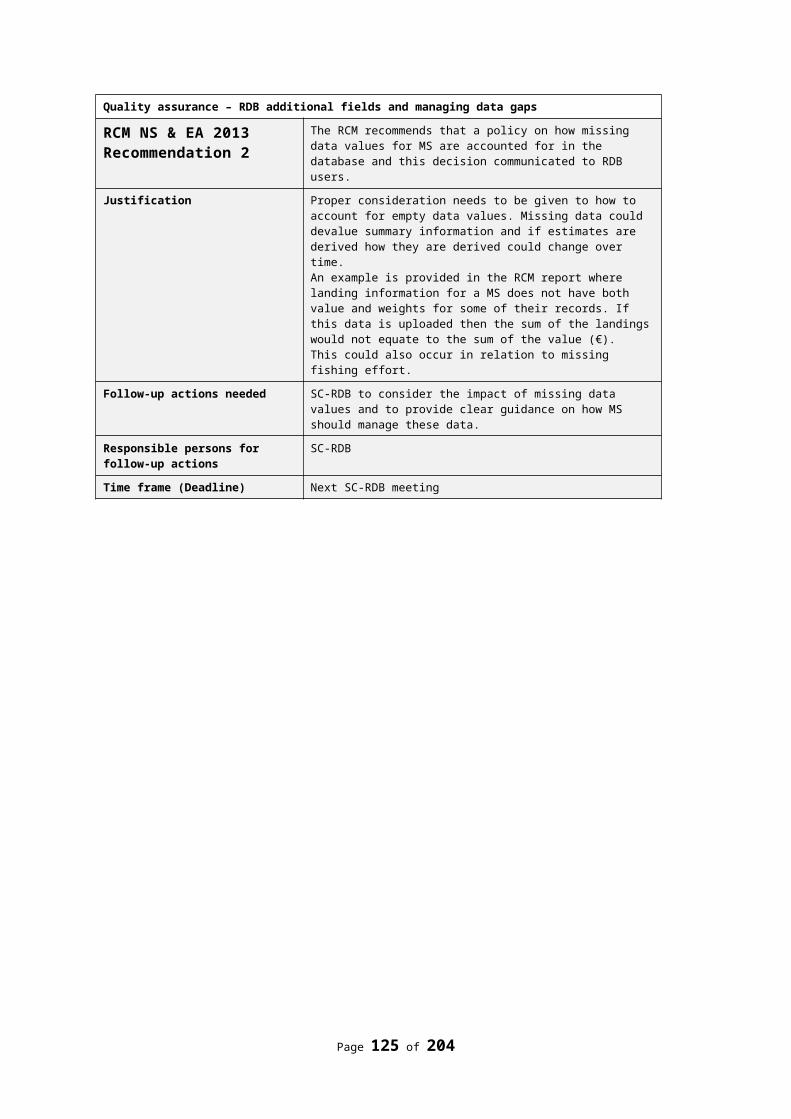
There is a further concern that this could lead to a requirement for at-sea sampling of some fleet metiers under the DCF that are currently excluded due to low discards of finfish or crustacea.
Fiche - Socio-economic data
The Commission made a good case for the need for social information however, the precise requirements were unclear and collection of some variables (ethnicity) was questionable. We agree with the opinion of both PGECON and EWG 13-05 that before social data are included in the new DCMAP a pilot study should be conducted how data should be collected, which data are available through common sources and what are the applications/end users and requirements. In the UK, Seafish are already collecting some of the information suggested for collection (e.g. training).
(3) General comments on the reports of DC-MAP 1 and DC-MAP 2(a) The UK welcomes the move toward design-based sampling for biological variables in
commercial fisheries;(b) The modus operandi whereby new data collection obligations are considered (and existing
ones reviewed for discontinuation) seems more fitted to expanding obligations than maintaining them at sustainable levels. Other than a reference to cost and affordability, there is nothing to say that “new work in must be balanced by old work out”. We cannot write a blank cheque for increasing obligations set against static or reduced national resourcing (financial and personnel);
(c) The proposal for different classes of research vessel surveys is okay, but there needs to be a clearer perspective on how surveys will be added/removed from the various lists;
(d) More use must be made of ICES planning groups to coordinate collection of biological data. For example, the IBTS WG is well placed to coordinate sampling of fish weights, maturities etc., but at the moment each Member State seems to operate its own schedules rather than a properly coordinated one;
(e) The Commission must redouble its efforts to ensure that Member States understand the role of data collection under EMFF and the need for Member States to ensure that its distribution of EMFF funding for data collection is commensurate with the obligations placed on it through DC-MAP and the MRR;
(f) It is not clear that the wording in the consultation document or the DC-MAP reports sufficiently addresses the need to share primary data between control agencies and the national scientists responsible for DC-MAP data collection within the same Member State. If the control authority does not consider the national scientists to be a part of its Member State’s Competent Authority, sensu the control regulation, then the control regulation needs to be revised to oblige that recognition. Otherwise some Member States’ scientists will continue to struggle to get access to primary data from their control authorities.
Page 125 of 176
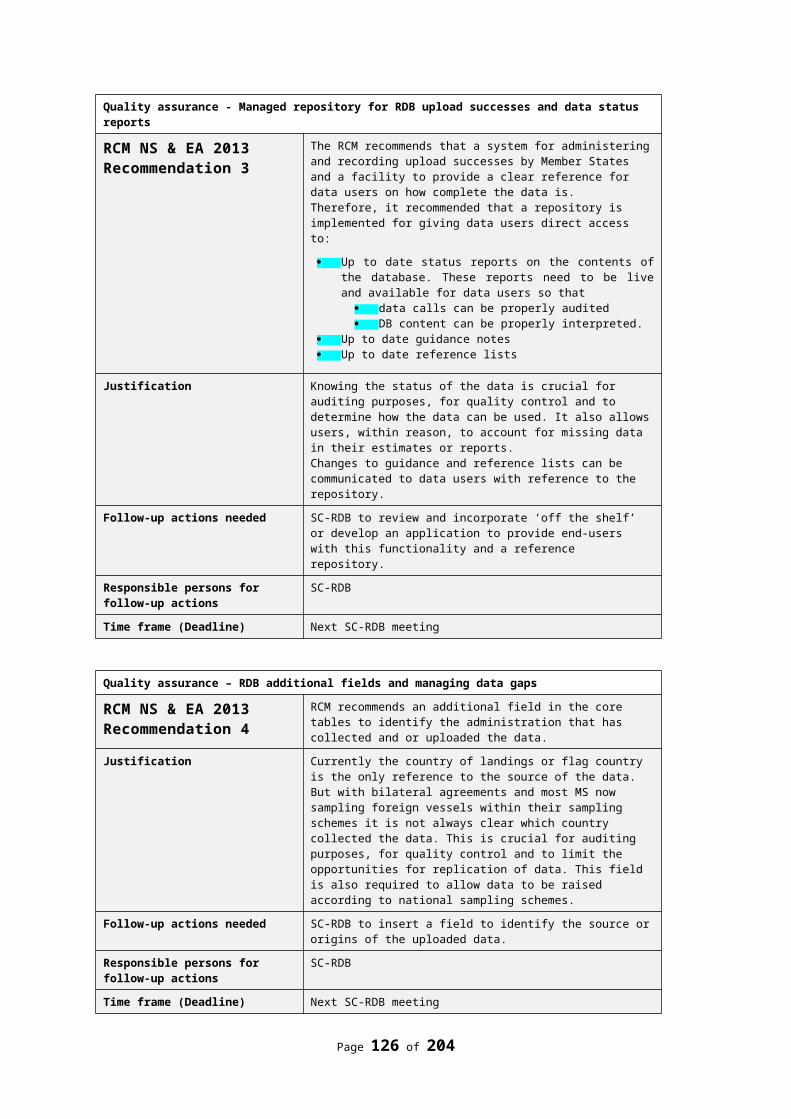
Annex 2: Proposal for data collection for eel and salmon assessment in UK as part of the DC-MAP
For attention of: UK National Coordination Meeting to be held in Aberdeen in August 2013, [and North Sea and North Atlantic Regional Coordination Meetings to be held in September 2013.]
Note for the two RCMs: – the data collection programmes for both eel and salmon need to be common between the two regions, because eel and salmon resources are distributed and assessed across both regions. There has been no attempt as yet to coordinate data collection methods amongst Member States within or among regions. Although the data requirements are common, the practical methods to collect these data may vary within and between Member States, depending on local conditions and logistics.Background
The following is based on the recommendations of the ICES Workshop on Eels and Salmon DCF Data 2012 (WKESDCF), and the subsequent review and recommendations of WKESDCF by the STECF in January 2013.
WKESDCF described the current data collection requirements relating to diadromous species and concerns related to those. Eel and salmon differ markedly from marine species in their biology, the nature and distribution of their fisheries, and the methods used to assess stock status and provide management advice. As a result, the data collection requirements do not fit well into the ‘standard’ approaches used for marine species. WKESDCF described the data needs of the salmon and eel assessments and gave several recommendations on which type of data and how should be collected for salmon and eel.
STECF concluded that WKESDCF made a thorough revision of the current DCF and listed several recommendations to be taken into account in the new DCMAP. General and species-specific recommendations were made and can be found in the WKESDCF report. However, STECF considered these too detailed to be included in the DCMAP as there is a general agreement that the new DCMAP should be flexible and restrict the details as much as possible in order to allow the data collection to accommodate efficiently to changes the end-user needs.
STECF agreed that DC-MAP should include provisions for collecting such eel and salmon data, which is needed for stock assessment purposes. However, the details of sampling, such as the variables to be sampled, number and distribution of samples and targets for the quality of data will be decided in the regional level. Regional planning, coordination and task sharing between Member States should ensure as effective use of resources as possible. It is important, that salmon and eel data needs are evaluated and prioritized together with other regional data needs. As it comes to eel, there is a need for cooperation between RCGs, since there is only one pan-European eel stock and a high variety of local conditions that should be also taken into account.Conclusion of STECF on Sampling of salmon and eel (ToR B.4)
Salmon and eel data for the stock assessment purposes should be collected under DCF. Salmon and eel data are needed to:
carry out single species assessments for these species assessment of the economic and social importance of the salmon and eel fisheries (recreational
and commercial)
Proposed draft text for DCMAP (to be included under chapter “stock-based variables”)
For salmon and eel, data for assessment purposes shall be collected from inland waters. The rivers where such data is collected as well as variables which are to be collected in each of the rivers are decided in Regional Coordination Groups.Programmes to address the recommendations of WKESDCF
Page 126 of 176
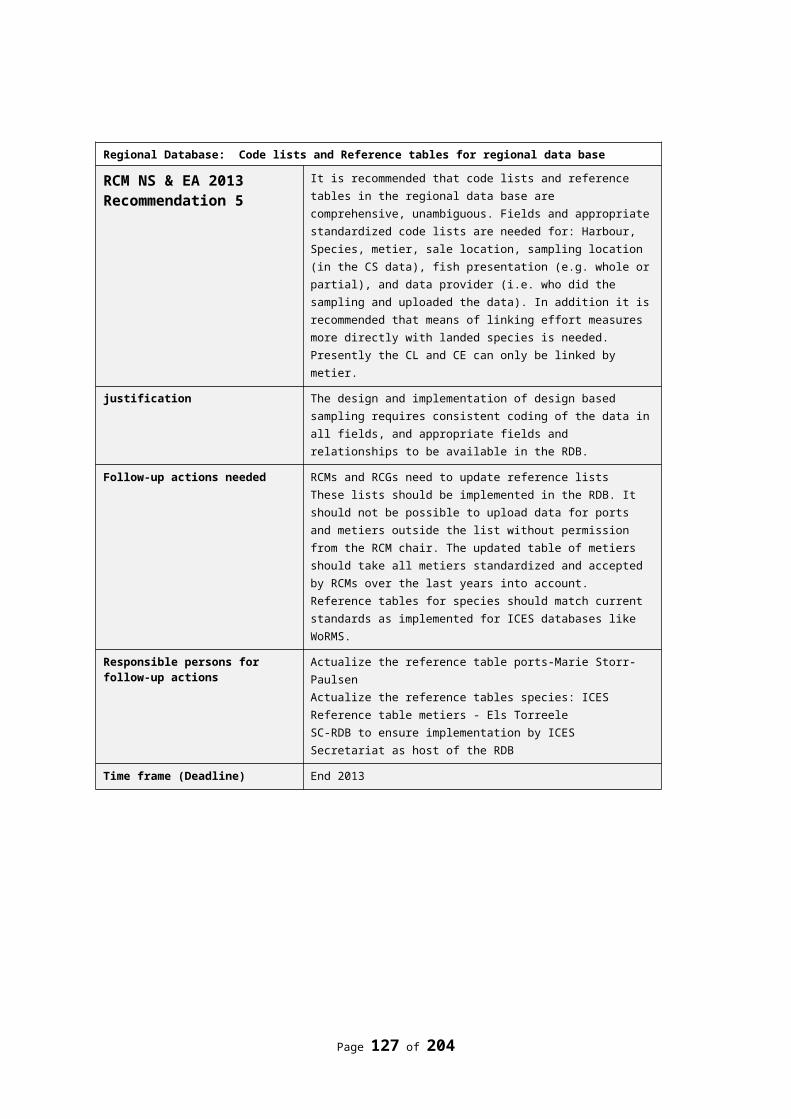
Recommendations specific to eels, and to salmon, are presented in the following two tables along with summary details of the methods proposed to address these recommendations. In addition, WKESDCF made several recommendations common to both eels and salmon. Where these ‘general’ recommendations translate directly to sampling requirements, they have been included in the two tables. The remainder are listed here for reference.
1. Sampling of diadromous species within national programmes should endeavour to meet the standards of precision required for marine species, and where this is impractical it should be addressed within the usual derogation procedures or pilot studies;
2. An international pilot study would be a fruitful way forward: to establish minimum standards for data collection on the basis of current expert judgement; to analyse achieved precision levels where adequate databases exist; and to stimulate further analysis when and where more data become available within the framework of the DC-MAP. Separate pilot studies might be required for eels and salmon, but a joint study should be considered;
3. Habitat data collection should be included under the new DC-MAP, and this should be harmonized with the requirements to collect data on habitat under Article 17 of the Habitats Directive;
4. Member States should seek opportunities to harmonize data collection programmes for eels and salmon, particularly in relation to electrofishing surveys, trapping facilities, automatic counters and habitat surveys.
Recommendations specific to eels, and to salmon, are presented in the following two tables along with summary details of the methods proposed to address these recommendations.
Page 127 of 176
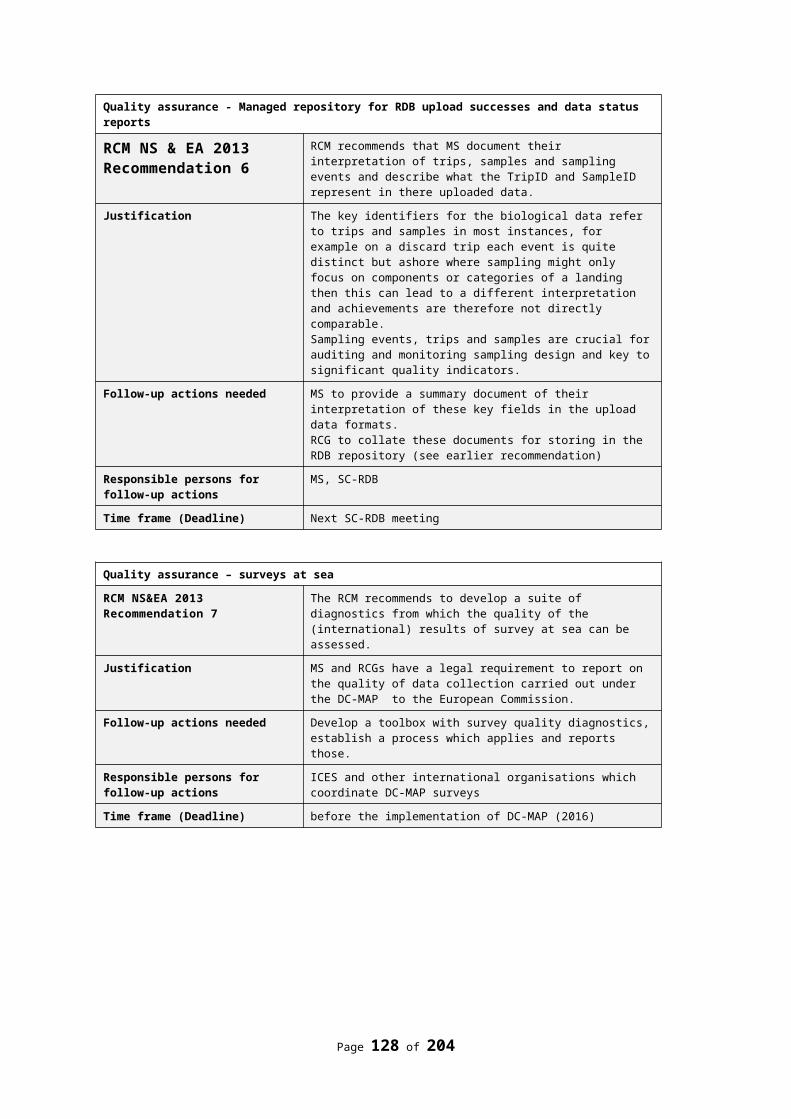
PRELIMINARY UK PROGRAMME FOR DATA COLLECTION FOR EEL STOCK ASSESSMENT PURPOSES (based on WKESDCF recommendations)WKESDCF recommendation for data collection for EEL
England and Wales proposal Scotland proposalNB. Collection proposal will vary in light of changing SG priorities, the resources available and in light of the forthcoming “Review of Management of Salmon and Freshwater Fisheries in Scotland”
N Ireland proposal
EMP assessments delivered to ICES No costs required to deliver (staff costs to assess data will be claimed – every 3 or 2 years)
No costs required to deliver (staff costs to assess data will be claimed – every 3 years).
Cost: £2,100 every 3 years
No data costs associated with delivery to ICES - reports ready under EU requirement (staff costs to assess data may be claimed as E&W)
Pilot study to address the assessment of eel stocks in large open water bodies, such as lakes, deep rivers, transitional and coastal waters.
Pilot study in E&W, between Cefas, EA, Defra, stakeholders.to be coordinated with Scotland and N Ireland
The SG has currently no plans to undertake such studies.
Desk exercise based on Lough Neagh commercial data and existing intermittent fyke net surveys of Erne Lakes, cross checked against silver production estimates. Will need to add CPUE measures to production on Lough Neagh
Fisheries data - ANNUAL: fishing capacity and effort;
number and weight of all eel caught, separated by:
commercial and recreational fisheries;
location of fishery (freshwater, transitional and coastal);
stage (eel<12 cm length, yellow, silver) ;
number and weight of glass eel/elver used for restocking
Continue to collect as previous.
Continue to collect weight as previous, either new reporting of numbers or convert from wt
Collect commercial already. Recreational fishery is catch and release, post-release mortality will be treated as part of natural mortality.
Continue to collect as previous.
Continue to collect as previous.
Continue to collect weight, number estimated from weight.
Not applicable. Scotland has no eel fisheries.
Continue as previous. Add CPUE measure to L Neagh
Continue to collect weight as previous, either new reporting of numbers or convert from wt
Collect commercial already. No significant recreational fishery. Propose pilot study of post-release mortality?
Continue to collect as previous.
Continue to collect as previous
Continue to collect weight, number converted from weight
Fisheries data – REPORTIING PERIOD (3 or 2y), subject to minimum catch Not applicable. Scotland has no eel
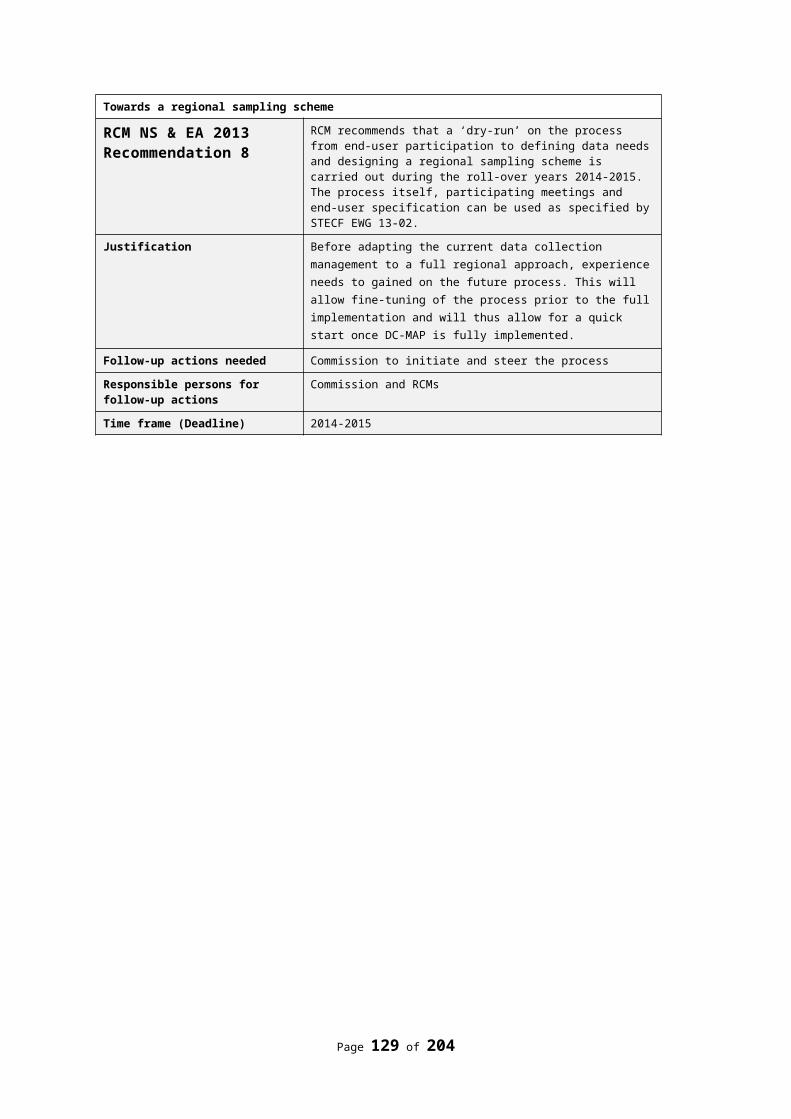
thresholds: Information on the abundance and
distribution of exploited eels necessary to estimate mortality rates in those EMUs supporting fisheries where the catch is estimated at or exceeding 25 t of silver eel equivalents per year (or as approved by ICES)
Abundance and distribution derived from E-fishing surveys and SMEP II estimates in relevant EMUs.
Recruitment surveys – Severn Estuary.
fisheries. Lough Neagh is over 25 T SE
equiv. No other active fishery areas anticipated unless EU EMP reviews support re-opening fisheries. Existing programmes on recruitment and in fishery to derive mortality rates
‘Eel index river’ per EMU - ANNUAL: information on abundance of
recruits (glass eel and/or elvers); information on abundance of
standing stock (yellow eel); counts or estimates of the
number, weight and sex ratio of emigrating silver eel;
information on anthropogenic impacts in these systems, on all life stages
3 index rivers per EMU over 3 yrs. 1 survey of Severn Estuary every
3 yrs (three trawls). ~£300k E-fishing surveys to populate
SMEP II estimates of yellow eels SMEP II estimates from yellow eel
data
Mapping and characterising impacts. Mortality rates addressed below.
3 index rivers for Scottish RBD Electrofishing surveys
Yellow eel recruitment at 1 site.
Biomass of silver eel escapement at all 3 sites
Cost: £20,000
L Neagh index system. Erne - potential index system.
(trans-boundary reporting through RoI)
LAGAN or Quoile - new index system needed for NERBD
Eel recruitment time-series identified by ICES as contributing to the annual international stock assessment process
Network of surveys to be finalised.Yellow eel recruitment at 1 site (as above).
Bann and Erne.New index site on east coast started and simple trap technology being tested
Surveys for standing stock of eel as employed for assessing stock compliance with EMP limits, and should integrate the DC-MAP surveys with WFD and MFSD surveys
E-fishing surveys to populate SMEP II estimates of yellow eels.Sufficient wiggle room here to extend surveys to more index rivers?
Not applicable. Neagh CPUE surveys Elsewhere other RBDs through
cross compliance and fyke surveys or WFD continuity. (Would require additional resource to DCF)
At EMU level and at appropriate temporal frequencies: growth rates of eel, determined at
yellow and silver stages; sex ratio of standing stock and
silver eel;
infection intensity and abundance of Anguillicoloides crassus, and other parasites and diseases as recognized by ICES as having a
One survey
Need for further growth and sex ratio data to be reviewed on basis of sensitivity of assessments to these parameters.
Review need for pilot study
Will be carried out at 2 index sites Not required for current
assessment
The SG has currently no plans collect this data.
Current sampling effort in all 3 NI EMUs probably sufficient.(Would require increased lab time)
Page 129 of 176
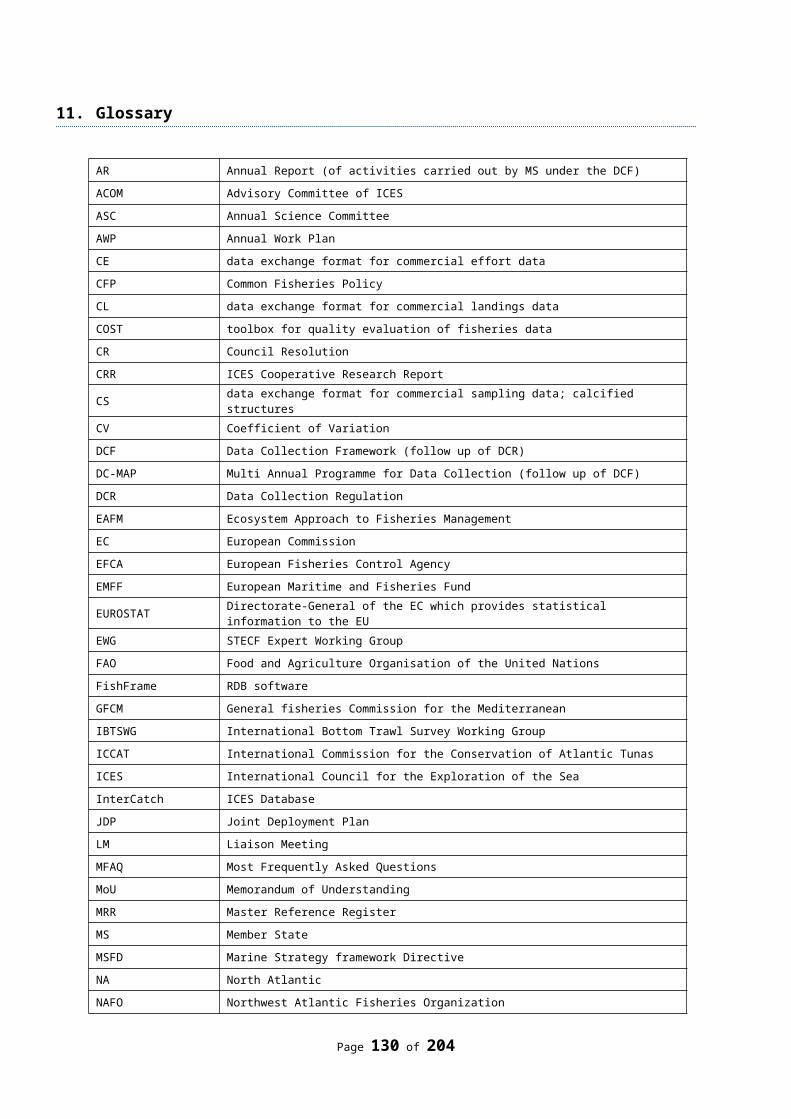
potential impact on effective spawner stock biomass;
tissue concentrations of contaminants as recognized by ICES as having a potential impact on effective spawner stock biomass
Review need for pilot study The SG has currently no plans collect this data.
Support the need for international surveys at sea of eel in the spawning area
No planned involvement No planned involvement If international collaborations emerge, can use Loughs Neagh/Erne as site / supply of large silver eels for tracking
Data necessary to establish the mortality caused by non-fisheries anthropogenic factors
Pilot studies on estimating mortality rates from non-fisheries anthropogenic factors; standing stock estimates (included above)
The SG has currently no plans collect this data.
Potential pilot studies: -L Neagh (using whole freshwater life cycle models, grouping all non fishery mortality by elimination.) Erne where there is no fishery could complement
Economic data should be collected for eel fisheries
Not planned Not applicable Data could be collected for Lough Neagh Commercial returns but on a macro scale and subject to commercial confidentiality
Page 130 of 176
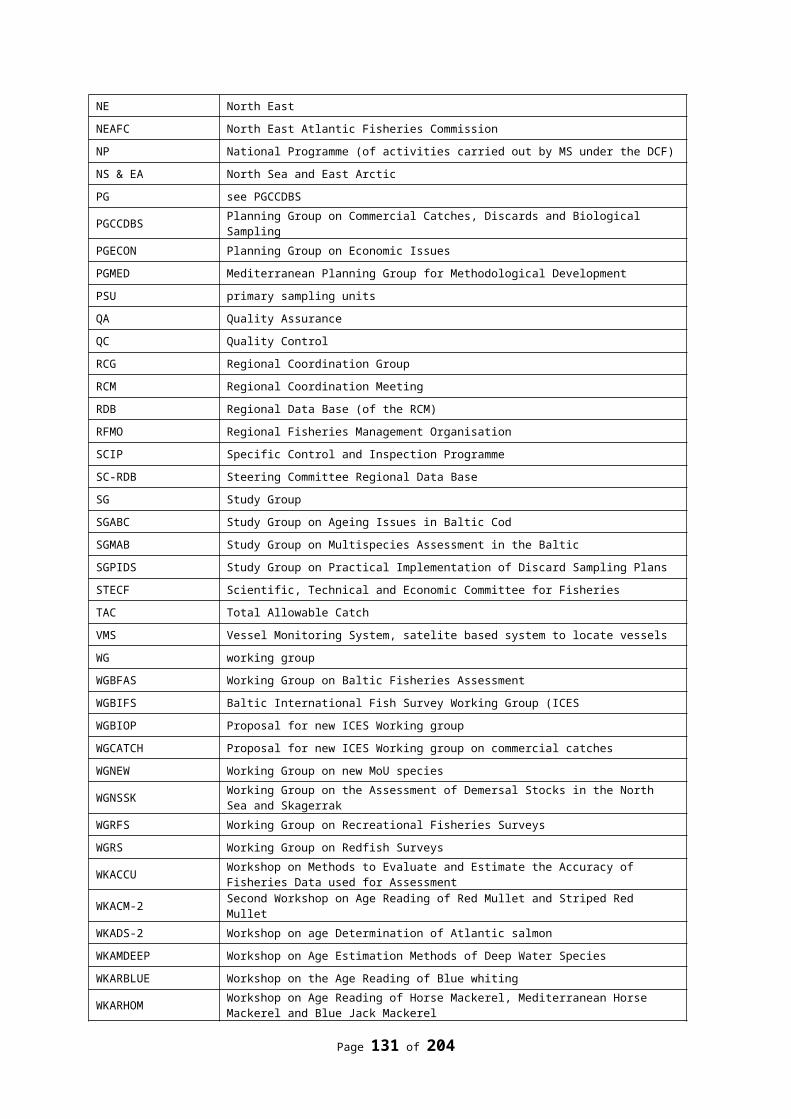
PRELIMINARY UK PROGRAMME FOR DATA COLLECTION FOR SALMON ASSESSMENT PURPOSES (based on WKESDCF recommendations)WKESDCF recommendation for data collection for SALMON
England and Wales proposal Scotland proposalNB. Collection proposal will vary in light of changing SG priorities, the resources available and in light of the forthcoming “Review of Management of Salmon and Freshwater Fisheries in Scotland”
N Ireland proposal
ICES Areas IIIa and VIId should be added to the areas for which the collection of biological variables is required for North Atlantic salmon (currently specified in Appendix VII of Commission Decision 2010/93/EU) but areas containing no coastal waters and around Greenland and Faroes could be excluded
Data collection in VIId (Eastern Channel) to be included in programme where appropriate
N/A N/A
Participation in the NASCO Salmon Sampling program at West Greenland should be eligible for DC-MAP funding because the programme is endorsed by the EU and the data relate to the exploitation of EU stocks and are essential to the provision of advice to NASCO
Inclusion in DC-MAP not confirmed. Annual cost = £15k
Inclusion in DC-MAP not confirmed. Annual cost = £15k
N/A
The following data should be collected annually for all fisheries exploiting North Atlantic salmon: fishing capacity and effort;
number and weight of all salmon caught, separated by:
commercial and recreational fisheries;
Continue to collect as previous.
Continue to collect as previous.
Continue to collect as previous.
Collect data on the effort deployed by both net and coble (estuarine) and fixed engine (coastal) net fisheries by month.
Data will be collected from all identified salmon fisheries through an annual survey.
Data on numbers and weight of all salmon caught will be collected from both commercial net fisheries (net and coble and fixed engine) and from recreational rod fisheries at a monthly level.
Data on the location of the
All sections: NI Net Fisheries closed - Data
would be collected if re-opened
Data to be collected for recreational fisheries
Page 131 of 176
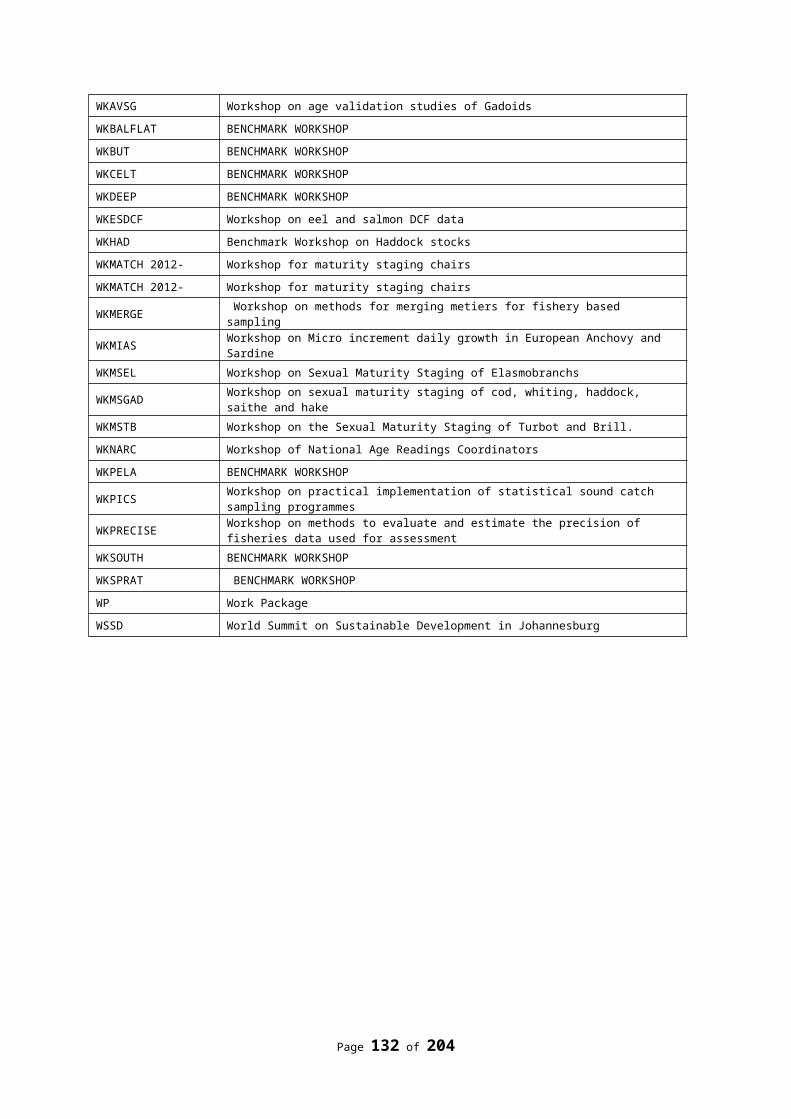
location of fishery (river, estuarine and coastal);
age class (one sea-winter and multi-sea-winter);
number of salmon released in recreational fisheries;
weight of ranched salmon caught
Continue to collect as previous.
Continue to collect as previous.
Continue to collect as previous.
Continue to collect as previous.
fisheries will be recorded. The annual data collection survey
will collect catch data broken down into two sea age categories, grilse (one sea-winter) and salmon (multi sea-winter).
The annual data collection survey will collect the numbers and weight of salmon released from the recreational (rod) fisheries.
Not applicable to Scottish salmon fisheries.
Cost: £45,000
In mixed salmon stock fisheries, data should be collected on the stock composition of the catch at least once every 5 years
Three fisheries: NE, Solway & Severn @£50k, £30k & £30k respectively= £110k
The development of genetic methodologies, the collection of baseline and fishery samples and an evaluation of the approach is currently being undertaken. However, the SG has no current plan to collect such data at the frequency recommended.Cost: £0
N/A - All MSFs closed to further notice. Sampling would be required if re-opened
Counts of adult salmon returns should be obtained for at least one river stock in 30; these ‘census stocks’ should be agreed by ICES
Counters (11 rivers – Test, Itchen, Hampshire Avon, Frome, Fowey, Lune, Kent, Leven, Caldew, Tyne and Tees) @ £15k / site= £165k
Collection of adult count data will be undertaken on 2 major Scottish rivers.
The possibility of increasing the number of counter locations further will be explored and implemented as funds are secured.Cost: £50,000
River Bush index site for NI full coverage: adult, egg/fry/ parr/smolt annually.7 other rivers in DCAL area with adult count and annual 0+/1+ juvenile assessmentFoyle area covered by transboundary Loughs agency and not claimed to date
The following data should be collected annually for stocks in ‘salmon index rivers’, as agreed by ICES:– information on the abundance of fry/parr;– information on the abundance of smolts;– information on the number of ascending adults.This may include tagging studies to
Index rivers used for ICES:-Tamar, Dee, Frome, Lune & Tyne:
Tamar and Dee @ £75kFrome- inc. pit tag sampling @ £75kLune & Tyne @£15k each (in addition to collection of biological data)
Total = £255k
3 sites on the North Esk and 6 sites on the Girnock Burn will be electrofished annually to provide information on the abundance of fry/parr.
Smolt information will be collected from a total trap on the Girnock and a partial trap on the North Esk.
R Bush and 7 other rivers:
As for DCF
Page 132 of 176
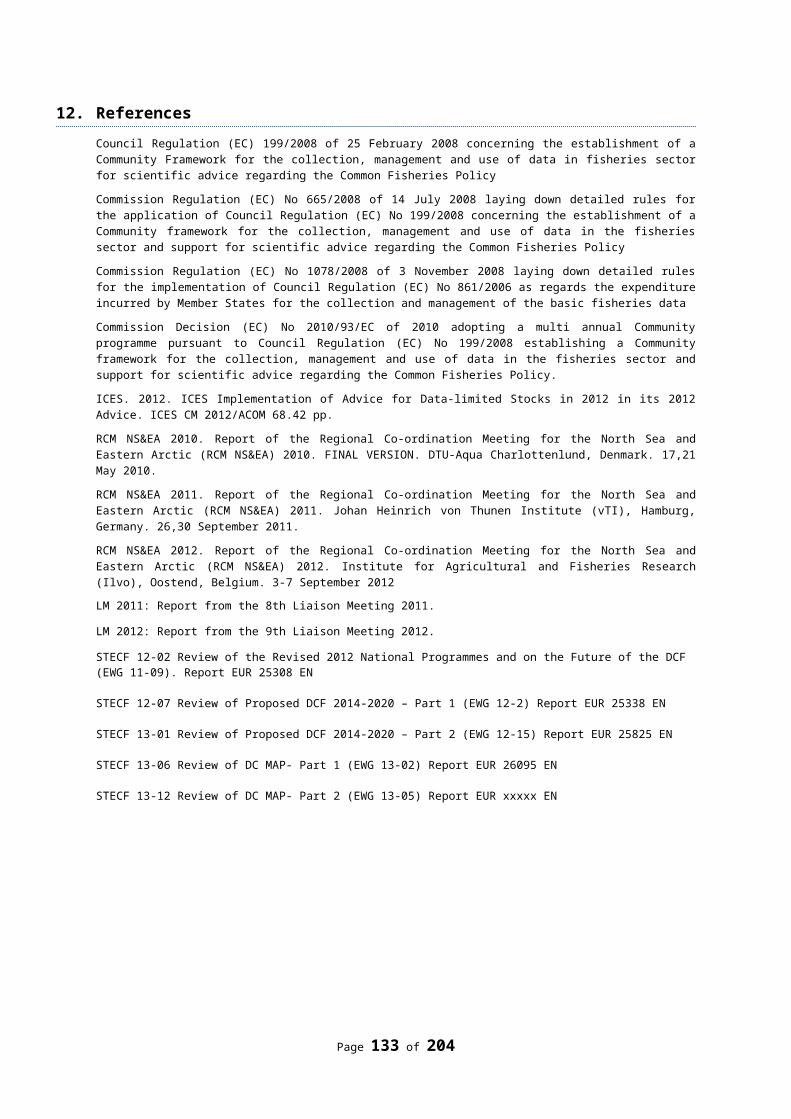
obtain time-series of population estimates, exploitation rates, freshwater and marine survival, etc.
Information on the number of ascending adults will be collected on both the North Esk and Girnock sites.Cost: £50,000
The new DC-MAP should include surveys for juvenile salmonids as employed for assessing stock compliance with conservation limits and meeting the requirements of WFD
Sampling annually at 380 sites @ £750 / site= £285k
Juvenile sampling is carried out at the Girnock Burn and North Esk sites (see above). Additional sampling is nor currently routinely conducted by the SG. Sites previously sampled by SEPA in relation to the WPD are not currently claimed.Cost £0.
WFD element not claimed currently but some sites carried out depending on annual budget.NI relies more on Semi-quantitative salmon specific surveys rather than the small number of fully quant WFD sites
The collection of the following biological data should be included in the new DC-MAP:– Fecundity of adults by age (1SW and MSW) (estimated at a national/regional level every 5 years); and– Sex ratios of adults by age (1SW and MSW) (estimated at a national/regional level every 5 years)
Focusing this just on the (5) index rivers - (using non-destructive techniques)= £50k
The SG currently has no plans to collection additional fecundity and sex ratio data.
Cost £0.
R Bush index river:
As for DCF
Data on salmon maturity are not required and should be removed from the new DC-MAP
N/A N/A N/A
Economic data should be collected for salmon fisheries
An update of the previous review - done once during this funding period = £50k
The SG has no current plan to collect economic data.
Only recreational fisheries open
Page 133 of 176
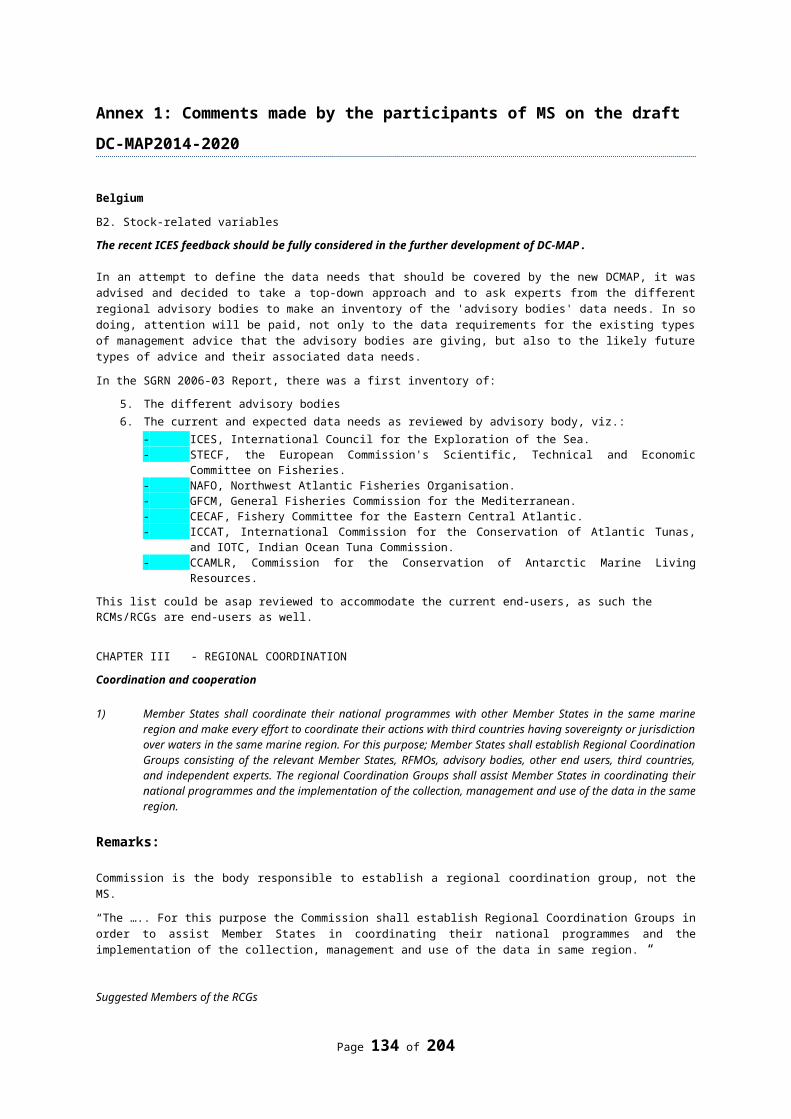
PRELIMINARY INDICATIVE COSTS OF EEL AND SALMON DATA COLLECTION:Data collection England and Wales proposal Scotland proposal N Ireland proposalEEL - Annual costs: Index rivers – 12 sites per EMU per year @ £800/site
= £9,600 * 11 (am including Wales) = £105,600 yr-1
Severn Estuary - 3 surveys at £100,000 per survey = £300,000; but once every three years = £100,000 yr-1
Recruitment Monitoring - at 10 sites per year at £10,000 per site = £100,000 yr-1
Silver eel monitoring - at 5 sites per year at £10,000 per site = £50,000 yr-1
Total: £355,600 yr-1 Total: £20,700 yr-1 Total: £80,000 yr-1
EEL - Pilot studies: Large lakes, estuaries & rivers = £200,000Estimating mortality rates from non-fisheries anthropogenic factors = £100,000Parasites = £50,000Contaminants £100,000Growth rate and sex ratio study = £50,000Total: £500,000
SALMON - Annual costs: Total: £720,000 yr-1 Total: £160,000 yr-1 Total: £300,000 yr-1
SALMON - Single surveys: Total: £160,000
OVERALL UK TOTALS FOR SALMON AND EEL: Annual £1,636,300
Pilot/single surveys £660,000
Page 134 of 176
Annex 3: Ranking of 2012 metiers
Table X. Ranking 2012 Effort (days at sea) IIIa at a regional level
Métier LVL6 BEL DEU DNK FRA NLD SWE Total % cum%OTB_MCD_90-119_0_0 19130 265 19395 27 27FPO_CRU_>0_0_0 14132 14132 19 46MIS_MIS_0_0_0 8669 4 48 8721 12 58OTB_CRU_32-69_0_0 2192 1098 3290 4 62OTT_CRU_70-89_2_35 3225 3225 4 67OTB_CRU_70-89_2_35 5 50 3114 3169 4 71GNS_DEF_120-219_0_0 103 2166 763 3032 4 75OTB_CRU_32-69_2_22 2107 2107 3 78OTB_MCD_>=120_0_0 1575 1 1576 2 80LHP_FIF_0_0_0 91 1403 1494 2 82SDN_DEF_90-119_0_0 1231 39 1270 2 84OTT_CRU_32-69_0_0 1071 1071 1 85OTT_CRU_32-69_2_22 981 981 1 87GNS_SPF_50-70_0_0 19 908 927 1 88SDN_DEF_>=120_0_0 696 696 1 89OTT_DEF_90-119_0_0 652 652 1 90GNS_DEF_100-119_0_0 51 500 83 634 1 91OTM_SPF_16-31_0_0 589 35 624 1 92OTT_MCD_90-119_0_0 556 556 1 92GNS_DEF_>=220_0_0 334 210 544 1 93GTR_DEF_120-219_0_0 536 536 1 94FYK_CAT_>0_0_0 6 476 482 1 94GNS_SPF_10-30_0_0 15 439 454 1 95OTT_CRU_90-119_0_0 416 416 1 96OTB_CRU_90-119_0_0 35 329 364 0 96PTM_SPF_16-31_0_0 249 1 250 0 96GNS_CRU_>0_0_0 163 61 224 0 97OTB_DEF_90-119_0_0 20 197 217 0 97PTM_SPF_32-69_0_0 87 109 196 0 97SB_FIF_>0_0_0 194 194 0 98OTB_DEF_>=120_0_0 123 55 178 0 98PTB_SPF_16-31_0_0 166 166 0 98OTM_SPF_32-69_0_0 15 46 95 156 0 98PS_SPF_16-31_0_0 156 156 0 98TBB_DEF_>=120_0_0 56 99 155 0 99OTB_DEF_<16_0_0 146 146 0 99FPO_FIF_>0_0_0 144 144 0 99SSC_DEF_>=120_0_0 47 96 1 144 0 99GNS_DEF_90-99_0_0 13 76 3 92 0 99OTB_SPF_16-31_0_0 82 82 0 100OTB_DEF_32-69_0_0 39 39 0 100OTB_CRU_>=120_0_0 31 31 0 100DRB_MOL_>0_0_0 26 26 0 100GNS_DEF_50-70_0_0 25 25 0 100PTB_MCD_90-119_0_0 25 25 0 100GTR_DEF_90-99_0_0 24 24 0 100GNS_SPF_100-119_0_0 22 22 0 100PTB_DEF_>=120_0_0 21 21 0 100PTB_SPF_32-69_0_0 21 21 0 100FPN_CAT_>0_0_0 20 20 0 100OTT_CRU_90-119_1_300 13 13 0 100LLS_DEF_0_0_0 11 11 0 100OTM_DEF_<16_0_0 11 11 0 100OTM_DEF_90-119_0_0 10 10 0 100PTB_DEF_<16_0_0 8 8 0 100OTM_DEF_>=120_0_0 7 7 0 100PS_SPF_32-69_0_0 4 4 0 100LLS_FIF_0_0_0 3 3 0 100LLS_SPF_0_0_0 2 2 0 100
Métier LVL6 BEL DEU DNK FRA NLD SWE Total % cum%OTB_SPF_32-69_0_0 2 2 0 100OTT_MCD_90-119_1_120 2 2 0 100OTT_MCD_90-119_1_300 2 2 0 100TBB_DEF_<16_0_0 2 2 0 100OTB_CRU_90-119_1_120 1 1 0 100OTT_CRU_90-119_1_120 1 1 0 100OTT_DEF_90-119_1_120 1 1 0 100PTM_DEF_16-31_0_0 1 1 0 100
Table X. Ranking Official 2012 catch weight (t) IIIa at a regional level
Métier LVL6 BEL DEU DNK FRA IRL NLD SWE Total % cum%OTB_MCD_90-119_0_0 10329 62 10391 15 15PTM_SPF_32-69_0_0 1813 6868 8681 13 28OTM_SPF_16-31_0_0 7901 441 8342 12 41OTM_SPF_32-69_0_0 629 1305 5853 7786 12 52PS_SPF_16-31_0_0 4844 4844 7 60SDN_DEF_>=120_0_0 3085 3085 5 64SDN_DEF_90-119_0_0 2400 67 2467 4 68PTM_SPF_16-31_0_0 2258 81 2338 3 71MIS_MIS_0_0_0 2248 5 1 1 2255 3 75OTB_MCD_>=120_0_0 2011 2011 3 78OTB_CRU_32-69_0_0 1377 430 1807 3 81GNS_DEF_120-219_0_0 128 1322 81 1531 2 83OTB_DEF_<16_0_0 1423 1423 2 85OTB_SPF_16-31_0_0 1127 1127 2 87PTB_SPF_16-31_0_0 881 881 1 88OTB_DEF_90-119_0_0 38 819 858 1 89TBB_DEF_>=120_0_0 338 490 829 1 90OTT_DEF_90-119_0_0 589 589 1 91OTT_CRU_32-69_0_0 576 576 1 92FPO_CRU_>0_0_0 552 552 1 93OTB_DEF_>=120_0_0 497 30 528 1 94OTT_CRU_70-89_2_35 478 478 1 94SSC_DEF_>=120_0_0 143 322 11 476 1 95OTT_CRU_32-69_2_22 470 470 1 96OTB_CRU_32-69_2_22 400 400 1 96OTB_CRU_70-89_2_35 6 291 297 0 97LHP_FIF_0_0_0 66 210 276 0 97GNS_SPF_50-70_0_0 2 197 198 0 98OTM_DEF_<16_0_0 180 180 0 98OTT_MCD_90-119_0_0 176 176 0 98PTB_SPF_32-69_0_0 173 173 0 98OTB_SPF_32-69_0_0 135 135 0 99PTB_DEF_>=120_0_0 117 117 0 99GNS_DEF_>=220_0_0 92 19 111 0 99GTR_DEF_120-219_0_0 102 102 0 99GNS_SPF_10-30_0_0 10 88 98 0 99OTT_CRU_90-119_0_0 75 75 0 99GNS_DEF_100-119_0_0 12 53 10 74 0 100PTB_DEF_<16_0_0 60 60 0 100OTM_DEF_90-119_0_0 36 36 0 100OTB_CRU_90-119_0_0 5 28 34 0 100SB_FIF_>0_0_0 25 25 0 100FYK_CAT_>0_0_0 25 25 0 100GNS_CRU_>0_0_0 14 9 23 0 100OTB_DEF_32-69_0_0 18 18 0 100OTM_DEF_>=120_0_0 15 15 0 100PTM_DEF_16-31_0_0 12 12 0 100TBB_DEF_<16_0_0 11 11 0 100LLS_DEF_0_0_0 11 11 0 100DRB_MOL_0_0_0 9 9 0 100GNS_DEF_90-99_0_0 2 7 9 0 100OTB_CRU_>=120_0_0 7 7 0 100
Page 136 of 176
Métier LVL6 BEL DEU DNK FRA IRL NLD SWE Total % cum%GNS_DEF_50-70_0_0 5 5 0 100FPO_FIF_>0_0_0 5 5 0 100PTB_MCD_>=120_0_0 5 5 0 100LLS_FIF_0_0_0 4 4 0 100OTB_DEF_70-89_2_35 4 4 0 100PTB_MCD_90-119_0_0 4 4 0 100OTT_CRU_90-119_1_300 3 3 0 100GTR_DEF_90-99_0_0 2 2 0 100FPN_CAT_>0_0_0 2 2 0 100GNS_SPF_100-119_0_0 2 2 0 100OTT_DEF_90-119_1_120 1 1 0 100GTR_DEF_>=220_0_0 1 1 0 100PS_SPF_32-69_0_0 0 0 100OTT_MCD_90-119_1_300 0 0 100OTT_CRU_90-119_1_120 0 0 100LLS_SPF_0_0_0 0 0 100OTT_DEF_90-119_1_300 0 0 100OTT_MCD_90-119_1_120 0 0 100OTB_CRU_90-119_1_120 0 0 100GNS_DEF_110-156_0_0 0 0 100GNS_SPF_110-156_0_0 0 0 100GNS_SPF_32-109_0_0 0 0 100OTM_SPF_32-89_0_0 0 0 100PTM_SPF_32-89_0_0 0 0 100
Table X. Ranking Official 2012 value (k€) IIIa at a regional levelMétier LVL6 BEL DEU DNK FRA IRL NLD SWE Total % cum%OTB_MCD_90-119_0_0 38199 427 38626 30 30OTB_CRU_32-69_0_0 8215 3254 11469 9 38PTM_SPF_32-69_0_0 968 5224 6192 5 43OTT_CRU_70-89_2_35 5524 5524 4 47OTM_SPF_32-69_0_0 321 750 4451 5522 4 51FPO_CRU_>0_0_0 5513 5513 4 56MIS_MIS_0_0_0 4502 8 4510 3 59SDN_DEF_>=120_0_0 4410 4410 3 62OTT_CRU_32-69_0_0 4338 4338 3 66OTB_MCD_>=120_0_0 4289 0 4289 3 69OTB_CRU_32-69_2_22 4156 4156 3 72GNS_DEF_120-219_0_0 353 3197 306 3857 3 75OTT_CRU_32-69_2_22 3795 3795 3 78PS_SPF_16-31_0_0 3715 3715 3 81SDN_DEF_90-119_0_0 3424 188 3612 3 84OTB_CRU_70-89_2_35 1 41 3352 3394 3 86OTM_SPF_16-31_0_0 2792 342 3133 2 89OTT_DEF_90-119_0_0 1886 1886 1 90OTB_DEF_90-119_0_0 65 1640 1705 1 91TBB_DEF_>=120_0_0 634 913 1548 1 93OTT_MCD_90-119_0_0 1280 1280 1 94OTB_DEF_>=120_0_0 884 75 959 1 94SSC_DEF_>=120_0_0 348 574 922 1 95OTT_CRU_90-119_0_0 866 866 1 96PTM_SPF_16-31_0_0 596 61 657 1 96GNS_DEF_100-119_0_0 91 439 78 608 0 97GNS_DEF_>=220_0_0 425 72 497 0 97LHP_FIF_0_0_0 118 358 476 0 97OTB_SPF_16-31_0_0 428 428 0 98GTR_DEF_120-219_0_0 413 413 0 98OTB_CRU_90-119_0_0 54 327 380 0 98OTB_DEF_<16_0_0 360 360 0 99PTB_DEF_>=120_0_0 275 275 0 99PTB_SPF_16-31_0_0 249 249 0 99PTM_SPF_32-89_0_0 217 217 0 99GNS_SPF_50-70_0_0 1 187 188 0 99OTB_SPF_32-69_0_0 103 103 0 99PTB_SPF_32-69_0_0 97 97 0 99
Page 137 of 176
Métier LVL6 BEL DEU DNK FRA IRL NLD SWE Total % cum%GNS_SPF_10-30_0_0 7 87 93 0 100OTB_CRU_>=120_0_0 71 71 0 100GNS_CRU_>0_0_0 49 18 67 0 100GNS_DEF_90-99_0_0 15 47 62 0 100OTB_DEF_32-69_0_0 59 59 0 100OTM_DEF_<16_0_0 47 47 0 100OTT_CRU_90-119_1_300 34 34 0 100OTM_DEF_90-119_0_0 33 33 0 100LLS_DEF_0_0_0 31 31 0 100FPN_CAT_>0_0_0 27 27 0 100SB_FIF_>0_0_0 23 23 0 100PTB_MCD_90-119_0_0 19 19 0 100OTM_DEF_>=120_0_0 18 18 0 100PTB_DEF_<16_0_0 15 15 0 100FYK_CAT_>0_0_0 1 13 14 0 100OTM_SPF_32-89_0_0 12 12 0 100GNS_DEF_50-70_0_0 12 12 0 100LLS_FIF_0_0_0 10 10 0 100GNS_SPF_100-119_0_0 9 9 0 100OTB_DEF_70-89_2_35 8 8 0 100PTB_MCD_>=120_0_0 7 7 0 100GTR_DEF_90-99_0_0 6 6 0 100GTR_DEF_>=220_0_0 6 6 0 100OTT_CRU_90-119_1_120 4 4 0 100OTT_DEF_90-119_1_120 3 3 0 100PTM_DEF_16-31_0_0 3 3 0 100OTT_MCD_90-119_1_120 3 3 0 100FPO_FIF_>0_0_0 2 2 0 100OTT_MCD_90-119_1_300 2 2 0 100OTT_DEF_90-119_1_300 1 1 0 100OTB_CRU_90-119_1_120 1 1 0 100PS_SPF_32-69_0_0 1 1 0 100GNS_SPF_32-109_0_0 100LLS_SPF_0_0_0 100GNS_SPF_110-156_0_0 100TBB_DEF_<16_0_0 100GNS_DEF_110-156_0_0 100DRB_MOL_0_0_0 100
Table X. Ranking 2012 Effort (days at sea) IV at a regional level
Métier LVL6 BEL DEU DNK ENG FRA IRL NIR NLD SCT SWE WLS Total % cum%
FPO_CRU_>0_0_0 732919
7 75002
7 37930
7 19 19
TBB_CRU_16-31_0_0 10683377
2 3818 20464070
4 10 28
OTB_DEF_70-99_0_0 3 713 45432191
5 9 803 376 102837
2 7 35
TBB_DEF_70-99_0_0 3555 973 2004 34311603
4 502604
7 6 41
DRB_MOL_0_0_0 61 2642414
2 0 4652493
2 6 47
OTB_CRU_70-99_0_0 514 638 5055 6491485
3 162172
5 5 52
TBB_DEF_16-31_0_0 314 32056
92088
6 5 57
MIS_MIS_0_0_0 30131433
9 01735
2 4 61
GTR_DEF_90-99_0_0 14 44081220
2 531667
7 4 65
OTB_DEF_>=120_0_0 77 1493 2239 95 483 6152 2501078
9 3 67FPO_MOL_>0_0_0 8925 980 2 9907 2 69GNS_DEF_120-219_0_0 7 155 4241 4281 616 10 368 2 4 9684 2 72DRB_MOL_>0_0_0 2025 5564 7589 2 74GNS_DEF_100-119_0_0 568 678 4873 10 1161 1 7291 2 75OTM_SPF_32-69_0_0 294 729 16 3136 0 55 1776 303 71 6380 1 77OTB_MCD_>=120_0_0 6070 13 6083 1 78LHP_FIF_0_0_0 55 13 825 1726 3028 30 5677 1 79OTB_DEF_100-119_0_0 55 372 2291 1688 1113 142 1 5662 1 81OTB_MOL_70-99_0_0 72 5215 215 5502 1 82
Page 138 of 176
Métier LVL6 BEL DEU DNK ENG FRA IRL NIR NLD SCT SWE WLS Total % cum%FPO_CRU_0_0_0 3396 0 922 4318 1 83GTR_DEF_120-219_0_0 1473 2619 218 4310 1 84PTB_DEF_>=120_0_0 44 144 4024 4212 1 85GTR_DEF_100-119_0_0 918 2545 24 3487 1 86LLS_DEF_0_0_0 2546 678 3 165 38 3 3433 1 87FPO_MOL_0_0_0 3073 3073 1 87MIS_MOL_0_0_0 831 2110 2941 1 88GNS_DEF_90-99_0_0 55 65 554 694 1336 2704 1 89OTT_CRU_70-99_0_0 81 89 2266 2436 1 89TBB_DEF_100-119_0_0 193 954 1279 2426 1 90SSC_DEF_>=120_0_0 5 510 272 22 38 206 1263 2316 1 90GNS_DEF_>=220_0_0 307 883 244 74 774 2282 1 91SSC_DEF_70-99_0_0 147 452 1469 165 2233 1 91OTT_DEF_>=120_0_0 26 2122 27 2175 1 92OTT_DEF_70-99_0_0 1272 231 449 53 2005 0 92HMD_MOL_>0_0_0 1939 42 1981 0 93OTB_MCD_70-99_0_0 494 911 492 1897 0 93TBB_DEF_>=120_0_0 648 249 288 620 1805 0 94OTM_SPF_16-31_0_0 27 1098 49 230 293 22 81 1800 0 94OTB_SPF_70-99_0_0 14 19 1529 1 1563 0 95PTM_SPF_32-69_0_0 154 209 359 0 9 701 66 1498 0 95SDN_DEF_>=120_0_0 1131 87 105 24 1347 0 95OTB_DEF_<16_0_0 28 1093 6 18 28 92 1265 0 96GTR_DEF_50-70_0_0 1 1102 1 1104 0 96GNS_CRU_100-119_0_0 518 473 991 0 96OTT_MCD_70-99_0_0 981 981 0 96PTB_DEF_70-99_0_0 120 663 783 0 96OTB_MOL_32-69_0_0 7 770 777 0 97PTM_SPF_16-31_0_0 649 41 2 33 725 0 97GTR_DEF_>=220_0_0 95 586 681 0 97OTB_DEF_32-69_0_0 1 656 2 19 678 0 97OTB_CRU_100-119_0_0 29 20 615 664 0 97OTB_CRU_32-69_0_0 440 8 22 163 633 0 97SSC_DEF_100-119_0_0 62 453 82 597 0 98OTB_DEF_16-31_0_0 357 185 13 555 0 98OTB_CRU_>=120_0_0 381 156 537 0 98FPO_FIF_>0_0_0 277 234 511 0 98OTB_MCD_100-119_0_0 443 27 470 0 98OTB_SPF_16-31_0_0 451 2 15 468 0 98PTM_DEF_100-119_0_0 454 454 0 98GND_SPF_50-70_0_0 441 441 0 98FPO_CRU_10-30_0_0 361 361 0 98GND_DEF_100-119_0_0 359 359 0 99GNS_CRU_120-219_0_0 334 5 339 0 99OTT_CRU_100-119_0_0 312 312 0 99HMD_MOL_0_0_0 305 305 0 99OTT_CRU_32-69_0_0 246 246 0 99GND_DEF_90-99_0_0 238 1 239 0 99GNS_CRU_>0_0_0 238 238 0 99SDN_DEF_>0_0_0 203 203 0 99GNS_DEF_71-89_0_0 174 22 1 197 0 99FYK_CAT_>0_0_0 1 188 189 0 99GND_DEF_120-219_0_0 160 8 168 0 99GNS_SPF_100-119_0_0 163 163 0 99MIS_UND_UND_0_0 161 161 0 99OTM_DEF_32-69_0_0 1 135 20 156 0 99PS_SPF_32-69_0_0 154 154 0 99MIS_CRU_0_0_0 148 1 149 0 99PS_SPF_70-99_0_0 147 147 0 99OTB_SPF_32-69_0_0 128 2 16 146 0 99FPO_CRU_50-70_0_0 142 142 0 99PS_SPF_100-119_0_0 139 139 0 99GND_DEF_50-70_0_0 135 135 0 99OTB_MOL_100-119_0_0 131 131 0 99OTB_CRU_<16_0_0 9 94 103 0 100GNS_DEF_0_0_0 102 102 0 100SDN_DEF_70-99_0_0 98 98 0 100OTM_DEF_<16_0_0 86 86 0 100TBB_CRU_<16_0_0 86 86 0 100LLS_FIF_0_0_0 85 85 0 100TBB_DEF_<16_0_0 80 80 0 100GNS_DEF_<10_0_0 2 75 77 0 100OTT_DEF_100-119_0_0 7 7 62 76 0 100PTB_MCD_>=120_0_0 73 73 0 100TBB_DEF_0_0_0 73 73 0 100
Page 139 of 176
Métier LVL6 BEL DEU DNK ENG FRA IRL NIR NLD SCT SWE WLS Total % cum%OTT_CRU_>=120_0_0 69 69 0 100OTM_DEF_16-31_0_0 68 68 0 100PTB_DEF_<16_0_0 54 13 67 0 100PS_SPF_>0_0_0 60 4 64 0 100SDN_DEF_100-119_0_0 11 53 64 0 100TBB_MOL_0_0_0 64 64 0 100OTM_SPF_<16_0_0 2 52 5 59 0 100GNS_SPF_120-219_0_0 54 54 0 100PTB_SPF_16-31_0_0 44 44 0 100GTR_DEF_0_0_0 39 39 0 100PTM_DEF_<16_0_0 38 38 0 100TBB_CRU_70-99_0_0 18 19 37 0 100OTB_MOL_>=120_0_0 11 24 35 0 100GNS_DEF_10-30_0_0 34 34 0 100LHM_FIF_0_0_0 32 32 0 100PS_SPF_<16_0_0 29 29 0 100FPO_CRU_90-99_0_0 26 26 0 100OTM_SPF_0_0_0 26 26 0 100PTB_MCD_70-99_0_0 26 26 0 100SSC_DEF_<16_0_0 23 23 0 100OTB_DEF_0_0_0 22 22 0 100MIS_FIF_0_0_0 19 19 0 100OTB_SPF_>=120_0_0 15 3 18 0 100OTM_SPF_70-99_0_0 7 2 1 8 18 0 100GNS_CRU_50-70_0_0 16 16 0 100FPO_CRU_100-119_0_0 15 15 0 100GND_DEF_>=220_0_0 13 2 15 0 100GND_SPF_10-30_0_0 13 13 0 100TBB_CRU_>=120_0_0 13 13 0 100SSC_DEF_0_0_0 12 12 0 100GND_SPF_100-119_0_0 10 10 0 100GND_SPF_71-89_0_0 10 10 0 100GNS_CRU_90-99_0_0 10 10 0 100TBB_MCD_70-99_0_0 10 10 0 100OTB_MOL_<16_0_0 9 9 0 100GNS_SPF_90-99_0_0 8 8 0 100OTB_SPF_100-119_0_0 8 8 0 100TBB_DEF_32-69_0_0 8 8 0 100LHP_CEP_0_0_0 7 7 0 100GND_SPF_90-99_0_0 6 6 0 100GNS_DEF_50-70_0_0 1 5 6 0 100OTB_CRU_16-31_0_0 6 6 0 100OTB_DWS_>=120_0_0 6 6 0 100OTM_DEF_>=120_0_0 6 6 0 100GND_DEF_10-30_0_0 1 4 5 0 100GND_SPF_120-219_0_0 5 5 0 100OTM_SPF_>=120_0_0 5 5 0 100GND_DEF_31-49_0_0 4 4 0 100GNS_DEF_110-156_0_0 4 4 0 100GNS_SPF_71-89_0_0 4 4 0 100PTM_DEF_16-31_0_0 4 4 0 100GND_SPF_31-49_0_0 3 3 0 100GNS_CRU_>=220_0_0 3 3 0 100LLS_DWS_0_0_0 3 3 0 100OTB_SPF_<16_0_0 3 3 0 100GTR_DEF_71-89_0_0 2 2 0 100LHP_DEF_0_0_0 2 2 0 100OTB_DWS_100-119_0_0 2 2 0 100PTB_CRU_>=120_0_0 2 2 0 100GND_DEF_71-89_0_0 1 1 0 100GNS_CRU_<10_0_0 1 1 0 100GNS_CRU_31-49_0_0 1 1 0 100GNS_CRU_71-89_0_0 1 1 0 100GNS_DEF_31-49_0_0 1 1 0 100GTR_DEF_10-30_0_0 1 1 0 100OTT_CRU_<16_0_0 1 1 0 100OTT_MOL_70-99_0_0 1 1 0 100OTT_SPF_32-69_0_0 1 1 0 100PS_SPF_16-31_0_0 1 1 0 100PTB_CRU_70-99_0_0 1 1 0 100PTB_SPF_>=120_0_0 1 1 0 100PTB_SPF_70-99_0_0 1 1 0 100SB_FIF_>0_0_0 1 1 0 100
Page 140 of 176
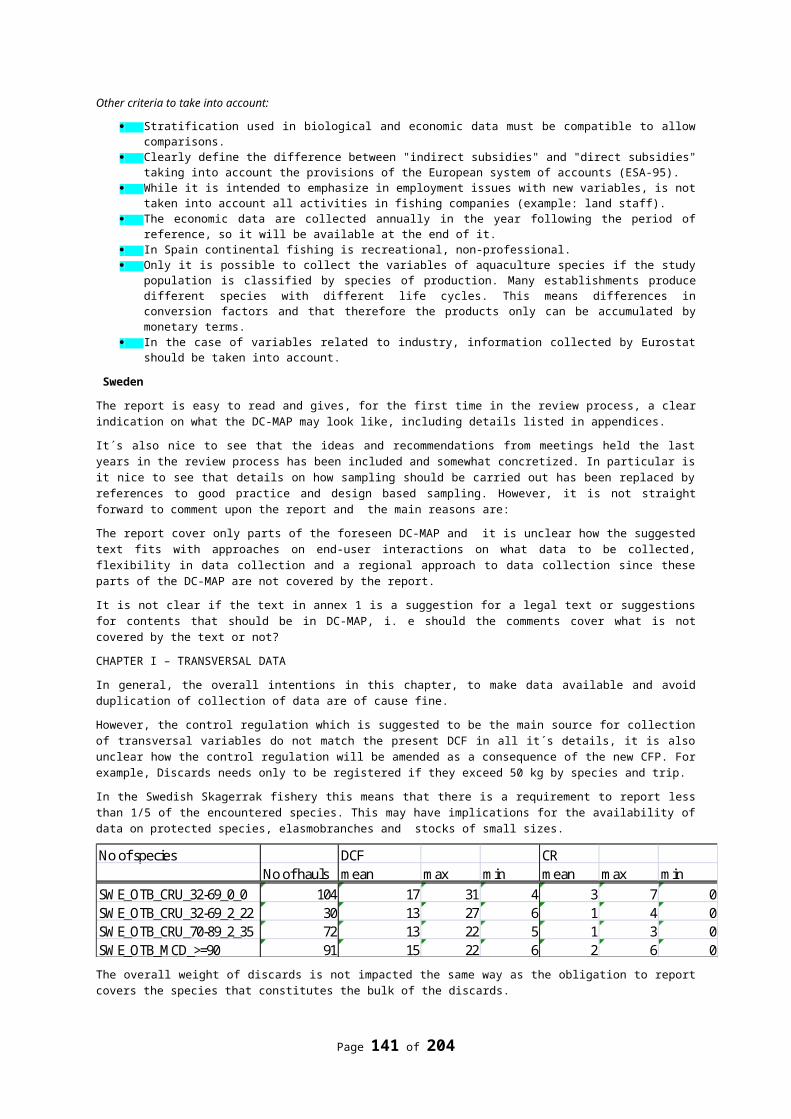
Table X. Ranking Official 2012 catch weight (t) IV at a regional level
Métier LVL6 BEL DEU DNK ENG FRA IRL NIR NLD SCT SWEWLS Total % cum%
OTM_SPF_32-69_0_03445
89890
9 19 30979 93371115
1 672318558
0 392534158
935 35
OTB_DEF_<16_0_0 17084342
1 1 51 164 5652 50997 5 40
TBB_DEF_70-99_0_0740
2 1410338
5 898 36293 126 49515 5 46
OTM_SPF_16-31_0_0 4654071
7 9 194 4960 692 2425 49462 5 51
OTB_DEF_>=120_0_0 139 8339615
6 489 6652396
0 1150 40899 4 55
PTM_SPF_32-69_0_0 6166669
3 25291112
4 1314 7419 3755 38999 4 59
OTB_DEF_16-31_0_02239
9 43 2 22444 2 61
TBB_CRU_16-31_0_0107
51633
0 3116 927 21448 2 63DRB_MOL_0_0_0 106 5250 15490 267 21112 2 66
PTB_DEF_>=120_0_0 203 3341968
5 20222 2 68
OTB_DEF_100-119_0_0 142 1021270
1 12191 3285 301 1 19642 2 70
PTM_SPF_16-31_0_01849
8 393 1 116 0 50 19058 2 72
OTB_DEF_70-99_0_0 8 1253 0226
5 14194 2 979 291 9 19000 2 74
OTB_SPF_32-69_0_01779
0 980 18770 2 76
OTB_MCD_>=120_0_01734
8 7 17355 2 77
OTB_SPF_16-31_0_01569
9 1 10 15711 2 79TBB_DEF_16-31_0_0 2 3 14640 14645 2 80
OTB_CRU_70-99_0_0 710 803223
8 3541033
1 12 14448 1 82
FPO_CRU_>0_0_0 17837
6 1 6051 14444 1 83
DRB_MOL_>0_0_0373
1 9124 12856 1 85
TBB_DEF_100-119_0_0 676592
0 5811 12407 1 86SSC_DEF_>=120_0_0 17 2201 1351 90 315 792 7590 12355 1 87
PS_SPF_32-69_0_01043
0 10430 1 88PS_SPF_>0_0_0 9405 718 10123 1 89
TBB_DEF_>=120_0_0360
5 1063140
6 3159 9234 1 90
FPO_MOL_>0_0_0765
9 273 1 7933 1 91OTT_DEF_>=120_0_0 122 7004 123 7249 1 92MIS_MIS_0_0_0 4339 2538 6877 1 93GNS_DEF_120-219_0_0 6 161 4942 546 150 1 66 2 5874 1 93
SSC_DEF_70-99_0_0 511 0108
9 2775 342 4716 0 94OTM_SPF_<16_0_0 50 2738 1601 4389 0 94OTB_MOL_70-99_0_0 35 4146 38 4219 0 95GTR_DEF_90-99_0_0 14 346 3525 7 3892 0 95OTM_DEF_<16_0_0 3154 3154 0 95SDN_DEF_>=120_0_0 1912 231 748 95 2985 0 96OTM_DEF_16-31_0_0 2929 2929 0 96OTB_SPF_70-99_0_0 20 2 2700 2722 0 96OTT_CRU_70-99_0_0 100 65 2369 2535 0 97
MIS_MOL_0_0_0194
2 278 2220 0 97GNS_DEF_>=220_0_0 264 495 237 14 1071 2082 0 97SSC_DEF_100-119_0_0 320 1405 300 2025 0 97FPO_MOL_0_0_0 1955 1955 0 97OTB_MCD_70-99_0_0 668 939 232 1838 0 98OTM_DEF_32-69_0_0 71 1745 1816 0 98FPO_CRU_0_0_0 456 1288 52 1795 0 98OTM_SPF_70-99_0_0 12 1609 1621 0 98TBB_MOL_0_0_0 1475 1475 0 98LLS_DEF_0_0_0 344 310 517 147 1319 0 98LHP_FIF_0_0_0 304 1 59 158 568 27 1117 0 99GNS_DEF_100-119_0_0 207 263 547 2 97 1116 0 99GTR_DEF_120-219_0_0 213 788 59 1061 0 99PTB_DEF_70-99_0_0 145 880 1024 0 99OTT_DEF_70-99_0_0 455 20 389 34 898 0 99
Page 141 of 176
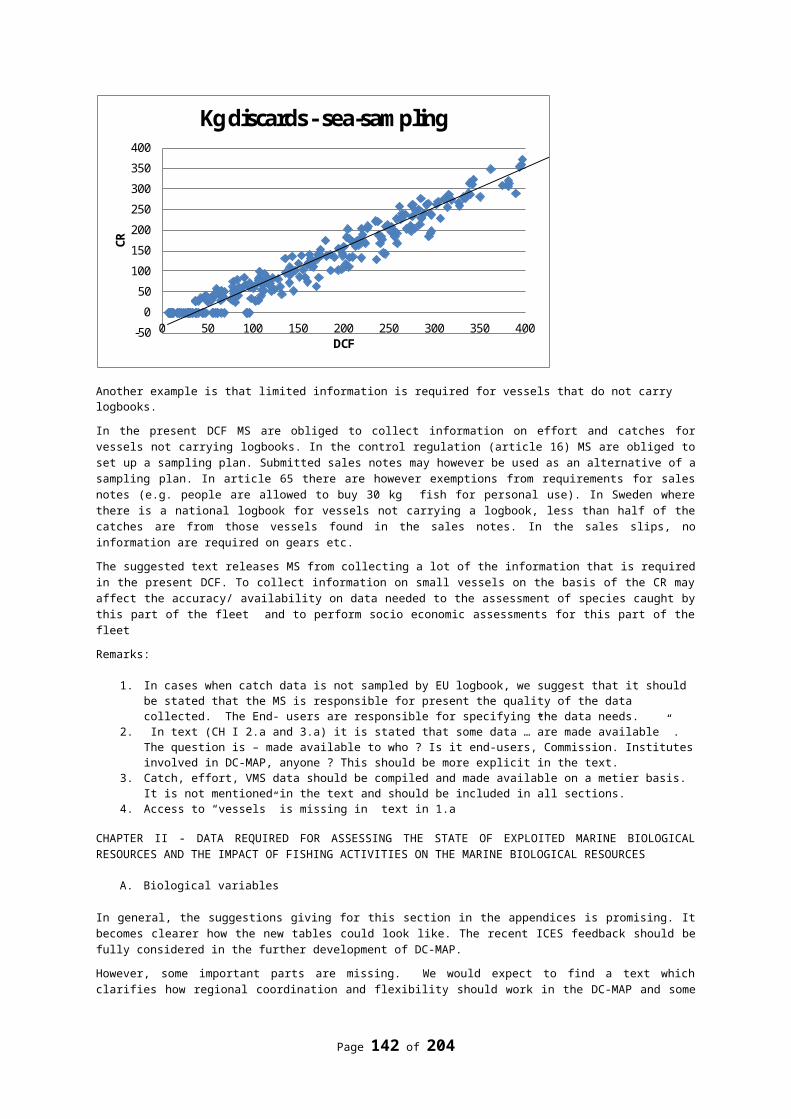
Métier LVL6 BEL DEU DNK ENG FRA IRL NIR NLD SCT SWEWLS Total % cum%
GTR_DEF_100-119_0_0 107 618 7 733 0 99OTB_MCD_100-119_0_0 580 16 595 0 99OTB_CRU_100-119_0_0 9 7 575 591 0 99HMD_MOL_>0_0_0 540 8 548 0 99PTB_DEF_<16_0_0 482 65 547 0 99PTM_DEF_<16_0_0 521 521 0 99GNS_DEF_90-99_0_0 26 22 179 64 225 516 0 99OTB_MOL_32-69_0_0 5 436 441 0 99OTT_MCD_70-99_0_0 419 419 0 99MIS_CRU_0_0_0 386 386 0 99PTB_SPF_16-31_0_0 357 357 0 100PTB_MCD_>=120_0_0 302 302 0 100OTB_CRU_>=120_0_0 110 187 296 0 100OTT_CRU_100-119_0_0 295 295 0 100OTB_CRU_32-69_0_0 205 15 4 53 276 0 100GTR_DEF_>=220_0_0 33 180 212 0 100SDN_DEF_70-99_0_0 198 198 0 100OTT_CRU_32-69_0_0 165 165 0 100OTB_DEF_32-69_0_0 141 24 165 0 100GNS_CRU_100-119_0_0 30 131 161 0 100PTM_DEF_100-119_0_0 156 156 0 100SDN_DEF_100-119_0_0 21 128 149 0 100GTR_DEF_50-70_0_0 133 133 0 100SDN_DEF_>0_0_0 131 131 0 100GND_SPF_50-70_0_0 127 127 0 100SSC_DEF_<16_0_0 121 121 0 100OTT_DEF_100-119_0_0 17 84 108 0 100OTT_CRU_>=120_0_0 103 103 0 100GNS_DEF_<10_0_0 101 101 0 100PTM_DEF_16-31_0_0 90 90 0 100LHM_FIF_0_0_0 89 89 0 100TBB_DEF_<16_0_0 87 87 0 100TBB_DEF_0_0_0 84 84 0 100LLS_FIF_0_0_0 75 0 75 0 100OTB_DEF_0_0_0 69 69 0 100GNS_SPF_120-219_0_0 67 67 0 100FPO_FIF_>0_0_0 30 35 65 0 100OTB_SPF_<16_0_0 63 63 0 100OTB_MOL_100-119_0_0 58 58 0 100TBB_CRU_70-99_0_0 30 26 56 0 100GTR_DEF_0_0_0 48 48 0 100OTB_CRU_<16_0_0 2 41 43 0 100GNS_CRU_120-219_0_0 39 1 40 0 100SSC_DEF_0_0_0 39 39 0 100GND_DEF_100-119_0_0 33 33 0 100OTB_MOL_>=120_0_0 7 22 29 0 100GNS_DEF_71-89_0_0 17 11 29 0 100GND_DEF_120-219_0_0 27 27 0 100GND_DEF_90-99_0_0 27 27 0 100GNS_CRU_>0_0_0 27 27 0 100OTB_DWS_>=120_0_0 21 21 0 100FPO_CRU_10-30_0_0 20 20 0 100TBB_CRU_<16_0_0 19 19 0 100MIS_UND_UND_0_0 19 19 0 100OTM_DEF_>=120_0_0 19 19 0 100GNS_DEF_0_0_0 11 11 0 100GNS_SPF_100-119_0_0 11 11 0 100FPO_CRU_50-70_0_0 11 11 0 100PTB_MCD_70-99_0_0 10 10 0 100OTB_SPF_>=120_0_0 9 9 0 100GND_DEF_50-70_0_0 8 8 0 100TBB_CRU_>=120_0_0 8 8 0 100OTM_SPF_>=120_0_0 4 4 0 100TBB_MCD_70-99_0_0 4 4 0 100GND_DEF_>=220_0_0 4 4 0 100TBB_DEF_32-69_0_0 3 3 0 100FYK_CAT_>0_0_0 3 3 0 100MIS_FIF_0_0_0 3 3 0 100PS_SPF_70-99_0_0 3 3 0 100GNS_DEF_10-30_0_0 2 2 0 100
Page 142 of 176
Métier LVL6 BEL DEU DNK ENG FRA IRL NIR NLD SCT SWEWLS Total % cum%
OTB_MOL_<16_0_0 2 2 0 100GNS_CRU_90-99_0_0 2 2 0 100GNS_DEF_110-156_0_0 2 2 0 100GND_SPF_10-30_0_0 2 2 0 100GNS_CRU_50-70_0_0 2 2 0 100PS_SPF_100-119_0_0 1 1 0 100GNS_CRU_<10_0_0 1 1 0 100OTB_CRU_16-31_0_0 1 1 0 100LHP_DEF_0_0_0 1 1 0 100PTB_SPF_>=120_0_0 1 1 0 100OTT_CRU_<16_0_0 1 1 0 100LHP_CEP_0_0_0 1 1 0 100OTT_SPF_32-69_0_0 1 1 0 100FPO_CRU_90-99_0_0 1 1 0 100OTB_SPF_100-119_0_0 1 1 0 100GNS_SPF_71-89_0_0 1 1 0 100GND_SPF_120-219_0_0 1 1 0 100GND_SPF_100-119_0_0 1 1 0 100PTB_SPF_70-99_0_0 0 0 100GND_SPF_90-99_0_0 0 0 100HMD_MOL_0_0_0 0 0 100GND_DEF_10-30_0_0 0 0 100GND_SPF_71-89_0_0 0 0 100GNS_CRU_>=220_0_0 0 0 100GNS_SPF_90-99_0_0 0 0 100GND_SPF_31-49_0_0 0 0 100GNS_DEF_31-49_0_0 0 0 100GNS_DEF_50-70_0_0 0 0 100GNS_CRU_31-49_0_0 0 0 100GTR_DEF_71-89_0_0 0 0 100LLS_DWS_0_0_0 0 0 100PTB_CRU_70-99_0_0 0 0 100GND_DEF_31-49_0_0 0 0 100PS_SPF_<16_0_0 0 0 100FPO_CRU_100-119_0_0 0 0 100GNS_CRU_71-89_0_0 0 0 100GND_DEF_71-89_0_0 0 0 100OTT_MOL_70-99_0_0 0 0 100GTR_DEF_10-30_0_0 0 0 100OTB_DWS_100-119_0_0 0 0 100SB_FIF_>0_0_0 0 0 100PTB_CRU_>=120_0_0 0 0 100
Table X. Ranking Official 2012 value (k€) IIIa at a regional level
Métier LVL6 BEL DEU DNK ENGFRA IRL NIR NLD SCT SWE
WLS Total % cum%
OTM_SPF_32-69_0_01798
3 74076 10894
4 74366 3173 178551 21 21
TBB_CRU_16-31_0_0 43305314
8 11317 2701 71496 9 30
OTB_DEF_>=120_0_0 2211102
8 10177 1 45841 2260 69526 8 38
TBB_DEF_70-99_0_02467
5 4630 25710 11 344 55370 7 45
OTB_CRU_70-99_0_0 2533 2526 6853121
0 36812 21 49955 6 51FPO_CRU_>0_0_0 51 26079 3 19756 1 45889 5 56OTB_MCD_>=120_0_0 35602 35602 4 60PTB_DEF_>=120_0_0 511 557 32763 33830 4 64DRB_MOL_>0_0_0 5727 19234 24961 3 67SSC_DEF_>=120_0_0 38 5694 3113 146 306 11576 20873 2 70OTM_SPF_16-31_0_0 153 13125 10 1578 1901 16768 2 72OTT_DEF_>=120_0_0 205 14542 241 14987 2 74GNS_DEF_120-219_0_0 22 441 11151 2106 5 1 13728 2 75OTB_DEF_<16_0_0 491 10788 3 321 1621 13224 2 77TBB_DEF_100-119_0_0 1034 10484 1 11520 1 78TBB_DEF_>=120_0_0 6869 1928 2506 1 11304 1 80
PTM_SPF_32-69_0_0 4129 2277119
7 3094 10697 1 81OTB_SPF_32-69_0_0 9814 668 10482 1 82PS_SPF_>0_0_0 9197 713 9910 1 83PS_SPF_32-69_0_0 9048 9048 1 84
Page 143 of 176
Métier LVL6 BEL DEU DNK ENGFRA IRL NIR NLD SCT SWE
WLS Total % cum%
OTT_CRU_70-99_0_0 334 240 8314 8889 1 85GNS_DEF_>=220_0_0 658 2600 942 4458 8659 1 86FPO_MOL_>0_0_0 7363 469 1 7834 1 87OTB_DEF_70-99_0_0 11 2161 4948 2 1 527 10 7660 1 88OTB_DEF_100-119_0_0 205 1491 5133 2 631 1 7463 1 89OTB_DEF_16-31_0_0 7047 4 7051 1 90DRB_MOL_0_0_0 277 6228 6506 1 91GNS_DEF_100-119_0_0 0 1495 1876 2391 5762 1 91SSC_DEF_70-99_0_0 1104 3385 2 1224 5715 1 92PTM_SPF_16-31_0_0 5560 58 38 5656 1 93SDN_DEF_>=120_0_0 3500 417 985 256 5157 1 93OTB_MCD_70-99_0_0 1703 3377 5081 1 94OTB_SPF_16-31_0_0 4835 4835 1 95LLS_DEF_0_0_0 1878 2061 435 4374 1 95MIS_MIS_0_0_0 3674 3674 0 96TBB_MOL_0_0_0 3263 3263 0 96MIS_MOL_0_0_0 1801 1005 2806 0 96OTB_CRU_32-69_0_0 1608 33 13 384 2038 0 97GNS_DEF_90-99_0_0 159 160 1377 331 2027 0 97OTB_CRU_100-119_0_0 24 25 1892 1941 0 97GTR_DEF_90-99_0_0 99 1540 1639 0 97OTM_SPF_70-99_0_0 33 1 1511 1545 0 97OTB_MOL_32-69_0_0 9 1516 1525 0 98HMD_MOL_>0_0_0 1442 19 1460 0 98LHP_FIF_0_0_0 236 3 1022 70 1331 0 98OTT_DEF_70-99_0_0 1170 1 104 1275 0 98OTT_CRU_32-69_0_0 1152 1152 0 98OTT_CRU_100-119_0_0 1082 1082 0 98OTM_SPF_<16_0_0 10 1053 1063 0 98GTR_DEF_120-219_0_0 948 949 0 99OTM_DEF_16-31_0_0 948 948 0 99OTB_MCD_100-119_0_0 947 947 0 99OTB_CRU_>=120_0_0 340 603 943 0 99SSC_DEF_100-119_0_0 481 1 451 932 0 99OTM_DEF_<16_0_0 830 830 0 99MIS_CRU_0_0_0 700 700 0 99PTB_MCD_>=120_0_0 684 684 0 99GTR_DEF_100-119_0_0 488 488 0 99GNS_DEF_<10_0_0 1 441 442 0 99PTB_DEF_70-99_0_0 386 386 0 99GTR_DEF_0_0_0 373 373 0 99OTM_DEF_32-69_0_0 1 359 360 0 100OTT_CRU_>=120_0_0 324 324 0 100OTB_CRU_<16_0_0 7 239 246 0 100OTT_DEF_100-119_0_0 29 214 243 0 100PTB_DEF_<16_0_0 130 98 228 0 100GND_DEF_120-219_0_0 197 5 202 0 100LLS_FIF_0_0_0 200 200 0 100SSC_DEF_<16_0_0 200 200 0 100GNS_CRU_100-119_0_0 7 184 191 0 100OTB_MOL_70-99_0_0 84 104 188 0 100GND_DEF_100-119_0_0 182 182 0 100GND_DEF_90-99_0_0 170 170 0 100GNS_DEF_71-89_0_0 93 51 1 144 0 100PTM_DEF_<16_0_0 139 139 0 100FPO_FIF_>0_0_0 77 61 138 0 100TBB_CRU_70-99_0_0 63 72 134 0 100OTB_MOL_100-119_0_0 127 127 0 100GNS_CRU_>0_0_0 123 123 0 100GNS_CRU_120-219_0_0 111 2 113 0 100PTB_SPF_16-31_0_0 97 97 0 100TBB_CRU_<16_0_0 80 80 0 100GND_SPF_50-70_0_0 78 78 0 100OTB_MOL_>=120_0_0 14 61 75 0 100OTB_DEF_32-69_0_0 64 64 0 100GTR_DEF_>=220_0_0 56 56 0 100OTB_DWS_>=120_0_0 50 50 0 100OTM_DEF_>=120_0_0 46 46 0 100GND_DEF_50-70_0_0 43 43 0 100TBB_CRU_>=120_0_0 32 32 0 100OTB_SPF_70-99_0_0 26 5 31 0 100GNS_SPF_120-219_0_0 30 30 0 100
Page 144 of 176
Métier LVL6 BEL DEU DNK ENGFRA IRL NIR NLD SCT SWE
WLS Total % cum%
PTM_DEF_16-31_0_0 24 24 0 100SDN_DEF_100-119_0_0 23 23 0 100GNS_SPF_100-119_0_0 0 23 23 0 100OTB_SPF_<16_0_0 17 17 0 100OTB_SPF_>=120_0_0 15 16 0 100TBB_DEF_16-31_0_0 5 3 1 10 0 100MIS_FIF_0_0_0 9 9 0 100GND_DEF_>=220_0_0 8 1 9 0 100GNS_DEF_110-156_0_0 8 0 8 0 100GNS_CRU_50-70_0_0 7 7 0 100OTB_MOL_<16_0_0 6 6 0 100LHP_DEF_0_0_0 6 6 0 100OTB_CRU_16-31_0_0 5 5 0 100LHP_CEP_0_0_0 5 5 0 100OTT_CRU_<16_0_0 4 4 0 100GNS_CRU_90-99_0_0 3 3 0 100GND_DEF_10-30_0_0 3 3 0 100OTB_SPF_100-119_0_0 3 3 0 100GND_SPF_10-30_0_0 2 2 0 100PTB_SPF_70-99_0_0 2 2 0 100PTB_SPF_>=120_0_0 0 1 1 0 100GNS_CRU_<10_0_0 1 1 0 100OTT_SPF_32-69_0_0 1 1 0 100GNS_CRU_>=220_0_0 1 1 0 100GND_SPF_100-119_0_0 1 1 0 100GND_SPF_90-99_0_0 1 1 0 100OTT_MCD_70-99_0_0 1 1 0 100GND_SPF_71-89_0_0 1 1 0 100GNS_SPF_71-89_0_0 1 1 0 100GND_SPF_120-219_0_0 1 1 0 100GNS_CRU_71-89_0_0 1 1 0 100GND_DEF_31-49_0_0 0 100LLS_DWS_0_0_0 0 100GNS_DEF_31-49_0_0 0 100PTB_CRU_70-99_0_0 0 100GNS_SPF_90-99_0_0 0 100FYK_CAT_>0_0_0 0 100SDN_DEF_70-99_0_0 0 100GNS_CRU_31-49_0_0 0 100GND_SPF_31-49_0_0 0 100FPO_CRU_0_0_0 0 100GND_DEF_71-89_0_0 0 100GTR_DEF_50-70_0_0 0 100GTR_DEF_71-89_0_0 0 100LHM_FIF_0_0_0 0 100FPO_CRU_10-30_0_0 0 100GNS_DEF_50-70_0_0 0 100SB_FIF_>0_0_0 0 100OTT_MOL_70-99_0_0 0 100GNS_DEF_0_0_0 0 100MIS_UND_UND_0_0 0 100FPO_CRU_50-70_0_0 0 100TBB_DEF_0_0_0 0 100SSC_DEF_0_0_0 0 100OTB_DEF_0_0_0 0 100OTB_DWS_100-119_0_0 0 100GNS_DEF_10-30_0_0 0 100TBB_DEF_<16_0_0 0 100PTB_MCD_70-99_0_0 0 100PS_SPF_100-119_0_0 0 100PS_SPF_70-99_0_0 0 100TBB_MCD_70-99_0_0 0 100PTB_CRU_>=120_0_0 0 100FPO_CRU_90-99_0_0 0 100OTM_SPF_>=120_0_0 0 100GTR_DEF_10-30_0_0 0 100PS_SPF_<16_0_0 0 100TBB_DEF_32-69_0_0 0 100FPO_CRU_100-119_0_0 0 100HMD_MOL_0_0_0 0 100FPO_MOL_0_0_0 0 100PTM_DEF_100-119_0_0 0 100SDN_DEF_>0_0_0 0 100
Page 145 of 176

Annex 4: Regional ranking of top 10 metiers by year
Table X-1a. Rankings Comparison for 2010 - 2012. Top 10 Metiers in 2012 - Landings in IIIa (cum% in 2012 = 77,8%)
Top 10 Metiers in 2012
Official landing catch weight (tons) Position in ranking2012 2011 2010 2012 Ranked 2011 Ranked 2010 Ranked
OTB_MCD_90-119_0_0 10391.46 11433.10 11801.29 1 YES 1 YES 2 YES
PTM_SPF_32-69_0_0 8681.07 7335.38 21445.09 2 YES 2 YES 1 YES
OTM_SPF_16-31_0_0 8341.66 3605.87 6009.64 3 YES 6 YES 4 YES
OTM_SPF_32-69_0_0 7786.50 5500.04 3307.81 4 YES 3 YES 6 YES
PS_SPF_16-31_0_0 4844.12 4693.55 3119.31 5 YES 4 YES 7 YES
SDN_DEF_>=120_0_0 3085.05 2148.11 834.53 6 YES 8 YES 17 YES
SDN_DEF_90-119_0_0 2467.34 3275.59 4197.37 7 YES 7 YES 5 YES
PTM_SPF_16-31_0_0 2338.07 4298.93 2040.27 8 YES 5 YES 10 YES
MIS_MIS_0_0_0 2255.03 1882.60 1518.25 9 YES 11 YES 13 YES
OTB_MCD_>=120_0_0 2011.21 1467.62 2287.52 10 YES 12 YES 9 YES
Table X-1b. Rankings Comparison for 2010 - 2012. Top 10 Metiers in 2012 - Landings in IV and VIId (cum% in 2012 = 67,7%)
Top 10 Metiers in 2012
Official landing catch weight (tons) Position in ranking2012 2011 2010 2012 Ranked 2011 Ranked 2010 Ranked
OTM_SPF_32-69_0_0 341588.84 206364.71 157591.91 1 YES 2 YES 2 YES
OTB_DEF_<16_0_0 50997.12 274799.20 295202.71 2 YES 1 YES 1 YES
TBB_DEF_70-99_0_0 49514.84 57302.54 59084.38 3 YES 4 YES 3 YES
OTM_SPF_16-31_0_0 49461.51 67064.68 47358.78 4 YES 3 YES 6 YES
OTB_DEF_>=120_0_0 40899.17 42058.15 42555.67 5 YES 6 YES 7 YES
PTM_SPF_32-69_0_0 38999.03 23296.72 31259.54 6 YES 9 YES 8 YES
OTB_DEF_16-31_0_0 22443.93 3406.20 50503.97 7 YES 34 No 5 YES
TBB_CRU_16-31_0_0 21447.60 21181.84 24209.79 8 YES 12 YES 10 YES
DRB_MOL_0_0_0 21112.40 12484.22 14840.42 9 YES 21 YES 21 YES
PTB_DEF_>=120_0_0 20222.12 20160.10 22821.03 10 YES 13 YES 11 YES
Table X-2a. Rankings Comparison for 2010 - 2012. Top 10 Metiers in 2012 - Landings value in IIIa (cum% in 2012 = 69,1%)
Top 10 Metiers in 2012
Official landing value (euro) Position in ranking2012 2011 2010 2012 Ranked 2011 Ranked 2010 Ranked
OTB_MCD_90-119_0_0 38626484 46431574 42192759 1 YES 1 YES 1 YES
OTB_CRU_32-69_0_0 11469222 12045323 13156953 2 YES 2 YES 3 YES
PTM_SPF_32-69_0_0 6191858 5025848 14881256 3 YES 7 YES 2 YES
OTT_CRU_70-89_2_35 5524461 8375067 6867060 4 YES 3 YES 4 YES
OTM_SPF_32-69_0_0 5522068 3795478 2049650 5 YES 10 YES 13 YES
FPO_CRU_>0_0_0 5512871 4275089 4491935 6 YES 9 YES 8 YES
MIS_MIS_0_0_0 4509743 5113351 3869717 7 YES 5 YES 10 YES
SDN_DEF_>=120_0_0 4409534 3177978 1140445 8 YES 14 YES 18 No
OTT_CRU_32-69_0_0 4337648 8375067 4599235 9 YES 3 YES 7 YES
OTB_MCD_>=120_0_0 4289174 3175190 3891522 10 YES 15 YES 9 YES
Page 146 of 176
Table X-2b. Rankings Comparison for 2010 -2012. Top 10 Metiers in 2012 - Landings value in IV and VIId (cum% in 2012 = 69,8%)
Top 10 Metiers in 2012
Official landing value (euro) Position in ranking2012 2011 2010 2012 Ranked 2011 Ranked 2010 Ranked
OTM_SPF_32-69_0_0 178550644 170077716 97402296 1 YES 1 YES 1 YES
TBB_CRU_16-31_0_0 71496202 34373262 53693964 2 YES 9 YES 5 YES
OTB_DEF_>=120_0_0 69526486 73143586 65517171 3 YES 2 YES 2 YES
TBB_DEF_70-99_0_0 55370341 51009584 56616410 4 YES 5 YES 4 YES
OTB_CRU_70-99_0_0 49954935 57387011 50227729 5 YES 3 YES 6 YES
FPO_CRU_>0_0_0 45888995 43611542 36768812 6 YES 6 YES 7 YES
OTB_MCD_>=120_0_0 35602178 36589921 32912290 7 YES 7 YES 9 YES
PTB_DEF_>=120_0_0 33829609 35352960 36528446 8 YES 8 YES 8 YES
DRB_MOL_>0_0_0 24960702 27645094 31113898 9 YES 11 YES 10 YES
SSC_DEF_>=120_0_0 20872580 20780565 18336698 10 YES 13 YES 12 YES
Table X-3a. Rankings Comparison for 2010 - 2012. Top 10 Metiers in 2012 - Effort in IIIa (cum% in 2012 = 82.2%)
Top 10 Metiers in 2012
Days at sea Position in ranking2012 2011 2010 2012 Ranked 2011 Ranked 2010 Ranked
OTB_MCD_90-119_0_0 19395 20497 20564 1 YES 1 YES 1 YES
FPO_CRU_>0_0_0 14132 16282 16746 2 YES 2 YES 2 YES
MIS_MIS_0_0_0 8721 9728 8743 3 YES 3 YES 3 YES
OTT_CRU_70-89_2_35 6394 5065 5413 4 YES 4 YES 4 YES
OTB_CRU_32-69_0_0 3290 3693 4464 5 YES 6 YES 6 YES
GNS_DEF_120-219_0_0 3032 3982 4712 6 YES 5 YES 5 YES
OTB_CRU_32-69_2_22 2107 1865 1866 7 YES 9 YES 9 YES
OTB_MCD_>=120_0_0 1576 864 1243 8 YES 15 No 11 YES
LHP_FIF_0_0_0 1494 1764 1731 9 YES 10 YES 10 YES
SDN_DEF_90-119_0_0 1270 1643 2493 10 YES 11 YES 8 YES
Table X-3b. Rankings Comparison for 2010 - 2012. Top 10 Metiers in 2012 - Effort in IV and VIId (cum% in 2012 = 67,7%)
Top 10 Metiers in 2012
Days at sea Position in ranking2012 2011 2010 2012 Ranked 2011 Ranked 2010 Ranked
FPO_CRU_>0_0_0 79307 83179 77440 1 YES 1 YES 1 YES
TBB_CRU_16-31_0_0 40704 26801 34854 2 YES 4 YES 2 YES
OTB_DEF_70-99_0_0 28372 28777 28549 3 YES 3 YES 4 YES
TBB_DEF_70-99_0_0 26047 30362 33865 4 YES 2 YES 3 YES
DRB_MOL_0_0_0 24932 8105 17780 5 YES 5 YES 7 YES
OTB_CRU_70-99_0_0 21725 23225 25854 6 YES 6 YES 5 YES
TBB_DEF_16-31_0_0 20886 14382 18369 7 YES 8 YES 6 YES
MIS_MIS_0_0_0 17352 14643 13241 8 YES 7 YES 9 YES
GTR_DEF_90-99_0_0 16677 14036 11714 9 YES 9 YES 11 YES
OTB_DEF_>=120_0_0 10789 11762 12480 10 YES 11 YES 10 YES
Page 147 of 176
Annex 5: Overview of potentially required bilateral agreements
landings >200t and accounting for more than 5% of a MS landing
Area 27.I+II
DEU DNK NLD NOR SCTDEU Clupea harengus 8447981 3496887 11944868 0% 0% 71% 0% 0%DEU Gadus morhua 2257916 6241632 8499548 0% 0% 0% 27% 0%DNK Clupea harengus 8354313 13399515 21753828 7% 0% 0% 32% 0%ENG Gadus morhua 3940915 154 3941069 67% 0% 0% 33% 0%ENG Melanogrammus aeglefinus 596948 596948 88% 0% 0% 12% 0%ENG Pollachius virens 1062274 17877 1080151 58% 32% 0% 0% 8%EST Gadus morhua 224945 224945 0% 0% 0% 100% 0%EST Pandalus borealis 4198004 4198004 0% 0% 0% 100% 0%IRL Clupea harengus 4801767 4801767 0% 0% 0% 100% 0%POL Gadus morhua 2512721 2512721 100% 0% 0% 0% 0%POL Melanogrammus aeglefinus 393475 393475 100% 0% 0% 0% 0%POL Sebastes mentella 316734 316734 100% 0% 0% 0% 0%SCT Clupea harengus 10583881 1726551 12310432 0% 0% 0% 86% 0%
Flag Country
SpeciesTotal landings
abroad (kg)Total landings into
flag country (kg)Total flag landings
(kg)
Landing country
Area 27.IIIa
DNK SWEDEU Gadus morhua 347479 2929 350408 98% 0%DEU Pollachius virens 308087 75018 383105 80% 0%DNK Clupea harengus 1150098 7997913 9148011 0% 10%SWE Clupea harengus 3835993 13028899 16864892 23% 0%SWE Trachinus draco 684500 24482 708982 97% 0%
SpeciesFlag Country
Total landings abroad (kg)
Total landings into flag country (kg)
Total flag landings (kg)
Landing country
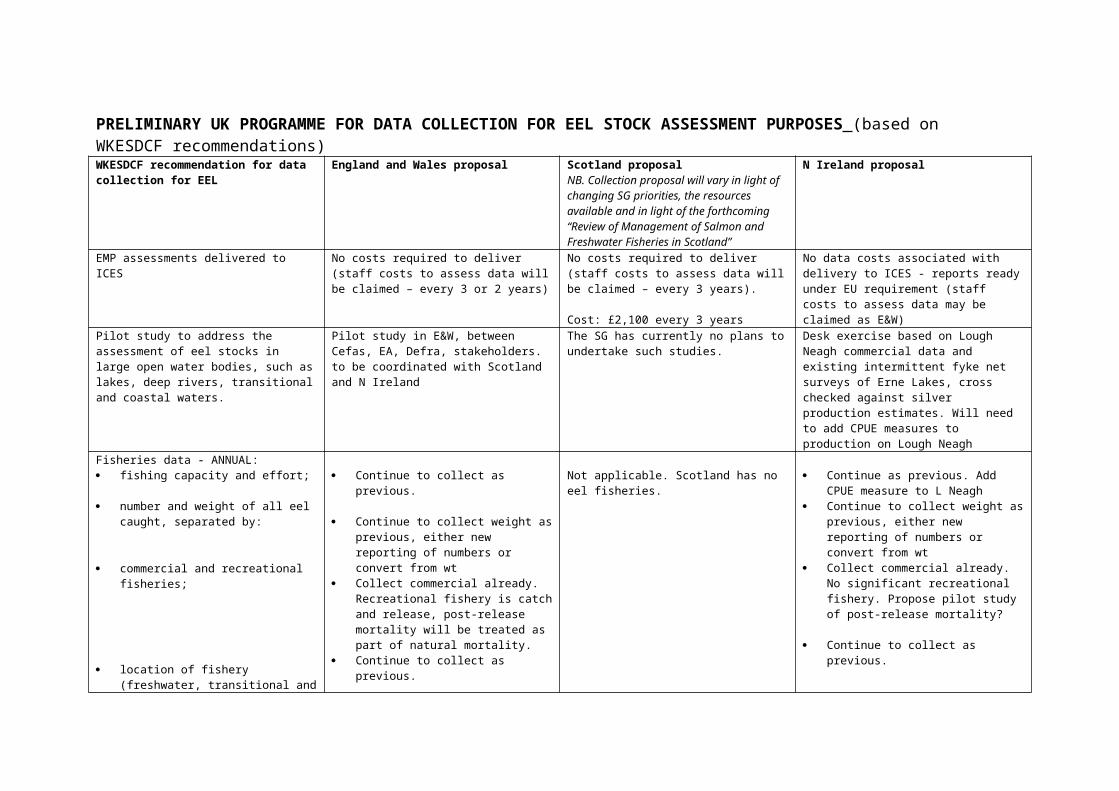
Area 27.IV+VIIdDEU DNK ENG ESP FRA GBR IRL NLD NOR SCT
BEL Crangon crangon 600511 273654 874165 0% 0% 0% 0% 0% 0% 0% 69% 0% 0%BEL Gadus morhua 219887 635919 855806 0% 0% 0% 0% 0% 0% 0% 26% 0% 0%BEL Limanda limanda 295730 255373 551103 0% 0% 0% 0% 0% 0% 0% 54% 0% 0%BEL Pleuronectes platessa 1815048 4122863 5937911 0% 0% 0% 0% 0% 0% 0% 31% 0% 0%DEU Ammodytes sp. 1708439 1708439 0% 100% 0% 0% 0% 0% 0% 0% 0% 0%DEU Clupea harengus 20327476 4187021 24514497 0% 1% 0% 0% 0% 0% 0% 82% 0% 0%DEU Gadus morhua 2072297 39771 2112068 0% 94% 0% 0% 0% 0% 0% 4% 0% 0%DEU Limanda limanda 235528 16653 252181 0% 10% 0% 0% 0% 0% 0% 83% 0% 0%DEU Lophiidae sp. 270275 4112 274387 0% 6% 0% 29% 0% 63% 0% 1% 0% 0%DEU Melanogrammus aeglefinus 452851 31549 484400 0% 93% 0% 0% 0% 0% 0% 0% 0% 0%DEU Merluccius merluccius 347781 29395 377176 0% 88% 0% 0% 0% 0% 0% 4% 0% 0%DEU Nephrops norvegicus 380402 4629 385031 0% 0% 0% 0% 0% 0% 0% 98% 0% 0%DEU Pleuronectes platessa 3604341 266446 3870787 0% 8% 0% 0% 0% 0% 0% 85% 0% 0%DEU Pollachius virens 5599109 2069436 7668545 0% 73% 0% 0% 0% 0% 0% 0% 0% 0%DEU Scomber scombrus 4558809 566 4559375 0% 0% 0% 0% 0% 0% 0% 100% 0% 0%DEU Solea solea 437700 2514 440214 0% 1% 0% 0% 0% 0% 0% 98% 0% 0%DEU Sprattus sprattus 464940 6000 470940 0% 99% 0% 0% 0% 0% 0% 0% 0% 0%DEU Trachurus sp. 5355678 34 5355712 0% 0% 0% 0% 0% 0% 0% 100% 0% 0%DNK Ammodytidae sp. 2615398 47267827 49883225 0% 0% 0% 0% 0% 0% 0% 0% 5% 0%DNK Clupea harengus 53676562 50023663 103700225 37% 0% 0% 0% 0% 14% 0% 0% 0% 0%DNK Scomber scombrus 18857800 17480799 36338599 0% 0% 0% 0% 0% 13% 0% 0% 39% 0%DNK Solea solea 357033.682 74651.074 431684.756 0% 0% 0% 0% 0% 0% 0% 83% 0% 0%DNK Trachurus trachurus 1507822 5908 1513730 0% 0% 0% 0% 0% 0% 0% 95% 5% 0%ENG Cancer pagurus 1875013 5455925 7330938 0% 0% 0% 0% 0% 0% 0% 14% 0% 12%ENG Clupea harengus 5735045 191250 5926295 0% 0% 0% 0% 0% 0% 0% 97% 0% 0%ENG Gadus morhua 861361 863659 1725020 0% 2% 0% 0% 1% 0% 0% 16% 0% 31%ENG Limanda limanda 566471 39386 605857 0% 4% 0% 0% 7% 0% 0% 83% 0% 0%ENG Lophius sp. 261833 66641 328474 0% 2% 0% 7% 0% 0% 6% 5% 0% 60%ENG Melanogrammus aeglefinus 595913 911623 1507536 0% 1% 0% 0% 0% 0% 0% 0% 0% 38%ENG Merlangius merlangus 360310 971367 1331677 0% 1% 0% 0% 14% 0% 0% 1% 0% 12%ENG Merluccius merluccius 221554 17965 239519 0% 12% 0% 0% 0% 0% 0% 7% 0% 74%ENG Microstomus kitt 291908 266347 558255 0% 2% 0% 0% 2% 0% 0% 44% 0% 4%ENG Nephrops norvegicus 307017 1371128 1678145 0% 0% 0% 0% 0% 0% 0% 0% 0% 18%ENG Pleuronectes platessa 13484821 1115818 14600639 0% 3% 0% 0% 0% 0% 0% 89% 0% 1%ENG Pollachius virens 1774388 25780 1800168 0% 53% 0% 0% 0% 0% 0% 0% 0% 46%ENG Psetta maxima 248905 65642 314547 0% 3% 0% 0% 0% 0% 0% 75% 0% 1%ENG Solea solea 259955 931204 1191159 0% 0% 0% 0% 0% 0% 0% 22% 0% 0%ENG Triglidae sp. 329726 160322 490048 0% 1% 0% 0% 36% 0% 0% 30% 0% 0%IRL Cancer pagurus 1286313 1325 1287638 0% 5% 0% 0% 0% 0% 0% 95% 0% 0%IRL Pecten maximus 210728 55820 266548 0% 0% 0% 0% 0% 79% 0% 0% 0% 0%IRL Scomber scombrus 10157827 10268063 20425890 0% 0% 0% 0% 3% 28% 0% 0% 19% 0%NIR Clupea harengus 5566783 5566783 0% 13% 0% 0% 0% 0% 73% 0% 0% 14%NIR Melanogrammus aeglefinus 339300 339300 0% 0% 2% 0% 0% 0% 0% 0% 0% 98%NIR Nephrops norvegicus 315430 315430 0% 0% 62% 0% 0% 0% 0% 0% 0% 38%NIR Scomber scombrus 6429012 6429012 0% 25% 0% 0% 0% 0% 0% 0% 56% 19%NIR Trachurus trachurus 469065 469065 0% 0% 0% 0% 0% 0% 84% 0% 0% 16%
Flag Country
Species Total landings abroad (kg)
Total landings into flag country (kg)
Total flag landings (kg)
Landing country
Page 149 of 176
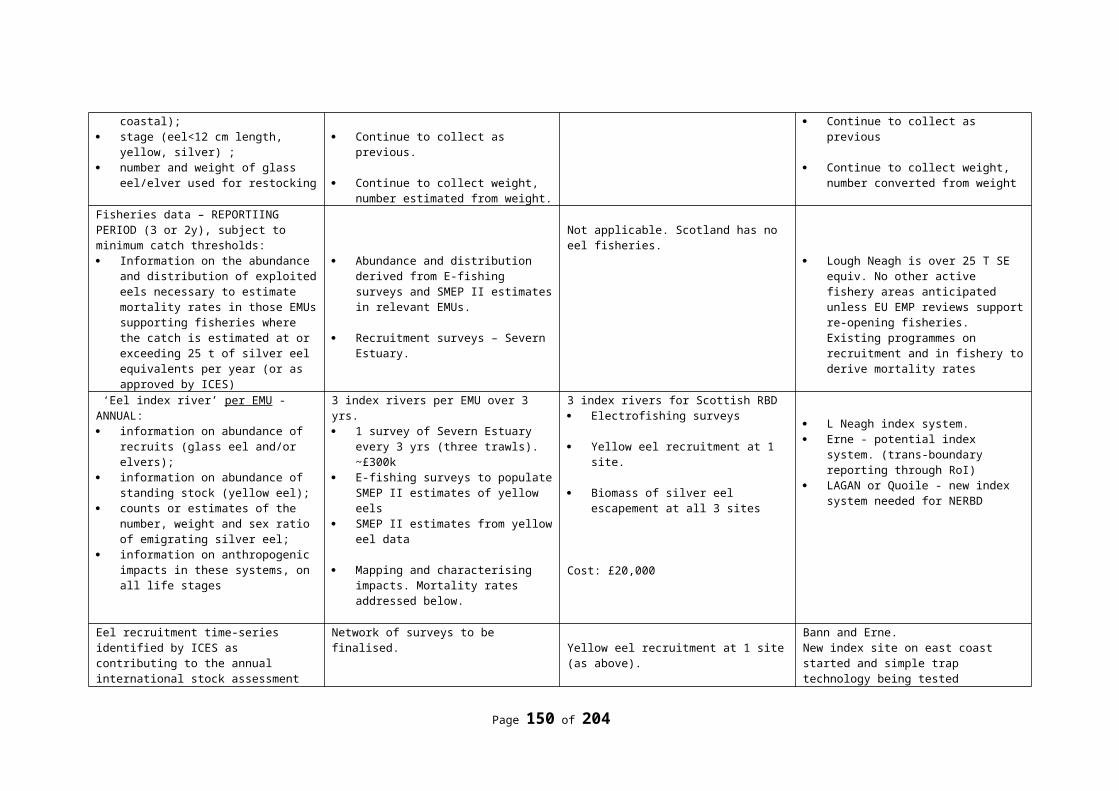
Area 27.IV+VIId (cont’d)
DEU DNK ENG ESP FRA GBR IRL NLD NOR SCTNLD Aspitrigla cuculus 224142 79074 303216 0% 0% 7% 0% 66% 0% 0% 0% 0% 0%NLD Chelidonichthys lucerna 707651 1053470 1761121 0% 2% 2% 0% 35% 0% 0% 0% 0% 0%NLD Crangon crangon 3205637 11436852 14642489 15% 7% 0% 0% 0% 0% 0% 0% 0% 0%NLD Gadus morhua 547723 1405766 1953489 0% 25% 0% 0% 2% 0% 0% 0% 0% 0%NLD Limanda limanda 528530 3608087 4136617 0% 10% 0% 0% 3% 0% 0% 0% 0% 0%NLD Merlangius merlangus 475669 429397 905066 0% 0% 3% 0% 48% 0% 0% 0% 0% 0%NLD Mullus surmuletus 229958 148645 378603 0% 0% 6% 0% 52% 0% 0% 0% 0% 0%NLD Pleuronectes platessa 1833074 29814215 31647289 0% 5% 0% 0% 0% 0% 0% 0% 0% 0%SCT Capros aper 1745000 1745000 0% 100% 0% 0% 0% 0% 0% 0% 0% 0%SCT Clupea harengus 9231408 24409678 33641086 0% 0% 0% 0% 0% 0% 0% 0% 27% 0%SCT Lophius sp. 357645 4382349 4739994 0% 0% 1% 6% 0% 0% 0% 0% 0% 0%SCT Nephrops norvegicus 1214519 7893666 9108185 0% 0% 13% 0% 0% 0% 0% 0% 0% 0%SCT Pecten maximus 5097470 4140813 9238283 0% 0% 55% 0% 0% 0% 0% 0% 0% 0%SCT Pleuronectes platessa 2045903 802170 2848073 0% 27% 4% 0% 0% 0% 0% 41% 0% 0%SCT Scomber scombrus 31841581 25450280 57291861 0% 8% 0% 0% 0% 0% 0% 0% 47% 0%SCT Sprattus sprattus 580247 70334 650581 0% 89% 0% 0% 0% 0% 0% 0% 0% 0%SWE Ammodytes sp. 5652000 5652000 0% 100% 0% 0% 0% 0% 0% 0% 0% 0%SWE Clupea harengus 12832000 1260000 14092000 0% 89% 0% 0% 0% 2% 0% 0% 0% 0%SWE Gadus morhua 456855 14536 471391 0% 97% 0% 0% 0% 0% 0% 0% 0% 0%SWE Pollachius virens 890252 32062 922314 0% 97% 0% 0% 0% 0% 0% 0% 0% 0%SWE Scomber scombrus 4270010 4270010 0% 21% 0% 0% 0% 76% 0% 0% 3% 0%SWE Sprattus sprattus 2223000 2223000 0% 100% 0% 0% 0% 0% 0% 0% 0% 0%
Flag Country
Species Total landings abroad (kg)
Total landings into flag country (kg)
Total flag landings (kg)
Landing country
Area 27.Vb+XII+XIV
GRL ISLDEU Reinhardtius hippoglossoides 1834061 2785319 4619380 0% 40%DEU Sebastes sp. 1779349 1557175 3336524 0% 53%EST Pandalus borealis 916746 916746 0% 100%LTU Sebastes mentella 587469 587469 0% 100%POL Reinhardtius hippoglossoides 361412 361412 100% 0%
Flag Country
Species Total landings abroad (kg)
Total landings into flag country (kg)
Total flag landings (kg)
Landing country
Page 150 of 176
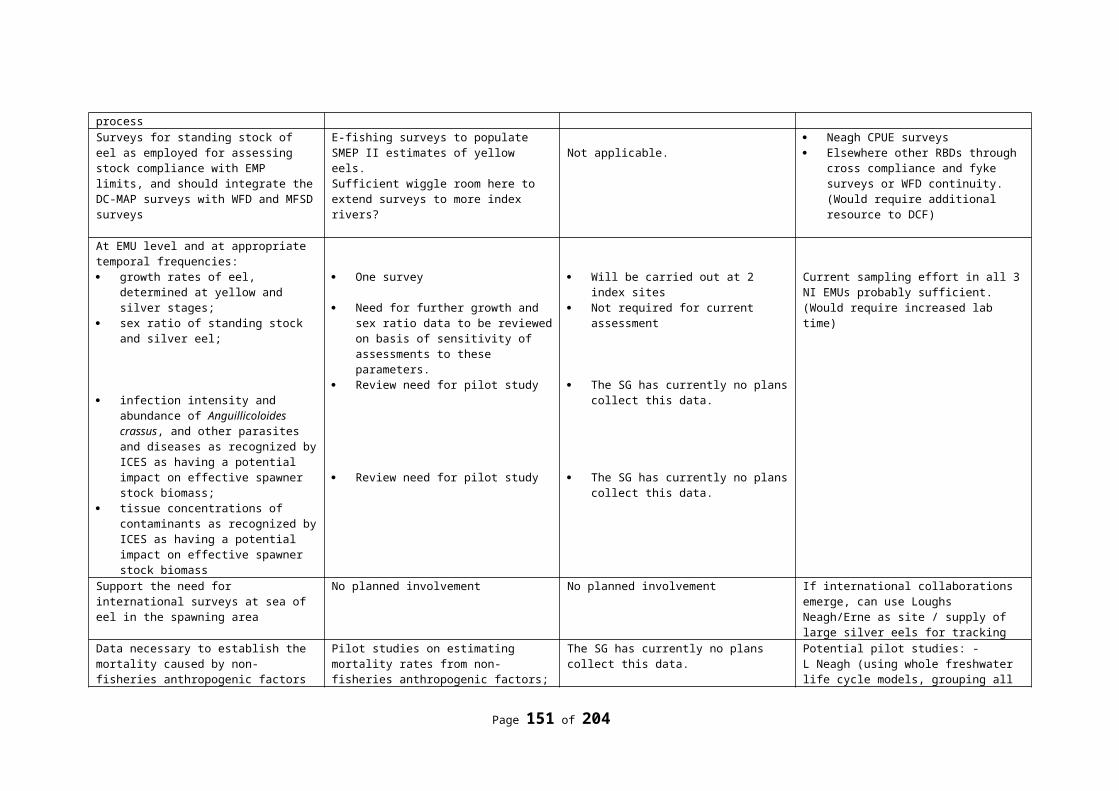
Annex 6: Comment by participants from MS on regional coordination
UK RCM members comments:
Role and responsibilities of the RCGs should include:- Consider regional data needs identified from end-user consultations, and identify if these are
being met through current NP achievements and existing regional coordination actions between Member States and third countries having sovereignty or jurisdiction over waters in the same marine region.
- Design and evaluate regional data collection schemes to meet regional needs in a cost-effective manner. This could be achieved through amendments to Annual Work Plans of Member States and through cooperation or task-sharing among Member States and with third countries where appropriate. The RCG would make recommendations on this to MS and end users, and where appropriate advise on the DC-MAP data requirements and how feasible they are to attain within available resources. A cost-effective and efficient regional coordination process requires end-users to prioritise their data requirements between objectives and within available resources.
- Audit national data collection schemes against best practice guidelines and make recommendations for improvements to design of MS data collection schemes to ensure data are fit-for-purpose and can be combined in a statistically robust manner across MS where required.
- Evaluate end-user requests for additional data collection, or modifications or termination of existing data requirements, using agreed criteria as proposed by STECF, and considering requirements for stability of data collection requirements and working within available DC-MAP EMFF budgets (i.e. new data requirements must be balanced by removal or reduction of other requirements).
Views on operational details of RCGs: - The RCGs will be a continuous process involving an annual programme of plenary meetings,
workshops and intersessional work to be agreed with the Commission. The RCGs should comprise a core group of MS representatives and Type 1 end users, with flexibility to invite external experts or stakeholders to meetings where required. Member States must ring-fence funding for their RCG members to allow them to fully carry out their responsibilities to the RCG.
- The task of the chair will be to coordinate the work of the group during and between meetings of the Regional Coordination Group, to work closely with the Commission in developing RCG ToRs and regional annual work plans, monitoring progress, and ensuring ToRs are fully addressed. The chair will liaise with end users to develop tasks for scientific and technical expert groups to help RCG address regional data collection issues or to establish workshops or study contracts to address specific issues.
- The RCG will operate through a 3-way collaboration and negotiation with MS and end users, to facilitate regional data collection schemes meeting end-user needs, make recommendations and ensure that MS obligations within the Decision are achievable and cost effective.
- MS must ensure that participants in regional coordination groups have the authority to consent to the decisions made by the group.
Portugal RCM members comments:Since PT participate in 3 RCMs and this item concerns the general aspects of the DC-MAP, cross all RCMs, PT will present its comments at the RCM NA (16-20 Sep), in which will participate with its NC.
Spain RCM members comments:
Till the moment, different collection programs have been developed in EU. All of them have laid the principles to improve scientific advice which is necessary to achieve the CFP objectives.
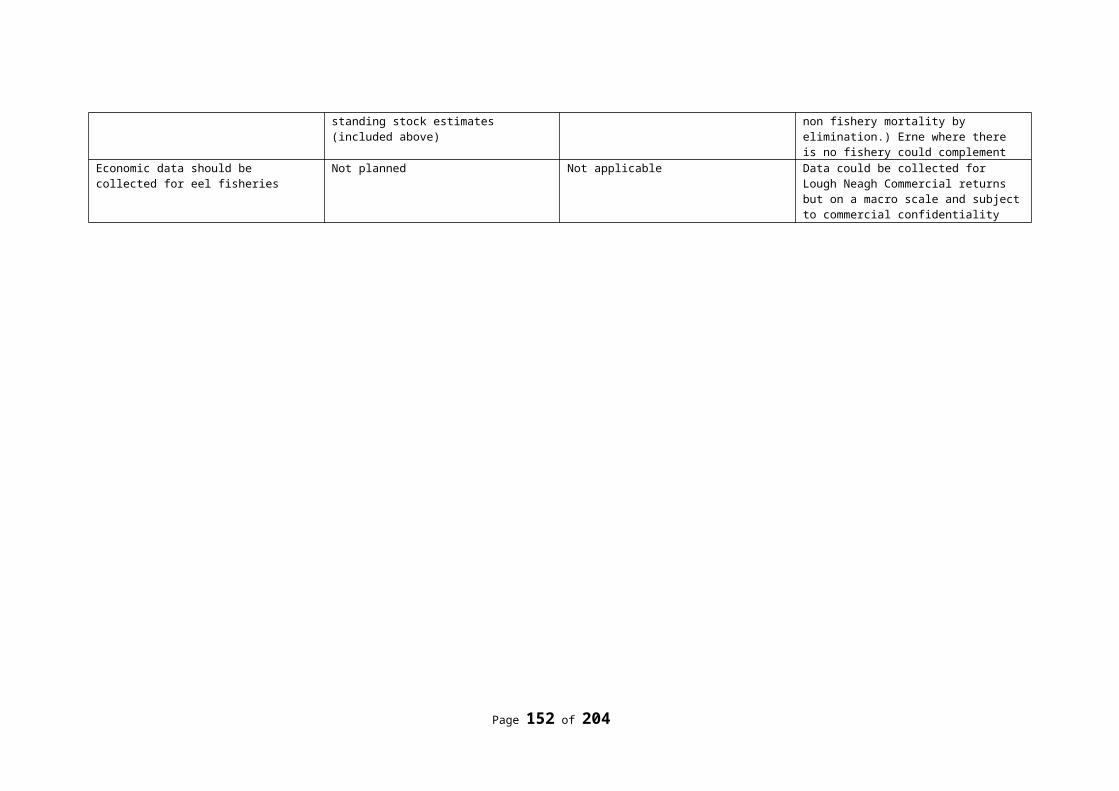
These multiannual programmes have established criteria for the collection, management and use of biological, technical, environmental and socioeconomic information in the fishing sector, under settings checked annually. Undoubtedly, RCMs have played a fundamental and priority role in this process, and certainly without its work data collection had not reached the targets.
There are many goals for the next years, as stated in the new CFP. So the new data collection framework is facing a lot of important challenges. The CFP has new demands; we must meet the requirements for financing with a new financial instrument with shared management, and planning work in a multiannual framework broader than the last periods.
Therefore the next route should be realistic, adapted to financial availability and taking into account the human and material resources. The principal premises are requirements harmonisation and the cost- benefit analysis. So it would not be feasible to have different programmes of data collection, which complicate not only the tasks collection but certainly management and transmission thereof. There is no doubt that the most successful option is to continue with a single, coordination framework for the collection, management and transmission of basic information. Although it is not an obstacle to use the flexibility for making punctual and necessary adjustments.
Undoubtedly the new regional groups are key actors in the framework of the new DC-MAP according to the Commission's proposal. In the meetings should be discussed the activities prior to their development. It is important to stress that this activity is an exclusively an ex – ante condition, and not a final decision, being required the submission to the Commission, the intervention of the Member States and the STECF evaluation.
In the new framework for data collection, it should be clear the role of these groups, components and its contribution to data collection.
In our opinion these groups should not be established as bodies with final decision power. They should have sufficient capacity to analyse proposals, applying different type of analysis and evaluating the final application. Therefore its role must be eminently technical. We believe that the role of these bodies should be give recommendations. This is a fundamental role for the future data collection proper functioning, and with significant financial implications.
So the groups will have a clear responsibility for give recommendations /comments to Member States, but only from a technical point of view. This process should be led by the chairman, who should have an intense coordination work. We must be realistic and ensure the ratio cost benefit in the request of data. The final Member States coordination is essential.
In the new period we have to prioritize the necessary information and apply correct designs to achieve it. We have to prepare similar basic queries for all regions avoiding duplication and optimizing response times.
The ultimate goal is that the information collected would be useful and meet the real needs of end-users.
Swedish RCM member comments on the role of the RCG
We support the idea of dynamic regional coordination groups. The main aim for this group should be to facilitate that sampling resources within a region is utilized in an effective way allowing the data collection to support advice on a regional scale for different end-users. The task of the RCGs should further be to make sure that data is collected in a way that quality (bias and precision) could be assessed in a transparent way all the way from the sampling event to the production of regional estimates ( RCGs need to make sure that best practices are implemented and that sampling and estimation processes are harmonized were needed). To achieve this, the regional database needs to be a backbone in the RCG work and the RCGs need to have the responsibility to govern the content of the RDB as well as identify areas of improvement.
The RCMs need to change their way of work and turn into more dynamic groups with a larger base of expertise. There must be a possibility for independent experts to be invited, for end-users to interact with data collectors and for MS to divide tasks between them. This implies that different participants
Page 152 of 176
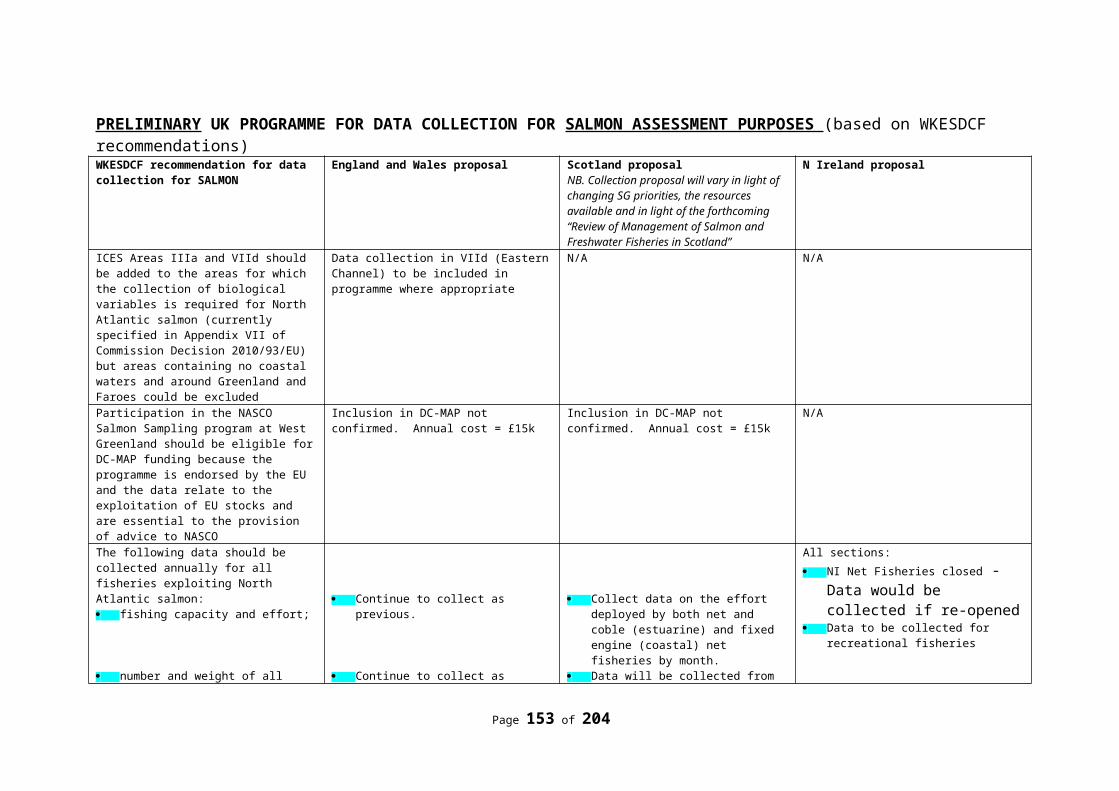
probably need to have different roles and mandates (e.g. an independent expert may not take part in an actual decision). These roles and mandates need to be carefully considered.
Tasks for the RCGs could include:- Propose and agree modifications to the NWP to achieve the regional requirements - Evaluate the proposed Annual Work Plans (AWP) in relation to the regional requirements - Propose and agree modifications to the AWP to achieve the regional requirements. - Share the views and advise MS on their proposed Annual Work Plans in relation to application
of rules of good practice - Discuss on compilation of indicators to assess the importance of fishery and related activities
at the level of administrative areas - Produce an annual (?) data-call to the MS to upload data in the Regional Data Base (RDB)- Evaluate the data call RDB, identify gaps, feed back to the MS, and deliver guidance to MS- Rank the fishing activities on a regional level according to agreed criteria, in order to assess
the sampling responsibilities and agree on exemption rules - Contribute to the evaluation of the quality of the data uploaded in the RDB by MS . - Advice to further developing the RDB - Manage and evaluate bilateral agreements between MS - Update reference tables- Update database recommendations- Advice WGs/steering group on studies/project proposals- Different groups dealing with different regional topics are established and work
intersessional. Members of these groups are relevant experts from MS.
Suggested Members of the RCGs:- EU representative- Experts from Member states- End user type 1, on invitation type 2 or type 3- Observers (industry, NGO): 1-2- Third countries: on invitation- Independent expert: on invitation (topic related: topics can be
- Quality- Statistical sound sampling schemes et al
Page 153 of 176
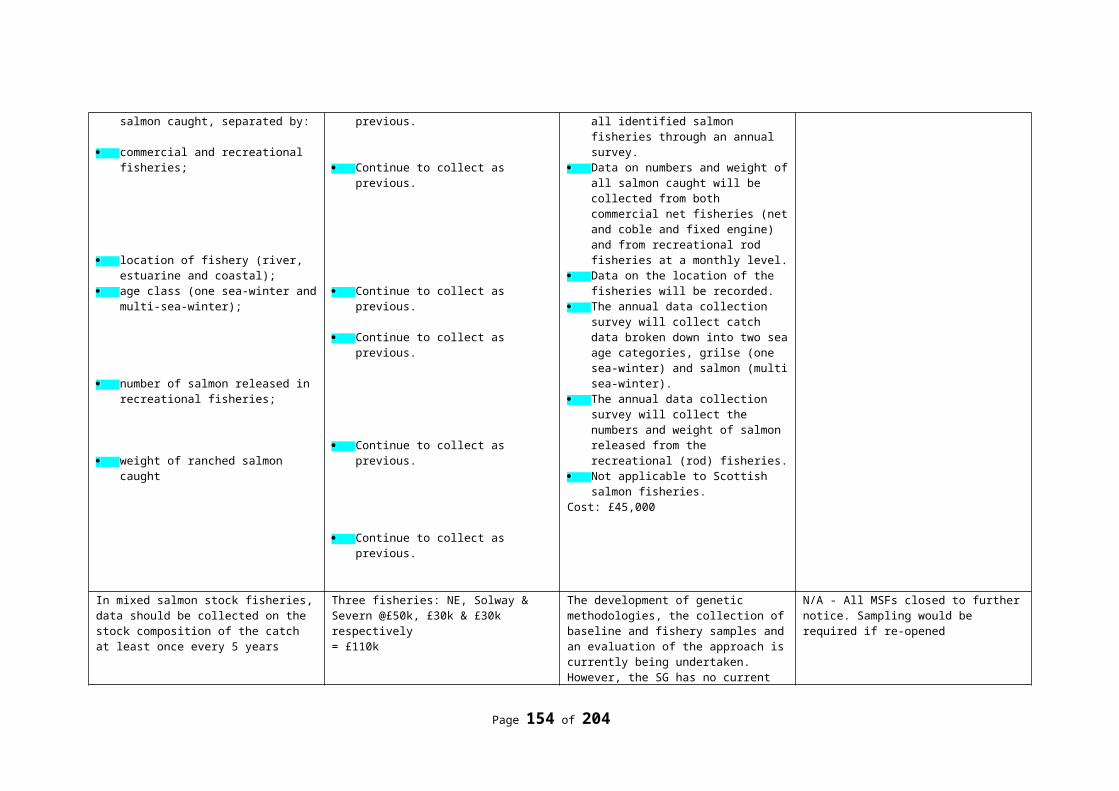
Annex 7: Future of PGCCDBS
Role and operation of PGCCDBS
The ICES Planning Group on Commercial Catches, Discards and Biological Sampling (PGCCDBS) was established in 2002 in response to the EC-ICES Memorandum of Understanding (MoU) requesting ICES to provide support for the EU Data Collection Framework (DCF). It implements the ICES Quality Assurance Framework to ensure that data sets and parameters supporting assessments and advice for the ICES area are based on i) statistically-sound sampling schemes; ii) correct and consistent interpretation of biological material such as otoliths and gonads; iii) technology that improves accuracy and cost-effectiveness of data collection; iv) comprehensive and easily sourced documentation, and v) efficient collaboration between PGCCDBS, expert groups and other bodies in relation to data collection.
The outputs of the series of PGCCDBS meetings and associated intersessional work such as workshops and exchanges form an extremely valuable resource summarising current state of knowledge in Europe and worldwide. In many cases, a high degree of technical and scientific competence has been required for PGCCDBS workshops (such as sampling design and data analysis), and leading experts from Europe and overseas have been involved.
The recent meetings of PGCCDBS have focused on work completed since the last year, planned work for the current and next year, in the following topics which have formed the basis of the Terms of Reference:
- Stock-based biological parameters from sampling of fishery and survey catches (age, growth, maturity, fecundity, sex ratio)
- Fleet/metier related variables (discards estimates and length/age compositions of landings and discards) and statistical design of sampling schemes
- Data collection technology (hardware, and software such as WebGR and the Regional Data bases).
- Implementation of the ICES Quality Assurance Framework
- Addressing recommendations and requests for advice from ICES expert groups (including through PGCCDBS data contact persons), and RCMs.
The PGCCDBS meets in parallel with the Planning Group for the Mediterranean Sea Data Collection (PGMED) to review the outcomes of a wide range of workshops and age exchanges.
The PGCCDBS has over 40 members and the annual meeting of five days is typically structured around plenary presentations of the outcomes of intersessional workshops and age exchanges, followed by three sub-groups working in parallel to address ToRs related to biological parameters, fleet-based sampling, data collection technology or any other specific requests, with further plenaries to review subgroup outcomes and agree the report content and proposals for future work. Future work on age and maturity is partly driven by schedules for age exchanges etc. provided through age and maturity interactive tables developed by the PG, and specific requests from assessment expert groups.
The PGCCDBS in 2013 and beyond
The body of data and knowledge, and the competences of PGCCDBS, have increased over time, but this has also served to highlight the limitations in data and understanding. Furthermore, by raising the level of awareness of these issues in other ICES Expert Groups, a wide range of requests for advice are being sent to PGCCDBS. As a result, the scope of the subgroups has expanded over the last few years. For example, the fleet-based subgroup has spent increasing time on issues of statistical sampling design (building on outcomes from the PGCCDBS-derived Workshop on Practical Implementation of catch Sampling (WKPICS) and Study Group of practical Implementation of Discards Sampling (SGPIDS)) and how to report data quality, whilst the biological parameters subgroup is
Page 154 of 176
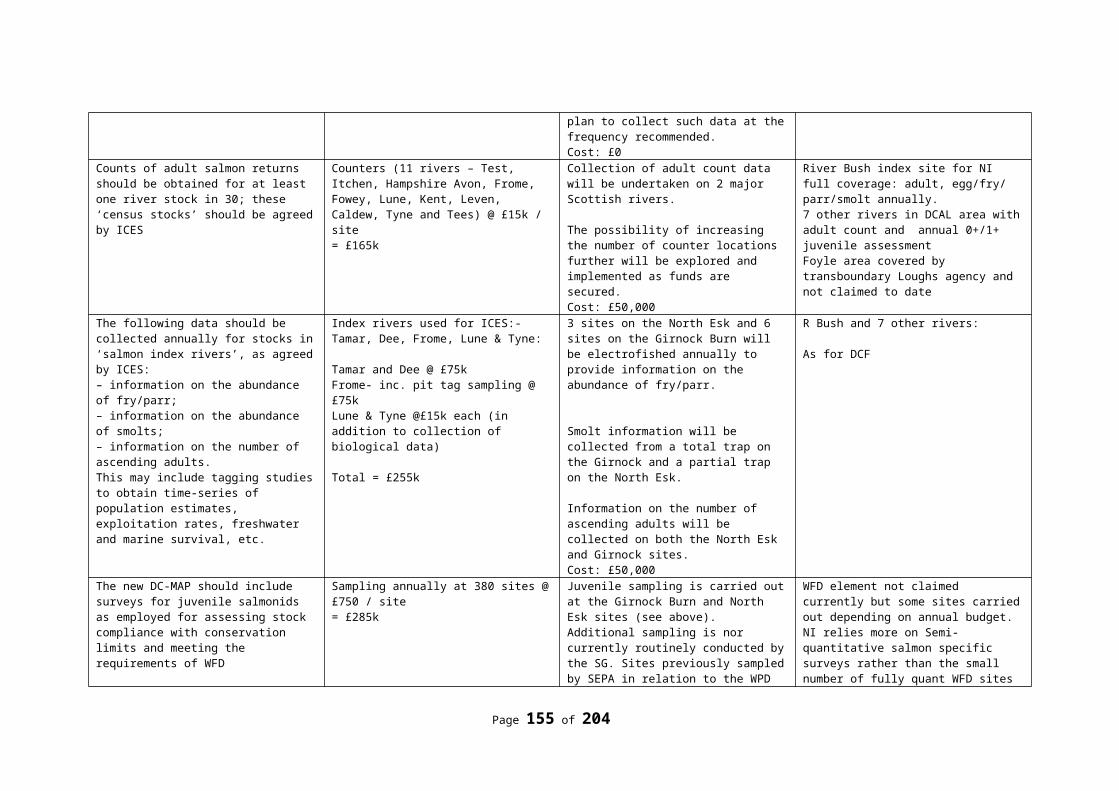
facing an ever-increasing body of information from age exchanges and calibration studies, and age/maturity workshops, along with the need to develop quality indicators for assessment expert groups. Whilst the subgroups have remained very productive, the amount and complexity of material being produced, and the volume of responses to external requests, has meant that PGCCDBS outputs are not being reviewed as comprehensively as desired during the meeting, increasing the amount of post-PGCCDBS work by the Chairs and subgroup members and reducing the synergy of having many experts together in the same room.
During the 2013 PGCCDBS meeting, members of the fleet subgroup proposed that their work would be better undertaken during a dedicated Working Group, which would allow more time to focus on its ToRs and develop its role to meet the changing demands for fishery data in coming years. This WG would also build on the comprehensive frameworks developed through SGPIDS and WKPICS and the earlier workshops on data collection and data quality evaluation dealing with data accuracy (WKACCU), precision (WKPRECISE) and merging different metier (WKMERGE). A proposal for a Working Group on Commercial Catches (WGCATCH) was developed (see Annex 6 of PGCCDBS 2013 report).
During the 2013 meeting of the Workshop for National Age Reading Coordinators(WKNARC), a similar conclusion was reached that PGCCDBS is no longer the ideal vehicle for coordinating and developing the collection, interpretation and use of data on biological parameters, and that a new Working Group on Biological Parameters (WGBIOP) should be formed (see proposal in Annex XX of WKNARC 2013 report).
Future options
Considering i) the proposal to established WGCATCH and WGBIOP, iii) the current workload at PGCCDBS meetings, iii) the link with PGMED, iv) the inputs from the WGRFS and v) the surveys related a new setup of PGCCDBS is needed. Several options are currently being discusses considering how these WGs would fit into the larger picture of ICES work on data quality and understanding of biological processes.
The PGCCDBS exists within a broader set of activities aimed at facilitating the process of data collection under the DCF, and ensuring the quality and cost-effectiveness of the data collection across Member States. Other related meetings linking with PGCCDBS are:
- The Regional Coordination Meetings for the North Sea & Eastern Arctic; North Atlantic; Baltic; Mediterranean & Black Sea; Long Distance fisheries. (Their purpose is to coordinate the activities of Member States in meeting DCF data collection requirements);
- PGMED (which meets in parallel with PGCCDBS)
- PGECON (established in 2012 to discuss methodological and coordination issues related to the economic modules of the DCF at European level - fleet economic data, aquaculture, processing sector).
- The annual Liaison Meeting (LM) which includes: the chairs of STECF DCF EWG’s (formerly chairs SGRN and SGECA); the chairs of the different RCMs; the Chairs of PGCCDBS, PGMED and PGECON; ICES secretariat; European Commission representatives. (Held annually to analyse the RCM reports in order to ensure overall coordination between the RCMs. On the basis of the reports, the LM makes recommendations to the Commission.)
Currently there is a system of recommendations and responses passing between ICES assessment expert groups and PGCCDBS via the PGCCDBS Contact Persons on the Expert Groups, and also passing between PGCCDBS, the RCMs and the Liaison meeting. The RCMs and LM also make recommendations to Member States, which in turn are expected to list the recommendations and responses in their Annual Reports of DCF activities and achievements. The recommendations process has been streamlined by ICES which has set up a Recommendations Database and has taken action to limit the number of recommendations being generated.
Any revision of the structure and role of PGCCDBS and formation of a WGCATCH and WGBIOP would need to ensure that the current system is improved as a result, and is at least made more efficient and cost-effective than at present. Three general options for a revised structure are given below.
Page 155 of 176
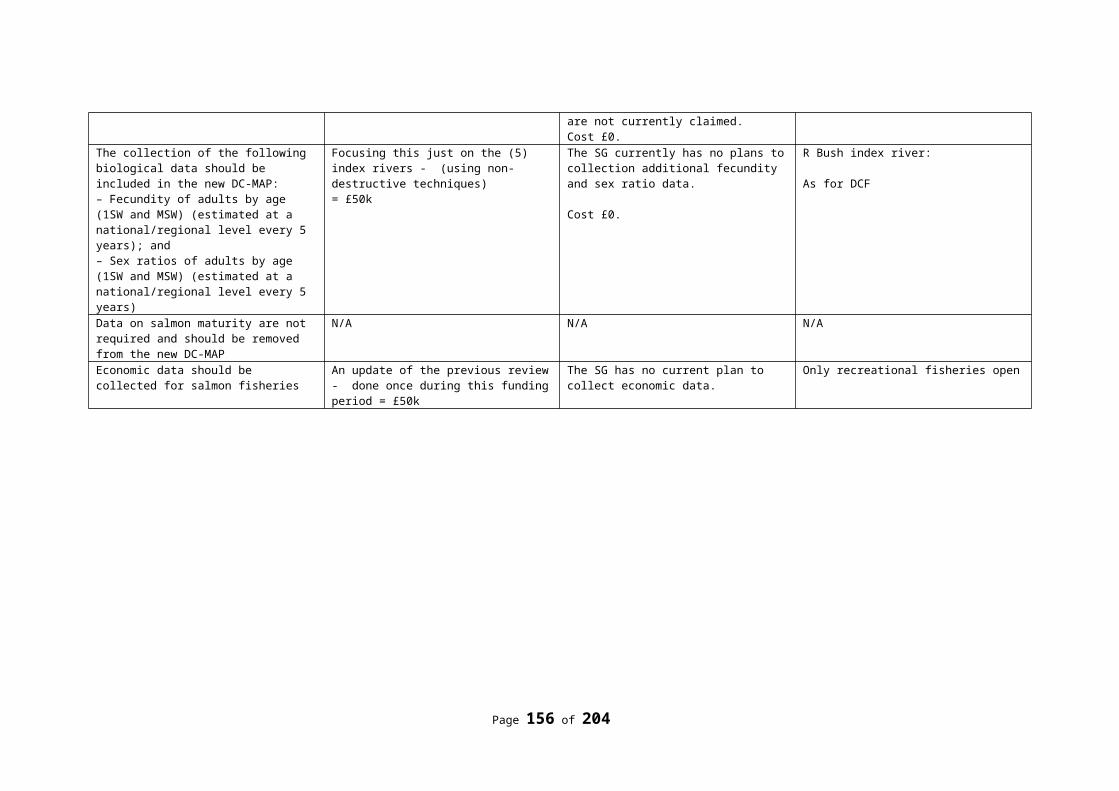
Option 1: No change to present system (Figure 18.1)
PGCCDBS remains in its present form, and WGCATCH and WGBIOP are not formed.
- Advantages: No overhead involved in establishing a new structure. Costs remain about the same.
- Disadvantages: The problems of work overload at the PGCCDBS meeting remain and are likely to get worse over time. Further development is inhibited as a result. The work of subgroups is often an extension of work carried out in workshops established by PGCCDBS, and there is a cost for PG members also attending the workshops as well as some duplication of effort.
Figure 18.1. Current relationship between PGCCDBS and other related data groups and end users
Option 2: WGCATCH and WGBIOP are formed, and PGCCDBS continues as a higher-level form of steering group (Figure 18.2)
In this option, WGCATCH would remove PGCCDBS tasks related to fishery sampling at sea and on shore whilst continuing the work of WKPICS and SGPIDS. WGBIOP would similarly remove PG tasks on ageing and maturity. The two WGs would go beyond what has been done previously at workshops and PGCCDBS by including more science development as well. In this option, a much reduced version of PGCCDBS remains, with a primary role as a steering group for the two WGs and to act as the intermediary between the WGs and end users. In this case it may make sense to include WGRFS (which derives from the first Workshop on Sampling Methods for Recreational Fisheries set up by PGCCDBS in 2009) into the triad of data-related ICES Working groups that partially or totally deal with sampling of commercial fisheries for DCF-DCMAP purposes and other end uses.
- Advantages: i) The problems of work overload at the PGCCDBS meeting are resolved by separating out the work of the two main subgroups into separate Working Groups. The new WG structure allows more opportunity to develop the science to address a broader range of end uses. ii) Experts with interest in both areas, i.e. catch sampling and biological parameters, will have the change to cover both meetings, may attend both meeting, while now is unfeasible with in the PGCCDBS sub-groups setup. iii) Allow the participation of Mediterranean and Black Sea experts at the WGCATCH and WGBIOP, while before was not possible due to the overlap between PGMed and PGCCDBS. iii) Better incorporation of recreational fisheries sampling within the DC-MAP structure; iv) Better incorporation of
Page 156 of 176
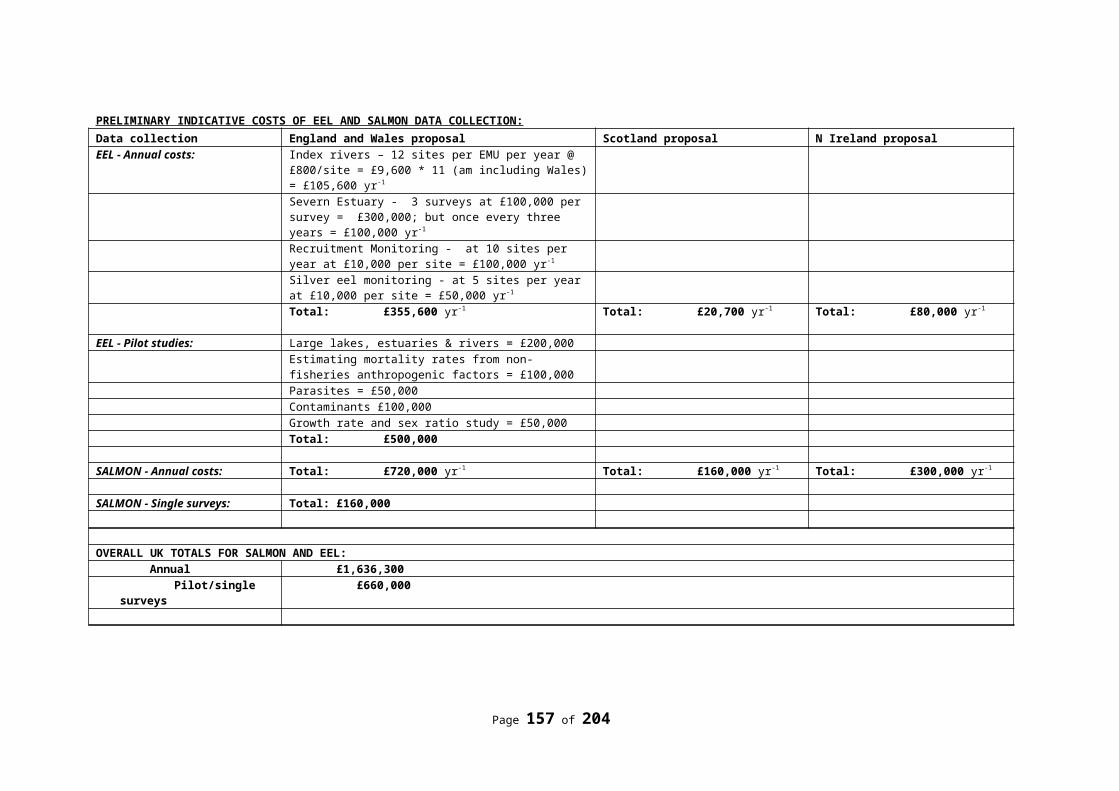
surveys coordination / evaluation within the DC-MAP structure; v) Better incorporation of eels and salmon sampling within the DC-MAP structure;
- Disadvantages: i) The coordination role of the down-sized PGCCDBS and the Liaison Meeting become confused. ii) There will be additional costs for individuals who attend the WGCATCH or WGBIOP as well as the revised PGCCDBS, and for individuals who now want to attend both WGs (this may be mitigated by careful management of participation, and note also that costs associated with previous PGCCDBS workshops/study groups such as WKNARC, WKPICS, SGPIDS are terminated). iii) The benefits of PGMED meeting at the same time and place as PGCCDBS will be reduced as the WGCATCH/WGBIOP will probably meet at different times. The recommendations process will probably become more complex.
Figure 18.2. Relationships between data groups and ICES expert group end users following the formation of WGCATCH and WGBIOP with PGCCDBS restructured as a form of steering group for the three fishery and biological parameter data Working Groups.
Option 3: WGCATCH and WGBIOP are formed, and the Liaison Meeting is strengthened into a Liaison Group which includes the chairs of WGCATCH, WGBIOP, WGRFS, PGMED, PGECON and RCMs to develop an overall steering responsibility in relation to DC-MAP requirements (Figure 18.3).
This option removes completely the need for a PGCCDBS.
- Advantages: The overall coordination system for DC-MAP related data collection is simplified whilst allowing the triad of WGRFS, WGCATCH and WGBIOP the time to also develop the science in ways that benefit all end users. The costs associated with maintaining a form of PGCCDBS are removed. It could be considered if the chair of the SCICOM Steering Group of Ecosystem, Science, Survey and Technology (SSGESST) could contribute productively to the Liaison Group given the key role of surveys in national DCF programmes (noting an increase in cost for this). Experts with interest in both areas, i.e. catch sampling and biological parameters, will have the change to cover both meetings, may attend both meeting, while now is unfeasible with in the PGCCDBS sub-groups setup.
- Disadvantages: There will still be some additional cost to MS and the Commission for individuals who attend both the WGCATCH and WGBIOP rather than the single PGCCDBS meeting (this may be mitigated by careful management of participation and by removing the costs associated with also participating in PGCCDBS). The benefits of PGMED meeting at the
Page 157 of 176
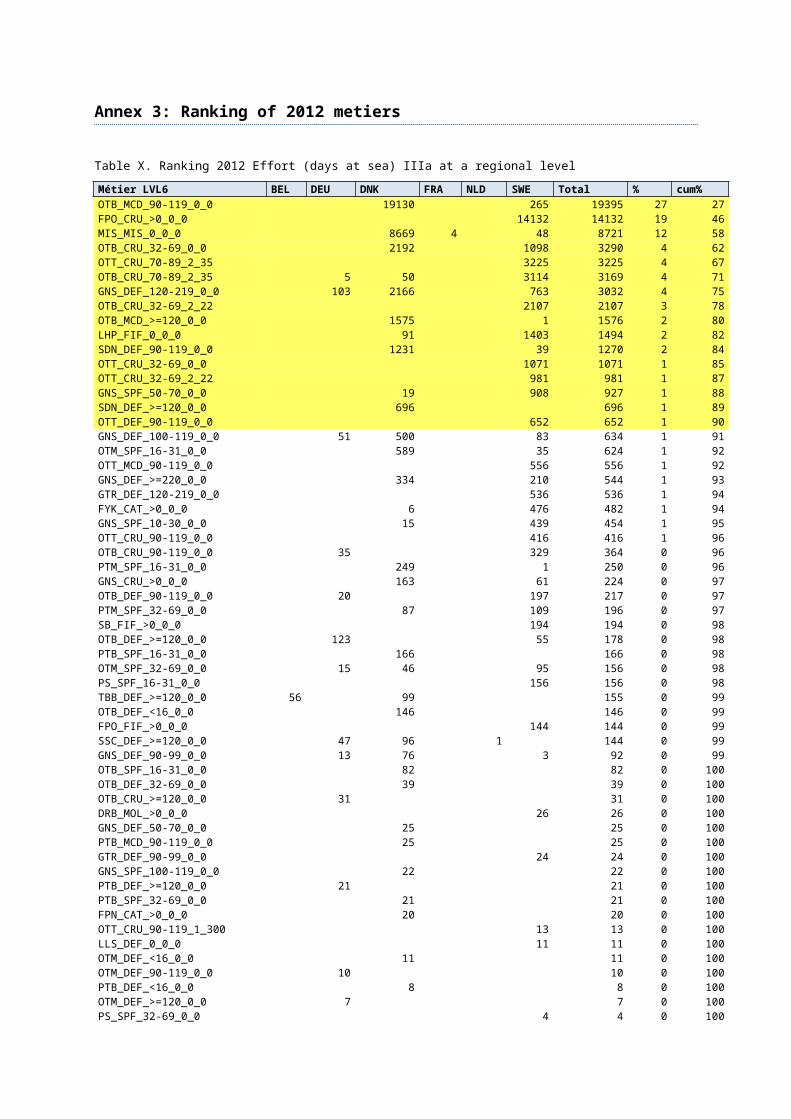
same time and place as PGCCDBS will disappear as the WGCATCH/WGBIOP will probably meet at different times. This linkage will have to occur through the Liaison Group. The recommendations process will be more efficient than option (2).
Fig18.3. Relationships between data groups and ICES expert group end users following the formation of WGCATCH and WGBIOP, with PGCCDBS merged with the Liaison Meeting to form a Liaison Group.
Page 158 of 176
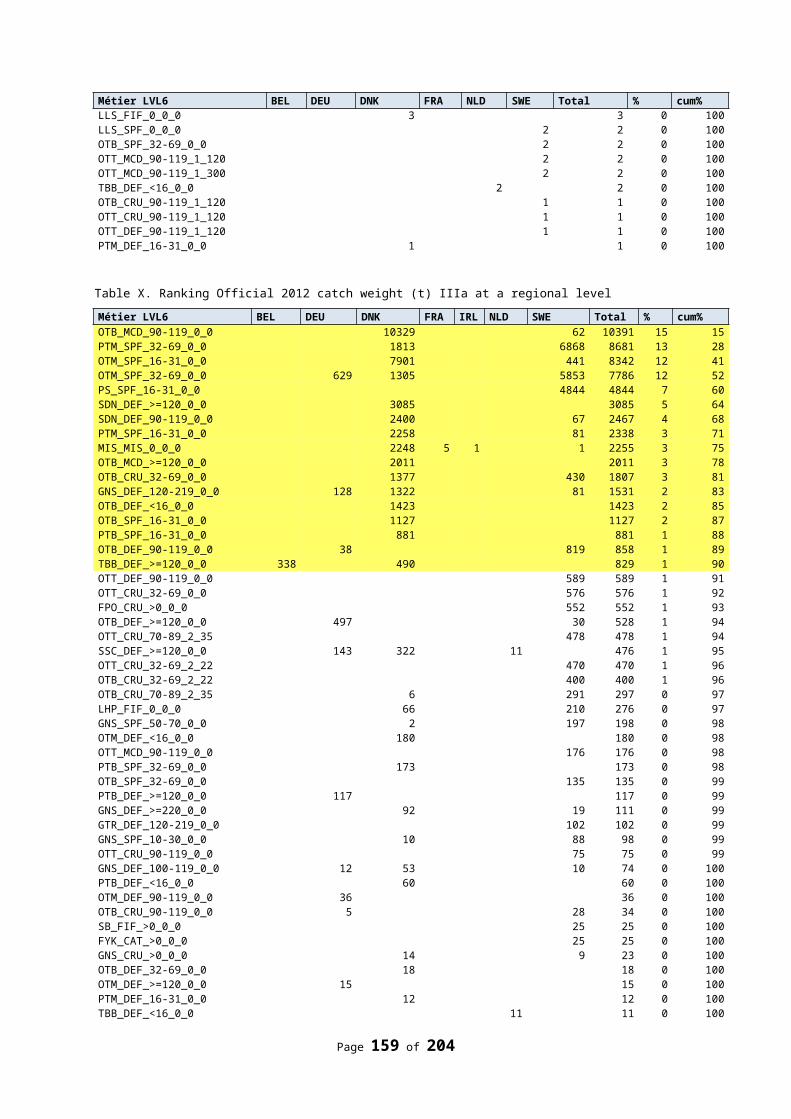
Annex 8: Agenda of the meeting
EU DATA COLLECTION FRAMEWORK (DCF), REG. 199/2008, 665/2008 AND DECISION 93/2010/EU
Regional Co-ordination Meeting for the North Sea and East Atlantic
Vigo, 9 – 13 September, 2013European Fisheries Control Agency (EFCA)
Agenda (draft)
General time schedule:Monday14.00 - 18.00 - meeting time16.00 – 16.30 - Coffee break
Tuesday – Thursday09.00 – 18.00 - meeting time10.30 – 11.00 - Coffee break13.00 - 14.30 - Lunch16.00 – 16.30 - Coffee break
Friday09.00 – 13.00 - meeting time10.30 – 11.00 - Coffee break
Monday plenaryTuesdayWednesday subgroup breakThursdayFriday
9:00 to 10:30 11:00 to 13:00 16:30 to 18:0014:30 to 16:00
Page 159 of 176
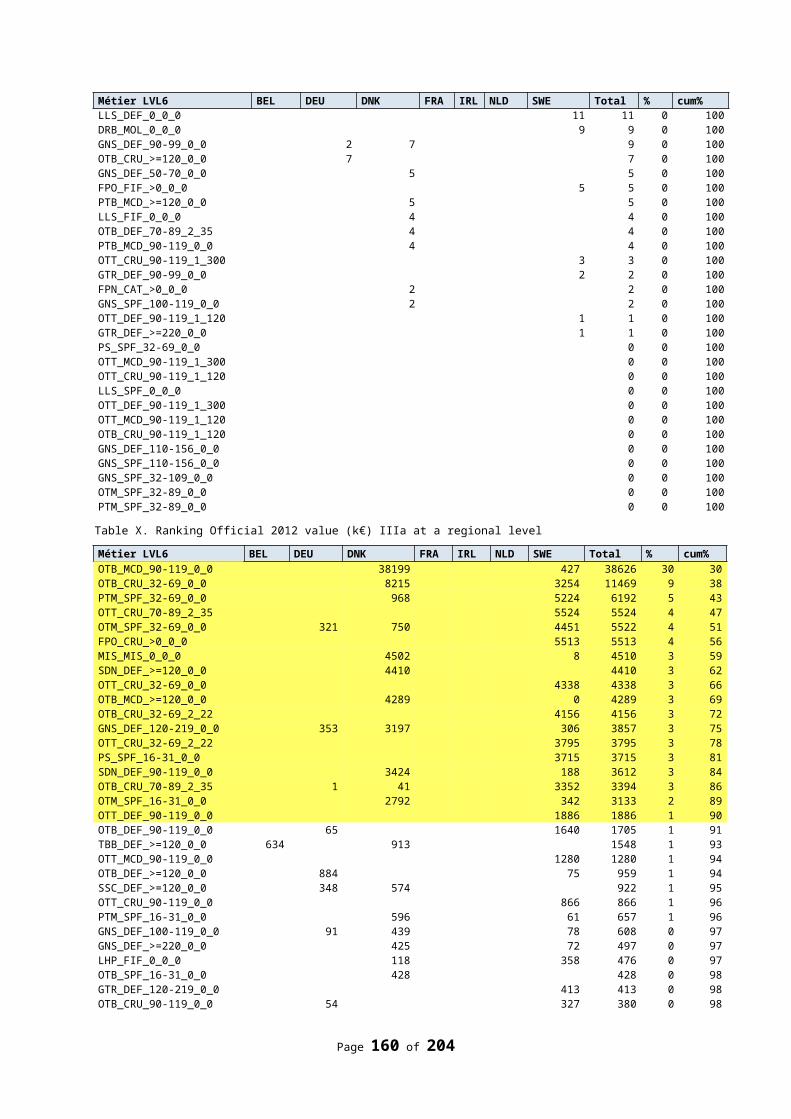
Monday, 9 September 201314.00 - 14.30 : Plenary session:
Welcome, introduction of the participants, organization & house rules, adoption of the agenda and appointment of subgroups & rapporteurs
14.30 – 16.00 : Plenary session - ToR 1 :
- Review progress in regional co-ordination since the 2012 RCM (follow-up of recommendations).
- Review of the outputs of RCM 2012. - Review the bilateral and multilateral agreements in place. - Review of the outputs of the 9th Liaison Meeting (Brussels, October 2012).
16.00 – 16.30: Coffee break
16.30 – 18.00 : Plenary session - ToR 1 (cont.)
- continue discussions
18.00 End of the day
Page 160 of 176
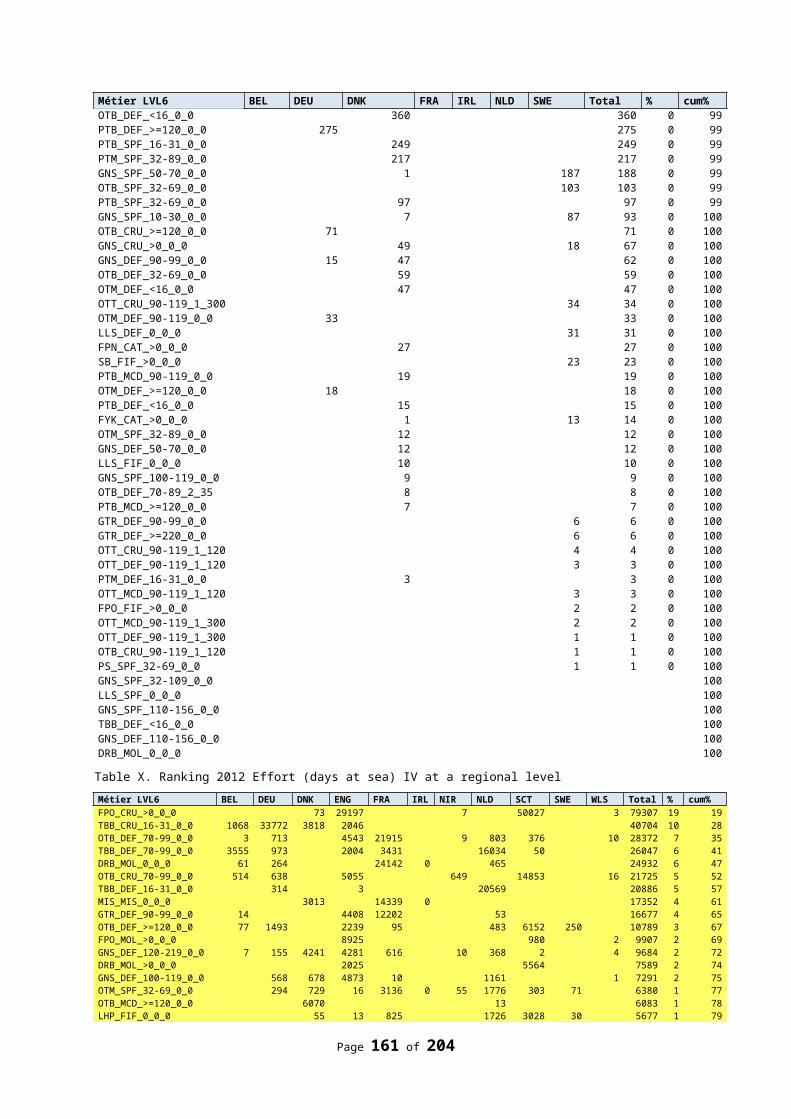
Tuesday, 10 September 20139.0-10.30 : Plenary session: Tor 2 and ToR 5 Presentations and discussions:
ToR 2 Review feedback and recommendations from data end users
- STECF EWG Presentation of STECF process to advice the Commission on DC-MAP
ToR 5 Provide feedback on the draft EU MAP2014-2020
- progress with development of DC-MAP - logistic processes in DC-MAP (templates, evaluation and approval of AWP and AR, financial
matter) - actions to be taken by MS NOW for 2014
Questions by MS to the Commission
- DC-MAP presentation of the Consultation Document (CD) (circulated to all NC’s) and the STECF EWG 13-05 report.
- Presentation by each MS on their view on the documents (CD and EWG 13-05).
10.30 - 11.00: Coffee break
11.00 - 13.00 : Plenary session
ToR 5 continued.
- Presentations continued- Discussion common understanding of the new DC-MAP and hopefully helpful feedback to the
Commission can be agreed.
ToR 5 What does the new CFP change to data collection?
- landing obligation - new elements in CFP which affect data collection
13.00 – 14.30: Lunch break
14.30 - 16.00 : Plenary session
ToR 3 Regional Coordination.
- Regional Coordination under the DC-MAP (summary of idea’s expressed by EWG)
- Would it be possible to establish a regional data collection programme and how should the upcoming Regional Coordination Groups (successor of the RCM’s) work? What responsibility should a chairman and possibly a co-chair be given? Presentation/response of each MS’s view.
- Proposals for cooperation activities between Member States that could be put forward for funding under the EMFF (ref. Article 85 (2)e).
16.00 - 16.30: Coffee break
16.30 - 18.00 : Plenary session
ToR 3 continued.
- Response to the 2013 RCM data call- Problems encountered with uploading data in FishFrame. MS response. Each MS has to
prepare max ½ page for the report. - Regional Data Bases (present and future)
ToR 2 Review feedback and recommendations from data end users
- ICES feedback to DC-Map - ICES assessment WGs and benchmark meetings
Page 161 of 176
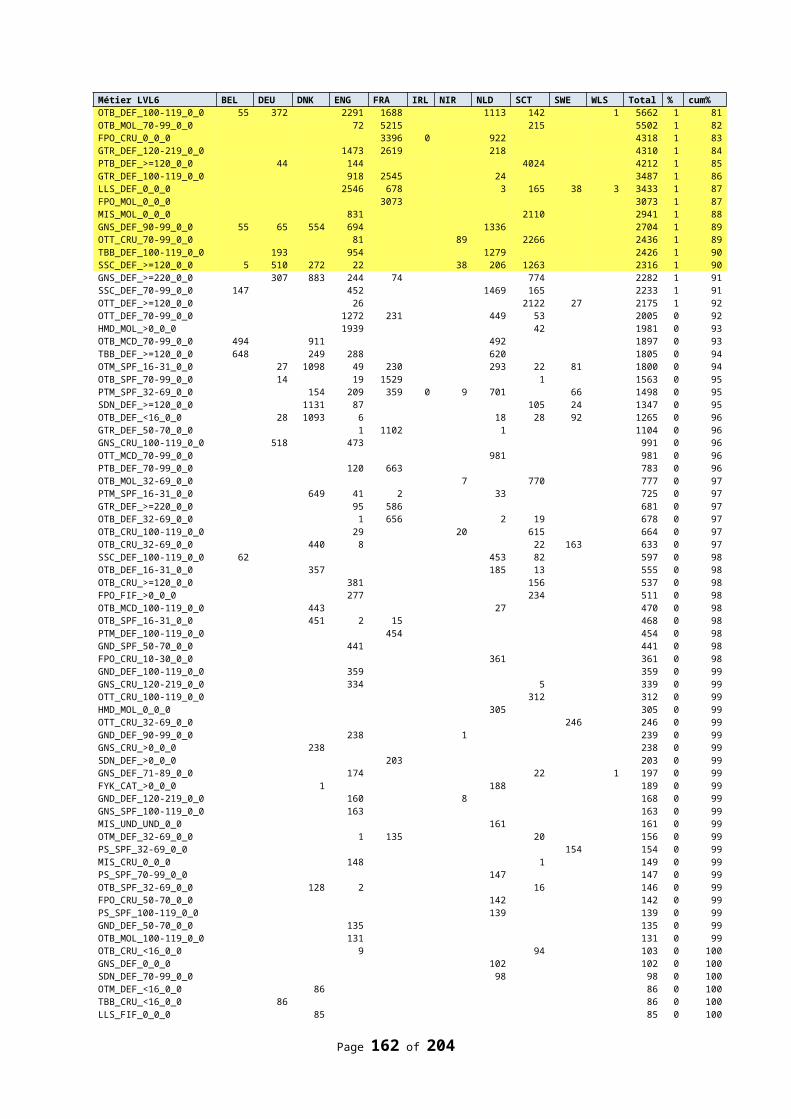
- PGCCDBS - PGRFS
ToR 4 Review of the progress on quality control, validation etc.
- Presentation on the outcome and results of the latest SGPIDS - and SGPICS
Establishing sub-groups
Tor 7 Sub-group A: Ranking of metier based on data from the Data Call and the RDB to find out whether changes are needed in the 2014-2016 National Programme.
Tor 7 Sub-group B: Developing statistical sound harmonised sampling programmes based on information in the RDB.
Tor 4 Sub-group C: Data Quality Issues.
18.00 End of the day
Wednesday, 11 September 20139.00 - 10.30 : Sub-groups work
10.30 - 11.00: Coffee break
11.00 – 13.00 Sub-groups work
13.00 – 14.30: Lunch break
14.30 – 16.00 Sub-groups work
16.00 - 16.30: Coffee break
16.30 – 18.00 Sub-groups work
18.00 End of the day
Page 162 of 176
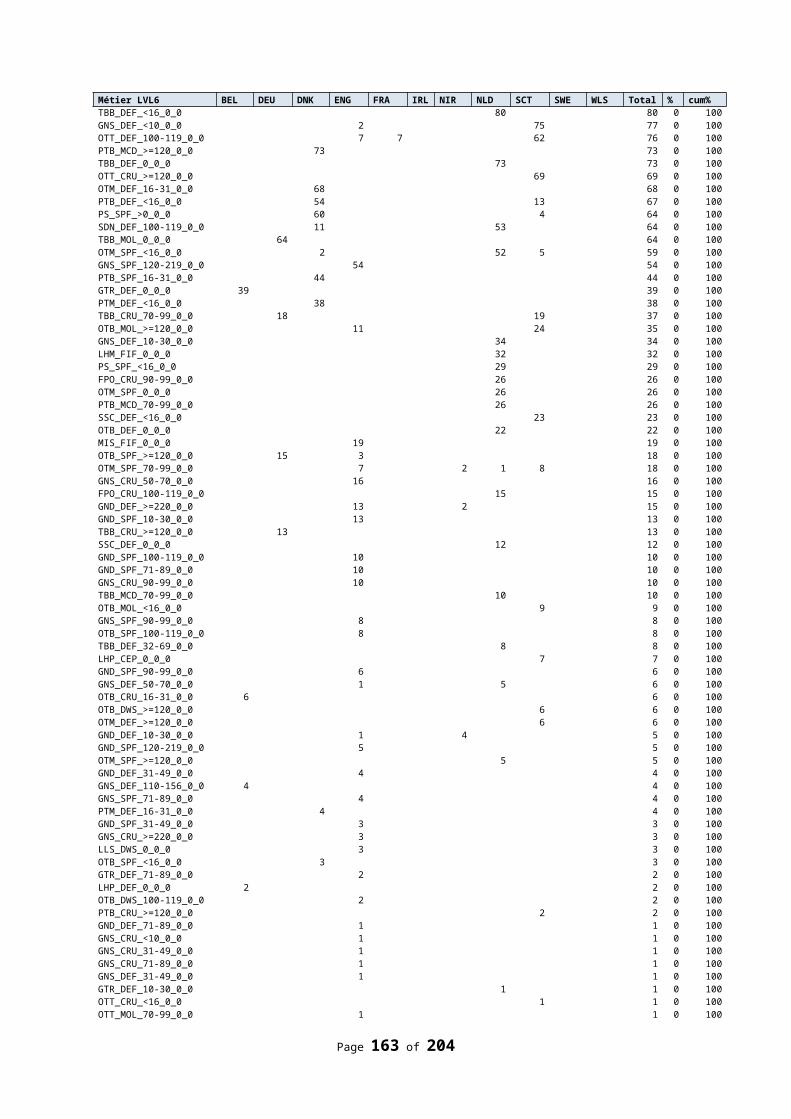
Thursday, 12 September 20139.00 – 10.30: Plenary session
- sub groups chair report back on progress in subgroups- ToR 6 Studies and pilot projects (ref. EMFF Article 85 (2)a)- ToR 3 Proposals for cooperation activities between Member States that could be put forward
for funding under the EMFF (ref. Article 85 (2)e)
10.30 - 11.00: Coffee break
11.30 – 13.00 Sub-groups work
13.00 – 14.30: Lunch break
14.30 – 16.00 Sub-groups work
16.00 - 16.30 : Coffee break
16.30 - 18.00 : Plenary session
- Status and presentation of Sub-group workdiscuss additional terms of reference in relation to results of sub-group work
- writing and reading
18.00 End of the day
Friday, 13 September 20139.00 - 10.30 : Plenary session
- Draft recommendations – discussion- Adoption of the recommendations- feed back from non EU Member States- Report assemblage and reading
10.30 - 11.00 : Coffee break
11.00 – 13.00 : Plenary session
- continuation report assemblage and reading.
Closure of the meeting
Page 163 of 176
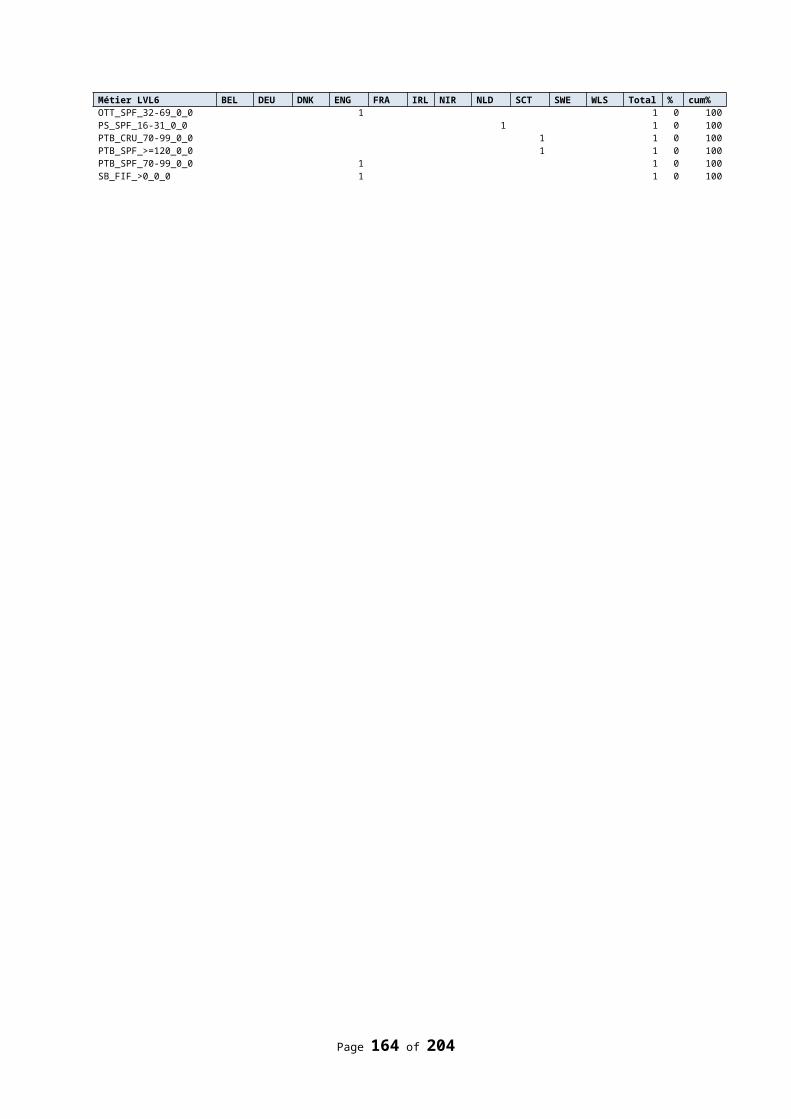
Annex 9: Data range check
Table showing the minimum and maximum lengths uploaded to the RDB from the length samples for each species or species group and the minimum and maximum lengths and ages uploaded for those species sampled for age. As well as providing a simple reference for data outliers and some questionable figures and species names (see highlighted cells) the table provides a sum of individuals sampled.
Length Samples (mm) Age Samples
Length (mm) Ages
Species Min Max Numbers Min Max Min Max Numbers
Abramis brama 360 360 1 9999 9999 9999 9999 9999Agonus cataphractus 20 200 1821 9999 9999 9999 9999 9999
Alepocephalus bairdii 360 870 198 9999 9999 9999 9999 9999
Alloteuthis subulata 20 100 78 9999 9999 9999 9999 9999
Alosa alosa 610 610 1 9999 9999 9999 9999 9999
Alosa fallax 70 680 66 9999 9999 9999 9999 9999
Amblyraja radiata 30 770 13676 9999 9999 9999 9999 9999
Ammodytes marinus 40 250 199720 80 215 0 4 971
Ammodytes sp. 110 160 4 9999 9999 9999 9999 9999
Ammodytes tobianus 40 170 26 9999 9999 9999 9999 9999
Ammodytidae sp. 120 250 40 9999 9999 9999 9999 9999
Anarhichas denticulatus 470 1300 475 9999 9999 9999 9999 9999
Anarhichas lupus 150 1260 3015 9999 9999 9999 9999 9999
Anarhichas minor 300 1210 49 9999 9999 9999 9999 9999
Anguilla anguilla 360 930 5 9999 9999 9999 9999 9999
Anotopterus pharao 580 820 2 9999 9999 9999 9999 9999
Antimora rostrata 220 630 142 9999 9999 9999 9999 9999
Aphanopus carbo 750 1120 54 9999 9999 9999 9999 9999
Aphia minuta 40 40 1 9999 9999 9999 9999 9999
Argentina silus 120 440 2848 9999 9999 9999 9999 9999
Argentina sp. 100 360 828 9999 9999 9999 9999 9999
Argentina sphyraena 70 410 2649 9999 9999 9999 9999 9999
Arnoglossus laterna 30 190 1527 9999 9999 9999 9999 9999
Aspitrigla cuculus 110 480 11388 9999 9999 9999 9999 9999
Bathyraja spinicauda 560 560 1 9999 9999 9999 9999 9999
Belone belone 450 710 4 9999 9999 9999 9999 9999
Brosme brosme 150 1020 1580 9999 9999 9999 9999 9999
Buccinum undatum 40 100 3198 9999 9999 9999 9999 9999
Buglossidium luteum 30 140 1394 9999 9999 9999 9999 9999
Caelorinchus caelorhincus 40 60 17 9999 9999 9999 9999 9999
Callionymus lyra 40 280 1286 9999 9999 9999 9999 9999
Callionymus maculatus 50 250 1264 9999 9999 9999 9999 9999
Callionymus reticulatus 40 120 25 9999 9999 9999 9999 9999
Cancer pagurus 60 254 36979 9999 9999 9999 9999 9999
Capros aper 115 140 6 9999 9999 9999 9999 9999
Centrolophus niger 630 630 1 9999 9999 9999 9999 9999
Cephalopoda sp. 40 510 99 9999 9999 9999 9999 9999
Page 164 of 176
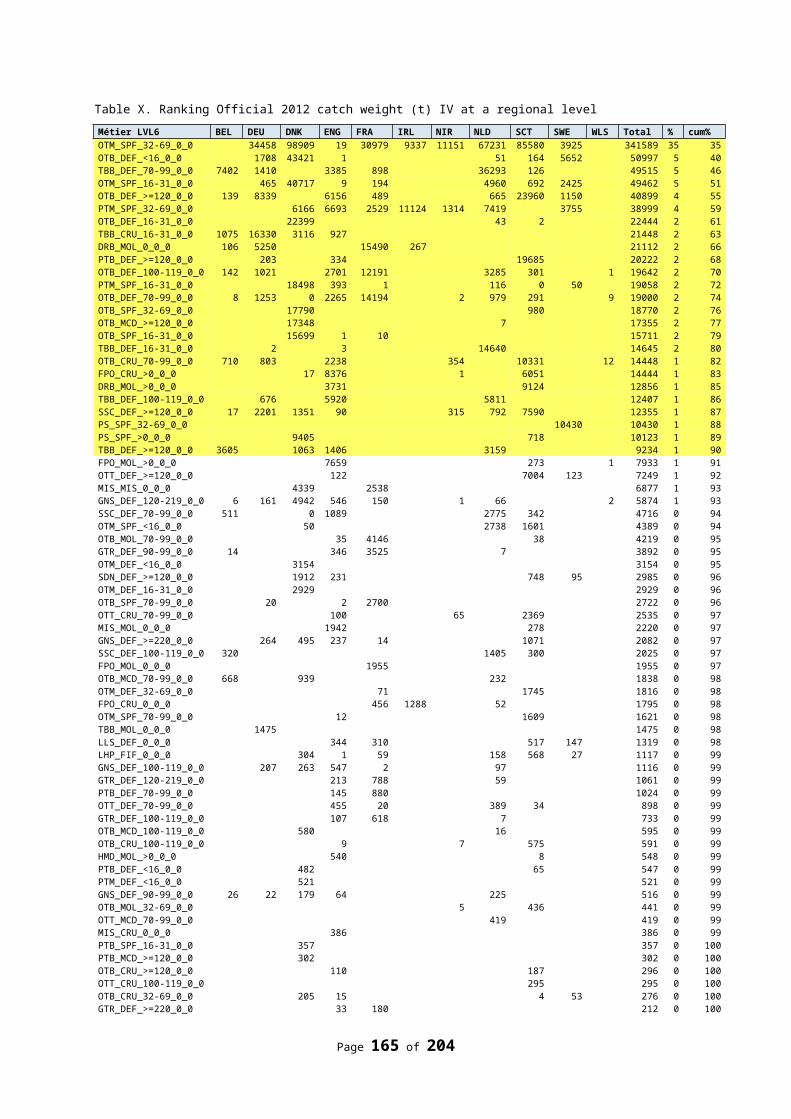
Contd.
Length Samples (mm) Age Samples
Length (mm) Ages
Species Min Max Numbers Min Max Min Max Numbers
Ceratias holboelli 790 1030 3 9999 9999 9999 9999 9999Chelidonichthys lucerna 20 630 3380 218 542 1 6 333
Chelon labrosus 360 360 1 9999 9999 9999 9999 9999
Chimaera monstrosa 30 1040 5043 9999 9999 9999 9999 9999
Ciliata mustela 40 200 105 9999 9999 9999 9999 9999
Clupea harengus 15 420 215057 15 393 0 99 54865
Conger conger 790 1360 13 9999 9999 9999 9999 9999
Coryphaenoides rupestris 60 830 1261 9999 9999 9999 9999 9999
Cottunculus thomsonii 220 430 19 9999 9999 9999 9999 9999
Crangon allmanni 22 570 1151 9999 9999 9999 9999 9999
Crangon crangon 4 890 76952 9999 9999 9999 9999 9999
Crystallogobius linearis 50 50 1 9999 9999 9999 9999 9999
Cyclopterus lumpus 50 560 1246 9999 9999 9999 9999 9999
Dicentrarchus labrax 50 860 11460 230 830 2 22 4996
Dipturus batis 290 1550 42 9999 9999 9999 9999 9999
Dipturus linteus 100 1180 28 9999 9999 9999 9999 9999
Dipturus oxyrinchus 640 870 2 9999 9999 9999 9999 9999
Enchelyopus cimbrius 80 390 2215 9999 9999 9999 9999 9999
Engraulis encrasicolus 50 190 825 9999 9999 9999 9999 9999
Entelurus aequoreus 120 500 2 9999 9999 9999 9999 9999
Etmopterus spinax 110 1200 2484 9999 9999 9999 9999 9999
Eutrigla gurnardus 10 510 25599 9999 9999 9999 9999 9999
Gadiculus argenteus 10 180 1413 9999 9999 9999 9999 9999
Gadus morhua 50 1570 310805 40 1570 0 32 94941
Gaidropsarus ensis 340 550 24 9999 9999 9999 9999 9999
Gaidropsarus vulgaris 100 330 173 9999 9999 9999 9999 9999
Galeorhinus galeus 1250 1400 4 9999 9999 9999 9999 9999
Galeus melastomus 230 720 313 9999 9999 9999 9999 9999
Gasterosteus aculeatus 30 70 10 9999 9999 9999 9999 9999
Glyptocephalus cynoglossus 30 620 74237 70 490 0 15 6707
Gobiidae sp. 60 100 18 9999 9999 9999 9999 9999
Gobius niger 40 140 53 9999 9999 9999 9999 9999
Gymnammodytes semisquamatus 75 210 163 9999 9999 9999 9999 9999
Helicolenus dactylopterus 110 260 8 9999 9999 9999 9999 9999
Hippoglossoides platessoides 30 1170 36693 9999 9999 9999 9999 9999
Hippoglossus hippoglossus 290 1930 1123 9999 9999 9999 9999 9999
Homarus gammarus 80 400 25798 9999 9999 9999 9999 9999
Hoplostethus atlanticus 160 650 38 9999 9999 9999 9999 9999
Hydrolagus affinis 1090 1300 5 9999 9999 9999 9999 9999
Hyperoplus 160 180 3 9999 9999 9999 9999 9999
Hyperoplus lanceolatus 80 350 2239 9999 9999 9999 9999 9999
Labridae sp. 400 400 1 9999 9999 9999 9999 9999
Contd.
Page 165 of 176
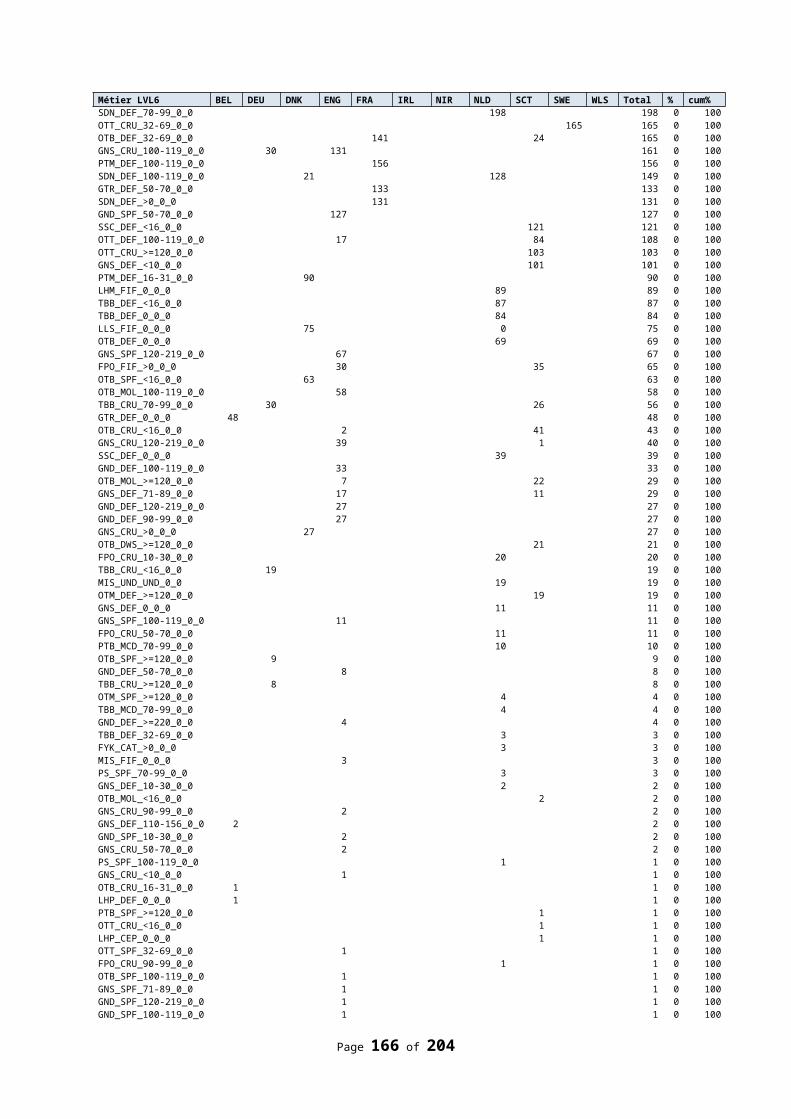
Length Samples (mm) Age Samples
Length (mm) Ages
Species Min Max Numbers Min Max Min Max Numbers
Labrus bergylta 160 390 5 9999 9999 9999 9999 9999Labrus bimaculatus 190 190 2 9999 9999 9999 9999 9999
Lampetra fluviatilis 140 330 16 9999 9999 9999 9999 9999
Lepidion eques 230 340 8 9999 9999 9999 9999 9999
Lepidorhombus whiffiagonis 110 630 24804 240 630 2 15 1133
Leptoclinus maculatus 60 280 911 9999 9999 9999 9999 9999
Lesueurigobius friesii 60 100 28 9999 9999 9999 9999 9999
Lesueurigobius sp. 80 80 2 9999 9999 9999 9999 9999
Leucoraja circularis 135 970 12 9999 9999 9999 9999 9999
Leucoraja fullonica 340 760 7 9999 9999 9999 9999 9999
Leucoraja naevus 170 740 3733 9999 9999 9999 9999 9999
Limanda limanda 20 530 103956 70 370 0 15 9296
Liocarcinus depurator 30 30 543 9999 9999 9999 9999 9999
Liopsetta glacialis 430 430 1 9999 9999 9999 9999 9999
Liparis liparis 20 160 332 9999 9999 9999 9999 9999
Liparis montagui 70 70 1 9999 9999 9999 9999 9999
Lithodes maja 110 110 1 9999 9999 9999 9999 9999
Loligo forbesii 130 320 12 9999 9999 9999 9999 9999
Loligo sp. 90 450 130 9999 9999 9999 9999 9999
Loligo subulata 30 80 25 9999 9999 9999 9999 9999
Lophiidae sp. 300 910 127 9999 9999 9999 9999 9999
Lophius budegassa 590 650 2 9999 9999 9999 9999 9999
Lophius piscatorius 80 1560 12675 160 1100 0 12 719
Lophius sp. 140 1460 26832 200 1460 1 18 2531
Lumpenus lampretaeformis 110 330 235 9999 9999 9999 9999 9999
Lumpenus lumpretaeformis 80 260 56 9999 9999 9999 9999 9999
Lycenchelys sarsi 50 250 86 9999 9999 9999 9999 9999
Lycodes esmarki 170 500 2 9999 9999 9999 9999 9999
Lycodes reticulatus 420 680 8 9999 9999 9999 9999 9999
Lycodes vahlii 90 250 783 9999 9999 9999 9999 9999
Macropipus puber 55 99 2436 9999 9999 9999 9999 9999
Macropodia 138 138 1 9999 9999 9999 9999 9999
Macrourus berglax 110 700 1576 9999 9999 9999 9999 9999
Maja squinado 131 137 3 9999 9999 9999 9999 9999
Maurolicus muelleri 40 80 818 9999 9999 9999 9999 9999
Melanogrammus aeglefinus 60 830 353831 70 830 0 16 32930
Merlangius merlangus 30 710 285912 40 630 0 14 31621
Merluccius merluccius 10 1190 46786 150 1090 0 11 1003
Micromesistius poutassou 130 800 10435 230 380 0 11 484
Microstomus kitt 19 730 69649 190 440 2 20 4269
Molva dypterygia 110 1310 85 9999 9999 9999 9999 9999
Molva molva 120 1710 9998 480 1710 2 13 203
Contd.
Length Samples (mm) Age Samples
Page 166 of 176
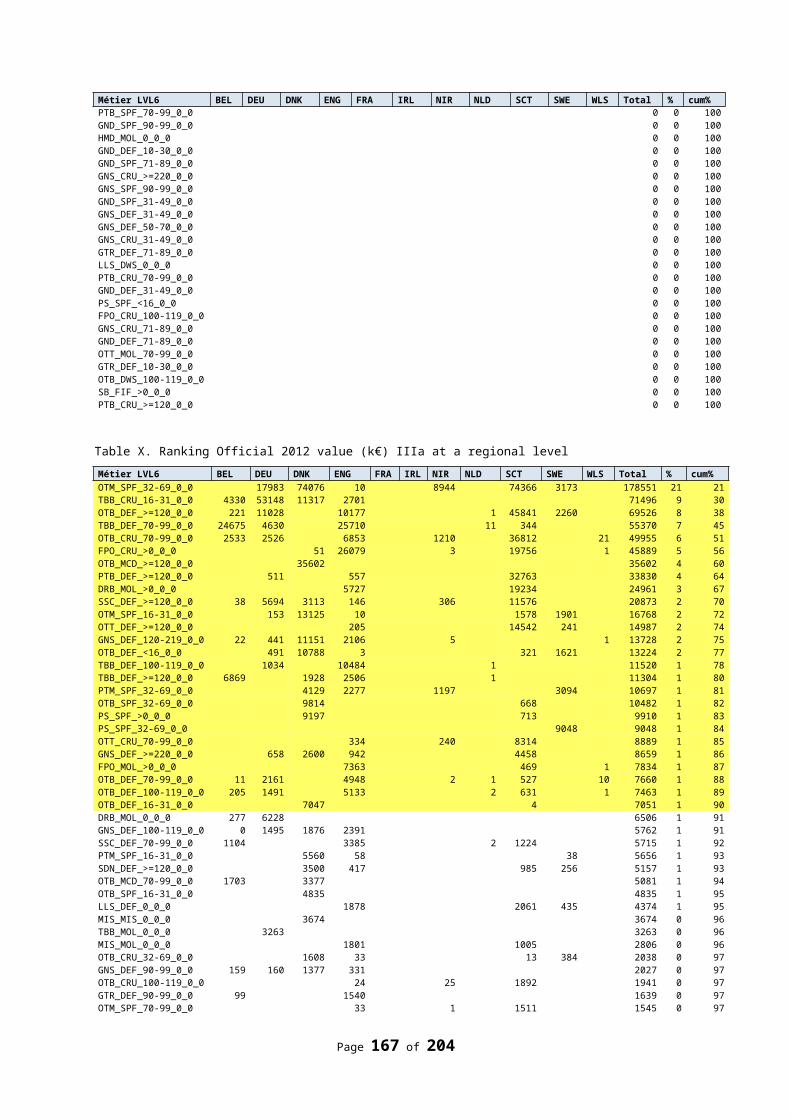
Length (mm) Ages
Species Min Max Numbers Min Max Min Max Numbers
Mugil cephalus 590 600 3 9999 9999 9999 9999 9999Mugilidae sp. 280 590 3 9999 9999 9999 9999 9999
Mullus barbatus 140 370 123 9999 9999 9999 9999 9999
Mullus surmuletus 100 450 1838 143 400 0 7 298
Mustelus asterias 580 1160 123 9999 9999 9999 9999 9999
Mustelus mustelus 70 1020 60 9999 9999 9999 9999 9999
Myctophidae 60 160 86 9999 9999 9999 9999 9999
Myoxocephalus scorpius 20 340 2056 260 260 3 3 1
Mytilus edulis 105 160 119 9999 9999 9999 9999 9999
Myxine glutinosa 110 490 97 9999 9999 9999 9999 9999
Nemichthys scolopaceus 690 690 1 9999 9999 9999 9999 9999
Nephrops norvegicus 1 185 541671 9999 9999 9999 9999 9999
Notacanthus chemnitzii 640 1100 13 9999 9999 9999 9999 9999
Notoscopelus elongatus 90 170 26 9999 9999 9999 9999 9999
Osmerus eperlanus 30 190 2542 9999 9999 9999 9999 9999
Pandalus borealis 6 28 24488 9999 9999 9999 9999 9999
Pasiphaea sp. 34 51 55 9999 9999 9999 9999 9999
Pecten maximus 60 150 3341 9999 9999 9999 9999 9999
Perca fluviatilis 150 150 2 9999 9999 9999 9999 9999
Petromyzon marinus 420 420 1 9999 9999 9999 9999 9999
Pholis gunnellus 90 290 61 9999 9999 9999 9999 9999
Phycis blennoides 100 670 1112 9999 9999 9999 9999 9999
Platichthys flesus 25 510 19668 180 455 1 8 761
Pleuronectes platessa 20 740 503167 20 650 0 20 67051
Pollachius pollachius 170 1040 3489 320 750 2 10 20
Pollachius virens 100 1220 150130 60 1220 0 22 33906
Pomatoschistus 20 110 1051 9999 9999 9999 9999 9999
Pomatoschistus lozanoi 30 50 16 9999 9999 9999 9999 9999
Pomatoschistus microps 20 30 9 9999 9999 9999 9999 9999
Pomatoschistus minutus 20 90 4243 9999 9999 9999 9999 9999
Psetta maxima 120 910 13943 150 728 0 22 1229
Raja batis 160 1210 310 9999 9999 9999 9999 9999
Raja brachyura 630 650 3 9999 9999 9999 9999 9999
Raja clavata 130 1090 829 9999 9999 9999 9999 9999
Raja montagui 530 650 16 9999 9999 9999 9999 9999
Raja sp. 420 1020 892 9999 9999 9999 9999 9999
Rajella bathyphila 580 580 1 9999 9999 9999 9999 9999
Rajella fyllae 400 490 5 9999 9999 9999 9999 9999
Rajidae sp. 550 1160 6 9999 9999 9999 9999 9999
Raniceps raninus 160 290 22 9999 9999 9999 9999 9999
Regalecus glesne 420 420 1 9999 9999 9999 9999 9999
Reinhardtius hippoglossoides 290 1060 57684 330 930 3 25 264
Contd.
Length Samples (mm) Age Samples
Length (mm) Ages
Page 167 of 176
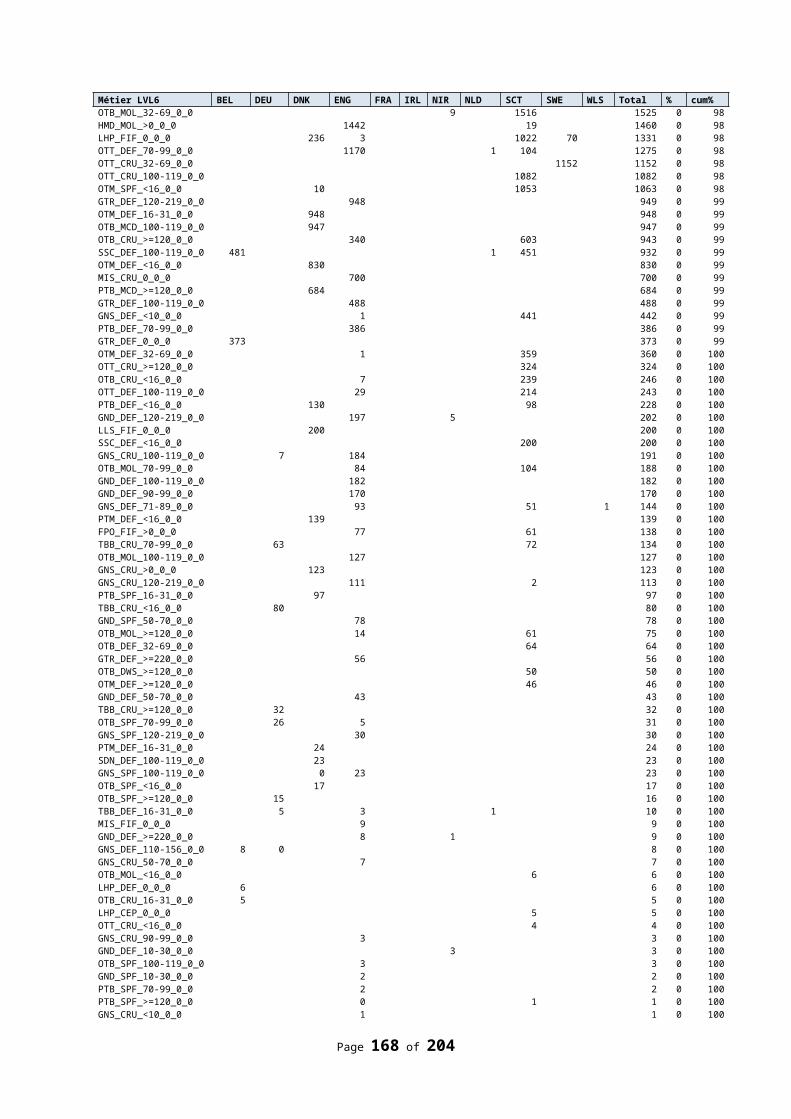
Species Min Max Numbers Min Max Min Max Numbers
Rhinochimaera atlantica 1010 1130 8 9999 9999 9999 9999 9999Rossia macrosoma 30 70 4 9999 9999 9999 9999 9999
Salmo salar 170 170 1 9999 9999 9999 9999 9999
Sardina pilchardus 100 260 565 220 220 2 2 1
Scomber scombrus 30 880 41129 160 472 0 17 14676
Scophthalmus rhombus 130 830 17687 150 625 0 13 1378
Scyliorhinus canicula 100 860 3035 9999 9999 9999 9999 9999
Scyliorhinus stellaris 320 670 14 9999 9999 9999 9999 9999
Sebastes marinus 130 720 4010 9999 9999 9999 9999 9999
Sebastes mentella 26 670 45667 9999 9999 9999 9999 9999
Sebastes sp. 200 450 3 9999 9999 9999 9999 9999
Sebastes viviparus 120 470 338 9999 9999 9999 9999 9999
Sepia officinalis 10 38 46 9999 9999 9999 9999 9999
Sepietta oweniana 30 80 4 9999 9999 9999 9999 9999
Sepiidae 170 190 2 9999 9999 9999 9999 9999
Sepiola atlantica 40 40 1 9999 9999 9999 9999 9999
Solea solea 30 650 415026 90 560 0 39 23208
Somniosus microcephalus 1170 1170 1 9999 9999 9999 9999 9999
Spinachia spinachia 70 520 34 9999 9999 9999 9999 9999
Sprattus sprattus 5 165 78960 47 165 0 8 16022
Squalus acanthias 160 1270 785 9999 9999 9999 9999 9999
Symphodus melops 170 170 2 9999 9999 9999 9999 9999
Syngnathidae sp. 90 220 41 9999 9999 9999 9999 9999
Syngnathus rostellatus 30 390 1375 9999 9999 9999 9999 9999
Syngnathus typhle 130 130 1 9999 9999 9999 9999 9999
Taurulus bubalis 90 110 6 9999 9999 9999 9999 9999
Trachinus draco 130 430 7705 9999 9999 9999 9999 9999
Trachinus vipera 60 190 6 9999 9999 9999 9999 9999
Trachurus trachurus 40 510 14355 175 401 1 27 1771
Trachyrincus murrayi 100 200 180 9999 9999 9999 9999 9999
Trigla lyra 300 300 1 9999 9999 9999 9999 9999
Triglidae sp. 140 430 214 130 390 1 5 14
Triglops murrayi 110 130 3 9999 9999 9999 9999 9999
Trisopterus esmarkii 10 250 38635 85 220 0 3 3432
Trisopterus luscus 100 630 7878 9999 9999 9999 9999 9999
Trisopterus minutus 80 260 1431 9999 9999 9999 9999 9999
Zeugopterus norvegicus 100 100 1 9999 9999 9999 9999 9999
Zeugopterus punctatus 35 530 210 9999 9999 9999 9999 9999
Zeus faber 90 540 795 9999 9999 9999 9999 9999
Zoarces viviparus 70 320 86 9999 9999 9999 9999 9999
Page 168 of 176
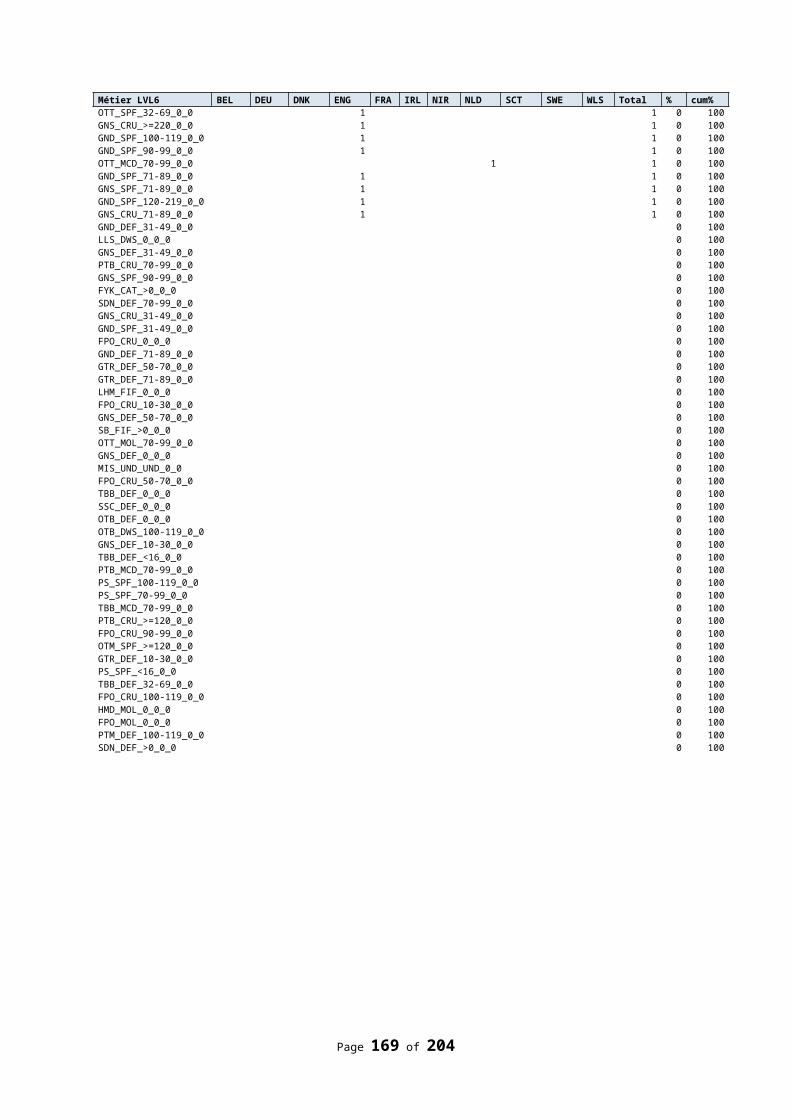
Annex 10: A comparison between RCM 2010 species reference list and contents of the RDB 2013.
Code 1 - spp present in both lists, Code 2 - spp present in the RDB but NOT in the reference list, Code 3 - spp present in the reference list which were not used in the RDB.
Species Code CommentsAnarhichas spp. 3 RCM ref tableArgentina spp 3 RCM ref tableCentroscymnus crepidater 3 RCM ref tableDalatias licha 3 RCM ref tableDeania calcea 3 RCM ref tableMustelus spp 3 RCM ref tableTrigla lucerna 3 RCM ref tableAmmodytidae 3 RCM ref tableRaja naevus 3 RCM ref tableRaja radiata 3 RCM ref tableRajidae nei 3 RCM ref tableTrisopterus esmarki 3 RCM ref tableCetorhinus maximus 3 RCM ref tableShark-like selachii nei 3 RCM ref tableSquatina squatina 3 RCM ref tableAspitrigla cuculus 1 RCM ref table + RDBCentrophorus squamosus 1 RCM ref table + RDBCentroscyllium fabricii 1 RCM ref table + RDBCentroscymnus coelolepis 1 RCM ref table + RDBCoryphaenoides rupestris 1 RCM ref table + RDBCrangon crangon 1 RCM ref table + RDBDasyatis pastinaca 1 RCM ref table + RDBDicentrarchus labrax 1 RCM ref table + RDBDipturus oxyrinchus 1 RCM ref table + RDBHelicolenus dactylopterus 1 RCM ref table + RDBLepidorhombus boscii 1 RCM ref table + RDBLepidorhombus whiffiagonis 1 RCM ref table + RDBLeucoraja circularis 1 RCM ref table + RDBLophius budegassa 1 RCM ref table + RDBLophius piscatorius 1 RCM ref table + RDBMacrourus berglax 1 RCM ref table + RDBMallotus villosus 1 RCM ref table + RDBMicrostomus kitt 1 RCM ref table + RDBMolva dypterygia 1 RCM ref table + RDBMolva molva 1 RCM ref table + RDBMullus surmuletus 1 RCM ref table + RDBPecten maximus 1 RCM ref table + RDBPhycis blennoides 1 RCM ref table + RDB
Contd.
Page 169 of 176
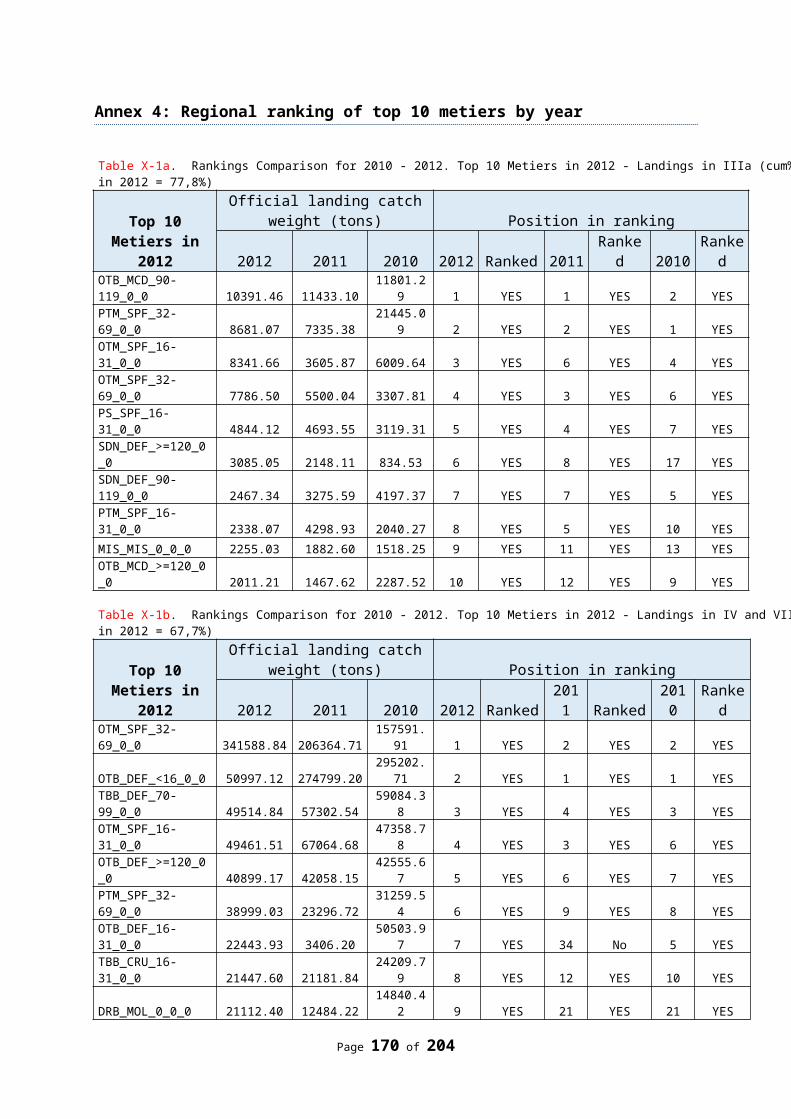
Species Code CommentsPhycis phycis 1 RCM ref table + RDBPlatichthys flesus 1 RCM ref table + RDBRaja montagui 1 RCM ref table + RDBSebastes marinus 1 RCM ref table + RDBSqualus acanthias 1 RCM ref table + RDBZeus faber 1 RCM ref table + RDBBrosme brosme 1 RCM ref table + RDBEtmopterus spinax 1 RCM ref table + RDBEutrigla gurnardus 1 RCM ref table + RDBGaleus melastomus 1 RCM ref table + RDBGlyptocephalus cynoglossus 1 RCM ref table + RDBLimanda limanda 1 RCM ref table + RDBMerlangius merlangus 1 RCM ref table + RDBMerluccius merluccius 1 RCM ref table + RDBNephrops norvegicus 1 RCM ref table + RDBPsetta maxima 1 RCM ref table + RDBRaja brachyura 1 RCM ref table + RDBRaja clavata 1 RCM ref table + RDBReinhardtius hippoglossoides 1 RCM ref table + RDBSalmo salar 1 RCM ref table + RDBScophthalmus rhombus 1 RCM ref table + RDBScyliorhinus canicula 1 RCM ref table + RDBSebastes mentella 1 RCM ref table + RDBAnguilla anguilla 1 RCM ref table + RDBMelanogrammus aeglefinus 1 RCM ref table + RDBMicromesistius poutassou 1 RCM ref table + RDBPleuronectes platessa 1 RCM ref table + RDBPollachius virens 1 RCM ref table + RDBScomber scombrus 1 RCM ref table + RDBSolea solea 1 RCM ref table + RDBSprattus sprattus 1 RCM ref table + RDBTrachurus trachurus 1 RCM ref table + RDBClupea harengus 1 RCM ref table + RDBGadus morhua 1 RCM ref table + RDBPandalus borealis 1 RCM ref table + RDBMullus barbatus 1 RCM ref table + RDBAbramis brama 2 RDBAequipecten opercularis 2 RDBAgonus cataphractus 2 RDBAlepocephalus bairdii 2 RDBAlloteuthis subulata 2 RDBAlopias vulpinus 2 RDBAlosa alosa 2 RDBAlosa fallax 2 RDB
Contd.
Species Code CommentsAmblyraja hyperborea 2 RDBAmblyraja radiata 2 RDB
Page 170 of 176
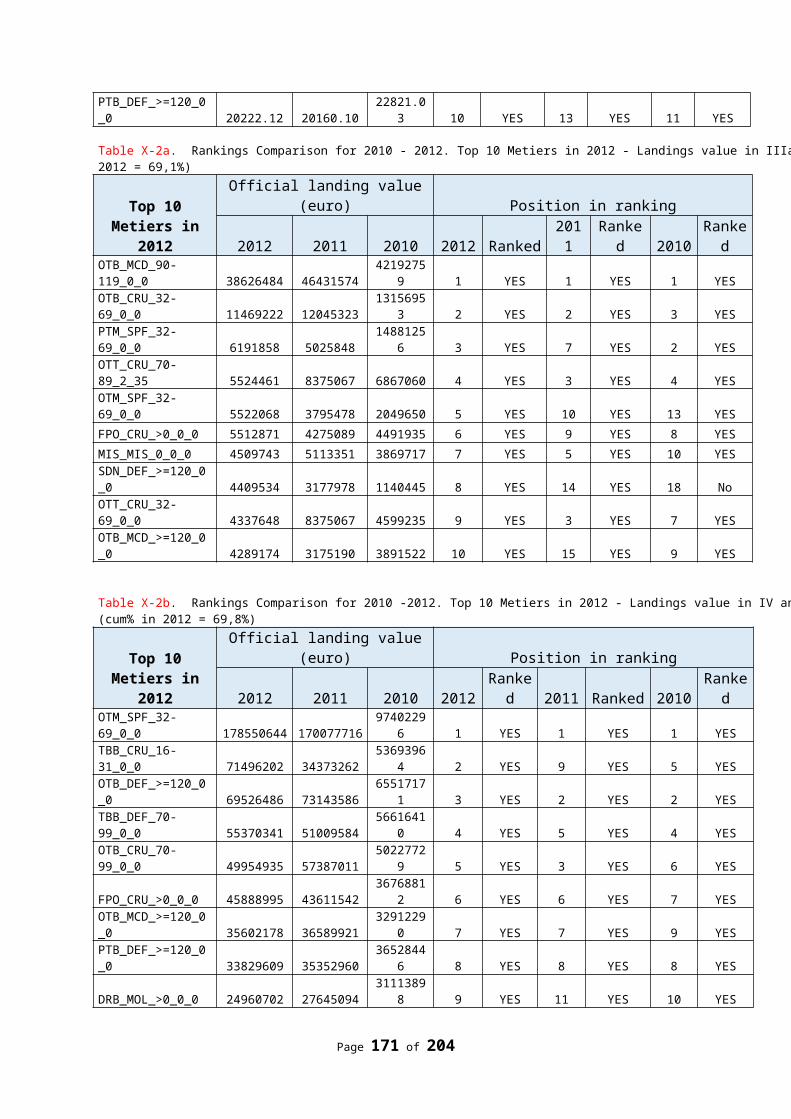
Ammodytes sp. 2 RDBAmmodytes tobianus 2 RDBAmmodytidae sp. 2 RDBAnarhichas lupus 2 RDBAnarhichas sp. 2 RDBAnotopterus pharao 2 RDBAntimora rostrata 2 RDBAphanopus carbo 2 RDBAphia minuta 2 RDBArgentina silus 2 RDBArgentina sp. 2 RDBArgentina sphyraena 2 RDBArgopecten irradians 2 RDBArgyrosomus regius 2 RDBAriidae 2 RDBArnoglossus laterna 2 RDBAsterias rubens 2 RDBBalistes carolinensis 2 RDBBathyraja spinicauda 2 RDBBelone belone 2 RDBBeryx sp. 2 RDBBivalvia 2 RDBBoops boops 2 RDBBothidae sp. 2 RDBBrachypterois serrulata 2 RDBBrachyura sp. 2 RDBBrama brama 2 RDBBuccinum undatum 2 RDBBuglossidium luteum 2 RDBCaelorinchus caelorhincus 2 RDBCallionymus lyra 2 RDBCallionymus maculatus 2 RDBCallionymus reticulatus 2 RDBCancer pagurus 2 RDBCapros aper 2 RDBCarcinus maenas 2 RDBCentroberyx affinis 2 RDBCentrolophus niger 2 RDBCentrophorus granulosus 2 RDBCephalopoda sp. 2 RDBCerastoderma edule 2 RDBCeratias holboelli 2 RDB
Contd.
Species Code CommentsChaceon affinis 2 RDBChelidonichthys lucerna 2 RDBChelon labrosus 2 RDBChimaera monstrosa 2 RDBCiliata mustela 2 RDB
Page 171 of 176
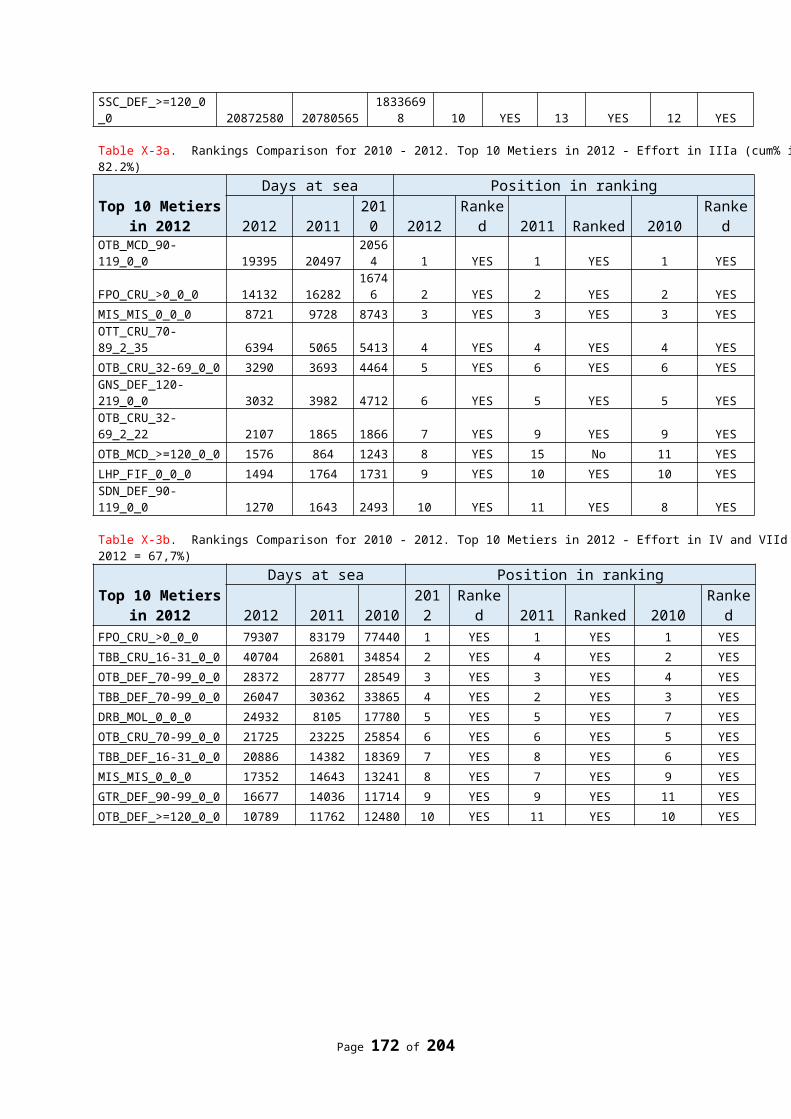
Conger conger 2 RDBCoregonus lavaretus 2 RDBCoryphaena hippurus 2 RDBCottunculus thomsonii 2 RDBCrassostrea gigas 2 RDBCrustacea 2 RDBCrystallogobius linearis 2 RDBCtenolabrus rupestris 2 RDBCyclopterus lumpus 2 RDBDecapodiformes 2 RDBDicentrarchus sp. 2 RDBDicologlossa cuneata 2 RDBDipturus batis 2 RDBDipturus linteus 2 RDBDipturus nidarosiensis 2 RDBDissostichus eleginoides 2 RDBEchinus esculentus 2 RDBEnchelyopus cimbrius 2 RDBEngraulis encrasicolus 2 RDBEntelurus aequoreus 2 RDBEsox lucius 2 RDBEuthynnus alletteratus 2 RDBGadiculus argenteus 2 RDBGaidropsarus ensis 2 RDBGaidropsarus sp. 2 RDBGaidropsarus vulgaris 2 RDBGalatheidae 2 RDBGaleorhinus galeus 2 RDBGasterosteidae sp. 2 RDBGobiidae sp. 2 RDBGobius niger 2 RDBGymnammodytes semisquamatus 2 RDBHippoglossoides platessoides 2 RDBHippoglossus hippoglossus 2 RDBHomarus gammarus 2 RDBHoplostethus atlanticus 2 RDBHydrolagus affinis 2 RDBHyperoplus 2 RDBIllex sp. 2 RDB
Contd.
Species Code CommentsIstiophoridae 2 RDBIsurus oxyrinchus 2 RDBKatsuwonus pelamis 2 RDBLabridae sp. 2 RDBLabrus bergylta 2 RDBLabrus bimaculatus 2 RDBLamna nasus 2 RDBLampetra fluviatilis 2 RDB
Page 172 of 176
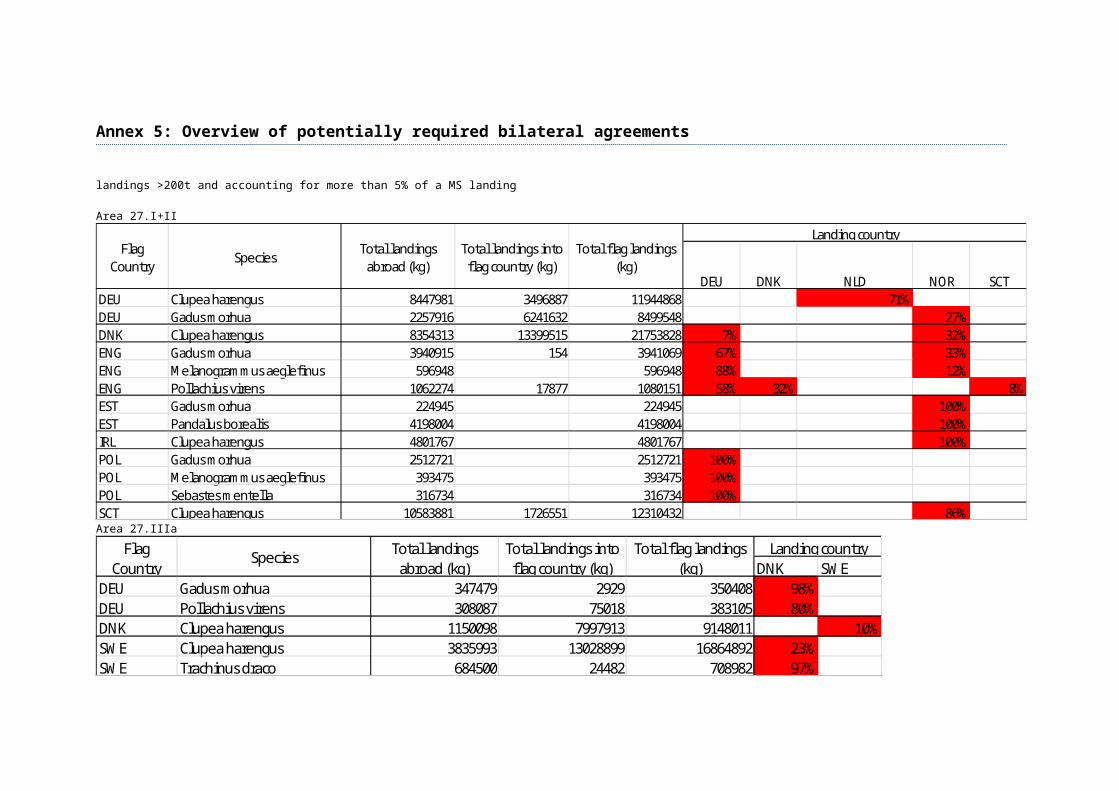
Lepidion eques 2 RDBLepidopus caudatus 2 RDBLepidorhombus sp. 2 RDBLeptoclinus maculatus 2 RDBLesueurigobius friesii 2 RDBLesueurigobius sp. 2 RDBLeucoraja fullonica 2 RDBLeucoraja naevus 2 RDBLimanda ferruginea 2 RDBLiocarcinus depurator 2 RDBLiopsetta glacialis 2 RDBLiparis liparis 2 RDBLiparis montagui 2 RDBLithodes maja 2 RDBLittorina littorea 2 RDBLittorina sp. 2 RDBLoliginidae 2 RDBLoligo sp. 2 RDBLoligo subulata 2 RDBLoligo vulgaris 2 RDBLophiidae sp. 2 RDBLophius sp. 2 RDBLumpenus lampretaeformis 2 RDBLumpenus lumpretaeformis 2 RDBLycenchelys sarsi 2 RDBLycodes esmarki 2 RDBLycodes reticulatus 2 RDBLycodes vahlii 2 RDBMacropipus puber 2 RDBMacropodia 2 RDBMaja squinado 2 RDBMaurolicus muelleri 2 RDBMercenaria mercenaria 2 RDBMola mola 2 RDBMora moro 2 RDBMugil cephalus 2 RDB
Contd.
Species Code CommentsMugilidae sp. 2 RDBMullidae sp. 2 RDBMustelus asterias 2 RDBMustelus mustelus 2 RDBMustelus sp. 2 RDBMya arenaria 2 RDBMyctophidae 2 RDBMyoxocephalus scorpius 2 RDBMytilus edulis 2 RDBMyxine glutinosa 2 RDBNecora puber 2 RDB
Page 173 of 176
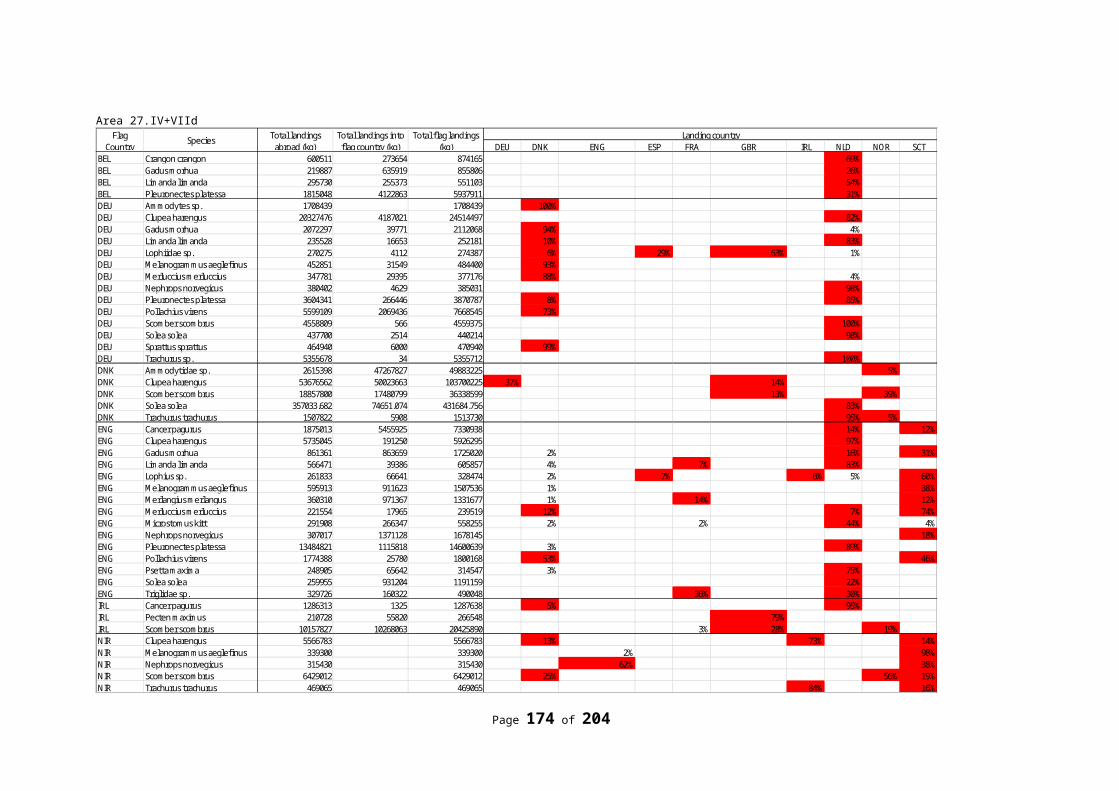
Nemichthys scolopaceus 2 RDBNotacanthus chemnitzii 2 RDBNotoscopelus elongatus 2 RDBOctopodidae 2 RDBOctopus vulgaris 2 RDBOncorhynchus mykiss 2 RDBOsmerus eperlanus 2 RDBOsteichthyes 2 RDBOstrea edulis 2 RDBPagellus acarne 2 RDBPagellus bogaraveo 2 RDBPagellus erythrinus 2 RDBPalaemon adspersus 2 RDBPalaemon serratus 2 RDBPalinurus sp. 2 RDBPandalus montagui 2 RDBPandalus sp. 2 RDBParapenaeus longirostris 2 RDBPasiphaea sp. 2 RDBPegusa lascaris 2 RDBPenaeus sp. 2 RDBPerca fluviatilis 2 RDBPetromyzon marinus 2 RDBPholis gunnellus 2 RDBPleuronectiformes 2 RDBPollachius pollachius 2 RDBPolyprion americanus 2 RDBPomatoschistus 2 RDBPomatoschistus lozanoi 2 RDBPomatoschistus microps 2 RDBPomatoschistus minutus 2 RDBPortunidae sp. 2 RDBPrionace glauca 2 RDB
Contd.
Species Code CommentsPseudophycis bachus 2 RDBRaja batis 2 RDBRaja microocellata 2 RDBRaja sp. 2 RDBRajella bathyphila 2 RDBRajella fyllae 2 RDBRajidae sp. 2 RDBRajiformes 2 RDBRaniceps raninus 2 RDBRegalecus glesne 2 RDBRhinochimaera atlantica 2 RDBRossia macrosoma 2 RDBRostroraja alba 2 RDBRutilus rutilus 2 RDB
Page 174 of 176
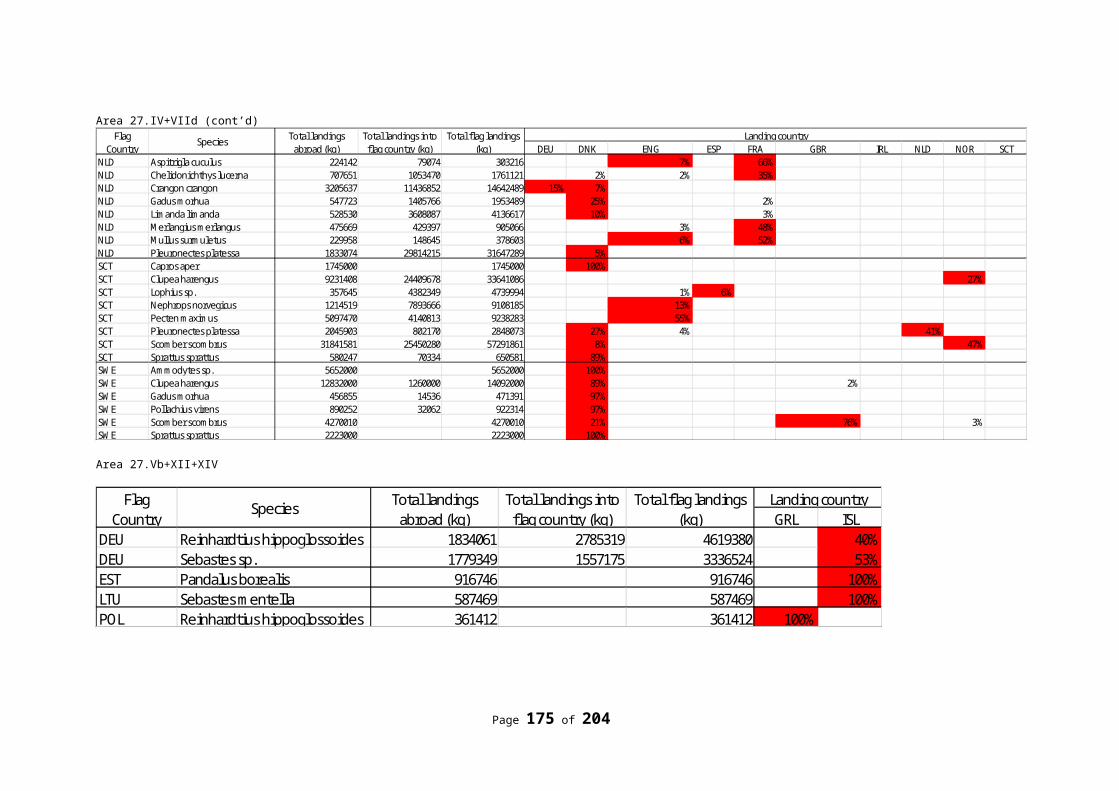
Salmo trutta 2 RDBSander lucioperca 2 RDBSarda sarda 2 RDBSardina pilchardus 2 RDBSardinella aurita 2 RDBSardinella maderensis 2 RDBScomber japonicus 2 RDBScyliorhinidae 2 RDBScyliorhinus stellaris 2 RDBSebastes sp. 2 RDBSebastes viviparus 2 RDBSelachii sp. 2 RDBSepia officinalis 2 RDBSepietta oweniana 2 RDBSepiidae 2 RDBSepiidae sepiolidae 2 RDBSepiola atlantica 2 RDBSolea sp. 2 RDBSolen sp. 2 RDBSomniosus microcephalus 2 RDBSparidae 2 RDBSparus aurata 2 RDBSphyrna zygaena 2 RDBSpinachia spinachia 2 RDBSpisula sp. 2 RDBSpondyliosoma cantharus 2 RDBSqualidae sp. 2 RDBStrongylocentrotus sp. 2 RDBSymphodus melops 2 RDBSyngnathidae sp. 2 RDB
Contd.
Species Code CommentsSyngnathus rostellatus 2 RDBSyngnathus typhle 2 RDBTaurulus bubalis 2 RDBThunnini 2 RDBThunnus alalunga 2 RDBThunnus albacares 2 RDBThunnus obesus 2 RDBThunnus thynnus 2 RDBTodarodes sagittatus 2 RDBTrachinus draco 2 RDBTrachinus vipera 2 RDBTrachipterus arcticus 2 RDBTrachurus mediterraneus 2 RDBTrachurus sp. 2 RDBTrachyrincus murrayi 2 RDBTrigla lyra 2 RDBTriglidae sp. 2 RDB
Page 175 of 176
Triglops murrayi 2 RDBTrisopterus esmarkii 2 RDBTrisopterus luscus 2 RDBTrisopterus minutus 2 RDBTrisopterus sp. 2 RDBUrophycis tenuis 2 RDBVeneridae 2 RDBZeugopterus norvegicus 2 RDBZeugopterus punctatus 2 RDBZoarces viviparus 2 RDBAmmodytes marinus 2 RDBAnarhichas denticulatus 2 RDBAnarhichas minor 2 RDBCrangon allmanni 2 RDBGasterosteus aculeatus 2 RDBHyperoplus lanceolatus 2 RDBLoligo forbesii 2 RDB
Page 176 of 176