Embed Size (px)
Citation preview

SFB 649 Discussion Paper 2008-028
Are stewardship and valuation usefulness
compatible or alternative objectives of financial
accounting?
Joachim Gassen*
* Humboldt-Universität zu Berlin, Germany
This research was supported by the Deutsche Forschungsgemeinschaft through the SFB 649 "Economic Risk".
http://sfb649.wiwi.hu-berlin.de
ISSN 1860-5664
SFB 649, Humboldt-Universität zu Berlin Spandauer Straße 1, D-10178 Berlin
SFB
6
4 9
E
C O
N O
M I
C
R
I S
K
B
E R
L I
N

Are stewardship and valuation usefulness
compatible or alternative objectives of financial accounting?
Joachim Gassen Wirtschaftswissenschaftliche Fakultät
C.A.S.E - Center for Applied Statistics and Economics Humboldt-Universität zu Berlin
10099 Berlin, Germany Phone: +49(0)30-2093 5764
E-mail: [email protected]
Keywords: decision usefulness, valuation usefulness, stewardship, conservatism
JEL Classifications: D82, G14, G34, M41
This version, March 2008 First version, May 2007
I thank the collaborative research center SFB 649 of the German research foundation (DFG) at Humboldt University, Berlin for providing me with data access via the Financial Economic Data Center (FEDC) and workshop participants from the Accountancy Spring Camp at Tilburg University, the 3rd annual convention of the SFB 649 at Motzen, the University of Naples, the spring meeting of the Kommission Rechnungswesen, and the VI Workshop on Empirical Research in Financial Accounting in Madrid (Best Paper Award) for valuable comments. I also thank S. P. Kothari, Ryan LaFond, Laurence van Lent, Joan Luft, Erik Peek, Kristina Schwedler, Thorsten Sellhorn, Holly Skaife, the discussant of the Accountancy Spring Camp, Sofie van der Meulen, and the discussant from the VI Workshop on Empirical Research in Financial Accounting, Christina Dargenidou, for very helpful feedback.

2
Are stewardship and valuation usefulness
compatible or alternative objectives of financial accounting? Abstract: In their joint framework project, the FASB and the IASB recently proposed dropping stewardship as a separate objective of financial accounting, because the Boards view stewardship and valuation usefulness as compatible sub-objectives ranking under an overall objective of decision usefulness. This paper puts this conjecture to an empirical test. As it is widely agreed that asymmetric timely earnings increase the contractual efficiency of accounting information, I first test whether firms with more asymmetric timely earnings produce more valuation-useful financial accounting information. Second, I test whether firms with more influential non-equity stakeholders provide more valuation-useful financial accounting information. As non-equity stakeholders in general face higher transaction costs when diversifying unsystematic risk compared to equity stakeholders and as stewardship-related risks should be at least in part unsystematic, I expect the demand for stewardship-related accounting information to increase with the influence of non-equity stakeholders. Using a broad sample of U.S. firms and a set of firm-specific metrics for valuation usefulness based on short-window capital market reactions to quarterly earnings announcements, I document that the valuation usefulness of financial accounting information is consistently negatively related to its stewardship-orientation. I conclude from these analyses that valuation usefulness and stewardship are alternative objectives of financial accounting.
Keywords: decision usefulness, valuation usefulness, stewardship, conservatism

3
1 Introduction
The objectives of financial accounting are a crucial determinant of financial
accounting standard setting and research, alike. While it appears undisputed that the
overall purpose of financial accounting is to provide decision-useful information to
market participants, the usage of this information differs across subjects. Starting from
this overall objective of decision usefulness and in line with an extensive body of prior
literature (among others: Beaver/Demski, 1979; Gjesdal, 1981; Kim, 1995, Christensen et
al., 2005), Christensen/Demski (2003, pp. 284-300) identify two main sub-objectives of
accounting: To provide valuation-relevant information and contracting-relevant
information. Historically, standard setters identified the objectives of financial
accounting in a similar fashion. In SFAC No. 1, the Financial Accounting Standards
Board (FASB) states that the overall objective of financial reporting is to provide
“information that is useful to present and potential investors and creditors and other users
in making rational investment, credit, and similar decisions” (SFAC 1.34). The Board
then narrows that focus into, among others, two different sub-objectives: “information to
help […] users in assessing the amounts, timing, and uncertainty of prospective cash
receipts” (SFAC 1.37) and “information about how management of an enterprise has
discharged its stewardship responsibility to owners (stockholders) for the use of
enterprise resources entrusted to it” (SFAC 1.50). This paper refers to the overall
objective of SFAC 1.34 as “decision usefulness” and to the first sub-objective (SFAC

4
1.37) as “valuation usefulness” and the second sub-objective (SFAC 1.50) as
“stewardship” or, used synonymously, “contracting usefulness”.1
In their current joint project on developing a common conceptual framework of
financial reporting, the FASB and the International Accounting Standards Board (IASB)2
identify only one objective of financial accounting: decision usefulness. They further
state that decision-useful information should
help present and potential investors and creditors and others to assess the amounts, timing, and uncertainty of the entity’s future cash inflows and outflows (the entity’s future cash flows) (DP IASB/FASB, OB3).
Thereby the Boards appear to be implicitly narrowing the focus of decision
usefulness on valuation usefulness. In addition they suggest subsuming the different sub-
objectives of financial accounting under their understanding of “decision usefulness”, as
they no longer view stewardship and valuation usefulness as alternative sub-objectives:
Users of financial reports who wish to assess how well management has discharged its stewardship responsibilities are generally interested in making resource allocation decisions, which include, but are not limited to, whether to buy, sell, or hold the entity’s securities or whether to lend money to the entity. Decisions about whether to replace or reappoint management, how to remunerate management, and how to vote on shareholder proposals about management’s policies and other matters are also potential considerations in making resource allocation decisions in the broad sense in which that term is used in the framework. Thus, the objective of financial reporting stated in paragraph OB2 encompasses providing information useful in assessing management’s stewardship (DP IASB/FASB, OB28).
This suggestion has already been the topic of heavy debate. Two of the IASB
members issued alternative views on the discussion paper. In the comment letters invited
by the discussion paper a majority of 86 % of respondents voted against the suggestion to
1 In line with the U.S. standard setter, the processor of the IASB, the International Accounting Standards
Committee (IASC), in its Framework also identified the overall objective of decision usefulness and the derived sub-objectives of valuation and contracting usefulness (FK.12-21).
2 I refer to the FASB and the IASB as “the Boards” from now on.

5
drop the stewardship sub objective (DP IASB/FASB, BC32-41 and AV1.1-7; ASB PN
293; IASB ON 20 FEB 2007, Par. 40-44).
Building on this motivation, this paper investigates whether valuation usefulness
and stewardship are compatible or alternative objectives of financial accounting. I offer
some theoretical arguments discussing why or why not stewardship and valuation
usefulness could be alternative objectives in the background section. I expect firms to
balance their accounting choices predominantly depending on the demand for
contracting-related and valuation-related information by stakeholders. Also, I argue that
the demands for these different types of information should differ systematically with the
non-accounting-related governance and informational infrastructure of the firm.
Notwithstanding this theoretical reasoning, the question whether valuation
usefulness and stewardship constitute compatible or alternative objectives of financial
accounting ultimately constitutes an empirical question. This paper addresses this
empirical question. Doing so requires empirically traceable definitions of valuation
usefulness and stewardship. I detail the reasons for my variable choice in the second
section of the paper. Since I am focusing on actual valuation-related decisions induced by
financial accounting information, short-window capital market reactions to quarterly
earnings announcements are used as a proxy for valuation usefulness. Both undirectional
measures (abnormal turnover and change in bid-ask spread)—which are closely related to
the notion of information content pioneered by Beaver (1968)—and directional measures
of the short-window response of returns to earnings changes and earnings surprises,
similar to the concept of valuation relevance as laid out by Lo/Lys (2000), are applied in
this paper. It appears crucial to differentiate between valuation and value relevance.

6
While the former aims at capturing the actual accounting related valuation decisions, the
latter targets the alignment between accounting and market information per se, without
addressing the question whether accounting information is (potentially) useful to market
participants in valuation-related decisions or whether it merely constitutes an echo of
information from more timely sources which were already impounded into prices.
The literature has not agreed upon a definition for stewardship yet, let alone
developed an empirical proxy for the fulfillment of the stewardship role by financial
accounting (O’Connell, 2007). Acknowledging this, I conceptually define stewardship as
providing information that is useful in assessing management’s actions. I decide to use
the asymmetric timeliness of earnings, well known as conditional conservatism, as a
supply-side proxy for the stewardship-orientation of financial accounting information
because an extensive body of research documents both theoretically and empirically that
conditional conservatism is a supply-side answer to the demand for contractual efficient
accounting information (e.g. Chen et al., 2007; see Watts (2003a,b) for an overview of
the related literature).
Using conditional conservatism as a proxy for the supply of stewardship-oriented
financial accounting information is not without draw-backs, as the concept of asymmetric
timeliness has been questioned by recent literature (e.g. Dietrich et al., 2007; Givoly et
al., 2007; see Ryan, 2006, for a recent overview). Therefore and to increase the internal
robustness of my findings, I apply an additional set of demand-site motivated metrics as
alternative proxies for the degree of financial accounting’s stewardship-orientation. As
laid out in the next section, management not adhering to explicit or implicit contracts
because of hidden action problems caused by low stewardship-orientation of financial

7
accounting information imposes at least partly unsystematic risk to stakeholders. As
diversifying this unsystematic risk component will be more costly to stakeholders facing
higher transaction costs, the demand for stewardship will be higher for stakeholders
facing higher levels of transaction costs. Also, stakeholders facing higher transactions
costs will generally find it harder to renegotiate their contracts. If demand and supply are
in equilibrium, this justifies the use of proxy variables for the relative importance of high-
transactions-costs stakeholders (creditors, suppliers, lessors, employees) as proxies for
the stewardship-orientation of financial accounting information.
Using the intersection of daily CRSP with quarterly Compustat and IBES data, I
estimate my firm-specific constructs for a large panel sample of 119,861 quarterly
observations of U.S. firms covering the time-span of 1990-2005. This yields a cross-
sectional sample of 3,245 firm-level observations that are used for the main tests. In
order to assess the validity of the firm-level metrics, industries are ranked according to
the firm-level metrics and out-of sample validity checks are performed based on these
industry rankings for an even broader sample of up to 311,907 firm-quarter observations.
The main research question is being assessed by two separate tests. First, the
impact of valuation usefulness on the asymmetric timeliness of earnings is explored using
an interacted version of the standard reverse regression approach introduced by Basu
(1997). I find that firms with more valuation-useful financial accounting information
have less asymmetric timely earnings. As a second test for the connection between
stewardship and valuation usefulness, a determination model for valuation usefulness
incorporating other determinants that prior literature has found to be connected to the
valuation usefulness of earnings, is estimated. Thereby I reach two conclusions. First:

8
Asymmetric timeliness has a dampening effect on valuation usefulness after controlling
for other factors that influence the valuation usefulness of financial accounting
information. Second: When stewardship-orientation is assessed by the relative
importance of high-transaction-costs stakeholders, I also find that higher levels of
demand for stewardship lead to lower levels of valuation usefulness. As a side result, I
find that firms operating in poorer information environments, as indicated by lower
analyst following and a higher frequency of zero-return trading days, have more
valuation-useful financial accounting information. Based on these results, which are
backed by a set of robustness checks which are detailed in the third section, and stressing
the importance of the limitations which are presented in the conclusion, I cautiously
conclude that valuation usefulness and stewardship are alternative objectives of financial
accounting.
This paper makes several contributions to interrelated streams in the accounting
literature. Directly related to its research question, this paper contributes empirical
insights to the theoretical discussion about the objectives of financial accounting (e. g.
Beaver/Demski, 1979; Gjesdal, 1981; Liang, 2000; Lambert, 2001; Liang, 2001; Arya et
al., 2004; Christensen/Demski, 2004; Christensen et al., 2005). While these authors put
emphasis on accounting information serving a contracting and a valuation role and
provide theoretical models describing this dual objective, this paper provides empirical
evidence generally consistent with their reasoning. While a recent paper (O’Connell,
2007) explicitly calls for empirical research in this area, the interrelatedness of
stewardship and valuation usefulness has rarely been investigated empirically in the prior
literature with one noteworthy exception. In a recent paper (Bushman et al., 2006) the

9
authors investigate the linkage between valuation earnings coefficients, derived from a
value relevance regression, and compensation earnings coefficients, derived from a
regression of changes in management’s cash compensation on earnings changes. They
find these two coefficients to be positively correlated and interpret this evidence as being
consistent with stewardship and valuation usefulness being compatible objectives of
financial accounting. In doing so, they assume that value relevance captures valuation-
usefulness of financial accounting, while this paper argues that valuation usefulness is
conceptually more appropriately captured by short-window capital market reactions to
accounting announcements. In another related paper (LaFond/Watts, 2008), the authors
find that firms with high levels of information asymmetry, measured by the probability of
informed trade, have higher levels of conditional conservatism. LaFond and Watts
interpret this finding as indicating that conditional conservatism is a rational equilibrium
response to high levels of information asymmetries between company in- and outsiders.
The results of this paper compliment the findings of LaFond and Watts in showing that
conditional conservatism is becoming more pronounced as the valuation usefulness of
financial accounting information declines. I interpret this finding as indicating that, when
information asymmetry is high, financial accounting information is becoming less
suitable to provide hard-to-verify information and thus, is tailored by its prepares towards
its stewardship role.
Besides of its main contribution, this paper is providing additional insights into
the determinants of the information content of financial accounting information (e.g.
Beaver, 1968; Lipe, 1990; Landsman/Maydew, 2002; Francis et al., 2002a; DeFond et al.,
2007), as it adds to this literature by investigating firm-specific determinants of the

10
information content of financial accounting information. Also, it provides new insights on
the determinants and consequences of conservative accounting (e.g. Peek et al., 2006;
Ball et al., 2008), and on the influence of the information environment on the
information-incorporating pricing process (e.g. Francis et al., 2002b; Chen et al., 2006;
Frankel et al., 2006). Finally, this paper contributes to the discussion of alternative
metrics of earnings attributes, accounting objectives and their inter-relatedness (e.g.
Lo/Lys, 2000; Schipper/Vincent, 2003, Francis et al., 2004).
This paper continues as follows: The second section provides some theoretical
background to the research question and discusses the development of the metrics for
valuation usefulness and stewardship. The third section presents the test design, the data,
and the results. The fourth section concludes.
2 Background
2.1 Theory Development
This paper investigates whether valuation usefulness and stewardship are
compatible or alternative objectives of financial accounting. I define the two sub-
objectives to be alternatives in theory if and only if the following two conditions are met:
(a) there is a demand for the fulfillment of both sub-objectives, and (b) both sub-
objectives obeyed separately would give rise to different accounting choices.
Agency theory rooted analyses predict that an efficient information system used in
a contractual setting might have different attributes than an information system used in a
valuation setting (e.g. Gjesdal, 1981; Christensen et al., 2005). Building on that and
assuming that information is only privately available to the manager ex ante accounting
disclosure, three possible settings might be interesting. First, the incentives between

11
manager and stakeholders might be aligned ex ante. Second, the incentives between
manager and stakeholders might be miss-aligned ex ante but might be alignable by the
use of accounting information. Third, the incentives between manager and stakeholders
might be miss-aligned ex ante and might be not alignable by the use of accounting
information. In the first setting there exists no demand for contracting-useful accounting
information (assumption (a) from above is violated). In the second setting there is
demand for contracting-useful accounting information (assumption (a) is fulfilled). In the
third setting, accounting signals are unverifiable, accounting is cheap talk and thus,
rational stakeholders would not have any demand for accounting information (again,
assumption (a) is violated).
Focusing on the presumable most realistic second scenario, the question becomes
whether assumption (b) holds under this condition. In this scenario, accounting
information is used as an input variable to the incentive constraint of the manager. As
prior research generally shows (for an overview see Lambert, 2001), in this setting
accounting information performs the better the more directly it is linked to management’s
actions. Valuation-useful accounting information, in turn, would predominantly be based
on management’s actions outcomes. This would indicate that in this setting, demand
would be high for a contracting-useful accounting system and market participants would
be willing to sacrifice valuation usefulness for contracting usefulness. It has been argued
that in that situation, contracting-useful information is the best available information for
valuation purposes as well, as only verifiable information can be valuation useful (Watts,
2003a). This argument appears plausible from a single firm perspective, in a sense that
for each single firm there exists an accounting system which balances contractual and

12
valuation purposes of accounting so that it reaches efficient equilibrium levels of both.
Applied on the cross-section however, some firms have less incentive miss-alignment ex
ante and thus might end up with an accounting system which weights the valuation role
more dominantly (e.g. by disclosing private forward-looking information of the
management as knowingly misreporting by management is of no concern), while other
firms with more severe ex ante miss-alignment of incentives might focus on the
contracting role of accounting.
Another reason for potential cross-sectional differences in the weighting of
valuation and the contracting usefulness might be differences in the non-accounting
informational infrastructure. This infrastructure consists of non-accounting (voluntary)
disclosures by the management and of third party disclosures about the firm. Assuming
that voluntary disclosures are credible in a sense that they do not constitute cheap talk,
they constitute a different means for the management to communicate private information
to stakeholders. It appears justified to expect that drafting contracts based on voluntary
disclosures is more costly as managers cannot be forced to voluntarily disclose. As such,
voluntary disclosure can mainly be viewed as an alternative valuation-relevant
accounting disclosure whenever incentives between stakeholders and managers are
sufficiently aligned. Third party disclosures in addition can generate valuation-useful
disclosures but cannot, by definition, give away private information of the management.
Nevertheless they can help mitigating costly information processes of stakeholders on a
timely basis and thus can crowd out the valuation usefulness of accounting information to
some extent. In general I expect that the better the non-accounting informational
environment of a given firm, the lower the demand for valuation-useful accounting

13
information. This decrease in demand should lead c.p. to accounting choices which give
more weight to contracting-useful accounting information.
Summing up, if valuation usefulness and stewardship are alternative objectives of
financial accounting, I expect that firm-specific determinants in the non-accounting-
related governance structure and the informational environment shape the demand for and
finally the supply of contracting and valuation useful information. Firms which use their
accounting to align the incentives between managers and stakeholders lack the possibility
to provide valuation-relevant information. Therefore I expect a negative correlation
between valuation usefulness and stewardship. In addition, the demand for and supply of
valuation-useful accounting information should decline for firms from rich non-
accounting information environments.
2.2 Measures for Valuation Usefulness and Stewardship
This section discusses the measures for valuation usefulness and stewardship used
in this paper. Since the goal of this project is to question the proposed new framework
approach, I try to define the applied constructs closely in line with what I infer to be the
standard setters’ definitions. In the discussion paper containing the draft of the first two
chapters of the new framework, the Boards define decision-useful information as follows:
“…information that is useful to present and potential investors and creditors and others in
making investment, credit, and similar resource allocation decisions” (IASB/FASB DP,
OB2). This definition can without substantial loss be shortened to: “…information that is
useful in making resource allocation decisions.” This broad definition appears to be of
little help from an economic stand-point, as, for an economist, every decision is a
resource allocation decision, and a piece of information is defined as news if it is of some

14
value to the recipient (Hirshleifer, 1973). Applying this reasoning, the original definition
could be condensed even more to simply, “information.”, making the adjective “decision-
useful” redundant. In order for the definition to be empirically traceable, however, it must
be narrower. The Boards provide such a definition: “financial reporting should provide
information to help present and potential investors and creditors and others to assess the
amounts, timing, and uncertainty of the entity’s future cash inflows and outflows” (DP
IASB/FASB, OB3). As asset pricing is based on expected future returns (ultimately
determined by cash flows) and their covariance with systematic risk factors, this
definition can be seen as to be very closely related to the term valuation-relevant
information as laid out by, e.g., Christensen/Demski (2003, pp. 145-147). Thus, I come
to the conclusion that effectively the Boards have narrowed the definition of decision
usefulness to the definition of valuation usefulness. Nevertheless, I still refer to this
notion as valuation usefulness only, because conceptually decision usefulness has a
broader focus than valuation usefulness. Following that, this paper defines valuation
usefulness as the ability of financial accounting information to provide information that is
relevant for decision making in the valuation process.
In its draft of the first chapter of the new conceptual framework, the Boards
describe stewardship as follows: “Management of an entity is accountable to owners
(shareholders) for the custody and safekeeping of the entity’s economic resources and for
their efficient and profitable use” (DP IASB/FASB, OB 27). In that sense they define the
stewardship role of financial accounting as providing information that “is useful in
assessing how well management has discharged its stewardship responsibilities” (DP
IASB/FASB, OB 27). This focuses on information about management actions such as

15
operational, financing, and investment decisions, as well as on management
communications to stakeholders. In this sense, the term stewardship is closely related to
the Christensen/Demski (2003, pp. 229-230) notion of the contracting role of accounting.
That is why I define stewardship as providing information that is useful for the evaluation
of management’s actions. It is important to note that the definitions of valuation
usefulness and stewardship used in this paper naturally overlap: Information about
management’s failure to stick to a current investment plan, for example, might well be
decision-useful to some/all stakeholders for estimating future cash flows from investing
activities. But they are also not theoretically conjunct. Imagine a situation where
financial accounting fulfills its stewardship role perfectly. In that case, contracts could be
written in a way so that management’s actions would perfectly align with investors’
preferences; accounting would not report any deviations by the management from the
optimal path, and because of that would not yield any surprises; the value of the firm
would follow a random walk; and accounting would not be decision-useful for valuation
purposes.
In prior literature the term valuation usefulness has often been linked to the
concept of the value relevance of financial accounting information (e.g., Bushman et al.,
2006; Barth et al., 2001). Value relevance is normally defined as the strength of the link
between accounting information (predominantly measured by earnings (changes) and/or
book value of earnings) and the value of the according firm (predominantly measured by
the price or return of its equity shares). Undoubtfully, value relevance is an important
attribute of financial accounting. It appears questionable however, whether in can be
linked to the valuation usefulness of financial accounting information (Holthausen/Watts,

16
2001). Asset prices are influenced by financial accounting as well as by other non-
financial-accounting information. To the extent that financial accounting information just
confirms non-financial-accounting information which was available to the market before,
it can hardly be valuation useful by itself. To the extreme: if financial accounting is
defined to mimic asset price returns, it becomes absolutely value-relevant from an
empirical measurement perspective, while being a pure echo of previous signals and thus
providing no valuation-useful information.3 While playing a confirmatory role might
well be a very important objective of financial accounting from the contractual
standpoint, valuation usefulness implies that market participants learn something from
financial accounting what they not already know.
When operationalizing the definition of valuation usefulness, I also refrain from
assuming priors about the valuation models market participants are using. Instead, this
paper investigates empirical manifestations of valuation-related decisions that can be
traced back to the arrival of accounting information with a comparably high probability.
Consequently, it investigates the equity market, as conceptually, the value of equity
should be more closely related to firm fundamentals than the value of debt instruments or
the values of other stakeholders’ claims, which are less dependent on the economic
performance of the reporting entity. In addition, the equity market has undisputable
advantages with respect to data availability. However, there are some limitations to
focusing solely on the equity market. First, in choosing not to investigate valuation-
3 To the extent that confirming financial accounting information reduces uncertainty about the future
states of the world, it is still decision useful. However, (a) in equilibrium with perfect financial accounting information no such uncertainty would exist because market participants would penalize managers for ex-ante miss-informing ex post, incentivizing them to truthfully disclose ex ante and (b) the concept of value relevance does not separate between new information, confirming information and pure echoes.

17
related decisions on all relevant stakeholder markets, (e.g., the debt, labor, goods, or
suppliers markets) internal validity becomes a concern. Second, one can measure only
actual decisions, not the general ability of financial accounting information to affect
decisions.
In order to identify valuation-related decisions caused by the arrival of new
accounting information, this paper focuses on short-window capital market reactions to
quarterly earnings announcements. It uses a short-window research design in order to
ensure that the observed valuation-related decisions are by a high probability caused by
new accounting information. This concept is related to the “information content” concept
in the empirical accounting literature (among many others, Beaver, 1968;
Landsman/Maydew, 2002). While the traditional information content literature focuses
on undirectional market reactions to the announcement of information (Lo/Lys, 2000),
this paper also focuses on directional reaction to earnings-related information. So, it
studies short-window earnings-returns coefficients (based on earnings changes and on
analyst forecast errors) along with abnormal turnover and changes in bid-ask spreads
around quarterly earnings announcement dates. The third section of this paper will give
additional details concerning the empirical operationalization of these four metrics.
Developing an operational metric for stewardship is far from trivial. As I define
financial accounting’s fulfillment of the stewardship role as to provide information that is
useful in evaluating management’s actions, an indicator variable is needed that captures
the existence of this type of information. Following the reasoning presented above, such
an indicator variable could be constructed by observing contracts in which financial
accounting data is used to assess management’s actions. Given that I am not aware of a

18
sufficiently large source of archival data about such contractual decisions,4 I see two
possible substitute concepts. First, as argued in the previous section, it can be assumed
that markets, in general, balance the demand for and supply of stewardship-related
financial accounting information. Under that assumption, firms with stakeholders having
a high demand for the stewardship role of accounting would provide more contracting-
useful financial accounting information. Following this reasoning, the demand for
stewardship could be used as a proxy for the supply of stewardship. It can be expected
that different stakeholder groups of a given entity differ systematically in their demand
for stewardship-related accounting information. Stewardship affects expected returns by
influencing the probability that management is honoring implicit or explicit accounting-
related contracts. The propensity of management to expropriate wealth from the
stakeholders depends on the governance infrastructure and on implicit cultural standards
and rules, which differ at the firm, industry, and country levels. From this follows that
stewardship-related valuation impacts can be assumed to be predominantly a source of
unsystematic risk. Thus, stakeholders should be able to diversify away substantial parts
of stewardship-related risks. As diversifying is more costly for asset classes facing
higher transaction costs, this would mean that investors facing lower transaction costs in
the contractual relationship with the respective entity would have less demand for
stewardship-related information. This reasoning could be operationalized so that the
demand for stewardship-related information can be expected to increase with the
proportion of debt financing (lending by suppliers, employee involvement in the value
4 Obvious contractual decisions linked to accounting information would be, e.g., management
compensation contracts, debt covenants, and some collective labor agreements. It might be an interesting avenue for future research to use data in these (and probably other) contracts to assess whether firms having relatively more of these contracts produce less valuation-useful earnings.

19
creation process, lease-based financing) as debt holders (suppliers, employees, lessors), in
general, face higher transaction costs than equity holders (Benston/Smith, 1976).
Nevertheless, this reasoning relies on demand for and supply of stewardship-
related information to be in equilibrium. If there is an imbalance between demand and
supply induced by market frictions, this demand-driven concept is invalid. Thus, this
approach in applied as a secondary test, only. For the main analyses, I rely on the only
measure of supply of stewardship-related accounting information that I am aware of:
conditional conservatism, also referred to as earnings conservatism, news dependent
conservatism, or asymmetric timeliness. A substantial body of literature theoretically and
empirically supports the notion that asymmetric timeliness constitutes a supply-side
response to the demand for contracting-related accounting information (e.g. Chen et al,
2007; Zhang, 2007). As stewardship-related accounting information requires a greater
degree of hardness (verifiability) for a given signal whenever management and
stakeholder incentives are a priori aligned, mandating a higher degree of verification for
gains than for losses constitutes a rational rule for stewardship-related information. Thus,
this paper uses the asymmetric timeliness metric since it is a theoretically and empirically
well founded measure for the stewardship orientation of financial accounting information.
3 Empirical Analyses
3.1 Data and Sample Selection
Defining suitable firm-level measures of valuation usefulness and stewardship
requires repeated observations over time for each firm. The problem with investigating
firm attributes on time-series data is twofold. (1) As accounting data is of low frequency,
the low numbers of time-series observations available for statistical analyses lead to a

20
relatively low power of the resulting statistics. (2) Increasing the time-span in order to
increase the number of observations per firm, and thus the power of the resulting
statistics, gives rise to serious internal validity concerns: Estimating firm-specific
attributes over a period of time implies that these firm attributes are constant over this
time period, which might not be the case (Givoly et al., 2007).
I choose my sample in order to minimize these concerns. First of all, I limit the
initial time period to the 16 years between 1990 and 2005. While it can still be argued
that firms changed substantially during this period, this comparably short but current time
period should be warranted, given that sample size would decrease and external validity
concerns would increase substantially if a time-span from a period in the past with
supposedly fewer structural changes would be used. Second, I focus on the U.S. market
and use quarterly accounting data for the analyses. As the U.S. market is the largest
equity market in the world, and quarterly accounting data is the highest frequency of
accounting data available, this design choice maximizes the number of firm-specific
observations within the time-span available to the analyses.
The analyses require quarterly earnings per share data and earnings announcement
dates from Compustat; daily price, volume and returns data from CRSP; and quarterly
earnings per share forecast data from IBES to calculate the firm-level attributes and to
conduct the tests. In order to maximize the number of firms in the cross-sectional sample,
I require only ten non-consecutive firm-specific input observations for the calculation of
each of the firm-specific attributes.5 In order for the firm to become part of the cross-
sectional sample, I require that all firm-level attributes are calculable for it. Applying
these requirements yields a cross-sectional sample of 3,245 firms. In order to calculate 5 I vary the minimum amount of observations to up to 30, finding qualitatively unchanged results.

21
the firm-specific attributes for these 3,245 firms, a panel sample of 119,861 observations
is used. Details of the composition of the panel sample across time and industries can be
inferred from Appendix 2. For the sake of clarity, I refer to the cross-sectional sample of
3,245 firms as the “cross-sectional sample” and to the panel sample of 119,861 firm-year
observations as the “panel sample” throughout the paper.
In addition “out-of-sample” analyses are conducted throughout the paper, where
industry group rankings of the firm-specific attributes are used to verify their external
validity. For each of these analyses, the unique maximum number of firm-year
observations available is used, meaning that firms with insufficient data to calculate the
firm-specific attributes are included in the sample. The maximum number of firm-year
observations for that sample is 311,907. I refer to this sample as the “full sample”
throughout the paper.
3.2 Calculation of the Valuation Usefulness Metrics
Table 1 details the construction of the firm-level valuation usefulness metrics.
Variable definitions are given in Appendix 1. To estimate the average abnormal share
turnover around the quarterly earnings announcement date, first the average turnover of
the three-day window surrounding the quarterly earnings announcement date is
calculated. Then an average firm-quarter specific share turnover is constructed by
calculating the mean of the two windows starting five and ending 30 days before and
after the quarterly earnings announcement date. The abnormal quarterly earnings
announcement turnover of firm i (ATOVERi) is the difference between the average
turnover of the earnings announcement period and the average turnover of the two

22
surrounding periods.6 As can be inferred from Panel A of Table 1 and in line with
expectations and prior literature (e.g. Landsman/Maydew, 2002), ATOVER is
significantly positive for both the mean and the median, indicating that, on average, share
turnover is higher for quarterly earnings announcement periods than it is for non-
reporting periods.
To calculate the change in bid-ask spreads around quarterly earnings
announcement dates, the average bid-ask spread of the four-day period beginning two
days after the quarterly earnings announcement date and the average bid-ask-spread of
the four-day period ending two days prior to the quarterly earnings announcement date
are calculated. In line with prior literature (Kim/Verrecchia, 1994; Brooks, 1996;
Krinskey/Lee, 1996; Gajewski, 1999), as investors need time to incorporate earnings
information and as new information asymmetry might be growing quickly, I use short
periods excluding the actual event dates to calculate the measure of bid-ask spread
change induced by quarterly earnings announcements (ΔBASi). Panel A of Table 1
verifies that the average firm experiences a significant decrease in its bid-ask spread
around its quarterly earnings announcement periods. Nevertheless, with the standard
deviation of ΔBASi being quite high, considerable variance across firms exists with a
substantial body of firms experiencing an increase in ΔBASi around their earnings
announcement dates. This result is in line with prior results and with the theoretical
predictions by Kim/Verrecchia (1994).
6 Where applicable throughout the analyses, all dependent and independent variables are winsorized by
their top and bottom percentiles. Deleting the winsorized observations does not qualitatively influence the results.

23
The next metric of the valuation usefulness of accounting data is based on the
short-window earnings response coefficient (ERCi), which is estimated as the coefficient
α1,i of model (1)
(1) ititiiit NICAR ,,,1,0, εαα +Δ+= ,
where CAR is the cumulative abnormal return of the three-day window around the
quarterly earnings announcement date, and ΔNI is the change in price-deflated earnings
per share from the same quarter of the last year (detailed definitions are given in
Appendix 1).7 Model (1) is estimated as a firm-specific time-series model separately for
each firm that has 10 or more non-consecutive observations available. As can be seen in
Panel A, the average of ERCi across the firms of the cross-sectional sample is
significantly positive for both the median and the mean, indicating that market
participants react to an increase (decrease) in earnings by adjusting their willingness to
pay accordingly, causing a positive (negative) abnormal return.
The final valuation usefulness measure relies on earnings forecast data from
IBES. The short-window response coefficient of the earnings forecast error (FCERCi) is
estimated as the coefficient α1,i of model (2)
(2) ititiiit FCECAR ,,,1,0, εαα ++= ,
where CAR is the cumulative abnormal return of the three-day window around the
quarterly earnings announcement date, and FCE is the forecast error from the last mean
IBES earnings forecast before the quarterly earnings announcement date (detailed
definitions are given in Appendix 1). Model (2) is estimated as a firm-specific time-series
7 The robustness of model (1) is tested by replacing ΔNI with the change of NI from the prior quarter
and by the difference of NI and a forecast of NI based on a AR(4) model on the firm’s time-series of NI finding qualitatively the same results.

24
model separately for each firm that has 10 or more non-consecutive observations
available. Similar to ERC, but even more consistently so, Panel A reports FCERC to be
significantly positive, lending additional support to the overall valuation usefulness of
financial accounting data.
The four firm-specific attributes capture different aspects of valuation usefulness.
While the first metric (ATOVER) supposedly captures all market transactions induced by
the arrival of new accounting information, the second metric (ΔBAS) focuses on the
effect accounting data disclosure has on information asymmetry. Imagine a situation
where the arrival of new accounting data in combination with the informational priors of
market participants causes higher levels of information dispersion. This dispersion will,
c.p., lead to higher ATOVER, indicating higher levels of market activity and higher
ΔBAS, which indicates higher levels of information asymmetry (Kim/Verrechhia, 1994).
Both ATOVER and ΔBAS speak distinctively to decisions induced by the arrival of new
accounting information: Market activities are direct results of the decisions of market
participants, while an increase in information asymmetry makes the valuation process
more costly. Compared with the former two undirectional metrics, the latter two (ERCi
and FCERCi) are more directly linked to the predominant accounting summary measure
of economic performance: earnings. While they fail to measure decisions induced by
other accounting information, accounting-based valuation models justify the assumption
that current earnings are a central input factor in estimating future cash flows. The
standard setters see the fundamental role of accounting as helping investors and creditors
to decide upon their expected values of future cash flows, and I posit that the earnings-

25
related metrics of valuation usefulness most closely relate to the concept of valuation
usefulness the standard setting bodies appear to have in mind.
Besides separately estimating the link between valuation usefulness and
stewardship for each measure of valuation usefulness, I construct a combined measure of
valuation usefulness (VUSCORE) that is based on decile ranks of the four metrics (with
ΔBASi multiplied by -1 to ensure proper ranking) and is scaled between zero and one.
Panel B of Table 1 backs the theoretical arguments presented above, as the correlation
across the different metrics of valuation usefulness is generally low to moderate; and the
correlation of ΔBAS with the other metrics is the lowest.
Panel C of Table 1 compares the average values of the combined valuation
usefulness metric VUSCORE across industries. It shows significant differences across
industries, with firms from the “Shop” industry group exhibiting the highest valuation
usefulness and firms from the “Utilities” industry group the lowest. As an aside, it is
interesting to note that firms from industries known for high levels of political cost and
regulation (Money, Extracting Industries, and Utilities) and firms from industries with
high levels of intangibles and intellectual capital (Telecom and Chemicals) constitute the
lower half of the industry ranking, indicating that these are the industries with the least
valuation-useful accounting information.8
8 The industry ranking variable VUIND is used to test the external validity of the VUSCORE metric out
of the panel-data sample. Tests for the full sample (not tabulated) show that the positive correlation of ΔNI and FCE with CAR increases consistently with VUIND and that VUIND is positively correlated to ATOVER and -ΔBAS. These results provide assurance for the general out-of-sample validity of the VUSCORE metric.

26
3.3 Calculation of the Asymmetric Timeliness Metric
As discussed in section 2, stewardship is a not well defined concept, while this
paper assumes that financial accounting is fulfilling the stewardship role when it provides
information that is useful in evaluating management’s actions. Evaluating management’s
actions is predominantly done for contracting purposes. Following a rich line of literature
(Basu, 1997; Watts, 2003 a,b; and many others) that suggests conservatism of accounting
(here measured by the asymmetric timeliness of earnings) is the leading indicator of the
contractual efficiency of accounting data, I interpret asymmetric timeliness as this paper’s
main indicator for the level of fulfillment of the stewardship role of accounting.
In line with prior research using quarterly data (Basu et al., 2001; Givoly et al.,
2007), asymmetric timeliness is measured based on the following piecewise ‘reverse’
earnings-on-returns regression:
(3) itititiitiitiiit RETNEGRETNEGNI ,,,,3,,2,,1,0, * εββββ ++++= ,
where NI is price deflated earnings per share, and RET is the buy-and-hold return for the
quarter. NEG is one if RET is negative and zero otherwise (detailed definitions are given
in Appendix 1). Model (3) is estimated as a time-series model for each firm that has
more than 10 observations available. To ensure that enough observations with negative
returns are available in order to produce meaningful estimates of β3,i, at least five
observations with negative values for RET are required.
Most commonly, the level of conditional conservatism is assessed by analyzing
the value of β3,i from model (3). If β3,i is significantly positive, firm i is said to exhibit
conditional conservatism behavior on average, as β3,i is an indicator for the asymmetric
timeliness of earnings with respect to bad versus good news. This paper compares the

27
level of asymmetric timeliness across firms and so needs a metric for relative differences
in asymmetric timeliness. Following a method suggested by Gassen et al. (2006), I
calculate the metric of asymmetric timeliness used in this paper based on the regression
coefficients and on the geometric notion of the kink in the resulting regression line.
Applying trigonometry yields: CONSi = arctan(β3,i + β2,i) - arctan(β2,i). Based on prior
literature, the sample is expected to exhibit asymmetric timely behavior on average, thus
the mean and median of CONS are expected to be significantly positive.
Panel A of Table 2 verifies this. Also in line with prior literature (Francis et al.,
2004; Gassen et al., 2006; Givoly et al., 2007), a substantial number of firms having
CONS below zero are found, indicating an inverse asymmetric timely accounting
behavior (faster recognition of gains than of losses). This result mandates some analyses
to address internal validity concerns and to verify the metric for asymmetric timeliness.
In Panel B the panel sample is partionated by deciles of the firm-level metric of
asymmetric timeliness in 10 groups. If CONS is capturing asymmetric timeliness in the
original sense for the panel sample, the asymmetric timeliness is expected to increase
systematically across the 10 sub-samples. To test this model (4) is estimated for each of
the sub-samples.
(4) ititit
ititj
itjt
ittit
NEGRET
RETNEGFFINDUSTRYYEARNI
,,,3
,2,1
10
1,
2005
1990,,
* εβ
ββδγ
++
+++= ∑∑== ,
where NI is price-deflated earnings per share, and RET is the buy-and-hold return for the
quarter. NEG is one if RET is negative and zero otherwise. YEAR and FFINDUSTRY
are year and industry fixed effects, respectively (detailed definitions are given in
Appendix 1). Model (4) is estimated for each sub-sample using OLS and significance

28
tests are based on standard errors clustered by firms. The results of the 10 regressions are
reported in Panel B of Table 2. In order to compare the level of asymmetric timeliness
across samples, CONSD is calculated as arctan(β3 + β2) - arctan(β2). As can easily be
seen, the asymmetric timeliness of the sub-samples increases nearly monotonically with
their CONS rank. The trend across all relevant coefficients and CONSD is significant at
conventional levels as assessed by OLS regressions of the coefficients on their samples’
ranks and as reported by the right-most column of Panel B. Based on these results, I
conclude that the firm-specific metric CONSi captures the concept of asymmetric
timeliness.
Panel C reports the average levels of CONS across industries, indicating that asymmetric
timeliness is highest for firms in the “Telecom” industry and lowest for firms in the
“Utilities” industry. Although CONS exhibits significant variance across industries,
substantial within-industry variance of CONS is also observed, leading to the question
whether asymmetric timeliness is driven by industry-level determinants. Nevertheless,
CONSIND, an industry ranking based on CONS, is used to test the external validity of
CONS for the full sample. Results for the full sample (not tabulated) indicate that the
level of asymmetric timeliness consistently increases with CONSIND. I view this result
as supporting my conclusion that CONS is a robust firm-specific measure of asymmetric
timeliness, and thus a reasonable proxy for the fulfillment of the stewardship role by
accounting information.
3.4 Connection between Stewardship and Valuation Usefulness
This section addresses the core research question of the paper: Do higher levels of
stewardship lead to higher levels of valuation usefulness? As laid out in the second

29
section, two different proxy concepts for the stewardship-orientation of financial
accounting information will be applied. First, I will use the conditional conservatism
metric CONS, developed in the previous section, as a supply-side metric. Using this
metric, I apply three different tests using the panel sample, the full sample, and the cross-
sectional sample (Table 3 and 4). After that, four proxies for the relative importance of
high-transaction-costs stakeholders will be used as demand-site related metrics for the
stewardship-orientation of financial accounting information (Table 5).
A first analysis, reported in Panel A of Table 3, investigates for the panel sample
whether valuation usefulness has an impact on the stewardship role of accounting by
estimating the following model:
(5)
tiitititit
iitttiit
iitj
itjt
ttit
VUSCORENEGRETNEGRETVUSCORERETRETVUSCORENEG
VUSCORENEGFFINDUSTRYYEARNI
εβββββ
ββδγ
++
+++
++++= ∑∑==
*****
,,7,,6
,5,4,3
2,1
10
1,
2005
1990,
,
where NI is price-deflated earnings per share, and RET is the buy-and-hold return for the
quarter. NEG is one if RET is negative and zero otherwise. VUSCORE is the combined
metric of valuation usefulness. YEAR is a series of yearly and FFINDUSTRY a series of
industry fixed effects (detailed definitions are given in Appendix 1). Model (5) is
estimated on the panel sample using OLS and the significance tests are based on standard
errors clustered by firms.
Panel A details the results. The coefficients β5 and β7 are of particular interest,
indicating the impact of valuation usefulness on the asymmetric timeliness of earnings.
The interaction between RET and the valuation usefulness score is significantly positive,
indicating that firms with more valuation useful accounting information have more timely

30
earnings with respect to gains. In addition, the three-way interaction
REG*NET*VUSCORE is significantly negative, indicating that firms with more
valuation-useful financial accounting have less asymmetric timely earnings, which are
timelier in gain situations. This result speaks to the paper’s main research question:
Having overall timely gains with no asymmetric component appears to be an attribute of
valuation-useful earnings, while being less efficient from a stewardship perspective, as
fulfilling the stewardship role is supported by asymmetric timely earnings. Based on this
analysis, I would cautiously conclude that stewardship and valuation usefulness are
alternative objectives of financial accounting.
I test the robustness of this finding out-of-sample based on the full sample and on
the industry rank measure of valuation usefulness, VUIND. Specifically, the following
model is estimated:
(6)
itititit
ititititit
ititititt
ittit
VUINDNEGRETNEGRETVUINDRETRET
VUINDNEGVUINDNEGYEARNI
,,,,7
,,6,,5,4
,,3,2,1
2005
1990,,
****
*
εββββ
βββγ
+
+++
++++= ∑=
,
where NI is price deflated earnings per share, and RET is the buy-and-hold return for the
quarter. NEG is one if RET is negative and zero otherwise. VUIND is an industry rank
variable based on VUSCORE, the combined metric of valuation usefulness. YEAR is a
series of yearly fixed effects (detailed definitions are given in Appendix 1). Model (6) is
estimated on the full sample using OLS and the significance tests are based on standard
errors clustered by firms.
Again, the discussion focuses on β5 and β7. Both coefficients are significant; the
two-way interaction RET*VUIND is positive and the three-way interaction

31
RET*NEG*VUIND is negative. These results confirm the findings of Panel A discussed
above for the full sample.
The documented impact of valuation usefulness on asymmetric timeliness in
Table 3 could be driven by other factors that influence valuation usefulness and
asymmetric timeliness simultaneously, causing a spurious correlation between them.
This competing explanation is examined by including determinants of valuation
usefulness in a multivariate setting in Table 4. The following model is estimated on the
cross-sectional sample using OLS:
(7)
iiiii
iiii
iii
CONSZRETURNPERSPRED
MTBNUMESTSIZEFFINDUSTRYVUVAR
εββββ
βββδ
++++
++++= ∑=
7654
321
10
1)log(
,
where the dependent variable VUVAR is either ATOVER, ΔBAS, ERC, FCERC, or
VUSCORE. SIZE is the natural logarithm of average market capitalization. NUMEST is
the average number of analysts following the firm. MTB is the average market-to-book
ratio. PRED is a measure of earnings predictability: the R² coefficient of a AR(4) time-
series regression, regressing current quarter earnings per share (price-deflated) on prior
quarter earnings per share. PERS is a measure of earnings persistence: the sum of the
AR(1) and AR(4) coefficients from the AR(4) time-series regression of current quarter
earnings per share on prior periods earnings per share. ZRETURN is the average
percentage of trading days with zero returns to the firm. CONS is the firm-specific
measure of asymmetric timeliness, and FFINDUSTRY is a set of industry fixed effects
(detailed definitions are given in Appendix 1).
SIZE is included as a variable controlling for the public visibility of the firm and
other institutional aspects correlated with the size of the firm such as risk, agency

32
conflicts, and reporting costs. I make no sign prediction for size. In order to evaluate
accounting information and transform it into valuation-relevant information, an
informational infrastructure is needed. Financial analysts are part of this infrastructure
and, thus, the average number of analysts following the firm should be positively related
to the valuation usefulness of accounting information. On the other hand, it can be argued
that analysts are acting as substitutes for, and not as complements to, accounting
information (Francis et al., 2002). In that case, a negative relation could be expected.
The market-to-book ratio is used as a measure of growth opportunities available to
the firm.9 Decisions made in growing firms tend to be complex than those in static firms,
and thus one could expect accounting information to be more useful for evaluating
growth firms. Again, this reasoning might well be questioned: As growth firms are often
part of intangible, capital-intensive industries, and as accounting is argued to be less
informative in these settings (Francis/Schipper, 1999), it could also be expected that
financial accounting is less valuation-useful for high growth firms.
Prior literature discusses (Schipper/Vincent, 2003) and documents (Francis et al.,
2004) the link between earnings attributes and the valuation usefulness of earnings. From
a valuation framework standpoint, earnings should be more valuation-useful whenever
they are more persistent, as more persistent earnings yield more information about future
cash flows. Viewed similarly, earnings that are easier to predict provide more reliant
9 Market-to-book is used in the literature as a proxy for a vast diversity of economic concepts including
risk, conservatism, and growth (for an overview: Gassen et al., 2006). As the model controls for conditional conservatism, it appears to be valid to view MTB as a proxy for growth. Nevertheless, caution is to be applied when interpreting the results.

33
input factors and, thus, can be expected to be more valuation-useful.10 Thus, the model
incorporates PERS and PRED and both proxies are expected to be positively related to
the valuation usefulness of financial accounting.11
In order to manifest itself in the measures of valuation usefulness, financial
accounting information has to enter the price formation process. In a world where
transaction costs are present and differ systematically across firms, the pricing
mechanism cannot be assumed to be homogenous across all firms. I therefore include the
percentage of zero returns to control for the information environment of the firm. The
percentage of zero returns is a measure of transaction costs and liquidity (Lesmond et al.,
1999) and can be regarded as a proxy for information impounded into prices (Ashbaugh-
Skaife et al., 2006). The information environment influences the way accounting
information is evaluated by market participants. If the information environment is low
overall, accounting information might gain higher relative importance, given the absence
of other valuation-relevant information (Francis et al., 2002). On the other hand, market
participants might have problems incorporating accounting information on short notice,
due to higher levels of information asymmetry and fewer market participants willing to
trade. Thus, I make no sign predictions for ZRETURN. The final variable of model (8) is
the main variable of interest, the firm-specific measure of asymmetric timeliness, CONS, 10 It can be argued however that earnings that are very easy to predict cannot be decision useful, as they
convey no new information to the market. Thus, the variable PERS appears to be the concept more directly linked to the valuation role of earnings, and PRED is included mainly due to its role in prior literature.
11 In additional analyses (not tabulated) a third earnings attribute, earnings smoothness, defined as the standard deviation of net income divided by the standard deviation of cash flows from continuing operations, in included in model (8). Earnings smoothing is found to be significantly positively related to valuation usefulness, while other variables of interest are qualitatively unchanged. The model without smoothing is reported in the paper, as requiring cash flow data reduces the cross-sectional sample from 3,425 to 2,817 firm observations. Also, in untabulated robustness results, additional explanatory variables (standard deviation of daily abnormal returns, standard deviation of operating cash flows, frequency of losses, average operating cycle) are included as proxy variables for the firm’s operating and risk environment. These additional variables do not qualitatively affect the results.

34
which I view as a measure of the relative fulfillment of the stewardship role of accounting
for the given firm. According to this paper’s research design setup, I make no sign
prediction for CONS.
Panels A and B of Table 4 report the descriptive statistics of the independent
variables and the correlations, respectively. Generally, correlations are moderate to low
and in the expected direction. The regression results of model (7) are displayed in Panel
C. The results for the individual metrics for valuation usefulness are discussed first. For
ATOVER as the valuation usefulness proxy, the abnormal turnover around quarterly
earnings announcement dates is significantly positively related to the number of analysts
following, the growth prospects of the firm, and the informational efficiency of the price
process (captured by lower levels of ZRETURN), while it is negatively related to size and
the persistence of earnings. I interpret these findings as indicative that the informational
environment plays an active role when accounting information is being used by market
participants. Active markets with sufficient analyst coverage support accounting
information in generating abnormal trading activities.
When the change in bid-ask spreads around quarterly earnings announcement
dates is used as the dependent variable, it is positively related to size, the growth
prospects of the firm, and the level of asymmetric timeliness, and negatively related to
the informational efficiency of the price process. The negative impact of the
informational environment on the change in bid-ask spreads is as expected. The relation
to growth fits well with the result for the abnormal turnover, and it may indicate that, for
growth firms, financial accounting information, on average, induces more information
dispersion in the market, causing increased trading and raising bid-ask spreads. However,

35
it is interesting that more asymmetric timely earnings have a positive impact on the bid-
ask spread change around quarterly earnings announcement dates, indicating that
asymmetric timely earnings correlate with higher levels of information asymmetry. This
finding is consistent to LaFond/Watts (2008) which document that firms with higher
information asymmetries have more asymmetric timely earnings. Alternatively, it might
be explained by the two sides of asymmetric timely earnings. Losses generally are
communicated to the market before earnings are disclosed, and gains are not transformed
into earnings in a timely manner, yielding blurred earnings metrics in gain situations and
increasing information asymmetry over the short window.
The next regression uses the short window earnings change response coefficient
as a directional measure for valuation usefulness. This market reaction on earnings
change is found to be positively related to growth and the predictability and persistence
of earnings, while it is negatively related to the number of analysts following, the
informational efficiency of the price process, and the level of asymmetric timeliness.
While the positive results are as expected, the negative results are very interesting. First
of all, asymmetric timely earnings cause a less pronounced market response. Again, a
possible explanation for this result is that the market leads the accounting in the case of
losses and untimely earnings have relatively low valuation relevance in the case of gains.
I take particular interest in the result indicating that firms with poorer informational
infrastructure (indicated by less analyst following and a higher percentage of zero trading
days) observe a more pronounced short-window market response on earnings changes. I
interpret this result as evidence for earnings being more valuation useful for firms with
poorer information infrastructures.

36
When evaluating the short-window market response to earnings forecast errors it
is found that it is positively related to size, the number of analysts following, and the
growth prospects of the firm, and negatively related to the amount of asymmetric
timeliness. Again, the positive relations are as expected, as in the case of earnings
forecast errors the informational infrastructure, especially the number of analysts, has a
positive impact on the quality of the signal. The negative relation between the market
reaction to earnings surprises and asymmetric timeliness can be explained by asymmetric
timely earnings presenting no or only opaque new information to the market.
In the right-most column, the results for the summary metric of valuation
usefulness are reported. It is found to be positively related to the number of analysts
following, the persistence of earnings, and the informational efficiency of the pricing
process, and negatively related to the level of asymmetric timeliness.
After investigating the impact of stewardship on valuation usefulness when
stewardship is being measured by the asymmetric timeliness of accounting earnings,
Table 5 contains the results for the alternative demand-side metrics which measure the
relative importance of high-transaction-costs stakeholders. As laid out in section two,
high-transaction-costs stakeholders are assumed to have an on average higher demand for
stewardship-oriented financial accounting information. The applied metrics for the
relative importance of high-transaction-costs stakeholders are detailed in Panel A of
Table 5. The relative importance of debt holders is measured by DEBTi which is the
average of total debt divided by total assets for firm i.12 ACC_PAYi, the average of
12 It can well be argued that debt holders do not face significantly higher transactions costs than equity
holders in general. I still assume that on average debt holders bare higher transaction costs in my sample, since the sample is limited to firms with public equity outstanding but contains firms with private as well as with public debt. As investors generally face higher transaction costs on private

37
accounts payable divided by total assets over the time-series firm i, measures the relative
importance of lenders. The relative influence of lessors is captured by RENTEXPi, the
average of rental expenses divided by net sales over the time-series of firm i. Finally, the
relative importance of employees is being captured by EMPLi, the average of employees
in thousands divided by net sales in million USD for firm i. All variables are based on
yearly Compustat data. Requiring this data reduces the cross-sectional sample from
3,425 to 2,978 observations. I refer to the resulting sample as the limited cross-sectional
sample.
Panel B reports the correlation between the demand-side stewardship measures,
CONS and VUSCORE. First of all, VUSCORE is consistently negatively correlated with
all demand-side stewardship measures, lending univariate support for the claim that
valuation usefulness and stewardship are alternative objectives of financial accounting.
Second, asymmetric timeliness is only significantly positively correlated with DEBT,
indicating in line with prior literature that the demand for asymmetric timely earnings
increases with the relative importance of debt financing (Peek et al., 2006; Zhang, 2007).
The remaining correlation of CONS with the demand-side stewardship measures are low,
indicating that these metrics capture different aspects of the stewardship orientation of
financial accounting information and thus justifying their use in this research design. All
other correlations are moderate to low, with exemption of RENTEXP and EMPL which
exhibit a high correlation probably due to sharing the same denominator. Because of this
correlation, caution is used when interpreting model (9) which includes both variables as
explanatory variables.
capital markets, a higher percentage of capital traded on private markets indicates higher transactions costs.

38
Panel C reports the results of two determinant models:
(8)
iiiiii
iii
iii
SSHIPZRETURNPERSPREDMTB
NUMESTSIZEFFINDUSTRYVUSCORE
εβββββ
ββδ
+++++
+++= ∑=
76543
21
10
1)log(
and
(9)
iiiii
iiiii
iii
iii
CONSEMPLRENTEXPPAYACCDEBTZRETURNPERSPREDMTB
NUMESTSIZEFFINDUSTRYVUSCORE
εβββββββββ
ββδ
+++++++++
+++= ∑=
111098
76543
21
10
1
_
)log(
,
where SSHIP stands for one of the demand-side stewardship measures (DEBT,
ACC_PAY, RENTEXP, EMPL) and all other variables are as defined and discussed in
the presentation of model (7). In model (9) all stewardship metrics are included together
to assess their inter-relatedness. Both models are estimated using OLS. Turning to the
model results, the model estimates for the non-stewardship-related explanatory variables
are in general qualitatively the same as presented in Table 4 and will thus not be
discussed further. Focusing on the stewardship-retaled metrics, I find for the four
versions of model (8), that all metrics load significantly negative, indicating that the
valuation usefulness of quarterly financial accounting information decreases as the
relative importance of high-transaction-cost stakeholders increases. I interpret this finding
as consistent with the notion that the higher the demand for stewardship-oriented
financial reporting the lower the valuation usefulness of financial accounting information,
clearly lending support to the claim that stewardship and valuation usefulness are
alternative objectives of financial accounting. The results of model (9) indicate that
demand-side related stewardship measures possess explanatory power up-and-above the
supply-side motivated measure of asymmetric timeliness, while in turn asymmetric
timeliness still continues to be significantly negatively related with VUSCORE. The only

39
stewardship measure which is not longer significantly negatively related to VUSCORE
when all stewardship measures are included is EMPL. Taken together, model (9) clearly
supports the negative link between stewardship and valuation usefulness: All stewardship
measures are negatively related to valuation usefulness after controlling for other
determinants, four out of five significantly so.
The results of the multivariate analyses can be summed up as follows: Financial
accounting’s valuation usefulness is predominantly a function of a firm’s informational
infrastructure and earnings properties. Firms with persistent and smooth earnings and an
informationally efficient infrastructure have more valuation useful financial accounting
information, whereas firms in poorer informational infrastructures, firms with higher
levels of high-transaction-costs stakeholders, and firms that report earnings in an
asymmetric timely fashion in order to fulfill the stewardship role of financial accounting
have less valuation-useful financial accounting information in general.
4 Conclusion
I conclude that valuation usefulness and stewardship are alternative objectives of
financial accounting. Based on the results of this paper, for some firms within rich
information environments, accounting information appears to fulfill predominantly a
confirmatory role. This accounting information appears to be more useful in making
economic decisions related to contracting rather than valuation. Firms operating in weak
information environments, however, lack the channels to effectively communicate
valuation-relevant information by any means other than accounting information. For
these firms, accounting information appears to be valuation-useful from a valuation
perspective.

40
The results of this study are subject to several limitations. As far as internal
validity is concerned, the interpretation of the results relies on the used metrics for
valuation usefulness and stewardship to succeed in capturing their underlying economic
concepts. I try to carefully motivate their use, balance their respective strengths and
weaknesses, and provide some evidence that they are predictably related with factors,
which theory suggests should be linked to their underlying concepts. However, if the
metrics do not proxy for their underlying economic concepts, the conclusions of the paper
are not valid. In addition, I tried to identify additional independent variables that might
have an impact on the dependent constructs of interest and included these variables in the
determinant models. If I failed to include additional variables that are causally related to
the dependent variables, while being correlated with the independent variables, the
resulting omitted variables problem would question the validity of the findings. In
respect to external validity, this paper addresses only a limited time period of a selected
national capital market. While the U.S. market constitutes the largest equity market in
the world, and the chosen timeframe covers the last 16 years, it is still an empirically
open question whether the results of this paper extend to other time periods and other
markets as well.
Based on these limitations, it is obvious that I leave a lot to future research. The
usage of contract-related firm-year specific measures for the relative importance of the
stewardship role to assess the inter-relatedness of the valuation usefulness and the
stewardship role of accounting might be an interesting avenue. Another promising area is
the investigation of the valuation usefulness of financial accounting information on non-
equity markets. Building on the results of this paper about the influence of the

41
information environment on the role of accounting information it could be interesting to
explore the firm-specific determinants for the usage of financial accounting information
by market participants in greater detail.
From a standard-setting perspective, the results of this paper could contribute to
the development of the joint conceptual framework. If the Boards decide to adopt their
broad definition of decision usefulness, every piece of information is decision-useful and
stewardship as well as valuation usefulness are assumed to be compatible sub-objectives
of the single overall objective decision usefulness. However, the results of this paper
suggest that this broad definition blurs an important difference in the channels by which
accounting information affects economic relationships. Thus, stressing the importance of
this study’s limitations discussed above, I cautiously suggest that the Boards should
consider explicitly stating that the overall objective of decision usefulness gives rise to
two alternative sub-objectives, valuation usefulness and stewardship. In doing so, they
would acknowledge that financial reporting standard setting has to balance these
alternative objectives of financial reporting.

42
References
Arya, A., Glover, J., Mittendorf, B., Zhang, L., 2004. The disciplining role of accounting in the long-run. Review of Accounting Studies 9: 399-417.
ASB PN 293. Press release Accounting Standards Board, 11 July 2006. Ashbaugh-Skaife, H., Gassen, J., LaFond, R., 2006. Does stock price synchronicity
represent firm-specific information? The international evidence. MIT Sloan Research Paper 4551-05.
Ball, R., Robin, A., Sadka, G., 2008. Is financial reporting shaped by equity markets or by debt markets? An international study of timeliness and conservatism. Review of Accounting Studies, forthcoming.
Barth, M., Beaver, W., Landsman, W., 2001. The relevance of the value-relevance literature for financial accounting standard setting: Another view. Journal of Accounting and Economics 31: 77-104.
Basu, S., 1997. The conservatism principle and the asymmetric timeliness of earnings. Journal of Accounting and Economics 24: 3-37.
Basu, S., Hwang, L., Jan, C., 2001. Auditor Conservatism and Quarterly Earnings. Working Paper.
Beaver, W., 1968. The information content of annual earnings announcements. Journal of Accounting Research (Supplement) 6: 67-92.
Beaver, W., Demski, J., 1979. The nature of income measurement. Accounting Review 54: 38-46.
Benston, G., Smith, C., 1976. A transaction cost approach to the theory of financial intermediation. Journal of Finance 31: 215-231.
Brooks, R., 1996. Changes in asymmetric information at earnings and dividend announcements. Journal of Business Finance & Accounting 23: 359-378.
Bushman, R., Engel, E., Smith, A., 2006. An analysis of the relation between the stewardship and the valuation roles of earnings. Journal of Accounting Research 44: 53-83.
Chen, Q., Hemmer, T., Zhang, Y., 2007. On the relation between conservatism in accounting standards and incentives for earnings management. Journal of Accounting Research 45: 541-565.
Chen, X., Cheng., Q., Lo, K., 2006. Are analyst research and corporate disclosure complements or substitutes? Working paper.
Christensen, J., Demski, J., 2003. Accounting theory: an information content perspective. McGraw-Hill Irwin.
Christensen, J., Demski, J., 2004. Asymmetric monitoring: good versus bad news verification. Schmalenbach Business Review 56: 206-222.
Christensen, P., Feltham, G., Şabac, F., 2005. A contracting perspective on earnings quality. Journal of Accounting and Economics 39: 265-294.

43
DeFond, M., Hung, M., Trezevant, R., 2007. Investor protection and the information content of annual earnings announcements: International evidence. Journal of Accounting and Economics 43: 37-67.
Dietrich, R., Muller III, K., Riedl, E. 2007. Asymmetric timeliness tests of accounting conservatism. Review of Accounting Studies 12: 95-124.
DP IASB/FASB. Discussion paper: Preliminary views on an improved conceptual framework for financial reporting: The objective of financial reporting and Qualitative characteristics of decision-useful financial reporting information. IASB, London.
Fama, E., French, K., 1997. The Industry Costs of Equity. Journal of Financial Economics 43: 153-193.
Francis, J., Schipper, K., 1999. Have Financial Statements Lost their Relevance? Journal of Accounting Research 37: 319-352.
Francis, J., Schipper, K., Vincent, L., 2002a. Expanded disclosures and the increased usefulness of earnings announcements. The Accounting Review 77: 515-546.
Francis, J., Schipper, K., Vincent, L., 2002b. Earnings announcements and competing information. Journal of Accounting & Economics 33: 313-342.
Francis, J., LaFond, R., Ohlson, P. Schipper, K., 2004. Cost of equity and earnings attributes. Accounting Review 79: 967-1010.
Frankel, R., Kothari, S., Weber, J., 2006. Determinats of the informativeness of analyst research. Journal of Accounting & Economics 41: 29-54.
Gassen, J., Fülbier, R., Sellhorn, T., 2006. International differences in conditional conservatism: the role of unconditional conservatism and income smoothing. European Accounting Review 15: 527-564.
Gajewski, J., 1999. Earnings announcements, asymmetric information, trades and quotes. European Financial Management 5: 411-423.
Givoly, D., Hayn, C., Natarajan, A., 2007. Measuring reporting conservatism. Accounting Review 82: 65-106.
Gjesdal, F., 1981. Accounting for stewardship. Journal of Accounting Research 19: 208-231.
Hirshleifer, J., 1973. Where are we in the theory of information? The American Economic Review 63: 31-69.
Holthausen, R., and Watts, R. 2001. The relevance of the value-relevance literature for financial accounting standard setting. Journal of Accounting and Economics 31: 3-75.
IASB ON 20 FEB 2007. Information for observers, board meeting, 20 February 2007, London, Agenda Paper 3A.
Kim, O., Verrecchia, R., 1994. Market liquidity and volume around earnings announcements. Journal of Accounting and Economics 17: 41-67.
Kim, S., 1995. Efficiency of an information system in an agency model. Econometrica 63: 89-102.

44
Krinskey, I., Lee, J., 1996. Earnings announcements and the components of the bid ask spread. Journal of Finance 51: 1523-1535.
LaFond, R., Watts, R., 2008. The information role of conservatism, The Accounting Review 83: 447-578.
Lambert, R. 2001. Contracting theory and accounting. Journal of Accounting and Economics 32: 3-87.
Landsman, W., Maydew, E., 2002. Has the information content of quarterly earnings announcements declined in the past three decades? Journal of Accounting Research 40: 797-808.
Lambert, R., 2001. Contracting theory and accounting. Journal of Accounting and Economics 32: 3-87.
Lesmond, D., J. Ogden, and J. Trzcinka., 1999. A New Estimate of Transaction Costs. Review of Financial Studies 12: 1113-1141.
Liang, P., 2000. Accounting recognition, moral hazard, and communication. Contemporary Accounting Research 17: 457-490.
Liang, P., 2001. Recognition: An information content perspective. Accounting Horizons 15: 223-242.
Lipe, R., 1990. The relation between stock returns and accounting earnings given alternative information. Accounting Review 65: 49-71
Lo, K., Lys, T., 2000. Bridging the gap between value relevance and information content. Working paper.
O’Connell, V., 2007. Reflections on stewardship reporting. Accounting Horizons 21: 215-227.
Peek, E., Cuijpers, R., Buijink, W. 2007. Creditors' and shareholders' reporting demands in public versus private firms: Evidence from Europe. Working Paper.
Roulstone, D., 2003. Analyst following and market liquidity. Contemporary Accounting Research 20: 551-578.
Schipper, K., Vincent, L., 2003. Earnings quality. Accounting Horizons Supplement 13, 97-110.
Watts, R., 2003a. Conservatism in accounting, Part I: Explanations and implications. Accounting Horizons 17: 207-221.
Watts, R., 2003b. Conservatism in accounting, Part II: Evidence and research opportunities. Accounting Horizons 17: 287-301.
Zhang, J. 2007. The contracting benefits of accounting conservatism to lenders and bor-rowers. Journal of Accounting and Economics (forthcoming).

45
APPENDIX 1: Variable Definitions
Variable Definition
Independent Variables BASd,i = difference between daily closing ask and closing bid price from CRSP,
divided by the average of the closing bid and ask price for date d of firm i. Measured in base points.
CARt,i = cumulative abnormal value weighted return from the day prior to the day after the Compustat quarterly earnings announcement date for quarter t of firm i.
ΔNIt,i = change in Compustat quarterly earnings per share from the quarterly earnings per share of the previous year’s same quarter, deflated by the closing price per share of the previous year quarter for quarter t of firm i.
FCEt,i = IBES quarterly earnings forecast error, defined as the difference between the last summary mean earnings per share forecast and the actual earnings per share reported by IBES deflated by the closing price per share of the previous year quarter for quarter t of firm i.
NIt,i = Compustat quarterly earnings per share deflated by price per share at the beginning of the quarter for quarter t of firm i.
FFINDUSTRYt,i = variable indicating the membership of the firm in one of the ten industry groups proposed by Fama/French (1997).
YEARt = yearly fixed effects. RETt,i = buy and hold return of the quarter t of firm i. NEGt,i = one if RETt,i < 0 and zero otherwise. SIZEi = natural logarithm of the market capitalization of equity, averaged over all
quarterly observations of firm i. NUMESTi = number of analysts for the most recent quarterly earnings forecast on
IBES, averaged over all quarterly observations of firm i. MTBi = market value of equity divided by book value of equity, averaged over all
quarterly observations of firm i. PREDi = R² of an AR(4) forecast, regressing earnings per share deflated by price on
previous quarters’ earnings per share, requiring a minimum of ten observations.
PERSi = sum of the AR(1) and AR(4) coefficient from a AR(4) forecast, regressing earnings per share deflated by price on previous quarters’ earnings per share, requiring a minimum of ten observations..
ZRETURNi = percentage of trading days without return for firm i, averaged over all quarterly observations of firm i.

46
(APPENDIX 1 Continued) Variable Definition
Measures of valuation usefulness ATOVERi = average daily turnover from the day prior to the day after the Compustat
quarterly earnings announcement date minus the average daily turnover of a combined pre and post window, the pre window beginning 30 days and ending 5 days prior and the post window beginning 5 days and ending 30 days post the earnings announcement date. Averaged over all available observations of firm i, requiring a minimum of ten observations.
ΔBASi = difference between the average BASd,i from a window beginning 2 days and ending 5 days post the quarterly earnings announcement date and the average BASd,i from a window beginning 5 days and ending 2 days prior the earnings announcement date. Averaged over all available observations of firm i, requiring a minimum of ten observations.
ERCi = coefficient α1,i from the regression: ititiiit NICAR ,,,1,0, εαα +Δ+= over the time series of quarterly observations of firm i, requiring a minimum number of 10 observations.
FCERCi = coefficient α1,i from the regression: ititiiit FCECAR ,,,1,0, εαα ++= over the time series of quarterly observations of firm i, requiring a minimum number of 10 observations.
VUSCOREi = sum of the decile ranks of ATOVERi, -ΔBASi, ERCi, and FCERCi, [0,1] distributed.
VUINDj = ranking of the ten industry groups j proposed in Fama/French (1997), ranked by their average VUSCOREi, [0,1] distributed.
Measures of stewardship CONSi = kink in the regression line of the regression
itititiitiitiiit RETNEGRETNEGNI ,,,,3,,2,,1,0, * εββββ ++++= , calculated in degrees as )arctan()arctan( ,2,3,2 iiiiCONS βββ −+= for each firm i, requiring a minimum of 10 observations and a minimum of 5 observations with NEG equal to one.
DEBTj = average of total debt divided by total assets over the time series of firm i. ACC_PAYj = average of accounts payable divided by total assets over the time series of
firm i. RENTEXPj = average of rental expenses divided by net sales over the time series of
firm i. EMPLj = average of employees in thousands divided by net sales in million USD
over the time series of firm i.

47
APPENDIX 2: Quarterly Earnings Observations by Year and Industry (Panel Sample)
Year Fama/French Industry Total
Consumer Non. Dur
Consumer Durable
Extracting Industries Chemicals Manu-
facturing Telecom Utilities Shops Money Other
1990 199 158 97 219 1,269 86 54 741 342 310 3,475 (2.9 %) 1991 205 178 105 270 1,357 97 56 835 371 347 3,821 (3.2 %) 1992 244 186 115 388 1,503 114 60 1,054 430 453 4,547 (3.8 %) 1993 282 214 136 458 1,794 124 64 1,297 532 531 5,432 (4.5 %) 1994 335 272 150 503 2,094 146 64 1,544 960 560 6,628 (5.5 %) 1995 369 302 168 517 2,288 150 59 1,761 1,299 617 7,530 (6.3 %) 1996 413 328 172 581 2,563 162 63 2,109 1,391 663 8,445 (7.1 %) 1997 399 344 182 687 2,747 188 47 2,413 1,490 725 9,222 (7.7 %) 1998 388 344 169 795 2,802 186 46 2,568 1,528 793 9,619 (8.0 %) 1999 376 320 168 782 2,695 182 44 2,572 1,648 770 9,557 (8.0 %) 2000 348 286 176 803 2,691 261 43 2,699 1,760 782 9,849 (8.2 %) 2001 307 270 185 854 2,674 246 43 2,550 1,709 753 9,591 (8.0 %) 2002 292 248 174 824 2,538 236 44 2,474 1,661 727 9,218 (7.7 %) 2003 275 233 167 795 2,414 219 43 2,329 1,601 704 8,780 (7.3 %) 2004 258 211 147 757 2,315 210 44 2,139 1,466 657 8,204 (6.8 %) 2005 183 148 107 551 1,713 148 34 1,533 1,055 471 5,943 (5.0 %)
4,873 4,042 2,418 9,784 35,457 2,755 808 30,618 19,243 9,863 Total (4.1 %) (3.4 %) (2.0 %) (8.2 %) (29.6 %) (2.3 %) (0.7 %) (25.5 %) (16.1 %) (8.2 %)
119,861 (100 %)

48
TABLE 1: Metrics of Valuation Usefulness
Panel A: Cross-Sectional Valuation Usefulness Metrics
Variable # of Firms First Quartile Median Third Quartile Mean Std. Dev.
ATOVERi 3,425 0.840 2.699*** 5.940 4.207*** 4.742 ΔBASi 3,425 -15.615 -4.484*** 4.298 -5.664*** 25.533 ERCi 3,425 -0.044 0.201*** 0.661 0.443*** 1.309 FCERCi 3,425 0.239 1.969*** 6.840 6.522*** 14.025 VUSCOREi 3,425 0.389 0.500 0.611 0.500 0.176
Panel B: Correlations (Cross-Sectional Sample)
Variable ATOVERi ΔBASi ERCi FCERCi VUSCOREi
ATOVERi -0.021 -0.012 0.250 0.461 ΔBASi -0.063 0.003 0.007 -0.421 ERCi -0.033 -0.013 0.156 0.437 FCERCi 0.173 -0.014 0.209 0.455 VUSCOREi 0.531 -0.488 0.522 0.627
Panel C: Valuation-Usefulness Metric VUSCORE by Industry
Industry # of Firms First Quartile Median Third Quartile Mean Std. DevShops 935 0.417 0.556 (1) 0.667 0.542a 0.172
Manufacturing 956 0.417 0.528 (2) 0.639 0.525a,b 0.170 Consumer Non Durable 124 0.417 0.528 (2) 0.625 0.518a,b,c 0.160
Other 299 0.389 0.500 (4) 0.639 0.514a,b,c 0.185 Consumer Durable 102 0.389 0.472 (5) 0.583 0.486a,b,c,d 0.166
Telecom 100 0.361 0.444 (6) 0.514 0.445b,c,d 0.143 Chemicals 273 0.306 0.417 (8) 0.556 0.438c,d 0.173
Money 557 0.306 0.444 (6) 0.556 0.432d 0.168 Extracting Industries 61 0.306 0.417 (8) 0.500 0.423d,e 0.152
Utilities 18 0.250 0.347 (10) 0.444 0.350e 0.142
Notes: ATOVERi is the average abnormal share turnover of firm i over a three day window centered on the quarterly earnings announcement date. ΔBASi is the change in firm i’s average closing bid-ask-spread from a window prior to a window post the quarterly earnings announcement date. ERCi is the coefficient of the explantory variable in a regression of the three-day quarterly earnings announcement period’s abnormal returns of firm i on the change in quarterly earnings from the same quarter of the previous fiscal year. FCERCi is the coefficient of the explanatory variable in a regression of the three-day quarterly earnings announcement period’s abnormal returns of firm i on the IBES based earnings forecast error. VUSCORE is the sum of the deciles of ATOVER, -ΔBAS, ERC, and FCERC. All variables are 1%-winsorized where appropriate. See Appendix 1 for more detailed variable definitions. In Panel A, the significance of distribution means against zero is assessed by t-tests (Wilcoxon tests) for means (medians). ***/**/* marks two-sided significance at the 1/5/10% level. In Panel B, Pearson are above and Spearman correlations are below the diagonal. Bold typeset indicates two-sided significance below the 1 % level. In Panel C, the superscripts a,b,c,d,e indicate that the respective industry groups distributions’ means of VUSCOREi are not significantly different from each other at the 1 % level.

49
TABLE 2: Asymmetric Timeliness as a measure of Stewardship
Panel A: Cross-Sectional CONS Metric
Variable # of Firms First Quartile Median Third Quartile Mean Std. Dev.
CONSi 3,425 -1.318 0.706*** 4.082 2.396*** 8.609
Panel B: Portfolio Test of CONS (Panel Sample)
(4) itititititj
itjt
ttit NEGRETRETNEGFFINDUSTRYYEARNI ,,,3,2,1
10
1,
2005
1990, * εβββδγ +++++= ∑∑
==
Coeff. Lower Deciles of CONS Higher Deciles of CONS Trend
1 2 3 4 5 6 7 8 9 10 β1 -0.014*** -0.004*** -0.002 -0.002** 0.002** -0.001 -0.001 0.001 0.000 0.009*** 0.00 β2 0.024*** 0.011*** 0.001 -0.006** -0.003* -0.011*** -0.021*** -0.024*** -0.039*** -0.086*** 0.00 β3 -0.059*** -0.002 0.027*** 0.034*** 0.030*** 0.055*** 0.080*** 0.107*** 0.165*** 0.362*** 0.00
CONSD -3.389 -0.114 1.559 1.928 1.726 3.131 4.582 6.132 9.433 20.356 0.00 Adj. R² 0.095 0.082 0.086 0.106 0.166 0.070 0.102 0.092 0.145 0.261 0.07
n 10,384 12,400 12,735 12,579 12,804 12,226 12,480 11,952 11,742 10,559
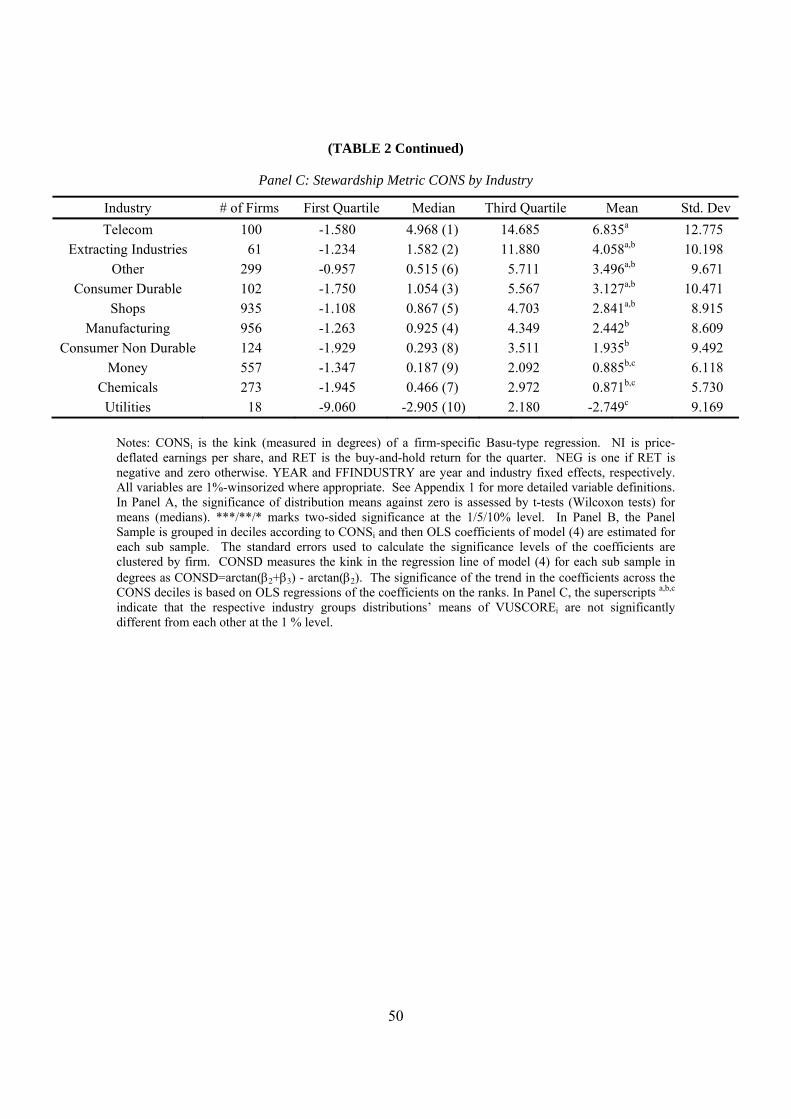
50
(TABLE 2 Continued)
Panel C: Stewardship Metric CONS by Industry
Industry # of Firms First Quartile Median Third Quartile Mean Std. Dev Telecom 100 -1.580 4.968 (1) 14.685 6.835a 12.775
Extracting Industries 61 -1.234 1.582 (2) 11.880 4.058a,b 10.198 Other 299 -0.957 0.515 (6) 5.711 3.496a,b 9.671
Consumer Durable 102 -1.750 1.054 (3) 5.567 3.127a,b 10.471 Shops 935 -1.108 0.867 (5) 4.703 2.841a,b 8.915
Manufacturing 956 -1.263 0.925 (4) 4.349 2.442b 8.609 Consumer Non Durable 124 -1.929 0.293 (8) 3.511 1.935b 9.492
Money 557 -1.347 0.187 (9) 2.092 0.885b,c 6.118 Chemicals 273 -1.945 0.466 (7) 2.972 0.871b,c 5.730
Utilities 18 -9.060 -2.905 (10) 2.180 -2.749c 9.169
Notes: CONSi is the kink (measured in degrees) of a firm-specific Basu-type regression. NI is price-deflated earnings per share, and RET is the buy-and-hold return for the quarter. NEG is one if RET is negative and zero otherwise. YEAR and FFINDUSTRY are year and industry fixed effects, respectively. All variables are 1%-winsorized where appropriate. See Appendix 1 for more detailed variable definitions. In Panel A, the significance of distribution means against zero is assessed by t-tests (Wilcoxon tests) for means (medians). ***/**/* marks two-sided significance at the 1/5/10% level. In Panel B, the Panel Sample is grouped in deciles according to CONSi and then OLS coefficients of model (4) are estimated for each sub sample. The standard errors used to calculate the significance levels of the coefficients are clustered by firm. CONSD measures the kink in the regression line of model (4) for each sub sample in degrees as CONSD=arctan(β2+β3) - arctan(β2). The significance of the trend in the coefficients across the CONS deciles is based on OLS regressions of the coefficients on the ranks. In Panel C, the superscripts a,b,c
indicate that the respective industry groups distributions’ means of VUSCOREi are not significantly different from each other at the 1 % level.

51
TABLE 3: Impact of Valuation Usefulness on Stewardship
Panel A: Panel Regression Analysis (Panel Sample)
(5)
tiititititiittt
iitiitj
itjt
ttit
VUSCORENEGRETNEGRETVUSCORERETRET
VUSCORENEGVUSCORENEGFFINDUSTRYYEARNI
εββββ
βββδγ
++++
+++++= ∑∑==
****
*
,,7,,6,5,4
,32,1
10
1,
2005
1990,
Panel Sample Estimate Prob. NEGt,i -0.004 0.048 VUSCOREi 0.008 0.001 NEGt,i*VUSCOREi 0.005 0.101 RETt,i -0.078 0.000 RETt,i*VUSCOREi 0.095 0.000 RETt,i*NEGt,i 0.260 0.000 RETt,i*NEGt,i*VUSCOREi -0.253 0.000 R2 0.079 n 119,861
Panel B: Out-of-Sample Evidence (Full Sample)
(6)
itititititititit
itititititt
ittit
VUINDNEGRETNEGRETVUINDRET
RETVUINDNEGVUINDNEGYEARNI
,,,,7,,6,,5
,4,,3,2,1
2005
1990,,
****
*
εβββ
ββββγ
++++
++++= ∑=
Full Sample Estimate Prob. NEGt,i 0.002 0.005 VUINDt,i -0.017 0.000 NEGt,i*VUINDt,i -0.002 0.189 RETt,i -0.050 0.000 RETt,i*VUINDt,i 0.010 0.036 RETt,i*NEGt,i 0.262 0.000 RETt,i*NEGt,i*VUINDt,i -0.074 0.000 R2 0.090 n 311,907
Notes: NI is price-deflated earnings per share, and RET is the buy-and-hold return for the quarter. NEG is one if RET is negative and zero otherwise. YEAR and FFINDUSTRY are year and industry fixed effects, respectively. VUSCORE is a combined rank measure of the valuation-usefulness measures presented in Table 1. VUIND is the industry ranking based on VUSCORE as presented in Table 1. All variables are 1%-winsorized where appropriate. See Appendix 1 for more detailed variable definitions. The coefficients of model (5) and (6) are estimated using OLS and the standard errors used to calculate their significance levels are clustered by firm.

52
TABLE 4: Determinants of Valuation Usefulness
Panel A: Additional Independent Variables
Variable # of Firms First Quartile Median Third Quartile Mean Std. Dev.
SIZEi 3,425 4.201 5.051 5.960 5.134 1.298 NUMESTi 3,425 1.733 2.846 4.900 4.000 3.515 MTBi 3,425 1.658 2.480 3.972 3.159 2.214 PREDi 3,425 0.151 0.239 0.349 0.259 0.162 PERSi 3,425 -0.049 0.150 0.346 0.146 0.286 ZRETURNi 3,425 0.069 0.123 0.183 0.131 0.076
Panel B: Correlations (Cross-Sectional Sample)
Variable NUMESTi MTBi PREDi PERSi ZRETURNi CONSi ATOVERi ΔBASi ERCi FCERCi VUSCOREi
SIZEi 0.723 0.340 0.011 0.035 -0.643 -0.051 0.317 0.052 -0.032 0.344 0.178 (0.740) (0.361) (0.012) (0.022) (-0.663) (-0.049) (0.240) (0.070) (-0.065) (0.308) (0.178) NUMESTi 0.330 -0.014 0.029 -0.480 -0.015 0.499 0.041 -0.046 0.337 0.248 (0.375) (0.013) (0.004) (-0.586) (-0.025) (0.471) (0.041) (-0.076) (0.302) (0.288) MTBi 0.035 -0.021 -0.373 -0.030 0.318 0.038 0.013 0.219 0.149 (0.063) (-0.007) (-0.450) (-0.004) (0.356) (0.020) (-0.023) (0.141) (0.201) PREDi 0.361 -0.102 0.021 -0.009 0.007 0.091 -0.001 0.031 (0.401) (-0.115) (0.027) -(0.017) (0.000) (0.108) (-0.010) (0.038) PERSi 0.029 0.008 -0.043 0.011 0.070 0.018 0.049 (0.047) (0.012) -(0.027) (0.018) (0.096) (0.058) (0.050) ZRETURNi -0.003 -0.401 0.056 0.060 -0.243 -0.246 (-0.019) (-0.380) (0.040) (0.090) (-0.214) (-0.239) CONSi 0.032 0.041 -0.060 -0.076 -0.081 (0.062) (0.017) (-0.085) (-0.080) (-0.057)

53
Panel C: Cross-sectional Regression Analyses
(7)
iiiii
iiii
iii
CONSZRETURNPERSPRED
MTBNUMESTSIZEFFINDUSTRYVUVAR
εββββ
βββδ
++++
++++= ∑=
7654
321
10
1)log(
VUVARi =
ATOVERi
VUVARi =
ΔBASi
VUVARi=
ERCi
VUVARi =
FCERCi
VUVARi =
VUSCOREi
Estimate (Prob.)
Estimate (Prob.)
Estimate (Prob.)
Estimate (Prob.)
Estimate (Prob.)
SIZEi -0.658 2.742 0.035 2.217 -0.007 (0.000) (0.000) (0.245) (0.000) (0.070) log(NUMEST)i 0.614 0.088 -0.019 0.550 0.008 (0.000) (0.636) (0.043) (0.000) (0.000) MTBi 0.236 0.571 0.033 0.705 0.002 (0.000) (0.012) (0.005) (0.000) (0.210) PREDi -0.550 4.096 0.638 -1.368 -0.012 (0.195) (0.161) (0.000) (0.356) (0.537) PERSi -0.526 -0.866 0.196 0.920 0.038 (0.027) (0.598) (0.020) (0.270) (0.000) ZRETURNi -15.335 58.288 1.402 -2.683 -0.445 (0.000) (0.000) (0.001) (0.499) (0.000) CONSi 0.397 6.571 -0.408 -4.720 -0.089 (0.232) (0.004) (0.001) (0.000) (0.000) R2 0.404 0.026 0.026 0.167 0.152 n 3,425 3,425 3,425 3,425 3,425
Notes: ATOVERi is the average abnormal share turnover of firm i over a three day window centered on the quarterly earnings announcement date. ΔBASi is the average change in firm i’s closing bid-ask-spread from a window prior to a window post the quarterly earnings announcement date. ERCi is the coefficient of the explanatory variable in a regression of the three-day quarterly earnings announcement period’s abnormal returns of firm i of the on the change in quarterly earnings. FCERCi is the coefficient of the explanatory variable in a regression of the three-day quarterly earnings announcement period’s abnormal returns of firm i on the IBES based earnings forecast error. VUSCORE is the sum of the deciles of ATOVER, -ΔBAS, ERC, and FCERC. SIZE is the natural logarithm of average market capitalization. NUMEST is the average number of analysts following the firm. MTB is the average market-to-book ratio. PRED is a measure of earnings predictability, the R² coefficient of a AR(4) time-series regression, regressing current quarter earnings per share (price-deflated) on prior quarter earnings per share. PERS is a measure of earnings persistence, the sum of the AR(1) and AR(4) coefficients from the AR(4) time-series regression of current quarter earnings per share on prior periods earnings per share. ZRETURN is the average percentage of trading days with zero returns to the firm. CONS is the firm-specific measure of asymmetric timeliness, the kink (measured in degrees) of a firm-specific BASU-type regression and FFINDUSTRY is a set of industry fixed effects All variables are 1%-winsorized where appropriate. See Appendix 1 for more detailed variable definitions. In Panel B, numbers above are Pearson and numbers in brackets below are Spearman correlations. Bold typeset indicates two-sided significance below the 1 % level. In Panel C, model (7) is estimated for the cross-sectional sample using OLS.

54
TABLE 5: Demand-Side Metrics of Stewardship
Panel A: Cross-Sectional Metrics
Variable # of Firms First Quartile Median Third Quartile Mean Std. Dev.
DEBTi 2,978 0.029 0.118 0.262 0.171 0.173 ΑCC_PAYi 2,978 0.043 0.071 0.117 0.107 0.129 RENTEXPi 2,978 0.012 0.024 0.047 0.056 0.120 EMPLi 2,978 0.005 0.007 0.011 0.011 0.016
Panel B: Correlations (Limited Cross-Sectional Sample)
Variable VUSCOREi CONSi ZRETURNi DEBTi ACC_PAYi RENTEXPi EMPLi
VUSCOREi -0.103 -0.240 -0.167 -0.071 -0.173 -0.150 CONSi -0.080 -0.005 0.121 0.014 -0.019 -0.033 ZRETURNi -0.229 -0.016 0.185 0.106 -0.109 0.010 DEBTi -0.171 0.059 0.252 -0.037 -0.055 -0.023 ΑCC_PAYi -0.011 0.033 0.213 0.111 -0.088 -0.132 RENTEXPi -0.117 0.014 -0.193 -0.168 -0.169 0.734 EMPLi -0.101 -0.018 0.087 0.055 -0.222 0.498

55
TABLE 5 (Continued)
Panel C: Cross-sectional Regression Analyses
(8)
iiiii
iiii
iii
SSHIPZRETURNPERSPRED
MTBNUMESTSIZEFFINDUSTRYVUSCORE
εββββ
βββδ
++++
++++= ∑=
7654
321
10
1)log(
(9)
iiii
iiiii
iiii
iii
CONSEMPLRENTEXPPAYACCDEBTZRETURNPERSPRED
MTBNUMESTSIZEFFINDUSTRYVUSCORE
εββββββββ
βββδ
++++++++
++++= ∑=
11109
87654
321
10
1
_
)log(
SSHIPi =
DEBTi
SSHIPi =
ACC_PAYi
SSHIPi =
RENTEXPi
SSHIPi =
EMPLi
Model (9)
Estimate (Prob.)
Estimate (Prob.)
Estimate (Prob.)
Estimate (Prob.)
Estimate (Prob.)
SIZEi 0.000 -0.002 -0.007 -0.004 -0.004 (0.952) (0.592) (0.101) (0.283) (0.292) log(NUMEST)i 0.007 0.007 0.007 0.007 0.007 (0.000) (0.000) (0.000) (0.000) (0.000) MTBi 0.001 0.002 0.004 0.003 0.003 (0.560) (0.266) (0.009) (0.042) (0.091) PREDi -0.007 -0.008 0.006 -0.002 0.008 (0.751) (0.718) (0.805) (0.914) (0.720) PERSi 0.031 0.033 0.033 0.035 0.032 (0.007) (0.004) (0.003) (0.002) (0.005) ZRETURNi -0.354 -0.403 -0.472 -0.420 -0.404 (0.000) (0.000) (0.000) (0.000) (0.000) DEBTi -0.108 -0.100 (0.000) (0.000) ACC_PAYi -0.056 -0.067 (0.037) (0.011) RENTEXPi -0.250 -0.208 (0.000) (0.000) EMPLi -1.398 -0.425 (0.000) (0.126) CONSi -0.082 (0.000) R2 0.133 0.125 0.146 0.138 0.166 n 2,978 2,978 2,978 2,978 2,978

56
Notes: The limited cross-sectional sample contains all firm observations from the cross-sectional sample for which sufficient data are available to calculate the demand-side stewardship metrics. DEBTi is the average of total debt divided by total assets for firm i. ACC_PAYi is the average of accounts payable divided by total assets for firm i. RENTEXPi is the average of rental expenses divided by net sales for firm i. EMPLi is the average of employees in thousands divided by net sales in million USD for firm i. All variables are based on yearly Compustat data. VUSCORE is a combined rank measure of the valuation-usefulness measures presented in Table 1. SIZE is the natural logarithm of average market capitalization. NUMEST is the average number of analysts following the firm. MTB is the average market-to-book ratio. PRED is a measure of earnings predictability, the R² coefficient of a AR(4) time-series regression, regressing current quarter earnings per share (price-deflated) on prior quarter earnings per share. PERS is a measure of earnings persistence, the sum of the AR(1) and AR(4) coefficients from the AR(4) time-series regression of current quarter earnings per share on prior periods earnings per share. ZRETURN is the average percentage of trading days with zero returns to the firm. CONS is the firm-specific measure of asymmetric timeliness, the kink (measured in degrees) of a firm-specific BASU-type regression and FFINDUSTRY is a set of industry fixed effects All variables are 1%-winsorized where appropriate. See Appendix 1 for more detailed variable definitions. In the correlations tables of Panel B, Pearson are above and Spearman correlations are below the diagonal. Also in Panel B, bold typeset indicates two-sided significance below the 1 % level. In Panel C, models (8) and (9) are estimated for the limited cross-sectional sample using OLS.

SFB 649 Discussion Paper Series 2008
For a complete list of Discussion Papers published by the SFB 649, please visit http://sfb649.wiwi.hu-berlin.de.
001 "Testing Monotonicity of Pricing Kernels" by Yuri Golubev, Wolfgang Härdle and Roman Timonfeev, January 2008.
002 "Adaptive pointwise estimation in time-inhomogeneous time-series models" by Pavel Cizek, Wolfgang Härdle and Vladimir Spokoiny, January 2008. 003 "The Bayesian Additive Classification Tree Applied to Credit Risk Modelling" by Junni L. Zhang and Wolfgang Härdle, January 2008. 004 "Independent Component Analysis Via Copula Techniques" by Ray-Bing Chen, Meihui Guo, Wolfgang Härdle and Shih-Feng Huang, January 2008. 005 "The Default Risk of Firms Examined with Smooth Support Vector Machines" by Wolfgang Härdle, Yuh-Jye Lee, Dorothea Schäfer and Yi-Ren Yeh, January 2008. 006 "Value-at-Risk and Expected Shortfall when there is long range dependence" by Wolfgang Härdle and Julius Mungo, Januray 2008. 007 "A Consistent Nonparametric Test for Causality in Quantile" by Kiho Jeong and Wolfgang Härdle, January 2008. 008 "Do Legal Standards Affect Ethical Concerns of Consumers?" by Dirk Engelmann and Dorothea Kübler, January 2008. 009 "Recursive Portfolio Selection with Decision Trees" by Anton Andriyashin, Wolfgang Härdle and Roman Timofeev, January 2008. 010 "Do Public Banks have a Competitive Advantage?" by Astrid Matthey, January 2008. 011 "Don’t aim too high: the potential costs of high aspirations" by Astrid Matthey and Nadja Dwenger, January 2008. 012 "Visualizing exploratory factor analysis models" by Sigbert Klinke and Cornelia Wagner, January 2008. 013 "House Prices and Replacement Cost: A Micro-Level Analysis" by Rainer Schulz and Axel Werwatz, January 2008. 014 "Support Vector Regression Based GARCH Model with Application to Forecasting Volatility of Financial Returns" by Shiyi Chen, Kiho Jeong and Wolfgang Härdle, January 2008. 015 "Structural Constant Conditional Correlation" by Enzo Weber, January 2008. 016 "Estimating Investment Equations in Imperfect Capital Markets" by Silke Hüttel, Oliver Mußhoff, Martin Odening and Nataliya Zinych, January 2008. 017 "Adaptive Forecasting of the EURIBOR Swap Term Structure" by Oliver Blaskowitz and Helmut Herwatz, January 2008. 018 "Solving, Estimating and Selecting Nonlinear Dynamic Models without the Curse of Dimensionality" by Viktor Winschel and Markus Krätzig, February 2008. 019 "The Accuracy of Long-term Real Estate Valuations" by Rainer Schulz, Markus Staiber, Martin Wersing and Axel Werwatz, February 2008. 020 "The Impact of International Outsourcing on Labour Market Dynamics in Germany" by Ronald Bachmann and Sebastian Braun, February 2008. 021 "Preferences for Collective versus Individualised Wage Setting" by Tito Boeri and Michael C. Burda, February 2008.
SFB 649, Spandauer Straße 1, D-10178 Berlin http://sfb649.wiwi.hu-berlin.de
This research was supported by the Deutsche
Forschungsgemeinschaft through the SFB 649 "Economic Risk".

SFB 649, Spandauer Straße 1, D-10178 Berlin http://sfb649.wiwi.hu-berlin.de
This research was supported by the Deutsche
Forschungsgemeinschaft through the SFB 649 "Economic Risk".
022 "Lumpy Labor Adjustment as a Propagation Mechanism of Business Cycles" by Fang Yao, February 2008. 023 "Family Management, Family Ownership and Downsizing: Evidence from S&P 500 Firms" by Jörn Hendrich Block, February 2008. 024 "Skill Specific Unemployment with Imperfect Substitution of Skills" by Runli Xie, March 2008. 025 "Price Adjustment to News with Uncertain Precision" by Nikolaus Hautsch, Dieter Hess and Christoph Müller, March 2008. 026 "Information and Beliefs in a Repeated Normal-form Game" by Dietmar Fehr, Dorothea Kübler and David Danz, March 2008. 027 "The Stochastic Fluctuation of the Quantile Regression Curve" by Wolfgang Härdle and Song Song, March 2008. 028 "Are stewardship and valuation usefulness compatible or alternative objectives of financial accounting?" by Joachim Gassen, March 2008.