Embed Size (px)
Citation preview

An Introduction toUltraviolet-VisibleMolecularAbsorptionSpectrometry
Molecula. r absorption spectro. scopy in theultral'iolet and l'isible spectral regions
is widely used for the quantitatil'edetermination of a large number of inorganic,
organic, and biological species. In this chapter, weintroduce the principles of molecular absorption
spectroscopy based on electromagnetic T"Qdiation in
the wal'elength region of 190 to 800 nm. Many ofthese principles, howel'er, are applicable to spec-troscopic measurements in other spectral regionssuch as the infrared region.
fd'l Throughout this chapter, this logo indicateslQ.J an opportunity for online self-study at www.thomsonedu.com /cbemistry/skoog, linking you tointeractive tutorials, simulations, and exercises.
Molecular absorption spectroscopy I is based on themeasurement of the transmittance T or the absorbanceA of solutions contained in transparent cells having apath length of b centimeters. Ordinarily. the concen-tration of an absorbing analyte is linearly related to ab-sorbance as given by Beer's law:
PoA = -logT = logp = ebc
All of the variables in this equation are defined inTable 13-1.
13A MEASUREMENT OFTRANSMITTANCE ANDABSORBANCE
Transmittance and absorbance, as det1ned in Table13-1, cannot normally be measured in the laboratorybecause the analyte solution must be held in a trans-parent container. or cell. As shown in Figure 13-1, re-flection occurs at the two air-wall interfaces as well asat the two wall-solution interfaces. The resulting beamattenuation is substantial, as we demonstrated in Ex-ample 6-2, where it was shown that about 8.5% of abeam of yellow light is lost by reflection in passingthrough a glass cell containing water. In addition, atten-uation of a beam may occur as a result of scattering bylarge molecules and sometimes from absorption bythe container walls. To compensate for these effects,the power of the beam transmitted by the analyte solu-tion is usually compared with the power of the beamtransmitted by an identical cell containing only solvent.An experimental transmittanee and absorbance thatclosely approximate the true transmittance and absor-bance are then obtained with the equations
A I 1"01"", I Po= og~~= og-P~ulution p
The terms Po and 1', as used in the remainder of thisbook, refer to the power of radiation after it has passed
\ For further study, see F. Settle. ed .. Handbook of Instrumental Techniquesfor Analytical Chemistry, Upper Saddle River, NJ: Prenlice-HalL llJ97,S<,;c-tions IIIand IV; 1. D. Inglc Ir. and S. R. Crouch. Spectrochemical Analysis.Upper Saddle River. NJ: Prentice HaIL 19HH; E. J Meehan, in Treutise onAnalytical Chemistry. 2nd cd .. Part I, VoL 7. Chaps. 1-3. P. 1. Eking, E. J
Meehan. and I. M. Kolthoff, cds .. New York, NY: Wile ••., t981: 1. E. Cmob.
The Spectrum in Chemistry. New York: Academic Prc~s. 1978.
Incident radiant power, PoTransmitted radiant power, PAbsorbance, ATransmittance, TPath length 01 sample, bConcentration of absorber, cAbsorptivity,' aMolar absorptivity,' 6
Radiant power in watts incident on sampleRadiant power transmitted by sample10g(PoIP)PIPoLength over which attenuation occursConcentration in specified unitsAI(bc)AI(bc)
Incident intensity. 10
Transmitted intensity, IOptical density. D; extinction, ETransmission, TI,d
Extinction coefficient, kMolar extinction coefficient
*Terminology recommended by the American Chemical Society (Anal. CharI., 1990,62,91).
I C may be expressed in grams per liter or in other specified concentration units: b may be expressed in centimeters or other units of length.
tc is expressed in moles per liter; b is expressed in centimeters.
Reflection lossesat interfaces '""'~ .
Scatteringlosses insolution
~ Reflection lossesat interfaces
FIGURE 13-1 Reflection and scattering losses with asolution contained in a typical glass cell. Losses by re-fiecuO{lcan occur at all the boundaries that separatethe Ilifferentmaterials. In this example, the light passesthrough the air-glass, glass-solution, solution-glass, andglass-air interfaces.
through cells containing the solvent and the analytesolutions, respectively.
Equation 13-1 represents Beer's law. This relationshipcan be rationalized as follows.' Consider the blockof absorbing matter (solid, liquid, or gas) shown in
FIGURE 13-2 Radiation of initialradiant power Pois attenuated to transmitted power P by a solutioncontaining c moles per liter of absorbing solution witha path length of b centimeters.
Figure 13-2. A beam of parallel monochromatic radia-tion with power Po strikes the bloek perpendicular toa surface. After passing through a length b of the mate-rial, which contains n absorbing atoms. ions. or mole-cules. its power is decreased to I' as a result of absorp-tion. Consider now a eross section of the block havingan area S and an infinitesimal thickness dx. Within thissection there are dn absorbing particles; we can imaginea surface associated with each particle at which photoneapture will occur. That is, if a photon reaches one ofthese areas by chance, absorption will follow immedi-ately. The total projected area of these capture surfaceswithin the section is designated as dS; the ratio of thecapture area to the total area, then, is dS/S. On a statis-tical average, this ratio represents the probability forthe capture of photons within the section.
The power of the beam entering the section, 1'" isproportional to the number of photons per unit area,
and dP, represents the power absorbed within the sec-tion. The fraction absorbed is then -dP,IPxo and thisratio also equals the average probability for capture.The term is given a minus sign to indicate that the radi-ant power P decreases as it passes through the absorb-ing region. Thus,
dE', d5P, 5
Recall, now, that d5 is the sum of the capture areasfor particles within the section; it must therefore beproportional to the number of particles, or
where dn is the number of particles and a is a propor-tionality constant, which can be called the capture crosssection. Combining Equations 13-4 and 13-5 and inte-grating over the interval between 0 and n, we obtain-r dp, = !"adn
Pn Px 0 S
When these integrals are evaluated, we find that
-In!.. = anPo 5
After converting to base 10 logarithms and invertingthe fraction to change the sign, we obtain
log J>" = ---'!"-P 2.3035
where n is the total number of particles within theblock shown in Figure 13-2. The cross-sectional areaS can be expressed as the ratio of the volume of theblock V in cubic centimeters to its length I> in centime-ters. Thus,
5 = ""cm'I>
anI>2.303V
Note that IlIV is the number of particles per cubic cen-timeter, which has the units of concentration. We canthen convert IlIV to moles per liter because the numberof moles is given by
n p;>HielcSnumber mol ~ -------.
6.02 X 10²¹ p.ar-fictl!S1 mol
and c in moles per liter is given by
n lO00em'/lc = 6.02 X 10" mol x V em'
1000116.02 X lO"V moUl
Combining this relationship with Equation 13-7 yields
10 J>" = 6.02 X 10"abcg P 2.303 x 1000
Finally, the constants in this equation can be colleetedinto a single term e to give
Pologp = ebc = A
13B-1 Application of Beer's Law to Mixtures
Beer's law also applies to a medium containing morethan one kind of absorbing substance. Provided thatthe species do not interact, the total absorbance for amulticomponent system is given by
Atotal = At + Az + ... + An
= e[l>c + e2bc + ... + enl>c (13-9)
where the subscripts refer to absorbing components1,2, ... , n.
13B-2 Limitations to Beer's Law
Few exceptions are found to the generalization thatabsorbance is linearly related to path length. On theother hand, deviations from the direct proportionalitybetween the measured absorbance and concentrationfrequently occur when I> is constant. Some of these de-viations, called real deviatiolls, are fundamental andrepresent real limitations of the law. Others are a resultof how the absorbance measurements are made (in-strumental deviations) or a result of chemical changesthat occur when the concentration changes (chemicaldeviations).
Real Limitations to Beer's Law
Beer's law describes the absorption behavior of mediacontaining relatively low analyte concentrations; in thissense, it is a limiting law. At high concentrations (usu-ally >0.01 M), the extent of solute-solvent interactions.solute-solute interactions, or hydrogcn bonding can
r::"iI Exercise: Learn more about absorption~ spectrophotometry.
affect the analyte environment and its absorptivity. Forexample. at high concentrations, the average distancesbetween the molecules or ions responsihle for absorp-tion are diminished to the point where each particleaffects the charge distribution of its neighbors. Thcsesolute-solute interactions can alter the ability of the an-alyte species to absorb a given wavelength of radiation.Because the extent of interaction depends on concen-tration, deviations from the linear relationship hetweenabsorbance and concentration occur. A similar effect issometimes encountered in media containing low ah-sorber concentrations but high concentrations of otherspecies, particularly electrolytes. The proximity of ionsto the absorber alters the molar absorptivity of the lat-ter by electrostatic interactions; the effect is lessened bydilution.
Although the effect of molecular interactions is or-dinarily not significant at concentrations below 0.0 I M,some exceptions oceur among certain large organicions or molecules. For example, the molar ahsorptivityat 436 nm for the cation of methylene blue in aqueoussolutions is reported to increase by 88% as the dye con-centration is increased from 1O·5to 10-2 M; even below10-6 M, strict adherence to Beer's law is not observed.
Deviations from Beer's law also arise because ab-sorptivity depends on the refractive index of the me-dium.' Thus, if concentration changes cause significantalterations in the refractive index n of a solution, de-partures from Beer's law are observed. A eorrectionfor this effect can be made by substituting the quantityenl(n 2 + 2)2 for e in Equation 13-8. In general, this cor-rection is never very large and is rarely significant atconc!ntrations less than 0.01 M.
Apparent Chemical Deviations
Apparent deviations from Beer's law arise when ananalyte dissociates, associates, or reacts with a solventto produce a product with a different ahsorption spec-trum than the analyte. A common example of this be-havior is found with aqueous solutions of acid-baseindicators. For example, the color change associatedwith a typical indicator Hln arises from shifts in theequilibrium
Example 13-1 demonstrates how the shift in thisequilibrium with dilution results in deviation fromBeer's law.
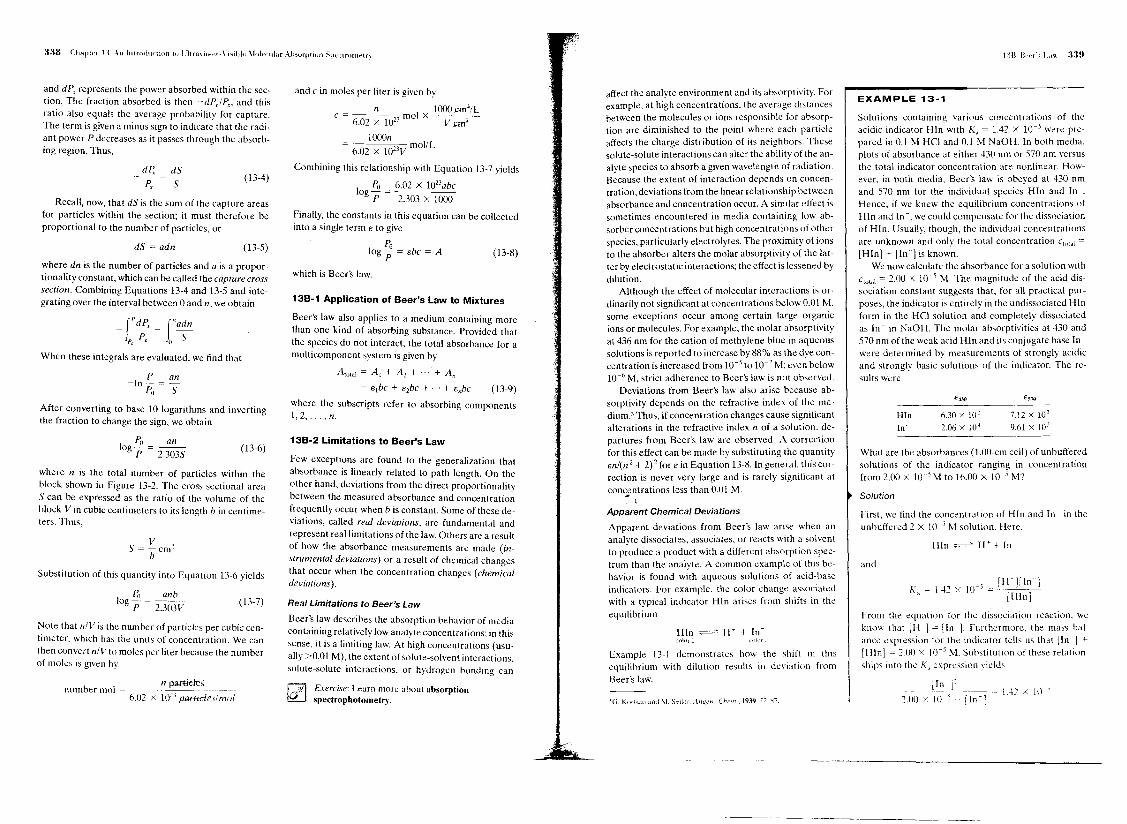
Solutions containing various concentrations of theacidic indicator Hln with K, = 1.42 X 10⁻⁵ were pre-pared in 0.1 M HCI and 0.1 M NaOH. In both media,plots of absorbance at either 430 nm or 570 nm versusthe total indicator concentration are nonlinear. How-ever, in both media, Beer's law is obeyed at 430 nmand 570 nm for the individual species HIn and In-.Hence, if we knew the equilibrium concentrations ofH In and In -, we eould compensate for the dissociationof Hln. Usually, though, the individual concentrationsare unknown and only the total concentration cta,,! =
[Hln] + IIn-] is known.We now calculate the absorbance for a solution with
CIO<a[ = 2.00 x 10-\ M. The magnitude of the acid dis-sociation constant suggests that, for all practical pur-poses, the indicator is entirely in the undissociated Hlnform in the HCI solution and completely dissociatedas In - in NaOH. The molar absorptivities at 430 and570 nm of the weak acid H1n and its conjugate base Inwere determined by measurements of strongly acidicand strongly basic solutions of the indicator. The re-sults were
6.30 X 10'2.06 x 10'
7.12 X 10³
9.61 X 10'
What are the absorbances (I.OO-cm cell) of unbufferedsolutions of the indicator ranging in concentrationfrom 2.00 x 10⁵ M to 16.00 X 10⁻⁵ M?
First, we find the concentration of Hln and In - in theunbuffered 2 x 10 5 M solution. Here,
. [Wrlln]K = 1.42 x 10-' ='--, -'---
" [Hln]
From the equation for the dissociation reaction. weknow that [H'] = [In ]. Furthermore, the mass bal-ance expression for the indicator tells us that [In ] +[Hln I = 2.00 x 10⁻⁵ M. Suhstitution of these relation-ships into the K, expression vields
[In-]'--------_._-~---2.00 x 10' [In -:
Rearrangement yields the quadratic expression
[In )2 + (1.42 x 1O-5[1n']) - (2.84 x 10⁻¹⁰) = 0
The positive solution to this equation is
[In -] = 1.12 x 10⁻⁵ M
[HIn] = (2.00 X 10⁻⁵) - (1.12 X 10⁻⁵)
= 0.88 X 10⁻⁵ M
We are now able to caleulate the absorbance at the twowavelengths. For 430 nm, we can substitute into Equa-tion 13-9 and obtain
A = e[,-b[In-] + eHlnb[HIn]A430 = (2.06 X 104 X 1.00 X 1.12 X 10-5)
+ (6.30 X 10' X 1.00 X 0.88 X 10-5)
= 0.236
Similarly at 570 nm,
A570 = (9.61 X 10' X 1.00 X 1.12 X 10-5)
+ (7.12 X 103 X 1.00 X 0.88 X 10-5)
= 0.073
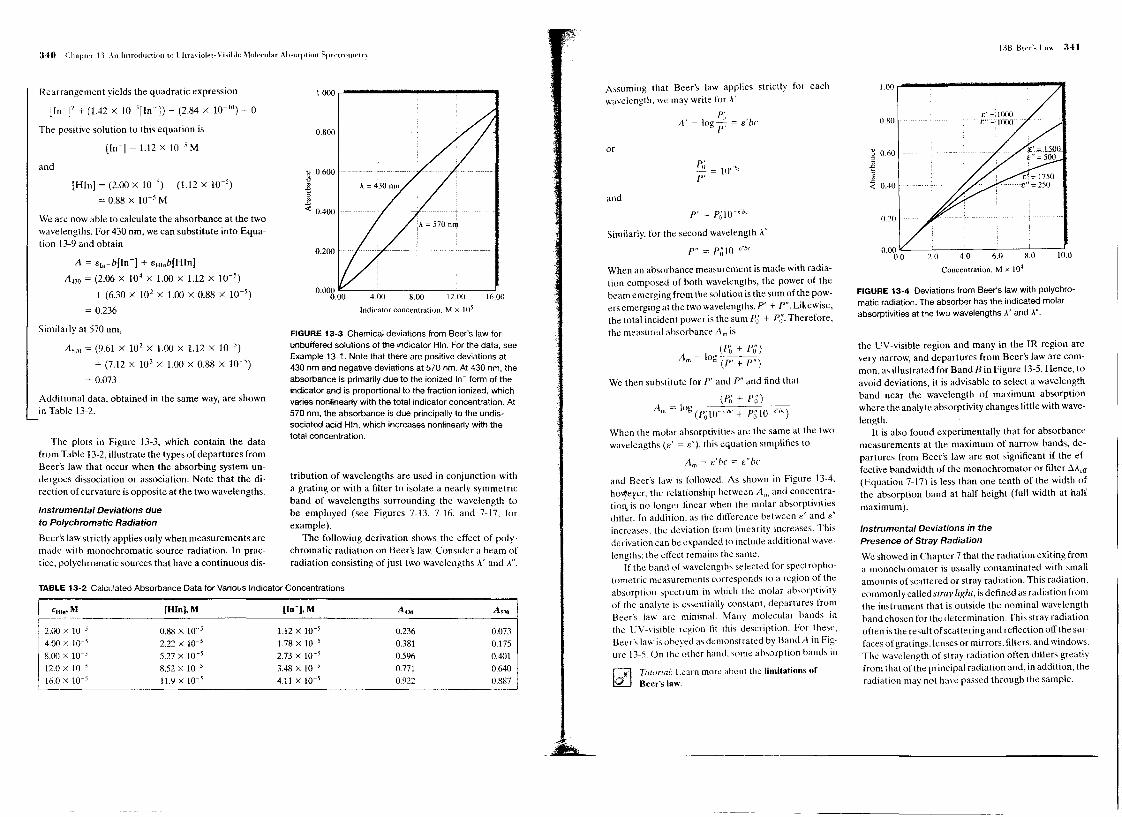
Additional data, obtained in the same way, are shownin Table 13-2.
The plots in Figure 13-3, which contain the datafrom Table 13-2, illustrate the types of departures fromBeer's law that occur when the absorbing system un-dergoes dissociation or association. Note that the di-rection of curvature is opposite at the two wavelengths.
Instrumental Deviations dueto Polychromatic Radiation
Beer's law strictly applies only when measurements aremade with monochromatic source radiation. In prac-tice, polychromatic sources that have a continuous dis-
Assuming that Beer's law applies strictly for eachwavelength, we may write for A'
PI; ,A' = log p; = e be
~ 0.600
of~:;: 0400 P' = Polo-'h.
Similarly, for the second wavelength A"
P" = PolO-"b"
When an absorbance measurement is made with radia-tion composed of both wavelengths, the power of thebeam emerging from the solution is the sum of the pow-ers emerging at the two wavelengths, P' + P". Likewise,the total incident power is the sum Po + Po· Therefore,the measured absorbance Am is
(Po + Po')Am = loge JY+P';j
We then substitute for P' and P" and find that
(P,; + P;;)Am = log (PolO ,b, + PolO-'-h')
When the molar absorptivities are the same at the twowavelengths (e' ~ e"), this equation simplitles to
Am = e'be = e"be
and Beer's law is followed. As shown in Figure 13-4,ho~ever, the relationship between Am and concentra-tion i~no longer linear when the molar absorptivitiesditf~r. In addition, as the difference between e' and [;"increases, the deviation from linearity increases. Thisderivation can be expanded to include additional wave-lengths: the effect remains the same.
if the band of wavelengths selected for spectropho-tometric measurements corresponds to a region of theabsorption spectrum in which the molar absorptivityof the analvte is essentially constant, departures fromBeer's law' are minimal. Many molecular bands inthe UV-visible region tit this description. For these,Beer's law is obeved as demonstrated by Band A in Fig-ure 13-5. On thc'other hand. some absorption hands in
r:=il Tutorial: Learn more ahout the limitations ofIQ.j Beer's law.
FIGURE 13-3 Chemical deviations from Beer's law forunbuffered solutions of the indicator Hln. For the data, seeExample 13-1. Note that there are positive deviations at430 nm and negative deviations at 570 nm. At 430 nm, theabsorbance is primarily due to the ionized In- form of theindicator and is proportional to the fraction ionized, whichvaries nonlinearly with the total indicator concentration. At570 nm, the absorbance is due principally to the undis-sociated acid Hln, which increases nonlinearly with thetotal concentration.
tribution of wavelengths are used in conjunction witha grating or with a filter to isolate a nearly symmetricband of wavelengths surrounding the wavelength tobe employed (see Figures 7-13, 7-16, and 7-17, forexample).
The following derivation shows the effect of poly-chromatic radiation on Beer's law. Consider a beam ofradiation consisting of just two wavelengths A' and A"
2.00 X 10⁻⁵
4.00 X 10⁻⁵
8.00 X 10⁻⁵
12.0 X 10⁻⁵
16.0 X 10⁻⁵
0.88 X 10'52.22 X 10⁻⁵
5.27 X 10⁻⁵
8.52 X 10⁻⁵
11.9 X 10⁻⁵
1.12 X 10⁻⁵
1.78 X 10-'2.73 X 10-'3.48 x 10⁻⁵
4.11 X 10⁻⁵
0.2360.3810.5%0.7710.922
0.0730.1750.4010.6400.887
~ 0.60
~E< 0.40
2.0Concentration. M x 104
FIGURE 13-4 Deviations from Beer's law with polychro-";atic radiation. The absorber has the indicated molarabsorptivities at the two wavelengths A' and A".
the UV-visible region and many in the IR region arevery narrow, and departures from Beer's law are com-mon, as illustrated for Band B in Figure 13-5. Hence, toavoid deviations, it is advisable to select a wavelengthband near the wavelength of maximum absorptionwhere the analyte absorptivity changes little with wave-length.
It is also found experimentally that for absorbancemeasurements at the maximum of narrow bands, de-partures from Beer's law are not significant if the ef-fective bandwidth of the monochromator or filter t.A,rr(Equation 7-17) is less than one tenth of the width ofthe absorption band at half height (full width at halfmaximum).
Instrumental Deviations in thePresence of Stray Radiation
We showed in Chapter 7 that the radiation exiting froma monochromator is usually contaminated with smallamounts of scattered or stray radiation. This radiation,commonlv called stray light, is defined as radiation fromthe instr~ment that is outside the nominal wavelengthband chosen for the determination. This stray radiationoften is the result of scattering and reflection off the sur-faces of gratings, lenses or mirrors. filters, and windows.The wavelength of stray radiation often differs greatlyfrom that of the principal radiation and, in addition, theradiation may not have passed through the sample.

FIGURE 13-5 The effect of polychromatic radiation onBeer's law. In the spectrum at the top, the absorptivityof the analyte is nearly constant over Band A from thesource. Note in the Beer's law plot at the bottom thatusing Band A gives a linear relationship. In the spectrum,Band B corresponds to a region where the absorptivityshows substantial changes. In the lower plot, note thedramatic deviation from Beer's law that results.
When measurements are made in the presence ofstray radiation, the observed absorbance A' is given by
Po+P,A' = log---P+P,
where P; is the power of nonabsorbed strav radiation.Figure 13-6 shows a plot of A' versus conce~tration forvarious ratios of P, to Po. Note that at high concentra-tions and at longer path lengths stray radiation canalso cause significant deviations from the linear rela-tionship between absorbance and path length'
Note also that the instrumental deviations illus-trated in Figures 13-5 and 13-6 result in absorhancesthat are smaller than theoretical. It can be shown that
instrumental deviations always lead to negative ab-sorbance errors.j
Mismatched Cells
Another almost trivial, but important, deviation fromadherence to Beer's law is caused by mismatched cells.If the cells holding the analyte and blank solutions arenot of equal path length and equivalent in optical char-acteristics, an intercept k will occur in the calibrationcurve and A = "be + k will be the actual equation in-stead of Equation 13-1. This error can be avoided byusing either carefully matched cells or a linear regres-sIOn procedure to calculate both the slope and inter-cept of the calibration curve. In most cases linear re-gression is the best strategy because an intercept canalso occur if the hlank solution does not totally com-pensate for interferences. Another way to avoid the
5E.1. f\.1eehan, in [realise on Analytical Chemistry, 2nd ed., P. 1. Elving,E.J. ~teehan. and L M. Kalthoff, eds., Part I, Vol. 7, p. 73, New York::Vlley, 1981. For a spreadsheet approach to stray-light calculations, seeS. R. Cro~ch and F. 1. Holler, Applications of Microsoft@ Excel in Ana/yr-u;al Chenuscr}', pp.127-29, Bdmont, CA: Brooks/Cole, 2004.
P,Po X 100%
0.0%0.2%
1.5 5.0 7.5
Conc~nrration. M x 103
FIGURE 13-6 Apparent deviation from Beer's law broughtabout by various amounts of stray radiation. Note that theabsorbance begins to level off with concentration at highstray-light levels. Stray light always limitsthe maximumabsorbance that can be obtained because when theabsorbance is high, the radiant power transmitted throughthe sample can become comparable to or lower than thestray-light level.
mismatched cell problem with single-beam instru-ments is to use only one cell and keep it in the same po-sition for both blank and analyte measurements. Afterohtaining the blank reading, the cell is emptied by as-piration, washed, and filled with analyte solution.
13C THE EFFECTS OF INSTRUMENTALNOISE ON SPECTROPHOTOMETRICANALYSES
The accuracy and precision of spectrophotometricanalyses are often limited by the uncertainties or noiseassociated with the instrument6 A general discussionof instrumental noise and signal-to-noise optimizationis found in Chapter 5.
13C-1 Instrumental Noise asa Function of Transmittance
As was pointed out earlier, a spectrophotometric mea-surement entails three steps: a 0% T measurement oradjustment, a 100% T measurement, and a measure-ment of % Twith the sample in the radiation path. Thenoise associated with each of these steps combines togive a net uncertainty for the final value obtained forT. The relationship between the noise encounteredin the measurement of T and the resulting concentra-tion uncertainty can be derived by writing Beer's law inthe form
1 0.434c = -cl;logT = -~lnT
To rcl~te the standard deviation in concentration a, tothe standard deviation in transmittance ar we proceedas in Section alB-3, Appendix 1 hy taking the partialderivative of this equation with respect to T. holding band e constant. That is,
de 0.434
aT "bT
Application of Equation al-29 (Appendix I) gives
a;= (;~ )a} = ( -~~~4 rd (13-11)
~See L D. Rothman, S. R. Crouch, and 1. D. Ingle Jr. Allal. Chem. 1975.47, 1126: 1. D. Ingle Jr. and S. R. Crouch. Anl1l. Chem .. 1972, 44. l375: H. LPardue. T. E. Hewitt, and M. 1. Milano, Gin. Cht'/ll., 1974. ]0,1028; J. 0Erickson and T. Surl~s. Amer. tab .. 1976.8 f61, -1.1:Optimum I'ararnetersfor Spectmphorometry. Palo Alln. CA: \'arian Instruments Division. 1977
Note that we use the population variance a2 instead ofthe sample variance s' when applying Equation al-29.Dividing Equation 13-11 by the square of Equation13-10 gives
( ~ )' = ( T 7:T )'
a, ~ = 0.434arc TInT TlogT
When there is a limited number of measurements andthus a small statistical sample, we replace the popula-tion standard deviations ac and aT with the samplestandard deviations s, and ST (Section alB-l. Appen-dix 1) and obtain
This equation relates the relative standard deviation ofc (sJc) to the absolute standard deviation of the trans-mittance measurement (ST)' Experimentally, ST can beevaluated by making, say, twenty replicate transmit-tance measurements (N = 20) of the transmittance ofa solution in exactly the same way and substituting thedata into Equation al-lO, Appendix 1.
Equation 13-13 shows that the uncertainty in a pho-tometric concentration measurement varies nonlin-early with the magnitude of the transmittance. The sit-uation is somewhat more complicated than is suggestedby Equation 13-13, however, because the uncertaintyST is also dependent on T.
In a detailed theoretical and experimental study, Roth-man, Crouch, and Inglc have described several sourcesof instrumental uncertainties and shown their net effecton the precision of absorbance or transmittance mea-surements.' These uncertainties fall into one of threecategories depending on how they are affected by themagnitude of the photocurrent and thus T. For Case Iuncertainties, the precision is independent of T; that is,sris equal to a constant k1· For Case If uncert~nties, theprecision is directly proportional to Vf2+ T. Finally,Case III uncertainties are directly proportional to T.Table 13-3 summarizes information about the sourcesof these three types of uncertainty and the kinds ofinstruments where each is likely to be encountered.
-L D. Rothman, S. R. Crouch, and J. D. Ingle Jr.. Anal. Chl'nJ., 1975.
47, 1226

Inexpensive photometers andspectrophotometers having smallmeters or digital displaysIR and near-IR spectrophotometersand photometersRegions where source intensity anddetector sensitivity are lowHigh-quality UV-visiblespectrophotometersHigh-quality UV-visible andIR spectrophotometersInexpensive photometers andspectrophotometers
Case I: ST = k,
Case I uncertainties often appear in less expensive ul-traviolet and visible spectrophotometers or photome-ters equipped with meters or digital readouts with lim-ited resolution. For example, some digital instrumentshave 3'h-digit displays. These can display the result to0.1 % T. Here, the readout resolution can limit themeasurement precision such that the absolute uncer-tainty in T is the same from 0% T to 100% T. A similarlimitation occurs with older analog instruments withlimited meter resolution.
Infrared and near-infrared spectrophotometersalso exhibit Case I behavior. With these, the limitingrandom error usually arises from Johnson noise in thethermal detector. Recall (Section 5B-2) that this typeof noise is independent of the magnitude of the pho-tocurrent; indeed, fluctuations arc observed even inthe absence of radiation when there is essentially zeronet current.
Dark current and amplifier noise are usually smallcompared with other sources of noise in photomet-ric and spectrophotometric instruments and becomeimportant only under conditions of low photocurrentswhere the lamp intensity or the transducer sensitivityis low. For example, such conditions are often encoun-tered near the wavelength extremes for an instrument.
The precision of concentration data obtained withan instrument that is limited by Case I noise can be ob-tained directly by substituting an experimentally de-termined value for ST = k1 into Equation 13-13. Here,the precision of a particular concentration determina-rYl Simulation: Learn more about the effects of!QJ instrumental noise.
tion depends on the magnitude of T even though theinstrumental precision is independent of T. The thirdcolumn of Table 13-4 shows data obtained with Equa-tion 13-13 when an absolute standard deviation SI
of :'::0.003, or :'::0.3% T, was assumed. Curve A in Fig-ure 13-7 shows a plot of the data. Note that a minimumis reached at an absorbance of about 0.5. Note alsothat the relative concentration error rapidly rises atabsorbances lower than about 0.1 and greater thanabout 1.0.
An uncertainty of 0.3% Tis typical of many moder-ately priced spectrophotometers or photometers. Withthese instruments, concentration errors of 1% to 2 %relative arc to be expected if the absorbance of thesample lies between about 0.1 and I.
Case 1/: ST = k2 V T2 + T
This type of uncertainty often limits the precision ofthe highest quality instruments. It has its origin inshot noise (Scction 5B-2), which occurs whenever thecurrent involves transfer of charge across a junction,such as the movement of electrons from the cathodeto the anode of a photomultiplier tube. Herc, an elec-tric current results from a series of discrete events(emission of electrons from a cathode). The averagenumber of these events per unit time is proportionalto the photon flux. The frequency of events and thusthe current is randomly distributed about the averagevalue. The magnitude of the current fluctuations isproportional to the square root of current (see Equa-tion 5-5). The effect of shot noise on Se is derived bysubstituting SI into Equation 13-13. Rearrangementleads to
TABLE 13-4 Relative Precision of Concentration Measurements as a Functionof Transmittance and Absorbance for Three Categories of Instrument Noise
Relative Standard Deviation in Concentration a
Transmittance, T Absorbance, A Case I Noise b Case II Noise < Case III Noise d
0.95 0.022 ,,=6.2 :':8A :!:25.J
0.90 0.046 :'::3.2 :':4.1 :':12.3
0.80 0.097 ,,=1.7 :':2.0 :':5.8
0.60 0.222 :':0.98 :'::0.96 :::2.5
OAO 0.398 :':0.82 ,,=0.61 :':IA
0.20 0.699 :':0.93 :,::OA6 :':0.81
0.10 1.00 :':1.3 :,:OA3 :':0.56
0.032 1.50 :':2.7 :'::0.50 :':0.38
0.010 2.00 :'::6.5 :'::0.65 :':0.2
0.0032 2.50 "=16.3 :'::0.92 :':0.23
0.0010 3.00 +43A :':IA :,:0.19
"-(sJc) x 100%.
bFrom Equation 13-13 withsr =k1 = :!:O.OO30.
<From Equation 13-14 with k"!. == :!:O.0030.
dFrom Equation 13-15 with k) == :!:O.013.
.1'<:= 0.434k, ~clog T \j 7.; + 1
The data in column 4 of Table 13-4 were caleulatedusing Equation 13-14. Curve B in Figure 13-7 is a plot
;; 6.0o ~o
:j:
f HI
3.0§=0~ 2.0="'JJ 1.0">~~
0.0
FIGURE 13-7 Relative concentration uncertainties arisingfrom various categories of instrumental noise. A, case I;B, Case II; C, Case III.The data are taken from Table 13-4.
of such data. Note the much broader minimum in theconcentration uncertainty. Note also that a large rangeof absorbances can be measured without the con-centration error becoming greater than 1% to 2%.This increased range represents a major advantage ofphoton-type detectors over thermal types, which arerepresented by curve A in the figure. As with Johnson-noise-limited instruments, shot-limited instruments donot give very reliable concentration data at transmit-tances greater than 95% (or A < 0.02).
Case 11/:ST = k3 T
By substituting ST = k;T into Equation 13- U. we sccthat the relative standard deviation in concentrationfrom this type of uncertainty is inversely proportionalto the logarithm of the transmittance.
0.434k,
log T
Column 5 of Table 13-4 contains data ohtainedfrom Equation 13-15 when k, is assumed to ha\'c avalue of 0.013, which approximates thc valuc obscrwdin the Rothman. Crouch. and Ingle study. The dataare plotted as curve C in Figure 13-7. Note that this

type of uncertainty is important at low absorbances(high transmittances) but approaches zero at highabsorbances.'
One source of noise of this type is the slow drift inthe radiant output of the source. This type of noisecan be called source flicker noise (Section 5B-2). Theeffects of fluctuations in the intensity of a source canbe minimized by the use of a constant -voltage powersupply or a feedback system in which the source inten-sity is maintained at a constant level. Modern double-beam spectrophotometers (Sections 13D-2 and 13D-3)can also help cancel the effect of flicker noise. Withmany instruments, source flicker noise does ·not limitperformance.
An important and widely encountered noise source,one that is proportional to transmittance, results fromfailure to position sample and reference cells repro-ducibly with respect to the beam during replicate trans-mittance measurements. All cells have minor imperfec-tions. As a consequence, reflection and scattering lossesvary as different sections of the'cell window are exposedto the beam; small variations in transmittance result.Rothman, Crouch, and Ingle have shown that this un-certainty often is the most common limitation to theaccuracy of high-quality ultraviolet-visible spectropho-tometers. It is also a serious source of uncertainty ininfrared instruments.
One method of reducing the effect of cell position-ing with a double-beam instrument is to leave the cellsin place during calibration and analysis. New standardsand samples are then introduced after washing andrinsing the cell in place with a syringe. Care must betaken to avoid touching or jarring the cells during thisprocess.
13C-3 Effect of Slit Width onAbsorbance Measurements
As shown in Section 7C-3, narrow slit widths are re-quired to resolve complex spectra.' For example, Fig-ure 13-8 illustrates the loss of detail that oecurs when
~For a spreadsheet approach to plottIng th~ rdative concc:ntration errorsfor the cases considered here. see S. R. Crouch and F. 1. Holler, Applica-tions of Microso!rfi Excel in Anall'rical Chemistn. pr. 229-32. Belmont.CA: Brooks/Colc. 2004.~For a discussion of the effects of slit width on spectra. see OptimumParameters for SpeclropJlOwmerry, Palo .-'\lto, CA: \"arian InstrumentsDivision. 1977; F. C Strong Ill. Allal. Chen! . J976, 48. 21.55:D. D. Gilbert,I. Chem. Educ., 1991, 68. AnH.
slit widths are increased from small values on the leftto larger values in the middle and right. In this ex-ample, the absorption spectrum of benzene vapor wasobtained at slit settings that provided effective band-widths of 1.6, 4, and 10 nm. For qualitative studies, theloss of resolution that accompanies the use of widerslits is often important because the details of spectraare useful for identifying species.
Figure 13-9 illustrates a second effect of slit widthon spectra made up of narrow peaks. Here, the spec-trum of a praseodymium chloride solution was ob-tained at slit widths of 1.0, 0.5, and 0.1 mm. Note thatthe peak absorbance values increase significantly (byas much as 70% in one instance) as the slit width de-creases. At slit settings less than about 0.14 mm, ab-sorbances were found to become independent of slitwidth. Careful inspection of Figure 13-8 reveals thesame type of effect. In both sets of spectra, the areasunder the individual peaks are the same, but wide slitwidths result in broader peaks with lower maximumabsorbances.
From both of these illustrations, we can concludethat quantitative measurement of narrow absorptionbands requires using narrow slit widths or, alternatively,very reproducible slit-width settings. Unfortunately, adecrease in slit width by a factor of 10 reduces the radi-ant power by a factor of 100 because the radiant poweris proportional to the square of the slit widthlO There isthus a trade-off between resolution and signal-to-noiseratio. Often, a compromise slit width must be chosen.The situation becomes particularly serious in spectralregions where the output of the source or the sensitivityof the detector is low. Under such circumstances, ade-quate signal-to-noise ratio may require slit widths largeenough to result in partial or total loss of spectral finestructure.
In general, it is good practice to narrow slits nomore than is necessary for resolution of the spectrumat hand. With a variable-slit spectrophotometer, properslit adjustment can be determined by acquiring spec-tra at progressively narrower slits until maximum ab-sorbances become constant. Generally, constant peakheights are observed when the effective bandwidth ofthe instrument is less than one tenth the full width athalf maximum of the absorption band.
FIGURE 13-8 Effect of bandwidth on spectral detail for a sample of benzene vapor. Note thatas the spectral bandwidth increases, the fine structure in the spectrum is lost. At a bandwidthof 10 nm, only a broad absorption band is observed.
~v.2 0.4 -
5~ '03
Peak hI. = 27.2Peak hI.
= 27.1
FIGURE 13-9 Effect of slit width (spectral bandwidth) on peak heights. Here, the samplewas a solution of praseodymium chloride. Note that as the spectral bandwidth decreases bydecreasing the slit width from 1.0 mm to 0.1 mm, the peak heights increase. (From OptImumSpectrophotometer Parameters, Application Report, 14-2, Varian Inc., Palo Alto, CA.)

13C-4 Effect of Scattered Radiation atWavelength Extremes of an Instrument
We have already noted that scattered radiation maycause instrumental deviations from Beer's law' Whenmeasurements are made at the wavelength extremesof an instrument, the effects of stray radiation may beeven more serious and on occasion may lead to theappearance of false absorption bands, For example,consider an older visible spectrophotomcter equippedwith glass optics, a tungsten source, and a photovoltaiccell detector, At wavelengths below about 380 nm, thewindows, cells, and prism begin to absorb radiation,thus reducing the energy reaching the transducer, Theoutput of the source falls off rapidly in this region asdoes the sensitivity of the transducer, Thus, the totalsignal for the 100% T adjustment may be as low as 1%to 2% of that in the region between 500 and 650 nm,
The scattered radiation, however, is often made upof wavelengths to which the instrument is highly sensi-tive, Thus, the effects of stray radiation can be greatlyenhanced, Indeed, in some instances the output signalproduced by the stray radiation may exceed that pro-duced by the monochromator output beam, Tn suchcases, the component of the measured transmittancedue to the stray radiation may be as large as or exceedthe true transmittance,
An example of a false band appearing at the wave-length extremes of a visible-region spectrophotometeris shown in Figure 13-10, The spectrum of a solution ofcerium(TV) obtained with an ultraviolet-visible spec-trophotometer, sensitive in the region 01'200 to 750 nm,is shown by curve B, Curve A is a spectrum of the samesolution obtained with a simple visible spectropho-tometer, The apparent maximum shown in curve Aarises from the instrument responding to stray wave-lengths longer than 400 nm, As can be seen in curve S,these longer wavelengths are not absorbed by thecerium(IV) ions, This same effect is sometimes ob-served with ultraviolet-visible instruments when at-tempts are made to measure absorbances at wave-lengths lower than about ZOO nm,
Instruments for making molecular absorption mea-surements in the ultraviolet, visible, and ncar-infraredregions are produced by dozens of companies, Therearc hundreds of instrument makes and models fromwhich to choose, Some arc simple and inexpensive
~~c~~ 0.50,D
«
380 420 460Wavelength. nm
FIGURE13·10 Spectrum of cerium(lV)obtained with aspectrophotometer having glass optics (A) and quartzoptics (8), The false peak in A arises from transmissionof stray radiation of longer wavelengths,
(a few hundred dollars); others are complex, computer-controlled, scanning instruments costing $30,000 ormore, The simpler instruments are often useful onlv inthe visible region for quantitative measurements ~t asingle wavelength, The more complex instruments canprovide spectral scanning at selectable resolution, mea-surements in the ultraviolet as well as the visible re-gions, compensation for source intensity fluctuations,and several other features, II
130-1 Instrument Components
Instruments for measuring the absorption of ultra-violet, visible, and near-infrared radiation are made upof one Or more (I) sources, (2) wavelength selectors,(3) sample containers, (4) radiation transducers, and(5) signal processors and readout devices, The designand performance of components (2), (4), and (5) weredescribed in considerahlc detail in Chapter 7 and thusare not discussed further herc, We will, however, con-sider hriefly the characteristics of Sources and samplecontainers for the region of 190 to 3000 nm.
11For an IOter<.:'sting dis...:ussion of commerCial instruments fur UV-yisibk
ahsllf(1ti<Jn measur<:,ment:::.. sc<:' R. Jarnutowski 1 R. Fcrrafl). ;lnd D, (.
Lankin. )pccrros{"oP\'. 1992. 7 (7), 2::'
Sources
For the purposes of molecular absorption measure-ments, a continuum source is required whose radiantpower does not change sharply over a considerablerange of wavelengths.
Deuterium and Hydrogen Lamps. A continuum spec-trum in the ultraviolet region is produced by electricalexcitation of deuterium or hydrogen at low pressure.The mechanism by which a continuum spectrum isproduced involves initial formation of an excited mo-lecular species followed by dissociation of the excitedmolecule to give two atomic species plus an ultravioletphoton, The reactions for deuterium are
D2 + E, ---> Dj ---> D' + D" + hv
where E, is the electrical energy absorbed by the mol-ecule and Dj is the excited deuterium' molecule. Theenergetics for the overall process can be representedby the equation
E, = ED~ = ED' + ED' + hv
Here, ED~ is the fixed quantized energy of Dj whercasED' and ED' arc the kinetic energies of the two deu-terium atoms, The sum of ED' and ED' can vary contin-uously from zero to ED;; thus, the energy and thc fre-quency of the photon can also vary continuously, Thatis, when the two kinetic energies are by chance small, hvwill be large, and conversely. The consequence is a truecontinuum spectrum from about 160 nm to the begin-ning of the visible region, as shown in Figure 13-11b,
Most modern lamps of this type contain deuteriumand.itre of a low-voltagc type in which an arc is formedbetwebn a heated, oxide-coated filament and a metaleleclrode (see Figure 13-11a), The heated filamentprovides electrons to maintain a direct current whenabout 40 V is applied between the filament and theelcctrodc. A regulated power supply is rcquired forconstant intensities.
An important feature of deuterium and hydrogendischarge lamps is the shape of the aperture hetweenthe two electrodes, which constricts the discharge to anarrow path, As a consequence, an intcnse ball of ra-diation about I to 1.5 mm in diameter is produced.Deuterium gives a somewhat larger and brighter ballthan hydrogen, which accounts for the widcspread uscof deuterium.
Both dcuterium and hydrogen lamps produce out-puts in the range of 160 -SOD nm. In the ultraviolet re-gion (190 - 400 nm), a continuum spectrum exists as
S 10-2
~
300Wavelength, nm
FIGURE13-11 (a) A deuterium lamp of the type usedin spectrophotometers and (b) its spectrum. The plot isof irradiance E, (proportional to radiant power) versuswavelength. Note that the maximum intensity occurs at--225 nm. Typically,instruments switch from deuteriumto tungsten at -·350 nm.
can be seen in Figure 13-11b. At longer wavelengths(>400 nm), the spectra from these lamps are no longercontinua, but consist of emission lines and bands super-imposed on a weak continuum. For many applications,the line or hand emission represents a nuisance. How-ever, somc modern array-dctector instruments use adeuterium source at wavelengths as long as SOO nm.With these, the array can be exposed for longer times tocompensate for the low source intensity in the visihleregion. Because the entire source spectrum is readilyobtained with a solvent hlank and then with the sample,the presence of emission lincs does not interfere with

calculation of the absorption spectrum. The line emis-sion has also been used for wavelength calibration ofabsorption instruments.
Quartz windows must be employed in deuteriumand hydrogen lamps because glass absorbs strongly atwavelengths less than about 350 nm. Although the deu-terium lamp continuum spectrum extends to wave-lengths as short as 160 nm, the useful lower limit is about190 nm because of absorption by the quartz windows.
Tungsten Filament Lamps. The most common sourceof visible and near-infrared radiation is the tungstenfilament lamp. The energy distribution of this sourceapproximates that of a blackbody (see Figure 6-22)and is thus temperature dependent. In most absorp-tion instruments, the operating filament temperature is2870 K; the bulk of the energy is thus emitted in the in-frared region. A tungsten filament lamp is useful for thewavelength region between 350 and 2500 nm. Figure13-12 shows a typical tungsten lamp and its spectrum.
500 1000 1500 2000Wavelength, nm
FIGURE 13-12 (a)A tungsten lamp 01 the type used inspectroscopy and its spectrum (b).Intensity 01 the tung-sten source IS usually quite low at wavelengths shorterthan about 350 nm. Note that the intensity reaches a maxi-mum in the near-IR region 01 the spectrum (-1200 nm inthis case).
Absorption of radiation by the glass envelope thathouses the filament imposes the lower wavelength limit.
In the visible region, the energy output of a tungstenlamp varies approximately as the fourth power ofthe operating voltage. As a consequence, close voltagecontrol is required for a stable radiation source. Elec-tronic voltage regulators or feedback -controlled powersupplies are usually employed to obtain the requiredstability.
Tungsten-halogen lamps, also called quartz-halo-gen lamps, contain a small quantity of iodine within aquartz envelope that houses the tungsten filament.Quartz allows the filament to be operated at a temper-ature of about 3500 K, which leads to higher intensitiesand extends the range of the lamp well into the UV re-gion. The lifetime of a tungsten-halogen lamp is morethan double that of the ordinary lamp. This added liferesults from the reaction of the iodine with gaseoustungsten that forms by sublimation and ordinarily lim-its the life of the filament; the product is the volatileWI,. When molecules of this compound strike the fila-ment, decomposition occurs, which redeposits tung-sten. Tungsten-halogen lamps are significantly moreefficient and extend the output wavelength range wellinto the ultraviolet. For these reasons, they are foundin many modern spectroscopic instruments.
Light-Emitting Diodes. Light-emitting diodes (LEOs)are used as sources in some absorption spectrometers.An LED is a pn-junction device that, when forwardbiased. produces radiant energy. Diodes made fromgallium aluminum arsenide (Am = 900 nm), galliumarsenic phosphide (Am = 650 nm), gallium phosphide(Am = 550 nm), gallium nitride (Am = 465 nm), and in-dium gallium nitride (Am = 450 nm) are widely avail-able. Mixtures of these compounds are used to shiftthe wavelength maximum to anywhere in the region of375 nm to 1000 nm or more. LEOs produce a spectralcontinuum over a narrow wavelength range. Typically,the full width at half maximum of an LED is20 to 50 nm.As spectroscopic sources, LEOs can be used as "semi-monochromatic" sources or in conjunction with inter-ference filters to further narrow the spectral output.They can be operated in a continuous mode Or in apulsed mode.
"White" LEOs are also available in which the lightfrom a blue LED (InGaN) strikes a phosphor, whichemits a spectral continuum typically in the range of-lOO -800 nm. Such LEOs are being used to make light-ing products such as flashlights. Thev have the advan-
tage of long lifetimes and a smaller environmental im-pact than tungsten filament lamps.
Xenon Arc Lamps. The xenon arc lamp produces in-tense radiation by the passage of current through anatmosphere of xenon. The spectrum is a continuumover the range between about 200 and 1000 nm, withthe peak intensity occurring at about 500 nm (see Fig-ure 6-22). In some instruments, the lamp is operatedintermittently by regular discharges from a capacitor;high intensities are obtained.
Sample Containers
In common with the other optical elements of an ab-sorption instrument, the cells, or cuvettes, that holdthe sample and solvent must be constructed of a mate-rial that passes radiation in the spectral region of in-terest. Thus, as shown in Figure 7-2a, quartz or fusedsilica is required for work in the ultraviolet region (be-low 350 nm). Both of these substances are transparentthroughout the visible and near:infrared regions toabout 3 f1m.Silicate glasses can be employed in the re-gion between 350 and 2000 nm. Plastic containers arealso used in the visible region.
The best cells minimize reflection losses by havingwindows that are perfectly normal to the direction ofthe beam. The most common path length for studiesin the ultraviolet and visible regions is 1 cm. Matched,calibrated cells of this size are available from severalcommercial sources. Other path lengths, from 0.1 cm(and shorter) to 10 cm, can also be purchased. Trans-parent spacers for shortening the path length of 1-cmcell'i.,to 0.1 cm are also available.
Cylindrical cells are sometimes employed in the ul-traviolet and visible regions because they are inexpen-sive. Special care must be taken to reproduce the posi-tion of the ccll with respect to the bcam: otherwise,variations in path length and reflection losses at thecurved surfaces can cause significant errors.
The quality of absorbance data depends criticallyon the way the cells are used and maintained. Finger-prints, grease, or other deposits on the walls markedlyalter the transmission characteristics of a cell. Thus, itis essential to clean cells thoroughly before and afteruse. The surface of the windows must not be touchedduring handling. Matched cells should never be driedby heating in an oven or over a flame - such treatmentmay cause physical damage or a change in path length.The cells should be regularly calibrated against eachother with an absorbing solution.
In this section, we consider four general types of spec-troscopic instruments: (1) single beam, (2) doublebeam in space, (3) double beam in time, and (4) multi-channel.
Single-Beam Instruments
Figure 13-13a is a schematic of a single-beam instru-ment for absorption measurements. It consists of atungsten or deuterium lamp, a filter or a monochro-mator for wavelength selection, matched cells that canbe placed alternately in the radiation beam, one of thetransducers described in Section 7E, an amplifier, anda readout device. Normally, a single-beam instrumentrequires a stabilized voltage supply to avoid errors re-sulting from changes in the beam intensity during thetime required to make the 100% T measurement anddetermine % T for the analyte.
Single-beam instruments vary widely in their com-plexity and performance characteristics. The simplestand least expensive consists of a battery-operated tung-sten bulb as the source, a set of glass filters for wave-length selection, test tubes for sample holders, a photo-voltaic cell as the transducer, and an analog mcter as thereadout device. At the other extreme are sophisticated,computer-controlled instruments with a range of 200to 1000 nm or more. These spectrophotometers haveinterchangeable tungsten and deuterium lamp sources,use rectangular silica cells, and are equipped with ahigh-resolution grating monochromator with variableslits. Photomultiplier tubes are used as transducers, andthe output is often digitized, processed, and stored in acomputer so that it can be printed or plotted in severalforms.
Double-Beam Instruments
Many modern photometers and spectrophotometersare based on a double-beam design. Figure 13-13b illus-trates a double-beam-in-space instrument in which twobeams are formed in space by a V-shape mirror calleda beamsplitter. One beam passes through the referencesolution to a photodeteetor, and the second simulta-neously traverses the sample to a second, matched de-tector. The two outputs are amplified, and their ratio(or the logarithm of their ratio) is determined elec-tronically or by a computer and displayed by the read-out device. With manual instruments, the measurementis a two-step operation involving first the zero adjust-ment with a shutter in place between selector and

Source
~
Readoutrn
FIGURE13-13 Instrumental designs for UV-visiblephotometers or spectrophotometers. In(a), a single-beam instrument is shown. Radiation from the filteror monochromator passesthrough either the reference cell or the sample cell before striking the photodetector. In (b), adouble-beam-in-space instrument is shown. Here, radiation from the filteror monochromatoris split into two beams that simultaneously pass through the reference and sample cells beforestriking two matched photodetectors. In the double-beam-in-time instrument (c), the beam isalternately sent through reference and sample cells before striking a single photodetector. Onlya matter of milliseconds separate the beams as they pass through the two cells.
Exercise: Learn more about single-beam. double-beam. and multichannel instruments.
beamsplitler. In the second step. the shutter isopened and the transmittance or absorbance is dis-played directly.
The second type of double-beam instrument is il-lustrated in Figure 13-13c. Here. the beams arc sepa-rated in time by a rotating sector mirror that directsthe entire beam from the monochromator first throughthe reference cell and then through the sample cell.The pulses of radiation are recombined by anothersector mirror, which transmits one pulse and reflectsthe other to the transducer. As shown by the insert la-beled "front view" in Figure 13-13c, the motor-drivensector mirror is made up of pie-shape segments, half ofwhich are mirrored and half of which are transparent.The mirrored sections arc held in place by blackenedmetal frames that periodically interrupt the beam andprevent its reaching the transducer. The detection cir-cuit is programmed to use these periods to perform thedark-current adjustment. The double-beam-in-timeapproach is generally preferred because of the diffi-culty in matching the two detectors needed for thedouble-beam-in-space design.
Double-beam instruments offer the advantage thatthcy compensate for all but the most short-term fluc-tuations in the radiant output of the source as well asfor drift in the transducer and amplifier. They also com-pensate for wide variations in source intensity withwavelength (see Figures 13-11 and 13-12). Further-more, the double-beam design lends itself well to thecontinuous recording of transmittance or absorbancespectra.
Mu/fichannellnsfrumenfs
A new'type of spectrophotometer appeared on themarket in the early 1980s and is based on one of thearray detectors (photodiode array or linear charge-coupled-device [CCD] array) described in Section 7E.These instruments arc usually of the single-beam de-sign shown in Figure 13-14. With multichannel systemsthe dispersive system is a grating spectrograph placedafter the sample or reference cell. The array detector isplaced in the focal plane of the spectrograph, wherethe dispersed radiation strikes it.
The photodiode array discussed in Section 7E-3.consists of a linear array of several hundred photodi-odes (256, 512, 1024. 2048) that have been formedalong the length of a silicon chip. Typically. the chipsarc 1 to 6 cm long. and the widths of the individualdiodes are 15 to 50 J-Im(see Figure 13-15). Linear CCD
.~
I
Is \ Ml
I I
Sample Gf, Red
Air " JI
..•Y~II.9~'~,,~ !\12
U~--BiU;--
Computer
data system
/i]jJ\0::, \ I _~'I
Source '-.~Lens
FIGURE13-14 Diagram of a multichannel spectrometerbased on a grating spectrograph with an array detector.Radiation from the tungsten or deuterium source is madeparallel and reduced in size by the lens and diaphragm.Radiation transmitted by the sample enters the spectro-graph through slit S. Collimating mirror M, makes thebeam parallel before it strikes the grating G. The gratingdisperses the radiation into its component wavelengths.which are then focused by focusing mirror M, onto thephotodiode or CCD array A. The output from the arraydetector is then processed by the computer data system.
arrays typically consist of 2048 elements, with eachelement being ~14 J-Imwide. The linear CCD is sub-stantially more sensitive than the photodiode arrayand behaves much like a linear array of miniature pho-tomultiplier tubes.
FIGURE 13-15 Diode arrays of various sizes. (Courtesyof Hamamatsu Photonics, Bridgewater, NJ.)

With single-beam designs, the array dark currentis measured and stored in computer memory. Next, thespectrum of the source is obtained and stored inmemory after dark-current subtraction. Finally, the rawspectrum of the sample is obtained and, after dark-current subtraction, the sample values are divided bythe source values at each wavelength to give absorb-ances. Multichannel instruments can also be configuredas double-beam-in-time spectrophotometers.
The spectrograph entrance slit of multichannel in-struments is usually variable from about the width ofone of the array elements to many times wider. Somespectrometers have no entrance slit but instead use afiber optic as the entrance aperture. Multichannelspectrometers using both photodiode arrays and CCDarrays are capable of obtaining an entire spectrum ina few milliseconds. With array detectors the light canbe integrated on a chip or multiple scans can be aver-aged in computer memory to enhance the signal-to-noise ratio.
A 'multichannel instrument is a powerful tool forstudies of transient intermediates in moderately fastreactions, for kinetic studies, and for the qualitativeand quantitative determination of the components ex-iting from a liquid chromatographic column or a eapil-lary electrophoresis column. They are also useful forgeneral-purpose scanning experiments. Some have thesoftware necessary to analyze the time dependence atfour or more wavelengths for kinetic studies.
Complete general-purpose array-detector-basedspectrophotometers are available commercially for$5000 to $10,000 and up. Several instrument compa-nies combine array-detector systems with tiber-opticprobes that transport the light to and from the sample.
In the sections that follow, some typical photometersand spectrophotometers are described. The instru-ments were chosen to illustrate the wide variety of de-sign variables that are encountered.
Photometers
Photometers provide simple, relatively inexpensivetools for performing absorption measurcments. Fil-ter photometers are often more convenient and morerugged and are easier to maintain and use than the moresophisticated spectrophotometers. Furthermore, pho-tometers characteristically have high radiant energythroughputs and thus good signal-to-noise ratios even
with relatively simple and inexpensive transducers andcircuitry. Filter photometers are particularly useful inportable instruments intended for field use or for use inmeasuring the absorbances of flowing streams. Thesephotometers are also employed for quantitative deter-minations in clinical laboratories.
~
.
Lc~'.n.~..__ .~F..•••I.I.t..e.r _ ~n.//,;W ...._._....
.". --,----~!',;, _.._.~>.,~: -----,----------- .. ------,- _.----_.---
Visible Photometers. Figure 13-16 presents schemat-ics for two visible photometers or calorimeters. Theupper figure illustrates a single-beam, direct-readinginstrument consisting of a tungsten filament lamp oran LED as a source, a lens to provide a parallel beamof light, a filter, and a photodiode transducer. The cur-rent produced by the photodiode is processed with elec-tronics or a computer to give a direct readout in ab-sorbance (shown) or, in some cases, transmittance. Formost instruments, the dark current (0% T) is obtainedby blocking the light beam with a shutter. The 100% T(0 A) is adjusted with solvent or a reagent blank in thelight path. With some instruments, the 0 A adjustmentis made by changing the voltage applied to the lamp. Inothers, the aperture size of a diaphragm located in thelight path is altered. The sample is then inserted into thelight path. Most modern colorimeters store the photo-diode signal for the reference (proportional to Po) andcompute the ratio of this signal to the photodiode signalfor the sample (proportional to the radiant power Pl.The absorbance is calculated as the logarithm of theratio of these signals (Equation 13-3).
A modern LED-based photometcr is shown in Fig-ure 13-17. With some instruments, the wavelength is au-tomatically changed by changing the LED or filter.Some instruments are made to operate at only one fixedwavelength. Calibration can be accomplished with twoor more standards. The instrument shown is of thefixed-wavelength design with a bandwidth of 15 nm.Wavelengths of 420. 450, 476, 500. 550, 580, 600, and650 nm are available.
Figure 13-16b is a schematic representation of adouble-beam photometer used to measure the absor-bance of a sample in a fil1Wingstream. Here, the lightbeam is split by a two-branched (bifurcated) fiber optic,which transmits about 50% of the radiation striking itin the upper arm and about 50% in the lower arm. Onebeam passes through the sample, and the other passesthrough the reference cell. Filters are placed after thecells before the photodiode transducers. Note that thisis the double-beam-in-space design. which requiresphotodiodes with nearly identical response. The elec-trical outputs from the two photodiodes are converted
FIGURE 13-16 Single-beam photometer (a) and double-beam photometer for flow analysis(b). In the single-beam system, the reference cell is first placed in the light path and laterreplaced by the sample cell. In the double-beam system (b), a fiber optic splits the beam intotwo branches. One passes through the sample cell and the other through the reference cell.Two matched photodiodes are used in this double-beam-in-space arrangement.
FIGURE 13-17 Photograph of a simple LED-basedcolorimeter. (Hach Company, USA.)
to voltages and the signals are processed by a log ratioamplifier or a computer to give a readout proportionalto absorbance.
Probe-Type Photometers. Figure 13-18 shows a pho-tograph and a schematic of an interesting. commer-cially available, dipping-type photometer, which em-ploys an optical fiber to transmit light from a source toa layer of solution lying between the glass seal at the endof the liber and a mirror. The refiected radiation fromthe latter passes to a photodiode detector via a secondglass fiber. The photometer uses an amplifier with anelectronic chopper synchronized with the light source;as a result, the photometer does not respond to extra-neous radiation. Filter options include "drop-in" filtersand a filter wheel with six interference filters for se-lected applications. Custom filters arc also available.Probe tips are manufactured from stainless steel,Swagelok" Stainless Steel, Pyrex''', and Acid-resistantLexan" Plastic. Light path lengths that vary from 1mmto 10em are available.
Absorbance is measured by tirst dipping the probeinto the solvent and then into the solution to be

Photodiode" amplifier!, derector
~Jnterfer~nce
filterI-HO-900 nm/
Probetip Path
length =2x
this gap
~
(b)
FIGURE 13-18 Photograph (al and schematic diagram(b) of a probe-type photometer. (Courtesy of BrinkmanInstruments, Inc.)
measured. The device is particularly useful for photo-metric titrations (Section I.+E I.
Filter Selection. General-purpose photometers aresupplied with several tilters. each of which transmits adifferent portion of the visible spectrum. Selection of
the proper filter for a given application is importantbecause the sensitivity of the measurement directlydepends on choice. Usually for a new analyticalmethod. the absorption spectrum of the solution to beanalyzed is taken on a scanning spectrophotometer.The filter that most closely matches the wavelength ofmaximum absorption is then chosen. In some cases.measurements are made away from the absorptionmaximum to minimize interferences. Whenever pos-sible. measurements are made near the absorptionmaximum to minimize Beer's law deviations due topolychromatic radiation (Section I3B-2).
When a spectrophotometer is not available to aid infilter selection, a filter Can be chosen by rememberingthat the color of the light absorbed is the complement ofthe color of the solution itself. A solution appears red,for example, because it transmits the red portion of thespectrum but absorbs the green. It is the intensity ofradiation in the green that varies with concentration.Hence, a green tilter should be used. In general, themost suitable filter will be the color complement of thesolution being analyzed.
Instruments for the Visible Region. Several spec-trophotometers designed to operate within the wave-length range of about 380 to 800 nm are available fromcommercial sources. These instruments are frequentlysimple, single-beam grating instruments that are rela-ti\'ely inexpensive (less than $1000 to perhaps $3000).rugged. and readily portable. At least one is batteryoperated and light and small enough to be handheld.The most common application of these instruments isfor quantitati\'e analysis, although several producegood absorption spectra as well.
Figure 13-19 shows a simple and inexpensivespectrophotometer, the Spect ronic 20. The originalversion of this instrument first appeared in the marketin the mid-1950s. and the modified version shown inthe figure is still being manufactured and widelysold. More of these instruments are currently in usethroughout the world than any other single spectro-photometer model. The instrument owes its popular-ity, particularly as a teaching tool, to its relatively lowcost. its ruggedness. and its satisfactory performancecharacteristics.
Ultraviolet Absorption Photometers
Ultraviolet photometers often serve as detectors inhigh-performance liqUid chromatography. In this ap-plication. a mercury vapor lamp usually serves as asource. and the emission line at 254 nm is isolatedby filters. This type of detector is described briefly inSection 28C-6
Ultraviolet photometers are also availahle for con-tinuously monitoring the concentration of one or moreconstituents of gas or liquid streams in industrialplants. The instruments are double beam in space (seeFigure 13-16b) and often employ one of the emissionlines of mercury, which has been isolated by a filter sys-tem. Typical applications include the determination oflow concentrations of phenol in wastewater: monitor-ing the concentration of chlorine. mercury_ Of aromat-ics in gases; and the determination of the ratio of hy-drogen sulfide to sulfur dioxide in the atmosphere.
Spectrophotometers
Numerous spectrophotometers arc available fromcommercial sources. SOffie have b~en designed for thevisthle region onl,,; others arc applicable in the ultravi-olet and visihk regions. A few have measuring capa-hilities from the ultraviolet through the near infrared(190 to .1000 nm).
FIGURE 13-19 (al The Spectronic 20 spectrophotometer and (bl its optical diagram. Radiationfrom the tungsten filament source passes through an entrance slit into the monochromator.A reflection grating diffracts the radiation, and the selected wavelength band passes throughthe exit slit into the sample chamber. A solid-state detector converts the light intensity into arelated electrical signal that is amplified and displayed on a digital readout. (Courtesy ofThermo Electron Corp., Madison, WI.I
for both ultraviolet and visible measurements. Thelower wavelength extremes for these instruments varyfrom 190 to 210 nm, and the upper from 800 to1000 nm. All are equipped with interchangeable tung-sten and hydrogen or deuterium lamps. Most employphotomultiplier tubes or photodiodes as transducersand gratings for dispersion. Digital readouts are nowstandard on almost all these spectrophotometers.The prices for these instruments range from $2000 to$8000.
As might be expectcd, performance specificationsvary considerably among instruments and are related,at least to some degree, to instrument price. Typically,bandwidths vary from 2 to 8 nm; wavelength accuraciesof :<:0.5to :<:2nm are reported.
The optical designs for the various grating in-strumcnts. do not differ greatly from those shownin Figures 13-l3a and 13-19. One manufacturer, how-ever, employs a concave rather than a plane grating;a simpler and more compact design results. Holo-graphic gratings are now becoming standard in manyspectrophotometers.
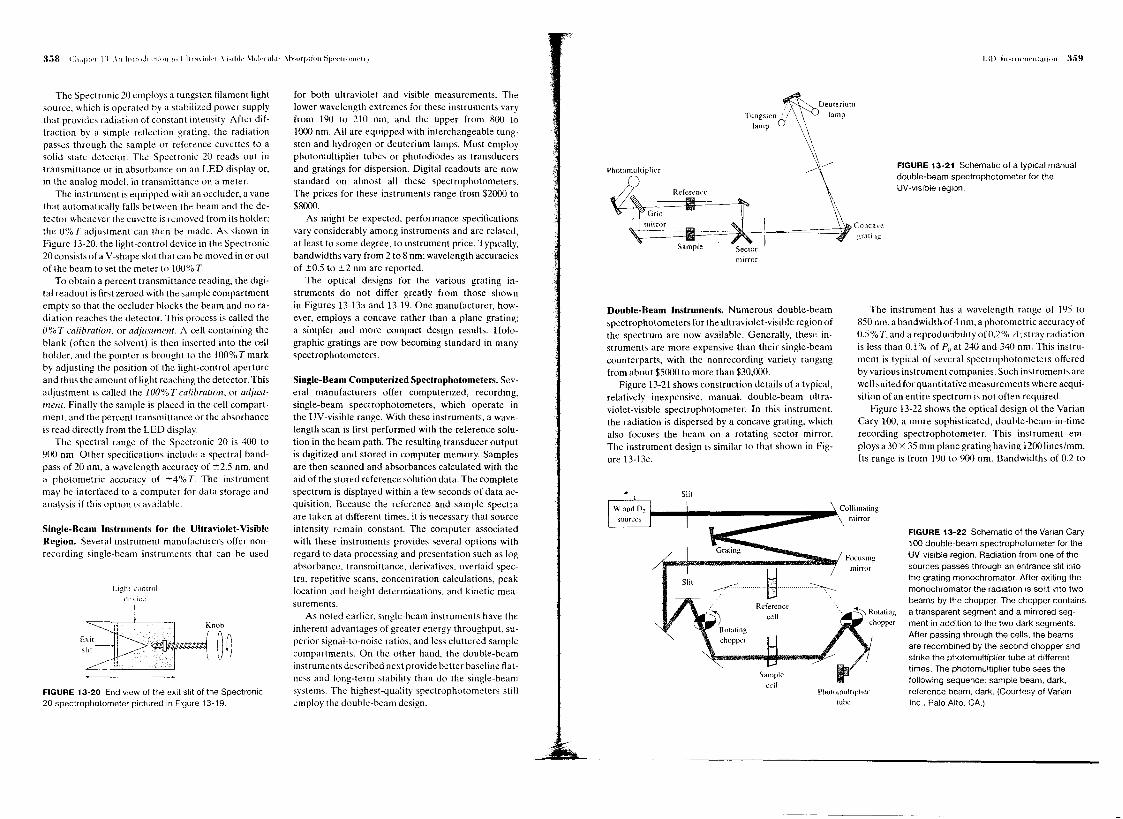
The Spectronic 20 employs a tungsten filament lightsource. which is operated by a stabilized power supplythat provides radiation of constant intensity. After dif-fraction by a simple reflection grating, the radiationpasses through the sample or reference cuvcttes to asolid state detector. The Spectronic 20 reads out intransmittance or in absorbance on an LED display or,in the analog model. in transmittance on a meter.
The instrument is equipped with an occluder, a vanethat automatically falls between the beam and the de-tector whenever the cuvette is removed from its holder;the 0% T adjustment can then be made. As shown inFigure 13-20, the light-control device in the Spectronic20 consists of a V-shape slot that can be moved in or outof the beam to set the meter to 100% T.
To obtain a percent transmittance reading, the digi-tal readout is first zeroed with the sample compartmentempty so that the occluder blocks the beam and no ra-diation reaches the detector. This process is called the0% T calibration. or adjustment. A cell containing theblank (often the solvent) is then inserted into the cellholder, and the pointer is brought to the 100% T markby adjusting the position of the light-control apertureand thus the amount of light reaching the detector. Thisadjustment is called the 100% T calibration, or adjust-mem. Finally the sample is placed in the cell compart-ment, and the percent transmittance or the absorbanceis read directly from the LED display.
The spectral range of the Spectronic 20 is 400 to900 nm. Other specifications includc a spectral band-pass of 20 nm, a wavelength accuracy of :<:2.5nm, anda photometric accuracy of :<:4%T. The instrumentmay be interfaced to a computer for data storage andanalysis if this option is available.
~ Deuterium
Tungsren//\ ~ lamplamp 0 \\
FIGURE 13·21 Schematic of a typical manualdouble-beam spectrophotometer for theUV-visibleregion.
ConcavegratIng
The instrument has a wavelength range of 195 to850 nm, a bandwidthDf 4 nm, a photometric accuracy of0.5% T, and a reproducibility of 0.2% A; stray radiationis less than 0.1 % of Po at 240 and 340 nm. This instru-ment is typical of several spectrophotomcters offeredby various instrument companies. Such instruments arewell suited for quantitative measurements where acqui-sition of an entire spectrum is not often required.
Figure 13-22 shows the optical design of the VarianCary 100, a more sophisticated, double-beam-in-timerecording spectrophotometer. This instrument em-ploys a 30 x 35 mm plane grating having 1200 Iines/mm.Its range is from 190 to 900 nm. Bandwidths of 0.2 to
Double-Beam Instruments. Numerous double-beamspectrophotometers for the ultraviolet-visible region ofthe spectrum are now available. Generally, these in-struments are more expensive than their single-beamcounterparts, with the nonrecording variety rangingfrom about $5000 to more than $30,000.
Figure 13-21 shows construction details of a typical,relatively inexpensive, manual, double-beam ultra-violet-visible spectrophotometer. In this instrument,the radiation is dispersed by a concave grating, whichalso focuses the beam on a rotating sector mirror.The instrument design is similar to that shown in Fig-ure 13-13c.
Single-Beam Computerized Spectrophotometers. Sev-eral manufacturers offer computerized, recording,single-beam spectrophotometers, which operate inthe UV-visible range. With these instruments, a wave-length scan is first performed with the reference solu-tion in the beam path. The resulting transducer outputis digitized and stored in computer memory. Samplesare then scanned and absorbances calculated with theaid of the stored reference solution data. The completespectrum is displayed within a few seconds of data ac-quisition. Because the reference and sample spectraare taken at different times, it is necessary that sourceintensity remain constant. The computer associatedwith these instruments provides several options withregard to data processing and presentation such as logabsorbance, transmittance, derivatives, overlaid spec-tra, repetitive scans, concentration calculations, peaklocation and height determinations, and kinetic mea-surements.
As noted earlier, single-beam instruments have theinherent advantages of greater energy throughput, su-perior signal-to-noise ratios, and less cluttered samplecompartments. On the other hand, the double-beaminstruments described next provide better baseline flat-ness and long-term stability than do the single-beamsystems. The highest-quality spectrophotomctcrs stillemploy the double-beam design.
Single-Beam Instruments for the Ultraviolet-VisibleRegion, Several instrument manufacturers offer non-recording single-heam instruments that can he used
FIGURE 13·22 Schematic of the VarianCary100 double-beam spectrophotometer for theUV-visibleregion. Radiation from one of tbesources passes through an entrance stit intothe grating monochromator. After exiting themonochromator the radiation is split into twobeams by the chopper. The cbopper containsa transparent segment and a mirrored seg-ment in addition to the two dark segments.After passing through the cells, the beamsare recombined by the second chopper andstrike the photomultiplier tube at differenttimes. The photomultiplier tube sees thefollowing sequence: sample beam, dark,reference beam, dark. (Courtesy of VarianInc., Palo Alto. CA.)
FIGURE 13-20 End view of the exit slit of the Spectronic20 spectrophotometer pictured in Figure 13-19

4.00 nm can be chosen in O.I-nm steps by means of amotor-driven slit contml system. The instrument has aphotometric accuracv of :;:0.00016 A; its stray radia-tion is less than 0.0013% of P" at 370 nm and 0.IXJ74%at 220 nm. The ahsorbance range is from 0 to 3.7 absor-bance units. The performance of this instrument is sig-niticantly better than that of the double-beam instru-ment of Figure 13-21; its price is correspondingly higher.
The Varian Cary 3(Xl shown in Figure 13-23 usesa premonochromator in front of the same douhle-heam-in-time instrument shown in Figure 13-22. Thesecond monochromator reduces the stray-light levelsto 0.fX)()(J41% at 370 nm and 0.00008% at 220 nm.This extends the ahsorhance range to 5.0 absorbanceunits. Most of the other characteristics are identicalto that of the Varian Cary 100. Both units have adouble-chopper arrangement that ensures nearly iden-tical light paths for both beams. The two beams strikethe photomultiplier tube at essentially the samepoint. which minimizes errors due to photocathodenonuniformity.
Double-Dispersing Instruments. To enhance spectralresolution and achieve a marked reduction in scatteredradiation. a number of instruments have been designedwith two gratings serially arranged with an interveningslit; in effect, then, these instruments consist of twomonochromators in a series configuration.
Multichannel Instruments. Array detectors began ap-pearing in UV -visible spectrophotometers in the
Grating monochromator
I
I
FIGURE 13-23 Optical diagram of the VarianCary 300 double-dispersing spectrophotometer.The instrument is essentially identical to that shown in Figure 13-22, except that a secondmonochromator is added immediately after the source. (VarianInc., Palo Alto. CA.)
19ROs. With a diode array. or more recently a CCDarray, loeated at the focal plane of a spectrograph, aspectrum can be obtained by electronic rather thanmechanical scanning. All of the data points neededto dcfine a spectrum can thus be gathered essentiallysimultaneously. The concept of multichannel instru-ments is attractive because of the potential speed atwhich spectra can be acquired as well as their applica-bility to simultaneous multicomponent determina-tions. By now. several instrument companies offer suchinstruments as either stand-alone spectrophotometersor as miniature versions.
Figure 13-24 shows a photograph of a miniaturetiber-optic spectrometer using a linear CCD array.The optical diagram is similar to that shown in Fig-ure 13-14, except that tiber optics are used to transportthe radiation to and from the sample cell. In the versionshown, the spectrometer is external to the computer.The output of the array connects to an analog-to-digitalconverter board in the computer. In other models, thespectrometer contains the converter and intcrfaces tothe computer via a USB port. Such spectrometers areavailable from about $1800 to about $5000.
Both tungsten and deuterium sources are availablefor the spectrophotometer shown in Figure 13-24. With
deuterium, the wavelength range is 2CX)-400 nm. Withthe tungsten source. the range is 360-850 nm. A com-bined deuterium and tungsten-halogen source is alsoavailable with a wavelength range of 200-1100 nm.Some fourteen different gratings arc available alongwith six different entrance slits. No entrance slit isneeded with liber-optic coupling. The spectrometerresolution depends on the grating dispersion and theentrance aperture.
A stand-alone diodc-array-based spectrophotome-ter is illustrated in Figure 13-25. This instrument usesa deuterium source for the lJV -visible region (190 to800 nm) and a tungsten lamp for the visible near-infrared region (370 to 1100 nm). A shutter blocks thecollimated source radiation or allows it to pass throughto the sample cell. A tilter can be inserted for stray-light correction. The spectrograph consists of the en-trance slit, the grating, and the diode-array detector. A1024-element photodiode array is used. The nominalbandwidth of the spectrophotometer is I nm over therange from 190 to 1100 nm. Stray light is less than0.05% at 220 nm and less than 0.03% at 340 nm.
With the spectrophotometer of Figure 13-25, scantimes can be as short as 0.1 s, but more typically the ar-ray is exposed for 1 to 1.5 s. With such short exposure
FIGURE 13-24 A multichannel miniature fiber-optic spectrometer. A fiber-optic cabletransports the light beam from the cell holder on the left to the spectrograph anddetector on the right. In some models, the spectrograph and detector are mounted on acircuit board inserted into the computer. (Courtesy of Ocean Optics. Inc.. Dunedin, FL.)

(a) What is the absorbance of a 3.79 x 10-' M solution of the complex at470 nm in a I.(j()-cm cell?
(b) What is the percent transmittance of the solution described in (a)?(c) What is the molar concentration of the complex in a solution that has the
ahsorhance descrihed in (a) when measured at 470 nm in a 2.50-cm cell')
At 5XOnm. which is the wavelength of its maximum absorption. the complexFe(SCN)" has a molar ahsorpti\ity 01'7.00 X 10' L cm-I mol-I Calculate(a) the ahsorbance of a 3.49 X 10.5 M solution of the complex at 580 nm in a
1.00-cm cell(h) the absorhance of a solution in a 2.50-cm cdl in which the concentration of
the complex is one half that in (a).(c) the percent transmittance of the solutions described in (a) and (b).(d) the absorhance of a solution that has half the transmittance of that described
in (a).
*13-9 A 2.50-mL aliquot of a solution that contains 7.9 ppm iron(III) is treated withan appropriate excess of KSCN to form thc Fe(SCN)2t complex and diluted to50.0 mL. What is the absorbance of the resulting solution at 580 nm in a 2.50-cmcell') See Prohlem 13-g for absorptivity data.
13-10 Zinc(lI) and the ligand L form a 1: 1 complex that absorhs strongly at 600 nm.As long as the molar concentration of L exceeds that of zinc(II) by a factor of 5,the ahsorbance depends only on the cation concentration. Neither zinc(II) nor Lahsorhs at 600 nm. A solution that is 1.59 X 10' M in zinc(II) and 1.00 X 10 J
M in L has an absorhance of 0.352 in a I.OO-cmcell at 600 nm. Calculate(a) the percent transmittance of this solution.(b) the percent transmittance of this solution in a 2.50-cm ccll,(c) the molar absorptivity of the complex.
~ 13-li The equilibrium constant for the conjugate acid-hase pair
HIn + H20 ~ H,O' + In
Shunerlstray_lighr filler
Cu\'etlt'Tungsten
Source lenslamp
Deuterium *13-8Silt
lamp
GraringSource lens
PhO{lldiodearray
FIGURE 13-25 A multichannel diode-array spectrophotometer, the AgilentTechnologies 8453.(Courtesy of AgilentTechnologies, Palo Alto,CA.)
times, photodecomposition of samples is minimizeddespite the location of the sample between the sourceand the monochromator. The stability of the sourceand the electronic system is such that the solvent signalneeds to he observed and stored only every 5 to 1(Jmin.
The spectrophotometer shown in Figure 13-25 isdesigned to interface with most personal computer sys-tems. The instrument (without the computer) sells forabout $10.000: the exact price depends on accessoriesand options.
*Answers are provided at the end of the hook for problems marked with an asterisk.
~ Problems with this icon are hest solved using spreadsheets.
*13-1 Express the following absorbances in terms of percent transmittance:(a) O.oJ8 (d) 0.241(h) 0.95X (e) 0.435(c) 0.399 (f) 0.692 is X.(~)X 10 '. From the additional information in the following table,
(a) calculate the absorbance at 43(Jnm and 600 nm for the following indicatorconcentrations: 3.00 X ]() 'M. 2.(XlX 1IJ-' M. I.(j() X 10-' M. (J.500 X
10-' M, and 0.250 X ur' M.(b) plot ahsorhance as a function of indicator concentration.
*13-2 Convert the following transmittance data to ahsorhanees:(a) 15.X% (d) 23.8'10
(h) 0.492 (e) 0.085(cl 39.4% (f) 5.38%
*13-3 Calculate the percent transmittance of solutions having half the absorbance of thesolutions in Problem 13-1.
*13-4 Calculate the absorbance of solul ions having twice the percent transmittance ofthose in Problem 13-2.
AbsorptionSpecies Maximum. om 430 nm 600nm
IIln 410 H.04 x 10' 1.23 x lO'
In 60" o.n,; x lO' 6.96 x 10'*13-5 A solution containing 6.23 ppm KMnO, had a transmittance o[ 0.195 in a 1.00-cm
cell at 520 nm. Calculate the molar ahsorptivity of KMnO, at 520 nm.
13-6 A solution containing 5.24 mg/IOO mL of A (335 g.'mol) has a transmittance of55.2% in a 1.50-cm cell at 425 nm. Calculate the molar absorpti\'ity of A at thiswavelength.
*13-7 A solution containing the complex formed hetween Hi( III) and thiourea has amolar ahsorptivity of9.32 X 10] L mol' ern I at470 nm.
is 4.2 X 10". The nl\1lar ahsorptivitie, [or the two principal species in a solutionof K.Cr,O, arc

A ",(CrO.' I ",(Cr,O,' I
345 l.R4 x 10' 10.7 x 10'370 4.Rl x 10' 7.28 x 10'.jj~l l.RR x 10' 1.89 x 10'
(c) scattered radiation (in a monochromator).(d) source flicker noise.(c) cell positioning uncertainty.(f) beamsphtter.
13-21 Describe how a monochromator, a spectrograph, and a spectrophotometer differfrom each other.Four solutions were prepared by dissolving 4.00 x 10-'.3.00 x 10".
2.()O x ]() '. and 1.00 x 10" moles of K,Cr,O- in water and diluting to 1.()()Lwith a pH 5.60 buffer. Derive theoretical absorbance values (l.()(l-cm cells) foreach solution and plot the data for (a) 345 nm, (b) 370 nm. and (c) 400 nm.
13-13 Describe the differences between the following and list any particularadvantages possessed by one over the other.(a) hydrogen and deuterium discharge lamps as sources for ultraviolet radiation.(b) filters and monochromators as wavelength selectors.(c) photovoltaic cells and photot ubes as detectors for electromagnetic radiation.(d) photodiodes and photomultiplier tubes.(e) double-beam-in-space and double-beam-in-time spectrophotometers.(f) spectrophotometers and photometers.(g) single-beam and double-beam instruments for absorbance measurements.(h) conventional and multichannel spectrophotometers.
13-14 A portable photometer with a hnear response to radiation registered 63.8 pAwith the solvent in the light path. The photometer was set to zero with no lightstriking the detector. Replacement of the solvent with an absorbing solutionyielded a response of 41.6 pA. Caleulate(a) the percent transmittance of the sample solution.(b) the absorbance of the sample solution.(c) the transmittance to be expected for a solution in which the concentration
of the absorber is one third that of the original sample solution.(d) the transmittance to be expected for a solution that has twice the concentra-
tion of the sample solution.
*13-15 A photometer with a linear response to radiation gave a reading of 498 mV withthe solvent in the light path and 25fl mV when the solvent was replaced by anabsorbing solution. The photometer was set to zero with no light striking thedetector. Calculate(a) the percent transmittance and absorbance of the absorbing solution.(b) the expected transmittance if the concentration of absorber is one half that
of the original solution.(c) the transmittance to be expected if the light path through the original
solution is doubled.
13-16 Why docs a deuterium lamp produce a continuum rather than a line spectrumin the ultraviolet'!
The following data were taken from a diode-array spectrophotometer in an ex-periment to measure the spectrum of the Co(II)-EDTA complex. The columnlabeled P;o'"",," is the relative signal obtained with sample solution in the cellafter subtraction of the dark signal. The column labeled Pm",,,, is the referencesignal obtained with only solvent in the cell after subtraction of the dark signal.Find the transmittance at each wavelength. and the absorbance at each wave-length. Plot the spectrum of th.: compound.
Wavelength, om Psqt,ut l~fGlufio.
350 O.lKl2flR9 0.llO2560.175 0.lKJ0326 0.(X159954(Xl 0.0\6975 00\5\43425 0.035517 O.ll31648
450 0.1162425 0.02497R475 0.ll'!5.174 0.Oj907.1
51X) 0\40567 0.023275525 0.lR89R4 0.0.17448550 0.2fl3103 0.088537575 0.31R3fl\ O.200R72600 0.394()()O 0.278072625 0,477018 0.363525
650 0.564295 0,468281
675 0.6550M 0.6\10fl2700 0.719\80 0.704126725 0.R1.1694 0.777466750 0.R85979 0.R63224775 0.945083 0.9214.\6ROO l.(Xl(XlOO 0.977237
13-23 Why do quantitative and qualitative anaiys.:s often require dillerent monochro-mator slit widths"
~ 13-24 The absorbances of solutions containing K,CrO, in 0.05 M KO/l w.:re measuredin a l.()-cm cdl at 375 nm. The following results were obtained:
13-17 Why can photomultiplier lubes not be used with infrared radiation'?
13-18 Why is iodine sometimes introdue.:d into a tungsten lamp"
13-19 Describe the origin of shot noise in a spectrophotometer. /low does the relativeuncertainty vary with concentration if shot noise is the major noise source?
Cone. ofK,CrO••g/L
0lXl5000100O.1J2(XJ0031X)0.0400
0.1230.2470.494074:'0.99\
13-20 Deline(al dark cun.:,,!.(b) transducer.
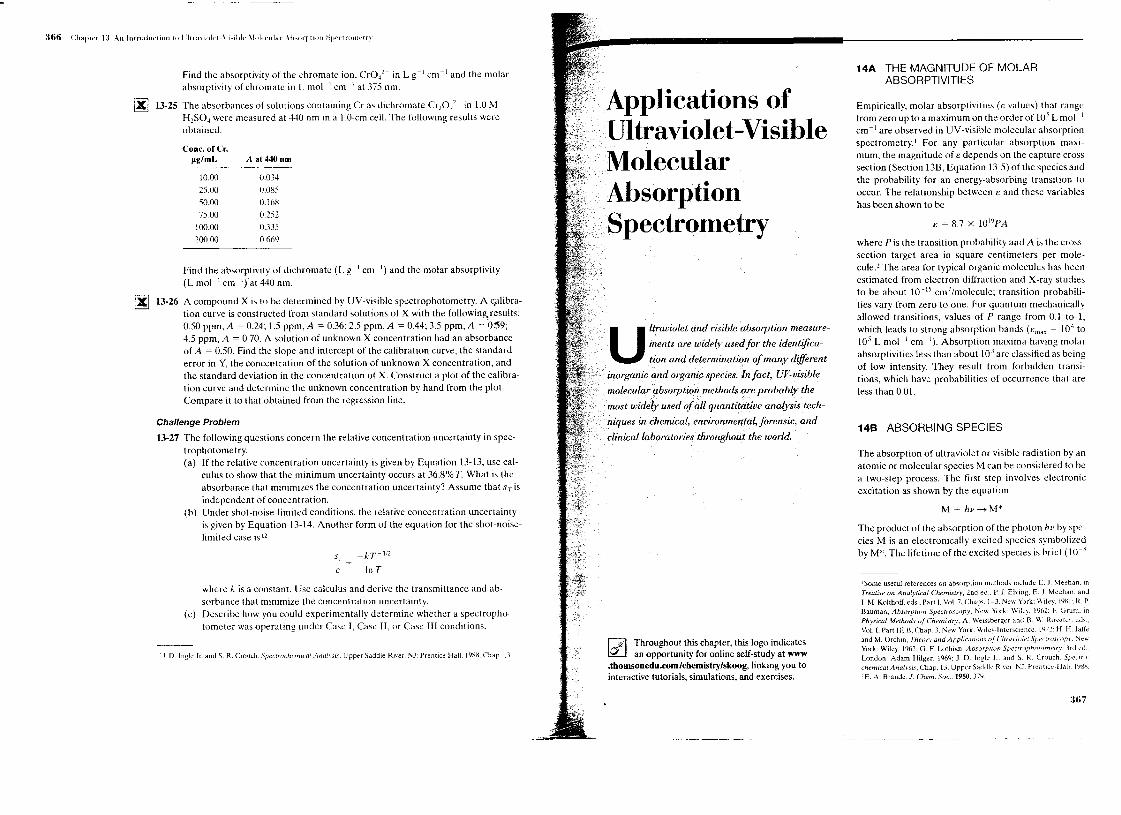
Find the absorptivity of the chromate ion, CrO,'- in L g-I cm-I and the molarabsorptivity of chromate in L mol-I cml at 375 nm.
The absorbanees of solutions containing Cr as dichromate Cr,O,'- in l.0 l\fH,SO, were measured at 440 nm in a l.O-cm cell. The following results wereobtained:
Cone,orCr,I'glmL
10.00
25.0050.0075.00
lOO.lXl200.00
0.034O.0~50.1680.2520.3350.669
Find the absorptivity of dichromate (L g-l cm-I) and the molar absorptivity(L mol-I cm ') at 440 nm.
A compound X is to be determined by UV-visible spectrophotometry. A c.alibra-tion curve is constructed from standard solutions of X with the following. results:0.50 ppm, A = 0.24; 1.5 ppm, A = 0.36; 2.5 ppm, A = 0.44; 3.5 ppm, A = 'o~9;4.5 ppm, A = 0.70. A solution of unknown X concentration had an absorbanceof A = 0.50. Find the slope and intercept of the calibration curve, the standarderror in Y, the concentration of the solution of unknown X concentration, andthe standard deviation in the concentration of X. Construct a plot of the calibra-tion curve and determine the unknown concentration by hand from the plot.Compare it to that obtained from the regression line.
Challenge Problem
13-27 The following questions concern the relative concentration uncertainty in spec-trophotometry.(a) If the relative concentration uncertainty is given by Equation 13-13, use cal-
culus to show that the minimum uncertainty occurs at 36.8% T. What is theabsorbance that minimizes the concentration uncertainty? Assume that Sr isindependent of concentration.
(b) Under shot-noise-limited conditions, the relative concentration uncertaintyis given by Equation 13-14. Another form of the equation for the shot-noise-limited case is 12
s, -kT-l"
c In T
where k is a constant. Use calculus and derive the transmittance and ab-sorbance that minimize the concentration uncertainty.
(c) Describe how you could experimentally determine whether a spectropho-tometer was operating under Case I, Case II, or Case III conditions.
Applications ofUltraviolet -VisibleMolecularAbsorptionSpectrQmetry
UIt.raviolet and. visible .absorption measure-ments are wide(y used for the identifica-
tion and determination of many different- inorganic and organicspecies.lnfact, Uf/-visible
molecular?bsorption method.sfre probably the,.most widely used afall quantiUitive ana!)'sis tech-
niques in chemical, environmert1al,forensic, andclinicallaborataries throughout the world.
U1 Throughout this chapter, this logo indicatesIQ.J an opportunity for online self-study at www.tbomsonedu.com/cbemistrylskoog, linking you tointeractive tutorials, simulations, and exercises.
14A THE MAGNITUDE OF MOLARABSORPTIVITIES
Empirically, molar absorptivities (e values) that rangefrom zero up to a maximum on the order of 10' L mol··1
cm-I are observed in UV-visible molecular absorptionspectrometry. 1 For any particular absorption maxi-mum, the magnitude of e depends on the capture crosssection (Section 13B, Equation 13-5) of the species andthe probability for an energy-absorbing transition tooccur. The relationship between e and these variableshas been shown to be
wherc P is the transition probability and A is the cross-section target area in square centimeters per mole-cule.' The area for typical organic molecules has beenestimated from electron diffraction and X-ray studiesto be about 10-15 cm2/molecule: transition probabili-ties vary from zero to one. For quantum mechanicallyallowed transitions, values of P range from 0.1 to 1,which leads to strong absorption bands (em" = 10' to105 L mol-I em-I). Absorption maxima having molarabsorptivities less than about 103 are classified as beingof low intensity. They result from forbidden transi-tions, which have probabilities of occurrence that areless than 0.01.
The absorption of ultraviolet or visible radiation by anatomic or molecular species M can be considered to bea two-step process. The first step involves electronicexcitation as shown by the equation
M + hv ....• M*
The product of the absorption of the photon hv by spe-cies M is an electronically excited species symbolizedby M*. The lifetime of the excited species is brief (10-8
ISome useful references on absorption methods include E. 1. Meehan. inTreatise on Analytical Chemvilry, 2nd cd., P. 1. Elvwg, E. 1. Meehan. andI. ~1. Kalthoff, eds .. Part I, Vol. 7, Chaps. 1-3, New York: Wiley, 1981; R. P.Bauman, Absorption Spectroscopy, Nev.' York: \Viky. 1962~ F Grum. inPhysical Methods of Chemistry, A. Weissbergcr and B. \V. Rossiter. cds ..Vol. L Part II[ B, Chap. 3, r\ew York: \\'iky~lntcrscicncc, t 472: H. H. Jaff~and M. Orchin, Theory and Applicl1liolll of UrriHiuli!! Spectroscopy, NewYork: Wiley. 1962; G. F Lothian. Absorpflon Spectrophotometry. :lrd ed.,Londun: Adam Hilger. 1969: 1. D. Ingle Jr. and S. R. Crouch, Spectro-chemical AfUllysL'i, Chap. 13, Upper Saddle River. NJ: Prentice-HalL 1985lE. A. Braude. I. Chern. Sac 1950, 379.

to 10-9 s). Any of several relaxation processes can leadto deexcitation of M*. The most common type of re-laxation involves conversion of the excitation energyto heat as shown by
M* .....M + heat
Relaxation may also occur by a photochemical pro-cess such as decomposition of M* to form new species.Alternatively, relaxation may involve reemission offluorescence or phosphorescence. It is important tonote that the lifetime of M* is usually so very short thatits concentration at any instant is ordinarily negligible.Furthermore, the amount of thermal energy evolvedby relaxation is quite small. Thus, absorption measure-ments create a minimal disturbance of the system un-der study except when photochemical decompositionoccurs.
The absorption of ultraviolet or visible radiationgenerally results from excitation of bonding clectrons.Because of this, the wavelengths of absorption bandscan be correlated with the types of bonds' in the speciesunder study. Molecular absorption spectroscopy is,therefore, valuable for identifying functional groups ina molecule. More important, however, are the applica-tions of ultraviolet and visible absorption spectroscopyto the quantitative determination of compounds con-taining absorbing groups.
As noted in Section 6C, absorption of ultraviolet andvisible radiation by molecules generally occurs in oneor more electronic absorption bands, each of which ismade up of many closely packed but discrete lines.Each line arises from the transition of an electron fromthe ground state to one of the many vibrational and ro-tational energy states associated with each excited elec-tronic energy state. Because there are so many of thesevibrational and rotational states and because their en-ergies dilfer only slightly, many closely spaced lines arecontaincd in the typical band.
As can be seen in Figure 14-la, the visible absorp-tionspectrum for l,2,4,S-tetrazine vapor shows the fincstructure that is due to the numerous rotational and vi-brational levels associated with the excited elcctronicstates of this aromatic molecule. [n the gaseous state,the individual tetrazine moleculcs are sufficiently sep-arated from onc anothcr to vibrate and rotate freely,and the many individual absorption lines appear as aresult of the large number of vibrational and rotationalcnergy states. [n the condensed state or in solution,howcver. the tetrazine molecules have little freedom torotate. so lines due to differences in rotational energy
Chromophore Examp[e Solvent ADtaX' om ElDn Transition Type
Alkene C6H13CH=CH, II-Heptane 177 13,000 1T~1T*
Alkyne C,H11C==C-CH3 II-Heptane 178 10,000 TT ---,l> ,,*196 2000225 160
Carbonyl CH3CCH] n-Hexane 186 1000 fl---,l> (T*u~ II 280 16 n ---,l> 1T*@ 0~ CH,CH n-Hexane 180 large n ......-)o(T*1: II n --+ 7T*<
0 293 12
Carboxyl CH,COOH Ethanol 204 41 n ...--71T*
Amido CH3CNH2 Water 214 60 n ---t1T*
II
°Azo CH3N=NCH3 Ethanol 339 n ---,l> 1T*
Nitro CH3NO, Isooctane 280 22 n ---t 77"*
Nitroso C,H,NO Ethyl ether 300 100665 20 n ......-71T*
Nitrate C"H5ONO, Dioxane 270 12 n --+ 71"*
FIGURE 14-1 Ultravioletabsorption spectra for 1,2,4,5-tetrazine. In (a), the spectrum is shown in the gas phase,where many lines due to electronic, vibrational, and rota-tional transitions can be seen. In a nonpolar solvent (b),the electronic transitions can be observed, but the vibra-tional and rotational structure has been lost. In a polarsolvent (c), the strong intermolecular forces cause theelectronic peaks to blend, giving only a single smoothabsorption band. (From S. F.Mason, J. Chern. Soc.,1959, 1265.)
most single bonds are sufficiently high that absorptionoccurs in the so-called vacuum ultraviolet region (A <185 nm), where components of the atmosphere alsoabsorb radiation strongly. Such transitions involve theexcitation of nonbondingn electrons to a* orbitals. Themolar absorptivities of n .....a* transitions are low to in-termediate and usually range between 100 and 3000 Lmol-I em -I Because of experimental difficulties asso-ciated with the vacuum ultraviolet region, most spec-trophotometric investigations of organic compoundshave involved longer wavelengths than 185 nm.
Most applications of absorption spectroscopy to or-ganic compounds are based on transitions for n or rrelectrons to the rr* excited state because the energiesrequired for these processes bring the absorption bandsinto the ultraviolet-visible region (ZOOto 700 nm). BothII -> rr* and rr .....rr* transitions require the presenceof an unsaturated functional group to provide the rr or-bitals. Molecules containing such functional groupsand capable of absorbing ultraviolet-visible radiationare called chronwphores.
The electronic spectra of organic molecules contain-ing chromophores are usually compiex, because the su-perposition of vibrational transitions on the electronictransitions leads to an intricate combination of over-lapping lines. The result is a broad band of absorptionthat often appears to be continuous. The complex na-
levels disappear. Furthermore, when solvent mole-cules surround the tetrazine molecules, energies of thevarious vibrational levels are modified in a nonuni-form way, and the energy of a given state in a sample ofsolute molecules appears as a single, broad peak. Thiseffect is more pronounced in polar solvents, such aswater, than in nonpolar hydrocarbon media. This sol-vent effect is illustrated in Figure 14-1b and c.
148-1 Absorption by Organic Compounds
All organic compounds are capable of absorbing elec-tromagnetic radiation because all contain valence elec-trons that can be excited to higher energy levels. Theexcitation energies associated with electrons forming
ture of the spectra makes detailed theoretical analy-sis difficult or impossiblc. Nevertheless, qualitative orsemiquantitative statements concerning the types ofelectronic transitions responsible for a given absorp-tion spectrum can be deduced from molecular orbitalconsiderations.
Table l4-ihsts the common organic chromophoresand the approximate wavelengths at which they ab-sorb. The data for position (Am,,) and peak intensity(8m,,) can serve as only a rough guide for identificationpurposes, because both are influenced by solvent ef-fects as well as other structural details of the molecule.[n addition, conjugation between two or more chro-mophores tends to cause shifts in absorption maximato longer wavelengths. Finally, vibrational effectsbroaden absorption peaks in the ultraviolet and visibleregions, which often makes precise determination ofan absorption maximum dimcult. The molar absorp-tivities for n"'" rr* transitions are normally low andusually range from iO to 100 L mol-I cm I. On theother hand, values for rr -> rr* transitions generallyrange between 1000 and is.OOOL mol 1cm -I Typicalabsorption spectra are shown in Figure 1.\-2.
Saturated organic compounds containing such het-eroatoms as oxygen, nitrogen, sulfur. or halogens havenon bonding electrons that can be excited by radia-tion in the range of 170 to 250 nm. Table 14-2 lists a

100,000080,000 f3 ~arOh:ne
60,000-l000020000o ~ ••••••.•_-
350 400 450 500 550 600 650
210230250270290310330350Wavelength. om
FIGURE 14-2 Absorption spectra for typical organiccompounds.
few examples of such compounds. Some of thesecompounds, such as alcohols and ethers, are commonsolvents, so their absorption in this region preventsmeasuring absorption of analytes dissolved in thesecompounds at wavelengths shorter than 180 to 200 nm.Occasionally, absorption in this region is used for de-termining halogen and sulfur-bearing compounds.
A number of inorganic anions exhibit ultraviolet ab-sorption bands that are a result of exciting nonbondingelectrons. Examples include nitrate (313 nm), carbon-ate (217 nm), nitrite (360 and 280 nm), azido (230 nm),and trithiocarbonate (500 nm) ions.
In general, the ions and complexes of elemenlsin the first two transition series absorb broad bandsof visible radiation in at least one of their oxidationstates and are, as a result, colored (see, for example,Figure 14-3). Here. absorption involves transitions be-tween filled and unfilled d-orbitals with energies that
TABLE 14-2 Absorption by Organic CompoundsContaining Heteroatoms with Nonbonding Electrons [;0
-l00 500CH,oH
(CH,hOCH,ClCH,'(CH,hSCH,NH2
(CH,hN
depend on the Iigands bonded to the metal ions. Theenergy differences between these d-orbitals (and thusthe position of the corresponding absorption maxi-mum) depend on the position of the element in the pe-riodic table, its oxidation state, and the nature of theligand bonded to it,
Absorption spectra of ions of the lanthanide' and ac-tinide transitions series differ substantially ffOLDthoseshown in Figure 14-3. The electrons responsible for ab-sorption by these elements (4fand Sf, respectively) areshielded from external influences by electrons that oc-cupy orbitals with larger principal quantum numbers.As a result, the bands tend to be narrow and relatively
:0:: ,""I-l00 500 600 700
Wavelength, nm
FIGURE 14-4 Absorption spectra of aqueous solutions ofrare earth ions.
l[~l400 500 600 700
unaffected by the species bonded by the outer elec-trons (see Figure 14-4).
10'000[-8000600040002000
;: 00. 400o~
For quantitative purposes, charge-transfer absorptionis particularly important because molar absorptivitiesare unusually large (£ > 10,0(0), which leads to highsensitivity. Many inorganic and organic complexes ex-hibit this type of absorption and are therefore calledcharge-transfer complexes.
A charge-transfer complex consists of an electron-donor group bonded to an electron acceptor. When thisproduct absorbs radiation, an electron from the donoris transferred to an orbital that is largely associated withthe acceptor. The excited state is thus the product ofa kind of internal oxidation-reduction process. Thisbehavior differs from that of an organic chromophorein which the excited electron is in a molecular orbitalshared by two or more atoms.
Familiar examples of charge-transfer complexesinclude the phenolic complex of iron(IlI). the 1,10-
[l] Simulation: Learn more about absorption spectra.
Zl'Ito !
-lOO
I~J-l00 500 600 700
V\"avekngth. mil
FIGURE 14-3 Absorption spectra of aqueous solutionsof transition metal ions.
phenanthroline complex of iron(II), the iodide com-plex of molecular iodine, and the hexacyanoferrate(II)-hexacyanoferrate(III) complex responsible for thecolor of Prussian blue. The red color of the iron(l1l)-thiocyanate complex is a further example of charge-transfer absorption. Absorption of a photon results inthe transfer of an electron from the thiocyanate ion toan orbital that is largely associated with the iron(lll)ion. The product is an cxcited species involving pre-dominantly iron(II) and the thiocyanate radical SeN.As with other types of electronic excitation, the elec-tron in this complex ordinarily returns to its originalstate after a brief period, Occasionally, however, an ex-cited complex may dissociate and produce photochem-ical oxidation-reduction products. Three spectra ofcharge-transfer complexes are shown in Figure 14-5.
In most charge-transfer complexes involving ametal ion, the metal serves as the electron acceptor.Exceptions are the 1,10-phenanthroline complexes ofiron(II) and copper(l), where the ligand is the accep-tor and the metal ion the donor. A few other examplesof this type of complex are known,
Organic compounds form many interesting charge-transfer complexes, An example is quinhydrone (a 1: 1complex of quinone and hydroquinone), which exhibitsstrong absorption in the visible region. Other examplesinclude iodine complexes with amines, aromatics, andsulfides.
50004000 Fe(SCN)2+300020001000
o400 450 500 550 600 650 700
~ 12,000
~ 108~~~~ 6000~ 4000~ 2000'0 0::;: -l00 450 500 550 600 650 700
~H~.~StarChlj- •10,000
5000o-l00 -l50 500 550 600 650 700
\Vavelength. nm
FIGURE 14-5 Absorption spectra of aqueous charge-transfer complexes.

14C QUAliTATIVE APPliCATIONS OFULTRAVIOLET-VISIBLE ABSORPTIONSPECTROSCOPY
Spectrophotometric measurements with ultraviolct ra-diation are useful for detecting chromophoric groups,such as those shown in Table 14-1.' Because large partsof even the most complex organic molecules are trans-parent to radiation longer than 180 nm, the appearanceof one or more peaks in the region from 200 to 400 nmis clear indication of the presence of unsaturated groupsor of atoms such as sulfur or halogens. Often, the iden-tity of the absorbing groups can be determined by com-paring the spectrum of an analyte with those of simplemolecules containing various chromophoric groups"Usually, however, ultraviolet spectra do not haveenough fine structure to permit an analyte to be identi-fied unambiguously. Thus, ultraviolet qualitative datamust be supplemented with other physical or chemicalevidence such as infrared, nuclear magnetic resonance,and mass spectra as well as solubility and melting: andboiling-point information.
Ultraviolet spectra for qualitative analysis are usuallymeasured using dilute solutions of the analyte. Forvolatile compounds, however, gas-phase spectra areoften more useful than liquid-phase or solution spectra(for example, compare Figure 14-1a and b). Gas-phasespectra can often be obtained by allowing a drop or twoof the pure liquid to evaporate and equilibrate with theatmosphere in a stoppered cuvette.
In choosing a solvent, consideration must be givennot only to its transparency, but also to its possibleeffects on the absorbing system. Quite generally, polarsolvents such as water, alcohols, csters, and ketonestend to obliterate spectral fine structure arising fromvibrational effects. Spectra similar to gas-phase spec-tra (see Figure 14-6) are more likely to be observed in
3For a detailed discussion of ultraviolet absorption spectroscopy in theidentification of organic functional groups, see R. M. Silverstein, G. CBassler, and T. C. Morrill, Specrromerric Idefl(~ficalion uf Organic Com-
pounds, 5th ed., Chap. 6, !"iew York: Wiley, 1991.~I-L H. Perkampus. [lV-VIS AlIas of Organic Compnlll!ds. 2nd ed ..Hoboken. NJ: WHey-VCH.I992. In addition. in the past. several organiza-tions have published catalogs of spectra that may still be useful, includingAmerican Petroleum Institute, Ultraviolet Spectral Data, AP.l. ResearchProject 44. Pittsburgh: Carnegie Institute of Techno logv: Sadtler Handbookof Ultra~'iolet Spectra, Philadelphia: Sadtler Research-Laboratories: Amer-ican Society for Testing ~'iaterials. Committee E-D. Philaddphia.
1.4
"c~~ 1.2:;( 1.6
FIGURE 14-6 Effect of solvent on the absorptionspectrum of acetaldehyde.
nonpolar solvents such as hydrocarbons. In actctttion,the positions of absorption maxima arc influenced bythe nature of the solvent. As a rule, the same solventmust be used when comparing absorption spectra foridentification purposes.
Table 14-3 lists some common solvents and theapproximate wavelength below which they cannot beused because of absorption. These wavelengths, calledthe cutoff wavelengths, depend strongly on the purityof the solvent.' Common solvents for ultraviolet spec-
'i Most major suppliers of reagent chemicals ill the United States offer spec-trochemical grades of solvents. Spectral-grade solvents have been treatedto remove absorbing impurities and meet or exceed the requirements setforth in Reagent Chemicals, 9th cd., Washington, DC: American ChemicalSociety, 2000. Supplements and updates are available at http://pubs.acs.org/reagentslindex.html
TABLE14-3 Solvents for the Ultraviolet and VisibleRegions
Lower LowerWavelength Wavelength
Solvent Limit,nm Solvent Limil,nm
Water 180 Diethyl ether 210Ethanol 220 Acetone 330Hexane 200 Dioxane 320Cyclohexane 200 Cellosolve 320Carbon 260tetrachloride
~ 0.4;;-E 0.3o~-< 0.2
0.1
FIGURE 14-7 Spectra for reduced cytochrome c at fourspectral bandwidths. (1)20 nm, (2) 10 nm, (3)5 nm, and(4) 1 nm. (Courtesy of Varian, Inc., Palo Alto, CA.)
trophotometry include water, 95% ethanol, cyclo-hexane, and lA-dioxane. For the visible region, anycolorless solvent is suitable.
The effect of variation in slit width, and hence effec-tive bandwidth, was shown previously for gas-phasespectra in Figure 13-8. The effect on solution spectrais illustrated for reduced cytochrome c in Figure 14-7.Clearly, peak heights and separation are distorted atwider bandwidths. Because of this, spectra for qualita-tive applications should be measured with minimumslit widths.
Even though it may not provide the unambiguous iden-tification of an organic compound, an absorption spec-trum in the visible and the ultraviolet regions is never-theless useful for detecting the presence of certainfunctional groups that act as chromophores. For ex-ample, a weak absorption band in the region of 280 to290 nm, which is displaced toward shorter wavelengthswith increased solvent polarity, strongly indicates thepresence of a carbonyl group. Such a shift is tcrmed ahypsochromic, or bLlle,shift. A weak absorption band atabout 260 nm with indications of vibrational finc struc-ture constitutes evidence for thc existcnce of an aro-matic ring. Confirmation of the presence of an aromaticamine or a phenolic structure may be obtained by com-paring the effects of pH on the spectra of solutions con-taining the sample with those shown in Table 14-4 forphenol and aniline.
The ultraviolet spectra of aromatic hydrocarbonsare characterized by three sets of bands that originatefrom 'IT --+ 'IT' transitions. For example, benzene has astrong absorption peak at 184 nm (em" = 60,000): aweaker band, called the E, band, at 204 nm (com" ~7900); and a still weaker peak, termed the B band, at256(emax = 200). The long-wavelength bands of benzenevapor, 1,2,4,5-tetrazine (see Figure 14-la), and manyother aromatics contain a series of sharp peaks duc tothe superposition of vibrational transitions on the basicelectronic transitions. As shown in Figure 14-1, sol-vents tend to reduce (or sometimes eliminate) this finestructure as do certain types of substitution.
E, Band B Band
Compound A..-x, om emax Amal,nm Emax
Benzene C6H6 204 7900 256 200Toluene C6H,CH, 207 7000 261 300m-Xylene C6H,(CH,), 263 300Chlorobenzene C.H,Cl 210 7600 265 240Phenol C.HsOH 211 6200 270 1450Phenolate ion c"H,O- 235 9400 287 2600Aniline C.HsNH2 230 8600 280 1430Anilinium ion C.H,NH; 203 7500 254 160Thiophenol C.H,SH 236 10.000 269 700Naphthalene CIOHs 286 9300 312 289Styrene C.H,CH=CH2 244 12,000 282 -\50

All three of the characteristic bands for benzene arestrongly affected by ring substitution: the effects on thetwo longer-wavelength bands are of particular interestbecause they can be studied with ordinary spectropho-tometric equipment. Table 14-4 illustrates the effectsof some common ring substituents.
By definition, an auxochrome is a functional groupthat does not itself absorb in the ultraviolet region buthas the effect of shifting chromophore peaks to longerwavelengths as well as increasing their intensities. Sucha shift to longer wavelengths is called a bathochromic,or red, shift. Note in Table 14-4 that -OH and- NH, have an auxochromic effect on the benzenech~omOphore, particularly with respect to the B band.AUXDchromic substituents have at least one pair of nele~tro~s capable of interacting with the 7T electrons of
the ring. This interaction apparently has the effect of- stabilizing the 7T* state, thereby lowering its energy,and increasing the wavelength of .the correspondingband. Note that the auxochromic effect is more pro-nounced for the phenolate anion than for phenol itself,probably because the anion has an extra pair of un-shared electrons to contribute to the interaction. Withaniline, on the other hand, the nOnbonding electronsare lost by formation of the anilinium cation, and theauxochromic effect disappears.
140 QUANTITATIVEANALYSIS BYABSORPTION MEASUREMENTS
Absorption spectroscopy based on ultraviolet and visi-ble radiation is one of the most useful tools availableto the scientist for quantitative analysis6 Importantcharacteristics of spectrophotometric and photomet-ric methods include (1) wide applicability to both or-ganic and inorganic systems, (2) typical detection limitsof lO-4 to lO-5 M (in some cases, certain modifica-tions can lead to lower limits of detection).' (3) mod-erate to high selectivity, (4) good accuracy (typically,relative uncertainties are 1% to 3%, although with spe-cial precautions. errors can be reduced to a few tenthsof a percent), and (5) ease and convenience of dataacquisition.
"For a wealth of detailed. practical information on spectrophotometriC"practices, see Techniques in Visible and (jltra~'iolet Spearomerry. \'01. I.
Sumdards in Absorption Spectroscopy, C. Burgess and A. Knowles. eds ..London: Chapman & Hall, 1981; 1. R. Edisbury. Practical If/nls Oil Ab-sorption Spearomelr.r. New York: Plenum Press, 1968.'See. for example, T. D. Harris. Anal. Chern .. 1982,54, 7.HA,
140-1 Scope
The applications of quantitative, ultraviolet-visible ab-sorption methods not only are numerous but also touchon everv field that requires quantitative chemical infor-mation.' The reader can obtain a notion of the scope ofspectrophotometry by consulting the series of reviewarticles that were published in Analytical Chemistry'as well as monographs on the subject.9
Applications to Absorbing Species
Tables 14-1, 14-2, and 14-4 list many common organicchromophoric groups. Spectrophotometric determina-tion of any organic compound containing one or moreof these groups is potentially feasible. Many examplesof this type of determination are found in the literature.
A number of inorganic species also absorb UV-visible radiation and are thus susceptible to direct de-termination. We have noted that many ions of the tran-sition metals are colored in solution and can .thus bedetermined by spectrophotometric measurttment. Inaddition, a numbcr of other species show charactcris-tic absorption bands, including nitrite, nitrate, andchromate ions, the oxides of nitrogen, the elementalhalogens, and ozone.
Applications to Nonabsorbing Species
Numerous reagents react selectively with nonabsorb-ing species to yield products that absorb strongly in theultraviolet or visible regions. The successful applica-tion of such reagents to quantitativc analysis usuallyrequires that the color-forming reaction be forced tonear completion. If the amount of product is limitedby the analyte, the absorbance of the product is pro-portional to the analyte concentration. Color-formingreagents are frequently employed as well for the de-termination of absorbing species, such as transition-metal ions. The molar absorptivity of the product isfrequently orders of magnitude greater than that of thespecies before reaction.
A host of complexing agents are used to determineinorganic species. Typical inorganic reagents includethiocyanate ion for iron, cobalt, and molyhdenum;
~L. G. Hargis.]. A. Howell. and R E. Sutlon. Altai. Chern. (Rc\lcwl.1996.68.169: 1-:\. Howell and R. E. Sutton, Anal. Chern .. (Re\'i.:w).1998. 7{j. 107
9H. Onishi, Pho[omeIric Dnerminatlon of Traces of :\-fetaLI. Part IIA. PartlIB. -Ilh ed .. :-';ew York: \Viky. 1986. 1989: Colorimetric Determination ofNonmetals. 2nd ed .. D. F. Boltz. ed., New Ymk: Intcrscicnce. 197.s: E. BSandell and H. Onishi. Photometric DeterminatiOfl of Tral"eS of .\krtlis...loth ed .. New York: Wiley. 1978: F D. Snell. PholUmerric and Fluor(Jm<!(ril
,\.ferhods o(Analysis. New York: Wiley. 1978
hvdrogen peroxide for titanium, vanadium, andchromium; and iodide ion for bismuth, palladIUm, andtellurium. Of even more importance are organicchelat-ing agents that form stable, colored complexes WIthcations. Common examples include dlethyldlthlOcar-bamate for the determination of copper. diphenylthio-carbazone for lead, I,lO-phenanthrolene for iron,and dimethylglyoxime for nickel. In the application ofthe last reaction to the photometric determinatIOn ofnickel, an aqueous solution of the cation is extractedwith a solution of the chelating agent in an immiscibleorganic liquid. The absorbance of thc resulting brightred organic laycr serves as a measure of the concentra-tion of the metal.
140-2 Procedural Details
A first step in any photometric or spectrophotometricanalysis is the developmcnt of conditions that yield areproducible relationship (preferably linear) betweenabsorbance and analyte concentration.
Selection of Wavelength
For highest sensitivity, spcctrophotometric absorbancemeasuremcnts are ordinarily made at a wavelength cor-responding to an absorption maximum because thechange in absorbance per unit of concentratIOn ISgreat-est at this point. In addition, the absorbance tS nearlyconstant with wavelength at an absorption maximum,which leads to close adherence to Becr's law (sce Fig-ure 13-5). Finally, small uncertainties that arise fromfailing to reproduce precisely the wavelength setting ofthe instrument have less influence at an absorptIOnmaximum.
Variables That Influence Absorbance
Common variables that influence the absorption spec-trum of a substance include the naturc of the solvent,the pH of the solution, the temperature, high electro-Ivte concentrations, and the presence of interferings~ubstances. The dIects of these variables must beknown and conditions for the analysis must be chosensuch that the absorbance will not be materially in-fluenced by small. uncontrolled variations in theirmagnitudes.
Cleaning and Handling of Cells
Accurate spectrophotometric analysis requires the useof good-quality, matched cells. These should be regu-larlv calibrated against one another to detect dlffer-
enees that can result from scratches, etching, and wcar.It is equally important to use proper cell-cleaning anddrying techniques. Erickson and Surles 10 recommendthe following cleaning sequence for the outSide Win-dows of cells. Prior to measurement, the cell surfacesshould be cleaned with a lens paper soaked in spectro-grade methanol. While wiping, it is best to hold the pa-per with a hemostat. The methanol is then allowed toevaporate, leaving the cell surfaces free of contamt-nants. Erickson and Surles showed that thiS methodwas superior to the usual procedure of wiping the cellsurfaces with a dry lens paper, which can leave ltnt anda film on the surface.
Determining the Relationship betweenAbsorbance and Concentration
The method of external standards (see Section 10-2)is most often used to establish the absorbance versusconcentration relationship. After deciding on the con-ditions for the analysis, the calibration curve is pre-pared from a series of standard solutions that bracketthe concentration range expected for the samples.Seldom, if ever, is it safe to assume adherence to Beer'slaw and use only a single standard to determine themolar absorptivity. It is never a good idea to base theresults of an analysis on a literature value for the mo-lar absorptivity. .
Ideally, calibration standards should approximatethe composition of the samples to bc analyzed not onlywith rcspect to the analyte concentration but als~ WIthregard to the concentrations of the other spectes In thesample matrix. This can minimize thc effects of van-ous components of the sample on the measured ab-sorbance. For example, the absorbance of many col-ored complexes of metal ions is decreased to a varyingdegree in the presence of sulfate and phosphate Ionsbecause these anions can form colorlcss complexeswith metal ions. The desired reaction is often less com-plete as a consequence, and lowered absorbances arethe result. The matrix effect of sulfate and phosphatecan often be counteracted by introducing into the stan-dards amounts of the two species that approximate theamounts found in the samples. Unfortunately. matrixmatching is often impossible or quite difficult whencomplex materials such as soils, minerals, and tissuesare being analyzcd. When this is the case. the standard-addition method is often helpful in counteracttng

matrix effects that affect the slope of the calibrationcurve. However, the standard-addition method doesnot compensate for extraneous absorbing species un-less they are present at the same concentration in theblank solution.
The Standard-Addition Method
The standard-addition method can take severalforms.l1 The one most often chosen for photometricor spectrophotometric analyses, and the onc that wasdiscussed in some detail in Section 10-3, involvesadding one or more increments of a standard solutionto sample aliquots. Each solution is then diluted to afixed volume before measuring its ahsorbance. Ex-ample 14-1 illustrates a spreadsheet approach to themultiple-additions method for the photometric deter-mination of nitrite.
Nitrite is commonly determined by a spectrophotomet-ric procedure using the Griess reaction. The samplecontaining nitrite is reacted with sulfanilimide and N-(I-naphthyl)ethylenediamine to form a colored speciesthat absorbs radiation at 550 nm. Five-milliliter aliquotsof the sample were pipetted into five 50.00-mL volu-metric flasks. Then, 0.00, 2.00, 4.00, 6.00, and 8.00 mL ofa standard solution containing 10.00 flM nitrite werepipetted into each flask, and the color-forming reagentsadded. After dilution to volume, the absorbance foreach of the five solutions was measured at 550 nm. Thcabsorbances were 0.139, 0.299, 0.486, 0.689, and 0.865,respectively. Devise a spreadsheet to calculate the ni-trite concentration in the original sample and its stan-dard deviation.
The spreadsheet is shown in Figure 14-8. Note that thefinal result indicates the concentration of nitrite in theoriginal sample is 2.8 :+: 0.3 flM. The standard devia-tion is found from the regression line 12 bv using an ex-trapolated x value of ~ 1.385 mL and a v ~'alue;f 0.000as illustrated in Example 1-1 of Chapt~r 1.
I i See M. Rader, I Chern. Educ.. 1980. 5~. 70.3.leFor more information on sprcadsh~e( ilpproach~s {u standard additIonmethods. see S. R. Crouch and F J Holler. ApplicillWIZS of .\licrosoW:'
Excel in Ana(\,'licill Chemistn Chaps. 4 and l~. BdmlmL c.-\ BrooksCole.200.t.
In the interest of saving time or sample, it is possibleto perform a standard-addition analysis using only twoincrements of sample. Here, a single addition of V; mLof standard would he added to one of the two samples.This approach is based on Equation 14-1 (see Sec-tion 10-3).
A,c\.Vs
C, = (A, ~-AI)V'
The single-addition method is illustrated in Ex-ample 14-2.
A 2.00-mL urine specimen was treated with reagent togenerate a color with phosphate, following which thesample was diluted to 100 mL. To a second 2.00-mLsample was added exactly 5.00 mL of a phosphate so-lution containing 0.0300 mg phosphate/mL, which wastreated in the same way as the original sample. The ab-sorbance of the first solution was 0.428, and th;t of thesecond was 0.538. Calculate the concentration of phos-phate in milligrams per millimeter of the specimen.
Solution
01W1.' I
c=-.Mool ~--.-200 0.00 2.00
C = (0.428)(O~OJOOmg PO/"/mL)(5.00 mL), (0.538 - 0.428)(2.00 mL sample)
= 0.292 mg PO.'- ImL sample
ones at which the molar absorptivities of the two com-ponents differ significantly. Thus, at A" the molar ab-sorptivity of component M is much larger than that forcomponent N. The reverse is true for A2. To completethe analysis, the absorbance of the mixture is deter-mined at the same two wavelengths. From the knownmolar absorptivities and path length, the followingequations hold:
AI
Analysis of Mixtures of Absorbing Substances
The total absorbance of a solution at any given wave-length is equal to the sum of the absorbances of the in-dividual components in the solution (Equation 13-9).This relationship makes it possible in principle to de-termine the concentrations of the individual compo-nents of a mixture even if their spectra overlap com-pletelv. For example, Figure 14-9 shows the spectrumof a solution containing a mixture of species M andspecies N as well as absorption spectra for the individ-ual components. It is apparent that there is no wave-length where the absorbance is due to just one of thesecomponents. To analyze the mixture, molar absorptiv-ities for M and Narc tlrst determined at wavelengthsA, and A2 with sufficient concentrations of the two stan-dard solutions to be sure that Beer's law is obeved overan absorbance range that encompasses the ab;orbanceof the sample. Note that the wavelengths selected are
(14-2)
(14-3)
where the subscript 1 indicates measurement at wave-length AI' and the subscript 2 indicates measurementat wavelength A,. With the known values of e and b,Equations 14-2 and 14-3 represent two equations intwo unknowns (c" and eN) that can be solved. The re-lationships are valid only if Beer's law holds at bothwavelengths and the two components behave inde-pendently of one another. The greatest accuracy is ob-tained by choosing wavelengths at which the differ-ences in molar ahsorptivities are large.
f7l lluorial: Learn more about calibration and analy~lQ.j sis of mixtures.
Mixtures containing more than two absorbing spe-cies can be analyzed. in principle at least, if a furtherabsorbance measurement is made for each added com-ponent. The uncertainties in the resulting data become
/-; .........•./ ' "
;/ " •••__ ~+N..••. ,
\
FIGURE 14-9 Absorption spectrum of a two-componentmixture (M + N) with spectra of the individualcompo-nents. Vertical dashed lines indicate optimal wavelengthsfor determination of the two components.

greater, however, as the number of measurements in-creases. Some array-detector spectrophotometers arecapable of reducing these uncertainties by overdeter-mining the system. That is, these instruments use manymore data points than unknowns and effectivelv matchthe entire spectrum of the unknown as closely' as pos-sible by least-squares techniques using the methods ofmatrix algebra. The spectra for standard solutions ofeach component are required for the analysis.
Computer data-processing methods based on factoranalysis or principal components analysis have been de-veloped to determine the number of components andtheir concentrations or absorptivities in mixturesl3
These methods are usually applied to data obtainedfrom array-detector-based spectrometers.
140-3 Derivative and Dual-WavelengthSpectrophotometry
In derivative spectrophotometry, spectra are obtainedby plotting the first- or a higher-order derivative of ab-sorbance with respect to wavelength as a function ofwavelength.'" Often, these plots reveal spectral detailthat is lost in an ordinary spectrum. In addition, con-centration measurements of an analyte in the presenceof an interference or of two or more analytes in a mix-lUre can sometimes be made more easily or more ac-curately using derivative methods. Unfortunately, theadvantages of derivative spectra are at least partiallyoffset by the degradation in signal-to-noise ratio thataccompanies obtaining derivatives. In some parts ofthe ultraviolet and visible regions, however, signal-to-noise ratio is not a limiting factor. Even if signal-to-noise ratio is degraded by differentiation, smoothingmethods can be applied to help improve precision.
Several different methods have been used to obtainderivative spectra. For modern computer-controlleddigital spectrophotometers, the differentiation can beperformed numerically using procedures such as deriv-ative least-squares polynomial smoothing, which is dis-cussed in Section 5C-2. With older analog instruments,derivatives of spectral data could be obtained electron-ically with a suitable operational amplifier circuit (see
li L R Malinowski. Factor Analysis in Chemistry, 3rd ed .. Chap_ 9, NewYork: Wiley, 2002
"For additional informal Ion see G. Talsky. Dcrh'l1lit,f.' 5pec!ropho(omelry
LOII'und HIgh Order, New York: VCH. IlN-t: T C O'Ha\'t~r.Anal. Chern.,1979.51. <JIA: F. Sanchez Rojas. C Bosch Ojeda. and 1. M. Cana Pavon,"Lllilfltu. 1988.35.753: C. Bosch Ojeda. F Sanchez Rojas, and J ,\I. CanoPawlD, Talanw, 1995, 42,1195
Section 3E-4). Another technique uses mechanical os-cillation of a refractor plate to sweep a wavelength in-terval of a few nanometers repetitively across the exitslit of a monochromator while the spectrum is scanned,a technique known as wavelength modulation. Alterna-tively, the spectrum can be scanned using two wave-lengths offset by a few nanometers, which is called dua/-wavelength speetrophotometry.
Applications of Derivative Spectra
Many of the most important applications of derivativespectroseopy in the ultraviolet and visible regions havebeen for qualitative identification of species. The en-haneed detail of a derivative spectrum makes it possibleto distinguish among compounds having overlappingspectra, a teehnique often called feature enhancement.lj
Figure 14-10 illustrates how a derivative plot can revealdetails of a spectrum consisting of three overlapping ab-sorption peaks. It should be noted that taking a deriva-tive enhances noise, and so high-quality spectra are amust for using this technique. If high-quality spectra arenot used, derivative spectra can sometimes cre<rte fea-tures that are not actually present.
Derivative spectrophotometry is also proving quiteuseful for the simultaneous determination of two ormore components in mixtures. With mixtures, severalmethods have been proposed for quantitative analysis.The peak-to-peak height has been used as has the peakheight at the zero crossing wavelengths for the individ-ual components. More recently, multivariate statisticaltechniques, such as partial least squares and principalcomponents analysis, have been used to determineconcentrations. Derivative methods have been usedto determine trace metals in mixtures. For example,trace amounts of Mn and Zn can be determined inmixtures by forming complexes with 5,8-dihydroxy-1,4-naphthoquinone.'6 Derivative methods have alsobeen widely applied to pharmaceutical preparationsand to vitamin mixtures I'
Derivative and dual-wavelength spectrophotometryhave also proved particularly useful for extractingultraviolet-visible absorption spectra of analytes pres-ent in turbid solutions, where light scattering obliteratesthe details of an absorption spectrum. For example.
FIGURE 14-10 Comparison of a derivative spectrum(a)with a standard absorption spectrum (b).
three amino acids, tryptophan, tyrosine, and phenylala-nine, contain aromatic side chains, which exhibit sharpabsorption bands in the 240 to 300-nm region. Thesesharp peaks are not, however, apparent in spectra oftypical protein preparations, such as bovine or egg al-bumin, because the large protein molecules scatterradiation severely, yielding only a smooth absorptionpeak such as that shown in Figure 14-11a. As shown incurves (b) and (c), the aromatic fine structure is re-vealed in first- and second-derivative spectra.
Dual-wavelength spectrophotometry has alsoproved useful for determination of an analyte in thepresence of a spectral interference. Here, the instru-ment is operated in the nonscanning mode with ab-sorbances being measured at two wavelengths at whichthe interference has identical molar absorptivities.In contrast, the analyte must absorb radiation morestrongly at one of these wavelengths than the other.The differential absorbance is then directly propor-tional to the analyte concentration.
I'Spreadsheet applicatIOns involving derivative tcchniqu<.:s for featureenhancement are giq.:n in S. R. Crouch and F J Holke Applications of.\ficr(!sof[~ Excd in Analyri,al Chemistry, flP- 312- 15. Belmont, CA:
Brooks'-Cole,200-1.I~H. Sedaira, Talanta. 2000. 51,39.IT. Abcra5tuuri ..A. L Jimenez, F Junena. and 1.J c\ri:ts. 1. Chern. Educ.,2001. 78. 793.
14E PHOTOMETRIC ANDSPECTROPHOTOMETRICTITRATIONS
Photometric or spectrophotometric measurements areuseful for locating the equivalence point of a titration,provided the analyte, the reagent, or the titration prod-uct absorbs radiation. IS Alternatively, an absorbing in-dicator can provide the absorbance change necessaryfor location of the equivalence point.
14E-1 Titration Curves
A photometric titration curve is a plot of absorbance,corrected for volume changes, as a function of the vol-ume of titrant. For many titrations, the curve consistsof two linear regions with differing slopes, one occur-ring early in the titration and the other located well be-yond the equivalence-point region. The end point is
18 For further information concerning this technique, see 1. B. Hcadridge,Photometric Titrations, New York: Pergamon. 1961: M. A. Leonard, inComprehensive Analytical Chemistry, G. Svehla, ed., VoL 8, Chap. 3, NewYork: Elsevier, 1977.
FIGURE 14-11 Absorption spectra of bovine albumin:(a) ordinary spectrum, (b) first-derivative spectrum,(c) second-derivative spectrum. (Reprinted with per-mission from J. E. Cahill and F.G. Padera, Amer. Lab.,1980,12 (4),109. Copyright 1980 by InternationalScientific Communications, Inc.)

(a; £...•.= f p = 0 (oj £p> 0 (c) fA> 0
7 £A=£l:::O \:r~ '7 (f)
LfA = a
FIGURE14-12 Typical photometric titration curves. Molarabsorptivities of the analyte, the product, and the titrantare given by 'A' 'P, 'T, respectively.
the intersection of the extrapolated linear portions ofthe curve. End points can also be determined auto-matically by titration to a fixed absorbance or by tak-ing the derivative to convert the linear-segment curveto a sigmoid-shape curve.
Figure 14-12 shows typical photometric titrationcurves. Figure 14-12a is the curve for the titration of anonabsorbing species with an absorbing titrant that re-acts with the analyte to form a nonabsorbing product.An example is the titration of thiosulfate ion with tri-iodide ion. The titration curve for the formation ofan absorbing product from nonabsorbing reactants isshown in Figure 14-12b; an example is thc titration ofiodide ion with a standard solution of iodate ion toform triiodide. The remaining figures illustrate thecurves obtained with various combinations of absorb-ing analytes, titrants, and products.
To obtain titration curves with linear portions thatcan be extrapolated, the absorbing systems must obeyBeer's law. In addition, absorbances must be correctedfor volume changes by multiplying the observed absor-bance by (V + ,.)IV, where V is the original volume ofthe solution and v is the volume of added titrant. Manymethods, however, use only changes in absorbance tolocate the endpoints by various techniques. With these,strict adherence to Beer's law is not a necessity.
Photometric titrations are ordinarily performed witha spectrophotometer or a photometer that has beenmodified so that the titration vessel is held stationary inthe light path. Alternatively, a probe-type cell. such asthat shown in Figure 13-18, can be employed. After the
instrument is set to a suitable wavelength or an appro-priate filler is inserted, the 0% r adjustment is made inthe usual way. With radiation passing through the ana-lyte solution to the transducer, the instrument is thenadjusted to a convenient absorbance reading hy varyingthe source intensity or the transducer sensitivity. It isnot usually necessary to measure the true absorbancebecause relative values are perfectly adequate for end-point detection. Titration data are then collected with-out changing the instrument settings. The power of theradiation source and the response of the transducermust remain constant during a photometric titration.Cylindrical containers are often used in photometrictitrations, and it is important to avoid moving the cell.so that the path length remains constant.
Both filter photometers and spectrophotometershave been used for photometric titrations. Several in-strument companies currently produce photometrictitration equipment.
Photometric tit rations often provide more accurate re-sults than a direct photometric analysis because thedata from several measurements are used to determinethe end point. Furthermore, the presence of other ab-sorbing species may not interfere, because only achange in absorbance is being measured.
An advantage of end points determined fromlinear-segment photometric titration curves is thatthe experimental data are collected well away fromthe equivalence-point region where the absorbancechanges gradually. Consequently, the equilibrium con-stant for the reaction need not be as large as that re-quired for a sigmoid titration curve that depends onobservations near the equivalence point (for example,potentiometric or indicator end points). For the samereason, more dilute solutions may be titrated usingphotometric detection.
The photometric end point has been applied tomany types of reactions. For example, most standardoxidizing agents have characteristic ahsorption spectraand thus produce photometrically detectable endpoints. Although standard acids or bases do not ab-sorb, the introduction of acid-base indicators permitsphotometric neutralization titrations. The photomet-ric end point has also been used to great advantage intitrations with EDTA (cthylenediaminetelraacetic
r::;l S.im~lla(i~)fl: Learn more about spectrophotomet-l2J rle htratlons.
acid) and other complexing agentsl9 Figure 14-Baillustrates the application of this technique to the de-termination of total hardness in tap water using Eri-ochrome Black T as the indicator. The ahsorbance ofthe indicator is monitored at 610 nm.'lJ
The photometric end point has also been adapted toprecipitation titrations. In turbidimetric titrations, thesuspended solid product causes a decrease m the radi-ant power of the light source by scattering from the par-ticles of the precipitate. The end point is observed whenthe precipitate stops forming and the amount of lightreaching the detector becomes constant. The end pomtin some precipitation titrations can also be detected asshown in Figure 14-13b by addition of an indicator.Here, the Ba2+ titrant reacts with SO, ,- to form insolu-ble BaSO,. Once the end point has been reached, theexcess Ba2+ ions react with an indicator, Thorin, to forma colored complex that absorbs light at 523 nm.21
14F SPECTROPHOTOMETRICKINETIC METHODS
Kinetic methods of analysis" differ in a fundamentalway from the equilibrium, or stoichiometric, methodswe have been considering. In kinetic methods, mea-surements are made under dynamic conditions in whichthe concentrations of reactants and products are chang-ing as a function of time. In contrast, titrations or pro-cedures using complexing agents to form absorbmgproducts are performed on systems that have come toequilibrium or steady state so that concentrations arestatic. The majority of kinetic methods use spectropho-tometry as the reaction monitoring technique. .
The distinction between the two types of methods IS
illustrated in Figure 14-14, which shows the progressover time of the reaction
where A represents the analyte, R the reagent, and Pthe product. Equilibrium methods operate in the n,-
19For a discussion llf EDTA tllratlons. :,cc 0.;\. Skoog. D. M. \\"cst. F. JHoller. and S. R. Crouch. Fllndimlcncals or Analytical Chemlstn". 8th cd.Belmont. CA: Brooks/Cole. 2U04. Chap. 172\)For information on this method. see ~klrohm. Applicatinn Bulletin.33/-k. f\.{etrohm AG. Herisilu. Switzerland2lSec ~ktnJhm. Appltcatioo Bulktltl. l-l.I)'"'c:. /'.fdrohm AG. Hcri~alJ.
S\'.itzaland~2For additional information. See D. A. Sk\Klg. D.;-"1.West. F J. Huller. ;.lnJ
S. R. Crouch. Fundllmt'fllah (If ..1nilly{icill ChemHVL Sill ~d., Chap_ 24BdmclOt, CA: Brooks'Cole. 2(~l--t: H. () ~IOll(lla_ Kint'£il A,peCl5 O(AflJ
{I'Heal Chemistry. N~w York: \\'iky. 19:-;~
I(J<)(J
950
900
~'" 850
800
7502
(a)
900
~ 800
~'" 75(J
FIGURE14-13 Photometric titration curves: (a)totalhardness of water, (b)determination of sulfate. In (a),total water hardness is obtained by titration with 0.10 MEDTAat 610 nm for 100 mL of a solution that contained2.82 mmol/L total hardness. Eriochrome BlackT was theindicator. In (b), 10.0 mLof a solution containing sulfatewas titrated with 0.050 M BaCl, using Thorinas an indi-cator and a wavelength of 523 nm. The response shown isproportional to transmittance. (From A. L.Underwood,.Ana/. Chem .. 1954,26,1322. Figure 1, p. 1323. Copynght1954 American Chemical Society.)
gion hevond time to' when the bulk concentrations of~eactanis and product have become constant and thechemical s,"stem is at c;;quilihrium. In contrast, kineticmethods a~e carried out during the time interval from

Time te
FIGURE 14-14 Change in concentration of analyte [A]andproduct [P]as a function of time. Untiltime t,the analyteand product concentrations are continuously changing.This is the kinetic regime. Inthe equilibrium region, afterI" the analyte arid product concentrations are static.
o to teo when analyte and product concentrations arechanging continuously.
Kinetic methods can be more selective than equilib-rium methods if reagents and conditions are chosento maximize differcnces in the rates at which the ana-lyte and potential interferents react. In equilibrium-based methods, selectivity is realized by maximizingdifferences in equilibrium constants.
Kinetic methods can employ several different types ofreactions. Catalyzed reactions are among the mostpopular. With these, a catalyst is determined by its in-fluence on the reaction rate or one of the reactants isdetermined. For example, iodide is a catalyst in the re-action of Ce(IV) with As(III). Trace quantities of 1-can be determined by measuring the rate of this reac-tion as a function of the 1- concentration. Normally,the method of external standards is used to prepare acalibration curve of rate versus iodide concentration.More than forty inorganic cations and more than fif-teen anions have been determined based on their cat-alytic effect.
Organic catalvsts have also been determined bv ki-netic methods. T'he most important applications of cat-alyzed reactions to organic analyses involve the use ofenzymes as catalysts. The behavior of a large number
[l] Simulation: Learn more about kinetic methods.
of enzymes is consistent with the general mechanismkj k!
E + S ;===' ES ------> P + E (14-5)k,
In this so-called Michaelis-Menten mechanism, the en-zyme E reacts reversibly with the substrate S to forman enzyme-substrate complex ES. This complex thendecomposes irreversibly to form the products and theregenerated enzyme. The rate of this reaction oftenfollows the rate law
d[PJdt
k,[E]o[S]Km + [S]
k,[EJo[S]L + k_' __ 2 + [S]
k,
where Km is the Michaelis constant (L, + k,)lk,. Un-der conditions where the enzyme is saturated with sub-strate, [Sl ;;> Km, the rate d[Plldt is directly propor-tional to the initial enzyme concentration [Elo:
d[P]'d!=k,[E]o
Hence, measurements of the rate can be used to obtainthe enzyme activity (concentration), [Elo. ~
Substrates can also be determined by kinetic meth-ods. Under conditions where [S] <'i Km, Equation 14-6reduces to
d[P] k'd! = K:[E]o[S] = k'[SJ
where k' = k,l Km. Here, the reaction rate is di-rectly proportional to the substrate concentration[S]. If measurements are made near the beginnin~of the reaction «5% reaction), [S] = [S]o and therate is directly proportional to the initial substrateconcentration.2:-
The regions where enzyme and substrate can bedetermined by kinetic methods are illustrated in Fig-ure 14-15, which shows a plot of initial rate versus sub-strate concentration. We can see that the initial rate isproportional to substrate concentration at verv lowconcentrations, but the rate is proportional to the en-zyme concentration when the substrate concentrationis very high.
In addition to catalyzed reactions, kinetic methodsof analysis also can employ uncatalyzed reactions. Asan example, phosphate can be determined by measur-ing the rate of its reaction with molvbdate to form aheteropoly species, 12-molybdophosphate. More sen-sitivity can be achieved by reducing the 12-molyb-
4: t
Initialrate.dlPj
diP! ~ _~'-IEJo[SI()dt Km
Analytical regionfor substrates
dophosphate with ascorbic acid or another reducingagent to form phosphomolybdenum blue, an intenselycolored species. In either case, the rate of formation ofthe product is directly proportional to the phosphateconcentration.
Kinetic methods based on reactions that, with half-lives greater than about 10 s, can be performed in anordinary spectrophotometer equipped with a ther-mostatted cell compartment and provision to intro-duce and mix samples and reagents. Rates of reactionare highly dependent on temperature, and so temper-ature control to about 0.1°C is necessary for good re-producibility. Many commercial spectrophotometershave attachments that allow rates to be obtained. Forvery slow reactions, sample introduction and mixingcan be accomplished prior to placing the reaction mix-ture in the cell compartment. Usually, however, a sta-tionary cell is used, and all reagents except one areplaced in the cell. The reagent needed to start the re-action is then introduced by syringe or pipette and theensuing reaction is monitored while the mixture isstirred. With single-channel spectrophotometers, thereaction is monitored at a single wavelength by meas-uring the absorbance as a function of time. Array-detector-based instruments allow entire spectra to betaken at different time intervals for later analysis.
Continuous llow methods, such as flow injectionanalysis (see Chapter 33), are also used for sample in-troduction and reaction monitoring. A popular methodwith flow injection is to introduce sample and reagents
I_d[~ ~ k2[EJuI dtIII
Analyticalregion forenzymes
FIGURE 14-15 Plot of initialrate of productformation as a function of substrate con-centration, showing the parts of the curveuseful for the determination of substrateand enzyme.
in flowing streams and then to stop the flow with the re-action mixture in the spectrophotometric flow cell. Forreactions with half-lives of less than 10 s, the stopped-flow mixing technique is popular. In this technique,'streams of reagent and sample are mixed rapidly, andthe flow of mixed solution is stopped suddenly. The re-action progress is then monitored at a position slightlydownstream from the mixing point. The apparatusshown in Figure 14-16 is designed to perform stopped-flow mixing and to allow measurements on the millisec-ond time scale.
Kinetic methods can be classified according to how themeasurement is made.'" Differential methods computethe rate of reaction and relate it to the analyte concen-tration. Rates are determined from the slope of the ab-sorbance versus time curve. Integral methods use an in-tegrated form of the rate equation and determine theconcentration of analyte from the absorbance changesthat occur over various time intervals. Curve-fittingmethods fit a mathematical model to the absorbanceversus time curve and compute the parameters of themodel, including the analyte concentration. The mostsophisticated of these methods use the parameters ofthe model to estimate the value of the equilibrium orsteady-state response. These methods can provideerror compensation because the equilibrium position is
2~ For spreads heel approaches to kinetic methods. see S. R. Crouch andF J Holler. Applications of Jticrosoft!; Excel in Analytical Chemi5try.Chap. 13. Belmont. CA: Broqks/Colc. 2004
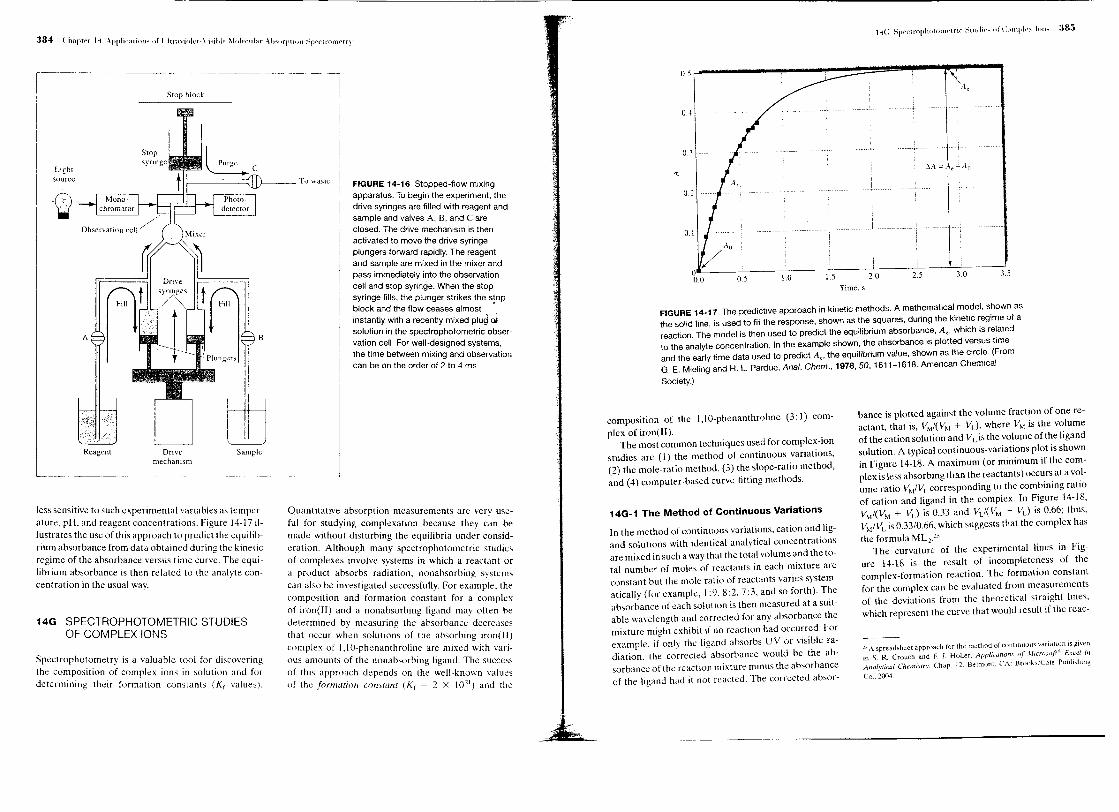
less sensitive to such experimental variables as temper-ature, pH, and reagent concentrations. Figure 14-17 il-lustrates the use of this approach to predict the equilib-num absorbance from data obtained during the kineticregIme of the absorbance versus time curve. The equi-IIbnum absorbance is then related to the analvte con-centration in the usual way. .
14G SPECTROPHOTOMETRIC STUDIESOF COMPLEX IONS
Spectrophotometry is a valuable tool for discoveringthe composition of complex ions in solution and fo~determining their formation constants (Kf values).
FIGURE 14-16 Stopped-flow mixingapparatus. To begin the experiment, thedrive syringes are filledwith reagent andsample and valves A, B, and Careclosed. The drive mechanism is thenactivated to move the drive syringeplungers forward rapidly.The reagentand sample are mixed in the mixer andpass immediately into the observationcell and stop syringe. When the stopsyringe fills,the plunger strikes the stopblock and the flow ceases almost .instantly with a recently mixed plua Glsolution in the spectrophotometric obser-vation cell. For well-designed systems,the time between mixingand observationcan be on the order of 2 to 4 ms.
FIGURE 14-17 The predictive approach in kinetic methods. A mathematical model, shown asthe solid line, is used to fit the response, shown as the squares, during the kinetic regime of areaction. The model is then used to predict the equilibrium absorbance, A" which is relatedto the analyte concentration. In the example shown, the absorbance is plotted versus timeand the early time data used to predict AO' the equilibriumvalue, shown as the circle. (FromG. E. Mielingand H. L. Pardue, Anal. Chem., 1978, 50,1611-1618. American ChemicalSociety.)
composition of the 1,10-phenanthroline (3: I) com-plex of iron(lI).
The most common techniques used for complex-ionstudies are (1) the method of continuous variations,(2) the mole-ratio method, (3) the slope-ratio method,and (4) computer-based curve-litting methods.
Quantitative absorption measurements are very use-ful tor studyIng complexation because thev can bemade without disturbing the equilibria und~r eonsid-aation. Although many spectrophotometric studiesof complexes involve systems in which a reactant ora product absorbs radiation, nonabsorbing systemscan also be Investigated successfully. For example, thecomposItIon and formation constant for a complexof lron(lI) and a non absorbing ligand may often bedetermined by measuring the absorbance decreasesthat occur when solutions of the absorbing iron( II)complex of I, IO-phenanthroline are mixed with vari-ous amounts of the nonabsorbing ligand. The successof this approach depends on the well-known valuesof the formalioll earlHam (Kf = 2 x 10²¹) and the
In the method of continuous variations, cation and lig-and solutions with identical analytical concentrationsarc mixed in such a way that the total volume and the to-tal number of moles of reactants in each mixture arcconstant but the mole ratio of reactants varies system-atically (for example, 1:9,8:2,7:3, and so forth). Theabsorbance of each solution is then measured at a suit-able wavelength and corrected for any absorbance themixture might exhibit if no reaction had occurred. Forexample. if only the ligand absorbs UV or visible ra-diation. the corrected absorbance would be the ab-sorbance of the reaction mixture minus the absorbanceof the ligand had it not reacted. The corrected absor-
bance is plotted against the volume fraction of one re-actant, that is, V"/(V" + V.J, where V" is the volumeof the cation solution and VLis the volume of the ligandsolution. A typical continuous-variations plot is shownin Figure 14-18. A maximum (or minimum if the com-plex is less absorbing than the reactants) occurs at a vol-ume ratio V"IVL corresponding to the combining ratioof cation and ligand in the complex. In Figure 14-18,V"/(j!,t + VL) is 0.33 and Vj/(V" + Vd is 0.66; thus,V.\.tIVLis 0.33/0.66, which suggests that the complex hasthe formula ML,.2'
The curvature of the experimental lines in Fig-ure 14-18 is the result of incompleteness of thecomplex-formation reaction. The formation constantfor the complex can be evaluated from measurementsof the deviations from the theoretical straight lines,which represent the curve that would result if the reac-
2.'A spreadsheet approach for the method of continuuus .....ariatlOn is given
in S. R. Crouch and F. 1. Holler, Applicaliort5 of Microsoft£. Excel inAnalytical Chemisrrv. Chap. t2. Belmont. CA' Brooks/Cole Publishing
Co .. 200..l.

i.2
1.0
~ 0.8c~.0
i 0.6""~t0 0.4u
\/M/(l'M + ~\)\'{J(VM + VL)
0.2 /10.40661
0.8 10.6
FIGURE 14-18 Continuous-variation plot for the 1:2complex ML,.
tion between the ligand and thc mctal proceeded tocompletion. Mathematical models can be derived toallow calculation of thc Kr value or computer curve-fitting methods can be used (see section 14G-4).
In the mole-ratio method, a series of solutions is pre-pared in which the analytical concentration of one re-actant (usually the cation) is held constant while thatof the other is varied. A plot of absorbance versusmole ratio of the reactants is then prepared. If the for-mation constant is reasonably favorable, two straightlines of different slopes that intersect at a mole ratiothat corresponds to the combining ratio in the complexare obtained. Typical mole-ratio plots are shown inFigure 14-19. Notice that the ligand of the I: 2 complexabsorbs at the wavelength selected so that thc slopebeyond the equivalence point is greater than zero. Wededuce that the uncomplexed cation involved in theI: I complex absorbs radiation, because the initialpoint has an absorbance greatcr than zero.
Formation constants can bc evaluatcd from the datain the curved portion of mole-ratio plots where thereaction is least complete. If two or morc complexesform, successive slope changes in the mole-ratio plot
r::il Simulation: Learn more about determining theIQ-1 composition of complexes.
may occur providcd the complexes have different molarabsorptivities and different formation constants.
This approach is particularly useful for weak complcxesbut is applicable only to systems in which a singlecomplex is formcd. The method assumes (I) that thecomplex-formation reaction can be forced to comple-tion by a large excess of either reactant and (2) thatBeer's law is followed under these circumstances.
Let us consider the reaction in which the complexMxLy is formed by the reaction of x moles of the cationM with y moles of a ligand L:
xM + yL;;==': MxLy
Mass-balance expressions for this system are
CM= [M] + x[MxL,.]
CL= [L] t y[MxLJ
FIGURE 14-19 Mole-ratio plots for a 1:1 and a 1:2complex. The 1 :2 complex is the more stable of thetwo complexes as indicated by closeness of the experi-mental curve to the extrapolated lines. The closer thecurve is to the extrapolated lines, the larger the formationconstant of the complex; the larger the deviation from thestraight lines, the smaller the formation constant of thecomplex.
where CMand Cl. are the molar analytical concen-trations of the two reactants. We now assume that atvery high analytical concentrations of L, the equilib-rium is shifted far to the right and [M] ~ x[M,Ly].
Under this condition, the first mass-balance expressionsimplifies to
where e is the molar absorptivity of MxLy and b is thepath length. A plot of absorbance as a function of CMislinear when there is sufficient L present to justify theassumption that [M] ~ x[MxLy]. The slope of this plotis eblx.
When CMis made very large, we assume that [L] ~y[MxLy], and the second mass-balance equation re-duces to
Again, if our assumptions arc valid, we find that aplot of A versus CLis linear at high concentrations of M.The slope of this line is ebly.
The ratio of the slopes of the two straightlines gives the combining ratio between M and L:
eblx yebly x
14G-4 Computer-Based Methodsfor Determining FormationConstants of Complexes
Several different methods depend on computer curvefitting to determine formation constants of complexes.We illustrate one approach here, but many others areused.'6
:~S(;e for example, K. A. Connors, Binding ConstanL5: The Measurementof ,\lolecular Complex Stability, I'cw York: \Viley, 19X5; F. J. C. RossoHi.and H. Rossotti. The Determination of Slabilily Constants. New York:McGraw-Hill. 1961
Principles
Let us consider the formation of a single I: 1 complexML from metal ion M and ligand L. Once again, weleave the charges off for generality:
[ML]K, = [M][L]
If the uneomplexed metal ion and the complex bothabsorb radiation at the analysis wavelength, we canwrite
[f we solve for [M] and substitute into Equation [4-7.we get
A = e"lb[ML] + eMb(cM- [MLj)= eMLb[ML] + eMbc" - eMb[ML] (14-8)
When the ligand conccntration is zero, [ML] = 0 andthe absorbance AL~Ois given by
If we substitute this expression into Equation l4-8 andrearrange, we get
M = A - AI -0 = e"lb[ML] - e"b[ML]= Lleb[ML] ([4-9)
where M is the difference in absorbance with andwithout the ligand present, and Cleis the difference inthe molar absorptivities of ML and M.
From the formation constant expression, we canwrite [ML] = Kf x [MJlL]. Furthermore, if our exper-imcnts are carried out in the presence of excess ligand,CL= [L]. Substituting these expressions and the massbalance expression for [M] into Equation l4-9, weobtain
j,EKiCL(\t
1 + K,cl

Data Analysis
Equation 14-10 is thc basis for sevcral computer-basedmcthods for determining the formation constant K,.In the usual experiment. a constant concentration ofmetal is used and the total ligand concentration CLisvaried. The change in absorbance M is then measuredas a function of total ligand concentration and the re-sults statistically analyzed to obtain K,. Unfortunately,the relationship shown in Equation 14-10 is nonlinear,and thus nonlinear regression must be used unless theequation is transformed to a linear form.27 We can lin-earize thc cquation by taking thc reciprocal of bothsidcs to obtain
A double reciprocal plot of blM versus IICLshouldbe a straight line with a slopc of II tieK,cM and an in-tercept. of II liecM' This equation is sometimes calledthe Benesi-Hildebrand equation.28
Linear regression can thus be used to obtain theformation constant as well as Ii" if CMis known. Theleast-squares parameters obtained are optimal only forthe linearized equation and may not be the optimumvalues for the nonlinear cquation. Hence, nonlinearregression is usually preferred for determining theparamcters K, and lie. Many computer programs areavailable for nonlinear regression. Sprcadsheet pro-grams such as Excel can be employed, but they do notgive statistical estimates of the goodness of fit or stan-dard errors for the parameters. Example 14-3 illus-trates thc use of Exccl for these calculations. Othcrprograms, including Origin, Minitab, GraphPad Prism,and TableCurve, givc more complete statistics.
To obtain the formation constant of a 1: I complex,the absorbance data in the table below were obtainedat various ligand concentrations and a metal con-centration of LOO X IO-J M. Both the uncomplexedmetal ion and the complcx absorb radiation at the
::Sce D. A. Sko()g, D. M. West. F. 1. Holler, and S. R Crouch, Funda-menlals ofAna/yeien! Chemistry, 8th ed .. Chap_ 8. Belmont, CA: Brooks/Cole.2()O ..!..
:iH. Rencsi and r H. Hildebrand, I Am. Chern. Soc., 1949. 7/, 2703
analysis wavelength. The cell path length was 10 cm.Use a spreadsheet to determine thc formationconstant.
[LJ,M A
0.0500 1.3050.0400 1.2150.0300 1.1580.0200 1.034O.OlOO 0.7870.0050 0.525O.{)()(){) 0.035
25
20
15<:(~.Q
10
5
a0.00
Solution
We will first use Equation 14-11, the linearized formof Equation 14-10. Here, wc need to calculate II[L]and biM. The rcsulting spreadsheet is shown in Fig-ure 14-20. The value of K, determined by this methodis 96 and lie is 152. Ncxt we will use Excel's ~olver toobtain thc results for the nonlinear Equation [4-10.'9We start out with initial estimates of the parametersK, = 10 and tie = 50. As can be sccn in Figure 14-21a,the fit is not good with these values. Using the initialestimates we can calculate the values predicted by thcmodel and obtain the differences between the modeland the data values (residuals). Solver then minimizesthe sum of the squares of thc residuals to obtain thebest-fit values shown in Figure 14-21b. The fit is nowquite good, as seen in the plot. The nonlinear regres-sion parameters are K, = 97 and tie = 151.
y ~ O,0688x + 6.5855
R' ~ 0.9994
100.00
1/[L]
-=~--:::;~-~~l~==~-=-~-L- __ 1- _ -_j _
-- -f- - ~--- -t ---. -, - r---- 'T----
--1- + tCellD5~1fl35 , __ ~_ ~~ _ -_-::_~=-~=--I= -. ~~_,-=-_
•g:::~~:(~~E.FiQEP~~E.jO,5~D{Ol- =-r---. ~-=r---='=----r==.CeiiB33~SI,_~J~JE.s:~1_Q,D5p1()~_ __ j _CellB34~B32fB33 ,j ._ __ _ _CellB3S:::1f832'B31 1-- 1
FIGURE 14-20 Spreadsheet to calculate the formation constant of a complex from absor-bance data using a double reciprocal plot. Equation 14-10 is linearized by calculatln~ th~ t
' I' columns D and E The least-squares slope and ,ntercept are given In t e porec'proca Sin. I I t d 'n celis 834 and 835and in the cells below the plot. The parameters K, and .lE are ca cu a e I .
Extensions to Complicated Equilibria
Equation 14-10 can be modified to fit many othercases. It can bc extended to account for the formationof polynuclear complexes and for multiple equilibria.Ultraviolet and visible absorption spectroscopy is not,however, particularly well suited for multiple equilib-ria because of its lack of specificity and because eachadditional equilibrium adds two unknowns, a forma-tion constant term and a molar absorptivity term.
The introduction of array-detector spectrometricsystems has brought about several new data analysis
approaches. Instead of using data at only a singlewavelength. these approaches can simultaneously usedata at multiple wavelengths. With modern cumput-ers. equations similar to Equation 14-10 can be fitnearlv simultaneously at multiple wavclengths uSingcurv~-litling programs such as TableCurve (SvstatSoftwarc).
29FoT more information on nonlinear regression using Excel. <;cc S. RCrouch and F. J. Holler, Applicatiom of Mjcros()fr'~ Excel in Ana/vl/catChemistry, Chap. 13. Belmont, CA: Brooks/Cole, 2004.
If formation constants are known or detcrmined bythc above methods, several programs are available fordetermining the species composition at various con-centrations~ The programs HALTAFALL'u and

012
010
008
0.06
•00'
002
000ooסס0
~~~-_---1: 10
::,.~__ ~ 50~~heet DocumentationCell <;S;(AS-$A$l f)~-Cell 0548$34"8$35-$8$3'85/(1 +$6$34'85)CeIlE~~Cell F~:,~-- - ---+ -Cell F12=SUM(FS F10) ==t -Cell 834=lnlt!a1 esllmate or Solver result-Cell 83S=lnitial estimate or Solver result
(h)
FIGURE14-21 Spreadsheets to calculate formation constants using nonlinear regression(a)The results from the model (Equation 14-10) are calculated in column D using the initial·estimates of K, ~ 10 and 6.. = 50. The plot shows the model values (solid line)and the datavalues (points). The difference between the data values (column C) and the model values(column D)are the residuals shown in column E. The squares of these are calculated in columnF and summed Incell F12 (SSR). In (b), Excel's Solver has minimized the value in cell F12 toobtain the best-flt values shown in cells 834 and 835. The model values a . hthe solid line in the plot. re again s own as
COMICS" have been popular for many years for spe-CiatiOn 10 complex systems. These programs use theformation constants and mass-balance expressions to
calculate the species composition as a function of ini-tial concentrations. Several modern versions. includ-ing some that operate in the Windows environment.are availahle.
*Answers are provided at the end of the hook for problems marked with an asterisk
[i] Prohlems with this icon are hest solved using spreadsheets. .
*14-1 A 25.0-mL aliquot of an aqueous quinine solution was diluted to 50.0 mL andfound to have an absorhance of 0.656 at 3-lS nm when measured in a 2.50-cm cell.
A second 25.0-mL aliquot was mixed with 10.00 mL of a solution containing25.7 ppm of quinine; after dilution to 50.0 mL. this solution had an absorbanceof 0.976 (2.50-COlcell). Calculate the concentration of quinine in parts per million
in the sample.
*14-2 A 0.5990-g pesticide sample was decomposed by wet ashing and then diluted to200.0 mL in a volumetric flask. The analysis was completed by treating aliquots of
this solution as indicated.
Volume of SampleTaken, mL
Absorbance, A, 545 om(l.OlI-cm cells)
0.7230.917
Calculate the percentage of copper in the sample .
14-3 Sketch a photometric titration curve for the titration of SnH with MnO, . Whatcolor radiation should he used for this titration? Explain.
14-4 Iron(IIl) reacts with thiocyanate ion to form the red complex Fe(SCN) 2+. Sketcha photometric titration curve for Fe(III) with thiocyanate ion when a photometerwith a green filter is used to collect data. Why is a green filter used?
14-5 Ethylenediaminetetraacetic acid abstracts bismuth(IIl) from its thiourea complex:
Bi(tu)/' + H,Y'- ---> BiY- + 6tu + 2H+
where tu is the thiourea molecule (NHz),CS. Predict the shape of a photometrictitration curve based on this process, given that the Bi(III) or thiourea complexis the only species in the system that absorbs light at 465 nm, the wavelengthselected for the analysis.
*14-6 The accompanying data (l.OO-cm cells) were ohtained for the spectrophotometrictitration of 10.00 mL of Pd(I1) with 2.44 x 10-' M Nitroso R (0. W. Rollins andM. M. Oldham. Anal. Chern., 1971, 43, 262).
o0.1470.2710.375
Calculate the concentration of the Pd( II) solution, given that the ligand-to-cationratio in the colored product is 2: I
*14-7 A 3.65-g petroleum specimen was decomposed by wet ashing and subsequentlydiluted to 500 mL in a volumetric flask. Cobalt was determined hy treating25.00-mL aliquots of this diluted solution as follows:
20.0020.00
0.276O~91

Assume that the Co(II)-ligand chelate obeys Beer's law, and calculate the per-centage of cohalt in the original sample.
*14·8 A simultaneous detcrmination for cohalt and nickel can he hased on absorptionby their respective 8-hydroxyquinolinol complexes. Molar absorptivities corre-sponding to their absorption maxima arc as follows:
428.Y10.2
Calculate the molar concentration of nickel and cohalt in each of the followingsolutions using the following data:
0.426
0.7920.0260.081
*14·9 When measured with a 1.00-cm cell, a 7.50 X 10⁵ M solution of species A ~xhib-ited absorhances of 0.155 and 0.755 at 475 and 700 nm, respectively. A 4.25 x10 ) M solution of species B gave absorbanees of 0.702 and 0.091 under the samecircumstances. Calculate the concentrations of A and B in solutions that yieldedthe following absorbance data in a 2.50-em cell: (a) 0.439 at 475 nm and 1.025 at700 nm; (b) 0.662 at 475 nm and 0.815 at 700 nm.
*14-10 The acid-base indicator Hln undergoes the following reaction in dilute aqueoussolution:
The following absorbance data were ohtained for a 5.00 X IW' M solution ofHIn in 0.1 M NaOH and 0.1 M HCI. Measurements were made at wavelengths of485 nm and 625 nm with 1.00·cm cells.
0.1 MNaOH
0.1 MHCI
Am = 0.075A.S) = 0.487
A62; = 0.904
A62j = 0.181
[n the NaOH solution, essentially all of the indicator is present as In ; in theacidic solution, it is essentiallv all in the form of HIn.(a) Calculate molar absorpti~ities for In - and HIn at 485 and 625 nm.(h) Calculate the acid dissociation constant for the indicator if a pH 5.00 buffer
containing a small amount of the indicator exhibits an absorbance of 0.567 at.+85nm and 0.395 at 625 nm (1.00-cm cells).
(c) What is the pH of a solution containing a small amount of the indicator thatexhihits an absorbance of 0.492 at 485 nm and 0.2'+5 at 635 nm (l.OO-cmcells)'!
(d) A 25.00-mL aliquot of a solution of purified weak organic acid HX requiredexactly 2.+.20mL of a standard solution of a strong hase to reach a phenol-phthalein end point. When exactly 12.10 mL of the hase was added to a sec-
ond 25.00-mL aliquot of the acid, which contained a small amount of the indi-cator under consideration, the absorbance was found to be 0.333 at 485 nmand 0.655 at 625 nm (I.OO-cmcells). Calculate the pH of the solution and K,
for the weak acid.(e) What would be the absorhance o[ a solution at 485 and 625 nm (1.50-cm
cells) that was 2.00 x 10-' M in the indicator and was buffered to a pH of6.000"
A standard solution was put through appropriate dilutions to give the concentra-tions of iron shown helow. The iron(I1)-1,IO,phenanthroline complex was thenformed in 25.0·mL aliquots of these solutions, following whieh each was dilutedto 50.0 mL. The following absorbances (1.00-cm cells) were recorded at510 nm:
Fe(lI) Concentration inOriginal Solutions, ppm
4.0010.016.024.032.040.0
0.1600.3YO0.6300.Y501.2601.580
(a) Plot a calibration eurve from these data.(b) Use the method of least squares to find an equation relating absorbance and
the concentration of iron(II).(c) Calculate the standard deviation of the slope and intercept.
14.U The method developed in Problem 14-11 was used for the routine detcrminationof iron in 25.0-mL aliquots of groundwater. Express the concentration (as ppmFe) in samples that yielded the accompanying absorbance data (1.00-cm cell).Calculate the relative standard deviation of the result. Repeat the calculationassuming the absorbance data are means of three measurements.(a) 0.143 (c) 0.068 (e) 1.512(b) 0.675 (d) 1.009 (f) 0.546
Copper(II) forms a 1: 1 complcx with the organic complexing agent R in acidicmedium. The formation of the complex can be monitored by spectrophotometryat 480 nm. Use the following data collected under pseudo-first-order conditionsto construct a calibration curve of rate versus concentration of R. Find the con-centration of copper(Il) in an unknown whose rate under the same conditionswas 6.2 x 1O-'As-1
3.6 X 10'5.4 X 10-'7.Y X 10-3
1.03 x 10 '
*14-14 Aluminum forms a I: I complex with 2-hydroxy-l·naphthaldehyde p-methoxy-henzovlhvdraxonal. which absorbs UV radiation at 285 nm. Under pseudo-first-order ~o~ditions, a plot of the initial rate of the reaction (absorbance units per
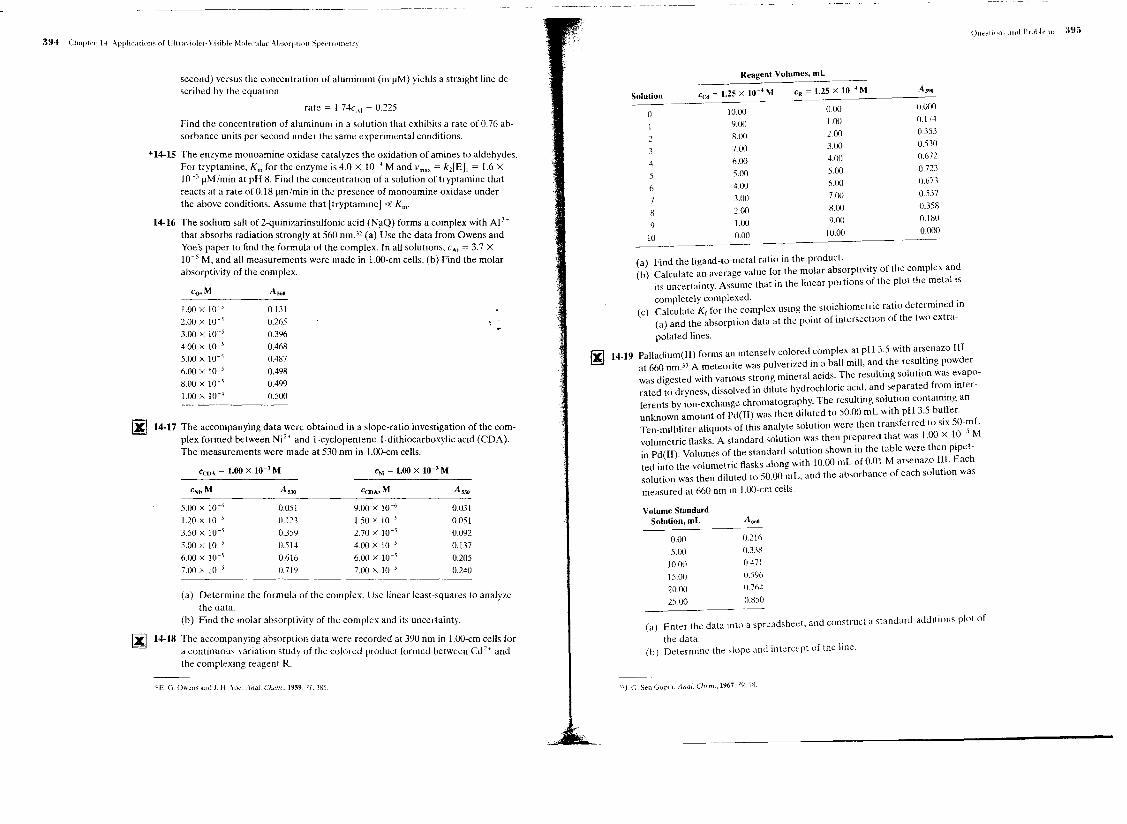
second) versus the concentration of aluminum (in J.lM)yields a straight line de-scribed by the equation
rate = 1.74c" - 0.225
Find the concentration of aluminum in a solution that exhibits a rate of 0.76 ab-sorbance units per second under the same experimental conditions.
*14-15 The enzyme monoamine oxidase catalyzes the oxidation of amines to aldehydes.For tryptamine, Km for the enzyme is 4.0 x to-' M and "m" = k,[EJo = 1.6 x10-' J.lM/min at pH 8. Find the concentration of a solution of tryptamine thatreacts at a rate of 0.18 J.lm/min in the presence of monoamine oxidase underthe above conditions. Assume that [tryptamine] <'! Km.
14-16 The sodium salt of 2-quinizarinsulfonic acid (NaQ) forms a complex with Al'+that absorbs radiation strongly at 560 nm." (a) Use the data from Owens andYoe's paper to find the formula of the complex. In all solutions, CAI = 3.7 X
10-5 M, and all measurements were made in 1,00-cm cells. (b) Find the molarabsorptivity of the complex.
cQ,M
1.00 x 10⁻⁵
2.00 X 10⁻⁵
3.00 X 10⁻⁵
4.00 X 10⁻⁵
5.00 X 10⁻⁵
6.00 X 10⁻⁵
8.00 X 10⁻⁵
1.00 X 10⁻⁴
01310.2650.3960.468
0.4870.4980.4990.500
14-17 The accompanying data were obtained in a slope-ratio investigation of the com-plex formed between Ni" and l-eyclopentene-l-dithiocarboxylie acid (CDA).The measurements were made at 530 nm in 1,00-cm cells.
CCDA ~ 1.00 X 10-' M CN, ~ 1.00 X 10-' M
CNi,M AsJO CCDMM AsJO
5.00 x 10⁻⁶ 0.051 9.00 x 10⁻⁶ 0.0311.20 x 10-5 0.123 1.50 x 10-' 0.0513.50 x 10-5 0.359 2.70 x 10⁻⁵ 0.0925.00 x 10-' 0.514 4.00 x 10-' 0.1376.00 x 10-5 0.616 6.00 x 10⁻⁵ 0.2057.00 x 10-5 0.719 7.00 x 10⁻⁵ 0.240
(a) Determine the formula of the complex. Use linear least-squares to analyzethe data.
(b) Find the molar absorptivity of the complex and its uncertainty.
The accompanying absorption data were recorded at 390 nm in 1.00-cm cells fora continuous-variation study of the colored product formed between Cd'+ andthe eomplexing reagent R.
Reagent Vulumes, mL
CCd = 1.25 x 10-' M c. ~ 1.25 x 10 'M A,<JOSolution
\0.00 000 o.om0
9.00 I.()() 0.1741
8.m 2.00 0.353
7(J() 3.00 0.530
6.00 4.00 0.6724
5.00 5.00 0.723
4.00 6.00 0.6736
3.00 7.00 0.5377
2.00 8m 0.3588
1.00 9.00 0.1809
0.00 10.00 0.00010
(a) Find the ligand-to-metal ratio in the prodUCt.(b) Calculate an average value for the molar absorptivity of the complex and
its uncertainty. Assume that in the linear portions of the plot the metal IS
completely complexed. ..... .(c) Calculate K
ffor the complex using the stOlchlomctnc ratIO determmed m
(a) and the absorption data at the point of intersectIon of the two extra-
polated lines.
'Xl 14-19 Palladium(II) forms an intensely colored complex at pH 3.5 with arsenazo III~ at 660 nm.33 A meteorite was pulverized in a ball mill, and the resultmg powder
was digested with various strong mineral acids. The resultmg solutIon was evapo-rated to dryness, dissolved in dilute hydrochloric acid, and separated from mter-ferents by ion-exchange chromatography. The resulting solutton contamm,g anunknown amount of Pd(lI) was then diluted to 50.00 mL With pH 3.5 buffer.Ten-milliliter aliquots of this analyte solution were then transferred to SIX50~~Lvolumetric flasks. A standard solution was then prepared that was 1.00 X 10 t Min Pd(II). Volumes of the standard solution shown in the table were then pIpe -ted into the volumetric flasks along with 10.00 mL of 0.01 M arsenazo III. Eachsolution was then diluted to 50.00 mL, and the absorbance of each solution wasmeasured at 660 nm in I.oo-cm cells.
Volnme StandardSolution, mL Ab60
0.005.00
\0.00
15.0020.0025.00
0.2160.33S0.471
0.5960.7640.S50
Enter the data into a spreadsheet. and construct a standard-additions plot of
the data.Determine the slupe and intercept of the line.

(c) Determine the standard dcviation of the slope and of the intercept.(d) Calculate the concentration of Pd(II) in the analne solution.(e) Find the standard deviation of the measured con·centration.
14-20 Given the information that
Fe3+ + y4- ~ FeY- K, = 1.0 X 10"
Cu" + y4- ~ CuY'- K, = 6.3 X 10¹⁸
and the further information that, among the several reactants and products,only Cuy2
- absorbs radiation at 750 nm, describe how Cu(II) could be usedas an indicator for the photometric titration of Fe(III) with H, Y 2 • Reaction:Fe3+ + H,y2- -> FeY + 21r.
*14-21 The chelate CuA,2- exhibits maximum absorption at 480 nm. When the chelat-ing reagent is present in at least a tenfold excess, the absorbance depends onlyon the analytical concentration of Cu(I1) and conforms to Beer's law over a widerange. A solution in which the analytical concentration of Cu IT is 2.15 X 10⁻⁴ Mand that for A 2- is 9.00 X 10³ M has an absorbance of 0.759 when measuredin a 1.00-cm cell at 480 nm. A solution in which the analytical concentrationsof Cu" and A ,- are 2.15 X 10⁻⁴ M and 4.00 X 10⁻⁴ M, respectively, has anabsorbance of 0.654 when measured under the same conditions. Use thi~ i'ofor-mation to calculate the forma lion constant K, for the process .
CulT + 2A2- ~ CuA2'-
*14-22 Mixing the chelating reagent B with Ni(I1) forms the highly colored NiB,'+,whose solutions obey Beer's law at 395 nm over a wide range. Provided the ana-lytical concentration of the ehelating reagent exceeds that of Ni(ll) bv a factorof 5 (or more), the cation exists, within the limits of observation, enti~ely in theform of the complex. Use the accompanying data to evaluate the formation con-stant K, for the process
2.00 X t04
2.00 x to '2.20 x Hf [1.50 x to ]
0.8440.316
To determine the formation constant of a I: 1 complex. the absorbances belowwere measured at 470 nm in a 2.50-cm cell for the ligand concentrations shown.The total metal concentration was CM = 7.50 X 10 4 M.
ILI,M A
0.0750 0.6790.0500 0.6640.0300 0.63'1OIJ200 0.6030.0100 0.524O.!lO'1O 0.42t00000 0.0'16
(a) Use linear regression and the Benesi-Hildebrand equation (Equation 14·11)to determine the formation constant and the difference in molar absorptivi-ties at 470 nm.
(b) Use nonlinear regression and Equation 14-10 to find the values of K, and j.e.Start with initial estimates of K, = 50 and j.e = 50.
Challenge Problem
14-24 (a) Prove mathematically that the peak in a continuous-variations plot occurs ata combining ratio that gives the complcx composition.
(b) Show that the overall formation constant for the complex MI." is
Kr=[C" -
where A is the experimental absorbance at a given value on the x-axis in acontinuous-variations plot, A"" is the absorbance determined from theextrapolated lines corresponding to the same point on the x-axis, eM is themolar analytical concentration of the metal, cL is the molar analytical con-centration of the ligand, and n is the ligand-to-metal ratio in the complex.'"Under what assumptions is the equation valid?What is c?Discuss the implications of the occurrence of the maximum in a continuous-variations plot at a value of less than OSCalabrese and Khan 35 characterized the complex formed between [, and [-using the method of continuous variations. They combined 2.60 X 10⁻⁴ Msolutions of [, and 1- in the usual way to obtain the following data set. Usethe data to find the composition of the [,11- complex.
0.00l.(lO
2.tlO3.004.00'1.<Xl
6.007.00S.OO9.lXl
10.00
0.0020.1210.2t40.2790.312
03250.301O.2'1R
0.l8RO.tOO0.00]
(g) The continuous-variations plot appears to be asymmetrical. Consult thepaper by Calabrese and Khan and explain this asymmetry.
(h) Use the equation in part (a) to determine the formation constant of the com-plex for each of the three central points on the continuous-variations plot.

(i) Explain any trend in the three values of the formation constant in terms ofthe asymmetry of the plot.
(j) Find the uncertainty in the formation constant determined bv this method.(k) What effect, if any. does the formation constant have on the ~bilitv to deter-
mine the composition of the complex using the method of contin~ousvariations"!
(I) Discuss the various advantages and potential pitfalls of using the method ofcontinuous variations as a general method for determining the compositionand formation constant of a complex compound.
MolecularLuminescenceSpectrometry
T...hree related types of optical methods areconsidered in this chapter: molecular
. fluorescence, phosphorescence, andchemiluminescence. In each of these methods, mol-
ecules of the analyte are excited to produce a spe-
cies whose emission spectrum provides informationfor qualitative or quantitative analxsis. The meth-
ods are known collectivelx as molecular lumines-
cence procedures.
r::;:'I Throughout this chapter, this logo indicates~ an opportunity for online self-study at www.thomsonedu.com/chemistry/skoog, linking you tointeractive tutorials, simulations, and exercises.
Fluorescence and phosphorescence are alike in thatexcitation is brought about by absorption of photons.As a consequence. the two phenomena are often re-ferred to by the more general termphotolwnincscence.As will be shown in this chapter. fluorescence differsfrom phosphorescence in that the electronic energytransitions responsible for fluorescence do not involvea change in electron spin. Because of this, the ex-cited states involved in fluorescence are short-lived«10-' s). In contrast. a change in electron spin ac-companies phosphorescence, and the lifetimes of theexcited states are much longer. often on the order ofseconds or even minutes .. In most instances, photo-luminescence. be it fluorescence or phosphorescence,occurs at wavelengths longer than that of the excitationradiation.
The third type of luminescence, chemiluminescence,is based on the emission of radiation by an excited spe-cies formed during a chemical reaction. In some in-stances, the excited species is the product of a reactionbetween the analyte and a suitable reagent (usually astrong oxidant such as ozone or hydrogen peroxide).The result is an emission spectrum characteristic of theoxidation product of the analyte or the reagent ratherthan the analyte itself. In other instances, the analyte isnot directly involved in the chemiluminescence reac-tion. Instead, the analyte inhibits or has a catalytic ef-fect on a chemiluminescence reaction.
Measurement of the intensity of photoluminescenceor chemiluminescence permits the quantitative deter-mination of a variety of important inorganic and or-ganic species in trace amounts. Currently, the numberof f1uorometric methods is far greater than the numberof applications of phosphorescence and chemilumines-cence procedures.
One of the most attractive features of luminescencemethods is their inherent sensitivity, with detection lim-its that are often one to three orders of magnitude lowerthan those encountered in absorption spectroscopy.In fact, for selected species under controlled condi-tions, single molecules have been detected by tluores-cence spectroscopy. Another advantage of photolumi-nescence methods is their large linear concentrationranges, which also are often significantly greater thanthose encountered in absorption methods. Because ex-cited states are quite susceptible to being deactivated bycollisions and other processes. many molecules do notfluoresce or phosphoresce at all. Because of such de-activation processes. quantitative luminescence meth-ods are often subject to serious interference effects.

For this reason luminescence measurements are oftencomhined with such separation techniques as chro-matography and electrophoresis. Fluorescence detec-tors are particularly valuahle as detectors for liquidchromatography (Chapter 2S) and capillary eleetro-phuresis (Chapter 30).
Generally, luminescence methods are less widelyapplicable for quantitative analyses than are ahsorp-tion methods hecause many more species ahsurb ul-traviulet and visible radiation than exhibit photolumi-nescence when radiation is absorbed in this region ofthe spectrum.'
15A THEORY OF FLUORESCENCEAND PHOSPHORESCENCE
Fluorescence occurs in simple as well as in complexgaseous, liquid, and solid chemical svstems. The sim-plest kind of fluorescence is that exhibited by diluteatomic vapors, which was described in Chapter 9. Forexample. the 1s electrons of vaporized sodium atomscan be excited to the 3p state by absorption of radia-tion of wavelengths 5S9.6 and 589.0 nm. After about10 's. the e1ect;ons return to the ground state and inso doing emit radiation of the same two wavelengthsin all directions. This type of fluorescence, in whichthe ahsorbed radiation is reemitted without a changein fre4uency, is known as resonance radiation or reso-natlce fluorescence.
Many molecular species also exhihit resonancefluorescence. Much more often, however. molecularfluorescence (or phosphorescence) hands center atwavelengths longer than the resonance line. This shifttoward longer wavelengths is termed the Stokes shift(see Section 6e-6).
15A-1 Excited States ProducingFluorescence and Phosphorescence
The characteristics of fluorescence and phospho-rescence spectra can he rationalized bv means of themolecular orhital considerations described in Sec-
F\lr further dhL'\I\SILln of Ill..: theory and applications uf ftuOfL'SCen..:e
l'h(J.;,phort>..:cnc<;'. ~nd luminc\cL'nct'. see J. R LakowiC7, Principks of
r!U(If<;,SCCIlCc Sr~etrd"Cl)p\. ~nd ed .. New York: Kluwcr Academic Puo-ilshin!! I'knurn Pft"';_ I t}lN: .\folec/llar 1,lImitl('scenn' Speetro5l"opy.S Schulrn,m . .;:J ,'t·v. )ilrk: \\'iJt'\. Part I. It)K~: Part 2. 14AA: Part 3.194-':
L I Wchr~. It1 Pin lit/It ,\lerhod\ of Chemwn. ~nJ ed.. \'olume \"IH.Char· .;. B. \\" R(h\ilt:r anJ R. (' Baetzol,t L'ds .. NeW York: \Viky. 1943;(j. Ci (jutlhdull l'r,l<t[nd Fll/orn,enC/:. 2nd ed .. Nt:'v. York: \'1drcd/),-,kkcf I'lLfj)
tion I-IB-1. However, an understanding uf the differ-ence hetween the two photoluminescence phenomenarequires a review of electron spin and the differencesbetween singlet and triplet excited states.
Electron Spin
The Pauli exclusion principle states that no two elec-trons in an atom can have the same set of four quan-tum numbers. This restriction requires that no morethan two electrons occupy an orbital and furthermorethe two have opposed spin states. Under this circum-stance, the spins are said to be paired. Bccause of spinpairing, most molecules exhibit no net magnetic fieldand are thus said to be diamagnetic - that is. they areneither attracted nor repelled by static magnetic fields.In contrast, free radicals. which contain unpaired elec-trons, have a magnetic moment and consequently areattracted by a magnetic field. Free radicals are thussaid to be paramagnetic.
Singlet and Triplet Excited States
A molecular electronic state in which all electro~ spinsare paired is called a singlet state, and no splitting ofelectronic energy levels Occurs when the molecule isexposed to a magnetic field. The ground state for a freeradical. on the other hand, is a doublet state becausethere are two possible orientations for the odd elec-tron in a magnetic field, and each imparts slightly dif-ferent energies to the system.
When one of a pair of electrons of a molecule is ex-cited to a higher energy level. a singlet or a triplet state isformed. In the excited singlet state, the spin of thepromoted electron is still paired with the ground-stateelectron. In the triplet state, however, the spins of thetwo electrons have become unpaired and are thus par-allel. These states can be represented as in Figure 15-1,where the arrows represent the direction of spin. Thenomenclature of singlet, doublet, and triplet derivesfrom spectroscopic multiplicity considerations, whichneed not concern us here. Note that the excited tripletstate is less energetic than the corresponding excitedsinglet state.
The properties of a molecule in the excited tripletstate differ significantlv from those of the excited sin-glet statc. For example. a molecule is paramagnetic inthe triplet state and diamagnetic in the singlet. Moreimportant. howcver. is that a singlet-to-triplet transi-tion (or the reverse), which also Illvolves a change inelectronic state, is a significantly less prohahle eventthan the corresponding singlet-to-singlet transition. As
~
1l~1-Ground
singlet stat~
{al
Excitedsingle! state
(b,
Ex(itedtriplet state
h:j
FIGURE 15-1 Electronic spin states of molecules. In (a)the ground electronic state is shown. In the lowest energy.or ground, state, the spins are always paired, and thestate is said to be a singlet state. In (b) and (c), excitedelectronic states are shown. If the spins remain pairedin the excited state, the molecule is in an excited singletstate (b). If the spins become unpaired, the molecule isin an excited triplet state (c).
a consequence, the average lifetime of an excited trip-let state may range from 10-' to several seconds, com-pared with an average lifetime of -~10-8 s for an ex-cited singlet state. Furthermore, radiation-induccd
excitation uf a ground-state Illolecuk to an excitedtriplet state has a low probability of occurring. and ab-sorption bands due to this process are sevcral ordersof magnitude less intense than the analogous singlet-to-singlet absorption. We shall see. however. that anexcited triplet state can be populated from an excitedsinglet state of certain molecules. Phosphorescenceemission is often a result of such a process.
Energy-Level Diagrams forPhotoluminescent MoleculesFigure 15-2 is a partial energy-level diagram, calleda Jablonski diagram. for a typical photoluminescentmolecule. The lowest heavy horizontal line representsthe ground-state energy of the molecule. which is nor-mally a singlet state, and is labeled SII' At room tem-perature. this state represents the energies of most ofthe molecules in a solution.
The upper heavy lines arc energy levels for theground vibrational states of three excited electronicstates. The two lines on the left represent the first (S,)and second (5,) electronic singlet states. The one onthe right (Td represents the energy of the first elec-tronic triplet state. As is normally the case, the energy
vL-~~~-----~T,
IiIIIt
I I I I IPhosphorescenceI t I I II I I I II I I I It I I I II I I I II I I I I
: : : I=1>1 •
•

of the first excited triplet state is lower than the energyof the corresponding singlet state.
Numerous vibrational energy levels are associatedwith each of the four electronic states. as suggested bythe lighter horizontal lines. As shown in Figure 15-2.absorption transitions can occur from the ground sin·glet electronic state (50) to various vibrational levels ofthe excited singlet electronic states (51 and 5,). Notethat direct excitation to the triplet state is not shown.Because this transition involves a change in multiplic.ity. it has a very low probability of occurrence. A low.probability transition of this type is called a forbiddentransition.
Molecules excited to electronic states 51 and 5,rapidly lose any excess vibrational energy and relaxto the ground vibrational level of that electronic state.This non radiational process is termed vibrationalrelaxation.
15A·2 Rates of Absorption and Emission
The rate of photon absorption is very rapid and takesplace in about 10"14 to 10-15 s. Fluorescence emission.on the other hand, occurs at a significantly slower rate.Typically. fluorescence occurs in 10-5 to 10-10 s. As wehave noted, the average rate of a triplet-to-singlet tran-sition is less than that of a corresponding singlet-to-singlet transition. Thus, phosphorescence emission re-quires 10-4 to 10 s or more to occur.
An excited molecule can return to its ground state bya combination of several mechanistic steps. As shownby the straight, downward pointing, vertical arrows inFigure 15-2, two of these steps, fluorescence and phos-phorescence. involve the emission of a photon of radi-ation. The other deactivation steps, indicated by wavyarrows, arc radiationless processes. The favored routeto the ground state is the one that minimizes the life-time of the excited state. Thus. if deactivation by fluo-rcscence is rapid with respect to the radiationless pro.ccsses. such emission is observed. On the other hand,if a radiationless path has a more favorable rate con.stant, fluorescence is either ahsent or less intense.
Photoluminescence is limited to systems incorpo.rating structural and environmental features thatcause the rate of radiationless relaxation or deactiva-tion processes to he slowed to a point where the emis·sion process can compete kinetically. We have a goodquantitative understanding of luminescence processes.
However, we arc only heginning to understand deacti.vation processes in any detail.
Vibrational Relaxation
As shown in Figure 15-2, a molecule may be promotedto any of several vibrational levels during the elec-tronic excitation process. Collisions hetween mole-cules of the excited species and those of the solventlead to rapid energy transfer with a minuscule increasein temperature of the solvent. Vibrational relaxation isso efficient that the average lifetime of a vibrationallvexcited molecule is 10' 12 S or less, a period significantl~shorter than the average lifetime of an electronicallyexcited state. As a consequence. fluorescence fromsolution always involves a transition from the lowestvibrational level of an excited electronic state. Severalclosely spaced emission lines are produced, however,and the transition can terminate in any of the vibra-tionallevels of the ground state (see Figure 15-2).
A consequence of the efficiency of vibratiOIial re-laxation is that the fluorescence band for a givbrelec-tronic transition is displaced toward lower frequenciesor longer wavelengths from the absorption band (theStokes shift). Overlap occurs only for the resonancepeak involving transitions hetween the lowest vihra-tionallevel of the ground state and the correspondinglevel of an excited state. In Figure 15-2, the wavelengthof absorbed radiation that produces the resonancepeak A, is labeled A;.
Internal Conversion
The term internal conversion describes intermolecu-lar processes by which a molecule passes to a lower-energy electronic state without emission of radiation.These processes are neither well defined nor well un-derstood, but they are often highly efficient.
Internal conversion is a crossover between twostatesofthe same multiplicity (singlet-singlet or triplet-triplet). It is particularly efficient when two electronicenergy levels are sufficiently close for there to he anoverlap in vibrational energy levels. This situation is il-lustrated in Figure 15-2 for the two excited singletstates 5, and 51' At the overlaps shown. the potential en-ergies of the two excited states arc essentially equal.which permits an efficient crossover from 5, to 5 l' In-ternal conversion can also occur betwee~ state 5,and the ground electronic state 5". Internal conversionthrough overlapping vibrational levels is usuallv moreprobable than the loss of energy hy fluorescen~ froma higher excited state. Thus. referring again to Figure15-2, excitation by the band of radiation labeled'\', usu-
.-4;.
ally produces a fluorescence band centered at wave-length A] to the exclusion of a band that would resultfrom a transition between 5, and 50' Here, the excitedmolecule proceeds from the higher electronic state tothe lowest vibrational state of the lower electronic ex-cited state via a series of vibrational relaxations, an in-ternal conversion. and then further relaxations. Underthese circumstances, the fluorescence occurs at A] only,regardless of whether radiation of wavelcngth A, or A,was responsible for the excitation. Quinine providesa classical example of this type of behavior (see Proh-lem 15-13). This naturally occurring substance pos-sesses two analytically useful excitation bands, onc cen·tered at 250 nm and the other at 350 nm. Regardless ofwhich wavelcngth is used to excite the molecule. how-ever, the wavelength of maximum emission is 450 nm(see Figure 15-3).
The mechanisms of the internal conversion process51 -+ 50 shown in Figure J 5-2 are not totally under-stood. For some molecules, thc vibrational levels of theground state overlap those of the first excited electronicstate, and deactivation occurs rapidly by the mechanismjust described. This situation prevails with aliphaticcompounds. for example, and accounts for these spe-cies seldom fluorescing. With such compounds, deacti-vation by energy transfer through overlapping vihra-tionallevels occurs so rapidly that fluorescence does nothave time to occur.
Internal conversion may also result in the phenom-enon of predissociatiofl. Here, the electron moves from
000 FIGURE 15-3 Fluorescence excitation andemission spectra for a solution of quinine.
a higher electronic state to an upper vibrational levelof a lower electronic state in which the vihrational en-ergy is great enough to cause rupture of a hond. Largemolecules have an appreciable probability for the exis-tence of bonds with strengths less than the electronicexcitation energy of the chromophores. Rupture ofthese bonds can occur as a consequence of absorptionhy the chromophore followed by internal conversionof the electronic energy to vibrational energy associ-ated with the weak hond.
Predissociation should be differentiated from disso·ciation, in which the absorhed radiation directly ex-cites the electron of a chromophore to a sufficientlyhigh vibrational level to cause rupture of the chromo-phoric bond. In this case, no internal conversion is in-volved. Dissociation processes also compete with thefluorescence process.
External Conversion
Deactivation of an excited electronic state may involveinteraction and energy transfer between the excitedmolecule and the solvent or other solutes. This processis called external conversion. Evidence for external con·version includes a marked solvent effect on the fluo-rescence intensity of most species. Furthermore. thoseconditions that tend to reduce the number of colli-sions hetween particles (low temperature and high vis-cosity) generally lead to enhanced fluorescence. Thedetails of external conversion processes are not wellunderstood.
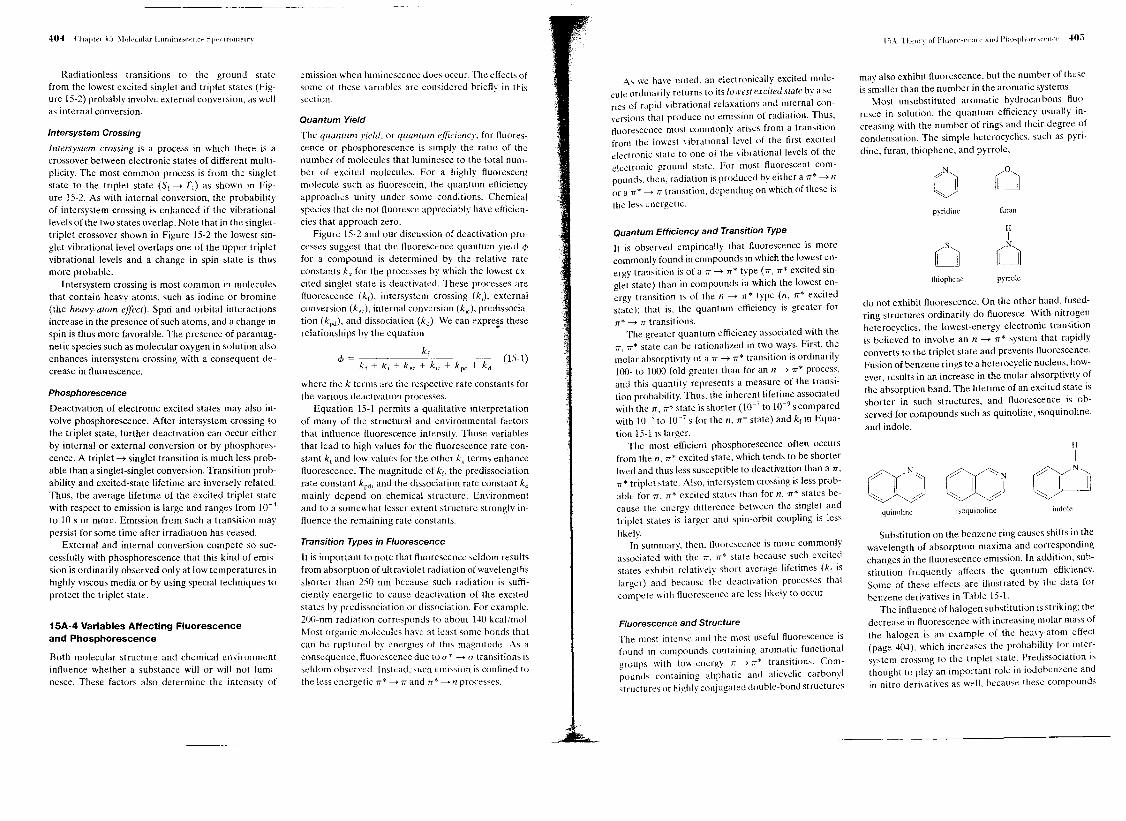
Radiationless transitions to the ground statefrom the lowest excited singlet and triplet statcs (Fig-ure IS-2) probably involve external conversion, as wellas internal conversion.
Intersystem Crossing
Intersystem crossing is a process in which there is acrossover between electronic states of different multi-plicity. The most common process is from the singletstate to the triplet state (51 -> T,) as shown in Fig-ure IS-2, As with internal conversion, the probabilityof intersystem crossing is enhanced if the vibrationallevels of the two states overlap. Note that in the singlet-triplet crossover shown in Figure 1S-2 the lowest sin-glet vibrational level overlaps one of the upper tripletvibrational levels and a change in spin state is thusmore probable,
Intersystem crossing is most common in moleculesthat contain heavy atoms, such as iodine or bromine(the heavy-atom effect), Spin and orbital interactionsincrease in the presence of such atoms, and a change inspin is thus more favorable, The presence of paramag-netic species such as molecular oxygen in solution alsoenhances intersystem crossing with a consequent de-crease in fluorescence,
Phosphorescence
Deactivation of electronic excited states may also in-volve phosphorescence, After intersystem crossing tothe triplet state, further deactivation can occur eitherby internal or external conversion or by phosphores-cence, A triplet -> singlet transition is much less prob-able than a singlet-singlet conversion, Transition prob-ability and excited-state lifetime are inversely related.Thus, the average lifetime of the excited triplet statewith respect to emission is large and ranges from 10'4to 10 s or more. Emission from such a transition maypersist for some time after irradiation has ceased.
External and internal conversion compete so suc-cessfully with phosphorescence that this kind of emis-sion is ordinarily observed only at low temperatures inhighly viscous media or by using special techniques toprotect the triplet state.
15A-4 Variables Affecting Fluorescenceand Phosphorescence
Both molecular structure and chemical environmentinfluence whether a substance will or will not lumi-nesce. These factors also determine the intensity of
emission when luminescence does occur, The effects ofsome of these variables arc considered briefly in thissection.
Quantum Yield
The qllalllilm yield, or quantum efficiency, for fluores-cence or phosphorescence is simply the ratio of thenumber of molecules that luminesce to the total num-ber of excited molecules. For a highly fluorescentmolecule such as fluorescein, the quantum efficiencyapproaches unity under some conditions. Chemicalspecies that do not fluorescc appreciably have efficien-cies that approach zero.
Figurc IS-2 and our discussion of deactivation pro-cesses suggest that the fluorescence quantum yield '"for a compound is determined by the relative rateconstants k, for the processes by which the lowest ex-cited singlet state is deactivatcd. These processes arefluorescence (k,), intersystem crossing (k;). externalconversion (kee), internal conversion (ki,), predissocia-tion (kpd), and dissociation (kd). We can expre~s theserelationships by the equation
k'" =. t (IS-I)kf + ki + kec + kic + kpd + kd
where the k terms are the respective rate constants forthe various deactivation processes.
Equation IS- I permits a qualitative interpretationof many of the structural and environmental factorsthat inlluence fluorescence intensity. Those variablesthat lead to high values for the fluorescence rate con-stant k, and low values for the other kx terms enhancelluorescence. The magnitude of k" the predissociationrate constant kpd, and the dissociation rate constant kd
mainly depend on chemical structure. Environmentand to a somewhat lesser extent structure strongly in-lluence the remaining rate constants.
Transition Types in Fluorescence
It is important to note that fluorescence seldom resultsfrom absorption of ultraviolet radiation of wavelengthsshorter than 2S0 nm because such radiation is suffi-ciently energetic to cause deactivation of the excitedstates by predissociation or dissociation. For example,200-nm radiation corresponds to about 140 kcallmol.Most organic molecules have at least some honds thatcan be ruptured by energies of this magnitude. As aconsequence, fluorescence due to u* ~ if transitions isseldom observed. Instead. such emission is confined tothe less energetic 17* ~ iT and rr* --+ n processes.
As we havc noted, an electronically excited mole-cule ordinarily returns to its lowest excited state by a se-ries of rapid vibrational relaxations and internal con-versions that produce no emission of radiation. Thus,fluorescence most commonly arises from a transitionfrom the lowest vibrational level of the first excitedelectronic state to one of the vibrational levels of theelectronic ground state. For most fluorescent com-pounds. then, radiation is produced by either a 1T* -> nor a 1T* -> 1T transition, depending on which of these IS
the less energetic.
Quantum Efficiency and Transition Type
It is observed empirically that fluorescence is morecommonly found in compounds in which the lowest en-ergy transition is of a 1T -> 1T* type (1T, 1T* excited sin-glet state) than in compounds in which the lowest en-ergy transition is of the n -> 1T* type (n, 1T* eXCitedstate): that is, the quantum efficiency is greater for1T* ~ 1T transitions.
The greater quantum efficiency associated with the1T. 1T* state can be rationalized in two ways. First, themolar absorptivity of a 1T -> 1T* transition is ordinarily100- to WOO-foldgreater than for an n -> 1T* process,and this quantity represents a measure of the transi-tion probability. Thus, the inherent lifetime associatedwith the 1T, 1T* state is shorter (10'7 to 10-9 s comparedwith lO S to 10-7 s for the n, 1T* state) and k, in Equa-tion IS- I is larger.
The most efficient phosphorescence often occursfrom the n, 1T* excited state, which tends to be shorterlived and thus less susceptible to deactivation than a 1T,
1T* triplet state. Also. intersystem crossing is less prob-able for 1T. 1T* excited states than for n, 1T* states be-cause the energy dilIerence between the singlet andtriplet states is larger and spin-orbit coupling is lesslikelv.
It; summarv, then. fluorescence is more commonlyassociated wi(h the 1T, 1T* state because such excitedstates exhibit relatively short average lifetimes (k, islarger) and because the deactivation processes thatcompete with lluorescence are less likely to occur.
Fluorescence and Structure
The most intense and the most useful fluorescence isfound in compounds containing aromatic functionalgroups with low-energy r. ---7 7T* transitions. Com-pounds containing aliphatic and alicyclic carbonylstructures or highly conjugated double-bond structures
may also exhibit fluorescence, but the number of theseis smaller than the number in the aromatic systems.
Most unsubstituted aromatic hydrocarbons fluo-resce in solution, the quantum efficiency usually in-creasing with the number of rings and their degree ofcondensation. The simple heterocyclics, such as pyri-dine, furan, thiophene, and pyrrole,
0 0
0pyridine furan
HI
s N
0 0thiophene pyrrole
do not exhibit fluorescence. On the other hand, fused-ring structures ordinarily do fluoresce. With nitrogenheterocyclics, the lowest -energy electronic transitionis believed to involve an n -> 1T* system that rapidlyconverts to the triplet state and prevents fluorescence.Fusion of benzene rings to a hcterocyclic nucleus, how-ever, results in an increase in the molar absorptivity ofthe absorption band. The lifetime of an excited state isshorter in such structures, and fluorescence is ob-served for compounds such as quinoline, isoquinoline,and indole.
H
I
COSubstitution on the benzene ring causes shifts in the
wavelength of absorption maxima and correspondingchanges in the fluorescence emission. In addition, sub-stitution frequently alIects the quantum efficiency_Some of these effects are illustrated by the data forbenzene derivatives in Table IS-I.
The influence of halogen substitution is striking: thedecrease in fluorescence with increasing molar mass ofthe halogen is an example of the heavy-atom effect(page 404), which increases the probability for inter-system crossing to the triplet state. Predissociation IS
thought to play an important role in iodobenzene andin nitro derivatives as well, because these compounds

The fluorescence of a molecule is decreased by sol-vents containing heavy atoms or other solutes withsuch atoms in their structure: carbon tetrabromidc andethyl iodide are examples. The effect is similar to thatwhich occurs when heavy atoms are substituted intofluorescing compounds: orbital spin interactions resultin an increase in the rate of triplet formation and a cor-responding decrease in fluorescence. Compounds con-taining heavy atoms are frequently incorporated intosolvents when enhanced phosphorescence is desired.
CompoundWavelengtb of Relative IntensitI
Formula Fluorescenc~ om of fluorescence
Benzene C,li" 270-310 10Toluene C,H,CH3 270-320 17Prapylbenzenc c"H,C3H, 270-320 17Fluorabenzene CoHsF 270-320 10Chlorabenzene C,H,Cl 275-345 7Bromobenzene C,H,Br 290-380 5Iodobenzene C,HsI 0Phenol C,H,OH 285-365 18Phenolate ion C,HsO- 310-400 10Anisole C,H,OCH, 285-345 20Aniline C,HsNH2 310-405 20Anilinium lon c"HsNH3 ' 0Benzoic acid C,H,COOH 310-390 3Benzonitrile C,H,CN 280-360 20Nitrobenzene C,H,N02 O·
Effect of pH on Fluorescence
The fluorescence of an aromatic compound with acidicor basic ring substituents is usually pH dependent.Both the wavelength and the emission intensity arclikely to be different for the protonated and unproto-nated forms of the compound. The data for phenol andaniline shown in Table 15-1 illustrate this effect. Thechanges in emission of compounds of this type arisefrom the differing number of resonance species thatare associated with the acidic and basic forms of themolecules. For example, aniline has several resonanceforms but anilinium has only one. That is,
have easily ruptured bonds that can absorb the excita-tion energy following internal conversion.
Substitution of a carboxylic acid or carbonyl groupon an aromatic ring generally inhibits fluorescence. Inthese compounds, the energy of the n -> 7T* transition isless than in the 7T -> 7T* transition, and as discussed pre-viously, the fluorescence yield from the n -> 7T* systemsis ordinarily low.
Effect of Structural Rigidity
It is found empirically that fluorescence is particularlyfavored in molecules with rigid structures. Forexample,the quantum efficiencies for fluorene and biphenyl arenearly 1.0and 0.2, respectively, under similar conditionsof measurement. The difference in behavior is largelya result of the increased rigidity furnished by the bridg-ing methylene group in fluorene. Many similar exam-ples can be cited.
The influence of rigidity has also been invoked toaccount for the increase in fluorescence of certain or-ganic chciating agents when thev arc complcxed with a
metal ion. For example, the fluorescence intensity of8-hydroxyquinoline is much less than that of its zinccomplex:
HH H H H H HHIH'" { V/ V/ '" /
6-6-6 6The additional resonance forms lead to a more stablefirst excited state; fluorescence in the ultraviolet regionis the consequence.
The fluorescence of certain compounds as a functionof pH has been used for the detection of end points inacid-base titrations. For example, fluorescence of thephenolic form of l-naphthol-4-sulfonic acid is not de-tectable by the eye because it occurs in the ultravioletregion. When the compound is converted to the pheno-late ion by the addition of base, however, the emissionband shifts to visible wavelengths, where it can readilybe seen. It is significant that this change occurs at a dif-ferent pH than would be predicted from the acid disso-ciation constant for the compound. The explanation ofthis discrepancv is that the acid dissociation constantfor the excited molecule differs from that for the samespecies in its ground state. Changes in acid or base dis-
Lack of rigidity in a molecule probably causes an en-hanced internal conversion rate (k,c in Equation 15-1)and a consequent increase in the likelihood for radia-tionless deactivation. One part of a nonrigid moleculecan undergo low-frequency vibrations with respect toits other parts: such motions undoubtedly account forsome energy loss.
Temperature and Solvent Effects
The quantum efficiency of fluorescence in most mole-cules decreases with increasing temperature becausethe increased frequency of collisions at elevated tem-peratures improves the probability for deactivation byexternal conversion. A decrease in solvent viscosityalso increases the likelihood of external conversionand leads to the same result.
r71 .Simulation: Learn more about luminescencelQ.J spectroscopy.
sociation constants with excitation are common and areoccasionally as large as four or five orders of magnitude.These observations suggest that analytical proceduresbased on fluorescence frequently require close controlof pH.
The presence of dissolved oxygen often reduces theintensity of fluorescence in a solution. This effect mavbe the result of a photochemically induced oxidatio~of the fluorescing species. More commonly, however,the quenching takes place as a consequence of theparamagnetic properties of molecular oxygen, whichpromotes intersystem crossing and conversion of ex-cited molecules to the triplet state. Other paramag-netic species also tend to quench fluorescence.
Effect of Concentration onFluorescence Intensity
The power of fluorescence emission F is proportionalto the radiant power of the excitation beam that is ab-sorbed by the system. That is,
where Po is the power of the beam incident on the so-lution, P is its power after traversing a length b of themedium, <Pc is the quantum efficiency of the fluores-cence process, and K" is a constant dependent ongeometry and other factors. The quantum efficiency offluorescence is a constant for a given system, and so theproduct <p,K" is lumped into a new constant K' on theright side of Equation 15-2. To relate F to the concen-tration e of the fluorescing species, we write Beer's lawin the form
where 10 is the molar absorptivity of the fluorescingmolecules and lObe is the absorbance A. By substitutionof Equation 15-3 into Equation 15-2, we obtain
The exponential term in Equation 15-4 can be ex-panded as a Maclaurin series to
, r (2.303ebe)'F = K Po 2.303ebc ~ -----
'- 2!
+ (2~3038bcr + . j"3! (15-5)
Provided that 2.303ebe = A < 0.05, all of the subse-quent terms in the brackets are small with respect to

the tirst term. Unc.kr these cc.mc.lillons.the maximumrelative error causec.l by dropping all but thc first termis 0.13 0/0. Thus, we may write
Thus. a plot of the fluorescence rac.liant power 01 asolution versus concentration 01 the emitting speciesshoulc.l be linear at low concentrations. When c be-comes great enough that the absorbance is targer thanabout 0.05. the higher-order terms in E4uation 15-5 be-come important and linearity is lost; F then lies belowan extrapolation olthe straight-line 1'101. This excessiveabsorption is known as primary absorprion.
Another factor responsible for negative departuresfrom linearity at high concentration is secondllrv ab-sorpeion. Secondary absorption occurs when the wave-length of emission overlaps an absorption band. Fluo-rescence is then decreased as the emission traversesthe solution and is reabsorbed by other molecules insolution. Secondary absorption can be absorption bythe analyte species itself or absorption by other speciesin the solution. The effects of these phenomena arcsuch that a plot of fluorescence versus concentrationmay exhibit a maximum. Absorption effects are oftentermed inner fileer effecrs.
Dynamic Quenching
The term quenching usually refers to nonradiativeenergy transfer from an excited species to othermolecules. Dynamic quenching. also called collisionalquenchin/i. requires contact between the excited spc-cies and the quenching agcnt (0). Dynamic 4uenchingoccurs as rapidly as the collision partnas can diffusetogether. The rate is temperature and viscosity depen-denl. The 4uencher concentration must be highenough that there is a high probability of a collision be-tween the excited species and the queneher during thelifetime of the excitec.l state.
For external conversion controllcc.l by dynamic4uenching with a single queneher. the external conver-sion rate constant can be written as
where kq is the rate constant for 4uenching and [OJ isthe concentration of the 4ucncher. In the absence of4uenching (k,., = 0) anc.l where predissociation and
dissociation arc abse:nt (kpd = k" = 0), the: flumes-cence quantum cfticiency <b~can b..:writt..:n from Equa-tion 15-1 as
kf<bf = -- _. -~---- - - ~k, + k, + k" + k,1 0 I
By taking the ratio of E4uation l5-9to Equation 15-10.we obtain th..:Stern- Vo\m..:re4uation
<l>f'-~ = I + K '0<PI ql
where Kq is the Stern- Volmer 4uenching constant de-fined as Kq = kq/(k, + k, + k,,). Rearrangement of thise4uation yields.
1 Kq[O)cPr ;;;V + <b~'
A plot of l/cPrversus [0) should be a straight line with aslope of Kq/c/A' and an intercept of l/cP? The Stern-Volmer constant can be obtained from the ratio of theintercept and the slope. Dynamic quenching reducesboth the ftuoreseence quantum yield and the ftuores-cence lifetime.
Because the ftuorescence emission Fis directly pro-portional to the quantum efficiency <P, (E4uation 15-2),we can also write the Stern-Volmer equation in termsof easily measurec.l quantities
r--" = I + KlO:F q,
where f-~,anc.lFare th..: tluorescence signals in the ab-sence and in the presence of quencher. respectively. TheStern- Volmer constant is then just the slop..: of a plot ofF.,fF versus [0). and the inte:rcept of the plot is unity.Example 15-1 illustrates the us.: of E4uation 15-12 indetermining Kq values.
The l1uorescence of 4uinine sulfate (see Figur.: 15-:\) isquenched by high concentrations of chloride ion. Thefollowing fluorescl:nce signals F were ohtained as afunction of the concentration of chloride ion.
fluorescenceIntensitJ, F \Cn,M
0.000.005
n.OIOO.Ol50.020
0.0250.030
0.0400.050
lRn.OR7.55~n4:\235.n20.:)
Set up a spreadsheet and determine the qu.:nchingconstant Kq.
The spr.:adsheet and Stern-Volmer plot are shown inFigure 15-4. The: data arc entered into columns BandC. and F.,/ F is calculated in column D. The slope andits standard deviation are Kq = 210 ::+: 0.9 M-I. as ob-tained from the spreadsheet statistics. Note: that the in-tercept is very nearly unity.
The presence of dissolved oxygen often reduces theintensity of fluorescence in a solution. This efkct issometimes the result of a photochemically inducedoxidation of the fluorescing species. More commonly,
however, the quenching takes place as a consequencL'of the paramagnetic pruperties of molecular o.\.)'gen,which promotes intcrs~'stem crossing and. con\\~rsionof excited molecules to the triplet state. Other para-magnetic species also tend to 4u.:nch l1uorescence.Dissolved oxyg.:n is also an dticient 4ne:ncher of th.:triplet state. For this reason. solutions are usually c.le-oxvgenated bdore phosphorescence measurementsarc made.
Other Types of Quenching
In stari<' quellchill/i. the 4ucncher and the ground-statel1uorophore form a complex called the dark colllple.c..Fluorescence is usually observ.:d only from the un-bound fluorophore:. The decrease in fluorescence inten-sitycan also be described by the Stern- Volm.:r e:4uationin the case of static quenching. Howe:ver, Kq in Equa-tion 15-ll is now the formation constant of the l1uo-rophore-quencher complex. With static 4uenching. thelifetime is not affected. Hence. lifetime measurementscan allow dynamic quenching to be c.listinguishec.lfromstatic 4uenching.
In long-range, or Forster, quenching, energy trans-fer occurs without collisions between molecules. Di-pole-dipole coupling between the excited lluorophoreand the quencher account for the transfer. The depen-dence of the degree of quenching on the quenchc."
y ~ 209.95x + 1.0092 lR' ~ 0.9999
FIGURE15-4 Spreadsheet and plot to determine quenching constant for chloride Ionquenchmg of quinine.

400
Wavelength, om
FiGURE 15-5 Spectra for phenanthrene: E, excitation;F, fluorescence; P, phosphorescence. (From W. R. Seitz,in Treatise on Analytical Chemistry, 2nd ed., P. J. Elving,E. J. Meehan, and I. M. Kalthoff, eds .. Part I, Vol. 7, p. 169,New York: Wiley, 1981. Reprinted by penmission of JohnWiley & Sons, Inc.)
concentration is complicated and does not followStern- Volmer behavior.
'15.11.-5Emission and Excitation Spectra
Figure 15-5 shows three types of photoluminescencespectra for phenanthrene. An excitation spectrum la-beled E in the figure is obtained by measuring lumi-nescence intensity at a fixed wavelength while the ex-citation wavelength is varied. Because the first step ingenerating fluorescence emission is absorption of radi-ation to create excited states, an excitation spectrum isessentially identical to an absorption spectrum takenunder the same conditions. Fluorescence and phos-phorescence spectra (F and P, respectively), on theother hand, involve excitation at a fixed wavelengthwhile recording the emission intensity as a function ofwavelength.
Another type of luminescence spectrum is shown inFigure 15-6. The total luminescence ,pectrum is eithera three-dimensional representation or a contour plot.Both simultaneously show the luminescence signal as afunction of excitation and emission wavelengths. Suchdata are often called an excitation-emission matrix. Al-though the total luminescence spectrum can be ob-tained on a normal computerized instrument, it can beacquired more rapidly with array-detector-based sys-tems (see next section).
Some luminescence instruments allow simultane-ously scanning both the excitation and the emissionwavelengths with a small wavelength difference be-tween them. The spectrum that results is known as asynchronous spectrum. A luminescence signal is ob-
Emission wavelength, om
(a)
600
500
.~' /8?c 400
~
300
200400 500 600 700 800
Ex.citation \I.'aveiength, om
(b)
FIGURE 15-6 Total luminescence spectra. In (a), the totalfluorescence spectrum of a mixture of anthracene andovalene is shown as a three-dimensional plot. In (b), thetotal fluorescence spectrum of 8-hydroxybenzo[a]pyreneis shown as a contour plot. Each line represents a par-ticular fluorescence intensity. (Part a from Y. Talmi et aI.,Anal. Chern., 1978, 50, 936A. Figure 11, p. 948A. Part badapted from J. H. Rho and J. L. Stewart, Anal. Chern ..1978,50,620. Figure 2, p. 622. Copyright 1978 AmericanChemical Society.)
40
1.0 Excitation
" spectrum.~~~c 2.0~-~§
u::1.0
0.0(al
4.0 ,
©©©©T etracene
3.0
"c~"" 2.0
~:;,on
1.0
FIGURE 15-7 Synchronous fluorescence spectra. In(a), the excitation and emission spectra of tetracene areshown. In (b), the synchronous spectrum is shown for afixed-wavelength difference of 3 nm. (From T. Vo-Dinh,Anal. Chern., 1978. 50, 396. Figure 1. p. 397. Copyright1978 American Chemical Society.)
tained only at wavelengths where both excitation andemission occur for the wavelength difference chosen asshown in Figure 15-7. The synchronous spectrum canalso be generated from the total luminescence spec-trum by appropriate software.
As has been pointed out earlier. photolumines-cence usually occurs at wavelengths that are longerthan the excitation wavelength. Furthermore, phos-phorescence bands are generally found at longer wa\'C-lengths than fluorescence hands because the excited
triplet state is, in most instances, lower in energy thanthe corresponding singlet state. In fact, the wavelengthdifference between the two provides a convenientmeasure of energy difference between triplet and sin-glct states.
158 INSTRUMENTS FOR MEASURINGFLUORESCENCE ANDPHOSPHORESCENCE
The components of instruments for measuring pho-toluminescence are similar to those found in ultra-violet-visible photometers or spectrophotometers.Figure 15-8 shows a typical configuration for thesecomponents in fluorometers and spectrofluorometers.Nearly all fluorescence instruments employ double-beam optics as shown to compensate for fluctuations inradiant power. The upper sample beam first passesthrough an excitation wavelength selector (filter ormonochromator), which transmits radiation that ex-cites fluorescence but excludes or limits radiation ofthe fluorescence emission wavelength. Fluorescence isemitted from the sample in all directions, but is mostconveniently observed at right angles to the excita-tion beam. The right-angle geometry minimizes thecontributions from scattering and from the intensesource radiation. The emitted radiation then passesthrough an emission wavelength selector (filter ormonochromator) that isolates the fluorescence emis-sion. The isolated radiation then strikes a photo trans-ducer, where it is converted into an electrical signal formeasurement.
The lower reference beam passes through an atten-uatelr that reduces its power to approximately that ofthe fluorescence radiation (the power reduction isusually by a factor of 100 or more). The attenuated ref-erence beam then strikes a second transducer and isconverted to an electrical signal. Electronics and acomputer data system then process the signals to com-pute the ratio of the fluorescence emission intensity tothe excitation source intensity and produce the result-ing spcctrum or single-wavelength data.
The sophistication, performance characteristics,and costs of fluorometers and spectrofluorometersdiffer as widely as do those of the corresponding instru-ments for absorption measurements. If only filters are~mrloycd for wavelength sdcction. the instrument is

0--t
---I Transducer )------Elcctnmics/cornpulc[
data sysl~m
FIGURE 15-8 Components of a fluorometer or spectrofluorometer. Source radiation IS splitinto two beams. The sample beam passes through the excitation wavelength selector tothe sample. The emitted fluorescence is isolated by the emission wavelength selector beforestriking the transducer. The reference beam is attenuated before striking the transducer. Theelectronics and computer system compute the ratio of the fluorescence intensity to thereference beam intensity, which cancels the effect of source intensity fluctuations.
called ajlllorometCf. True spectro(luorometers employtwo monochromators for wavelength isolation. Someinstruments arc hybrids in that they use a filter forselecting the excitation wavelength and a monochro-mator for choosing the emission wavelength. These are,often, still called spectrofluorometers. Several com-mercial spectrophotometers can be purchased withadapters that permit their use as spectrofluorometers.
Truc speetrofluorometers allow production of afluorescence excitation spectrum or a fluorescenceemission spectrum. Figure 15-9a shows an excitationspectrum for anthracene in which the fluorescenceemission was measured at a fixed wavelength while theexcitation wavelcngth was scanned. With suitable Cor-rections for variations in source output intensity anddetector response as a function of wavelength, an ab-solute excitation spectrum is ohtained that closely re-sembles an ahsorption spectrum.
Figure 15-9b is the fluorescence emission spectrumfor anthracene. The spectrum was ohtained hy holdingthe excitation wavelength constant while the emissionwavelengths were scanned. These two spectra arc ap-proximately mirror images of one another becausethe vihrational energy differences for the ground andexcited electronic states are roughly the same (seeFigure 15-2).
The selectivity of spectrofluorometers is importantin electronic and structural characterization of mole-cules and is valuable in hoth qualitative and quantita-tive analytical work. For concentration measurements,however. relatively inexpensive fluorometers often suf-
FIGURE 15-9 Fluorescence spectra for 1 ppm anthracenein alcohol: (a) excitation spectrum; (b)emission spectrum.
fice. These are usually deSIgned specifically to sohethe measurement problems peculiar to fluorescencemethods and are frequently as specitic and selective asmodified ahsorption spectrophotometers.
158-1 Components of Fluorometersand Spectrofluorometers
The components of fluoromclers and spcctroflu'J-rometers are quite similar to those we have discussedfor absorption photometers and spectrophotomclers.However. several differences arc discussed here.-
Sources
As shown hv Equation 15-6. the magnitude of the out-put signal in luminescence measurements. and thus thesensitivity. is directly proportional to the source radi-ant power I~J. For this reason, more intense sources an:used in luminescence methods than the tungsten ordeuterium lamps used in absorption measurements.
Lamps. The most common source for filter fluorome-ters is a low-pressure mercury vapor lamp equippedwith a fused silica window. This source produces usefullines for exciting fluorescence at 254, 302, 313, 546, 571(691, and 773 nm. [ndividuallines can be isolated withsuitahle absorption or interference filters. Becausetluorescence can he induced in most tluorcscing com-pounds hy a variety of wavelengths, at least one of themercury lines ordinarily proves suitable.
For spectrofluorometers, where a source of contin-uum radiation is required. a 75- to450-W high-pressurexenon arc lamp is commonly employed. Such lamps re-quire a power supply capable of producing direct cur-rents of 5 to 20 A at 15 to 30 V. The spectrum from axenon arc lamp is a continuum from about 300 to 1300nm. The spectrum approximates that of a blackbody(see Figure 6-22). [n some instruments, a capacitor isdischarged through the lamp at a constant frequency toprovide flashes that arc regularly spaced in time; higherpeak intensities are ohtained hy pulsing. In addition,the outputs of the transducers arc then ae signals thatcan be readily amplified and processed.
Blue light-emitting diodes (LEOs) have also heenused in fluorescence instruments. These lamps emitradiation at 450-475 nm and are suitable for excitingsome fluorophores. Mixtures of phosphors in someLEOs can provide wavelengths in the UV region toabout 375 nm (see Section 130-1).
Lasers. Since the 1970s. various types of lasers havealso been used as excitation sources for photolumines-cence measurements. Of particular interest arc tun·
ahle dye lasers pumped hy a pulsed nitrogen laser or aNd- YAG laser. Fixed-wawlength lasers are also used,particularly in detectors f'lf chmmatography andelect rophoresis.
Most commercial spectrofluorometers use lampsources hecause they are less expensive and more appli-cable to determining multiple analytes with differentexcitation wavelengths. Laser sources, however, offersignificant advantages in certain instances: for example,(I) when samples are very small. as in microhorc chro-matography and capillary electrophoresis where theamount of sample is a microliter or less; (2) in remotesensing, as in fluowmetric detection of hydroxyl radi-cals in the atmosphere orof chlorophyll in bodies ofwa-ter, where the collimated nature of laser beams is vital;or (3) when highly monochromatic excitation is neededto minimize the effects of fluorescing interferences.
Filters and Monochromators
Interference and ahsorption Iilters have heen used influorometers for wavelength selection of both the exci-tation beam and the resulting tluorescence radiation.Spect rofluorometers are equipped with at least oneand often two grating monochromators.
Transducers
Luminescence emission signals are typically quite lowin intensity. Therefore, sensitive transducers arc re-quired. Photomultiplier tubes are the most commontransducers in sensitive fluorescence instruments. Of-ten, these arc operated in the photon-counting modeto give improved signal-to-noise ratios (see page202). Transducers are sometimes cooled to improvesignal-to-noise ratios. Charge-transfer devices. sueh ascharge-coupled devices (CCDs), are also used for spec-tmtluorometry.' This type of transducer permits therapid recording of both excitation and emission spec-tra and is particularly useful in chromatography andelectrophoresis.
Cells and Cell Compartments
Both cyhndrical and rectangular cells fabricated ofglass or silica arc employed for tluorescence measure-ments. ('are must be taken in the design of the cell
R S. Pom~~royltl Chargt' Transfer IJc~'ic<,sill SpeClmscopy, J. V Swcedkr.K.I._ Ralzl:lif. and "'1 H,lJentnll. eds., ~eW York: VCH. !';I<J.t, pp. 2xI-Jl.t:I' .\1. ~rrr:r)()/1.R D, Jalklan. <:lnd ~f B. [knt,)IL "Ina! Chenz.. 1989.(,f ~,'C

QLamp
I IIII IIII III Sample
9 !\p apertureShutta ~\\ disk
I I III
~ffl'. Pnmar) Reference
~
~;'<i'" filler h 1'1'B > P oto~u tip lcr
Secondar~ C ~ , 'Sample filter F 0 _ ~
Phot.l~r= = ~ -i-It= ==::~ ~~:~--~-~tJi;L - ~ ~ ~ Sample ReferenceE D aperture
disk
FIGURE 15-10 A typical fluorometer.(Courtesy of Farrand Optical Componentsand Instruments Divisionof RuhleCompanies. Inc,)
compartment to reduce the amount of scattered radia-tion reaching the detector. Baffles are often introducedinto the compartment for this purpose. Even morethan in absorbance measurements, it is important toavoid fingerprints on cells because skin oils oftenfluoresce,
Low-volume micro cells are available for situationsin which sample volumes are limited. Several compa-nies make flow cells for fluorescence detection in chro-matography and in continuous flow analysis. Sample-handling accessories include micro-plate readers,microscope attachments, and fiber-optic probes. Low-volume cells are often used for room-temperature pho-sphorescence and for chemiluminescence. Special cellsand sample handling are needed for low-temperaturephosphorescence measurements.
Although the right-angle geometry shown in Fig-ure 15-8 is most common. two other cell configurationsare uscd. Front-surface geometry allows measurementson solutions with high absorbances or on opaque solids.The 180°, or in-line. geometry is rarely used becausethe weak luminescence signal must be isolated from theintense excitation beam by the emission wavelengthselector.
Data Manipulation
Modern computer-based luminescence instrumentshave many different data-manipulation schemes avail-able in software, Common data-manipulation and dis-play options include blank signal subtraction, produc-tion of corrected excitation and emission spectra.calculation and display of difference and derivative
spectra, peak dctection and processing, deconvolu-tion, production of three-dimensional total hlmines-cence plots, fitting of calibration data, calclJl~tion ofstatistical parameters, and smoothing of spectra byvarious methods. Specialized software is available forkinetics, for high-performance liquid chromatography(HPLC) detection, for analysis of mixtures, and fortime-resolved measurements.
Fluorometers
Filter fluorometers provide a relatively simple, low-cost way of performing quantitative fluorescenceanalyses. As noted earlier, eithcr absorption or inter-ference tilters are used to limit thc wavelengths of thcexcitation and emitted radiation. Generally, fluorome-ters are compact, rugged, and easy to use.
Figure 15-10 is a schematic of a typical tilter fluorom-eter that uses a mercury lamp for fluorescence excita-tion and a pair of photomultiplier tubes as transducers.The source beam is split near the source into a referencebeam and a sam pic beam. The reference beam is atten-uated by the aperture disk so that its intcnsity is roughlythe same as the fluorescence intensity. Both beamspass through the primary filtcr, with the reference beamthen bcing reflected to the reference photomultipliertube. The sample beam is focused on the sample bya pair of lenses and causes fluorescence emission. Theemitted radiation passes through a second filter andr::;l Tutorial: Learn more about fluorescencelQ.J instrumentation.
Samplephotomultipliertuhe
Xenonlamp
then is focused on the second photomultiplier tube.The electrical outputs from the two transducers arethen processed to compute the ratio of the sample toreference intensities, which serves as the analyticalvariable.
The instrument just described is representative ofthe dozen or more fluorometers available commer-cially. Some of these are simpler single-beam instru-ments. Some are portable instruments for field work.The cost of such fluorometers ranges from several hun-dred dollars to more than $10,000.
Spectrofluorometers
Several instrument manufacturers offer spectro-fluorometers capable of providing both excitationand emission spectra. The optical design of one ofthese, which employs two grating monochromators, isshown in Figure IS-II. Radiation from the excitationmonochromator is split. part passing to a referencephotomultiplier and part to the sample. The resultingfluorescence radiation, after dispersion by the emis-sion monochromator, is detected by a second photo-multiplier.
An instrument such as that shown in Figure 15-11provides perfectly satisfactory spectra for quantitative
analysis. The emission spectra obtained will not, how-ever, necessarily compare well with spectra from otherinstruments because the output depends not only onthe intensity of fluorescence but also on the character-istics of the lamp, transducer, and monochromators.All of these instrument characteristics vary with wave-length and differ from instrument to instrument. Anumber of methods have been developed for obtaininga corrected spectrum, which is the true fluorescencespectrum freed from instrumental effects (see nextsection).
Spectrofluorometers Based on Array Detectors
A number of spectrofluorometers based on diode-array and charge-transfer devices have been describedthat permit fluorescence spectra to be obtained in frac-tions of a second" Several commercial instruments arcnow available with CeD detectorss
~S~e, for example, R. S. Pomeroy in Charge Tramfer Devices in Spectro-scopy, 1. V. Sweedler, K. L. Ratzlaff and t-.1. B. Denton. cds._ New YorkVCH, 199..t pp. 281-3l4; P. .\1. Epperson, R. D. Jalkian, and M. B. Denton.4nal. Chon" 1989,61,282.'For example. see instrumems made by Ocean Optics, Inc. DunedinFlorida. and Spa Division. Jobin Yvan. Edison. New la,ey.
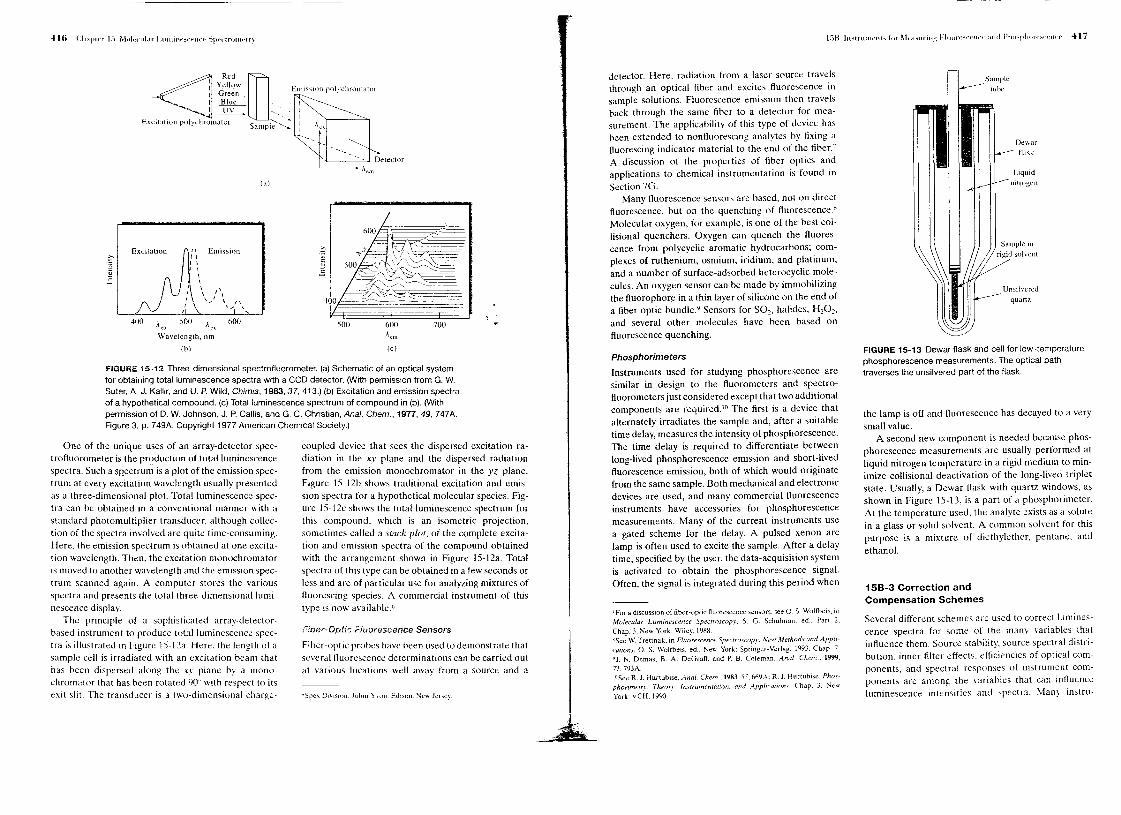
detector. Here, radiation from a laser source travelsthrough an optical fibcr and excites fluorescence insample solutions. Fluorescence emission then travelsback through the same fiber to a detector for mea-surement. The applicability of this type of device hasbeen extended to non fluorescing analytes by fixing afluorescing indicator material to the end of the fiber.'A discussion of the properties of fiber optics andapplications to chemical instrumentation is found inSection 7G.
Many fluorescence sensors are based, not on directfluorescence, but on the quenching of fluorescence'"Molecular oxygen, for example, is one of the best col-lisional quenchers. Oxygen can quench the fluores-cence from polycyclic aromatic hydrocarbons; com-plexcs of ruthenium, osmium, iridium, and platinum;and a number of surface-adsorbed heterocyclic mole-cules. An oxygen sensor can be made by immobilizingthe fluorophore in a thin layer of silicone on the end ofa fiber-optic bundle9 Sensors for SO" halidcs, H,O"and several other molecules have been based onfluorescence quenching.
<::]Red [Yellow
.i ~'ft;~. E~~iSSlOn polychromarof
I UV • I--~ "'''-..... IExcitation polvchromator S I~..... ( A
- ample ~ I ~\
~'-
.....-- -.. Detector
A~m
I'1\
- \ 1\'-." "
Aex Ae\
Wavelength, nm
(h)
coupled dcvice that sees the dispersed excitation ra-diation in the xy plane and thc dispersed radiationfrom the emission monochromator in the yz planc.Figure 15-12b shows traditional excitation and emis-sion spectra for a hypothetical molecular species. Fig-ure 15-12c shows the total luminescence spectrum forthis compound, which is an isometric projection,sometimes called a stack plot, of the complcte excita-tion and cmission spectra of the compound obtainedwith the arrangement shown in Figure 15-12a. Totalspectra of this type can be obtained in a few scconds orless and arc of particular use for analyzing mixtures offluorcscing species. A commcrcial instrument of thistype is now available."
Phosphorimeters
Instruments used for studying phosphorcscence aresimilar in design to the fluorometers and spectro-fluorometers just considered except that two additionalcomponents are required. to The first is a device thatalternately irradiates the sample and, after a suitabletime delay, measures the intensity of phosphorescence.The time delay is required to differentiate betweenlong-lived phosphorescence emission and short-livedfluorescence emission, both of which would originatefrom the same sample. Both mechanical and electronicdevices are used, and many commercial fluorescenceinstruments have accessories for phosphorescencemeasurements. Many of the current instruments usca gated scheme for the delay. A pulsed xenon arclamp is often used to excite the sample. After a delaytime, specified by the uscr, the data-acquisition systemis activated to obtain the phosphorescence signal.Often, the signal is integrated during this period when
FIGURE 15-12 Three-dimensional spectrofluorometer. (a)Schematic of an optical systemfor obtaining total luminescence spectra with a CCD detector. (Withpermission from G. W.Suter, A. J. Kallir,and U. P. Wild,Chimia, 1983,37,413.) (b)Excitation and emission spectraof a hypothetical compound. (c)Total luminescence spectrum of compound in (b). (Withpermission of D. W.Johnson, J. P. Callis, and G. C. Christian, Anal. Chem., 1977,49, 747A.Figure 3, p. 749A. Copyright 1977 American Chemical Society.)
One of the unique uses of an array-detector spec-trofluorometer is the production of total luminescencespectra. Such a spectrum is a plot of the emission spec-trum at every excitation wavelength usually presentedas a three-dimensional plot. Total luminescence spec-tra can be obtained in a conventional manner with astandard photomultiplier transducer, although collec-tion of the spectra involved are quite time-consuming.Here, the emission spectrum is obtained at one excita-tion wavelength. Then, the excitation monochromatoris moved to another wavelength and the emission spec-trum scanned again. A computer stores the variousspectra and presents the total three-dimensionallumi-nescence display.
The principle of a sophisticated array-detector·based instrument to produce total luminescence spec-tra is illustrated in Figure 15-12a. Here, the length of asample cell is irradiated with an excitation beam thathas been dispersed along the XI' plane by a mono-chromator that has been rotated 90° with respect to itsexit slit. The transducer is a two-dimensional charge·
Fiber-Optf.::: Pluorescence Sensors
Fiber-optic probes have heen used to demonstrate thatseveral fluorescence determinations can be carried outat various locations well away from a source and a
7 For a discussion of fiber-optic f1uorescence sensors, see O. S. Wolfueis, inMolecular Luminescence Spectroscopy. S. G. Schulman, ed., Part 2,Chap. 3, New York: Wiley, 19888See W. Trettnak. in Fluorescence Spectroscopy: iVew ;\Jethods and Appli-calions.o. S. \Voltbeis, ed .. New York: Springer-Verlag. 1993. Chap. i91. K. Demas, B. A. DeGraff. and P. B. Coleman, Anal. Chern., 1999,71.793A.:oSee R. 1. Hurtuhise, Anal. Chern., 1983. 55. 669:\: R.1. Hurtubise, Phus-phorimetr~ Theon' Instrumentation. and Applications, Chap. 3. NewYork: VCH, 1990
Unsilveredquartz
FIGURE 15-13 Dewar flask and cell for low-temperaturephosphorescence measurements. The optical pathtraverses the unsilvered part of the flask.
the lamp is off and fluorescence has decayed to a verysmall value.
A second new component is needed because phos-phorescence measurements are usually performed atliquid nitrogen tcmperature in a rigid medium to min-imize collisional deactivation of the long-lived tripletstate. Usually, a Dewar flask with quartz windows, asshown in Figure 15-13, is a part of a phosphorimeter.At the temperature used, the analyte exists as a solutein a glass or solid solvent. A common solvent for thispurpose is a mixture of diethylether, pentane, andethanol.
158-3 Correction andCompensation Schemes
Several different schemes arc used to correct lumines-cence spectra for some of the many variables thatinfluence them. Source stability, source spectral distri-bution, inner filter effects. efficiencies of optical com-ponents, and spectral responses of instrument com-ponents are among the \'ariables that can influenceluminescence intensities and spectra. Mam instru·

ments have provision to compensate or correct forsome of these effects,
Source Compensation
The luminescence instruments shown in Figures 15-10and 15-11 both monitor the source intensity via a ref-erence photomultiplier. Most commonly, the ratio ofthe sample luminescence signal to the signal from thereference detector is continuously obtained. This cancompensate for source intensity fluctuations amI drift.Both double-beam-in-space and double-beam-in-timedesigns are employed.
Corrected Excitation Spectra
Source compensation does not correct for the wave-length dependence of the source or the efficiencies ofthe optical components and excitation wavelength se-lector. Correction for these effects can be done in sev-eral ways. In some commercial instruments, a quanlwncounter has been used. The quantum counter is a ref-erence cell filled with a concentrated fluorophore ofhigh quantum efficiency, such as Rhodamine B. A 3- to8-g/L solution in glycerol essentially absorbs all inci-dent light from 220 to 600 nm. The guantum efficiencyis virtually constant over this excitation range. The ex-citation beam is split after the wavelength selector, anda fraction excites the reference material. The sameemission spectral distribution results from all excita-tion wavelengths so that the photomultiplier spectralresponse is not of concern. The resulting referenee sig-nal is directly proportional to the source radiant powerstriking the sample.
Modern computerized spectrofluorometers oftenachieve a similar correction by storing the referencespectrum of the source in computer memory. After thesample spectrum is scanned, the correction is made bycalculating the ratio of the sample spectrum to the ref-erence spectrum.
An example of the differences between correctedand uncorrected spectra is given in Figure 15-14. Anappropriately corrected excitation spectrum shouldbe identical to the absorption spectrum of the samecompound.
Corrected Emission Spectra
Emission spectra collected on different instrumentswill vary because of different wavelength dependen-cies of the wavelength selectors and transducers. Theshape of a properlY corrected emission spectrum re-
flects only how the luminescence efliciency varies withexcitation wavelength. as shown in Figure 15-14. Tocorrect the emission spectrum, a calibrated lightsource is employed. and calibration factors for theemission monochromator and transducer are deter-mined. These are stored in computer memory. The Un-corrected emission results are then multiplied by ap-propriate correction factors to give the correctedspectrum.
Because of variations in SOurce intensity, transducersensitivity, and other instrumental variables, it is im-possible to obtain with a given t1uorometer or spec-trophotometer exactly the same reading for a solutionor a set of solutions from day to day. For this reason itis common practice to standardize an instrument andset it to a reproducible sensitivity level. Standardiza-tion is oftcn carried out with a standard solution of astable fluorophore. Thc most common rcagent f<'lr thispurpose is a standard solution of quinine sulfate hav-ing a concentration of about 10' M. It is generallyexcited by radiation at 350 nm and emits radiationof 450 nm (see Figure 15-14). Other compounds havebeen described for other wavelength regions.
The Perkin-Elmer Corporation offers a set of sixfluorescence standards dissolved in a plastic matrix togive stable solid blocks that can be used indefinitelv- -without special storage. With these, the instrument iseasily standardized for the wavelength region to beused for the analysis.
Comparing fluorescence spectra among differentinstruments should be done only with corrected spec-tra, as discussed in Section l5B-3.
of both 1'" and P. heeause absorbance, wbich is propor-tional to concentration, depends on the ratio of thesetwo guantities.
The sensitivity of a fluoromctric method can bc im-pro\'ed by increasing 1'" or hy further amplifying thefluorescence signal. In actuality, the luminescence sig-nal is not zero, however, when the analytc concentra-tion is zero. Background luminescence and signalsfrom scattering and other sources determine the ulti-mate limits of detection that can be achieved. In spec-trophotometry. in contrast, an increase in 1'" resultsin a proportionate change in P and therefore fails toaffect A. Thus, fluorometric methods generally havedetection limits one to three orders of magnitude bct-ter than the corresponding spectrophotometric proce-durcs. On thc other hand. the precision and accuracyof photoluminescencc methods is usually poorer thanspectrophotometric procedures by a factor of perhaps2 to 5, The precision of photoluminescence methods isoften lunited tw source Ilicker noise and drift. The ac-curacy is often limited hy concomitants, or particles, inthe sample that cause additional fluorescence and scat-tering or that guench the analvte fluorescence. Gener-ally. phosphorescence methods are less precise thantheir fluorescence counterparts.
l.uminescence methods usuall\ ha\'e wider lineardynamic ranges than the corresponding ahsorptionmeth()ds. Calihration CUf\'es arc often linear fromslight I\' abmc the detection limit to the point whereahs"rption. and thus thc primar\' inner,tilter cffect, be,comC's significant. These mcthods also show increased
15C APPLICATIONS OFPHOTOLUMINESCENCE METHODS
Fluorescence and phosphorescence methods have in-herently lower limits of detection than absorption-based spectrophotometric measurements. They arcamong the most sensitivc analytical techniques avail-able to the scientist. The enhanced sensitivity arisesfrom the concentration-related parameter for fluo-rometry and phosphorimetry F being directly propor-tional to the souree radiant power Po. The luminescenceintensity can be measured independentlv of 1'". In con-trast, an ansorbancc measurement requires evaluation
FIGURE 15-14 Corrected and uncorrected spectra forquinine sulfate In 0.2 M H,SO,. Note that the correctedexcitation spectrum shows a higher intensity in theshort-wavelength (-- 250 nm) region than in the longer-wavelength region (-350 nm) because the molarabsorptiVity of the 250-nm band is larger, The uncor-rected excitation spectrum shows a much lower inten-sity in the 250-nm region because the source radiantpower is lower. The 350-nm band is of higher intensityin the uncorrected spectrum because of a high sourceradiant power. (From NIST Tech. Note 584, p, 55,December 1971.)
selectivity over absorption methods because not asmany molecules show significant luminescence as ab-sorh radiation, and both the excitation and the emis-sion wavelengths can be varied. On the other hand,contamination from reagents, laboratory glassware,and other interferents is more significant for lumines-cence methods,
15C-1 Fluorometric Determinationof Inorganic Species
Inorganic fluorometric methods arc of two types.'!Direct methods involve the formation of a fluorescingchelate and the measuremcnt of its emission. A secondgroup of methods is based on the decrease in fluores-cence emission because of the guenching action of thesubstance being determined. The latter technique hasbeen most widely used for aniun analysis,
Cations Forming Fluorescing Chelates
Two factors greatly limit the number of transition-metal ions that form t1uorescing ehelates. First. manyof these ions are paramagnetic, which increases therate of intersystem crossing to the triplet state, Deacti-\'ation by fluorescence is thus unlikely. although ph os-phorcscenct.: may he observl'd. A second factor is that
I Felf ,j r~'\l"\~ df llu"r(1rnelrj~- ddcrrnill"l1lnn <11tn,)r~;lIl1C ~f'(;':les, ~c(' A
ft'rn:wd<.:!-('ullcrrcl Jnd .\, ."-1. D,,:LI P<-'n:t.in 1/,'{/','/11 •.11" /.uminnCN!u:,
\r<'dfnj,-,){'I. S (i Schulm:ln. cd PM! I. Ch,tr ~. N~\\ Yqrk \\'i1~'\'. J",-<)
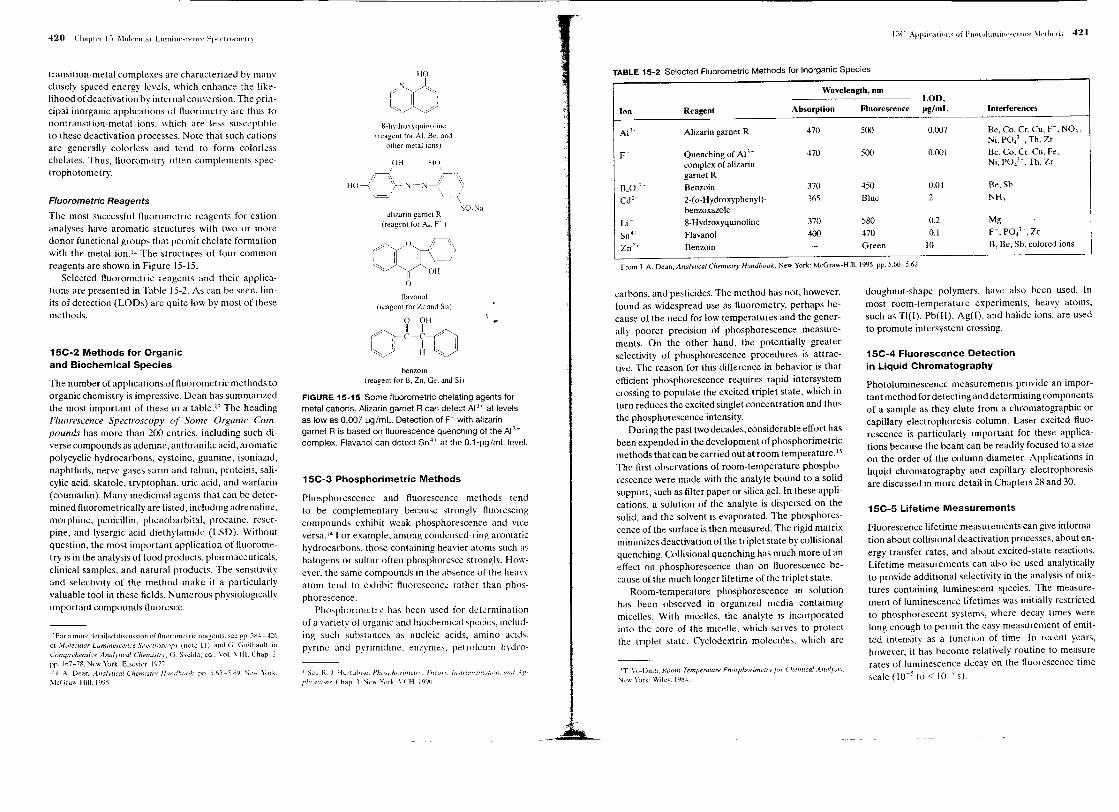
transition-metal complexes are characterized by manyclosely spaced energy levels_ which enhance the lik~-lihood of deactivation by internal conversion. The prin-cipal inorganic applications of fluorimetry are thus tonontransition-metal ions, which are less susceptibleto these deactivation processes. Note that such cationsare generally colorless and tend to form colorlesschelates. Thus, fluorometry often complements spec-trophotometry.
Fluorometric Reagents
The most successful fluorometrie reagents for cationanalyses have aromatic structures with two or moredonor functional groups that permit chelate formationwith the metal ion.12 The structures of four commonreagents are shown in Figure IS-IS.
Selected fluorometrie reagents and their applica-tions are presented in Table 15-2. As can be seen, lim-its of detection (LaDs) are quite low by most of thesemethods.
15C-2 Methods for Organicand Biochemical Species
The number of applications of fluorometric methods toorganic chemistry is impressive. Dean has summarizedthe most important of these in a table.1l The headingFluorescence Spectroscopy of Some Organic Com-pounds has more than 200 entries, including such di-verse compounds as adenine, anthranilic acid, aromaticpolycyclic hydrocarbons, cysteine, guanine, isoniazid,naphthols, nerve gases sarin and tabun, proteins, sali-cylic acid, skatole, tryptophan, uric acid, and warfarin(coumadin). Many medicinal agents that can be deter-mined tluorometrically are listed, including adrenaline,morphine, penicillin, phenobarbital, procaine, reser-pine, and lysergic acid diethylamide (LSD). Withoutquestion, the most important application of fluorome-try is in the analysis of food products, pharmaceuticals,clinical samples, and natural products. The sensitivityand selectivity of the method make it a particularlyvaluable tool in these fields. Numerous physiologicallyimportant compounds fluoresce.
12For a more detailed dis.:ussion of ftuurom.:tflc reagents. ~e pp. JK~ -42fJof ,lfolewlar LwnineJcence Speetmscop.\ (nol<: 11). and fj, (juilbaull, in
Comprehemiw Analytical CJumislry, G. Svehla, cd .. VoL VIII. Chap. 2,pp. 167-78, New York: Elsevier. 1977UJ A. Dean, Analytical Chonisfr\' Ilandho{)k, rr ).03-).6\1. NeW Ymk::vfcGraw-HilL 1995
LOD,Ion Reagent Absorption Fluorescence f1g/mL Interferences
AI" Alizarin garnet R 470 500 0.007 Be, Co, Cr, Cu, F-, NO"Ni, PO,'-, Th, Zr
F- Quenching of AI'+ 470 500 0.001 Be, Co, Cr, Cu, Fe,complex of alizarin Ni, PO}-, Th, Zrgarnet R
B,O,'- Benzoin 370 450 0.04 Be, Sb
Cd" 2-(o-Hydroxyphenyl}- 365 Blue 2 NH,benzoxazole
Li' 8-Hydroxyquinoline 370 580 0.2 MgSOH Flavanol 400 470 0.1 F-, pol-, Zr
Zn2, Benzoin Green 10 B, Be, Sb, colored ions
8-hydroxyquinolineIreagent for AI, Be. and
other metal ions}
~
o l~>I I 0.=/
"" OH
ocarbons, and pesticides. The method has not, however,found as widespread use as tluorometry, perhaps be-cause of the need for low temperatures and thc gener-ally poorer precision of phosphorescence measure-ments. On the other hand, the potentially greaterselectivity of phosphorescence procedures is attrac-tive. The reason for this difference in behavior is thatefficient phosphorescence requires rapid intersystemcrossing to populate the excited triplet state, which inturn reduces the excited singlet concentration and thusthe phosphorescence intensity.
During the past two decades, considerable effort hasbeen expended in the development of phosphorimetricmethods that can be carried out at room temperature. IS
The first observations of room-temperature phospho-rescence were made with the analyte bound to a solidsupport, such as filter paper or silica gel. In these appli-cations, a solution of the analyte is dispersed on thesolid, and the solvent is evaporated. The phosphores-cence of the surface is then measured. The rigid matrixminimizes deactivation of the triplet state by collisionalquenching. Collisional quenching has much more of aneffect on phosphorescence than on fluorescence be-cause of the much longer lifetime of the triplet state.
Room-temperature phosphorescence in solutionhas been observed in organized media containingmicelles. With micelles, the analyte is incorporatedinto the core of the micelle, which serves to protectthe triplet state. Cyclodextrin molecules, which are
FIGURE15-15 Some fluorometric chelating agents formetal cations. Alizaringarnet R can detect AI" at levelsas low as 0.007 ~g(mL. Detection of F- with alizaringarnet R is based on fluorescence quenching of the AI'-complex. Flavanol can detect Sn4
' at the 0.1-~g(mL level.
Phosphorescence and tluorescenee methods tendto be complementary because strongly fluorescingcompounds exhibit weak phosphorescence and viceversa." For example, among condensed-ring aromatichydrocarbons, those containing heavier atoms such ashalogens or sulfur often phosphoresce strongly. How-ever, the same compounds in the absence of the heavyatom tend to exhibit fluorescence rather than phos-phorescence.
Phosphorimetry has been used for determinationof a varietv of organic and biochemical species. includ-ing such substances as nucleic acids, amino acids.pyrine and pyrimidine, enzymes, petroleum hydro-
doughnut-shape polymers, have also been used. Inmost room-temperature experiments, heavy atoms,such as 1'1(1), Pb(Il), Ag(I), and halide ions, are usedto promote intersystem crossing.
15C-4 Fluorescence Detectionin Liquid Chromatography
Photoluminescence measurements provide an impor-tant method for detecting and determining componentsof a sample as they elute from a chromatographic orcapillary electrophoresis column. Laser-excited fluo-rescence is particularly important for these applica-tions because the beam can be readily focused to a sizeon the order of the column diameter. Applications inliquid chromatography and capillary electrophoresisare discussed in more detail in Chapters 28 and 30.
Fluorescence lifetime measurements can give informa-tion about collisional deactivation processes, about en-ergy transfer rates, and about excited-state reactions.Lifetime measurements can also be used analyticallyto provide additional selectivity in the analysis of mix-tures containing luminescent species. The measure-ment of luminescence lifetimes was initially restrictedto phosphorescent systems, where decay times werelong enough to permit the easy measurement of emit-ted intensity as a function of time. In recent years,however, it has become relatively routine to measurerates of luminescence decay on the fluorescence timescale (10-5 to < 10-' s).
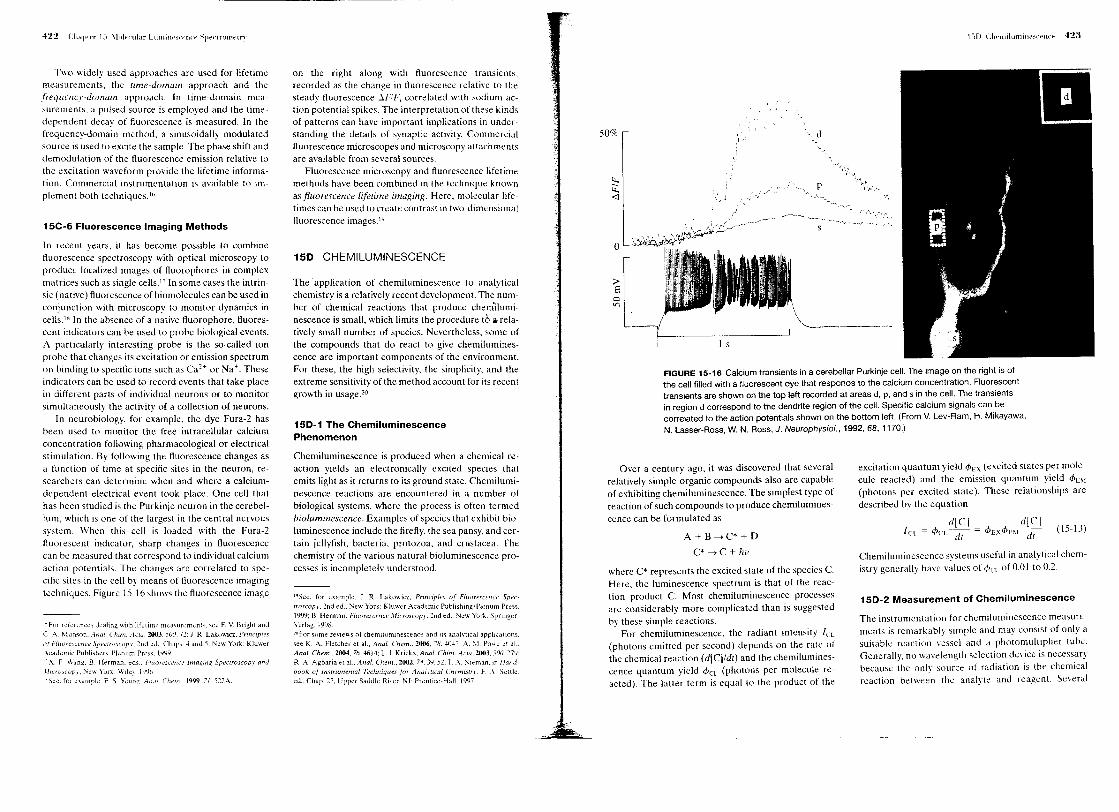
Two widely used approaches are used for lifetimemeasurements, the rime-domain approach and thefreqlletln-domain approach. In time-domain mea-surements. a pulsed source is employed and the time-dcpendent decay of fluorescence is measured. In thefrequency-domain method. a sinusoidally modulatedsource is used to excite the sample. The phase shift anddemodulation of the fluorescence emission relative tothe excitation waveform provide the lifetime informa-tion. Commercial instrumentation is available to im-plement both techniques."
In recent years. it has become possible to combinefluorescence spectroscopy with optical microscopy toproduce localized images of fluorophores in complexmatrices such as single cells,!' In some cases the intrin-sic (native) tluorescence of biomolecules can be used inconjunction with microscopy to monitor dynamics incells18 In the absence of a native fluorophore, fluores-cent indicators can be used to probe biological events.A particularly interesting probe is the so-called ionprobe that changes its excitation or emission spectrumon binding to specific ions such as Ca2+ or Na+. Theseindicators can be used to record events that take placein different parts of individual neurons or to monitorsimultaneously the activity of a collection of neurons.
In neurobiology, for example. the dye Fura-2 hasbeen used to monitor the free intracellular calciumconcentration following pharmacological or electricalstimulation. By following the fluorescence changes asa function of time at specific sites in the neuron, re-searchers can determine when and where a calcium-dependent electrical event took place. One cell thathas been studied is the Purkinje neuron in the cerebel-lum, which is one of the largest in the central nervoussystem. When this cell is loaded with the Fura-2fluorescent indicator, sharp changes in fluorescencecan be measured that correspond to individual calciumaction potentials. The changes are correlated to spe-cific sites in the cell by means of tluorescence imagingtechniques. Figure 15-16 shows the fluorescence image
~For rcf~ren..:c) dealing with lifdime meawrcments. 'iee F V, Bright andC. A. Munson. Anal. Chlm. Acw, 2003. 500, 7"2: 1. R. Lakov.icz. Principlesor" Fluorl.!.\cencl:' 5pecrroscop,I', 2nd cd .. Char:;. 4 and 5. l'iew York: Kluwer;\cademic Publishers, Plenum Press. t999- X. F. Wang. B. Herman. t:ds_. Ffuofl!scmce [maJ?illl? Spectroscopy andHicruscop,", ~cw Yurk: WIleY. 1'196'See, for example. E. S Y.::ung:. Andl. ChotL.1999. 71. 522.-\..
on the right along with fluorescence transients.recorded as the change in fluorescence relativc to thesteady tluorescence :IF! F, correlated with sodium ac-tion potential spikes. The interpretation of these kindsof patterns can have important implications in under-standing the details of synaptic activity. Commercialfluorescence microscopes and microscopy attachmcntsare available from several sources.
Fluorescence microscopy and fluoresccnce lifetimemethods have been combined in the technique knownas fluorescence liferime imaging. Here. molecular lifc-times can be used to create contrast in two-dimensionalfluorescence images."
The' application of chemiluminescence to analyticalchemistry is a relatively recent development. The num-ber of chemical reactions that produce chemilumi-nescence is small, which limits the procedure t6 a-rela-tively small number of species. Nevertheless, some ofthe compounds that do react to give chemilumines-cence are important components of the environment.For these. the high selectivity, the simplicity, and theextreme sensitivity of the method account for its recentgrowth in usage.'o
FIGURE 15-16 Calcium transients in a cerebellar Purkinje cell. The image on the right is ofthe cell filledwith a fluorescent dye that responds to the calcium concentration. Fluorescenttransients are shown on the top left recorded at areas d, p, and s in the cell. The transientsin region d correspond to the dendrite region of the cell. Specific calcium signals can becorrelated to the action potentials shown on the bottom left. (From V,Lev-Ram, H. Mikayawa,N. Lasser-Ross, W. N. Ross, J. Neurophysiof., 1992, 68, 1170.)150-1 The Chemiluminescence
Phenomenon
Chemiluminescence is produced when a chemical re-action yields an electronically excited species thatemits light as it returns to its ground state. Chemilumi-nescence reactions are encountered in a number ofbiological systems, where the process is often termedbioluminescence. Examples of species that exhibit bio-luminescence include the firefly. the sea pansy, and cer-tain jellyfish, bacteria, protozoa. and crustacea. Thechemistry of the various natural bioluminescence pro-cesses is incompletely understood.
excitation quantum yield <PEX (excited states per mole-cule reacted) and the emission quantum yield "'EM(photons per excited statc). These relationships aredescribed by the equation
Over a century ago, it was discovered that severalrelatively simple organic compounds also arc capableof exhibiting chemiluminescence. The simplest type ofreaction of such compounds to produce chemilumines-cence can be formulated as
A + B-+C* + D
C* -+C + hv Chemiluminescencc systems useful in analytical chem-istry generally havc values of <PCL of OJll to 0.2.where C* represents the excited state of the species C.
Here, the luminescence spectrum is that of the reac-tion product C. Most chemiluminescence processesare considerably more complicated than is suggestedby these simple reactions.
For chemiluminescence. the radiant intensity tel(photons emitted per second) depends on the rate ofthe chemical reaction (dICl/dr) and the chemilumines-cence quantum yield <PCL(photons per molecule re-acted). The latter term is equal to the product of the
The instrumentation for chemiluminescence measure-ments is remarkably simple and may consist of only asuitable reaction vessel and a photomultiplier tube.Generallv, no wavelength selection device is necessarybecause the onlv sou;ce of radiation is the chemicalreaction betwe;n Ihe analyte and reagent. Several
19See, for example. 1. R. I..<lkowicz. Principles of Fluorescence Spec-froScOpy, 2nd ed .. ~cw York: Kluwcr Academic PublishlllgiPknum Press.1999: B. Herman, Fluorescence Micrmcopy. 2nd ed .. New York: Springer-Verlag, 19Y8
:uFor some reviews of chemiluminescence and its analytical applications.see K. A. Fletcher et al., Anal. Chern .. 2006, -'!( ..llJ-P; A. \1. Pow..: d al..Anal. Chern .. 2004, 76,4614; L. 1. Kricb. Anal. Chim. Acta, 2003. 500. 27lJ;R. ..••...Agbaria el aL Anal. Chern., 2002. 74. 39. 52: T ..\. Nieman. in Handbook of {,wmmental Techniques for AnalytIcal Chemistr.\ F .-\. 5(:ttked., Chap 27, Upper Saddk Ri\'eL Nl: PrentiCe-Hall. 1997.
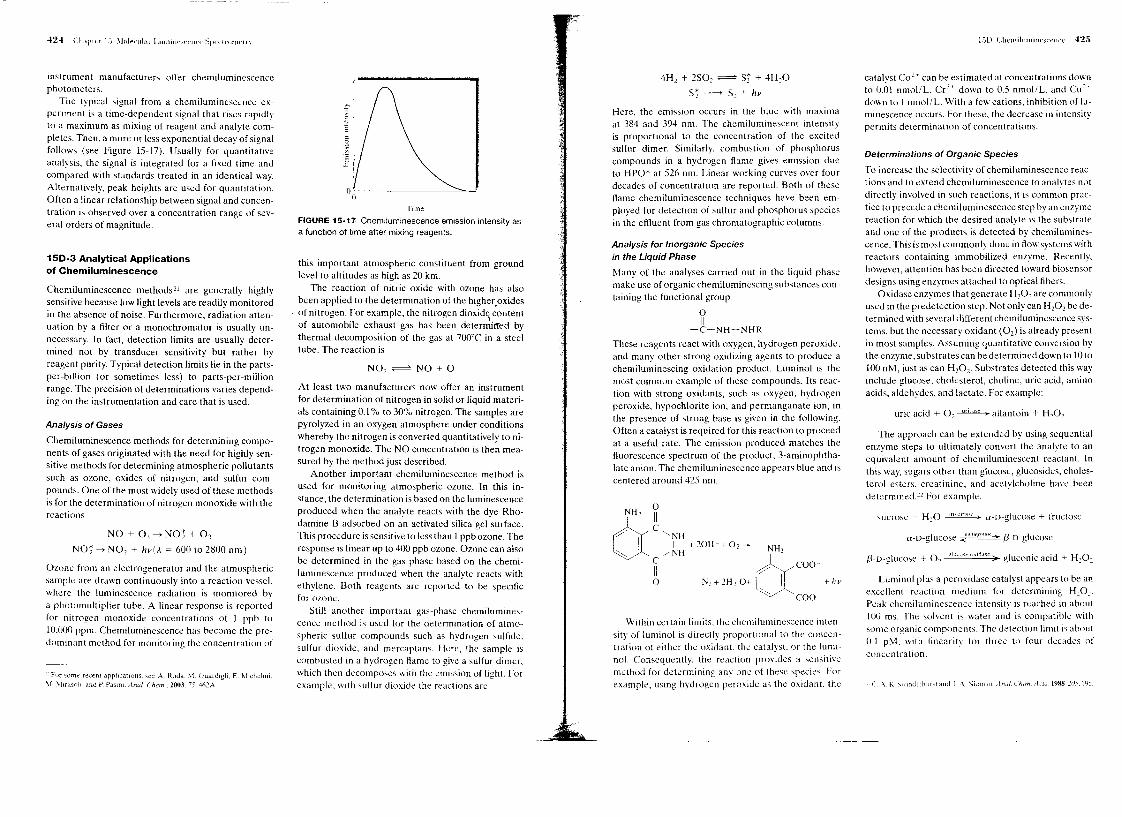
instrument manufacturers offer chemiluminescencephotometers.
The typical signal from a chemiluminescence ex·periment is a time·dependent signal that rises rapidlyto a maximum as mixing of reagent and analyte com-pletes. Then. a more or less exponential decay of signalfollows (see Figure 15-17). Usually for quantitativeanalysis. the signal is integrated for a fixed time andcompared with standards treated in an identical way.Alternatively, peak heights are used for quantitation.Often a linear relationship between signal and concen-tration is observed over a concentration range of sev-eral orders of magnitude.
150-3 Analytical Applicationsof Chemiluminescence
Chemiluminescence methods2l are generally highlysensitive because low light levels are readilv monitoredin the absence of noise. Furthermore, radiation atten-uation by a filter or a monochromator is usually un-necessary. In fact, detection limits are usually deter-mined not by transducer sensitivity but rather byreagent purity. Typical detection limits lie in the parts-per-billion (or sometimes less) to parts-per-millionrange. The precision of determinations varies depend·ing on the instrumentation and care that is used.
Analysis of Gases
Chemiluminescence methods for determining compo-nents of gases originated with the need for highly sen-sitive methods for determining atmospheric pollutantssuch as ozone. oxides of nitrogen. and sulfur com-pounds. One of the most widely used of these methodsis for the determination of nitrogen monoxide with thereactions
NO + 0l ....•NO! + O2
NO! ....•NO, + hv(A = 600 to 2800 nm)
Ozone from an electrogenerator and the atmosphericsample are drawn continuouslv into a reaction vesselwhere the luminescence radi'ation is monitored b~a photomultiplier tube. A linear response is reportedfor nitrogen monoxide concentrations of 1 ppb to10,000 ppm. Chemiluminescence has become the pre-dominant method for monitoring the concentration of
Time
FIGURE 15-17· Chemiluminescence emission intensity asa function of time after mixing reagents.
this important atmospheric constituent from groundlevel to altitudes as high as 20 km.
The reaction of nitric oxide with ozone has alsobeen applied to the determination of the higher oxidesof nitrogen. For example, the nitrogen dioxid~ ~ontentof automobile exhaust gas has been determirred bythermal decomposition of the gas at 700"C in a steeltube. The reaction is
At least two manufacturers now offer an instrumentfor determination of nitrogen in solid or liquid materi-als containing 0.1% to 30% nitrogen. The samples arepyrolyzed in an oxygen atmosphere under conditionswhereby the nitrogen is converted quantitatively to ni-trogen monoxide. The NO concentration is then mea-sured by the method just described.
Another important chemiluminescence method isused for monitoring atmospheric ozone. In this in-stance, the determination is based on the luminescenceproduced when the analyte reacts with the dye Rho·damine B adsorbed on an activated silica gel surface.This procedure is sensitive to less than 1ppb ozone. Theresponse is linear up to 400 ppb ozone. Ozone can alsobe determined in the gas phase based on the chemi·luminescence produced when the analyte reacts withethylene. Both reagents are reported to be specificfor ozone.
Still another important gas-phase chemilumines-cence method is used for the determination of atmo·spheric sulfur compounds such as hydrogen sulfide.sulfur dioxide. and mercaptans. Here, the sample iscombusted in a hydrogen flame to give a sulfur dimer.which then decomposes with the emission of light. Forexample. with sulfur dioxide the reactions are
4H2 + 2S02 ~ S; + 4H,OS! ----> s, + Iw
Here. the emission occurs in the blue with maximaat 384 and 394 nm. The chemiluminescent intensityis proportional to the concent ration of the excitedsulfur dimer. Similarly. combustion of phosphoruscompounds in a hydrogen flamc gives emission dueto HPO' at 526 nm. Linear working curves over fourdecades of concentration are reported. Both of theseflame chemiluminescence techniqucs have been em-ployed for detection of sulfur and phosphorus speciesin the effluent from gas chromatographic columns.
Analysis for Inorganic Speciesin the Liquid Phase
Many of the analyses carried out in the liquid phasemake use of organic chemilumincscing suhstances con·taining the functional group
oII
-C--NH-NHR
These reagents react with oxygcn, hydrogen peroxide.and many other strong oxidizing agents to produce achemilumincscing oxidation product. Luminol is themost common example of these compounds. Its reac-tion with strong oxidants, such as oxygen. hydrogenperoxide, hypochlorite ion, and permanganate ion, inthe presence of strong base is given in the following.Often a catalyst is required for this reaction to proceedat a useful rate. The emission produced matches thefluorescence spectrum of the product, 3-aminophtha-late anion. The chemiluminescence appears hlue and iscentered around 425 nm.
Within certain limits. the chemiluminescence inten-sity of luminol is directly proportional to the conccn-tration of either the oxidant. thc catalyst, or the lumi-nal. Consequently, the reaction provides a sensitivcmethod for determining any one of these species. Forexample. using hydrogen peroxidc as the oxidant. the
catalyst Co2' can he estimated at concentrations downto n.Ol nmol/L, Crl+ down to 0.5 nmoliL. and Cu"down to I nmoliL. With a few cations, inhibition of lu-minescence occurs. For these. the decrease in intensitypermits determination of concentrations.
Determinations of Organic Species
To increase the selectivity of chemiluminescence reac-tions and to extend chemiluminescence to analvtes notdirectly involved in such reactions, it is comm(;n prac-tice to precede a chemiluminescence step hy an enzymereaction for which the desired analyte is the substrateand onc of the products is detectcd by chemilumines-ccnce. This is most commonly done in flo'-,"systems withreactors containing immobilized enzyme. Recently,however, attention has been directed toward biosensordesigns using enzymes attached to optical fibers.
Oxidase enzymes that generate H20, are commonlyused in the predetection step. Not only can H,O, be de-termined with several different chemilumincscenee sys-tems, but the necessary oxidant (0,) is already presentin most samples. Assuming quantitative conversion bythe enzyme. substrates can be determined down to 10 to100 nM, just as can H,O,. Substrates detected this wayinclude glucose. cholesterol, choline, uric acid, aminoacids, aldehydes. and lactate. For exam pic:
The approach can be extended hy using sequentialenzyme steps to ultimately convert the analyte to anequivalent amount of chemilumineseent reactant. Inthis way, sugars other than glucose, glucosides, choles·terol esters, creatinine. and acetylcholine have beendetcrmined," For example.
Luminol plus a peroxidase catalyst appears to be anexcellent reaction medium for determining H20,.Peak chcmiluminescence intensity is reached in about100 ms. The solvcnt is water and is compatible withsome organic components. The detection limit is about0.1 pt\l. with linearity for three to four decades ofconcentration.

(a) Construct a spreadsheet and use it to draw a calibration curve for NADH.*(b) Find the least-squares slope and intercept for the plot in (a).
(c) Calculate the standard deviation of the slope and the standard deviationabout regression for the curve.
*(d) An unknown exhibits a relative fluorescence intensity of 12.16. Use thespreadsheet to calculate the concentration of NADH.
*(e) Calculatc the relative standard deviation for the result in part (d).*([) Calculate the relative standard deviation for the result in part (d) if a result
of 7.95 was the mean of three measurements.
15-8 The volumes of a solution containing 1.10 ppm of Zn2+ shown in the table were
pipetted into separatory funnels, each containing 5.00 mL of an unknown zincsolution. Each was extracted with three 5-mL aliquots of CCl, containing an ex-cess of 8-hydroxyquinoline. The extracts were then diluted to 25.0 mL and theirfluorescence measured with a fluorometer. The results were the following:
*Answers are provided at the end of the book for problems marked with an asterisk.
~ Problems with this icon are best solved using spreadsheets.
15-1 Explain the diffcrence between a fluorescence emission spectrum and a fluores-cence excitation spectrum. Which more closely resembles an absorption spectrum 0
15-2 Define the following terms: (a) fluorescence. (b) phosphorescence. (c) resonancefluorescence. (d) singlet state. (e) triplet state. (f) vibrational relaxation, (g) inter-nal conversion, (h) external conversion, (i) intersystem crossing, (j) predissocia-tion, (k) dissociation, (1) quantum yield, (m) chemiluminescence.
15-3 Why is spectrofluorometry potentially more sensitive than spectrophotometry?
15-4 Which compound in each of the pairs below would you expect to have a greaterfluorescence quantum yield" Explain.
0l:l£r0H~ I ~::::---... /-
~C02Hophenolphthalein
OH HOo-N=N-o
Volume Std.Zn2+,mL
FluorometerReadiug
0.0004.008.00
12.00
6.1211.16
15.6820.64
(a) Construct a working curve from the data.(b) Calculate a linear least-squares equation for the data.(c) Calculate the standard deviation of the slope and intercept and the standard
deviation about regression.(d) Calculate the concentration of zinc in the sample.(e) Calculate a standard deviation for the result in part (d).
*15-9 Quinine in a 1.664-g antimalarial tablet was dissolved in sufficient 0.10 M HCI togive 500 mL of solution. A 20.00-mL aliquot was then diluted to 100.0 mL withthe acid. Thc fluorescence intensity for the diluted sample at 347.5 nm provideda reading of 245 on an arbitrary scale. A standard l00-ppm quinine solution reg-istered 125 when measured under conditions identical to those for the dilutedsample. Calculate the mass in milligrams of quinine in the tablet.
*15-10 The determination in Problem 15-9 was modified to use the standard-additionmethod. In this case, a 4.236-g tablet was dissolved in sufficient 0.10 M HCl togive 1.000 L. Dilution of a 20.00-mL aliquot to 100 mL yielded a solution thatgave a reading of 448 at 347.5 nm. A second 20.00-mL aliquot was mixed with10.0 mL of 50-ppm quinine solution before dilution to 100 mL. The fluorescenceintensity of this solution was 525. Calculate the percentage of quinine in thetablet.
*15-11 Iron(lI) ions catalyze the oxidation of luminol by H20,. The intensity of theresulting chemiluminescence has been shown to increase linearly with iron(lI)concentration from 10 -10 to 10 -, M.
Exactlv 1.00 mL of water was added to a 2.00-mL aliquot of an unknownFe(ll) sol~tion, followed by 2.00 mL of a dilute H20, solution and 1.00 mL of analkaline solution of luminol. The chemiluminescence from the mixture was inte-grated over a Ia.o-s period and found to be 14.3.
OH HOn N-N h\dll\dH H
bis(o-hydroxyphenyl) hydrazine
15-5 Why do some absorbing compounds tluoresce but others do not?
15-6 Discuss the major reasons why molecular phosphorescence spectrometry has notbeen as widely used as molecular fluorescence spectrometry.
15-7 The reduced form of nicotinamide adenine dinucleotide (NADH) is an importantand highly fluorescent coenzyme. It has an absorption maximum of 340 nm andan emission maximum at 465 nm. Standard solutions of NADH gave the followingfluorescence intensities:
0.10002000.3000.400O.SOO0.6000.7000.800
2.244.526.639.0[
}O.94
13.7115.4917.91

To a second 2.DO-mLaliquot of the sample was added I.DOmL of a 3.58 x10 .\Nt Fe(ll) solution followed by the same volume of H,O, and luminol. Theintegrated intensity was 33.3. Find the concentration of Fe(ll) in the sample.
15-12 Equations for the chemiluminescence determination of SO, are given onpage 425. Derive an expression for the relationship between the concentrationof SO, in a sample. the luminescence intensity. and the equilibrium constant forthe first reaction.
15-13 Quinine is one of the best-known fluorescent molecules, and the sensitivities offluorometers are often specified in terms of the detection limit for this molecule.The structure of quinine is given below. Predict the part of the molecule that ismost likely to behave as the chromophore and fluorescent center.
where T is the observed lifetime of the excited state in the presence of a quench-ing agent and TO is the natural lifetime in the absence of a quencher. The fluor-escence radiant power F is given by Equation 15-7. This quantity is affected bycollisional quenching because the lifetime T is intluenced by collisional quench-ing. Derive an equation to show that the F-T ratio is independent of collisionalquenching and directly related to concentration. (From G. M. Hieftje and G. R.Haugen, Anal. Chim. Acta, 1981, 123, 255.)
~ IS-IS The following lifetimes were measured for the chloride quenching of quinine sul-fate given in Example 15-1. The fluorescence intensities are given in the example.
0.lX10
00050.0100.0150.0200112500300.040U.050
(a) Plot fluorescence intensity 'usus [0 ].(b) Plot the ratio of intensity to lifetime. F-T versus [0 I.
(c) Develop a normalization factor to correct the measured tluorescence inten-sitv to that of the solution without quencher.
(d) PI~)ton the same graph Fversus [Oland Foon versus [O-J.
Challenge Problem
15-16 The following volumes of a standard 10.0 ppb F solution were added to fourlO.OO-mLaliquots of a water sample: O.DO, I.DO,2.DO, and 3.00 mL. Precisely5.00 mL of a solution containing an excess of the strongly absorbing AI-acidalizarin garnet R complex was added to each of the four solutions, and theywere ea;h diluted to 50.0 mL. The fluorescence intensities of the four solutionswere as follows:
0.00 6R.21.00 55.32.00 4l.33.00 288
Explain the chemistry of the analytical method.Construct a plot of the data.Use the fact that the fluorescence decreases with increasing amounts of theF- standard to derive a relationship like Equation 1-3 for multiple standardadditions. Use that relationship further to obtain an equation for the un-known concentration c, in terms of the slope and intercept of the standard-additions plot, similar to Equation 1-4.Use linear least squares to find the equation for the line representing thedecrease in fluorescence relative to the volume of standard fluoride V,.Calculate the standard deviation of the slope and intercept.Calculate the concentration of F' in the sample in parts per billion.Calculate the standard deviation of the result in (e).
An Introductionto InfraredSpectrometry
T.he infrared. fIR) region.of the spe...c.trum en-compasses radiation with wavenumbersranging from about 12,800 to 10 cm -lor
wavelengths from 0.78 to 1000 I'm. Because ofsimilar applications and instrumentation, the JR
spectrum is usually subdivided into three regions,the near-JR, the mid-JR, and the far-JR. The tech-
niques and the applications of methods based onthe three JR spectral regions differ considerably as
discussed in this chapter.
~ Throughout this chapter, this logo indicateslQ.j an opportunity for online self-study at www.thomsonedu.com/chemistrylskoog, linking you tointeractive tutorials, simulations, and exercises.
Table 16-1 gives the rough limits of each of the threeregions. Measurements in the near-IR region are oftenmade with photometers and spectrophotometers simi-lar in design and components to the instruments de-scribed in earlier chapters for ultraviolet-visible spec-trometry. The most important applications of thisspectral region have been to the quantitative analysisof industrial and agricultural materials and for processcontrol. Applications of near- IR spectrometry are dis-cussed in Section 170.
Until the early 19805, instruments for the mid-IRregion were largely of the dispersive type and useddiffraction gratings. Since that time, however, mid-IRinstrumentation has dramatically changed so that nowthe majority of new instruments are of the Fouriertransform type. Photometers based on interferencefilters also find use for measuring the composition ofgases and atmospheric contaminants.
The appearance of relatively inexpensive Fouriertransform spectrometers in the last decade has mark-edly increased the number and type of applicationsof mid-IR radiation. This increase has come aboutbecause interferometric instruments can produceimprovements of an order of magnitude, or more, insignal-to-noise ratios and detection limits over disper-sive instruments. Before the appearance of these in-struments, the mid-IR spectral region was used largelyfor qualitative organic analysis and structure determi-nations based on absorption spectra. Now, in contrast,mid-IR spectrometry is beginning to be used in addi-tion for quantitative analysis of complex samples byboth absorption and emission spectrometry. Applica-tions of this spectral region are also beginning to appearfor microscopic studies of surfaces, analysis of solids byattenuated total reflectance and diffuse reflectance.photoacoustic measurements, and other uses. Severalof these applications are described in Chapter 17.
In the past the far-IR region of the spectrum. al-though potentially quite useful, had limited use becauseof experimental difficulties. The few sources of this typeof radiation are notoriously weak and are further atten-uated by the need for order-sorting filters that preventradiation of higher grating orders from reaching thedetector. Fourier transform spectrometers, with theirmuch higher throughput. largely alleviate this problemand make the far-[R spectral region much more acces-sible to chemists. Several applications of far-IR spec-troscopy are described in Section 17E.
[n this chapter, we first deal with the mechanismsof the absorption. emission. and reflection of IR radia-
TABLE 16-1 IR Spectral Regions
NearMiddleFarMost used
0.78 to 2.52.5 to 5050 to 10002.5 to 15
tion using absorption spectroscopy as the basis for thisdiscussion. We follow this discussion with a descriptionof the components of IR instruments and how theseare arranged in dispersive and nondispersive instru-ments as ~ell as in Fourier transform spectrometers. I
16A THEORY OF IR ABSORPTIONSPECTROMETRY
[R absorption, emission, and reflection spectra for mo-lecular species can be rationalized by assuming that allarise from various changes in energy brought about bytransitions of molecules from one vibrational or rota-tional energy state to another. [n this section we usemolecular absorption to illustrate the nature of thesetransitions.
16A-1 Introduction
Figure 16-1 shows a typical output from a commercialIR spectrophotometer. Although the y-axis is shownas linear in transmittance, modern computer-basedspecTr\lphotometers can also produce spectra that arelinea)" in absorbance. The abscissa in this spectrum IS
linear in wavenumbers with units of reciprocal cen-timders. A wavelength scale is also shown at the topof the plot. Computer-based spectrophotometers canalso produce a variety of other spectral formats such aslinear in wavelength, baseline corrected, and derivativeand smoothed spectra.
A linear wavenumber scale is usually preferred inIR spectroscopy because of the direct proportionalitybetween this quantity and both energy and frequency.The frequency of the absorbed radiation is, in turn, the
'F\)f detailed treaul1cntso{ IR spectrometry. see N. B. Colthup. L. H. Daly',and S. L Wibcrk\. Itarodu.ction tv Infrared I1nd Ramafl SPI'c£ro_\·(~OI}\'·
3rd ed., San Diego: ~-\cadcmic Press, 1990; B. Schrader, lrlfrared IInd RanumSpectroscop.\", New York: Vel-L 1I~~5;C~P. S. ~su. III Jlmulbo.ok of ~n!;lru.
fflmwl Tt.Yhniques for An,I1vtlcul Chef/iliffI'. f. Sdtle. cd .. lrrt'f SaddleRi\t'L NJ: Prentice Hall. 1997.Chap. 15
12800 to 40004000 to 200200 to 104000 to 670
molecular vibrational frequency actually responsiblefor the absorption process. Frequency. however, is sel-dom if ever used as the abscissa because of the incon-venient size of the unit; that is. a frequency scale of theplot in Figure 16-[ would extend from 1.2 x 10" to2.0 x 10 tJ Hz. Although the axis in terms of wavenum-bers is often referred to as a frequency axis, keep inmind that this terminology is not strictly correct be-cause the wavenumber v is only proportional to fre-quency v. The relationships are given in Equation 16-1.
I !'(Hz)v (cm-1) = _.- x 104(~mJcm) ~ ~-( mJ··~) (16-1),q~m) L c s
Finally, note that the horizontal scale of Figure 16-1changes at 2000 cm -I, with the units at higherwavenum-bers being represented by half the linear distance ofthose at lower wavenumbers. The expanded scale in theregion from 2000 to 650 cm' I permits easier identifica-tion of spectral features. Numerous [R bands usuallyappear in this region.
Dipole Moment Changes duringVibrations and Rotations
IR radiation is not energetic enough to bring about thekinds of electronic transitions that we have encoun-tered in our discussions of ultraviolet and visible radia-tion. Absorption of [R radiation is thus confined largelyto molecular species that have small energy differencesbetween various vibrational and rotational states.
To absorb [R radiation. a molecule must undergo anet change in dipole moment as it vibrates or rotates.Onlv under these circumstances can the alternatingelectric ticld of the radiation interact with the moleculeand cause changes in the amplitude of one of its mo-tions. For example. the charge distribution around amolecule such as hvdrogen chloride is not symmetricbecause the chlorine has a higher electron density thanthe hydrogen. Thus. hydrogen chloride has a significantdipolc moment and is said to be polar. The dipole mo-ment is determined by the magnitude of the charge

V·"a\elcngth. 11m2.5 30 ~.O 5.0 7.0 ~.(l 90 10.0 12.0 15.0
IlOa
90
80
70,
~ 60
I 50
~O
30
20
10
a~O(}O 3600 3200 2~OO HOO 200() I ~OO 1600 I~OO 1200 1000 ~OO 650
Wavenumber. em J
FIGURE 16-1 IR absorptjon spectrum of a thin polystyrene film. Note the scale change on thex-axis at 2000 em -'.
difference and the distance between the two centersof charge. As a hydrogen chloride molecule vibrates, aregular fluctuation in its dipole moment occurs, anda field is established that can interact with the elec-tric field associatcd with radiation. If the frequency ofthe radiation exactly matches a natural vibrational fre-quency of the molecule, absorption of the radiationtakes place that produces a change in the amplitude ofthe molecular vibration. Similarly, the rotation of asym-metric molecules around their centers of mass results inperiodic dipole moment fluctuations that allow interac-tion with the radiation lield.
No net change in dipole moment occurs during thevibration or rotation of homonuclear species such as0> N" or CI,. As a result, such compounds cannot ab-sorb IR radiation. With the exception of a few com-pounds of this type. all other molecular spccies ahsorbIR radiation.
Rotational Transitions
The energy required to cause a change in rotationallevel is quite small and corresponds to radiation of <, 'S
100 cm-' (A > l<XJ 11m). Because rotationalle"e1s arcquantized. absorption by gases in this far-IR region ischaracterized by discrete, well-dclincd lines. In liquidsor solids. intramolecular collisions and interactionscause hroadening of the lines into a continuum.
[Qj Tworiu/: Learn more ahout IR absorption.
y
Vibrational-Rotational Transitions
Vibrational energy levels arc also quantized. and formost molecules the energy differences between quan-tum states correspond to the mid-IR region. The IRspectrum of a gas usually consists of a series of closelyspaced lines, because there are several rotational en-ergy levels for each vibrational level. On the otherhand, rotation is highly restricted in liquids and solids;in such samples, discrete vibrational-rotational linesdisappear, leaving only somewhat broadened vibra-tional bands.
FIGURE 16-2 Types of molecular vibrations. Note that+ indicates motion from the page toward the reader and- indicates motion away from the reader.
ous change in the interatomic distance along the axisof the bond between two atoms. Bending vibrationsarc characterized by a change in the angle hetweentwo bonds and arc of four types: scissoring, rocking,
Types of Molecular Vibrations
The relative positions of atoms in a molecule are notfixed but instead fluctuate continuously as a con-sequence of a multitude of different types of vihra-tions and rotations about thc bonds in the molecule.For a simple diatomic or triatomic molecule. it is easyto define the number and nature of such vihrationsand relate these to energies of absorption. An anal v-sis of this kind becomes diflicult if not impossible formolecules made up of many atoms. Not on Iv do largcmolecules have a large number of vibrating centers.but also interactions among several ccnkrs can oc-cur and must be taken into account for a completeanalysis.
Vihrat ions fall into the hasic categories of stretchingand bending. A stretching vibration involves a continu-
\vagging. and t\visting. These are shown schematicallyin Figure 16-2.
All of the vibration tvpes shown in Figure 1(,-2 maybe possible in a molecule containing morc than twoatoms. In addition. interaction or coupling of vibrationscan occur if the vibrations involve bonds to a single cen-tral atom. The result of coupling is a change in the char-acteristics of the vibrations involved.
In the treatment that follows, we first considerisolated vihrations represented by a simple harmonicoscillator model. Modilications to the theory of the har-monic oscillator, which are needed to describe a mo-lecular system, arc taken up next. Finallv. the cffectsof vibrational interactions in molecular systems arediscussed.
16A-2 Mechanical Model of a StretchingVibration in a Diatomic Molecule
The characteristics of an atomic stretching vibrationcan be approximated by a mechanical model consist-ing of two masses connected hy a spring. A disturbanceof one of these masses along the axis of the springresults in a vibration called a simple harmonic molion.
Let us first consider the vibration of a single massattached to a spring that is hung from an immovahleobject (see Figure 16-3'1). If the mass is displaced a dis-tance y from its equilibrium position by application ofa force along the axis of the spring, the restoring force
FtGURE 16-3 Potential-energy diagrams. (a) harmonic OSCillator. (b) Curve 1, harmonicoscillator: curve 2, anharmonic motion.

F is proportional to the displacement (Hooke's law).That is,
where k is the force constant. which depends on thestiffness of the spring. The negative sign indicates thatF is a restoring force. This means that the direction ofthe force is opposite the direction of the displacement.Thus, the force tends to restore the mass to its originalposition.
Potential Energy of a Harmonic Oscillator
The potential energy E of the mass and spring can bearbitrarily assigned a value of zero when the mass is inits rest, or equilibrium, position. As the spring is com-pressed or stretched, however, the potential energy ofthis system increases by an amount equal to the workrequired to displace the mass. If, for example, the massis moved from some position y to y + dy, the work andhence the change in potential energy dE is equal to theforce F times the distance dy. Thus,
dE = -Fdy
Combining Equations 16-3 and 16-2 yields
dE = ky dy
Integrating between the equilibrium positiony = a andy gives
i'dE = j"'ydyo 0
E = !ky'2
The potcntial-energy curve for a simple harmonicoscillation, derived from Equation 16-4, is a parabola,as depicted in Figure l6-3a. Notice that the potentialenergy is a maximum when the spring is stretched orcompressed to its maximum amplitude A, and it de-creases to zero at the equilibrium position.
Vibrational Frequency
The motion of the mass as a function of time r can bededuced from classical mechanics as follows. Newton'ssecond law states that
where m is the mass and a is its acceleration. But ac-celeration is the second derivative of distance with re-spect to time. Thus,
d'vm dr', = -ky
A solution to this equation must be a periodic functionsuch that its second derivative is equal to the originalfunction times - k/m. A suitable cosine relationshipmeets this requirement. Thus, the instantaneous dis-placement of the mass at time r can be written as
where "•• is the natural vibrational frequency and Ais the maximum amplitude of the motion. The secondderivative of Equation 16-6 is
d'y--" = -41T2V,;,Acos21TVmtdt"
Substitution of Equations l6-6 and 16-7 into Equa-tion 16-5 gives
where "m is the natural frequency of the mechanicaloscillator. Although it depends on the force constantof the spring and the mass of the attached body, thenatural frequency is independent of the energy im-parted to the system; changes in energy merely resultin a change in the amplitude A of the vibration.
The equation just developed may be modified to de-scribe the behavior of a system consisting of two massesml and m, connected by a spring. Here, it is only neces-sary to substitute the reduced mass I' for the single massm where
m1n121'=-----
Inl + n1~
Thus. the vibrational frequency for such a svs[em isgiven by
1 !k I '[(nil + m,)Vm = l;-\/; = 21T \. fJljJ112
Molecular Vibrations
The approximation is ordinarily made that the be-havior of a molecular vibration is analogous to themechanical model just described. Thus, the frequencyof the molecular vibration is calculated from Equa-tion 16-10 after substituting the masses of the twoatoms for ml and m,. The quantity k is the force con-stant of the chemical bond, which is a measure of itsstiffness.
16A-3 Quantum Treatment of Vibrations
The equations of ordinary mechanics that we have usedthus far do not completely describe the behavior of par-ticles of atomic dimensions. For example, the quantizednature of molecular vibrational energies, and of otheratomic and molecular energies as well, does not appearin these equations. We may, however, invoke the 'con-cept of the simple harmonic oscillator to develop thewave equations of quantum mechanics. Solutions ofthese equations for potential energies have the form
E=(V+l)!!- (£2 27r\);
where h is Planck's constant, and v is the vibrationalquanttlm number, which can take only positive integervalues (including zero). Thus, in contrast to ordinarymechanics where vibrators can assume any potentialenergy, quantum mechanical vibrators can take ononlv certain discrete energies.
it is interesting to note that the factor Vk/J1./2rr ap-pears in both the classical and the quantum equations;by substituting Equation 16-10 into 16-11, we find
F. = (v + ~ )h"", (16-12)
where v'" is the vibrational frequency of the classicalmodel.'
We now assume that transitions in vibrational en-ergv levels can be brought about by absorption of ra-di;iion. provided the energy of the radiation exactlymatches the difference in energy levels j.E betweenthe vibrational quantum stales and provided also thevibration causes a change in dipole moment. This dif-ference is identical between any pair of adjacent levels.
'Lnfortunatdv. the generally accepted ~"ymbol tor the vibrational quan-tum numher r'is similar in appearance [0 the Greek nu. Il. which symbol-iZeS frequeno.:y. Thus. conslant care must he exercised to avoid confusing,the two 1Il equations -.;uch as Equation 16-12
because v in Equations 16-11 and 16-12 can assumeonly whole numbers; that is,
h rkj.E=hv =- i-•• 27r \ I'
At room temperature, the majority of molecules are inthe ground state v = 0; thus, from Equation 16-12,
1Eo = "2h" ••
("ih" - !h" ) = h"••2 •• 2 ••
The frequency of radiation v that will bring about thischange is identical to the classical vibrational frequencyof the bond "",. That is,
E - h •. - 'E' = h,' =!!- IIradiation - y - I..). m 21T \j f..L
v=v =~ 0-•• 2rr \I I'
If we wish to express the radiation in wave numbers, wesubstitute Equation 6-3 and rearrange:
1'-'; " ,-,;v = -,1- = 5.3x 1O-'"\!--
2rrc 'IJ I' ' I'
where v is the wavenumber of an absorption maximum(cm - I), k is the force constant for the bond in newtonsper meter (N/m), c is the velocity of light (cm sol), andI' is the reduced mass (kg) defined by Equation 16-93
IR measurements in conjunction with Equation16-14 or 16-15 permit the evaluation of the force con-stants for various types of chemical bonds. Generally,k has been found to lie in the range between 3 X la'and 8 X 10' N/m for most single bonds, with 5 x 10'serving as a reasonable average value. Double andtriple bonds are found by this same means to haveforce constants of about two and three times this value(1 X 10³ and l.5 X 103 N/m, respectively). With these

average experimental values, Equation 16-15 can beused to estimate the wavenumber of the fundamentalabsorption band, or the absorption due to the transi-tion from the ground state to the first excited state, fora variety of bond types. The following example dem-onstrates such a calculation.
Calculate the approximate wavenumber and wave-length of the fundamental absorption due to thestretching vibration of a carbonyl group C=O.
Solution
12 X 103 kg/mctml 6.0 X 10²³awmImct x
~ 2.0 X 10⁻²⁶ kg
Similarly, for oxygen,
m, ~ (16 x 10-3)/(6.0 x 1023) ~ 2.7 X 10⁻²⁶ kg
and the reduced mass J1 is given by (Equation 16-9)
2.0 x 10-26 kg x 2.7 X 10-26 kgJ1 ~ (2.0 + 2.7) x 10-26 kg
= 1.1 X 10⁻²⁶ kg
As noted earlier, the force constant for the typicaldouble bond is about I X 103 N/m. Substituting thisvalue and J1 into Equation 16-15 gives
- - - 0 10 12 . J IX 103 N/mv - )._, x s/cm -------1.1 x 10⁻²⁶ kg
= 1.6 X 103 cm-I
The carhonyl stretching hand is found experimentallyto be in the region of 1600 to 1800 cml (6.3 to 5.6 !lm).
Selection Rules
As given by Equations 16-12 and 16-13, the energy fora transition from energy level I to 2 or from level 2 too should he identical to that for the 0 to 1 transition.Furthermore. quantum theory indicates that the onlytransitions that can take place are those in which thevihrational quantum numher changes by unity; that
is, the selection rule states that ilv = :<::1. Because thevibrational levels are equally spaced for a harmonicoscillator, only a single ahsorption peak should be ob-served for a given molecular vibration. In addition tothe ilv ~ :<::1 selection rule, there must be a change indipole moment during the vibration.
Anharmonic Oscillator
Thus far, we have considered the classical and quantummechanical treatments of the harmonic oscillator. Thepotential energy of such a vibrator changes periodicallyas the distance between the masses fluctuates (Fig-ure 16-3a). From qualitative considerations, however,this description of a molecular vibration appears im-perfect. For example, as the two atoms approach oneanother, coulomhic repulsion between the two nucleiproduces a force that acts in the same direction as therestoring force of the bond. For this reason, the poten-tial energy can be expected to rise more rapidly thanthe harmonic approximation predicts. At the other ex-treme of oscillation. a decrease in the restoring force,and thus the potential energy, occurs as the interatomicdistance approaches that at which dissociation of theatoms takes place.
In theory, the wave equations of quantum mechanicspermit the derivation of more nearly correct potential-energy curves for molecular vibrations. Unfortunately,however, the mathematical complexity of these equa-tions prevents their quantitative application to all butsimple diatomic systems. Qualitatively, the curves takethe anharmonic form shown as curve 2 in Figure 16-3b.Such curves depart from harmonic behavior by vary-ing degrees, depending on the nature of the bond andthe atoms involved. Note, however, that the harmonicand anharmonic curves are nearly alike at low potentialenergies.
Anharmonicity leads to deviations of two kinds. Athigher quantum numbers, ilE becomes smaller (seecurve 2 in Figure 16-3b), and the selection rule is notrigorously followed. As a result, weaker transitionscalled overtones are sometimes observcd. These tran-sitions correspond to ilv ~ :<::2or :<::3.The frequenciesof such overtone transitions are approximately two orthree times that of the fundamental frequency, and theintensities arc lower than that of the fundamental.
Vibrational spectra are further complicated hy twodifferent vibrations in a molecule interacting to giveabsorptions at frequencies that are approximately thesums or differences of their fundamental frequencies.
Again, the intensities of these sum and differencebands are generally low.
It is ordinarily possible to deduce the numher andkinds of vibrations in simple diatomic and triatomicmolecules and whether these vibrations will lead toabsorption. Complex molecules may contain severaltypes of atoms as well as hands. For these molecules.the many types of possihle vibrations give rise to lRspectra that are much more diflicult to analyze.
The number of possible vibrations in a polyatomicmolecule can be caleulated as follows. Three coordi-nates are needed to locate a point in space. To fix Npoints requires a set of thrce coordinates for each point,for a total of 3N. Each coordinate corresponds to onedegree of freedom for one of the atoms in a polyatomicmolecule. For this reason. a molecule containing Natoms is said to have 3N degreesoffreedom.
In defining the motion of a molecule, we need toconsider (1) the motion of the entire molecule throughspace (that is, the translational motion of its center ofgravity); (2) the rotational motion of the entire mole-cule around its center of gravity; and (3) the motion ofeach of its atoms relative to the other atoms. or in otherwords, its individual vibrations. Because all atoms inthe molecule move in concert through space, definitionof translational motion requires three coordinates andthus this common motion requires three of the 3N de-grees of freedom. Another three degrees of freedomare needed to describe the rotation of the molecule asa wh~le. The remaining 3N - 6 degrees of freedom in-volve i'nteratomic motion and hence represent thenumber of possible vibrations within the molecule. Alinear molecule is a special case because. by definition,al! of the atoms lie on a single. straight line. Rotationabout the hand axis is not possible, and two degrees offreedom suffice to describe rotational motion. Thus,the number of vibrations for a linear molecule is givenby 3N - 5. Each of the oN - 6 or 3N - 5 vibrations iscalled a normal mode.
For each normal mode of vibration. there is apotential-energy relationship such as that shown bythe solid lines in Figure 16-3h. The same selection rulesdiscussed earlier apply for each of these relationships.In addition, to the extent that a vibration approxi-mates harmonic behavior. the differences between theenergy levels of a given vihration are the same: that is.
a single absorption peak appears for each vibrationhaving a change in dipole moment.
Four factors tend to produce fewer experimentalbands than would be expected from the theoreticalnumber of normal modes. Fewer absorption bands arefound when (1) the symmetry of the molecules is suchthat no change in dipole moment results from a partic-ular vibration; (2) the energies of two or more vibra-tions are identical or nearly identical; (3) the absorp-tion intensity is so low as to be undetectable by ordinarymeans; or (4) the vibrational energy is in a wavelengthregion beyond the range of the instrument.
Occasionally, more absorption bands are found thanare expected based on the number of normal modes.We have already mentioned the overtone bands thatoccur at two or three times the frequency of the funda-mental. In addition, combination bands are sometimesencountered when a photon excites two vibrationalmodes simultaneously. The frequency of the combina-tion band is approximately the sum or difference of thetwo fundamental frequencies. This phenomenon oc-curs when a quantum of energy is absorbed by twobonds rather than one.
16A-5 Vibrational Coupling
The energy of a vibration, and thus the wavelength ofthe corresponding absorption maximum, may be influ-enced by (or coupled with) other vibrators in the mol-ecule. A number of factors influence the extent of suchcoupling.
1. Strong coupling between stretching vibrations oc-curs only when there is an atom common to the twovibrations.
2. Interaction between bending vibrations requires acommon bond between the vibrating groups.
3. Coupling between a stretching and a bending vibra-tion can occur if the stretching bond forms one sideof the angle that varies in the bending vibratioIl.
4. Interaction is greatest when the coupled groups haveindividual energies that are nearly equal.
5, Little or no interaction is observed between groupsseparated by two or more bonds.
6. Coupling requires that the vibrations he of the samesymmetry species.-'
~For a discussion of symmetry operations and symmetry species, seeFA. Cottoo. Chemical ApplicaliollS afGroup Theory, Jrd ed .. l\iew York:Wiley 1990: R. S. Drago. Phvsical Mc:thods for Chemists, 2nd ed .. Phila-delphia: Saunders. 19Y::!.

As an example of coupling effects, let us considerthe IR spectrum of carbon dioxide. If no coupling oc~curred between the two C=O bonds, an absorptionband would be expected at the same wavenumber asthat for the C=O stretching vibration in an aliphaticketone (about 1700 cm', or 6 ~m; see Example 16-1).Experimentally, carbon dioxide exhibits two absorp~tion maxima. one at 2350 cm-1 (4.3 ~m) and the otherat 667 cm-1 (15 ~m).
Carbon dioxide is a linear molecule and thus has(3 x 3) - 5 = 4 normal modes. Two stretching vibra~tions are possible; furthermore, interaction betweenthe two can occur because the bonds involved are asso-ciated with a common carbon atom. As can be seen, oneof the coupled vibrations is symmetric and the other isasymmetric.
The symmetric vibration causes no change in dipolemoment, because the two oxygen atoms simulta-neously move away from or toward the central carbonatom. Thus, the symmetric vibration is IR inactive.In the asymmetric vibration, one oxygen moves awayfrom the carbon atom as the carbon atom moves towardthe other oxygen. As a consequence, a net change incharge distribution occurs periodically, producing achange in dipole moment, so absorption at 2350 cm-1
results.The remaining two vibrational modes of carbon
dioxide involve scissoring, as shown here.
These two bending vibrations are the resolved compo-nents at 90' to one another of the bending motion in allpossible planes around the bond axis. The two vibra-tions are identical in energy and thus produce a singleabsorption band at 667 cm '. Quantum states that areidentical, as these are, are said to be degenerate.
It is of interest to compare the spectrum of carbondioxide with that of a nonlinear, triatomic moleculesueh as water, sulfur dioxide, or nitrogen dioxide. Thesemolecules have (3 x 3) -- 6 = 3 vibrational modes thattake the following forms:
Because the central atom is not in line with the othertwo, the symmetric stretching vibration produces achange in dipole moment and is thus IR active. For ex~ample, stretching peaks at 3657 and 3766 cm --1 (2.74 and2.66 ~m) appear in the IR spectrum for the symmetricand asymmetric stretching vibrations of the water mol~ecule. There is only one component to the scissoringvibration for this nonlinear molecule because motion inthe plane of the molecule constitutes a rotational de~gree of freedom. For water, the bending vibrationcauses absorption at 1595 cml (6,27 ~m). The differ-ence in behavior of linear and nonlinear triatomic mol-ecules with two and three absorption bands, respec-tively, illustrates how IR absorption spectroscopy cansometimes be used to deduce molecular shapes.
Coupling of vibrations is a common phenomcnon.As a result, the position of an absorption band corre-sponding to a given organic functional group cannot bespecified exactly. For example, the C-O stretching fre~quency in methanol is 1034 cm -I (9.67 ~m), in ethanol itis 1053 cm-I (9.50 ~m), and in 2~butanol it is 1105 cm-1
(9.05 ~m). These variations result from a coupling ofthe C--o stretching with adjacent C-C stretching orC-H vibrations.
Although interaction effects may lead to uncertain~ties in the identification of functional groups containedin a compound, it is this very etIect that provides theunique features of an IR absorption spectrum that areso important for the positive identification of a specificcompound.
Three types of instruments for IR absorption mea~surements are commonly available: (1) dispersivespectrophotometers with a grating monochromator;(2) Fourier transform spectrometas employing an
interferometer (Section 71); and (3) nondispersivephotometers using a filter or an absorbing gas thatare used for analysis of atmospheric gases at specificwavelengths.
Until the 1980s, the most widely used instrumentsfor IR measurements were dispersive spectrophotom~eters. Now, however. this type of instrument has beenlargely displaced for mid- and far-IR measurementsby Fourier transform spectrometers because of theirspeed, reliability, signal~to~noise advantage, and conve-nience. Dispersive spectrometers are still used in thenear~IR where they are often extensions of UV-visibleinstruments, but many dedicated near~IR instrumentsare of the Fourier transform --IR (FTIR) type.
168-1 Fourier Transform Spectrometers
The theoretical basis and the inherent advantages ofFourier transform (FT) and .other multiplex instru~ments were discussed in some detail in Section 71, andthe reader mav find it worthwhile to review that sec-tion before pr~ceeding further. Two types of multiplexinstruments have been described for the IR region.In the FT spectrometer, coding is accomplished bysplitting the source into two beams whose path lengthscan be varied periodically to give interference pat-terns. The FT is then used for data processing.' Thesecond is the Hadamard transform spectrometer,which is a dispersive instrument that employs a movingmask at the focal plane of a monochromator for en-coding the spectral data. Hadamard transform IR in~struments have not been widely adopted and will,there1'qre, not be discussed further in this book.6
When FTIR spectrometers first appeared in themark'etplace, they were bulky, expensive (>$100,000),and required frequent mechanical adjustments. Forthese reasons, their use was limited to special applica-tions where their unique characteristics (speed, highresolution, sensitivity, and unparalleled wavelengthprecision and accuracy) were essential. FT instru-
5For detailed discu~ions of Fourier transform IR spectroscopy, see S.Davis, M. Abrams. J. Brault, Fourier Trallsforll! Spectrometry, San Diego'Academic Press, 20t.H: B. C. Smith. FundameJltllls of Fourier TransformInfrared SpeCIr05copy. Boca Raton. FL: eRe Press. 1996; P. R Gnfiithsand J. A. dd-Iaselh. Fourier Trans/ormln(rared Spectroscopy. :\cw York:
Wile\'. 1986"'For"a description of tht: Hadamard transform and Hadamard tran.sformspectroscopy. see D. K. Graff. I Cht'm. Educ.. 1995, 72, 30-L Fourier,Hadamard, and Hilbert Tramjorms ill Chemistn'. A. G.I\Iarshall, cd .. Ne\\York: Plenum Press. 19S2.
ments have now been reduced to benchtop size andhave become reliable and easy to maintain. Further~more, the price of simpler models has been reduced tothe point where they are competitive with all but thesimplest dispersive instruments (-$15.000 and more).For these reasons, FT instruments have largely dis-placed dispersive instruments in the laboratory.-
Components of FT Instruments
The majority of commercially available FTIR instru~ments are based on the Michelson interferometer, al~though other types of optical systems are also encoun~teredo We shall consider the Michelson design only,which is illustrated in Figure 7~43.8
Drive Mechanism, Requirements for satisfactory in~terferograms (and thus satisfactory spectra) are thatthe moving mirror have constant speed and a positionexactly known at any instant. The planarity of the mir~ror must also remain constant during its entire sweepof 10 em or more.
In the far-IR region, where wavelengths range from50to 1000 ~m (200 to 1Oem-I),displacementofthe mir~ror bv a fraction of a wavelength, and accurate mea~sure~ent of its position, can be accomplished by meansof a motor-driven micrometer screw. A more preciseand sophisticated mechanism is required for the mid~and near-IR regions, however. Here, the mirror mountis generally floated on an air bearing held within close~fitting stainless steel sleeves (see Figure 16~4). Themount is driven by a linear drive motor and an electro-magnetic coil similar to the voice coil in a loudspeaker;an increasing current in the coil drives the mirror at con-stant velocity. After reaching its terminus, the mirror isreturned rapidly to the starting point for the next sweepby a rapid reversal of the current. The length of travelvaries from 1 to about 20 cm; the scan rates range from0.01 to 10 cm Is.
Two additional features of the mirror system arenecessary for successful operation. The first is a meansof sampling the interferogram at precisely spaced re~tardation intervals. The second is a method for deter-mining exactly the zero retardation point to permitsignal averaging. If this point is not known preciselv.
"For a r.:view of commercial FTIR spectromd~rs, see 1. P. Smith JnJY_Hinson-Smith, Anal. Chon .. 2003. 75, 37:\~The \.tichdso/l intafaometer was designed and built in UNl by .-\ . .-\Michelson. He wa, awarded the 190"7Nobel Priz<.: in phy"ics fll[ the lll\en-
tlOn ()f inh:rfcromdry.

Jt ,,,"./retardatton
White-lightsource
S,
/ Signal sampling interval
!To sample
and Tl
FIGURE 16-4 Interferometers in an FTIRspectrometer. Subscript 1 defines the radiation pathin the IR interferometer. Subscripts 2 and 3 refer to the laser and white-light interferometers,respectively. (Courtesy of Thermo Electron Corp., Franklin,MA.)
the signals from repetitive sweeps would not be inphase; averaging would then tend to degrade ratherthan improve the signal.
The problem of precise signal sampling and signalaveraging can be accomplished by using two or threeinterferometers rather than one, with a single mirrormount holding the movable mirrors. Figure 16-4 is aschematic showing such an arrangement. The compo-nents and radiation paths for each of the three interfer-ometer systems arc indicated by the subscripts 1,2, and3, respectively. System 1is the lR system that ultimatelyprovides an intcrferogram similar to that shown ascurve A in Figure 16-5. System 2 is a so-called laser-fringe reference system, which provides sampling-interval information. It consists of a Hc-Ne laser S" aninterferometric system including mirrors MM, andM" a beamsplilter B2, and a transducer T,. The outputfrom this system is a cosine wave, as shown in C ofFigure 16-5. This signal is converlcd elcctronically tothc square-wave form shown in D; sampling hegins ortcrminates at each successive zero crossing. The laser-fringe reference system gives a highly reproducihle andregularly spaced sampling interval. In most instru-ments. the laser signal is also used to control the speedof the mirror-drive system at a constant level.
The third interferometer system, sometimes calledthe white-light system, employs a tungsten source S3and transducer T3 sensitive to visible radiation. Its mir-ror system is fixed to give a zero retardation displacedto the left from that for the analytical signal (see inter-ferogram B, Figure 16-5). Because the source is poly-chromatic, its power at zero retardation is much largerthan any signal before and after that point. Thus, thismaximum is used to trigger the start of data samplingfor each sweep at a highly reproducible point.
The triple interferometer system just describedleads to remarkahle precision in determining spectralfrequencies, which significantly exceeds that realizablewith conventional grating instruments. This high re-producibility is particularly important when manyscans are to he averaged. Contemporary instruments,such as the benchtop unit pictured in Figure 16-6, areable to achieve excellent frequency precision with oneor two interferometers. In the instrument diagrammedin Figure 16-7, the interferometer is actually twoparallel interferometers, one to modulate the IR ra-diation from the source before it passes through thesample and the second to modulate the red light fromthe He-Ne laser to provide the reference signal foracquiring data from the IR detector. No white-light
source is employed, and the IR interferogram is usedto establish zero retardation. The maximum in the IRinterferogram is an excellent reference because thisis the only point at which all wavelengths interfereconstructively.
The bench top system shown in Figure 16-6 is capa-ble of providing spectra with a resolution of approxi-
FIGURE 16-6 Photo of a basic, benchtop FTIRspec-trometer suitable for student use. Spectra are recordedin a few seconds and displayed on the LCDpanel forviewing and interpretation. The spectra may be storedin a memory card for later retrieval and analysis, or theymay be printed. (Courtesy of Thermo Electron Corp.,Madison, WI.)
FIGURE 16-5 Time-domain signals for the threeinterferometers contained in many FTIRinstruments.Curve A, IRsignal; curve B, white-light signal; curve C,laser-fringe reference signal; curve D, square-waveelectrical signal formed from the laser signal. (FromP. R. Griffiths,Chemical Infrared Fourier TransformSpectroscopy, p. 102, New York:Wiley,1975.Reprinted with permission.)
mately 4cm-1. Higher resolution, down to ~0.01 em ··1,
can be achieved with a more sophisticated system formaintaining the alignment of the moving mirror. Onemirror-alignment system uses three laser-fringe refer-ence systems that are directed at different points onthe moving mirror instead of one. Because three pointsare adequate to define a plane, the use of three laserssignificantly increases the accuracy with which the po-sition and orientation of the mirror can be known atany instant.
Instrument Designs
FTIR spectrometers can be single-beam or double-beam instruments. Figure 16-8 shows the optics of a ba-sic single-beam spectrometer, which sells in the rangeof $15,000 to $20,000. A typical procedure for deter-mining transmittance or absorbance with this type of in-strument is to first obtain a reference interferogram byscanning a reference (usually air) twenty or thirty times,coadding the data, and storing the results in the mem-ory of the instrument computer (usually after trans-fo~ming it to the spectrum). A sample is then inserted inthe radiation path and the process repeated. The ratioof sample and reference spectral data is then computed
Q1 Simulation: Learn more about lRlQJ instrumentation.

FIGURE 16-7 Diagram of a basicFTIRspectrometer. Radiation of allfrequencies from the IRsource is re-flected into the interferometer whereit is modulated by the moving mirroron the left. The modulated radiationis then reflected from the two mirrorson the right through the sample in thecompartment at the bottom. Afterpassing through the sample, theradiation falls on the transducer. Adata-acquisition system attached tothe transducer records the signal andstores it in the memory of a computeras an interferogram. (Courtesy ofThermo Electron Corp., Franklin, MA.)
to give the transmittance at various frequencies. Fromthis ratio the absorbancc is calculated as a function ofwavenumber. Ordinarily, modern IR sources and de-tectors are sufficiently stablc so that reference spectraneed to bc obtained only occasionally.
A double-beam spectrometer is illustrated in Fig-ure 16-9. The mirrors directing the interferometerbeam through the sample and reference cells are oscil-lated rapidly compared to the movement of the inter-ferometer mirror so that sample and reference infor-mation can be obtained at each mirror position. Thedouble-beam design compensates for source and detec-tor drifts.
Performance Characteristicsof Commercial Instruments
A number of instrument manufacturers offer severalmodels of FTIR instruments. The least expensive hasa range of 7800 to 350 cm-I (1.3 to 29 ~m) with a reso-
BLaser_ detector
BeaIll,:>plltter /
Mirror, '\JIllCen[ef hole
for laser beam
FIGURE 16-8 Single-beam FTIRspectrometer. In one arm of the interferometer, the IRsourceradiation travels through the beamsplitter to the fixed mirror, back to the beamsplitter, andthrough the sample to the IR transducer. In the other arm, the IR source radiation travels tothe beam splitter, is reflected to the movable mirror, and travels back through the beam splitterto the sample and to the transducer. When the two beams meet again at the beamsplitter, theycan interfere with each other if the phase difference (path difference) is appropriate. A plot ofthe signal versus mirror displacement is the interferogram. The interferogram contains informa-tion about all the frequencies present. The spectrum, intensity versus wavenumber, is the FT ofthe interferogram. It can be calculated with a computer from the signal versus mirrordisplace-ment. An empty sample compartment allows the reference spectrum to be calculated. Next,the sample is placed in the sample compartment and the sample spectrum is obtained. Theabsorbance is then calculated at each wavenumber from the ratio of the sample intensity tothe reference intensity.
lution of 4 cm' 1. This performance can be obtainedwith a scan time as brief as 1second. More expensive in-struments with interchangeable beamsplitters, sources,and transducers offer expanded frequency ranges andhigher resolutions. For example, one instrument is re-ported to produce spectra from the far-IR (10 em-lor1000 ~m) through the visible region to 50,000 em -1, or200 nm. Resolutions for commercial instruments varyfrom 8 to less than 0.01 cm -1 Several minutes are re-quired to obtain a complete spectrum at the highestresolution.'
signal-to-noise ratio can, of course, be traded for rapidscanning, with good spectra being attainable in a fewseconds in most cases. Interferometric instrumentsarc also characterized by high resolutions «0.1 cm 1)and highly accurate and reproducible frequency de-terminations. The latter property is particularly help-ful when spectra are to be subtracted for backgroundcorrection.
A thcoretical advantage of FT instruments is thattheir optics provide a much larger energy throughput(one to two orders of magnitude) than do dispersive in-struments, which are limited in throughput by the needfor narrow slit widths. The potential gain here, how-ever, may be partially offset by the lower sensitivity ofthe fast-response detector required for the interfero-metric measurements. Finally, it should he noted that
the interferometer is free from the problem of strayradiation because each IR frequency is. in effecl,chopped at a different frequency.
The areas of chemistry where the extra performanceof interferometric instruments has been particularlyuseful include (l) very high-resolution work that is en-countered with gaseous mixtures having complex spec-tra resulting from the superposition of vibrational androtational bands; (2) the study of samples with highabsorbances; (3) the study of substances with weak ah-sorption bands (for example. the study of compoundsthat are chemisorbed on catalyst surfaces); (4) investi-gations requiring fast scanning such as kinetic studiesor detection of chromatographic eftluents; (5) collect-ing IR data from vcrv small samples; (0) obtaining re-flection spectra; and (7) IR emission studies.
Advantages of FT Spectrometers
Over most of the mid-IR spectral range, FT instru-ments have signal-to-noise ratios that are better thanthose of a good-quality dispersive instrument. usuallyby more than an order of magnitude. The enhanced

Samplecompartment
1- - - - - - - - -I
I I
d [I .[.. · ·.·.:.:·~(/~;J J..... . , : ::/::::..)~
// I ~ ".•• I /'~' .....
//1: "', "IIII
:1:11- _
4000 Wavenumber. cm-1
5UOO,
2000 1500 1300 1100 1000 900 800 700 650
100
90 " Doubk~beam mode80
1J' 70~.
60 Single-beam~ 50 mode.~
40§
30 H2Of-CO2
20
10H2O
CO2
0
4 6 9 10 II 12 13 14 15 16
Wavelength. ,um
FIGURE 16-10 Single- and double-beam spectra of atmospheric water vapor and CO,. In thelower. single-beam trace. the absorption of atmospheric gases is apparent. The top. double-beam spectrum shows that the reference beam compensates very well for this absorption andallows for a stable 100% T baseline to be obtained. (From J. D. Ingle Jr. and S. R. Crouch.Spectrochemical Analysis, p. 409, Upper Saddle River,NJ: Prentice-Hall, 1988. Withpermission.)
FIGURE 16-9 Double-beam FTIRspectrometer. The beam emerging from the interferometerstrikes mirror M" which in one position directs the beam through the reference cell and in theother position directs it through the sample cell. MirrorM" which is synchronized to M" alter-nately directs the reference beam and the sample beam to the transducer.
reference before the monochromator, however, hasthe advantage that most scattered radiation and IRemission, generated within the cell compartment, is ef-fectively removed by the monochromator and thusdoes nol reach the transducer.
Figure 16-11 shows schematically the arrangementof components in a typical IR spectrophotometer.Like many inexpensive dispersive IR instruments, it isan optical null type, in which the radiant power of thereference beam is reduced, or attenuated, to match
168-2 Dispersive Instruments
Although most instruments produced today are FTsystems, many dispersive spectrophotometers are stillfound in laboratories. Dispersive IR spectrophotome-ters are generally double-beam, recording instruments,which use reflection gratings for dispersing radiation.As was pointed out in Section 130-2, the double-beamdesign is less demanding with respect to the perfor-mance of sources and detectors - an important char-acteristic because of the relatively low intensity of IRsources, the low sensitivity of IR transducers, and theconsequent need for large signal amplifications (seeSection 16C).
An additional reason for the general use of doublc-beam instruments in the lR region is shown in Fig-ure 16-10. The lower curve reveals that atmosphericwater and carbon dioxide absorb radiation in someimportant spectral regions and can cause serious in-terference problems. Thc upper curve shows that the
reference beam compensates nearly perfectly for ab-sorption by both compounds. A stable 100% T base-line results.
Generally, dispersive IR spectrophotometcrs incor-poratc a low-frequency chopper (five to thirty cyclesper sccond) that permits thc detector to discriminatebetwccn the signal from the source and signals fromextraneous radiation, such as fR emission from vari-ous bodics surrounding the transducer. Low choppingrates are demanded by the slow response times of theIR transducers used in most dispersive instrumcnts. Ingeneral, the optical designs of dispersive instrumentsdo not differ greatly from the double-beam UV -visiblespectrophotometers discussed in the previous chapterexcept that the sample and reference compartmentsare always located between the sourcc and the mono-chromator in IR instruments. This arrangement is pos-sible because IR radiation, in contrast to UV-visible,is not suiliciently energetic to cause photochcmicaldecomposition of thc sample. Placing the sample and
Attenuat<Jr ~7JmntorReference
<---EJ-- -~-.'h _~J__~_-,____ GratingSoun.:c >-.J \ • /,t_--EJ---1 Chopper I L~_ll__T.:nSducer
Sample •
Monochromator
FIGURE 16-11 Schematic diagram of adouble-beam, dispersive IRspectrophoto-meter. The heavy black tines indicate me-chanical linkages, and the light lines indicateelectrical connections. The radiation pathis designated by dashed lines.

that of the beam passing through the sample. Attenu-ation is accomplished by imposing a device that re-moves a continuously variable fraction of the refer-ence beam. The attenuator commonlv takes the formof a comb. the teeth of which are tapered so that thereis a linear relationship between the lateral movementof the comb and the decrease in power of the beam.Movement of the comb occurs when a difference inpower of the two beams is sensed bv the detection svs-" .tern. Most dispersive IR instruments are older instru-ments that use mechanical recorders instead of com-puters. For such instruments, the comb movement issynchronized with the recorder pen so that its positiongives a measure of the relative power of the two beamsand thus the transmittance of the sample.
Note that three types of systems link the compo-nents of the instrument in Figure 16-11: (I) a radiationlinkage indicated by dashed lines, (2) a mechanicallinkage shown by thick dark lines, (3) an electrical con-nection shown by narrow solid lines.
Radiation from the source is split into two beams,half passing into the sample-cell compartment and theother half into the reference area. The reference beamthen passes through the attenuator and on to a chopper.The chopper consists of a motor-driven disk that alter-nately reftects the reference or transmits the samplebeam into the monochromator. After dispersion by aprism or grating, the alternating beams fall on the trans-ducer and are converted to an electrical signal. The sig-nal is amplified and passed to the synchronous rectifier,
4000 3000
100
80
-
i 60
402;...
20
a device that is mechanically or electrically coupled tothe chopper to cause the rectifier switch and the beamleaving the chopper to change simultaneously. If thetwo beams are identical in power. the signal from therectifier is constant direct current. If, on the other hand.the two beams differ in power, a ftuctuating, or ac, cur-rent is produced, the phase of which is determined bywhich beam is the more intense. The current from therectifier is filtered and further amplified to drive a syn-chronous motor in one direction or the other, depend-ing on the phase of the input current. The synchronousmotor is mechanically linked to both the attenuator andthe pen drive of the recorder and causes both to moveuntil a null balance is achieved. A second synchronousmotor simultaneously drives the chart and varies thewavelength. Frequently, a mechanical linkage betweenthe wavelength and slit drives varies the slit width tokeep the radiant power reaching the detector approxi-mately constant.
The reference-beam attenuator system, such as theone just described, creates three limitations to the per-formance of dispersive IR instruments. First, the re-sponse of the attenuator system always lags behind thetransmittance changes, particularly in scanning regionswhere the signal is changing most rapidly. Second, themomentum associated with both the mechanical atten-uator and the recorder system may result in the pendrive overshooting the true transmittance. Third, in re-gions where the transmittance approaches zero, almostno radiation reaches the transducer, and the exact null Pump
FIGURE 16-13 A portable IRphotometer designed for gas analysis. The sample is introducedinto the cell by means of a pump. The path length can be changed by altering the number ofmirror reflections. (Courtesy of Thermo Electron Corp., Franklin, MA.)
position cannot be established accurately. The resultis sluggish transducer response and rounded peaks.Figure 16-12 illustrates transmittance overshoot androunded peaks in regions of low transmittance (1700and3000cm').
than the instruments we have previously described inthis chapter.
Filter Photometers
Figure 16-13 shows a schematic diagram of a portable,IR filter photometer designed for quantitative analysisof various substances in the atmosphere.lIJ Differentmodels are available that are factory calibrated for 1,5,30, or more than 100 gases. The instrument is com-puter controlled. For many compounds, fixed band-pass filters of 1.8. 3.3, 3.6,4.0.4.2.4.5.4.7, 8, 11, and14 J.1mcan be employed. A continuously variable tiller.
168-3 Nondispersive Instruments
Several simple, rugged instruments have been designedfor quantitative IR analysis. Some are simple filter pho-tometers, whereas others employ filter wedgcs in lieu ofa dispersing element to provide entire spectra. Finally,some gas analyzers use no wavelength-selection deviceat all. Generally, these instruments are less complex,more rugged, easier to maintain, and less expensive
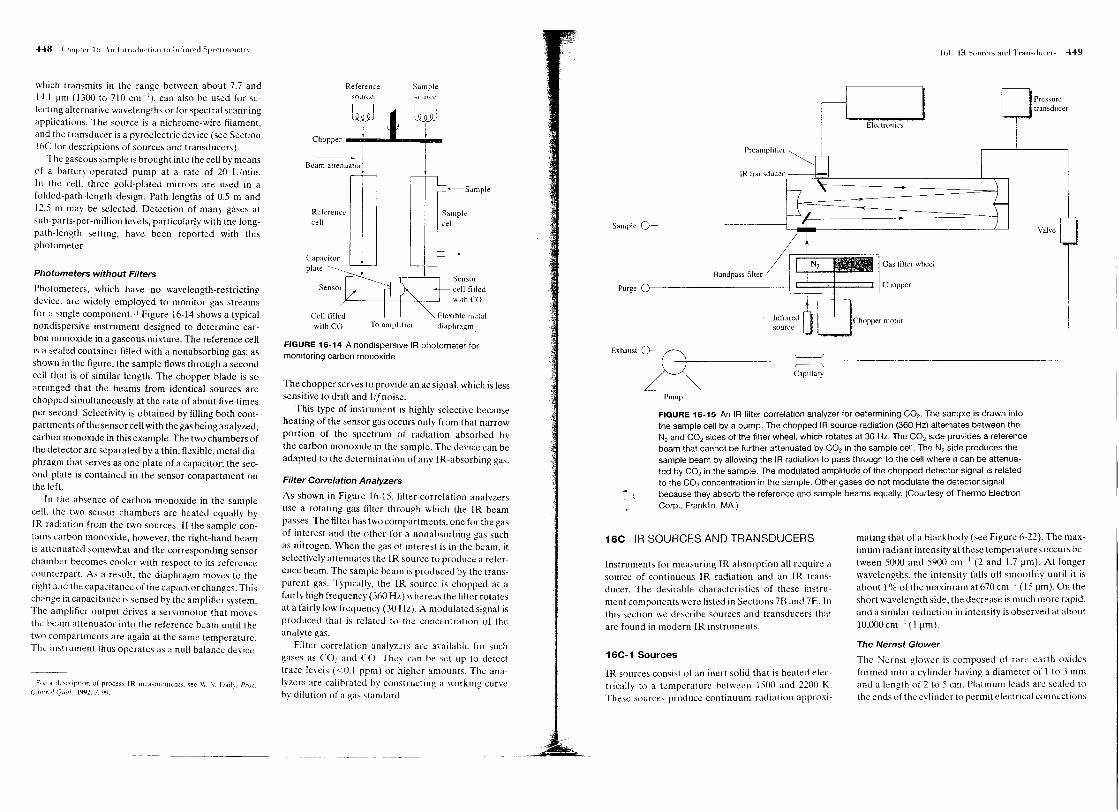
which transmits in the range between about 7.7 and14.1 11m(1300 to 710 cm-'). can also be used for se-lecting alternative wavelengths or for spectral scanningapplications. The source is a nichrome-wire filament,and the transducer is a pyroelectric device (see Section16C for descriptions of sources and transducers).
The gaseous samplc is brought into the cell by meansof a battery-operated pump at a rate of 20 Umin.[n the cell, three gold-plated mirrors are used in afolded-path-Iength design. Path lengths of 0.5 m and12.5 m may be selected. Detection of many gases atsub-parts-per-million levels, particularly with the long-path-length setting, have been reported with thisphotometer.
Photometers without Filters
Photometers, which have no wavelength-restrictingdevice. are widely employed to monitor gas streamsfor a single component.l1 Figure 16-14 shows a typicalnondispersive instrument designed to determine car-bon monoxide in a gaseous mixture. The reference cellis a sealed container filled with a non absorbing gas; asshown in the figure, the sample flows through a secondcell that is of similar length. The chopper blade is soarranged that the beams from identical sources arechopped simultaneously at the rate of about five timesper second. Selectivity is obtained by filling both com-partments of the sensor cell with the gas being analyzed,carbon monoxide in this example. The two chambers ofthe detector are separated by a thin, flexible, metal dia-phragm that serves as one plate of a capacitor; the sec-ond plate is contained in the scnsor compartment onthe left.
[n the absence of carbon monoxide in the samplecell, the two sensor chambers are heated equally byIR radiation from the two sources. If the sample con-tains carbon monoxide, however, the right-hand beamis attenuated somewhat and the corresponding sensorchamber becomes cooler with respect to its referencecounterpart. As a result, the diaphragm moves to theright and the capacitance of the capacitor changes. Thischange in capacitance is sensed by the amplitler system.The amplitler output drives a servomotor that movesthe beam attenuator into the reference beam until thetwo compartments are again at the same temperature.The instrument thus operates as a null balance device.
_--Sample
I Sample[IIReference I~U .
Capacitor IPlate::~ SensorSensor cell filled
with CO
Cell filled FleXible metalwith CO To amplifier diaphragm
FIGURE 16-14 A nondispersive IRphotometer formonitoring carbon monoxide.
The chopper serves to provide an ae signal, which is lesssensitive to drift and I/fnoise.
This type of instrument is highly selective becauseheating of the sensor gas occurs only from that narrowportion of the spectrum of radiation absorbed bythe carbon monoxide in the sample. The device can beadapted to the determination of any IR-absorbing gas.
Filter Correlation Analyzers
As shown in Figure 16-15, filter correlation analyzersuse a rotating gas filter through which the IR beampasses. The filter has two compartments. one for the gasof interest and the other for a nonabsorbing gas suchas nitrogen. When the gas of interest is in the beam, itselectively attenuates the IR source to produce a refer-ence beam. The sample beam is produced by the trans-parent gas. Typically, the IR source is chopped at afairly high frequency (360 Hz) whereas the filter rotatesat a fairly low frequency (30 Hz). A modulated signal isproduced that is related to the concentration of theanalyte gas.
Filter correlation analyzers are available for suchgases as CO, and CO. Thev can be .set up to detecttrace levels «0.1 ppm) or higher amounts. The ana-Ivzers are calibrated by constructing a working curveby dilution of a gas standard.
FIGURE 16-15 An IRfilter correlation analyzer for determining CO,. The sample is drawn intothe sample cell by a pump. The chopped IRsource radiation (360 Hz)alternates between theN, and CO, sides of the filter wheel, which rotates at 30 Hz. The CO, side provides a referencebeam that cannot be further attenuated by CO, in the sample cell. The N, side produces thesample beam by allowing the IR radiation to pass through to the cell where it can be attenua-ted by CO, in the sample. The modulated amplitude of the chopped detector signal is relatedto the CO, concentration in the sample. Other gases do not modulate the detector signalbecause they absorb the reference and sample beams equally. (Courtesy of Thermo ElectronCorp., Franklin, MA.)
mating that of a blackbody (see Figure 6-22). The max-imum radiant intensity at these temperatures occurs be-tween 5000 and 5900 em· , (2 and 1.7 11m). At longerwavelengths, the intensity falls off smoothly until it isabout 1% of the maximum at 670 cm- 1 (15 11m). On theshort wavelength side, the decrease is much more rapid,and a similar reduction in intensity is observed at about1O,000cm '(111m).
Instruments for measuring IR absorption all require asource of continuous IR radiation and an IR trans-ducer. The desirable characteristics of these instru-ment components were listed in Sections 7B and 7E. [nthis section we describe sources and transducers thatare found in modern IR instruments.
The Nernst Glower
The Nernst glower is composed of rare earth oxidesformed into a cylinder having a diameter of I to 3 mmand a length of 2 to 5 em. Platinum leads are sealed tothe ends of the cylinder to permit electrical connections
IR sources consist of an inert solid that is heated elec-trically to a temperature between 1500 and 2200 K.These sources produce continuum radiation approxi-

1000
'=~>,
g 100
~>.~ 10
<.5
FIGURE 16-16 Spectral distribution of energy from aNernst glower operated at approximately 2200 K.
to what amounts to a resistive heating element. Ascurrent passes through the device, its temperatureincreases to between 1200 K and 2200 K. The Nernstglower has a large nega~ive tempcrature coefficient ofclcctrical resistance, and it must be heated externallyto a dull red heat before the current is large enoughto maintain the desired temperature. Because the re-sistance decreases with increasing temperature, thesource circuit must be designed to limit the current orthe glower rapidly becomes so hot that it is destroyed.
Figure 16-16 shows the spectral output of a Nernstglower operated at approximately 2200 K. Note thatthe overall curve shape is similar to that of a black-body. The small peaks and depressions are a functionof the chemical composition of the device.
The Globar
A Globar is a silicon carbide rod, usually about 5 cmlong and 5 mm in diamcter. It also is electrically heated(1300 to 1500 K) and has the advantage of a positivecoelJicient of resistance. On the other hand, watercooling of the electrical contacts is required to preventarcing. Spectral energies of the Globar and the Nernstglower are comparable except in the region below5 11m,where the Globar provides a significantly greateroutput.
Incandescent Wire Source
A source with somewhat lower intensity but withlonger life than the Globar or Nernst glower is a tightlywound spiral of nichrome wire heated to about 1100 Kby an electrical current. A rhodium wire heater sealedin a ceramic cylinder has similar properties, althoughit is more expensive. Nichrome wire sources are less
intense than many IR sources. However, the incan-descent wire source requires no cooling and is nearlymaintenance free. For this reason, the nichrome wiresource is often used where reliability is paramount,such as in process analyzers.
target. Some of the radiation is then reflected back tothe lidar instrument where it is analyzed and used toobtain information about the target. By means of lidar,distance, speed, rotation, chemical composition, andconcentration of remote targets can be obtained.
The Mercury Arc
For the far-IR region of the spectrum (A > 50 11m),noneof the thermal sources just described provides suffi-cient radiant power for convenient detection. Here, ahigh-pressure mercury arc is used. This device consistsof a quartz-jacketed tube containing mercury vapor ata pressure greater than I atmosphere. Passage of elec-tricity through the vapor forms an internal plasmasource that provides continuum radiation in the far-IRregion.
IR transducers are of three general types: (I) pyro-electric transducers, (2) photoconducting transducers,and (3) thermal transducers. The first is found in pho-tometers, some FTIR spectrometers, and dispersivespectrophotometers. Photoconducting transducers arefound in many FTIR instruments. Thermal detectorsare found in older dispersive instrumcnts but are tooslow to be used in FTIR spectrometers.
The Tungsten Filament Lamp
An ordinary tungsten filament lamp is a convenientsource for the near-IR region of 4000 to 12,800 em-l(2.5 to 0.78 11m).
Pyroelectric Transducers
Pyroelectric transducers are constructed from singlecrystalline wafers of pyroelectric materials, whichare insulators (dielectric materials) with very specialthermal and electrical properties. Triglycine sulfate(NH,CH2COOHh' H,SO, (usually deuterated or witha fraction of the glycines replaced with alanine), isthe most important pyroelectric material used for IR-detection systems.
When an electric field is applied aeross any dielec-tric material, polarization takes place, with the mag-nitude of the polarization being a function of the di-electric constant of the material. For most dielectrics,this induced polarization rapidly decays to zero whenthe .external field is removed. Pyroelectric substances,in co~trast, retain a strong temperature-dependentpola'rization after removal of the fteld. Thus, by sand-wiching the pyroelectric crystal between two elec-trodes, one of which is IR transparent. a temperature-dependent capacitor is produced. Changing itstemperature by irradiating it with IR radiation altersthe charge distribution across the crystal, which can bedetected as a current in an external electrical circuitconnecting the two sides of the capacitor. The magni-tude of this current is proportional to the surface areaof the crystal and the rate of change of polarizationwith temperature. Pyroelectric crystals lose theirresidual polarization when they are heatcd to a tem-perature called the Curie poin/. For triglycine sulfate.the Curie point is 4rC
Pvroelectric transducers exhibit response timesthat ~re fast enough to allow them to track the changes
The Carbon Dioxide Laser Source
A tunable carbon dioxide laser is used as an IR sourcefor monitoring the concentrations of certain atmo-spheric pollutants and for determining absorbing spe-cies in aqucous solutions." A carbon dioxide laserproduccs a band of radiation in the range of 900 to1100 cm-l (11 to 9 11m),which consists of about 100closely spaeed diserete lines. As described in Section7B-3, anyone of these lines ean be chosen by tuningthe laser. Although the range of wavelengths availableis limited, the region from 900 to 1100 cm-l is one par-ticularly rich in absorption bands arising from the in-teractive stretching modes of CO2, Thus, this source isuseful for quantitative dctermination of a number ofimportant species such as ammonia, butadiene, ben-zene, ethanol, nitrogen dioxide, and trichloroethylene.An important property of the laser source is the radi-ant power available in each line, which is several ordersof magnitude greater than that of blackbody sources.
Carbon dioxide lasers are widely used in remote-sensing applications such as light detection and rang-ing (lidar). The operating principle of lidar is similar tothat of radar. The lidar system transmits radiation outto a target where it interacts with and is altered by the
12Sce A. A. Demido\". in Introduction to Laser Spectrwcopy, 2nd ed., D. LAndrews and A. A. Demido\". eds_. New York: Kluwer Academic/PlenumPress, 2002: Z. Zding.:r. M. Strizik. P. KuhaCand S. Chis,Anal. Chim. Ada,2000.422. t 79: P. L r.,.·1t:yt:cM. ,"'. Sigrist. Rt'I,'. Sei. Inslrum .. 1990.61, l779
in the time-domain signal from an interferometer. Forthis reason, many FTIR spectrometers for the mid-IRregion employ this type of transducer.
Photoconducting Transducers
IR photoconducting transducers consist of a thin filmof a semiconductor material, such as lead sulfide, mer-cury telluride-cadmium telluride (MCT), or indiumantimonide, deposited on a nonconducting glass sur-face and sealed in an evacuated envelope to protectthe semiconductor from the atmosphere. Absorptionof radiation by these materials promotes nonconduct-ing valence electrons to a higher energy-conductingstate, thus decreasing the electrical resistance of thesemiconductor. Typieally, a photoconductor is placedin series with a voltage source and load resistor, andthe voltage drop across the load resistor serves as ameasure of the power of the beam of radiation.
A lead sulfide photoconductor is the most widelyused transducer for the near-IR region of the spectrumfrom 10,000 to 333 cm - t (1 to 311m). It can be operatedat room temperature. For mid- and far-IR radiation,MCT photoconductor transducers are used. They mustbe cooled with liquid nitrogen (77 K) to minimize ther-mal noise. The long-wavelength cutoff, and many ofthe other properties of these transducers, depend onthe ratio of the mercury telluride to cadmium telluride,which can be varied continuously.
The MCT transducer is faster and more sensitivethan the de ute rated triglycine sulfate transducer dis-cussed in the previous section. For this reason, theMCT transducer also finds widespread use in FTlRspectrometcrs, particularly those requiring fast rc-sponse times, such as spectrometers interfaced to gaschromatographs.
Thermal Transducers
Thermal transducers, whose responses depend on theheating effect of radiation, are found in older disper-sive spectromcters for detection of all but thc shortestIR wavelengths. With these deviees, the radiation isabsorbed hy a small blackbody and the resultant tem-perature rise is measured. The radiant power levelfrom a spectrophotometer beam is minute (](r 7 to10-9 W), so that the heat capacity of the absorbing cl-ement must be as small as possible if a detectable tem-perature change is to be produced. Under the best ofcircumstances, temperature changes are confined to afew thousandths of a kelvin.

*Answers are provided at the end of the book for problems marked with an asterisk.
00 Problems with this icon are best solved using spreadsheets.
*16-1 The IR spectrum of CO shows a vibrational absorption band centered at2170cm·1(a) What is the force constant for the CO bond'?(b) At what wavenumber would the corresponding peak for I'CO occur'!
*16-2 Gaseous HCl exhibits an IR absorption at 2890 cm 1 due to the hydrogen-chlorine stretching vibration.(a) Calculate the force constant for the bond.(b) Calculate the wavcnumber of the absorption band for HCl assuming the force
constant is the same as that calculated in part (a).
16-3 Calculate the absorption frequency corresponding to thc -C -H stretchingvibration treating the group as a simple diatomic C-H molecule with a forceconstant of k = 5.0 x 10' N/m. Compare the calculated value with the rangefound in correlation charts (such as thc one shown in Figure 17-6). Repeat thecalculation for the deuterated bond.
The problem of measuring IR radiation by ther-mal means is compounded by thermal noise from thesurroundings. For this reason. thermal transducers arehoused in a vacuum and are carefully shielded fromthermal radiation emitted by other nearby objects. Tofurther minimize the effects of extraneous heat sourccs,the beam from the source is always chopped. [n this way,the analyte signal, after transduction, has the frequencyof the chopper and can be separated electronically fromextraneous noise signals, which are ordinarily broadband or vary only slowly with time.
Thermocouples. In its simplest form, a thermocoupleconsists of a pair of junctions formed when two piecesof a metal such as bismuth are fused to each end of adissimilar metal such as antimony. A potential differ-ence between the two junctions varies with their dif-ference in temperature.
The transducer junction for [R radiation is formedfrom very fine wires or alternatively by evaporating themetals onto a nonconducting support. In either case,the junction is usually blackened (to improve its heat-absorbing capacity) and sealed in an evacuated cham-ber with a window that is transparent to [R radiation.The response time is typically about 30 ms.
The reference junction, which is usually housed inthe same chamber as the active junction, is designedto have a relatively large heat capacity and is carefullvshielded from the incident radiation. Because thc ana-Iyte signal is chopped, only the difference in tempera-ture between the two junctions is important; therefore.the reference junction does not need to be maintainedat constant temperature. To enhance sensitivity. sev-eral thermocouples may be connected in series to givewhat is called a thermopile.
*16-5 The wavelength of the fundamental N-H stretching vibration is about 1.5 I-'m.What is the approximate wavenumber and wavelength of the first overtone bandfor the N-H stretch'?
*16-6 Sulfur dioxide is a nonlinear molecule. How many vibrational modes will thiscompound have" How many IR absorption bands would sulfur dioxide beexpected to have'!
* 16-7 Indicate whether the following vibrations are active or inactive in the lRspectrum.
Bolometers. A bolometer is a type of resistance ther-mometer constructed of strips of metals, such as plat-inum or nickel, or from a semiconductor. This typeof semiconductor device is sometimes called a thermis-tor, Semiconductor materials exhibit a relatively largechange in resistance as a function of temperature. Theresponsive element in a bolometer is kept small andblackened to absorb the radiant heat. Bolometers arenot so extensively used as other [R transducers for themid-IR region. However, a germanium bolometer, op-erated at 1.5 K, is an excellent transducer for radiationin the range of 5 to 400 cm 1 (2000 to 25 I-'m).The re-sponse time is a few milliseconds.
(aJCHJ-CH3
(hi CH, - CCI,
le;SO,
(dICH,=Ctl,
c ~ C stretching
C - C stretching
Symmetric stretching
C - H stretching:
" /'H H•..• /
C=C/ •..•
H H/' "
'\ /'H H•..• /
C=C/ ...•
H H,/ "
CH2 wag:-1' "!J
H tl•..• /sC=cg/ •..•
H H,Ii 'IJ
CH2t\l,.'ist
rl ,;.H H•..• /
C=C/ •..•
H Hs' '"OJ
16-8 What are the advantages of an FTIR spectrometer compared with a dispersiveinstrument?
*16-4 The wavelength of the fundamental O-H strctching vibration is about lAl-'m.What is the approximate wavcnumbcr and wavelength of the first overtone bandfor the O-H stretch')
[iJ 16-9 What length of mirror drive in an FTIR spectrometer would be required to pro-vide a resolution of (a) 0.050 cm -1, (b) 0040cm -1, and (c) 4.0 cm -10

*16-10 It was stated that at room temperature (25°C) the majority of molecules are inthe ground vibrational energy level (v = 0).(a) Use the Boltzmann equation (Equation 8-1) to calculate the excited-state
and ground-state population ratios for HCl: N(v = 1)/N(v = 0). The funda-mental vibrational frequency of HCl occurs at 2885 cm-1
(b) Use the results of part (a) to find N(v = 2)/N(v = 0).
16-11 Why are nondispersive IR instruments often used for the determination of gasesrather than dispersive IR spectrometers?
16-12 The first FTIR instruments used three different interferometer systems. Briefly.describ~ how it has been possible to simplify the optical systems in more contem-porary instruments.
*16-13 In a particular trace analysi5 via FTIR, a set of sixteen interferograms were col-lected. The signal-to-noise ratio (SIN) associated with a particular spectral peakwas approximately 5: 1. How many interferograms would have to be collectedand averaged if the goal is to obtain a SIN = 20: I?
~ *16-14 If a Michelson interferometer has a mirror velocity of 1.00 cm/s, what will bethe frequency at the transducer due to light leaving the source at frequencies of(a) 4.8 X 10¹³ Hz" (b) 4.9 x 10¹³ Hz, and (c) 5.0 X 10¹³ Hz? What are the ~orre-sponding wavenumbers of these frequencies? '
Challenge Problem
16-15 (a) The IR spectrum of gaseous N,O shows three strong absorption bands at2224 cm -1,1285 cm-I, and 2089 cm-I. In addition two quite weak bandsare observed at 2563 cm-I and 2798 cm-l It is known that N,O is a linearmolecule, but assume it is not known whether the structure is N-N---D orN-O-N. Use the IR data to decide between the two structures. Whatvibrations can be assigned to the strong absorption bands? What are pos-sible causes of the weak absorptions?
(b) The IR spectrum of HCN shows three strong absorption bands at 3312 cm-I,2089 cm-I, and 712 cm-1 From this information alone, can you deducewhether HeN is linear or nonlinear? Assuming that HCN is linear, assignvibrations to the threc absorption bands.
(c) How many fundamental vibrational modes are expected for BF]? Which ofthese are expected to be IR active? Why? Sketch the vibrations.
(d) How many fundamental vibrational modes would you predict for (I) meth-ane, (2) benzene, (3) toluene, (4) ethylene, and (5) carbon tetrachloride?
Applicationsof InfraredSpectrometry
Modem IR spectrometry is a versatile
; .... tool thatisapplied .•.·...·.to.the qual.t.·.t.a.tive. .. and quantitative determinatiQnofmolecular species of~(l tJPes. [T/this chapter wefirst focus on the uses of mid-Ill q.bsorption and
teflectionspectrometryfor st~tUral inve~tigationsof molecular compoun&, parti~ularly organic com-
pounds anci species of interest W biochemistry. Wethen examine in less detail seVli"ralof the other
applications of IR spectroscopy.
r-:::¥I Throughout this chapter, this logo indicatesl2.J an opportunity for online self-study at www.thomsonedlLcom /chemistry/skoog, linking you tointeractive tutorials, simulations, and exercises.
As shown in Table 17-1, the applications of TR spec-trometry fall into three major categories based on thethree IR spectral regions. The most widely used re-gion is the mid-IR, which extends from about 670 to4000cm -I (2.5 to 14.911m).Here, absorption, reflection,and emission spectra arc employed for both qualitativeand quantitative analysis. The near-IR region, from4000 to 14,000 cm-I (0.75 to 2.5 11m),also finds consid-erable use for the routine quantitative determination ofcertain species, such as water, carbon dioxide, sulfur,low-molecular-weight hydrocarbons, amine nitrogen,and many other simple compounds of interest in agri-culture and in industry. These determinations are of-ten based on diffuse-reflectance measurements of un-treated solid or liquid samples or absorption studiesof gases. The primary use of the far-IR region (15 to1000 11m)has been for the determination of the struc-tures of inorganic and metal-organic species based onabsorption measurements.
17A MID-IR ABSORPTIONSPECTROMETRY
Mid-IR absorption and reflection spectrometry are ma-jor tools for determining the structure of organic andbiochemical species. In this section we examine mid-IRabsorption applications. Section 17B is devoted tomid-IR reflectance measurements. 1
As we have seen in earlier chapters, ultraviolet and vis-ible molecular spectra are obtained most convenientlyfrom dilute solutions of the analyte. Absorbance mea-surements in the optimal range are obtained by suitablyadjusting either the concentration or the cell length.Unfortunately, this approach is often not applicable forIR spectroscopy because no good solvents arc trans-parent throughout the region of interest. As a con-sequence, sample handling is frequently the most diffi-cult and time-consuming part of an IR spectrometricanalysisZ In this section we outline some of the common
:For further reading see R. M. Silverstein, F X. Webster. and D. Kiemle.Spectrometric Idenr(ficari(Jfl of Organic Compounds, 7th cd .. Chap. 2, NewYork: Wiky. 2005; B. Schrader, Jllfrured Qnd Ruman 5pecrroscopy, NewYork: VOL 1995; N. B_ Colthup, L. H. Daly. and S. E. Wiberley. lnrm-
duel/on LOInfrared and Raman Spectrml-"op). 3rd cd_. San Diego: Aca-demic Press, 1990.~See Practiced SamplifJf: Feclmiqul's (or Illfrared Allalysis. P. B. Coleman.ed .. Boca Raton, FL: eRe Press. 1993: T J. Porro and S. C Pattacini, Spec·rroscopy. 1993. tl (7). 40: Ibid., 8 IRL 39: A. L Smith, Applied InfraredSpectroscopy. New York: Wiley, 1979, Chap_ 4

TABLE17-1 MajorApplications of IRSpectrometry
Near-lR Diffuse reflectanceAbsorption
Mid-IR Absorption
QuantitativeQuantitativeQualitativeQuantitativeChromatographicQualitativeQuantitativeQualitative
ReflectanceEmissionAbsorption
techniques for preparation of samples for IR absorp-tion measurements.
Gases
The spectrum of a low-boiling-point liquid or gas canbe obtained by permitting the sample to expand intoan evacuated cvlindrical cell equipped with suitablewindows. For this purpose, a variety of cylindrical cellsare available with path lengths that range from a fewcentimeters to 10 m or more. The longer path lengthsare obtained in compact cells by providing reflectinginternal surfaces, so that the beam makes numerouspasses through the sample before exiting the cell (seeFigure 16-13).
Solutions
When feasible, a convenient way of obtaining IR spec-tra is on solutions prepared to contain a known concen-tration of sample, as is generally done in ultraviolet-visible spectrometry. This technique is somewhat
FIGURE17-1 Solvents for IRspectroscopy.Horizontal lines indicate useful regions.
~~
GiJ~
Front plate Quick-acting
nub ~4)
Applicable Samples
Solid or liquid comm~rcial materialsGaseous mixturesPure solid, liquid, or gasesComplex liquid, solid, or gaseous mixturesComplex liquid. solid, or gaseous mixturesPure solids or liquidsAtmospheric samplesPure inorganic or organometallic species 2500 2000 1SOO
Wavenumber. em-[
limited in its applications, however, by the availabil-ity of solvents transparent over significant regions inthe IR.
FIGURE17-2 IRspectra of water and of an aqueoussolution containing water-soluble aspirin. The topspectrum shows the computer-generated differencespectrum obtained by subtracting the water spectrumfrom that of the solution. (From Practical SamplingTechniques for Infrared Analysis, P. B. Coleman, ed.,Boca Raton, FL:eRC Press, 1993. With permission.)Solvents. Figure 17-1 lists several common S(?lvents
employed for IR studies of organic compoun,ds. Thisfigure illustrates that no single solvent is transparentthroughout the entire mid-IR region.
Water and the alcohols are difficult to use as sol-vents in IR spectrometry. Water shows several strongabsorption bands in the IR region, as can be seen inFigure 17-2. Here, the spectrum of water is shownalong with the spectrum of an aqueous solution of as-pirin. The computer-calculated diflerence spectrumreveals the spectrum of the water-soluble aspirin. Wa-ter and alcohols also attack alkali-metal halides, themost common materials used for cell windows. Hence,water-insoluble window materials, such as bariumtluoride, must be used with such solvents. Care mustalso be taken to dry the solvents shown in Figure 17-1before use with typical cells.
Cells. Because of the tendency for solvents to absorbIR radiation, IR liquid cells are ordinarily much nar-rower (Om to I mm) than those employed in the ultra-violet and visible regions. Often, relatively high sampleconcentrations (from 0.1 % to 10%) are required be-cause of the short path lengths and the low molar ab-sorptivities of IR bands. Liquid cells are frequentlydesigned for easy disassembly and use Teflon spacersto allow variation in path length (see Figure 17-3).Fixed-path-Iength cells can be filled or emptied with ahypodermic syringe.
A variety of window materials are available as listedin Table 17-2. Window materials are often chosen on
\Vavenumber, em I
5000 250n 1667 1250 1000 833 714Carbon disulfide ~
Carhon tetrachloride
Tetrachloroethylene
Chloroform
LI i ---t- -l I
Dimethylformamidc -_ 1_ _ 'I 1--'. - r-, iDioxane 1-
Cyclohexanc - -r----l- _~, _ i-I _ i
Benzene
the basis of cost, range of transparency, solubility inthe solvent, and reactivity with the sample or solvent.Sodium chloride and potassium bromide windows aremost commonly employed and are the least expensive.Even with care, however, their surfaces eventually be-come fogged because of absorption of moisture. Pol-ishing with a buffing powder returns them to their orig-inal condition.
For samples that arc wet or aqueous, calcium andbariuin fluoride are suitable, although neither trans-mits well throughout the entire mid-IR region. Silverbromide is often used, although it is more expensive, is
Applicable Water Solubility,Window Range, g/lOOg H,O,Material cm--1 20"C
Sodium chloride 40,000-625 36.0Potassium bromide 40,000-385 65.2Potassium chloride 40,000-500 34.7Cesium iodide 40,000-200 160.0Fused silica 50,000-2,500 InsolubleCalcium fluoride 50,000-1,100 1.51 x 10⁻³
Barium fluoride 50,000-770 0.12 (2S"C)Thallium bromide- 16,600-250 <0.0476iodide, KRS-5Silver bromide 20,000-285 1.2 X 10-'Zinc sulfide, 10,000-715 InsolubleIrtran-2Zinc selenidc, 10,000-515 InsolubleIrtran-4Polyethylene 625-30 Insoluble
FIGURE 17-3 Expanded view of a demount-able IRcell for liquid samples. Teflonspacersranging from 0.015 to 1 mm thick are available.(Courtesy of Perkin-Elmer Corp., Norwalk. CT.)

3200100
90?f=:
~
I 80
~i: 70
(b)
FIGURE 17-4 Determination of the path length of IRcellsfrom interference fringes. Fringes are observed with anempty cell in the light path (a). In (b) an illustration of thecalculation of the path length is given.
photosensitive, and is easily scratched. The Irtran ma-terials are also resistant to chemical attack and are wa-ter insoluble. They are somewhat expensive and havehigh indexes of refraction (2.2 to 2.4), which can leadto interference fringes because of mismatches with thesample index of refraction (often around 1.4 to 1.6).
Figure 17-4 shows how the thickness b of verynarrow IR cells can be determined by the interfer-ence fringe method. The interference pattern of Fig-ure 17-4a~is obtained by inserting an empty cell in thelight path of the sample beam and recording the trans-mittance against air in the reference beam. The re-llected radiation from the cell walls interferes with thetransmitted beam to produce the interference maximaand minima. The maxima occur when the radiation re-flected from the two internal surfaces of the cell hastraveled a distance that is an integral multiple N of thewavelength of the radiation transmitted without reflec-tion. Constructive interference then occurs wheneverthe wavelength is equal to 2b1N. That is,
2b= A
N
As shown in Figure 17Ab, the number of interferencefringes !:>..N between two known wavelengths Al and A,are counted and introduced into the equation
2b 2b ~!:>..N = - - - = 2bvi - 2bv,
Al A2
!:>.Nb = _ _
2(vl - v2)
It should be noted that interference fringes are ordinar-ily not seen when a cell is filled with liquid because therefractive index of most liquids approaches that of thewindow material and reflection is minimized (Equa-tion 6-15). On the other hand, interference can be ob-served between 2800 and 2000 cm-I in Figure 16-1.Here, the sample is a sheet of polystyrene. w[lich has arefractive index considerably different from dun of air.For this reason, significant reflection occurs at the twointerfaces of the sheet. Equation 17-2 is often used tocalculate the thickness of thin polymer films.
Liquids
When the amount of a liquid sample is small or whena suitable solvent is unavailable, it is common practiceto obtain spectra on the pure (neat) liquid. Here, only avery thin film has a sufficiently short path length to pro-duce satisfactory spectra. Commonly, a drop of the neatliquid is squeezed between two rock-salt plates to givea layer 0.015 mm thick or less. The two plates, held to-gether by capillary action, are then placed in the beampath. This technique does not give particularly repro-ducible transmittance data, but the resulting spectraare usually satisfactory for qualitative investigations.
Solids
Most organic compounds exhibit numerous absorp-tion bands throughout the mid-IR region, and findinga solvent that docs not have overlapping peaks is oftenimpossible. Because of this. spectra are often obtainedon dispersions of the solid in a liquid or solid matrix.Generally. in these techniques. the solid sample mustbe ground until its particle size is less than the wave-length of the radiation to avoid the effects of scatteredradiation.
relleting. One of the most popular techni,-!ucs forhandling solid samples has been KBr pellcting (otheralkali-metal halides have also been used). Halide saltshave the property of cold flow, in which they haveglasslike transparent or translucent properties whensufficient pressure is applied to the finely powderedmaterials. In using this technique, a milligram or less ofthe finely ground sample is intimately mixed with about100 mg of dried potassium bromide powder. Mixingcan be carried out with a mortar and pestle or, better. ina small ball mill. The mixture is then pressed in a specialdie at 10.000 to 15.(){)0pounds per square inch to yielda transparent disk. Best results are obtained if the diskis formed in a vacuum to eliminate occluded air. Thedisk is then held in the instrument beam for spectro-scopic examination. The resulting spectra fre,-!uentlyexhibit bands at 3450 and 1640 cm -I (2.9 and 6.1 /lm)due to absorbed moisture.
With many compounds. KEr pelleting produces ex-cellent spectra that appear in many spectral libraries.Being ionic, KBr transmits throughout most of the lRregion with a lower cutoff of about 400 em - t Ion ex-change can occur with some samples such as amine hy-drochlorides or inorganic salts. With the former. bandsof the amine hydrobromide arc often found. Polymor-phism can also occur because of the forces involved ingrinding and pressing the pellet. These can convertone polymorph into another. Although KBr is themost frequently used pelleting salt, materials such asCsI and CsBr are sometimes used. Cesium iodide hasgreater transparency at low frequencies than KBr.
Mulls. IR spectra of solids that are not soluble in anIR-transparent solvent or are not conveniently pel-leted in KBr arc often obtained by dispersing the ana-Iyte in a mineral oil or a fluorinated hydrocarbonmull. Mulls are formed by grinding 2 to 5 mg of thefinely powdered sample (particle size <2 /lm) in thepresence of one or two drops of a heavy hydrocarbonoil (Nujol). If hydrocarbon bands are likelv to inter-fere, Fluorolube, a halogenated polymer. can be usedinstead. In either case, the resulting mull is then exam-ined as a film between flat salt plates.
Other Methods for Solids. The lR behavior of solidscan also be obtained by rellectancc kchni,-!ues andby the photoacoustic method. These spectra arc oftensimilar to absorption spectra and provide the same
kinds of information, These techniques are discussedin Sections 17B and l7C.
17A-2 Qualitative Analysis
The general use of mid-IR spectroscopy by chemistsfor identifying organic compounds began in the late1950s with the appearance of inexpensive and easy-to-use double-beam recording spectrophotometers thatproduce spectra in the region of 5000 to 670 cm -I (2to 15 /lm). The appearance of this type of instrument(as well as nuclear magnetic resonance and mass spec-trometers) revolutionized the way chemists identifyorganic, inorganic, and biological species. Suddenly,the time required to perform a '-!ualitative analysis orstructural determination was substantially reduced.
Figure 17-5shows four typical spectra obtained withan inexpensive double-beam instrument. Identificationof an organic compound from a spectrum of this kindis a two-step process. The first step involves determin-ing what functional groups are most likely present byexamining the group frequency region, which encom-passes radiation from about 3600 cm I to approxima-tely 1250 cm-I (see Figure 17-5). The second step in-volves a detailed comparison of the spectrum of theunknown with the spectra of pure compounds that con-tain all of the functional groups found in the first step,Here, the fingerprint region, from 1200 to 600 cm-I(Figure 17-5) is particularly useful because small differ-ences in the structure and constitution of a moleculeresult in significant changes in the appearance and dis-tribution of absorption bands in this region. Con-sequently, a close match between two spectra in the fin-gerprint region (as well as others) constitutes almostcertain evidence that the two compounds are identical.
Group Frequencies
We have noted that the approximate frequency (orwavenumber) at which an organic functional group,such as C=O, C=C, C~ H, C==C, or O~ H, absorbsIR radiation can be calculated from the masses of theatoms and the force constant of the bond between them(Equations 16-14 and 16-15). These frequencies, calledgroup frequencies, are seldom totally invariant becauseof interactions with other vibrations associated withone or both of the aloms composing the group. On theother hand, such interaction effects are ordinarilysmall: as a result, a range of frequencies can be assignedwithin which it is highly probable that the absorption

maximum for a given functional group will be found.Table 17-3 lists group frequencies for several commonfunctional groups. A more detailed presentation ofgroup frequencies is found in the correlation chartshown in Figure 17-6.' Note that, although most groupfrequencies fall in the range of3600 to '~50 cm-l, a fewfall in the fingerprint region. These include theC-O-C stretching vibration at about 1200 cm -1 andthe C -Cl stretching vibration at 700 to 800 cm 1.
Several group frequencies are identified in the fourspectra in Figure 17-5. All four spectra contain an
'Other correlation charts can be found in R M. Silverstein, F X. Webster.and D. Kienle, Spectrometric Identification of Organic Compounds. 7th ed.,Chap. 2, New York: Wiley. 2005.
absorption band at 2900 to 3000 em -I, which corre-sponds to a C-H stretching vibration and generallyindicates the presence of one or more alkane groups(see Table 17-3). The two peaks at about 1375 cm-1
and 1450 em 1 are also characteristic group frequen-cies for C-H groups and result from bending vibra-tions in the molecule. The spectrum in Figure 17-5c il-lustrates the group frequency for an O-H stretchingvibration at about 3200 cm 1 as well as the alkanegroup frequencies (these bands are also present in thespectrum for n-hexanal shown in Figure 16-12).
Finally, the characteristic group frequency for aC -CI stretching vibration is shown at about 800 cm-1
in Figure 17-5d.
100v 90g 80~ 70
I:~= 40~ 30~ 20
10
o
I---.j.J;:-H
I bend
Wavelength, 11m
ta)
IIIL<::-HI bend
CH,CHCH,CH,i -
CH,
100- 90
8070605040JO20100
14 15Wavelength. pm
I---- Group frequency region ------l~----Flng:crpflnt region ---~~
I b)
FIGURE 17-5 The group frequency region of the mid-IR (-3600-1250 cm -1) IS used toidentify common functional groups. The fingerprint region (-1200-600 cm ') is used toidentify compounds. (From R. M. Roberts, J. C. Gilbert, L. B. Rodewald, and A. S. Wingrove,Modem Experimental Organic Chemistry, 4th ed .. Philadelphia: Saunders. 1985. Withpermission.)
soon 4000 3000 2500 2000
100
l.J 90g SO
70I~~-= 40'V 30
"d: 2010
o
(CH3)2Cl{Cll~C!{CH.1
IOH
50004000
100 100
~ 90 900 80 C-H I 80" 70 /"'---------stretch
I 70
I60 I 6050 CH) I C-CI 50
040 I , I stretch 40
" 30 CHliCH,CH\\ I 30t 20\ Ic..
C-HI 2010 CI bend 1
100 0
III II 12 13 14 ISWavelength, pm
I--- Groupfrequencyregion--~I~----Fingerprint region---------1(d)
N-HC=CC=CC:=CC-NC:=NC-OC=ONO,
FrequencyRange, cm --1
2850-29701340-1470
3010-3095675-995
33003010-3100690-900
3590-36503200-36003500-36502500-27003300-3500161O-t68015OO-t6oo2100-2260lt80-13602210-22801050-13001690-17601500-15701300-1370
StrongStrong
MediumStrongStrongMediumStrongVariableVariable, sometimes broadMediumBroadMediumVariableVariableVariableStrongStrongStrongStrongStrongStrong
Alkenes (>C=C()
Alkynes (-C:=C-H)Aromatic rings
Monomeric alcohols, phenolsHydrogen-bonded alcohols, phenolsMonomeric carboxylic acidsHydrogen-bonded carboxylic acidsAmines, amidesAlkenesAromatic ringsAlkynesAmines, amidesNitrilesAlcohols, ethers, carboxylic acids, estersAldehydes, ketones, carboxylic acids, estersNitro compounds
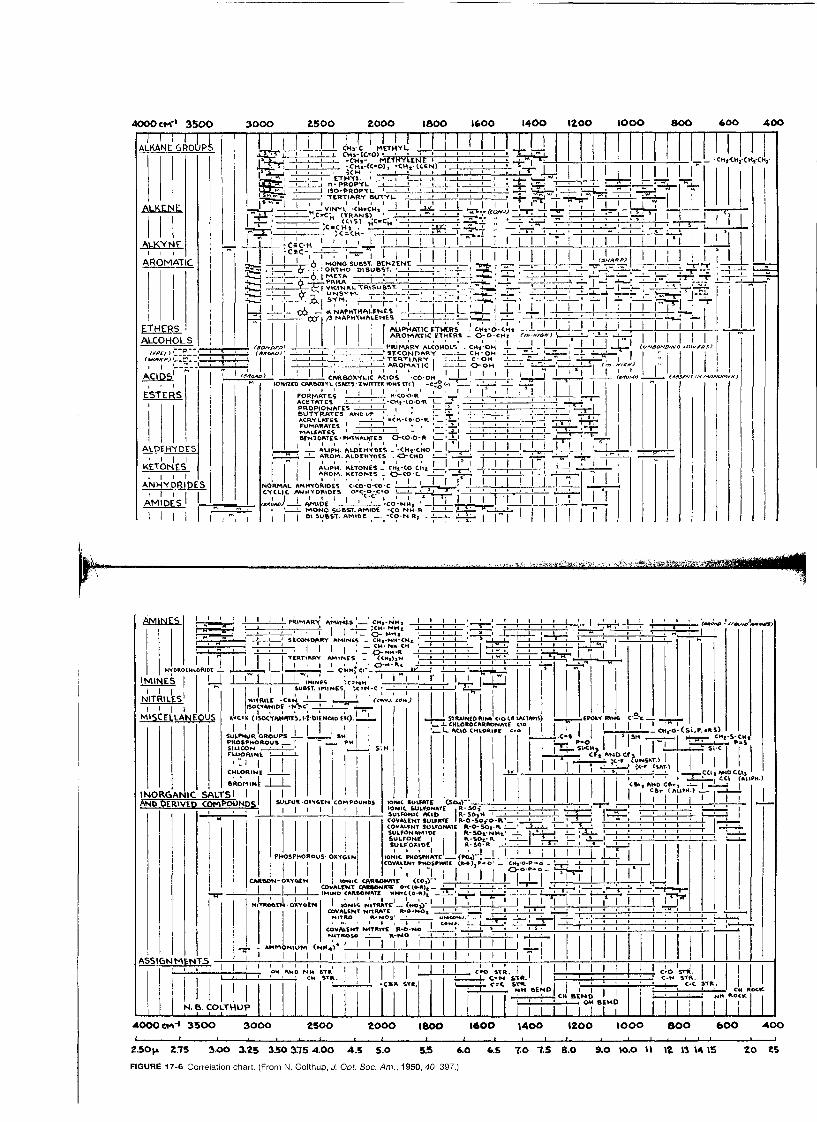
ALKENE I
I I IAbKYNE II I
A~OMAIIC

Group frequencies and correlation charts permitintelligent guesses as to what functional groups arelikely to be present or absent in a molecule. Ordinar-ilv. it is impossible to identify unambiguously eitherthe sources of all of the bands in a given spectrum orthe exact identity of the molecule. Instead. group fre-quencies and correlation charts serve as a startingpoint in the identification process.
The Fingerprint Region
Small differences in the structure and constitution of amolecule result in significant changes in the distributionof absorption maxima in this region of the spectrumthat extends from about 1200 to 600 cm- 1 (8 to 14 11m).The fingerprint region is thus well suited for identifyingcompounds based on spectral comparisons. Most singlebonds give rise to absorption bands at these frequen-cies; because their energies are about the same. stronginteraction occurs between neighboring bonds. The ab-sorption bands are thus composites of these various in-teractions and depend on the overall skeletal structureof the molecule. Exact interpretation of spectra in thisregion is seldom possible because of the complexity ofthe spcctra. However, for identification purposes, thcrichness of spectral features is a distinct advantage.Many compounds show unique absorption bands in thisregion, which is very useful for final identification.
Figure 17-5a and b illustrates the unique characterof IR spectra, particularly in the fingerprint region.The two molecules shown differ by just one methylgroup, yet the two spectra differ dramatically in the fin-gerprint region.
As shown in Figure 17-6, a number of inorganicgroups such as sulfate, phosphate, nitrate. and carbon-ate absorb IR radiation in the fingerprint region«1200cm-1 or >8.3 11m).
Limitations to the Use of Correlation Charts
The unambiguous establishment of the identity or thestructure of a compound is seldom possible from cor-relation charts alone. Uncertainties frequently arisefrom overlapping group frequencies, spectral varia-tions as a function of the physical state of the sample(that is, whether it is a solution, a mull, in a pelletedform, and so forth), and instrumental limitations.
In using group frequencies, it is essential that theentire spectrum, rather than a small isolated portion,be considered and interrelated. Interpretation basedon one part of the spectrum should be confirmed or re-jected by studying other regions.
To summarize, correlation charts serve only as aguide for further and more careful study. Several ex-cellent monographs describe the absorption character-istics of functional groups in detail.' A study of thesecharacteristics, as well as the other physical propertiesof the sample, may permit unambiguous identification.IR spectroscopy, when used in conjunction with massspectrometry, nuclear magnetic resonance, and ele-mental analysis, usually leads to positive identificationof a species.
Collections of Spectra
As just noted, correlation charts seldom suffice for thepositive identification of an organic compound from itsIR spectrum. However, several catalogs of IR spectraare available that assist in qualitative identification byproviding comparison spectra for a largc number ofpure compounds.' Manually searching large catalogsof spectra is slow and tedious. For this reason, com-puter-based search systems are widely used. •
Computer Search Systems
Virtually all IR instrument manufacturers now offcrcomputer search systems to aid in identifying com-pounds from stored IR spectral data'" The positionand relative magnitudes of peaks in the spectrum ofthe analyte are determined and stored in memory togive a peak profile, which can be compared with pro-files of pure compounds stored on disk or CD-ROM.The computer then matches profiles and prints a list ofcompounds having spectra similar to that of the ana-lyte. Usually, the spectrum of the analyte and that ofeach potential match can be shown simultaneously onthe computer display for comparison, as shown inFigure 17-7.
In 1980 the Sad tier Standard IR Collection and theSadtler Commercial IR Collection became available as
~R. M. Silverstein, F. X. Webster, and D. Kienle, Spectrometric Iden-tification of Organic Compounds, 7th ed., New York: Wiley. 2005;B. Schrader, Infrared and Raman SpectroscoPJ', New York: veil 1995:N. B. Colthup, L. H. Daly, and S. E. Wiberley, Introduction to Infrared andRa.rnan Spectroscopy, 3rd ed., San Diego: Academic Press, 1990.sSee Informatics/Sadtler Group, Bio-Rad Laboratories, Inc., Philadel-phia, PA; c.1. Pouchert, The Aldrich Library of Infrared Spectra. 3rd ed ..Milwaukee. Wl: Aldrich Chemical Co., 1981; Thermo Galactic, SpecrraOnline (http://spectra.galactic,com).6See E. Pretsch. G. Toth, M. E. Monk. and M. Badertscher. Computer-Aided Structure Elucidation: Spectra Interpretation and Structure Generu.-tion, New York: VCH-Wiley, 2003: B. C Smith, Infrared Spectral Interpre-tmion: A Systl!matic Approach, Boca Raton, FL eRe Press, 1998. Chap. 9;\\'. O. George and H. \Villis, Complller Methuds in U1/, ~Tisible and IRSpectroscop.,-", ?\itW York: Springer-Verlag, 1990.
FIGURE 17-7 Plot of an unknown spectrum and the best match from a computer searchreport. (Courtesy of Informatics/Sadtler Group, Bio-Rad Laboratories, Inc., Philadelphia, PAl
software packages. Currently. this library containsmore than 220,000 spectra.' Included are vapor-phasespectra and condensed-phase spectra of pure com-pounds. Individual databases in application areas suchas polymers, industrial products, pure organic com-pounds, forensic sciences, and the environment areavailable. Several manufacturers of Fourier transformIR (FTIR) instruments have now incorporated thesepackages into their instrument computers, thus creat-ing instantly available IR libraries of hundreds of thou-sands of compounds.
The Sadlier algorithm consists of a search system inwhich the spectrum of the unknown compound is firstcoded according to the location of its strongest absorp-tion peak; then each additional strong band (% T< 60%) in ten regions 200 cm-I wide from 4000 to2000 cm -I are coded by their location. Finally, thestrong bands in seventeen regions 100 cm -I wide from2100 to 400 cm -I are coded in a similar way. The com-pounds in the library are coded in this same way. Thedata are organized by the location of the strongest bandwith only those compounds having the same strongest
r::;;'l Turoria/: Learn more about IR spectral interpre-leJ tation and identification.
band being considered in any sample identification.This procedure is rapid and produces a list of potentialmatches within a short period. For example, only a fewseconds are required to search a base library of 50,000compounds by this procedure.
In addition to search systems. artificial intelligence-based computer programs seek to determine the struc-ture or substructure from spectral profiles. Some ofthese programs use data from different types of instru-ments (nuclear magnetic resonance, mass, and IR spec-trometers, etc.) to determine structuresS
Quantitative IR absorption methods differ somewhatfrom ultraviolet-visible molecular spectroscopic meth-ods because of the greater complexity of the spectra,the narrowness of the absorption bands, and the instru-mental limitations of IR instruments. Quantitative dataobtained with older dispersive IR instruments weregenerally significantly inferior in quality to data ob-tained with UV -visible spectrophotometers. The preci-sion and accuracy of measurements with modern FTIRinstruments, however, is distinctly better than those

Time(a)
1.0
0.8
~ug 0.6
ge 0.4f-.
0.2
0.04000 3600 3200 2800 2400 2000 1600 1200 800 400
Wavenumber, cm--I
(b)
FIGURE17-8 (a) Interferogram obtained from a typical FTIRspectrometer for methylenechloride. The plot shows detector signal output as a function of time or displacement of themoving mirrorof the interferometer. (b) IRspectrum of methylene chloride produced by theFourier transformation of the data in (a). Note that the Fourier transform takes signal intensitycollected as a function of time and produces transmittance as a function of frequency aftersubtraction of a background interferogram and proper scaling.
with dispersive instruments. Meticulous attention todetail is, however, essential for obtaining good-qualityresults9
relatively narrow. Furthermore, with dispersive instru-ments, the low intensity of sources and low sensitivitiesof transducers in this region require the use of rela-tively wide monochromator slit widths; thus. the band-widths employed are frequently of the same order ofmagnitude as the widths of absorption peaks. We havepointed out (Section 13B-2) that this combination ofcircumstances usually leads to a nonlinear relationshipbetween absorbance and concentration. As discussedin Section 16B-l, FTIR instruments have betterperformance characteristics. Hence, Beer's law devia-tions are not quite as serious as with dispersive instru-
Deviations from Beer's Law
With IR radiation, instrumental deviations fromBeer's law are more common than with ultraviolet andvisible wavelengths because IR absorption bands are
~For a discussion of quanlilative FTIR spectroscopy. see B. C. Smith,Fundamenrals of Fourier Transform Infrared Spectroscopy, Boca Raton,
FL: eRe Press, 1995; P. R Griffiths and 1. A. deHasech. Fourier Trans-form Infrared 5pecrrometr,,-. 'ew York: \\'lley, 1986.
.tie.·...
ments. In either casc, quantitative analysis usually re-quires that empirical calibration curves be used.
Absorbance Measurement
Matched absorption cells for solvent and solution areordinarily employed in the ultraviolet and visible re-gions, and the measured absorbance is then foundfrom the relation
A IPsolvent
= og--~P"olulion
The use of the solvent in a matched cell as a referenceabsorber has the advantage of largely canceling out theeffects of radiation losses due to reflection at the vari-ous interfaces, scattering and absorption by the sol-vent, and absorption by the container windows, Thistechnique is seldom practical for measurements in theIR region because of the difficulty in obtaining cellswhose transmission characteristics are identicaL MostIR cells have very short path lengths, which are diffi-cult to duplicate exactly. In addition, the cell windowsare readily attacked by contaminants in the atmo-sphere and the solvent. Because of this, their transmis-sion characteristics change continually with use. Forthese reasons, a reference absorber is often dispensedwith entirely in IR work, and the intensity of the radi-ation passing through the sample is simply comparedwith that of the unobstructed beam, In either case, theresulting transmittance is ordinarily less than 100%,even in regions of the spectrum where no absorptionby the sample occurs (see Figure 17-5),
For quantitative work, it is necessary to correct forthe scattering and absorption by the solvent and thecelL Two methods are employed. In the so-called cell-in·cell·out procedure, spectra of the pure solvent andthe analyte solution are obtained successively with re-spect to the unobstructed reference beam. The samecell is used for both measurements. The transmittanceof each solution versus the reference beam is then de-termined at an absorption maximum of the analyte.These transmittances can be written as
where P, is the power of the unobstructed beam and'Ii) and T, are the transmittances of the solvent andanalvte solution. respectively, against this reference. IfP, remains constant during the two measurements. then
the transmittance of the sample with respect to the sol-vent can be obtained by division of the two equations.That is,
T = T,n;, = PIP"
With modern FTIR spectrometers, the referenceinterferogram is obtained with no sample in thesample cell. Then, the sample is placed in the cell, anda second interferogram obtained. Figure 17-8a showsan interferogram collected using an FTIR spectrome-ter with methylene chloride, CH,Cl" in the samplecell. The Fourier transform is then applied to the twointerferograms to compute the IR spectra of the refer-ence and the sample. The ratio of the two spectra canthen be computed to produee an IR spectrum of theanalyte such as the one illustrated in Figure 17-8b,
An alternative way of obtaining Po and T for a singleabsorption band is the baseline method. For an instru-ment that displays transmittance, the solvent transmit-tance is assumed to be constant or at least to change lin-early between the shoulders of the absorption peak, asillustrated in Figure 17-9. The quantities To and T, arethen obtained as shown in the figure, For direct ab-sorbance readout, as is shown in Figure 17-7, the ab-sorbance is assumed to be constant or to change linearlyunder the absorption band. The peak absorbance isthen obtained by subtracting the baseline absorbance,
Typical Applications
With the exception of homo nuclear molecules, all or-ganic and inorganic molecular species absorb radia-tion in the IR region. IR spectrophotometry thus of-fers the potential for determining an unusually largenumber of substances. Moreover, the uniqueness ofan IR spectrum leads to a degree of specificity that is
A == log !JJ ::: log !!.!JT, P
FIGURE17-9 The baseline method for determining theabsorbance of an absorption maximum.

FIGURE 17-10 Spectra of C8HIO isomers incyclohexane.
matched or exceeded by relatively few other analyticalmethods. This specificity has found particular applica-tion to analysis of mixtures of closely related organiccompounds. Two examples that typify these applica-tions follow.
Analysis of a Mixtnre of Aromatic Hydrocarbons. Atypical application of quantitative IR spectroscopy in-volves the resolution of CHHIO isomers in a mixture thatincludes v-xylene, m-xylene, p-xylcne, and ethylben-zene. The IR absorption spectra of the individual com-ponents in the range of 12 to 15 flm in cyclohexane sol-vent is shown in Figure 17-10. Useful absorption bandsfor determination of the individual compounds occur at13.47,13.01,12.58, and 14.36 flm, respectively. Unfortu-nately, however, the absorbance of a mixture at anyoneof these wavelengths is not entirely determined by theconcentration of just one component because of over-lapping absorption bands. Thus, molar absorptivitiesfor each of the four compounds must be determined atthe four wavelengths. Then. four simultaneous equa-tions can be written that permit the calculation of theconcentration of each species from four absorbancemeasurements (see Section 14D-2). Alternatively.chemometric techniques. such as factor analvtical
12 13 l-l 15
A, tlm
12 13 14 15
A, pm
Minimum DetectableConcentration, ppmt
Carbon disulfideChloropreneDiboraneEthylenediamineHydrogen cyanideMethyl mercaptanNitrobenzenePyridineSulfur dioxideVinylchloride
12 13 14 15
A, ,Llln
4.5411.4
3.913.0
3.043.38
11.8
14.28.6
10.9
Courtesy of Thermo Electron Corp.
*1992-1993 OSHA exposure limits for 8-h weighted average.
tFor a 20.25-01 cell.
fShort·term exposure limit: is-Olin time-weighted average that shall not be exceeded at any time during the work day
for a variety of chemical compounds. IR absorptionprocedures appear to meet this need better than anyother single analytical tool.
Table 17-4 demonstrates the potential of IR spec-troscopy for the analysis of mixtures of gases. Thestandard sample of air containing five species in knownconcentration was analyzed with a computerized ver-sion of the instrument shown in Figure 16-13; a 20-mgas cell was employed. The data were printed outwithin a minute or two after sample introduction.
Table 17-5 shows potential applications of IR filterphotometers (such as that shown in Figure 16-13) forthe quantitative determination of various chemicals inthe atmosphere for the purpose of assuring compli-ance with Occupational Safety and Health Adminis-tration (OSHA) regulations.
Of the more than 400 chemicals for which maxi-mum tolerable limits have been set by OSHA, morethan half appear to have absorption charaeteristicssuitable for determination by means of IR filter pho-tometers or spectrophotometers. With such a largenumber of absorbing compounds, we expeet overlap-ping absorption bands. However, the method can pro-vide a moderately high degree of selectivity.
methods, 10 can use entire spectral regions to determinethe individual components. Such methods can be usedeven when the relationship between absorbance andconcentration is nonlinear (as frequently occurs in theIR region).
Determination of Air Contaminants. The recent pro-liferation of government regulations with respect Loatmospheric contaminants has demanded the devel-opment of sensitive, rapid. and highly specific methods
TABLE 17-4 An Example of IR Determinations of AirContaminants
Conen, Found, RelativeContaminant ppm ppm Error, %
Carbon monoxide 50.0 49.1 18Methyl ethyl ketone 1000 98.3 1.7
Methanol 100.0 99.0 1.0
Ethylene oxide 50.0 49.9 0.2Chloroform 100.0 99.5 0.5
CourteSy of Thermu Ekc!ron Curp
Disadvantages and Limitationsto Quantitative IR Methods
There are several disadvantages to quantitative analysisby IR spectrometry. Among these are the frequent non-adherence to Beer's law and the complexity of spectra.
The richness of spectral features enhances the prob-ability of overlapping absorption bands. In addition,with older dispersive instruments, the narrowness ofbands and the effects of stray radiation make absor-bance measurements critically dependent on the slitwidth and the wavelength setting. Finally, the narrow-path-length cells required for many analyses are in-convenient to use and may lead to significant analyticaluncertainties. For these reasons, the analytical errorsassociated with a quantitative IR analysis often cannotbe reduced to the level associated with ultraviolet andvisible methods, even with considerable care and effort.
178 MID-IR REFLECTIONSPECTROMETRY
IR reflection spectrometry has found a number of ap-plications, particularly for dealing with solid samplesthat are difficult to handle, such as polymer films andfibers, foods, rubbers, agriculture products, and manyothers." Mid-IR reflection spectra, although not iden-tical to the corresponding absorption spectra, aresimilar in general appearance and provide the same in-formation as do their absorption counterparts. Reflec-tance spectra can be used for both qualitative and
II See F. M. Mirabella, cd .. Modern Techniques in Applied Molecular Spec·troscopy, New York: Wiley, 1998; G. Kortum, Reflectance Spectroscopy,New York: Springa, 1969: N. J. H:trrick, /nterfUll Reflection Spectroscopy,New York: Wiley, 1967.

quantitative analysis. Most instrument manufacturersnow offer adapters that fit into the cell compartmentsof IR absorption instruments and make it possible toobtain reflection spectra readily.
Reflection of radiation is of four types: specular reflec-tion. diffuse reflection, infernal reflection, and attenuatedtotal reflectance (ATR). Specular reflection occurswhen the reflecting medium is a smooth polished sur-face. Here, the angle of reflection is identical to the in-cident angle of the radiation. If the surface is made upof an IR absorber, the relative intensity of reflection isless for wavelengths that are absorbed than for wave-lengths that are not. Thus, a plot of reflectance R, whichis the fraction of the incident radiant energy reflected,versus wavelength or wavenumber provides a spectrumfor a compound similar in general appearance to atransmission spectrum for the species. Specular reflec-tion spcctra find some use for examining and character-izing the smooth surfaces of solids and coated solids butare not as widely used as diffuse- and total-reflectionspectra. We will, therefore, focus on the latter two typesof spectra.
Diffuse-reflectance IR Fourier transform spectrome-try (D RIFTS) is an effective way of directly obtainingIR spectra on powdered samples with a minimum ofsample preparation.12 In addition to saving time insample preparation, it permits conventional IR spec-tral data to be gathered on samples not appreciably al-tered from their original state. The widespread use ofdiffuse-reflectance measurements had to await thegeneral availability of FTIR instruments in the mid-1970s because the intensity of radiation reflected frompowders is too low to be measured at medium resolu-tion and adequate signal-to-noise ratios with disper-sive instruments.
Diffuse reflection is a complex process that occurswhen a beam of radiation strikes the surface of a finelydivided powder. With this type of sample, specular rc-flection occurs at each plane surface. However, be-cause there are many of these surfaces and they arerandom Iv oriented, radiation is reflected in all direc-
L For additional information, see M. Milosevic. S. L. Berets. AppL Spec-
(rose Rn .. 2002.37. }..p; P. R. Griffiths and M. P. Fuller in Adl'aflCeS in
[n(riJ.rt"'dund Raman Spectroscupy, R. 1. H. Clark and R. E. Hester. cds ..\"ul. 9. Chap_ 2.LDndon: Heydon and Sons, 19x2
tions. Typically, the intensity of the reflected radiationis roughly independent of thc viewing angle.
A numbcr of models have bcen developed to de-scribe in quantitative terms the intensity of diffuse re-flected radiation. The most widely used of these mod-els was developed by Kubelka and MunklJ Fuller andGriffiths in their discussion of this model show that therelative reflectance intensity for a powder f(R'x) IS
given bV14
(I R')'f(R' ) = -x = ~.. x, 2R'x 5
where R'x is the ratio of the reflected intensity of thesample to that of a non absorbing standard, such asfinely ground potassium chloride. The quantity k is themolar absorption coefficient of the analyte, and s is ascattering coefficient. For a diluted sample, k is relatedto the molar absorptivity e and the molar concentra-tion of the analyte c by the relationship
k = 2.303ec
Reflectance spectra then consist of a plot off(R'x,) ver-sus wavenumber (see Figure 17-12b).
Instrumentation
Currently, most manufacturers of FTIR instrumentsoffer adapters that fit in cell compartments and permitdiffuse-reflectance measurements. Figure 17-11 illus-trates one type of adapter. The collimated beam fromthe interferometer is directed to an ellipsoidal mirrorand then to the sample. The sample is usually groundand mixed with KBr or KCI as a diluent. The mixtureis then placed in a sample cup 3-4 mm deep and about10-15 mm in diameter. A complex combination of re-flection, absorption, and scattering occurs before thebeam is directed to the detector.
To obtain a spectrum with a single-beam instrument,the signal for the sample is first stored. A reference sig-nal with a good reflector. such as finely ground KBr orKCl, is then recorded in place of the sample. The ratioof these signals is thcn taken to give the reflectance.
Comparison of Absorptionand Reflection Spectra
Figure 17-12 compares the conventionallR absorptionspectrum for carbazole obtained bv mcans of a KBrpellet with the diffuse-reflectance spectrum of a 5%
l.ip' Kubdka and L Munk. Tech. Ph.I'\._ 1931. 12. 593: P. Kuodka. I Opt
SQC Am .. 1948. 3:1. 44":;
:'~-L p, Fuller and P, R. Griffiths. A.rwl. Chern .. 1978. 50.19fKJ.
FIGURE 17-11 A diffuse-reflectance attachment for anFTIRspectrometer.
finely ground mixture of carbazole in potassium chlo-ride. Note that the peak locations are the same in thetwo spectra but that the relative peak heights differconsiderably. The differenccs arc typical, with minOrpeaks generally appearing larger in reflection spectra.
Internal-reflection spectroscopy is a technique for ob-taining IR spectra of samples that are difficult to dealwith, such as solids of limited solubility, films, threads,pastes, adhesives, and powders15
Principles
Whcn a beam of radiation passes from a more denseto a less dense medium, reflection occurs. The fractionof the incident beam reflected increases as the angleof incidence becomes larger; beyond a certain criticalangle, reflection is complete. It has been shown boththeoretically and experimentally that during the reflec-tion process the beam penetrates a small distance intothe less dense medium beforc reflection occurs. Thedepth of penetration, which varies from a fraction of awavelength up to several wavelengths, depends on thewavelength, the index of refraction of the two materials,and the angle of the beam with respcct to the interfacc.The penetrating radiation is called the evanescent wave.At wavelengths where thc less dense medium absorbsthe evanescent radiation, attenuation of the beam oc-curs, which is known as attenuated total reflectance, or
15 See E M. Mirabella. cd .. Modem Techniques in Applied Molecular Spec-troscopy. New York: Wiley, 1998: (j-, Kortum, Reffccumce Spectrm-copy,New 'r"orlc Springer. lY69: N. 1. HarricK.lruemill Reflection SpI:Y[(mcop.'"New York: Wiky. 1%7.
ATR. The resulting ATR spcctrum resembles that of aconventional IR spectrum with some differcnces.
Instrumentation
Figure 17-13 shows an apparatus for ATR measure-ments. As can be seen from the upper figure, the sample(here, a solid) is placed on opposite sides of a transpar-ent crystalline material of high refractive index. Byproper adjustment of the incident angle, the radiationundergocs multiple internal reflections before passingfrom the crystal to the detector. Absorption and atten-uation takc place at each of these reflections.
Figure 17-13b is an optical diagram of an adapterthat fits into the cell area of most IR spectrometers andpermits ATR measurements. Cells for liquid samplesare also available.
ATR Spectra
ATR spectra are similar but not identical to ordinaryabsorption spectra. In gencral, although the samebands are observed, their relative intensities differ.
O;;JCJl.00
::--.IN1....-;H~
carbazole"c~.Q
~ 0.75.Q
-<
0.50
2000 1500(a)
FIGURE 17-12 Comparison of the absorption spectrum(a) for carbazole with its diffuse-reflectance spectrum (b).

FIGURE17-13 ATRapparatus. In (a) a solid sample isshown mounted on an internal reflection crystal of highrefractive index. The materials used as ATRcrystalsinclude KRS-5, AgCI,Ge, Si, and the Irtran materials.Solid samples can be pressed against the crystal toobtain optical contact. In (b), a typical attachment for ATRis shown. With many attachments, the internal reflectionplate can be positioned in the holder to provide severalincident angles.
With ATR spectra, the absorbances, although depen-dent on the angle of incidence, are independent ofsample thickness, because the radiation penetratesonly a few micrometers into the sample. The effectivepenetration depth dp depends on the wavelength of thebeam, the refractive indexes of the crystal and thesample, and the beam angle. The penetration depth canbe calculated from
where A, is the wavelength in the crystal (Aln,), 0 is theangle of incidence, and n, and n, are the refractive in-dexes of the sample and crystal, respectively. Note thatthe effective penetration depth can be changed bychanging the crystal material, the angle of incidence,or both. It is possible to obtain a depth profile of a sur-face using ATR spectroscopy. In practice, a multi-reflection crystal with a 45' angle can accommodatemost routine samples.
One of the major advantages of ATR spectroscopyis that absorption spectra are readily obtainable on awide variety of sample types with a minimum of prepa-ration. Threads, yarns, fabrics, and fibers can be stud-
ied by pressing the samples against the dense crystal.Pastes, powders, or suspensions can be handled in asimilar way. Aqueous solutions can also be accommo-dated provided the crystal is not water soluble. Thereare even ATR flow cells available. ATR spectroscopyhas been applied to many substances, such as poly-mers, rubbers, and other solids. It is of interest that theresulting spectra are free from the interference fringesmentioned previously.
The spectra obtained with ATR methods can differfrom [R absorption spectra because of distortions thatoccur near strong absorption bands where the samplerefractive index may change rapidly. Also, the orienta-tion of the sample on the ATR crystal can influenceband shapes and relative intensities. However, the ATRband intensity is usually proportional to concentrationso that quantitative measurements can be made.
:".1odulatedbeam
from FfIR
FIGURE17-14 Diagram of a photoacoustic attachmentfor an FTIRspectrometer.
acoustic effect for obtaining absorption spectra ofsolids and turbid liquids.
17e PHOTOACOUSTIC IRSPECTROSCOPY
Photoacoustic IR spectroscopy saw limited applicationbefore the advent of FT[R instruments. Now, sev-eral manufacturers make photoacoustic accessories forFTIR instruments. [n photoacoustic measurements,the sample is placed in a small sample cup within thephotoacoustic attachment as illustrated in Figure 17-14.The photoacoustic spectrometer chamber is tilled witha high-thermal-conductivity gas such as helium or ni-trogen and placed in the FTIR sample compartment.The mirror shown deflects the modulated beam ontothe sample. Absorption of the IR beam by the samplecan result in nonradiative decay of the excited vibra-tional states of the sample molecules. This can transferheat to the surface of the sample and result in the gen-eration of a modulated acoustic wave in the gas insidethe chamber. A very sensitive microphone then detectsthe acoustic wave.
Photoacoustic spectra are normally plotted in aformat similar to absorption spectra as shown in Fig-ure 17-15. The spectra are usually plotted as a ratioto a background scan of a totally absorbing materialsuch as carbon black. Although the frequencies oftransitions are the same as in absorption spectra, rela-tive intensities depend on wavelength and modulationfrequency.
Photoacoustic spectra can be obtained on sampleswith essentially no sample preparation. The only re-quirement is that the sample must fit within the samplecup. fn addition to solids and turhid liquids, photo-acoustic methods have been used for detecting the
Photoacoustic spectroscopy (PAS) provides a way toobtain ultraviolet, visible, and IR absorption spectra ofsolids, semisolids, or turbid liquids." Acquisition ofspectra for these materials by ordinary methods is usu-ally difficult at best and often impossible because oflight scattering and reflection.
PAS is based on a light absorption effect that was firstinvestigated in the 1880s by Alexander Graham Belland others. This effect is observed when a gas in aclosed cell is irradiated with a chopped beam of radia-tion of a wavelength that is absorbed by the gas. Theabsorbed radiation causes periodic heating of the gas,which in turn results in regular pressure fluctuationswithin the chamber. If the chopping rate lies in theacoustical frequency range, these pulses of pressurecan be detected by a sensitive microphone. The pho-toacoustic effect has been used since the turn of thecentury for the analysis of absorbing gases and has re-cently taken on new importance for this purpose withthe advent of tunable IR lasers as sources. Of greaterimportance, however. has been the use of the photo-
components of mixtures separated by thin-layer andhigh-performance liquid chromatography and formonitoring the concentrations of gaseous pollutantsin the atmosphere.
The near-IR (NIR) region of the spectrum extendsfrom the upper wavelength end of the visible region atahout 770 nm to 2500 nm (13,000 to 4000 cm-I)." Ab-sorption bands in this region are overtones or combi-nations (Section 16A-4) of fundamental stretching vi-brations that occur in the region of 3000 to 1700 cm-I.The bonds involved are usually C- H, N - H, anda-H. Because the bands are overtones or combina-tions, their molar absorptivities are low and detectionlimits are on the order of 0.1%.
In contrast to mid-[R spectrometry, the most im-portant uses of NIR radiation are for the routine quan-titative determination of species, such as water, pro-teins, low-molecular-weight hydrocarbons, and fats, inproducts of the agricultural, food, petroleum, andchemical industries. Both diffuse-reflection and trans-mission measurements are used, although diffuse re-flectance is by far the more widely used.
I"For a general reference on NIR, see Handbook of Near-infrared Analy-sis. 2nd ed., D. A. Burns and E. W. Ciurczak, cds .. New York: MarcelDekker, 2001. For a review of commercial instrumentation, see C. M.Henry. AnaL Chern., 1999, 7/. 625A. In the literature of NlR spectrome-lry, the abscissa is usually wm/e!englh in nanometers or micrometers incontrast to mid-IR spectra in which the abscissa is wavenumber in units of(cm)-I
FIGURE17-15 Photoacoustic IRspectra of (a) a pulver-ized coal sample and (b)an extruded polymer pellet. (FromPractical Sampling Techniques for Infrared Analysis, P.B.Coleman, ed., Boca Raton, FL:eRC Press, 1993.)

Four different types of instruments are available forthe NIR region. Grating instruments are similar tothose used for UV-visible absorption spectroscopy.There are also discrete filter instruments usually con-taining filter wheels for selecting different wave-lengths. These are less flexible than other instrumentsbut useful for fixed, well-characterized samples. In ad-dition, acoustooptic tunable filter (AOTF) instru-ments are available. The acoustooptic filter is a solid-state device that diffracts radiation at wavelengthsdetermined by a radio frequency signal applied to thecrystal. Speed and ruggedness are the main advantagesof AOTF devices. Fourier transform spectrometersare also available commercially for NIR spectrometry.The advantages normally associated with FT instru-ments in the mid-IR region, such as high throughputand resolution, are less applicable in the NIR region.However, the wavelength reproducibility and signal-to-noise-ratio characteristics are major advantages ofFTsystems.
Most spectrometers use tungsten-halogen lampswith quartz windows. Cells for absorption measure-ments are usually quartz or fused silica transparent upto about 3000 nm. Cell lengths vary from 0.1 to 10 cm.Detectors range from PbS and PbSe photoconductorsto InSb and InAs photodiodes. Array detectors, suchas InGaAs detectors, have also become available forthe region. Several commercial UV-visible spec-trophotometers are designed to operate from 180 to2500 nm and can thus be used to obtain NIR spectra.
Several solvents are used for NIR studies. Some ofthese are listed in Figure 17-16. Note that only carbontetrachloride and carbon disulfide are transparentthroughout the entire NIR region.
170-2 Data Processing in NIR spectrometry
NIR spectral bands are normally broad and often over-lapping. There are rarely clean spectral bands that al-low simple correlation with analyte concentration. In-stead, multivariate calibration techniques are usedl'
Most commonly, partial least squares, principal compo-nents regression, and artificial neural networks are em-
'~For a discussion of multivariate techniques, see K. R. Beebe. R J PeiLand M. B. Seashohz, Chemomcrrics: A Practical Guide. Chap. 5. :'\ew YorkWiley, 1998: H. Martens and T. NaC's Mlllrimriate C<1libriltiofl. :\'ew )"orkWiley, 1989.
ployed. Such calibration involves development of a cal-ibration model through obtaining results on a "trainingset" that includes as many of the eonditions encoun-tered in the samples as possible. Problems and pitfalls indeveloping the models have been diseussedl'
The manufacturers of NIR instruments includesoftware packages for developing calibration models.In addition, third-party software for multivariate cali-bration is readily available.
170-3 Applications of NIRAbsorption Spectrometry
In contrast to mid-IR spectroseopy, NIR absorptionspectra are less useful for identification and more use-ful for quantitative analysis of compounds containingfunctional groups made up of hydrogen bonded to car-bon, nitrogen, and oxygen. Such compounds can oftenbe determined with accuracies and precisions equiva-lent to ultraviolet-visible spectroscopy, rather thanmid-IR spectroscopy. Some applications inthtde thedetermination of water in a variety of samples, includ-ing glycerol, hydrazine, organic films, and fuming ni-tric acid; the quantitative determination of phenols,aleohols, organic acids, and hydroperoxides based onthe ftrst overtone of the 0 - H stretching vibrationthat absorbs radiation at about 7100 cm] (1.4 Jlm);and the determination of esters, ketones, and car-boxylic acids based on their absorption in the region of3300 to 3600 cm-] (2.8 to 3.0 Jlm). The absorption inthis last case is the first overtone of the carbonylstretching vibration.
NIR spectrophotometry is also a valuable tool foridentification and determination of primary and sec-ondary amines in the presence of tertiary amines inmixtures. The analyses are generally carried out in car-bon tetrachloride solutions in IO-cm cells. Primaryamines are determined directly by measurement of theabsorbance of a combination N - H stretching band atabout 5000 cm-' (2.0 Jlm); neither secondary nor terti-ary amincs absorb radiation in this region. Primaryand secondary amines have several overlapping ab-sorption bands in the 3300 to 10,000 cm-' (I to 3 Jlm)region due to various N -H stretching vibrations andtheir overtones, whereas tertiary amines can have nosuch bands. Thus. one of these bands gives the second·
I"For example. ~ee.\1. A. Arnvld. J J BurmeIster. dnd G. W. SOl;)I!. Anal('hem .. 1998. ;/). F:.' L Zhang. (j \\'. Small. and \1. A.. :\cn<l[d, AnalChern. 20(H, 75. 59(}."
t-t I-- --i
Wavelength, J..lffi
10 1.2 14 16 18 2.0 2.2 2.4
ary amine concentration after correction for the ab-sorption by thc primary amine.
170-4 Applications of NIRReflectance Spectrometry
Near-IR reflectance spectroscopy has become a mostimportant tool for the routine quantitative determina-tion of constituents in finely ground solids. The mostwidcspread use of this technique has been for the de-termination of protein, moisture, starch, oil, lipids, andcellulosc in agricultural products such as grains andoilseeds. For example, Canada sells all its wheat basedon guaranteed protein content, and the CanadianGrain Commission formerly ran more than 600,000Kjeldahl protein determinations annually as a consc-quence. It was estimated in 1984 that 80% to 90% ofall Canadian grain was analyzed for protcin by NIRreflectance spectroscopy at a savings of more than$500,000 a year in analytical costs.'o
In NIR reflcctance spectroscopy, the finely groundsolid sample is irradiated with one or more narrowbands of radiation ranging in wavelength from 1 to2.5 Jlm or 10,000 to 4000 cm -I. Diffusc reflectance oc-curs in which the radiation penetrates the surface layerof thc particles, excites vibrational modes of the ana-lyte molecule, and is then scattered in all directions. Areflectance spectrum is thus produced that is depen-
FIGURE 17-16 Some useful solventsfor NIR spectroscopy. Solid lines indi-cate satisfactory transparency for usewith '-cm cells.
dent on the composition of the sample. A typical re-flectance spectrum for a sample of wheat is shown inFigure 17-17. The ordinate in this casc is the logarithmof the reciprocal of reflectancc R, where R is the ratioof the intensity of radiation reflected from the sampleto the reflcctance from a standard reflector, such asfinely ground barium sulfate or magnesium oxidc. Thereflectance band at 1940 nm is a water band used formoisture determinations. The band at about 2100 nmis, in fact, two overlapping bands, one for starch andthe other for protein. By making measurements atseveral wavelengths in this region, the concentrationsof each of these components can be determined.
~Oil 0.7.2
Wavelength, nm
FIGURE 17-17 Diffuse-reflectance NIRspectrum for asample of wheat.

Instruments for diffuse-reflectance measurementsare available from commercial sources. Some of theseemploy several interference filters to provide narrowbands of radiation. Others are equipped with gratingmonochromators. Ordinarily, reflectance measure-ments are made at two or more wavelengths for eachanalyte species being determined.
The great advantage of NIR reflectance methods istheir speed and the simplicity of sample preparation.Once method development has been completed.analysis of solid samples for several species can becompleted in a few minutes. Accuracies and precisionsof 1% to 2% relative are regularly reported.
The far-IR region is particularly useful for inorganicstudies because absorption due to stretching and bend-ing vibrations of bonds between metal atoms and bothinorganic and organic ligands generally occurs at fre-quencies lower than 650 em -I (> 15 I-'m). For example.heavy-metal iodides generally absorb radiation inthe region below l00cm-l, and the bromides and chlo-rides have bands at higher frequencies. Absorption fre-quencies for metal-organic bonds ordinarily dependon both the metal atom and the organic portion of thespecies.
Far-IR studies of inorganic solids have also provideduseful information about lattice energies of crystalsand transition energies of semiconducting materials.
Molecules composed only of light atoms absorbfar-IR radiation if they have skeletal bending modesthat involve more than two atoms other than hydro-gen. Important examples are substituted benzene de-rivatives, which generally show several absorptionbands. The spectra are frequently quite specific anduseful for identifying a particular compound. Thereare also characteristic group frequencies in the far-IRregion.
Pure rotational absorption by gases is observed inthe far-IR region, provided the moleculcs have perma-nent dipole moments. Examples include H,O. 0" HCLand AsH). Absorption by water is troublesome: elimi-nation of its interference requires evacuation or at leastpurging of the spectrometer.
Prior to the advent of Fourier transform spectrom-eters, experimental difficulties made it difficult to ob-tain good far-IR spectra. The sources available in thisregion are quite low in intensities. Order-sorting filters
are needed with grating instruments in this region tominimize radiation diffracted from higher grating or-ders. These reduced the already low throughputs ofdispersive spectrometers. It is no surprise that Fouriertransform spectrometry was first applied in this spec-tral region. The high throughput of interferometersand the relatively low mechanical tolerances requiredmade it fairly simple to obtain FTIR spectra in the far-IR region with good signal-to-noise ratios.
When they are heated, molecules that absorb IR ra-diation are also capable of emitting characteristicIR wavelengths. The principal deterrent to the analyt-ical application of this phenomenon has been the poorsignal-to-noise characteristics of the IR emission sig-nal. particularly when the sample is at a temperatureonly slightly higher than its surroundings. With)nter-ferometry, however, interesting and useful applica-tions have appeared in the literature.
An early example of the application of IR emissionspectroscopy is found in a paper that describes theuse of a Fourier transform spectrometer for the iden-tification of microgram quantities of pesticides.21
Samples were prepared by dissolving them in a suit-able solvent followed by evaporation on a NaCI orKBr plate. The plate was then heated electrically nearthe spectrometer entrance. Pesticides such as DOT,malathion. and dieldrin were identified in amounts aslow as 1 to 10 I-'g.
Equally interesting has been the use of interferom-etry for the remote detection of components emittedfrom industrial smoke stacks. In one of thcse applica-tions. an interferometer was mounted on an 8-inchreflecting telescope." With the telescope focused onthe plume from an industrial plant. CO, and SO, wercreadily detected at a distance of several hundred feet.
The Mars Global Surveyor launched from CapeCanaveral in November 1996. It reached Mars orbitin 1997. One of fivc instruments on board was an IRemission spectrometer, called a thermal emission spec-trometer. The spacecraft completed its mapping mis-sion in 20Dl. providing measurements of the Martiansurface and atmosphcre. The Mars rover Spirit has a
» 0.95
~U3 0.9
FIGURE 17-18 Spectra from Mars rover Spirit showing anunidentified mineral containing bound water in its crystalstructure. Minerals such as zeolites and gypsum arepossible candidates. Mini-TES= mini thermal-emissionspectrometer. (Courtesy of NASA/JPLlArizona StateUniversity.)
mini thermal-emission spectrometer on board capableof indicating the composition of nearby soils and rocks.Figure 17-18 shows an IR emission spectrum taken inearly 2004 that showed evidence of an unidentifiedwater-containing mineral, Thermal emission spectrahave also indicated the presence of carbonates andother hydrated minerals. These may have been pro-duced by long-standing bodies of water.
IR microspectrometry is used for obtaining absorptionor reflection spectra of species in samples having phys-ical dimensions in the range of 10 to 500 1-'01." IR mi-croscopes, which were first introduced bv several in-strument manufacturers in the 1980s, gen~rally consistof two microscopes. one an ordinary optical micro-scope and the other an IR device with reflection opticsthat reduce the size of the IR beam to about that of thesample. The optical microscope is used to visuallv lo-cate the sample particle or spot to be studied with theIR beam. The IR source is an ordinary Fourier trans-form spectrometer and not a grating instrument be-cause of the much greater sensitivity of FTiR instru-ments. The detector is usually a liquid-nitrogen-cooledmercury telluride-cadmium telluride photoconduc-tive device that is more sensitive than other types of IRdetectors.
The use of IR microscopy is still fairly new butappears to be a technique that will find increasing ap-plications in the future. Some of its current applica-tions include identification of polymer contaminants,imperfections in polymer films, and individual layersof laminated polymer sheets; identification of tinysamples of fibers, paint, and explosives in criminalis-tics; characterization of single fibers in the textile in-dustry; and identification of contaminants on elec-tronic components.
23See Practical Guide to Infrared Microspectroscopy, H. J. Humecki. ed.,New York: Marcel Dekker, 1995~J. Katon. Tnfrared Microspectroscopy inModern Techniques in Molecular Spectroscopy, F. Mirabella, ed., NewYork: Wiley, 1998.
*Answers are provided at the end of the book for problems marked with an asterisk.
~ Problems with this icon are best solved using spreadsheets.
17-1 Cyclohexanone exhibits its strongest IR absorption band at 5.86I-'m, and at thiswavelength there is a linear relationship between absorbance and concentration.(a) Identify the part of the molecule responsible for the absorbance at this
wavclength.(b) Suggest a solvent that would be suitable for a quantitative analysis of cyclo-
hexanone at this wavelength.(c) A solution of cyclohexanone (4.0 mg/mL) in the solvent selected in part
(b) exhibits a blank-corrected absorbance of 0.800 in a cell with a path lengthof 0.025 mm. What is the detection limit for this compound under theseconditions if the noise associated with the spectrum of the solvent is 0.001absorbance units'!

*17-2 The spectrum in Figure 17-19 was obtained for a liquid with the empirical for-mula of C,H60. Identify the compound.
17-3 The spectrum in Figure 17-20 is that of a high-hailing-point liquid having theempirical formula C,HIOO. Identify the compound as closely as possihle.
*17-4 The spectrum in Figure 17-21 is for an acrid-smelling liquid that boils at 50°Cand has a molecular weight of about 56. What is the compound') What impurityis clearly present"
*17-5 The spectrum in Figure 17-22 is that of a nitrogen-containing substance thathails at 9TC. What is the compound"
17-6 Why are quantitative analytical methods hased on NIR radiation often moreprecise and accurate than methods based on mid-IR radiation'?
17-7 Discuss the origins of photoacoustic IR spectra. What are the usual types ofsamples for photoacoustic measurements'?
17·8 Why do IR spectra seldom show regions at which the transmittance is l00%?
*17-9 An empty cell showed 15 interference fringes in the wavelength range of 6.0 to12.2 flm. Calculate the path length of the cell.
*17-10 An empty cell exhibited 11.5 interference fringes in the region of 1050 tp1580 cm-'. What was the path length of the cell? '
*17-11 Estimate the thickness of the polystyrene film that yielded the spectrum shownin Figure 16-1.
[iJ Challenge Problem
17-U (a) Consider an ATR experiment with a sample having a refractive index of 1.03at 2000 em -I. The ATR crystal was AgCl with a refractive index of 2.00 atthis wavelength. For an angle of incidence of 45°, what is the effective pene-tration depth of the evanescent wave? How would the penetration depthchange if the angle were changed to 60°?
(b) For the same experiment in part (a) and a 60° incidence angle, find thepenetration depths for sample refractive indexes varying from 1.00 to 1.70in steps of 0.10. Plot penetration depth as a function of refractive index.Determine the refractive index for which the penetration depth becomeszero. What happens at this point?
(c) For a sample with a refractive index of 1.37 at 2000 em . , and an incidenceangle of 45°, plot the penetration depth versus the ATR crystal refractiveindex. Vary the crystal refractive index over the range of 2.00 to 4.00 in stepsof 0.25. Which crystal, AgCl (no = 2.00) or Ge (no = 4.00), gives the smallerpenetration depth" Why'?
(d) An aqueous solution with a refractive index of 1.003 is measured with anATR crystal with a refractive index of 2.8. The incidence angle is 45°. Whatis the effective penetration depth at 3000 cm-', 2000 cm " and 1000 em-I.,Is absorption hy the aqueous solvent as much of a problem in ATR as innormal IR absorption measurements" Why or why not?
(e) Work by S. Ekgasit and H. Ishida (S. Ekgasit and H. Ishida, Appl. Spec/rose.,1996,50, 1187; Appl. Spec/rose., 1997,51,461) describes a new method toobtain a depth profile of a sample surface using ATR spectroscopy. Describethe principles of this new approach. Why are spectra taken with differentdegrees of polarization" What is the complex index of refraction"
.. ,.-~ c·-
.- ~,. c- !-'- .. -
r'c-~A.....;=:i
T..- - --.=!_.t- c- I
! (
_. --l! :_ ..
l- -t- .r: H..
_ ...• --,- it--- N:'
... _<
_. =:+- _. C•. _ "1-
t~=fT,--- i-
f f L=..... {i'- r-'---- ...T)- 1-· ft
--- ... 1- le--
.~ --- ., f< _1--
c__ r:===-_.'_._, - -.\ I
==\:. ' .... Lt 1:+-
t t'- iC"I------ .LM-.... , t- i
--- fT'1\. k,----
f-- .•. r i 8},'F- i ~,J.(E i2 1-; i .--
!J ' ,- i+<r;
.-.0
\., 0=: ,.i2
--I
--'-,
~-- r if
+- 'i. 0-- -ti- 0:",-- =>it ~j Q;
\;" ::0 C:::: . is '"0
.c0 ~-- S '"'"-"-l '"'"...., a:0 '"0 (JN E-
'".- -- _. , g c>-'0
°== "'k~
E,.- is '"'T ~-:-~-- - -; o ~. ... t-- 0 § ~~,,- ~ ri'
~ §i\..I-I-, t .cE
0 " 0:'=~,FF"- ! + i
0 ~ (J ;'l::: E(fJ-- ; :J '"0 ~~- i2 0.0
(fJO-- ->.
<----cr:i:t=.
.", r-- ~'"... -.,.. .,
E~-.. - ,-- 0- 1'- .--!-- 0 .£1::J~ -§::?'.. - -c' --- ~o<l
-. - ,- 0 0..«''1 0
'" '"0
'"',- , N '".... ~ ....(fJx
.-- --.~ I:: o~.. ,··Hi 0 ~ --
'T.-c- .. + !
or, ~ .~:it 0'III e
- ..- a: 0..
== ~~ ::l '"'i ;! ::0 Cliii~ u:o-- 7"I i~r:-l't':r-c-L:: r ,--- 0
:7;, 1 ' t ::-:1 :J ~,
q; ;, c ~• . ~,,-:T ! I 5N=o ~ ~ ~ _0
'" ~ ~'T
~() ";:L'lUP.llIWSU€l.L

-'I ' I jJ .'" I') :
iI1- ~-~I, ~~- V1 i ;
,.:
: - ;~--- I I
- i - .
,--I n
.~ :-- +-- -
; - - :- I
f::
; c: f--- -'-~- -i- t-
- ~~~... +:
I-r
-<1,-== -
I --- ~I
~'-~- +
C +! 1
C ~~ )!
-~
'-~-:' f-- '- I I! -.... I
, -~ .\.. I H ,...
I -
I
I; __ ,1. i-' c
I~
-., .++ rr--T +
. ...~:c: f----+--+-:'.T('"-N 'iT ,--:--:.: - Tr-
:~liI'
~~-'-f-----L--f----. -~_ ..
"-\:
f---- -I-·~· .-f-- _.f---- I
II .' ,
::
;._-- 7
iW.... ..•. hen radiation passes through a trans-~,'X. .' parent medium, the species present
'.. . ..... scatter a fraction flf the beam in all.¢irections(Section 6B-l 0). Raman .scattering re-
,su.lts from~he sametrPe of qu.f:lrltized vibrational
<.•fhanges a~fociatedUJith IR absorption. Thus, the
'difference if! wavele'!gth between the incident and.scattered visible radi~tion corresponds to wave-~lengths irt the mid-lflregion. Indeed, the Raman
scattering i;pectrum and IR absorption spectrum
for a given species often resemble one another quiteclosely. As discussed in this chapter, for some prob-
lems, lR spectroscopy is the superior tool, but for
others, Raman spectroscopy can provide more
useful information.
r3I Throughout this chapter, this logo indicateslQ.J an opportunity for online self-study at www.thomsonedu.com /chemistry/skoog, linking you tointeractive tutorials, simulations, and exercises.
In 1928 the Indian physicist C. V Raman discoveredthat the visible wavelength of a small fraction of theradiation scattered by certain molecules differs fromthat of the incident beam and furthermore that theshifts in wavelength depend on the chemical structureof the molecules responsible for the scattering. Ramanwas awarded the 1931 Nobel Prize in physics for thisdiscovery and for his systematic exploration of it. I
Although there can be striking similarities betweenRaman spectra and IR spectra, enough differences re-main between the kinds of groups that are IR active andRaman active to make the techniques complementaryrather than competitive. An important advantage ofRaman spectroscopy over IR lies in water being a quiteuseful solvent. In addition, because signals are usuallyin the visible or near-IR region, glass or quartz cells canbe employed, avoiding the inconvenience of workingwith sodium chloride or other atmospherically unstablewindow materials. Despite these advantages, Ramanspectroscopy was not widely used by chemists untillasers became available in the I960s, which made spec-tra a good deal easier to obtain. In recent years, Ramanspectroscopy has become a routine tool thanks to thelaser, the array detector, and the availability of com-mercial instrumentation at moderate cost.
18A THEORY OF RAMANSPECTROSCOPY
Raman spectra are acquired by irradiating a samplewith a powerful laser source of visible or near-IR mo-nochromatic radiation. During irradiation, the spec-trum of the scattered radiation is measured at someangle (often 90") with a suitable spectrometer. To avoidfluorescence. the excitation wavelengths are usuallywell removed from an absorption band of the analyte.The Raman experiment was illustrated previously inFigure 6-18. At the very most, the intensities of Ramanlines are 0.001% of the intensity of the source. Be-cause of this. it might seem more difficult to detect andmeasure Raman bands than IR vibrational bands.However. the Raman scattered radiation is in the visible
I For more compktc dl,>cussiollS of the theory and practice of Raman spec-troscopy. see J. R. Ferraro, K. Nakamoto, and C. \V. Brown, InrwduclorvRllman SpedTOsclJpl·. 2nd ed" San Diego: Academic Pre<is. 1003: R. L.\fcCrecry, Raman SPl'ctTOscOP-", (or Chemical Analysis. New York: Wiley,~(Jtlu:D. P. Strommen in Handbook vf Instrunu'nta{ Analysis. F. A. Settle.eLl.. Chap. In. t;pper Saddle River. NJ: Prentice Hall, 1997: AnalyticalRaman Speetrosco!H'. J G. G-rasscll and B. J Bulkin. eds .. New York'Wiley. l'J<11

fiGURE 18-1 The origin of Raman spectra. In (a) radiationfrom a source that is incident on the sample producesscattering at all angles. The incident radiation causes exci-tation (a)to a virtual levelj and subsequent reemission of aphoton of lower (left)or higher (right)energy. The Ramanspectrum (b)consists of lower-frequency emissions callecStokes scattering and higher-frequency emissions termedanti-Stokes scattering. Usually,the ground vibrational level(,. ~ 0) is more highlypopulated than the excited vibrationlevels so that the Stokes lines are more intense than theanti-Stokes lines. Elastically scattered radiation is of thesame frequency as the excitation beam and is calledRayleigh scattering.
or near-IR regions for which more sensitive detectorsare available. Hence, today, measurement of Ramanspectra is nearly as easy as measurement of IR spectra.
18A·1 Excitation of Raman Spectra
In Figure 18-1, the sample is irradiated by a monochro-matic beam of energy hI'". Because the excitationwavelength is well away from an absorption band, exci-tation can be considered to involve a virtual state of en-ergy level j, indicated by the dashed line in Figure 18-la.A molecule in the ground vibrational level (v = 0) canabsorb a photon of energy hI'" and reemit a photonof energy h(v" - vJ, as shown on the left side of Fig-ure 18-la. When the scattered radiation is of a lowerfrequency than the excitation radiation, it is calledStokes scattering. Molecules in a vibrationally excitedstate (v = I) can also scatter radiation inelastically andproduce a Raman signal of energy h(l'" + v,). Scatteredradiation of a higher frequency than the source radia-tion is called ami-Stokes scattering. Elastic scatteringcan also occur with emission of a photon of the same
energy as the excitation photon, hI'". Scattered radia-tion of the same frequency as the source is termedRayleigh scaltering. Note that the frequency shifts of theinelastically scattered radiation (v" + ,,,) ~ v" = v,and (1'" - vJ ~ v" ~ -v, correspond to the vibra-tional frequency. v,. The simplified Raman spectrumcorresponding to the transitions shown is given inFigure 18-1b.
Figure 18-2depicts a portion of the Raman spectrumof carbon tetrachloride that was obtained by using anargon-ion laser having a wavelength of 488.0 nm as thesource. As is usually the case for Raman spectra, the ab-scissa of Figure 1/;-2 is the wavenumber shift Ill', whichis defined as the difference in wavenumbers (em -I) be-tween the observed radiation and that of the source.Note that three Raman lines are found on both sides ofthe Rayleigh lines and that the pattern of shifts on eachside is identical. That is. Stokes lines are found atwavenumbers that are 21S, 314, and 459 em -I smallerthan the Rayleigh lines, and anti-Stokes lines occur at218,314, and 459 em I greater than the wavenumber ofthe source. It should also be noted that additio;allinescan be found at :':762 and :':790 em -I. Because the anti-Stokes lines are appreciably less intense than the corre-sponding Stokes lines, only the Stokes part of a spec-
-sm -400 -1m -2(Xl -IlK) () 100 200 300 400 S(Xl
Raman shifr. em-I
fiGURE 18-2 Raman spectrum of eel,. excited by laserradiation of A" ~ 488 nm (v" ~ 20,492 cm-'). The numberabove the Raman lines is the Raman shift, J.v = vex"!: /lv. inem". Stokes-shiftec lines are often given positive valuesrather than negative values as shown. (From J. R. Ferraro,K.Nakamoto, and e. W. Brown, Introductory Raman Spec-troscopy, 2nd ed., San Diego: Academic Press, 2003.Reprinted with permiSSion.)
Lowestexcitedelectronicstate
Rayleigh Ramanscattering scatteringE = hvex E ::::hI!ex ± tiE-T---------~--------'---I
I j'Groundelectronicstate
trum is generally used. Furthermore, the abscissa of theplot is often labeled simply "wavenumber v, em -I"
rather than "wavenumber shift Ilv." It is noteworthythat fluorescence may interfere seriously with the ob-servation of Stokes shifts but not with anti-Stokes. Withlluorescing samples, anti-Stokes signals may, therefore,be more useful despite their lower intensities.
It is important to appreciate that the magnitudeof Raman shifts is independent of the wavelength ofexcitation. Thus, Raman shifts identical to those shownin Figure 18-2 are observed for carbon tetrachlorideregardless of whether excitation was carried out withan argon-ion laser (4S/;.0), or a helium-neon laser(632.8 nml.
Superficially. the Raman Stokes shifts to lowerenergies (longer wavelengths) are analogous to theStokes shifts found in molecular lluorescence (seeSection 6C-6). We shall see, however, that Raman and
fiGURE 18-3 Origins of Rayleigh and Ramanscattering.
fluorescence spectra arise from fundamentally differ-ent processes.
18A-2 Mechanisms of Ramanand Rayleigh Scattering
In Raman spectroscopy, spectral excitation is normallycarried out by radiation having a wavelength that iswell away from any absorption bands of the analyte.The energy-level diagram of Figure IS-la is expandedin Figure IS-3 and provides a qualitative picture of thesources of Raman and Rayleigh scattering. The heavyarrow on the far left depicts the energy change in themolecule when it interacts with a photon from thesource. The increase in energy is equal to the energy ofthe photon hve,. It is important to appreciate that theprocess shown is nor quantized: thus. depending on thefrequency of the radiation from the source, the energy

of the molecule can assume any of an infinite numberof values, or virtual stares, between the ground stateand the lowest (first) electronic excited state shown inthe upper part of the diagram. The second and nar-rower arrow on the left shows the type of change thatwould occur if the molecule encountered by the pho-ton happened to be in the first vibrational level of theelectronic ground state. At room temperature, thefraction of the molecules in this state is small. Thus, asindicated by the width of the arrows, the probability ofthis process occurring is much smaller.
The middle set of arrows depicts the changes thatproduce Rayleigh scattering. Again the more probablechange is shown by the wider arrow. Note that no en-ergy is lost in Rayleigh scattering. As a consequence,the collisions between the photon and the moleculeare said to be elastic.
Finally, the energy changes that produce Stokes andanti-Stokes emission arc depicted on the right. The twodiffer from the Rayleigh radiation by frequencies cor-responding to ±!!J.E, the energy of the first vibrationallevel of the ground state, !lVv• Note that if the bond wereIR active, the energy of its absorption would also be !::J.E.Thus, the Raman frequency shift and the IR absorptionfrequency are identical.
Note also that the relative popUlations of the twoupper energy states are such that Stokes emission ismuch favored over anti-Stokes. In addition, Rayleighscattering has a considerably higher probability of oc-curring than Raman scattering because the most prob-able event is the energy transfer to molecules in theground state and reemission by the return of thesemolecules to the ground state. Finally, it should benoted that the ratio of anti-Stokes to Stokes intensitiesincreases with temperature because a larger fraction ofthe molecules is in the first vibrationally excited stateunder these circumstances.
18A-3 Wave Model of Ramanand Rayleigh Scattering
Let us assume that a beam of radiation having a fre-quency v" is incident on a solution of an analyte. Theelectric field E of this radiation can be described by theequation
where Eo is the amplitude of the wave. When the elec-tric field of the radiation interacts with an electron
cloud of an analyte bond, it induces a dipole momentm in the bond that is given by
frequency has been modulated by the vibrational fre-quency of the bond. It is important to note that the se-lection rules for Raman scattering require that there bea change in polarizability during the vibration - thatis, aalar in Equation 18-7 must be greater than zero forRaman lines to appear. The selection rules also predictthat Raman lines corresponding to fundamental modesof vibration occur with !!J.v = ± 1. Just as with IR spec-troscopy, much weaker overtone transitions appear at!::J.v = ±2.
We have noted that, for a given bond, the energyshift' observed in a Raman experiment should be iden-tical to the energies of its IR absorption bands, pro-vided the vibrational modes involved are both IR andRaman active. Figure 18-4 illustrates the similarity ofthe two types of spectra; it is seen that there are severalbands with identical vand !!J.v values for the two com-pounds. We should also note, however, that the relativeintensities of the corresponding bands are frequentlyquite different. Moreover, certain peaks that occur inone spectrum are absent in the other.
The differences between a Raman spectrum and anlR spectrum are not surprising when it is considered
where a is a proportionality constant called the polar-izability of the bond. This constant is a measure of thedeformability of the bond in an electric field.
The polarizability a varies as a function of the dis-tance between nuclei according to the equation
a = a" + (r - r,q)(:;)where a" is the polarizability of the bond at the equi-librium internuclear distance r"l and r is the inter-nuclear separation at any instant. The change in inter-nuclear separation varies with the frequency of thevibration Vv as given by
where rm is the maximum internuclear separation rela-tive to the equilibrium position. .
Substituting Equation 18-4 into 18-3 gives
a = a" + (:; )rmCOS(27Tvvt) r:71 lillurial: Learn more about Raman and IRIQJ spectra.
We can then obtain an expression for the induced di-pole moment m by substituting Equation 18-5 intoEquation 18-2. Thus,
that the basic mechanisms, although dependent on thesame vibrational modes, arise from processes that aremechanistically different. Infrared absorption requiresthat there be a change in dipole moment or charge dis-tribution during the vibration. Only then can radiationof the same frequency interact with the molecule andpromote it to an excited vibrational state. In contrast,scattering involves a momentary distortion of the elec-trons distributed around a bond in a molecule, followedby reemission of the radiation as the bond returns toits normal state. In its distorted form, the molecule istemporarily polarized; that is, it develops momentarilyan induced dipole that disappears on relaxation andreemission. Because of this fundamental difference inmechanism, the Raman activity of a given vibrationalmode may differ markedly from its IR activity. For ex-ample, a homonuclear molecule such as nitrogen, chlo-rine, or hydrogen has no dipole moment either in itsequilibrium position or when a stretching vibrationcauses a change in the distance between the two nuclei.Thus, absorption of radiation (IR) of the vibrationalfrequency cannot occur. On the other hand, the polar-izability of the bond between the two atoms of such amolecule varies periodically in phase with the stretch-ing vibrations, reaching a maximum at the greatest
80 .~
60 '§40 g20 e=
m = 0'"E"cos(27Tv"t)
+ E"rm(:;)coS(27TVvt)COS(27Tv"t) (18-6)
if we use the trigonometric identity for the product oftwo cosines
cosxcosy = [cos(x + y) + cos(x - y)]/2
we obtain from Equation 18-6
m = O'oE"cOS(27Tvel)
+ ~o rm( :; )COS[27T(V" - vvltJ
+ E"rm(aO')COS[21T(V" + v,)t]2 dr
10 -
tR>,
¥~ .j
dRaman
0.j000 3500
::140 !
~ 20 =:The first term in this equation represents Rayleigh
scattering, which occurs at the excitation frequency v".The second and third terms in Equation 18-7 corre-spond respectively to the Stokes and anti-Stokes fre-quencies of Vex - Vv and Vex + Vv' Here, the excitation
FIGURE18-4 Comparison of Raman and IRspectra for mesitylene and indene. (Courtesy ofPerkin-Elmer Corp .. Norwalk,CT.)

separation and a minimum at the closest approach. ARaman shift corresponding in frequency to that of thevibrational mode rcsults.
[t is of interest to compare the [R and the Ramanactivities of coupled vibrational modes such as thosedescribed earlier (page 438) for the carbon dioxidemolecule. In the symmetric mode, no change in the di-pole moment occurs as the two oxygen atoms moveaway from or toward the central carbon atom; thus, thismode is IR inactive. The polarizability, however, fluctu-ates in phase with the vibration because distortion ofbonds becomes easier as they lengthen and more diffi-cult as they shorten. Raman activity is associated withthis mode.
[n contrast, the dipole moment of carbon dioxidefluctuates in phase with the asymmetric vibrationalmode. Thus, an IR absorption band arises from thismode. On the other hand, as the polarizability of one ofthe bonds increases as it lengthens, the polarizability ofthe other decreases, resulting in no net change in themolecular polarizability. Thus, the asymmetric stretch-ing vibration is Raman inactive. For molecules with acenter of symmetry, such as CO" no IR active transi-tions are in common with Raman active transitions.This is often called the mutual exclusion principle.
Often, as in the foregoing examples, parts of Ramanand IR spectra are complementary, each being associ-ated with a different set of vibrational modes within amolecule. For noncentrosymmetric molecules, manyvibrational modes may be both Raman and IR active.For example, all of the vibrational modes of sulfur diox-ide yield both Raman and [R bands. The intensities ofthe bands differ, however, because the probabilities forthe transitions are different for the two mechanisms.Raman spectra are often simpler than [R spectra be-cause the occurrence of overtone and combinationbands is rare in Raman spectra.
The intensity or radiant power of a normal Ramanband depends in a complex way on the polarizability ofthe molecule, the intensity of the source, and the con-centration of the active group, as well as other factors.[n the absence of absorption, the power of Ramanemission increases with the fourth power of the fre-quency of the source. However, advantage can seldombe taken of this relationship because of the likelihoodthat ultraviolet irradiation will cause photodecomposi-tion of the analyte.
Raman intensities arc usually directly proportionalto the concentration ofthe active species. In this regard,Raman spectroscopy more closely resembles fluores-cence than absorption, in which the concentration-intensity relationship is logarithmic.
Raman measurements provide, in addition to intensityand frequency information, one additional variablethat is sometimes useful in determining the structureof molecules, namely, the depolarization ratio.' Here,it is important to distinguish carefully between theterms polarizability and polarization. The former termdescribes a molecular property having to do with thedeformability of a bond. Polarization, in contrast, is aproperty of a beam of radiation and describes the plancin which the radiation vibrates.
When Raman spectra are excited by plane-polar-ized radiation, as they are when a laser source is used,the scattered radiation is found to be polarized t/.l var-ious degrees depending on the type of vibration re-sponsible for the scattering. The nature of this effect isillustrated in Figure 18-5, where radiation from a lasersource is shown as being polarized in the yz plane. Partof the resulting scattered radiation is shown as beingpolarizcd parallel to the original beam, that is, in the xzplane; the intensity of this radiation is symbolized bythe subscript II. The remainder of the scattered beam ispolarized in the xy plane, which is perpendicular to thepolarization of the original beam; the intensity of thisperpendicularly polarized radiation is shown by thesUbscript L The depolarization ratio p is defined as
l~p = I;
Polarizedradiation
from laser
Partiallydepolarized
scatteredradiation
and away from the central carbon atom. The depolar-ization ratio is 0.005, indicating minimal depolariza-tion; the 459-cm -1 line is thus said to be polarized. [ncontrast, the carbon tetrachloride bands at 218 and314 cm -" which arise from nonsymmetrical vibrations,have depolarization ratios of about 0.75. From scatter-ing theory it is possible to demonstrate that the maxi-mum depolarization for nonsymmetric vibrations is617, and for symmetric vibrations the ratio is always lessthan this number. The depolarization ratio is thus use-ful in correlating Raman lines with modes of vibration.
Experimentally, the depolarization ratio may be ob-tained by inserting a Polaroid sheet or other polarizerbetween the sample and the monochromator. Spectraare then obtained with the axis of the sheet orientedparallel with first the xz and then the xy plane shown inFigure 18-5.
The depolarization ratio depends on the symmetryof the vibrations responsible for the scattering. For ex-ample, the band for carbon tetrachloride at 459 cm-1
(Figure 18-2) arises from a totally symmetric "breath-ing" vibration involving the simultaneous movement ofthe four tetrahedrally arranged chlorine atoms toward
Instrumentation for modern Raman spectroscopyconsists of a laser source, a sample illumination sys-tem, and a suitable spectrometer as illustrated in Fig-ure 18-63 The performance requirements for thesecomponents are more stringent than for the molecularspectrometers we have already described, however,because of the inherent weakness of the Raman scat-tering signal compared with the signal produced by theRayleigh scattering.
The sources used in modern Raman spectrometry arenearly always lasers because their high intensity is nec-essary to produce Raman scattering of sufficient in-tensity to be measured with a reasonable signal-to-noise ratio. Five of the most common lasers used forRaman spectroscopy are listed in Table 18-1. Because
FIGURE 18-6 Block diagram of a Raman spectrometer.The laser radiation is directed into a sample cell. TheRaman scattering is usually measured at right angles toavoid viewing the source radiation. A wavelength selectorisolates the desired spectral region. The transducerconverts the Raman signal into a proportional electricalsignal that is processed by the computer data system.

TABLE16-1 Some Common LaserSources for Raman Spectroscopy
Argon ionKrypton ionHelium-neonDiodeNd-YAG
488.0 or 514.5530.9 or 647.1632.8785 or 8301064
the intensity of Raman scattering varies as the fourthpower of the frequency, argon and krypton ion sourcesthat emit in the blue and green region of the spectrumhave an advantage over the other sources shown in thetable. For example, the argon ion line at 488 nm pro-vides Raman lines that arc nearly three times as in-tense as those excited by the He-Ne source, given thesame input power. However, these short-wavelengthsources can produce significant fluorescence and causephotodecomposition of the sample.
The last two sources in the table, which emit near-IRradiation, are finding more and more use as excitationsourCes. Near-IR sources have two major advantagesover shorter-wavelength lasers. The tirst is that theycan be operated at much higher power (up to 50 W)without causing photodecomposition of the sample.The second is that they are not energetic enough to pop-ulate a signitieant number of fluorescence-producingexcited electronic energy states in most molecules.Consequently, fluorescence is generally much less in-tense or nonexistent with these lasers. The Nd-YAGlaser, used in Fourier transform Raman spectrometersis particularly effective in eliminating fluorescence. Thetwo lines of the diode laser at 785 and 830 nm also mark-edly reduce fluorescence in most cases.
Figure 18-7 illustrates an example where theNd- YAG source completely eliminates backgroundtluorescence. The upper curve was obtained with con-ventional Raman equipment using the 5I4.5-nm linefrom an argon-ion laser for excitation. The sample wasanthracene, and most of the recorded signal arises fromthe tluorescence of that compound. The lower curve inblue is for the same sample recorded with a Fouriertransform spectrometer equipped with a Nd- YAG laserthat emitted at 1064 nm. Note the total absence offluorescence background signal.
The excitation wavelength in Raman spectrometrymust be carefully chosen. Not on Iv is photodecompo-sition and fluorescence a problem but colored samples
and some solvents can absorb the incidellt radiation orthe Raman-scattered radiation. Thus, tlrere is a needfor more than one source or for multipl'e wavelengthsources.
188-2 Sample-Illumination System
Sample handling for Raman spectrosc<,pic measure-ments is simpler than for IR spectroscopy becauseglass can be used for windows, lenses, amd other opti-cal components instead of the more fragule and atmos-pherically less stable crystalline halides .. fn addition,the laser source is easilv focused on a small samplearea and the emitted rad'iation efflcientl ~ focused on aslit or entrance aperture of a spectrometer. As a result,very small samples can be investigated. In fact, a com-mon sample holder for nonabsorbing liqruid samples isan ordinary glass-melting-point capillarV"
Gas Samples
Gases arc normally contained in glass ttJbes I-L cm indiameter and about 1 mm thick. Gases cart a.lso besealed in small capillary tubes. For weak scatterers, anexternal multiple-pass setup with mirrors can be used
FIGURE16-7 Spectra of anthracene taken with a conven-tional Raman instrument with an argon-ion laser sourceat 514.5 nm ~4)and with an FT-Raman instrUmentwitha Nd-YAGsource at 1064 nm (8). (From B.::;hase, Ana/.
Chern., 1987,59, 881A. Figure 5, p. 888A. (~opyright1987American Chemical Society.)
MIM\ ,\ ,\ ,~~
\ ,r---'"\'-- I
-----_ ...•.-
FIGURE18-6 Sample illuminationsystems for Raman spectrometry. In (a), a gas cell is shownwith external mirrors for passing the laser beam through the sample multiple times. Liquid cellscan be capillaries (b)or cylindrical cells (c). Solids can be determined as powders packed incapillaries or as KBrpellets (d).
as shown in Figure I8-8a. The resulting Raman scat-tering perpendicular to the sample tube and to the ex-citation laser beam is then focused on the entrance slitof the spectrometer by a large lens (L2 in the tigure).
Liquid Samples
Liquids can be scaled in ampoules, glass tubes, or cap-illaries. Figure IR-8b and c show two of many systemsfor illuminating liquids. In Figure 18-8b a capillary cellis shown. Capillaries can be as small as 0.5-0.1 mmbore and 1 mm long. The spectra of nanoliter volumesof sample can be obtained with capillary cells. A largecylindrical cell, such as that illustrated in Figure I8-8c.can be used to reduce local heating, particularly for ab-sorbing samples. The laser beam is focused to an areanear the wall to minimize absorption of the incident
beam. Further reduction of localized heating is oftenachieved by rotating the cell.
A major advantage of sample handling in Ramanspectroscopy compared with IR arises because water isa weak Raman scatterer but a strong absorber of IRradiation. Thus, aqueous solutions can be studied byRaman spectroscopy but only with difficulty by 1R.This advantage is particularly important for biologicaland inorganic systems and in studies dealing with wa-ter pollution.
Solid Samples
Raman spectra of solid samples are often acquired bvfilling a small cavitv or capillary with the sample afterit has been ground to a tine powder. Polvmers can usu-ally be examined directly with no sample pretreatment.

Input fibers
(b) Collectionfibers objective
To monochromatorslit
(el
FIGURE 18-9 Raman spectrometer with fiber-opticprobe. In (a) a microscope objective focuses the laserradiation onto excitation fibers that transport the beam tothe sample. The Raman scattering is collected by emis-sion fibers and carried to the entrance slit of a monochro-mator or to the entrance of an interferometer. A radiationtransducer, such as a photomultiplier tube, converts thescattered light intensity to a proportional current or pulserate; (b) end view of the probe; (c) end view of collectionfibers at entrance slit of monochromator. The coloredcircles represent the input fiber and the uncolored circlesthe collection fibers. (Adapted from R. L. McCreery,M. Fleischmann, and P. Hendra, Anal. Chern., 1983,55,146. Figure 1, p. 147. Copyright 1983 American ChemicalSociety.)
In some cases, KBr pellets similar to those used in IRspectroscopy are employed as shown in Figure 18-8d.Dilution with KBr can reduce decomposition of thesample produced by local heating.
Fiber-Optic Sampling
One of the significant advantages of Raman spectrom-etry is that it is based on visible or near-IR radiationthat can be transmitted for a considerable distance (asmuch as 100 m or more) through optical fibers. Fig-ure 18-9 shows the arrangement of a typical Raman in-strument that uses a fiber-optic probe. Here, a micro-scope objective lens is used to focus the laser excitationbeam on one end of an excitation fiber of a fiber bun-dle. These fibers bring the excitation radiation to thesample. Fibers can be immersed in liquid samples orused to illuminate solids. A second fiber or fiber bun-dle collects the Raman scattering and transports it to
the entrance slit of the spectrometer. Several commer-cial instruments are now available with such probes.
The Raman spectrum shown in Figure 18-10 illus-trates how a fiber-optic probe can be used to monitorchemical processes. In this case a fiber-optic probe wasused to monitor the hanging drop crystallization ofaprotinin (a serine protease inhibitor) and (NH,),SO,in aqueous solution. Raman bands were attributedto both the protein and the salt. By using chemomet-ric techniques, changes in the spectrum during crystal-lization were correlated with depletion of both theprotein and the salt. The authors were able to deter-mine accurately supersaturation of aprotinin using thistechnique.
Fiber-optic probes are proving very useful for ob-taining Raman spectra in locations remote from thesample site. Examples include hostile environments,such as hazardous reactors or molten salts; biologicalsamples, such as tissues and arterial walls; and envi-ronmental samples, such as groundwater and seawater.
Raman Microprobe
A popular accessory for Raman spectrometers is theRaman microprobe. The first developments in Ramanmicroscopy occurred in the 1970s. Today, several in-strument companies make microprobe attachments.With these, the sample is placed on the stage of a mi-croscope where it is illuminated by visible light. Afterselecting the area to be viewed and adjusting the fo-cus, the illumination lamp is turned off and the excitinglaser beam is directed to the sample. With modern op-tics, the Raman microprobe can obtain high-qualityRaman spectra without sample preparation on pico-gram amounts of sample with I-flm spatial resolution.
1.0E + 08
.~ 8,OE + 07
".§ 6,OE T 07
.~ 4,OE + 07
~ 2.0E + 07
3100 2700 2100 1700 t200 700 200
Raman shift, cm-I
FIGURE 18-10 Raman spectrum of an aqueous solutioncontaining aprotinin (100 mg/mL) and (NH,),SO, (1.0 M)in50 mM sodium acetate buffer at pH 4.5 and 24°C. Adiodelaser source at 785 nm was used with a CCD detector.(From R. E. Tamagawa, E. A. Miranda, and K. A. Berglund,Cryst. Growth Des., 2002, 2, 511. Figure 1, p. 512.Copyright 2002 American Chemical Society.)
Excitation
fiber BP
~------..... ~--If---1\--'----rI DIode
Sample i"'\ ~ la~erprobe
BRSample
186-3 Raman Spectrometers
Until the early 1980s, Raman spectrometers were sim-ilar in design and used the same type of componentsas the classical UV -visible dispersing instruments de-scribed in Section 130-3. Most spectrometers em-ployed double-grating systems to minimize the amountof stray and Rayleigh-scattered radiation reachingthe transducer. Photomultipliers served as transduc-ers. Now, however, most Raman spectrometers beingmarketed are either Fourier transform instrumentsequipped with cooled germanium transducers or multi-channel instruments based on charge-coupled devices.
Wavelength-Selection Devices and Transducers
A high-quality wavelength-selection device is requiredin Raman spectroscopy to separate the relatively weakRaman lines from the intense Rayleigh-scattered ra-diation. Traditional dispersive Raman spectrometersused double- or even triple-grating monochromatorsfor this purpose. In recent years, holographic interfer-ence filters, called notch filters, and holographic grat-ings have improved to the extent that they have virtuallyeliminated the need for multiple-grating monochroma-tors. In fact, the combination of a notch filter and a high-quality grating monochromator is now found in mostcommercial dispersive instruments.
Instruments with monochromators invariably usephotomultiplier tubes as transducers because of theweak signals being measured. Most spectrometers alsoemploy photon-counting systems to measure the Ra-man intensity. Because photon counting is inherently a
Tu.torial: Learn more about Ramaninstrumentation.
FIGURE 18-11 Fiber-optic Raman spectrometerwith spectrograph and CCD detector. The bandpassfilter (BP)is used to isolate a single laser line.Theband-rejection filter(BR)minimizes the Rayleigh-scattered radiation.
digital technique, such systems are readily interfacedto modern computer data systems.
Many newer Raman instruments have replaced thesingle-wavelength output monochromator with a spec-trograph and an array detector. The photodiode arraywas the first array detector to be used. It allows the si-multaneous collection of entire Raman spectra. Pho-todiode arrays are typically used in conjunction withan image intensifier to amplify the weak Raman signal.
More recently, charge-transfer devices, such ascharge-coupled devices (CCOs) and charge-injectiondevices (CIOs), have been employed in Raman spec-trometers. Figure 18-11 shows a fiber-optic Ramanspectrometer that uses a CCO as a multichannel detec-tor. Here, high-quality bandpass and band-rejection(notch) filters provide good stray light rejection. TheCCO array can be a two-dimensional array or in somecases a linear array.
Fourier Transform Raman Spectrometers
The Fourier transform Raman (FT-Raman) instru-ment uses a Michelson interferometer, similar to thatused in FTIR spectrometers, and a continuous-wave(CW) Nd- YAG laser as shown in Figure 18-12. The useof a 1064-nm (1.064-l-Im) source virtually eliminatesfluorescence and photodecomposition of samples.Hence, dyes and other fluorescing compounds canbe investigated with FT-Raman instruments. The FT-Raman instrument also provides superior frequencyprecision relative to conventional instruments, whichenable spectral subtractions and high-resolution mea·surements.
One disadvantage of the FT-Raman spectrometeris that water absorbs in the 1000-nm region, which cancancel the Raman advantage of being ahle !O use aque-

r_!,~~:I:o~~n~e~.:r~~~~__I II Fixed I
: mirror :I ~I
Liquid N, cooled: Beamsplitter :
Ge dekct()[ : M~ving rI I
I mirror 1I•1 _
FIGURE 18-12 Optical diagram of anFT-Raman instrument. The laser radiationpasses through the sample and then intothe interferometer, consisting of the beam-splitter and the fixed and movable mirrors.The output of the interferometer is thenextensively fittered to remove stray laserradiation and Rayleigh scattering. Afterpassing through the filters, the radiationis focused onto a cooled Ge detector.
ous solutions. Also, optical filtering, as shown in Fig-ure 18-12, is a necessity. The stray light from the excit-ing laser must he eliminated because it can saturatemany transducers. The Rayleigh-scattered line is oftensix orders of magnitude greater than the Stokes-shiftedRaman lines, and the intensity of this line must be min-imized before striking the transducer. Holographicnotch filters and other filter types are used for this pur-pose. Because the Raman scattering from a Nd-YAGlaser can occur at wavelengths as long as 1700 nm, pho-tomultipliers and many array detectors are not uscd.Most FT-Raman instruments instead use InGaAsGe, and other photoconductive devices as transducer~:These devices are usually operated at cryogenictemperatures.
The FT-Raman spectromcter has a number ofunique advantages for Raman spectrometry. However,the limitations previously noted mean that dispersiveRaman instruments will be widely used for somc time.
18C APPLICATIONS OF RAMANSPECTROSCOPY
Raman spectroscopy has been applied to thc qualita-t.ve and quantitative analysis of inorganic, organic, andhiological systems"
Nd-YAGlaser withline filter
18C-1 Raman Spectra of Inorganic Species
The Raman technique is often supcrior t,: 'IR spec-troscopy for Investigating inorganic systenis-becauseaqueous solutions can usually be employed.s In addi-tion, the vibrational energies of metal-ligand bonds aregenerally in the range of 100 to 700cm -I, a region of theIR that is experimentally difficult to study. These vihra-tions are frequently Raman active, how~ver, and lineswith dV values in this range are readily ohserved.Raman studies are potentially useful sources of infor-mation concerning the composition, structure, and sta-bility of coordination compounds. For example, nu-merous halogen and halogenoid complexes produceRaman spectra and thus are amenable to investigationby this means. Metal-oxygen bonds are also Ramanactive. Sfectra for such species as VO"-, Al(OH), ,St(OH)6--' and Sn(OH)l- have heen obtained. Ramanstudies have heen useful in determining the probahlestructures of these and similar species. For example.'n perchlonc ac.d solutions, vanadium(lV) appears tohe present as VO'-(aq) rather than as V(OH),"(aq).Studies of boric acid solutions show that the anionformed by acid dissociation is the tetrahedral B(OH),rather than f[,BOJ -. Dissociation constants for strongac.ds such as H2SO" HNO" H,SeO,. and HJOh havebeen calculated from Raman measurements. It seemsprohahle that the future will see even wider use of
Raman spectroscopy for theoretical verification andstructural studies of inorganic systems.
Raman spectra are similar to IR spectra in that theyhave regions useful for functional group detection andfingerprint regions that permit the identification ofspecific compounds. Daimay et al. have published acomprehensive treatment of Raman functional groupfrequencies·
Raman spectra yield more information about cer-tain types of organic compounds than do their IR coun-terparts. For example, the double-bond stretchingvibration for olefins results in weak and sometimesundetected IR absorption. On the other hand, theRaman band (which like the IR band, occurs at ahout1600 cm -I) is intense, and its position is sensitive tothe nature of substituents as well as to their geometry.Thus, Raman studies are likely to yield uscful informa-tion about the olefinic functional group that may notbe revealed by IR spectra. This statement applies tocycloparaffin derivatives as well; these compounds havea characteristic Raman hand in the region of 700 to1200 em -I. This band has been attrihuted to a breathingvibration in which the nuclei move in and out symmet-rically with respcct to the center of the ring. The posi-tion of the band decreases continuously from 1190cm-'for cyclopropane to 700 cm-I for cyclooctane; Ramanspectroscopy thus appears to be an excellent diagnos-tic tool for the estimation of ring size in paraffins.The IR hand associated with this vibration is weak ornonexistent.
18C-3 Biological Applicationsof Raman Spectroscopy
Raman spectroscopy has heen applied widely for thestudy of biological systems.' The advantages of thistechnique include the small sample requirement, theminimal sensitivity to water, the spectral detail, and theconformational and environmental sensitivity.
"L Daimay. N. B. Coilhup. w, G. Fatdy. and 1. G. Grasselli, The [{um/·
nook of infrared and Ranum ChanJClcrisfic Fn:quencies of Organic Mole-
cules. N~y, "ork: Acad.:mic Press, lY9L-See 1. R. F~rrar(). K. Nakamol\..l, and C \\'. Brown. IlIlroducron" Rl1l1UlII
~·pecrro_\o)py. 2n\..1ed .. San Oieg\): Acadt:rll\c Press, 2003. Chap_ 6: Infrared
and Raman Spectroscopy o{ Biological l{araials. H. U. Gremlich and H'{an. eds .. New York: ~1arcd Dekker, 2001: Biological Applications of Ra·man Spt'oroscopv. T G. Spiro. ",d.. \'ols. 1-3. New )'\Jfk: Wiley. 1987-88
Raman spectra tend to he less cluttered with bands thanIR spectra. As a consequence, peak overlap in mixturesis less likely, and quantitative measurements are sim-pler. In addition, Raman sampling devices are not suh-ject to attack hy moisture, and small amounts of waterin a sample do not interfere. Despite these advantages,Raman spectroscopy has only recently heen exploitedwidely for quantitative analysis. The increasing use ofRaman spectroscopy is due to the availability of inex-pensive, routine Raman instrumentation.
Because laser beams can be precisely focused, it be-comes possihle to perform quantitative analyses onvery small samples. The Raman microprobe has heenused to determine analytes in single bacterial cells,components in individual particles of smoke and flyash, and species in microscopic inclusions in minerals.Surfaces have been examined by tuning the instrumentto a given vihrational mode. This results in an image ofregions on a surface where a particular bond or func-tional group is present.
The Raman microprobe has played a critical role inthe authentication of some presumed ancient docu-ments such as the Vinland map (see the InstrumentalAnalysis in Action feature at the end of Section 3). Inthe case of the map, the presence of TiO, in the ink wasshown conclusively by Raman microscopy.
180 OTHER TYPES OF RAMANSPECTROSCOPY
Advancements in tunable lasers led to several new Ra-man spectroscopic methods in the early 1970s. A briefdiscussion of the applications of some of these tech-niques follows.
Resonance Raman scattering refers to a phenomenonin which Raman line intensities are greatly enhancedby excitation with wavelengths that closely approachthat of an electronic absorption hand of an analyteS
Under this circumstance. the magnitudes of Raman
~For brief reviews. see 1". G. SpIro and R. S. CzernusLcwicz in Physical
\1ethods ill Bioinorganic Chi'misrr),- I.. Que. ed . Sausalito, CA: L'nlversityScience Books, 2000~S. A. Asher. A/wI. Chon, 1993. 05, 59A

lines associated with the most symmetric vibrationsare enhanced by a factor of 10' to 106 As a COnse-quence, resonance Raman spectra have been obtainedat analyte concentrations as low as 10-8 M. This levelof sensitivity is in contrast to normal Raman studies,which arc ordinarily limited to concentrations greaterthan 0.1 M. Furthermore, because resonance enhance-ment is restricted to the Raman bands associated withthe ehromophore, resonance Raman spectra are usu-ally quite selective.
Figure 18-13a illustrates the energy changes respon-sible for resonance Raman scattering. This figure dif-fers from the energy diagram for normal Raman scat-tering (Figure 18-3) in that the electron is promotedinto an excited electronic state followed bv an immedi-ate relaxation to a vibrational level of the electronicground state. As shown in the figure, resonance Ramanscattering differs from fluorescence (Figure 18-13b) inthat relaxation to the ground state is not preceded byprior relaxation to the lowest vibrational level of the ex-cited electronic state. The time scales for the two phe-nomena are also quite different, with Raman relaxationoccurring in less than 10-1' s compared with the 10-6 to10-10
S for fluorescence emission.Line intensities in a resonance Raman experiment
increase rapidly as the excitation wavelength ap-proaches the wavelength of the electronic absorptionband. Thus, to achieve the greatest signal enhancementfor a broad range of absorption maxima, a tunable laseris required, With intense laser radiation, sample de-composition can become a major problem becauseelectronic absorption bands often occur in the ultravio-let region. To circumvent this problem, it is commonpractice to circulate the sample past the focused beamof the laser. Circulation is normally accomplished inone of two ways: by pumping a solution or liquidthrough a capillary mounted in the sample position orby rotating a cylindrical cell containing the samplethrough the laser beam. Thus, only a small fraction ofthe sample is irradiated at any instant. and heating andsample decomposition are minimized.
Perhaps the most important application of reso-nance Raman spectroscopy has been to the study ofbiological molecules under physiologically significantconditions; that is, in the presence of water and at lowto moderate concentration levels. As an example, thetechnique has been used to determine the oxidationstate and spin of iron atoms in hemoglobin and cyto-chrome c. In these molecules, the resonance Ramanbands are due solely to vibrational modes of the tetra-
180-2 Surface-EnhancedRaman Spectroscopy
Surface-enhanced Raman spectroscopy (SERS) to in-volves obtaining Raman spectra in the usual way onsamples that are adsorbed on the surface of colloidalmetal particles (usually silver, gold, or copper) or onroughened surfaces of pieces of these metals. For rea-sons that are finally becoming understood, at leastsemiquantitatively, the Raman lines of the adsorbedmolecule are often enhanced by a factor of 10' to 106
When surface enhancement is combined with the res-onance enhancement technique discussed in the previ-ous section, the net increase in signal intensity isroughly the product of the intensity produced by eachof the techniques. Consequently, detection limits in therange of 10-9 to 10 12 M have been observed.
Several sample-handling techniques are employedfor SERS. In one technique, colloidal silver or gold par-ticles arc suspended in a dilute solution (usually aque-ous) of the sample. The solution is then held or flowedthrough a narrow glass tube while it is excited by a laserbeam. In another method, a thin film of colloidal metalparticles is deposited on a glass slide and a drop or twoof the sample solution spotted on the film. The Ramanspectrum is then obtained in the usual manner. Alter-natively, the sample may be deposited electrolyticallyon a roughened metal electrode, which is then removedfrom the solution and exposed to the laser excitationsource.
FIGURE 18-13 Energy diagram for (a) resonance Ramanscattering and (b)fluorescence emission. Radiationlessrelaxation is shown as wavy arrows. In the resonanceRaman case, the excited electron immediately rela'lesinto a vibrational level of the ground electronic state •giving up a Stokes photon V,. In fluorescence, relaxationto the lowest vibrational level of the excited electronicstate occurs prior to emission. Resonance Raman scat-tering is nearly instantaneous, and the spectral bands arevery narrow. Fluorescence emission usually takes placeon the nanosecond time scale. Fluorescence spectraare usually broad because of the many vibrationalstates.
pyrrole chromophore. None of the other bands associ-ated with the protein is enhanced, and at the concentra-tions normally used these bands do not interfere as aconsequence.
Time-resolved resonance Raman spectrometrv is atechnique that allows collection of Raman spect'ra ofexcited state molecules. It has been used to study in-termediates in cnzyme reactions, the spectra of carot-enoid excited states, ultrafast electron transfer steps,and a variety of other biological and bioinorganic pro-cesses.' Time-discrimination methods have been usedto overcome a major limitation of resonance Ramanspectroscopy. namely, fluorescence interference eitherby the analyte itself or bv other species present in thesample.
180-3 Nonlinear Raman Spectroscopy
In Section 7B-3. we pointed out that many lasers areintense enough to produce significant amounts of non-linear radiation. Throughout the 1970s and 1980s.many Raman techniques were developed that dependon polarization induced by second-order and higherfield strengths. These techniques are termed nonlinearRaman methods." Included in these methods are stim-ulated Raman scattering, rhe hyper-Raman effect, stim-ulated Raman gain, inverse Raman spectroscopy, co-herent anri-Stokes Raman spectroscopy, and coherentStokes Raman spectroscopy. The most widely used ofthese methods is coherent anti-Stokes Raman spec-troscopy, or CARS.
Nonlinear techniques have been used to overcomesome of the drawbacks of conventional Raman spec-troscopy, particularly its low efficiency, its limitation tothe visible and near-ultraviolet regions, and its suscep-tibility to interference from fluorescence. A major dis-aovantage of nonlinear methods is that they tend to beanalyte specific and often require several different tun-able lasers to be applicable to diverse species. To date,none of the nonlinear methods has found widespreadapplication among nonspecialists. However. manv ofthese methods have shown considerable promise: Asless expensive and more routinely useful lasers be-come available. nonlinear Raman methods, particu-larly CARS, should become more widely used.
*Answers are provided at the end of the book for problems marked with an asterisk.
~ Problems with this icon are best solved using spreadsheets.
18-1 What is a virtual state')
18-2 Why docs the ratio of anti-Stokes to Stokes intensities increase with sarilpletemperature?
*18-3 At what wavelengths in nanometers would the Stokes and anti-Stokes Ramanlincs for carbon tetrachloride (el" = 218,314,459.762, and 790 cm-I) appear ifthe source were(a) a helium-neon laser (632.8 nmjO(b) an argon-ion laser (488,0 nm)"
*18-4 Assume the excitation sources in Problem 18-3 have the same power. (a) Com-pare the relative intensities of the CCI, Raman lines when each of the two