Embed Size (px)
Citation preview
Is
an(
1- r
and externa I users.
2. ldentify the major threats in gener;
ers need'to'i:ffectivell
INTEGRATIVE CASE ALPHA OMEGA ELECTRONICS
Linda Spurgeon, president and CEO of Alpha Omega Electronics (AOE), is not satis-
fied with the reporting capabilities of AOE's new enterprise resource planning (ERP)
system. Although the monthly closing process now takes less than two days, the system
only provides management with timely information about the firm's financial perform-
ance. Linda wants a report that integrates flnancial information with operational meas-
ures about how the firm is doing. She is also concerned about how to prepare AOE.to
transition from U.S. Generally Accepted Accounting Principles (GAAP) :to
International Financial Reporting Standards (IFRS) and about satisfying the SEC's
new requirements to begin submitting financial information using XBRL.
Linda calls a meeting with Stephanie Cromwell, AOE\ chief linancial officer,
Elizabeth Venko, AOE's controller, and Ann Brandt, AOEh vice president of information

systems, to discuss these issues' Stephanie mentions that she has been reading about
somethingcalledabalancedscorecardthatmightprovidethekindofmultidimensionalrepoii.Iinda desires. Ann and Elizabeth agree to research the balanced scorecard and
j.pvestigate how AOE's new ERP system could be conligured to produce one' Stephanie
asks'them to also look at how AoE could make better use ofthe reporting and graphing
capabilities ofits new ERP system. In addition, they will report back on what needs to be
done to prepare for IFRS and to use XBRL. As you read this chapter, think about how
both technological and regulatory changes affect the design and operation ofan organiza-
tion\ general ledger and reporting systems.
\
lntroduction
This chapter discusses the information processing operations involved in updating the general
ledger an,J preparing reports that summarize the results of an organization's activities As shown
in ilgot" iO-i, the-generut ledger and repo ing system plays a central role in a company's
accou-nting information system. Its primary function is to collect and organize data from the
following sources:
a Each ofthe accounting cycle subsystems described in Chapters 12 through l5 provides
infdrmation about rcgular transactions. (Only the principal data flows from each subsystem
are depicted, to keep the figure uncluttercd.)o The treasurer provicles information about financing and investing activities' such as the
issuance or retirement of debt and equity instruments and the purchase or sale of invest-
ment secudties.a The budget department provides budget numbers.
a The contoller provides adjusting entries.
Figure 16-2 shows the basic aotivities performed in the general ledger and reporting cycle'
The hrit three activities represent the basic steps in the cccounting cycle, which culminate in the
production of the traditional set of financial statemenrs. The fourth activity indicates that' in
uddition to financial reports for extemal use6, an organization's accounting system produces a
vadety of rcports for internal management.
W" U"gin by ilescribing the design of a typical general ledger and reporting system and
discuss the basic controls necessary to ensure that it provides management and vadous exter-
nal stakeholders with reliable information. We then discuss in detail each of the basic general
ledger and reporting cycle activities depicted in Figure 16-2 For each activity' we describe483

4U PART lll . ACCOUNTING INFORMATION SYSTEMS AppLtCATtONS
FIGURE 16-1Context Diagram o,the General Ledoer;eneral Ledger
and ReCorting9ystem
how the information needed to perform and manage the actiyity is collected, processed, andstored. We also explain the controls necessary to ensure not only the reliability ofthat informa-tion but also the safeguarding of the organization's resources. In addition, we discuss theimpact of regulatory and technological changes, such as the proposed switch-from GAAp toIFRS and tbe SEC'S mandate to use XBRL for electronic filing, on the design and operation ofthe general ledger and reporting system. We also explore how rools such as responsibilityaccounting, balanced scorecards, and well-designed graphs can improve the quality of infor-mation provided to managers.
FIGURE 'I6.2Level 0 Data Flow
Diagram of theGeneral Ledger
and Reporting Cycle
Cost of goods monuhctured
Woge ond solory expense
Joumol
Ledger and Reporting System
CHAPTER 16 . GENERAL LEDGER AND REPORTING SYSTEM
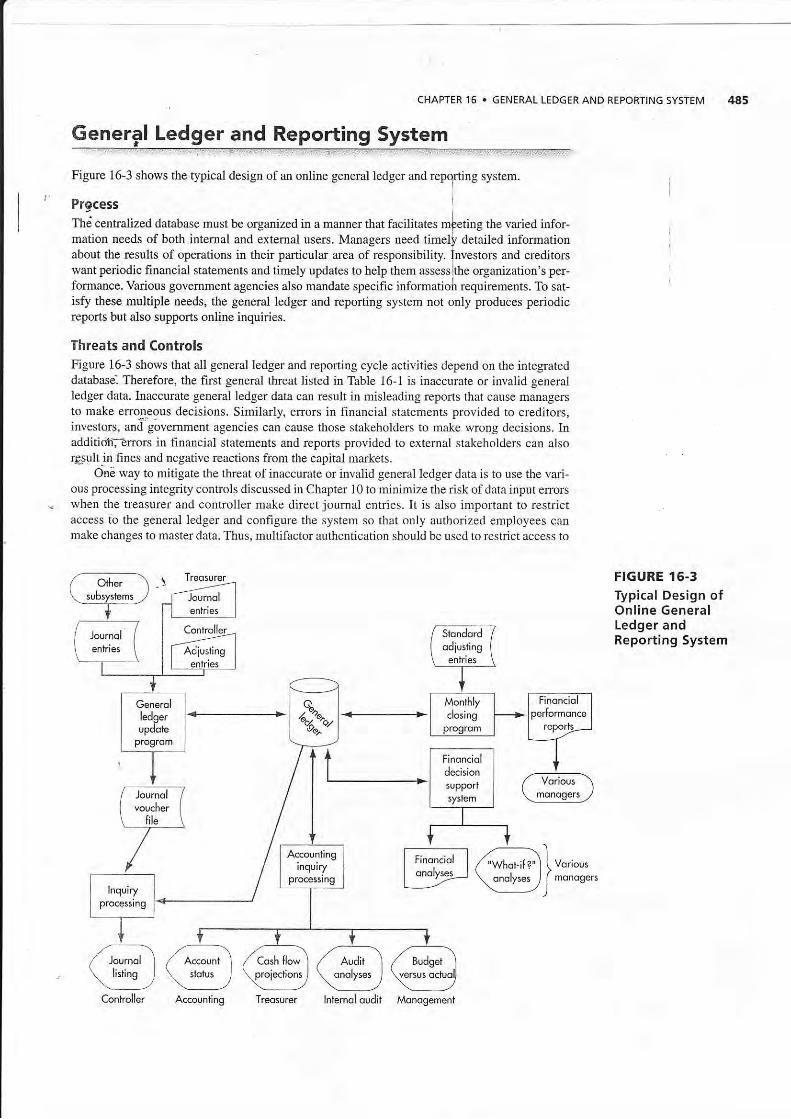
Figure l6-3 shows the typical design of an online general ledger and repgning system.
Prgcess
Thi centralized database must be organized in a manner thar facilirates mteting the varied infor-mation needs of both internal and external users. Managers need timeli, detailed infomationabout the results of operations in their particular area of responsibility. lnvestors and creditorswant periodic financial statements ard timely updates to help them assesslthe organization's per-formance. Various goyemment agencies also mandate specific informatiolr requirements. To sat-isfy these multiple needs, the general ledger and reporting system not only produces periodicrepons but also supporls onljne inqui-ries.
Threats and ControlsFigure 16-3 shows that all general ledger and reporting cycle activities depend on the integrateddatabase'. Therefore, the f,rrst general threat listed in Table 16-1 is inaccurate or invalid generalledger data. Inaccurate general ledger data can result in misleading reports that cause manage$to make erroneous decisions. Similarly, errors in financial statemetts provided to creditors,investols, and"g6vernment agencies can cause those stakehotders to make wrong decisions. Inadditidh;?rrom in financial statements and reports provided to extemal stakeholde$ can alsor€sultin fines and negative reactions from the capital markets.
OnE way to mitigate the threat of inaccurate or invalid general ledger data is to use the yari-ous processing integrity controls discussed in Chapter 10 to minimize the risk of data input errorswhen the keasurer and controller make direct joumal entries. It is also important to restrictaccess to the general ledger and configure the system so that only authodzed employees canmake changes to master data. Thus, multifactor authentication should be used to restrict access to
FIGURE 16-3Typical Design ofOnline GeneralLedger andReporting System
lnlernoloudit MonogementController Accounting Treosurer

485 PART lll . ACCOU NTING INFORMATION SYSTEMS APPLICATIONS
the general ledger. In addition, authorization contols (an access control matrix and compatibil-
ity tests) should. also be used to limit the functions that each legitimate user may perform. For
example, most managers should be given read-only access to the general ledger, as depicted at
the bottom of Figure 16-3. Otherwise, an unscrupulous managel can conceal theft of assets or
poor performance by altering the information in the general ledgbr In addition, the access con-
trol matrix should also be designed to limit the functions that can be performed at valious termi-
nals. Adjusting entries, for example, should be allowed only frofn terminals in the controller's
office. However, because such preventive controls car never be 1007o effective, Table 16-1 also
indicates that an important detective contlol is to regularly produ$e a report of all changes to the
general ledger and review them to verify that the database remai4s accurate.
A second general threat in the geneml ledger and reponing cycle is unauthorized disclosure
of financial information. In particular, it is important not to prematurcly release financial state-
ments; doing so is likely to result in fmes from various regulatory agencies and possible share-
holder lawsuits. The best control procedure for reducing the risk of unauthorized disclosure of
financial statements is to use multifactor authentication and physical seculity contlols to rcstrict
access to the general ledger to only those employees who need such access to Perform fheirjobs.Encrypting the database provides additional protection by making the information unintelligible
to anyone who succeeds in obtaining unauthorized access to the database. Encryption also pre-
vents IT employees who do not haYe access to the ERP system from using operating system utilities to view s€nsitive information. In addition, general ledger data should be encrypted when it is
being transmitted over the Intemet to other corporate ofhces, analysts, or govemment agencies.
A third general threat in the general ledger and reporting cycle concems the loss or destruc-
tion of master data. The best way to mitigate the risk of this tkeat is to employ the backup and
disaster recovery procedures that were discussed in Chapter 10.
TABLE 16-1 Threats and Controls in the General Ledger and Reporting System
General issues
throughout entircgeneral ledgerand reportingcycle
Update general
ledger
Threat
l. Inaccurate or invalid general ledger data
2. Unauthodzed disclosure of financialstatement
3. Loss or destruction of data
4. Inaccurate updating of general ledger
5. Unauthorized joumal entries
Controls (first number refers to the
1.1 Data processing integrity controls
1.2 Restriction of access to genelal ledger
1.3 Review of all changes to general ledger data
2.1 Access conrols2.2 Encryption3.1 Backup and disaster recovery procedures
4.I Data entry processing integdty controls4.2 Reconciliations and control reports
4.3 Audit trail creation and review
5.1 Access controls5.2 Reconciliations ard control reports
5.3 Audit trail creation and review
6.I Data entry processing integdty controls
6.2 Spreadsheet error protection controls
6.3 Standard adjusting entries
6.4 Reconciliations and control rePorts
6.5 Audit trail crcation and review7.1 Access controls7.2 Reconciliations and control reports
7.3 Audit trail creation and review
Processing integdty controlsUse of packaged software
Training and experience in applying IFRS and XBRLAuditsAr.rdits
Responsibility accountingBalanced scorccard
Training on proper grapb design
Post adjustingentries
Prepare flnancialstatements
6. Inaccurate adjusting entries
7. Unauthodzed adjusting entdes
8. Tnaccurate financial statements
9. Fraudulent financial rcporting
10. Poorly designed reports and graphsProducemanagerial
repofts
8.1
8.2
8.49.1
10.1
r0.210.3
CHAPTER 15 . G EN ERAL LEDG ER AN D REPORTING SYSTEM
Update General Ledgerr.:.::r,:i:;in.,;it:i:.':;:i:'-:::-ri;:..r'n:!-!::rrr.',.:-:r::rir!:r:i'i!i_ :: ::': -1 : i ri
As shown in Figure l6-2. tJre firsr aclivity in the general ledger system tcilcle L0) is updating lhegeq:ral ledger. I
Process I
Updating cons]sts of posting journal entries that originate from two sources:
1. Accountihg subsysrems. Each of the accounting subsystems described in Chapters 12
through 13 creates ajournal entry to update the general ledger In theory, the geneml ledgercould be updated for each individual transaction. In practice, however, the various account-ing subsystems usually update the general ledger by means of summaryjournal enfties thatrepresent the results of all transactions that occurred during a given period of time (day,
week, or month). For example, the revenue cycle subsystem would generate a summaryjoumal entry debiting aacounts receivable and cash and crediling sales for all sales made
during the update period. Similarly, the expenditure cycle would generate summary journalentries to record the purchase of supplies and inventodes alld to record cash disbursementsin payment for those purchases.
2. Tr.easurir -
The treasurer's off1ce provides infonnation forjournal entries to update thegeneral ledger for nonroutine tmnsactions such as the issuance or retirement of debt, the
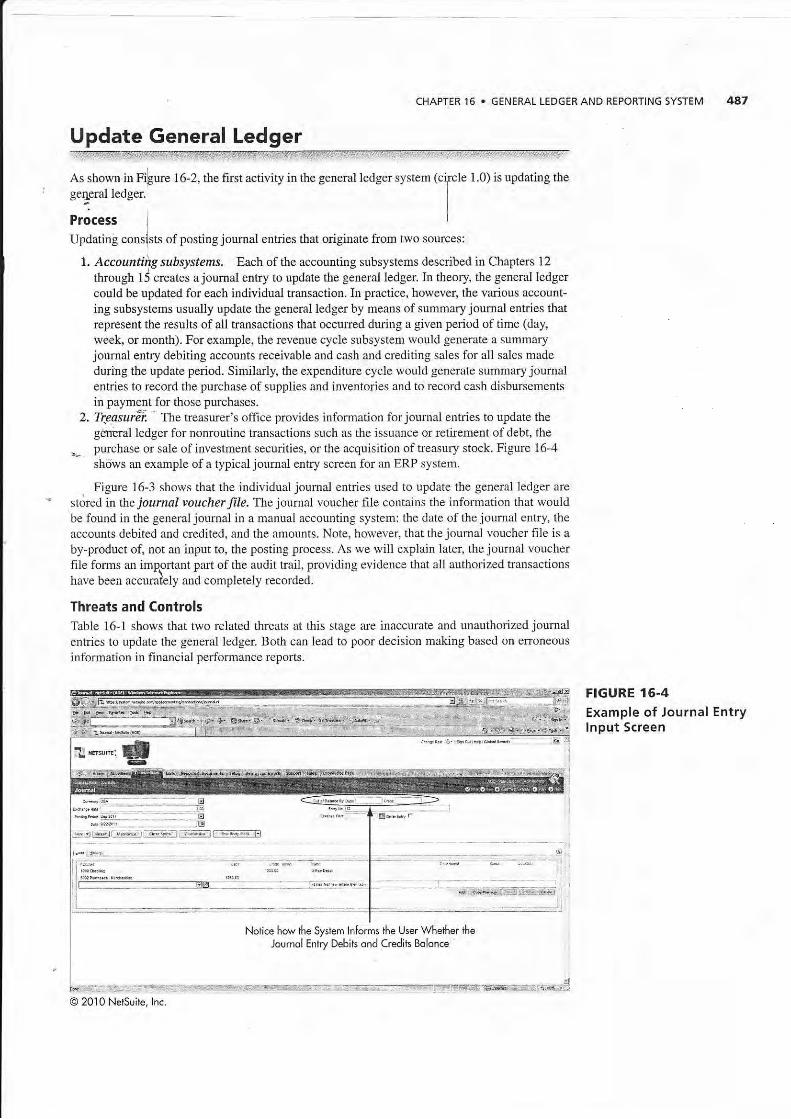
--. pxrchase or sale of investment securities, or the acquisition of treasury stock. Figure 16-4
shdws an example of a typical journal elltIy screen tbr an ERP system.
. Figure 16-3 shows that the individual journal enties used to update the general ledger are
stored in thejournal voucher frle. The journal voucher file contains the information that wouldbe t'ound in the general joumal in a manual accounting system: the date of the journal entry, theaccounts debited and credited, and the amounts. Note, however, that the joumal voucher file is a
by-product of, not an input to, the posting process. As we will explain later the journal voucher
file forms an imqortant part of the audit trail, providing evidence that all arthorized transactions
have been accumtely and completely recorded.
Threats and ControlsTable 16-1 shows that two related threats at this stage ale inaccumte and unauthorized joumalent es to update the general ledger Both can lead to poor decision making based on erroneous
information in financial perfonnance reports.
FIGURE 16-4Example of Journal Entrylnput Screen
€
Noiice how ihe System lnforms the User Wheher iheJournol Entry Debits ond Credits Bolonce
O 2010 Netsu;te, lnc.

4aa PART lll . ACCOUNTING INFORMATION sYSTEMS APPLICATIONS
As Figu.re i6-3 shows, therc arc two sources ofjoumal entries for updating the generalledger: summary joumal entries from the o&er AIS cycles and direct entries made by the treas-urer. The former are themselves the output of a series of processing steps, each of which was sub-ject to { variery ofapptication control procedures designed to ensure accuracy and completeness,as described in the preceding four chapters. Consequently, the Frimary input edit connol forsummar-y journal entries from the otber cycles is configurhg the {ystem to verify that the entdesrepreseht activity for the most recent time period. l
Jor]rnal entries made by the feasurer, however, are original data entry. Consequently, thefollowing types of input edit and processing conlrols are needed to ensure that they are accurateand complete:
7. A yalidity check to ensure that general ledger accounts exist for each account number refer-enced in a joumal entry.
2. Field (format) checlE to ensure that the amount field in the journal entxy contains onlynumeric data.
3. A zero-balance chec,/< to verify that total debits equal total credits in a joumal entryi4. A. cotnpleteness teJ, to ensure that all pertinent data are entered, especially the source of the
joumal entry.5. Closed-loop verification matchirLg account numben with account descriptions, to ensure
that the corect general ledger account is being accessed.
6. A sign check of the general ledger account balance, once updating is completed, to verirythat the balance is of the appropriate nature (debit or credit).
7. Calculating run-to-run totals to veify the accuracy ofjoumal voucher batch processing.(The computer calculates the new balance of the general ledger account, based on itsbeginning balance and the total debits and credits applied to that account, then comparesthat with the actual account balance in the updated general ledger. Any discrepancies indi-cate a processing erlor that must be investigated.)
Shong access contols, including multifactor authentication and compatibitity tests based onaccess conhol matrices, reduce the risk of unauthorized joumal entries. In addition to these pre-ventiye contxols, Table 16-1 lists two types of detective contols that should be used to identifyinaccurate and unauthorized j ournal entries: reconciliations and control reports, and maintenanceof an adequare audit trail.
RECONCILIATIONS AND CONTROL REPORTS Reconciliations and control reports can detectwhether any erors were made during the process of updating the general ledger. One foftn qd
reconciliatior is the preparation of a trial balance. The tial bal.once is a report that lists thebalances for all general ledger accounts (see Figure 16-5). Its name reflects the fact ftat if allactivities have been properly recorded, the total of all debit balances in various accounts shouldequat the total of all credit balances; if not, a posting eror has occurred.
Another important reconciliation is comparing the general ledger control account balances
to the total balance in the corresponding subsidiary ledger. For example, the sum of the balances
of individual customer accounts should equal the amount of the accounts receiyable controlaccount in the general ledger. If these two totals do not agree, the difference must be investigatedand corected. It is also important to examine all transactions occuring near the end of anaccounting period to verify that they are recorded in the proper time period.
At the end of a fiscal period it is also important to verify that any temporary "suspense" or"clearing" accounts have zero balances. Clearing and suspense accounts provide a means toensure that the general ledger is always in balance, To illustrate how these types of specialaccounts are used, assume that one clerk is responsible for recording the release of inyentory tocustomers and that another clerk is responsible for recording the billing of customers. The first
Unbitled shipments xxxInventory
The second clerk would make this entry:
Accounisreceivable x.xxUnbilled shipments x.xx

OncJboth entries have bee,, completed, the special clearing account, unbilled shipments, should
have a zero balance. If not. an error has been made and must be investigated and corrected'' Figure 16-6 is an example of one of the many kinds of control reports that ERP systems
provide to help identify the source of any errors that occu[ed in the general ledger update
process. Listingjournal vouchers by general account number facilitates identifying the cause of
irrors affecting a specific general ledger account. Listing the journal vouchers by numerical
seouence. tlate-.and account number can indicate the absence of any journal entry postings'
These reports oflen include rotals to show whether total debits and credits posted to the general
ledger were equal.
TH;AUD|TTRAIL The A\dit trsil is ataceable path that shows how a tansaction flows through
the information system to affect general ledger account balances. It is an important detective
CHAPTER l6 . GEN ERAL LEDG ER AND REPORTING SYSTEM 489
FIGURE 16-5Example Portion of TrialBalance
FIGURE 16-6Example of ControlReport Providing DetailsAbout changes to a
General Ledger AccountBalance
s-
@ 20 P.iJetSuite, lnc.
O 2010 Neisuite, lnc.
490 PART III . ACCOUNTING INFoRMATIoN sYsTEMS APPLIcATIoNs
contol that provides evidence about the causes of changes in general ledger account balances.A properly designed audit trail provides the ability to perform rhe following rasks:
1. Trace any transaction from its original source document (whether paper or electronic) tothe journal entry that updated the general ledler and to any report or other documenr u$ingthat data. This provides a means to yedfy thal a]l authorized ransactions were recorded.
2' Trace any item appearing in a report back thr]ough the general ledger to jts original sourcedocument (whether paper or electronic). ThiJ provides a means to verifv rhat all recordLdtransactions were indeed authorized and that'tley were recorcJed correcily. i
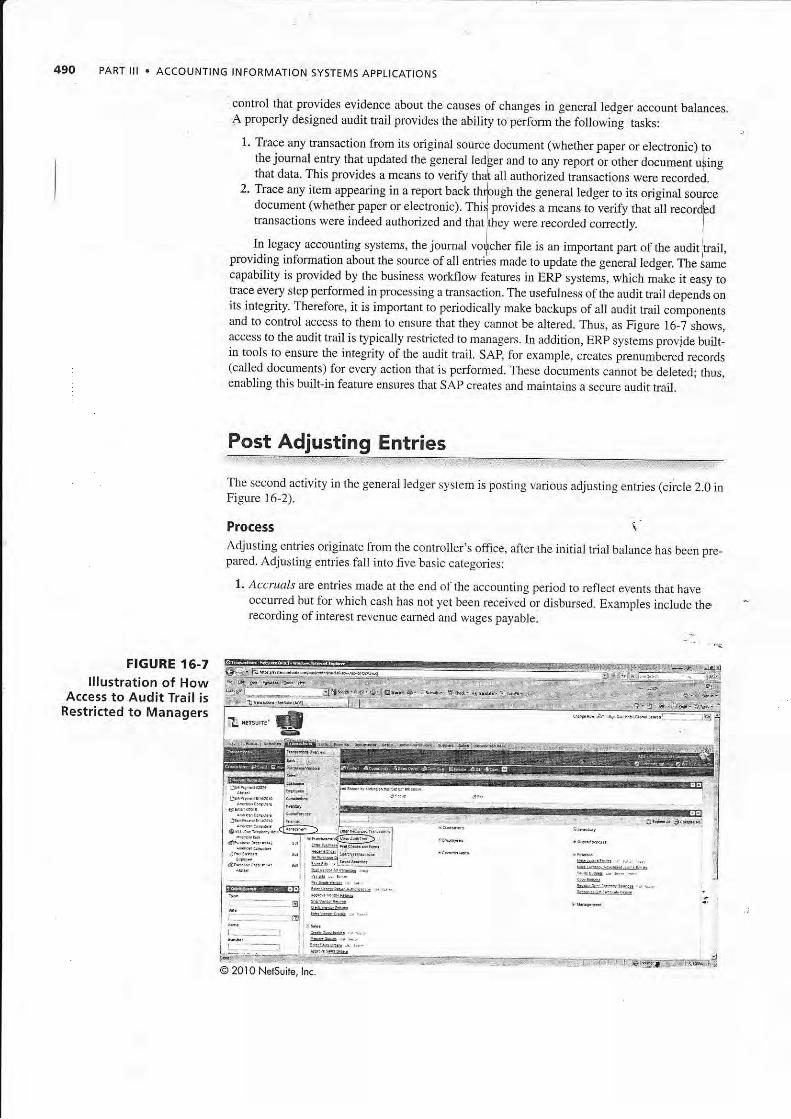
In legacy accounting systems, the journal vo{cher file is an important part of the audir rrail.providing information about the source ofall entriis made to update rhe general ledger. The samecapability is provided by the business workflow features in ERP systems, which make it easy totrace eYery step performed in processing a transaction. The usefulness ofthe audit trail depends onits integrity. Therefore, it is important to periodically make backups of all audit fail componentsand to control access to them to ensure that they cannot be altered. Thus, as Figure 16-7 shows,access to the audit trail is typically restricted to managers. In addition, ERP systems provide built-in tools to ensure the integdty of the audit trail. SAq for example, creates prenumbered records(called documents) for eYery action that is pedormed. These documents cannot be deleted; thus,enabling this built-in feature ensurcs that SAP creates and maintains a securc audit tail,
Post Adjusting Entries
The second activity in the general ledgcr system is posting various adjusting enties (circle 2.0 inFigure 16-2).
Process
FIGURE 16-7lllustration of How
Access to Audit Trail isRestricted to Managers
Adjusting entries originate from the controller,s office, after the initial trial balance has been pre_pared. Adjusting entries fail into five basic categories:
l, Accruals are entries made at the end of the accounting period to rcflect events that haveoccuffed but for which cash has not yet been received or disbursed. Examples include therecording ofinterest revenue eamed and wages payable.
'-
@ 20lO Netsuite, lnc.
rI
i
I, CHAPTER 16 . GENERAL LEDGERAND REPORTtNG SYSTEM
2. Deferrals are entries made at the end of the accounting period to reflect the exchange ofcash prbr to performance of the rcIated event. Examples inciude recognizlng advaice pay_ments from customers as a 1iability and recording certain payments (e.g., rent, interest, andinsurance) as prepaid assets.
3. Estimates arc e\ties tlat leflect a portion of expelses expected to occur oyer a number ofi accounting periods. Examples include depreciatiof and bad_debt expenses,4. Revaluations ne entries made to reflect ei*rer difiefences between the actuar and recorded
value of an asset or a change in accounting principle. Examples include a change in themellod used to value inventory reducing the value of inventory to reflect obsolescence, oradjusting inventory records to reflect the results noted during a physical count of inventory.
5. Corrections are entries made to counteract the effects of e[ors found in the general ledlerAs shown in Figure 16-3, information about these adjusting enhies is also stored in the joumalvoucher file. After all adjusting entries have been posted, an adjusted triat balance is prepared.The adjusted trial balance serves as the input to the next step in the general ledger and financialreporting cycle, the preparation of financial statements.
Threats and ControlsAs Table 16-1 shows, inaccurate and unauthorized adjusting joumar entries are threats that need tobe addresse4because they can produce erroneous financial statements that lead to poor decisions.To redrrce the risk of e[oneous input, the same types of data entry processing integrity conkols dis-cussed-dadier to prevent the threat of erroneous journat entrlesiy the teasurer should also beapplied to adjustingjoumal enrxies made by the controller often, however, adjusting j oumal entiesarc calculated in spreadsheets. Therefore, it is also important to employ the various spreadsheeterror protection contuols discussed in chapter 1 0 to minimize the risk of mistakes. Additional co[-txdl is provided by cteating a standard adjusting enay file for recurring adjustilg entries made eachperiod, such as depreciation expense. A standard adjusting entry frle improves input accuracy byeliminating the need to repeatedry key in the same types ofjoumar entriei. It also reduces the risi<of forgetting to make a rccurdng adjusting entry, thereby ensuring ilput completeness.
Strong access controls reduce the risk of unauthorized adjusting entries. In addition to theprecedrng prevenlive controls. periodic reconciliations and audit trails provide a means to detectunauthorized or inaccurate adjusting entries.
The third activity in the general ledger and reporting system is preparing financial statements(circle 3.0 in Figure 16-2).
ProcessMos! organizations "close the books" to produce financial statements both monthly and annually.A closing joumal entry zeroes out all revenue and expense accounts in the adjusted trial balanceand transfers the net income (or loss) to retained earnings. The income statemelt summarizesperformance for a period of time (usually either a month or a year). The balance sheet presentsinformation about the organization's assets, liabilities, ancl equity at a point in time. The state-ment of cash flows provides information about how the organization,s operating, investing, andfinancing activities affected its cash balance. We now discuss two important recent regulatory andtechnological developments that are likery to signirrcantry affect rhe process ofpreparing financialstatements: tlle proposed upcoming change from U.S. GAAP to IFRS and the mandatory use ofXBRL to submit reports to rhe SEC.
TRANSIT:ON FROM G,AAP TO IFRS In 2010, the SEC reaffrrmed its commiturent to decide in2011 whether it will require American companies to switch ftom u.s.-based Generally AcceptedAccounting Principles (GAAP) to Irtemational Financial Reporting Standards (IFRS) a; thebasis for preparing financial statements. Although the switah to IFRS will not likely occur urtil2015 at the earliest, companies need to begin planning for the transition now because it willlikely require extensive changes to their general ledger and reporting systems.
._
PART lll . ACCOUNTING INFORMATION SYSTEMS APPLICATIONS
IFRS differs from GAAP in several ways that affect the design of a company's general
ledger and reporting systems. One major difference concems accounting for fixed-assets. UnderGAAP, most major fixed assets are recorded and depreciated on a composite basis. For exam- 'ple, the entire cost of a qew corporate headquarters building would be recorded as one asset and
depreciated over its estimated useful life, whichl for buildings, is typically 40 years. Ir contast,IFRS generally requires componentization of flxed assets, to recognize the fact that differentelements (components) may have different econbmic lives. In terms of a corporale headquarters
building, that would mean that the costs of the roof and of the heating and air conditioning sys-
tems would be recorded separately from the building itself, because they are not likely to last40 years. Componentization will require companies to dig through their databases to identifyand disaggregate the costs of many fixed assets. For large companies that may have tens ofthousands of fixed assets, componentization will be a major undertakilg that carries the risk ofclassification and recording errors as they change the structure of their general ledgers.
Another difference involves accounting for research and development (R&D) costs. IFRSpermits capitalization of development costs at an earlier stage of the process tian does GAAP.Consequently, American companies may need to improve the way that they collect and recordR&D related costs so that they can properly decide which costs must be expensed and which can
be capitalized. At a minimum, this process will require creating additional fields in data recordsto capture information about tho stage of the R&D process when costs were incurred. In turn,this will necessitate careful modification and testing of existing programs to ensure that theycofiectly process the redesigned transaction records.
A third difference is that IFRS does not permit use of the last-in fimt-out (LIFO) method ofaccountilg for inventory. Consequently, companies that use LIFO will have to modify their costaccounting systems and the calculations used to value inventory. Those changes will need to becarefully reviewed and tested to minimize the risk of errors.
XBRL: REVOLUTIONIZING IHE RE?ORTING PROCISS XBRa stands for eXtensible BusinessReporting Language; it is a special programming language designed specifrcally to facilitate thecommunication of business information. Beginning in June 2009, the SEC required the500 largest U.S. public companies to use XBRL when submitting thei.r filings. By June 2011 allpublic companies will have to use XBRL.
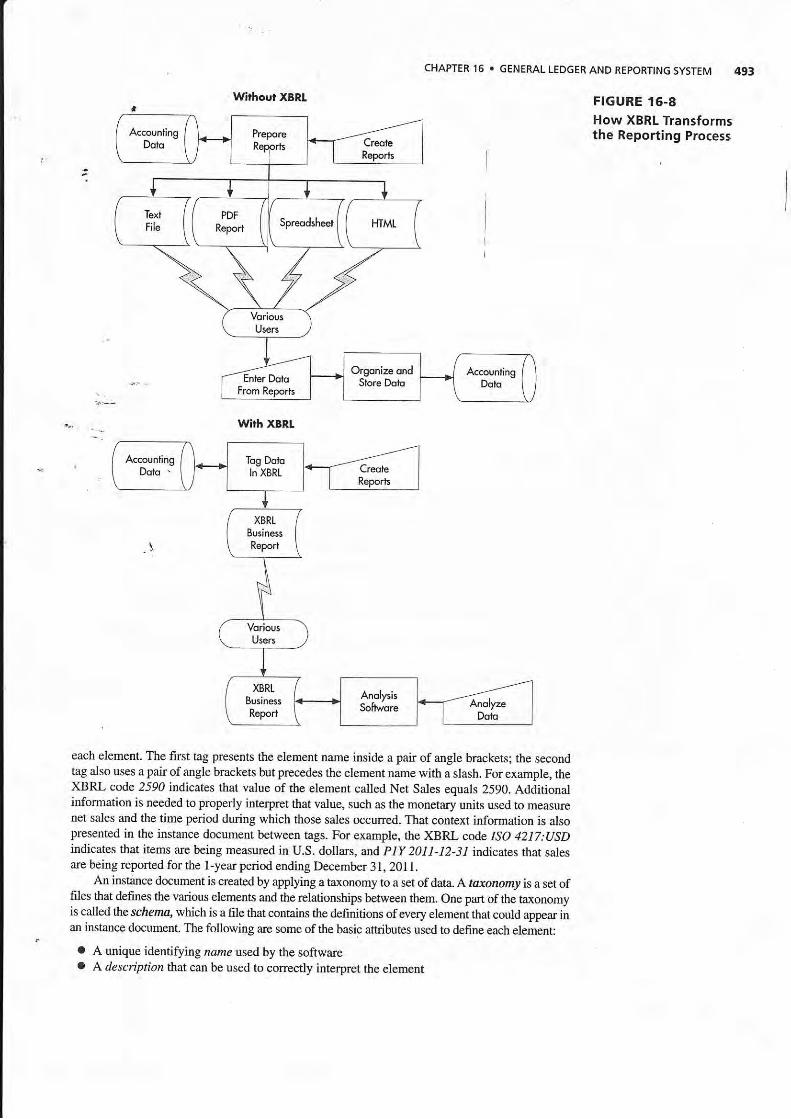
To understald the reyolutionary nature of XBRL, examine Figure 16-8. The top portionshows that prior to XBRL, preparers had to manually create reports in yarious fomats for differ-ent use$. Although thos" ."po.t" *ere th"n sent elecaonically to users, the'recipients then had to -reenter the data into their own systems in order to manipulate it. The entire process was ineffi-cient and prone lo erlor. . -
The bottom portion of Figure 16-8 shows how XBRL improyes the reporting process.Preparers encode the data and transmit it electonically in various fomats to usersi.lfho candirectly analyze it. Thus, XBRL sayes time and reduces the chances for data entry"errors.
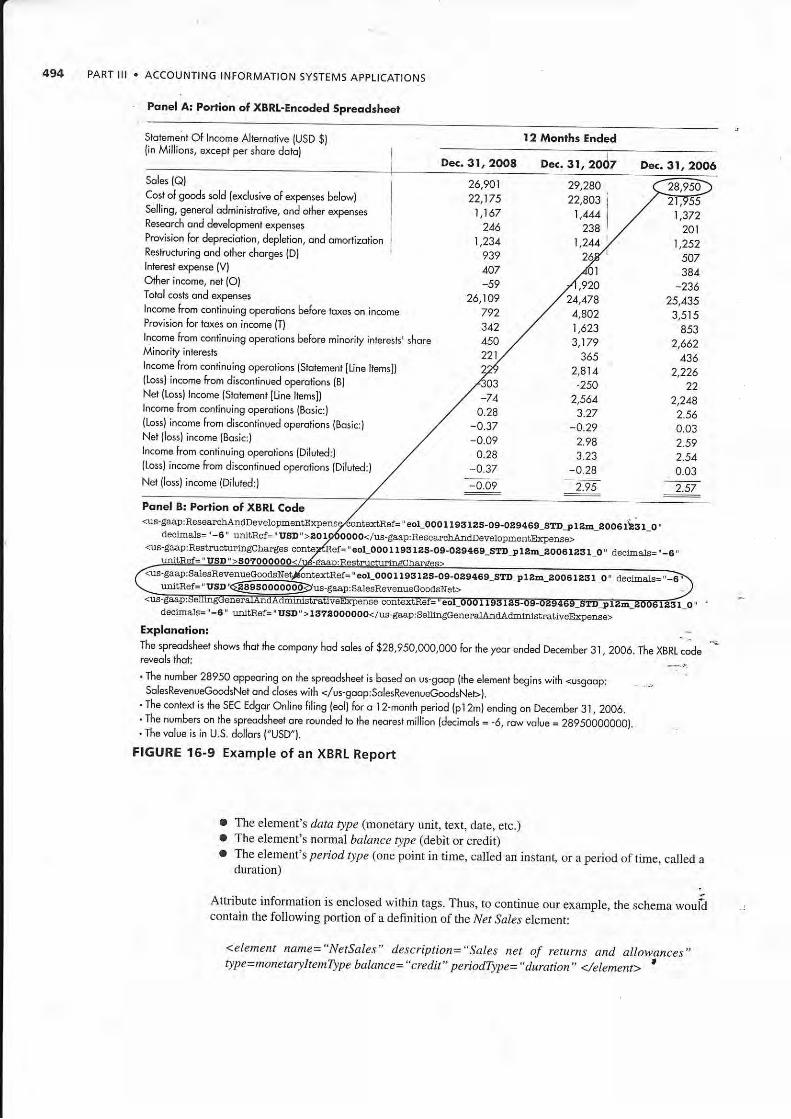
Without XBRL, electronic documents, regardless of fomat (text, HTML, PDR etc.) wereessentially just digital versions of paper reports. Humans could read the data, but computencould not automatically process it until the recipient manually entered it in the appropriate for-mat. XBRL changes that by encoding information about what a particular data item means sothat other computer programs can understand what to do with it. To illustuate, Figure 16-9 showshow XBRL can annotate a number in a spreadsheet to indicate that it represents sales for a par-ticular time period, following U.S. GAAP and measured in U.S. dollars. (The top portion ofFigure I 6-9 shows the spreadsheet that most users would see; the XBRL code in the bottom porlionis intended for use by software, although it can be viewed by programmers, auditors, or anyonewho needs or wants to see it).
XBRL Proress and Termirology Figure 16-10 provides a high-level view of the basic steps inpreparing and delivering XBRL repons. The XBRL file containing the tagged data that isdelivered to users is called ut instance ilocumenl. The instance document contains facts aboutspecific financial statement line items, including their values and contextual information such as .j
the measurement unit (dollars, euros, yuans. etc.) and whether the value is for a speciflc point intime (e.g., a balance sheet item) or a period of time (e.g., an income statement item). Each specificdata item in an XBRL document is called art el.ement. An element's specifrc value i$ displayed inan instance document between tags. Algle brackets are used to identii/ tags. Two tags are used for
Without XBRL
,-
CHAPTER 16 . GENERAL LEDGER AND REPORT|NG SYSTEM 493
FIGURE 16-8How XBRL Transformsthe Reporting Process
wirh XBRL
each element. The first tag presents the element name inside a pair of angle brackets; the secondtag also uses a pair of angle brackets but Fecedes the element name with a slash, For example, theXBRL code 2590 indicates rhat yalue of the element called Net Sales equals 2590. Additionalinformation is needed to properly interpet that value, such as the monetary uDits used to measurenet sales and the time period dudng which those sales occurred. That cotrtext information is alsopresented in the instance document between tags. For example, the XBRL code lSO 4ZL7:USDindicates that items are being measured in U.s. dollars, and p1y 20l i -12-31 indicates that salesare being reported for the 1-year period ending December 31, 2011.
An instimce document is created by applying a taxonomy to a set of data. A rdlonom, is a set offiles that defnes the various elements and the relationships between then One pafi of the taxonomyis called the scftemo, which is a file that coDtains the definitions ofevery element that could appear inan instance document. The following are some of the basic attributes used to defire each element:
o A unique identifuing narze used by the softwareo A descripti.on that can be used to conectly interpret the element
494 PART lll . ACCOUNTING TNFORMATTON SYSTEMS AppLtCATtONs
Ponel Ar Portion of XBRI-En.oded Spreodsheet
Slotement O[ lncome Alternotive IUSD $l{in Mill;ons, except per shor6 doiol
Soles lQ)Cost of goods sold (exclusive of expenses belo-)Selling, generol odminishotive, ond other expensesReseorch ond dwelopmenl expenses
Prodsion for depreciotion, depletion, ond omortizotionRestructuring ond o$er chorges {D)lnieresl expense (V)
Other income, net (O)
Tobl cosls ond expenses
lncome from continuing operolions before l,oxes on incomeProvision for toxes on income [T)lncome lrom conlinuing operolions belore minor;]y in]eresh, shoreMinoriiy interests
lncome from continr-ring operotions {sttement lline ltems])(l,oss) income from discontinued operotions {B)Net fl-ossl lncome {Stotemen} lline ltems])lncome from conlinuing operotions (BosicJ
{Loss) income from discontinued operotions (Bosic:}
Net lloss) income (Bosic:)
lncome from conlinuing operotions (Diluted:)([oss] income from discontinued operolions (Diluted:)
Nei (lossl income (Dilubd:)
Ponel Bt Portion of XBRL Code
declma,ls='-6' udtRef=', USD,,<us-gaap:RestmcturinEloharge6
=' eor_OOOt r931e5-o9-Oa9469_SrDJ, t8lr eoOSrlgt O,
" col_OOOI l06l?8-O9-O49469_STDj rala_Aoo6 tAgt O,
De..3I,2OO8
l2 Monrhs Ended
29,28022,803
1 ,144238
1,2M
Dec.3I,2006
1 ,372
26,90122,17 5
1 ,167246
1,234939407
-5926,109
792
450221
-740.28
-0.37-0.09
0.28
-0.37
,920
2011 ,252
507384
-23625,4353,515
8532,662
4362,226
2,2482.560.032.592.54
. 0.03
257
24,4784,8021,6233,179
3652,814
-250
2,56r',
3.27
-0.292.983.23
-0.28
_!!2_ _7ii
urftRef='USI,'>TSTZOOOOOO</us-ga,€,p:Se]liDEiceae]a,IArdAdministlativeExpense>
Explonotion:The spreodsheef shows thot $e compony hod soles of $28,95o,ooo,ooo for $e yeor ended December 31, 2006. The xBRt:ode
*reveols lhol. The number 28950 oppeoring on $e spreodsheet is bosed on us-goop {the element begins with <usgoop:
SolesRevenueGoodsNet ond closes with </us-goop:solesRwenueGoodsNet ).' The contexr is 6e.sEC Edgor online filing (eol) for o 1 2-monrh period (pl 2m) ending on December 3 r, 2006.' The numbers on fie spreodsheer ore rounded to the neorest mirlion ldecimols = -6, row volue = 2g95oooo00o).. The volue is in U.S. dollors ("USD"l.
FIGURE 15-9 Example o, an XBRL Report
a The element's data type (motetary :tl;.i,it, text, date, etc.)a The element's normal bqlance type (debit or credit)a The element's pe riod type (oDe point in time, called an instant, or a period of time, called a
duration)
Attdbute information is enclosed within tags. Thus, to continue our example, the schema wouficontain the following portion of a definition of the Ne, Sa/es element:
<element name="Netsqles" description=.,Sales net of returns and allowances,,
"eol_OOOtl9El85-O9-OS9469_SA,jtAD-AOO6taSl O, alecjna,ts=,,_i
type=monetaryItemType balance="credit,, periodType=,,duration" </element> t

CHAPTER 16 . GENERAL LEDGER AND REPORTING SYSTEM 495
FIGURE 16-'I O
Electronic Reportingwith XBRL
The taxonomy also includes a set of files called linkbases, which define the relationshipsuimong elements. Important linkbases include the following:
o The Reference linkbase identifies relevant authoritative pronouncements (e.9., U.S.-GAAP,IFRS) for that element.
o The Calculationlinkbase specifies how to combine elements (e.g., that "CurrentAssets"equals the. qum ofCash, Accounts Receivable, and Inventory).
a T1\e Definition litrkbase indicates hierarchical relationships among elements (e.g., that
"Curent Assets" is a subset of 'Assets").a T17e Presentation linkbase describes how to grcup elements (e.g., Assets, Liabilities, and
Equities).a The fuibellinkbase associates human-readable labels with elements.
As Figure 16-10 shows, the information in an XBRL taxonomy is used to tag the data and
create an instance document. The same taxonomy is usually uscd to create a set of separate
instance documents, one for each reporting year. Instance documents, however, contain only the
data yalues.. Another document, called the style sheet, ptovides the instructions on how to appro-
priately display the content of an instance document, either on a computer screen or in a printed
report. !
The benefits of XBRL are not limited to its use fot external reporting. Internal reporting willalso benefit because data can be exported ftom the basic ERP system in a format that managers
can import directly into a variety of apPlications, saving time and eliminating the errors arising
from having to manually reenter data.
The Accountant's Rote Accountants can, and should, play a major role in all phases ofproducing XBRL reports, beginning with the selection of an appropriate taxonomy. To ensure
comparability across XBRL reports produced by different organizations, standard taxonomies
have been developed for many different countries and industries. Accountants use their
knowledge of the organization's business practices plus general accounting principles to select
the standard taxonomy that best fits the organization. They then map each data item in the
organization's accounting system to its corresponding element in the taxonomy.
However, standard taxonomies cannot cover every possible situation. Sometimes, an organ-
ization needs to record financial information in a different manner or level of detail to reflect its
unique way of doing business. In such cases, accountants can create new tags to more accurately
496 PART lll . ACCOUNTTNG INFORMATION SYSTEMS,APPLICATIONS
present information about the organization's business activities. These new tags create what iscalled at extension taxonom!. This ability to modify XBRI, is why it is referred to as anextensible langsage,
Accountants are also likely to use software to apply the taxonomy (and aoy extensions) torag thea organization's data. ctpate instance documents, and then validate those instance docu-ments before they are subrnin{d. Accountarts will arso typically participate in creating stylesheets to ensue that rhe informhrion is displayed appropriately.
Not only do accoultants use XBRL; as Focus 16-1 explains, the accounting professionplayed a major role in its creation. XBRL is a work in process. you should bookmari and regu-larly- visit both the xbrl.org and sec.gov Web sites to stay abreast of continued developments inthis important rcporting tool.
Threats and ControlsTable 16-1 shows that one threat is the creation of inaccurate financial statements. The data pro-cessing integrity controls forjoumal entries discussed earlier combined with the use ofpackagedsoftwarc (e.g., an ERP system) to produce the flnancial statements minimizes the risk numericalerro6 in the data. However, because both IFRS and XBRL require numerous judgments abouthow to classify information, there is a risk that financiar statements may not accurately representthe results of operations. For example, mistakes in componentizing fixed assets can result ininaccurate depreciation expenses for IFRS financial statements. X-BRL standard taxonomiesoffer many fine-grained choices (e.g., more than 20 elements defrne the concept ..Cash
and CashEquivalents"), which can result in selecting an inappropriate tag unless the person doing themapping has extensive knowledge both about the organizatio['s business practices and theXBRL taxonomies. Unnecessarily creating taxonomy extensions instead of using a standard tagis another potential problem. Training and experience will likely reduce the risk of making sucimistakes. In addition, an independent extemal audit is necessary as a detectiye control.
Fraudulent financial reporting (threat g) is another potential problem. Filancial statementfraud often involves joumal entries by upperJevel management ihat cause tlie organization.sfinancial statements to either overstate revenues or understate liabilities. It is difficoit to pr"u"rt
The origins of XBRL can be traced back to the early .l99Os,
At that time, a software engineer named Jon Bosak recog-nized that a critical shortcoming of HTML is its inabllity todescribe the content of the data being presented. Bosakconvinced the World Wide Web Consortium (W3C) to spon-sor the development of a language with this capability. Thatprojed resulted in Bo5ak and two other software engineerscreating a programming language called XML, which standsfor extensible markup language. XML is a general-purposetool that can tag any data with identifying markers.
XML was a step in the right direction. Charlie Hoffman,a CPA who worked for a local accounting firm in Tacoma,Washington realized, however, that XML did not go farenough to be a general-purpose language for communicat_ing financial information, What was needed was the abilitynot only to identify each piece of data but also how toprocess it and how to relate it to other data items. Hoffmanstarted work on adding the desired capabilities to XML butrealized that the project required additional support. Hesought and obtained the AlCpAt help to pursue the
development of a prototype set o{ XML-enhanced _financia'lstatements.
As the work progressed, the results were shared withmajor software companies, who recognized the value of,such a common business language and joined the proiect.Eventually, many leading so{tware companies, and impor-tant user groups, cooperated in the venture with the AlCpA.The result: XBRL. The continued development and mainte-nance of XBRL is now overseen by a nonprofit internationalorganization (XBRL lnternational). Vendors are currentlyworking on making a wide range of financial and decisionsupport software capable of supporting XBRL. lndustry-specific coding taxonomies have been developed in manycountries. XBRL is on its way to becoming the global com:puter language for communjcating financial data. And it allstarted with one CPA who was looking for a better way to adisseminate financial data on the lnternet!
Postscript: ln December 2006, the AICpA formally recog-nized Charlie Hoffman's pioneering work in developing XBRLwith a special achievement award, t
, CHAPTER,6 . GENERAL LEDGER AND REPORTING SYSTEM
such joumal entries because upper-level management inherently has the ability to override mostinternal corfuols. Therefore, the best conhol to mitigate the threat of financial statement fraud isan independent review (audit) of all special joumal entries to the general ledger (i.e., all entriesother than the journal entries automatically generateq by the various cycles discussed
in Chapters 12 to 15i. Although Statement of Auditing Stardards number 99 requires extemalali4itors to "test tle ofjoumal entries recorded in the geueral ledger and otheradjustme[ts,"To be effective,that every change to
Produce Managerial Reports
The final activity h the general ledger and rcporting system (circle 4.0 in Figure 16-2) is to pro-
duce various managerial reports, including budgets.
ProcessERP systems.like the one depicted in Figure 16-3 can produce a number ofbudgets to help man-
agers Plan and evaluate performance. An operating budget depicts planned revenues and expen-
dituei for each organizational unit. A capital expenditures budget shows planned cash inflows
and ou!flows for each capital project. Cash flow budgets compare estimated cash inflows ftomoperdiions with planned expenditures and are used to determine borrowing needs.
In addition to budgets, the inquiry processing capabilities ofERP systems enable managers
to easily create an a'lmost unlimited number of performance reports. For example, sales can be
broken down by products, by salesperson, and by customer Displaying the data in graphs can
help managers quickly identify impo ant treDds and relationships, as well as areas in need ofmore detailed analysis. Accountants should understand how to use the flexible reporting and
graphing capabilities of ERP systems so that they can add value by suggesting alternative ways
to organize and.*ralyze data aboul business processes.
Threats and ControlsPoorly designed reports aud graphs (threat 10 in Table 16-l) can cause managers to make biased
or erroneous decisions. The following subsections diseuss thrce important controls to mitigate
that threat: the use of responsibility accounting and flexible budgets to design performance
repons, the balanced scorecard, and understanding the principles of proper graph design.
RESPONSIEILITY ACCOUNTING AND FLEXIBLE BUDGETING To properly eYaluate perfomance,
reports should highlight the results that can be directly contolled by the person or unit being
evaluated. ResponsiDility dccounting does this by producing a set of conelated rcports that bleatdown the organization's overall performance by the specific subunits which can most directly
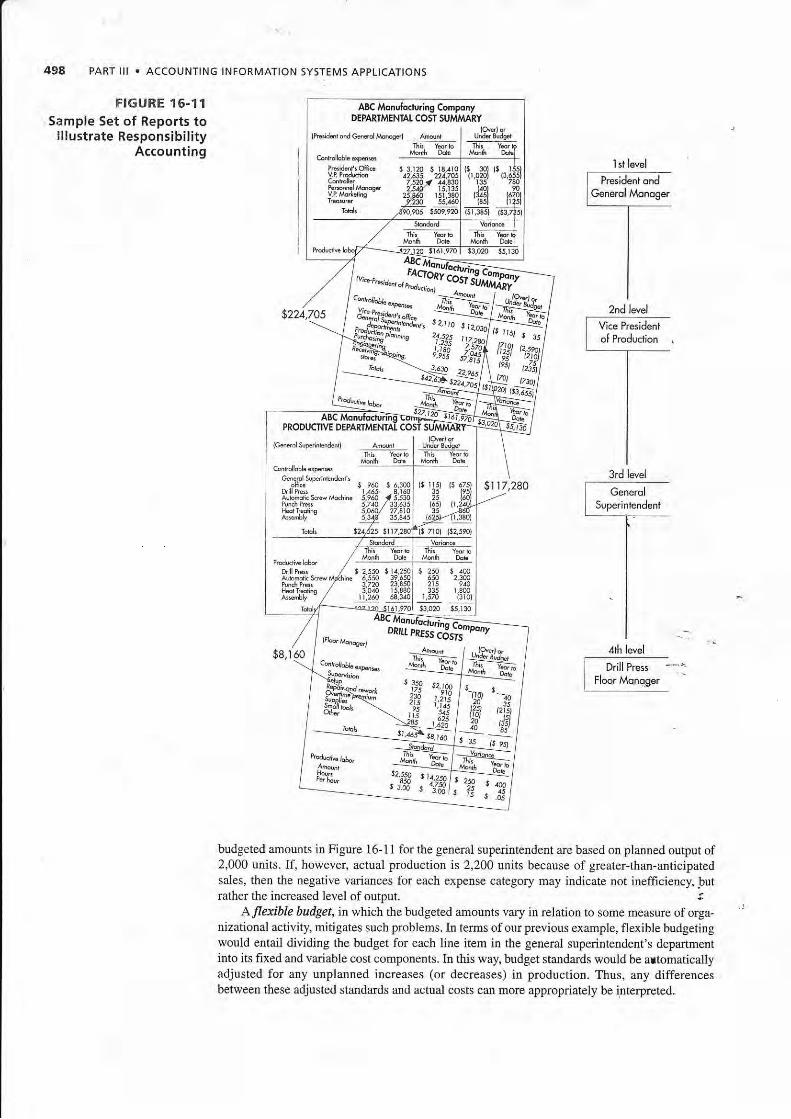
conhol ihose activities, as shown in Figure 16-11. Note how each report shows actual costs and
variances from budget for the curent month and the year to date, but only fol those items that the
manager of that subunit contxols. Note also the hierarchical nature of the reports: The total cost ofeach individual subunit is displayed as a single line item on the nexlhigher-level report.
It is also important to design the budget so tlat its content matches the natue of the unit being
eyaluated. For example, the performance reports depicted in Figure 16-11 focus on costs, because
production deparEnelts a.re usually treated as cost centers. In contrast, sales dePa.rtments are often
evaluated as tevenue centers. Consequently, their performance reports should compare actual to
forecasted sales, broken down by appropriate product and geographic categories. Similarly, reports
for departments that are aeated as profit centers should include both revenues and expenses.
No matter which basis is used to prepare a unit's budgetary perfomance report, tlle method
used to calculate the budget standard is crucial. The easiest approach is to establisb flxed targets
for each unit, store those figures in the database, and comPare actual performance with those Pre-
set values. A major drawback to this approach is that the budget number is static and does not
reflect unforeseen changes in the operating environment. Co[sequently, individual managers
may be penalized or rewarded for factom beyond their contlol. For example, assume that the
auditors should also regularly review all adjustunents to the general ledger.'er, such testing requires proper configuraiion of the accounting system, so
,eneral ledger accounts is captured and rdcorded as part of the audit trail.
49A PART lll . ACCOUNTING INFORMATION SYSTEMS AppLtCATtONS
FIGURE 't 6-1'lSample set o, Reports to
il!ustrate ResponsibilityAccounting
3rd level
f G-,-dSuperintendent
-TI
I
/th level
Drill Press
Floor Moroger
budgeted amounts in Figue 16-11 for the general superintendent are based on planned output of2,000 units. If, however, actual production is 2,200 units because of greater-than-anticipatedsales, then the negative variances for each expense category may indicate not ilefficiency, butrather the increased level of output. t
A,flexible budget, it which the budgeted arnounts vary in relation to some measure of orga-nizational activity, mitigates such problems. In terms of our previous example, flexible budgetingwould entail dividing the budget for each line item in the general superinlendent's departmentinto its fixed and variable cost components. In this way, budget standards would be artomaticallyadjusted for any unplanned increases (or decreases) in production. Thus, any differencesbetween these adjusted standards and actual costs can more appropriately be interpreted.
I st level
2nd level
A8€ Monuhcturing ComponyDEPARTMENIAT COST SUMMARY
,*^,*,jlTlHl
l,,r.'t , J5
{cs.srol supeinEn!.nl unJer Bu;qd
G.nehlterinbJed 1 I
"16- r e.0 r.1001 rl rD llPa I L5 3160|Aubmd. 5.dMrline lle60 a l53o lPui.[ Pcs 5.rro /33.6351 |HdrIEhE 5,a6O/ 27,StOAeFbt 5,349 35,34 16
$l r 7,280
CHAPTER 15 . GENEML LEDGER AND REPORTING SYSTEM 499
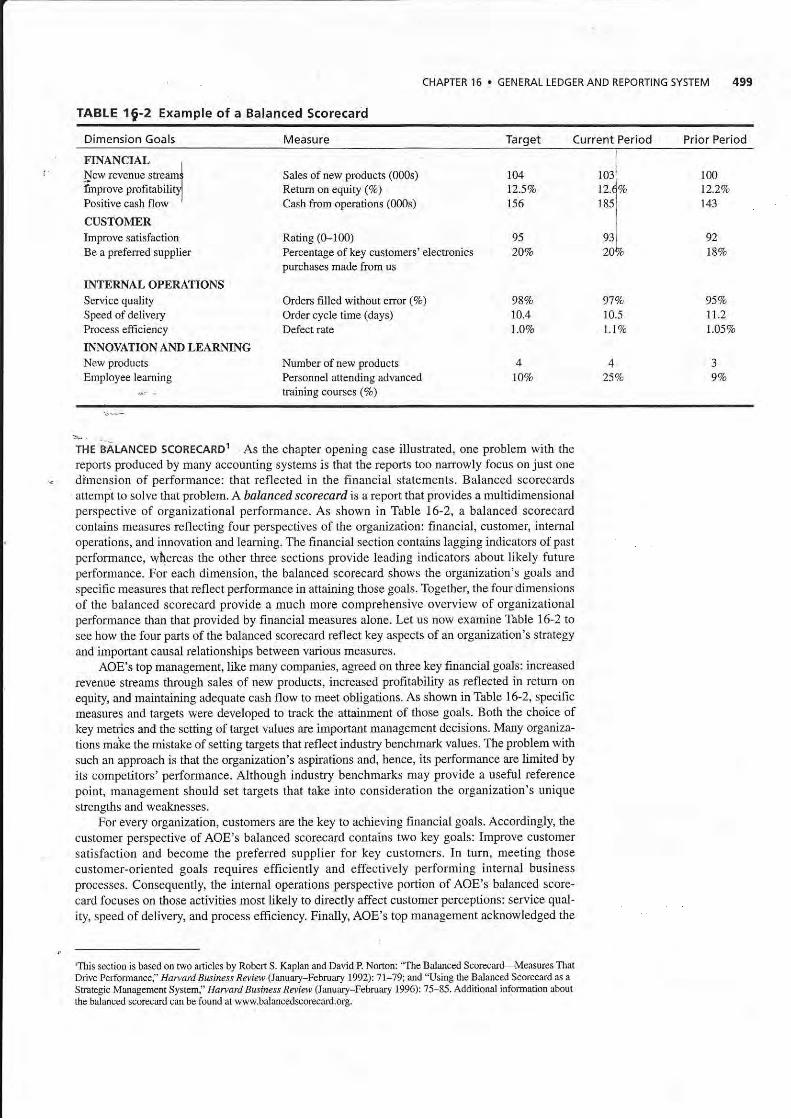
TABLE 1 2 Example of a Balanced Scorecard
Dimension Goals Measure Target Current Period Prior Period
FINANCIALI
New revenue stream{lmprove profitabilitfPositive cash flow I
CUSTOMERImprove satisfactio[Be a prcfered supplier
INTERNAL OPERAIIONSService qualitySpeed of deliveryProcess efEciency
INNOYAIION AND LEARNINGNew products
Employee leaming
Sales of new products (000s)
Retum on equity (%)Cash from opemtions (000s)
Rating (0-100)Percentage of key customers' elecbonicspurchases made from us
Orders filled without error (%)Order cycle time (days)
Defect rate
Number of rlew productsPersonflel attending advancedtraining courses (7o)
104125%156
9520Eo
98Ca
10.4
1,.07o
4lOVo
91V.10.5
l.lVo
4251o
100
12.2Vo
143
92lSVo
95Vo
11.2
l.05Vo
3
9Vo
I
1031
n.4c.r 85l
e3i20%
THE BALANCED scoREcARDr As the chapter opening case illustrated, one problem with thercports produced by many accqunting systems is that the rcports too nalrowly focus on just one
di'mension of performance: that reflected in the financial statements. Balanced scorecardsattempt to solve that $oblem. A balanceal scorecard is a rcport that provides a multidimensionalperspective of organizational performance. As shown in Table 16-2, a balanced scorecardcoltains measures reflecting four perspectives of the organization: financial, customer, internaloperations, and innovation and leaming. The finaacial section contains lagging indicators ofpastperformance, whereas the other tbree sections provide leading indicators about likely futureperformance. For each dimension, the balanced scorecard shows the organization's goals andspecific measures that reflect performance in attaining those goals. Together, the four dimensions
of the balanced scorecard provide a much more comprehensive overview of organizationalperformance than that govided by financial measures alone. Let us now examine Table 16-2 tosee how the four parts of the balanced scorecard reflect key aspects of an organization's shategy
and imponant causal relarionships between various measures.
AOE'S top management, like many companies, agreed on three key financial goals: increased
revenue stueams through sales of new products, increased profitability as reflected in retum on
equity, and maintaining adequate cash flow to meet obligations. As shown in Table 16-2, specifrc
measurcs and targets were developed to hack the attainment of those goals. Both the choice ofkey metrics and the setting of target values are important ma[agement decisions. Many organiza-
tions mai<e the mistake of setting targets that reflect industry benchmark values. The problem withsuch an approach is that tie organization's aspirations and, hence, its performance arc limited byits competitors' perfomance. Although industry benchmarks may provide a useful referencepoint, management should set targets that take into consideration the organization's uniquestrengths and weaknesses.
For every organization, customers are the key to achieving f,tnancial goals. Accordingly, the
customer perspective of AOE's balanced scorecard contains two key goals: ImProve customer
satisfaction and become the preferred supplier for key customers. In turn, meeting those
customer-oriented goals requires effrciently and effectively performing intemal businessprocesses. Consequently, the intemal operations perspectiye portion of AOE'S balanced score-
card focuses on those actiyities most likely to directly affect customer.perceptions: service qual-
ity, speed of delivery and process efficiency. Finaly, AOE's top management acknowledged the
'This section is based on lwo articles by Robert S. Kaplan and David P Norton: *Ihe Balanced Scorecard-Measures ThatDrive Performance," flr,,vdrd Business Review (lannary Febfltary 1992\t 1119; aid "Using the Balanced Scorecard .s aStsaEgic Management Sysl?ra:' Harvard Busifiess Reui.?), (January-February 1996): 75-85. Additional information about
the balanced scorecard can be found at ww*.balancedscorecard.org,
500 PART lll . ACCOUNTING INFORMATION SYSTEMS APPLICATIONS
importance of developing new products and training its worKorce to contitruously improve serviceand results. Therefore, measures of those two items are ilcluded in the innovation and leaming' perspectiye ofAOE's balanced scorecard.
Note that the preceding discussion implied a number of hypotheses about cause-and-effectrelationships. for example. hcreased employee training is expected to improve service quality, as
reflected in th{ percentage of customer orders filled corecdy. ln tum, improved service quality isexpected to rebult in increased customer satisfaction and in more puchases from key customels.Finally, increased customer satisfaction is expected to result in improved profitability and cashflow. Thus, the measures in the innovation and leaming, intemal operations, and customer perspec-tive portions of the balanced scorecard can be thought of as leading indicatoB of financial measwesof the organization's strategy. Analyzing trends in the actual measures allows AOE's managementto test the validity of those hypotheses. If improvements in one perspective do not generateexpected improyements in other areas in subsequent time pedods, top management must reevaluateand probably revise h)?otheses about the determinants of organizational success. Indeed, this abil-ity to test and refine stuategy is one of the major benefits the balanced scorecard provides.
Accountants and systems professionals should participate in the development of a balancedscorecard. Top management's role is to specify the goals to be pursued in each dimension.Accountants and information systems professionals can then help management choose the mostappropdate measures for tracking achievement of those goals. In addition, tbey can provide inputconcerning the feasibility of collecting the data that would be required to implement variousproposed measures.
Although the balanced scorecard was initially developed as a strategic management tool, itcar also be used as a vehicle to better manage enterprise risk by incorpomting appropriate risk-based goals and measures in the yarious dimensions. For example, an organization might want toincrease information security awareness among employees. One way to motivate attention to thatobjective is to explicitly list increased security awareness as one of the goals in the Innovationand Leaming section of the scorecard and then measure employee knowledge about secudty bestpractices. Similarly, listing reduced inventory shrinkage as one of the Intf,rnal OperationsProcess goals and measuring it can help focus attention on reducing the risk of employee theft.Extemal threats, such as loss of market share, can likewise be addressed by including appropri-ate measures (e.g., sales to repeat customen, number of new customers) in the Customer andFinancial sections of the balanced scorecard. Thus, the balanced scorecard can be used. as onetool to monitor and eyaluate an organization's controls and risk managemedt program. '
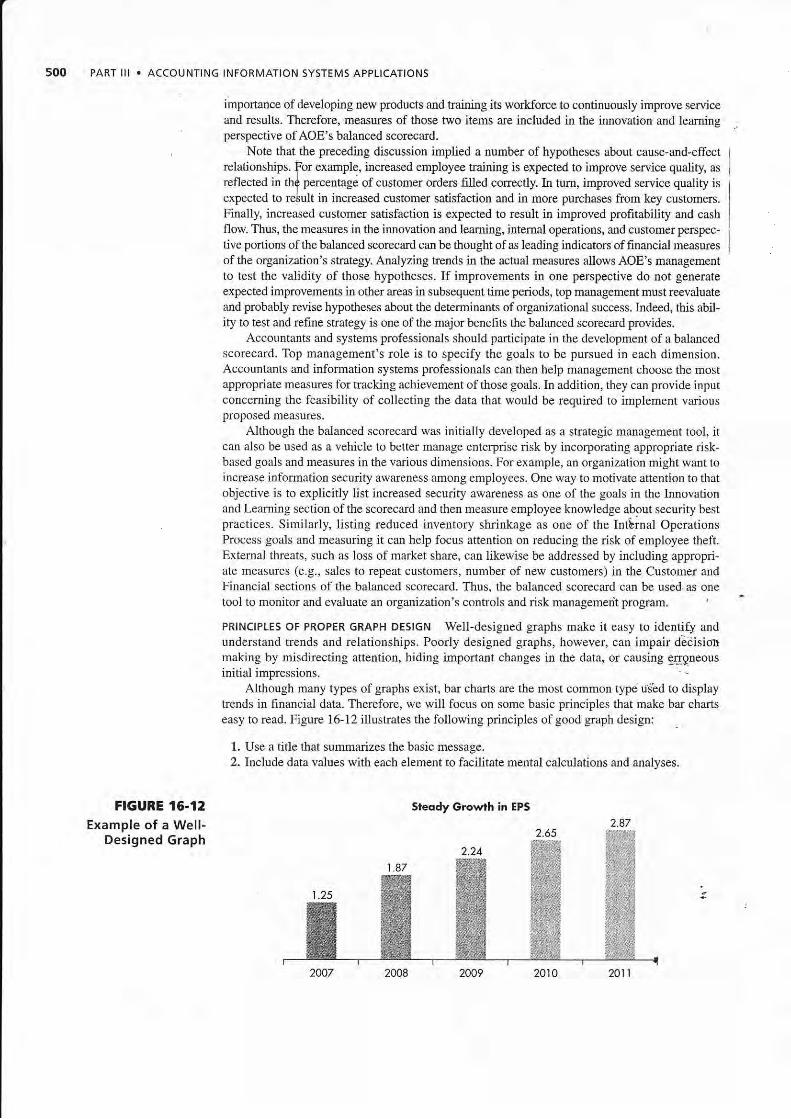
PAINCIPLES OF PROPER GRAPH DESTGN Well-designed graphs make it easy to identifJ andunderstand trends and relationships. Poorly designed graphs, howeyer. can impair d;iisiotmaking by misdirecting attention, hiding important changes in the data, or causing errgneousinitial impressions.
Although many types of graphs exist, bar charts ale the most common type uidbd to displaytrends in financial data. Thereforc, we will focus on some basic principles that make bar chartseasy to read. Figue 16-12 illustrates the following principles of good graph design:
l Use a tide that summarizes the basic message.
2. Include data yalues with each element to facilitate mental calculations and analyses.
FTGUBE t6-12Example of a Well-
Designed Graph
Sleody Growth in EPS
2.47
CHAPTER 16 . GENERAL LEDGER AND REPORTING SYSTEM
EPS Gro$h Conlinuej
3. Use 2-D, instead of 3-D, bars because that makes it easier to accurately assess themagnitude of changes and trends.
Howeyer, graphs not only must be easy to read but also must lead to accurate interpretations ofthe underlying data. The following two principles are essential for properly designing bar chartsof financial data so that they are accurately interpreted:
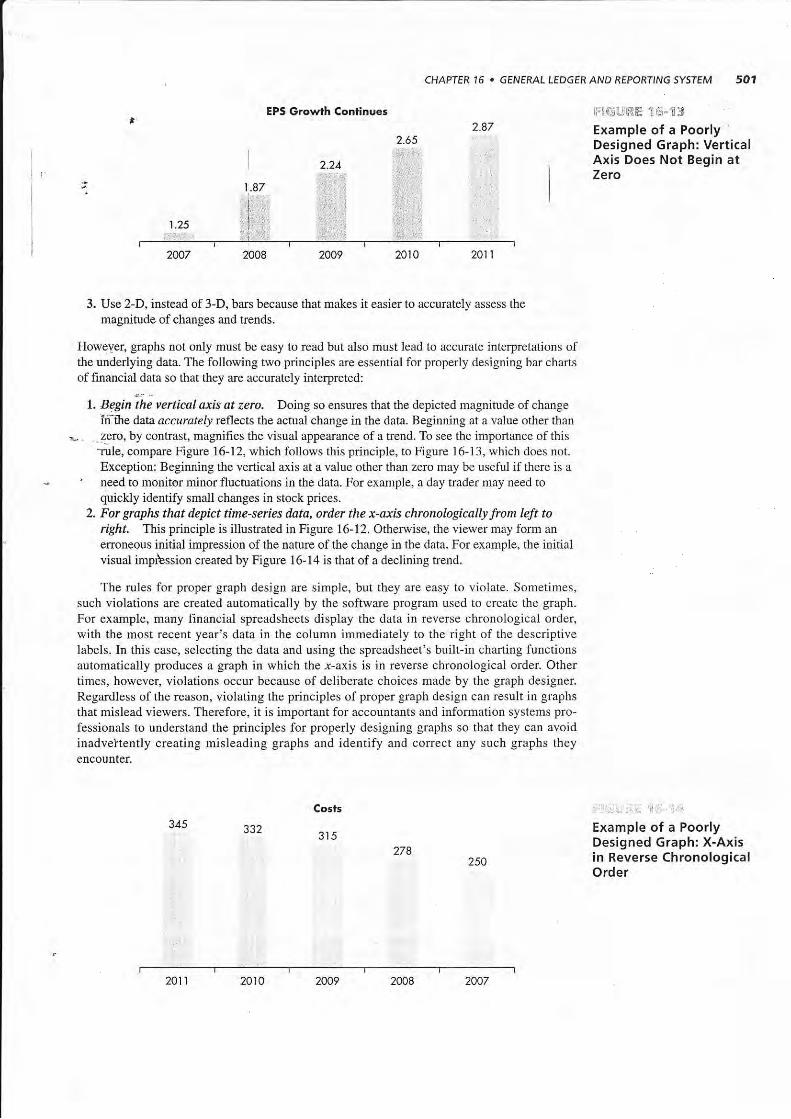
l. Aegniii vertical axis at zero. Doing so ensures that the depicted magnitude of change'ifdte data accurately reflects the actual change in the data. Beginning at a value other than
,- - z€Jo, by conhast, magnifies the visual appearance of a tend. To see the importance of this-rule, compare Figure l6-12, which follows this principle, to Figure 16-13, which does not.Exception: Beginning the vertical axis at a value other than zero may be useful if there is a
' need to monitor minor fluctuations in the data. For example, a day trader may need toquickly identify small changes in stock prices.
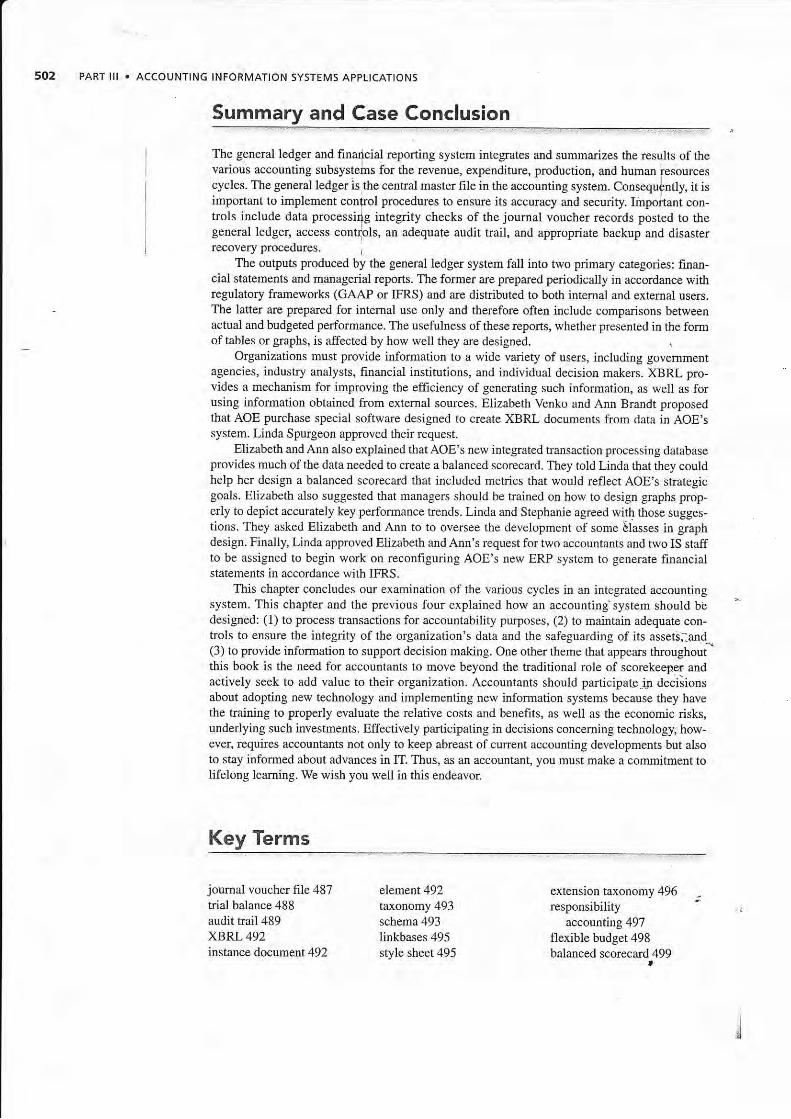
2. For graphs that depict time-series dda, order the x-axis chronologically from left torigftr. This principle is illustated in Figure 16-12. Otherwise, the viewer may form an
enoneous initial impression of the nature of the change in the data. For example, the initialvisual imprlssion created by Figure 16-14 is that of a declining trend.
The rules for proper graph design are simple, but they are easy to violate. Sometimes,such violations are created automatically by the software program used to create the graph.
For example, many financial spreadsheets display the data in reverse chronological order,with the most recent year's data in the column immediately to the dght of the descriptivelabels. In this case, selecting the data and using the spreadsheet's built-in charting functionsautomatically produces a graph in which the r-axis is in reverse chronological order. Othertimes, however, violations occur because of deliberate choices made by the graph designer.Regardless of the reason, violating the principles of proper graph design can result in graphs
that mislead viewers. Therefore, it is important for accountants and information systems pro-fessionals to understand the principles for properly designing graphs so that they can avoidinadveltently creating misleading graphs and identify and corect any such graphs theyencountet-
FlC,[.:]iiE 1 Lr= il3Example of a PoorlyDesigned Graph: VerticalAxis Does Not Begin atZeto
Example of a PoorlyDesigned Graph: X-Axis
2so in Reverse Chronologicalorder
345315
274
2011 20t0 2009 2008 2007
PART lll . ACCOUNTING INFORMATION SYSTEMS APPLICATIONS
su--.lry,nd 91":.9",n-9ll:.i9.n,, , ,.., =,,,. , . ., ..,,....,..
The general ledger and finaricial reporting system integrates and summarizes the results of thevarious accounting subsystems for *re revenue. expenditure. production, and human fesourcescycles. The general ledger is,the central master file in the accounting system. Consequfntly. it isimportant to implement conlrol procedures to ensure its accuracy and securiry. Impohant con-trols include data processirlg integrity checks of the joumal voucher records posted to thegeneral ledger, access contiols. an adequate audit trail, and appropriate backup and disasterrecovery procedures.
,
The outputs produced by the general ledger system fall into two primary categories: finan-cial statements and managerial reports. The former are prepared periodically in accordance withregulatory frameworks (GAAP or IFRS) and are distributed to both internal and extemal users.The latter are prepared for intemal use only and therefore often include comparisons betweenactual and budgeted performance. The usefulness of these reports, whether presented in the formof tables or graphs, is affected by how well they are designed
Organizations must provide information to a wide variety of users, including govemmentagencies, industry analysts, financial institutions, and individual decision makers. XBRL pro-vides a mechalism for improving the ef&ciency of generating such information, as well as forusing informatio[ obtained from extemal sourcas. Elizabeth Venko and Ann Brandt proposedthat AOE purchase special software designed to create XBRL documents from data in AOE'ssystem. Linda Spurgeon approved their request.
Elizabeth andAnn also explained thatAOE'S Ilew integrated tansaction processing databaseprovides much of the data needed to create a balalced scorccard. They told Linda that they couldhelp her design a balanced scorecard that included metrics that would reflect AOE'S strategicgoals. Elizabeth also suggested that managers should be trained on how to design graphs prop-erly to depict accurately key performance rends. Linda arld Stephanie agreed with those sugges-tions. They asked Elizabeth and Ann to to oversee the development of some blasses in graphdesign. Finally, Linda approved Elizabeth and Ann's request for two accountants and two IS staffto be assigned to begin work on reconfiguring AOE's new ERP system to generate financialstatements in accordance with IFRS.
This chapter concludes our examination of the various cycles in an integrated accountingsystem. This chapter and the previous four explained how an accounting system should bEdesigned: (1) to process transactions for accountability purposes, (2) to maintain adequate con-trols to ensure the integrity of the organization's data and the safeguarding of its assetsiand,(3) to provide information to support decision making. One other theme that appears throughout
-
this book is the need for accountants to moye beyond the traditional role of scorekeeper andactively seek to add value to their organization. Accountants should participate-fur deciSionsabout adopting new technology and implementing new information systems because they hayethe tuaining to properly evaluate the relative costs and benefits, as well as the economic risks,underlying such investments. Effectively participating in decisions concerning technology, how-ever, requires accountants not only to keep abreast of curent accounting developments but alsoto stay informed about adyances in IT. Thus, as arl accountant, you must mate a commitment toIifelong leaming. We wish you well in this endeavor
Key Terms
joumal voucher file 487trial balance 488audit rail 489XBPJ- 492instance document 492
elemelJ.t 492taxonomy 493schema 493linkbases 495style sheet 495
extension taxonomy 496responsibility
accounting 497flexible budget 498balanced scorecard 499
t
AIS 'N,ACI'ONChapter Ouiz
From where do adjusting entries usually come?a, treasurerb. contxollerc. various accounting cycle subsystems, such as sales order entryd. unit managers
2, Preparing performalce reports that contain data only about items that a specific organiza-tional unit controls is aa example of which of the following?
CHAPTER 16 . GENERAL LEDGER AND REPORTING SYSTEM 503
3. The definition of an XBRL element, including such infomation as whether its normalaccoun-t balance is a debit or a credit, is fouad in which of the following?
-a. linkbase c. schema-tt-rnstance document d. style sheet
" 4. -Which ofthe following shows the implied linkages among the portions of the balancedscorecard?
. a. Financial , Intemal -+ Innovation and learning -, Customerb. Innovation and learning , Intemal -, Customer -+ Financialc. Customer -+ Financial -+ Intemal -+ Iflnoyation and leamingd. Intemal -) Customer -+ Innovation and leaming -+ Financial
5. Which of the following XBRL documents contains the actual data values for a company'sIlet incomA for a particular year?
a. style sheets
b. schema
6. The number of orders shipped per warehouse worker each day is a metric that wouldmost likely appear in which part of the balanced scorecard?
a. flexible budget systemb- responsibility accounting system
a. innovation and learningh. customer
c. closing the booksd. management by exception
c. linkbasesd. instance document
c. internal operationsd- financial
c. trial balanced. data warehouse
c. IFRSd. the balanced scorecard
7. Which of the following is an important part of the audit tlail?a. journal vouchersb. flexible budgets
8. An adjusting joumal entry to record interest revenue that has been eamed but not yetreceived is an example of which of the following?a. accrual c. estimateb. deferral d. revaluation
9. Which of the following is designed primarily to improve the effrciency of financialreporting?a. XMLb. XBRL
10. Which of the following graph design principles is most important for ensuring that finan-cial data are accumtely interpreted?a. including a title that summarizes the point of the graphb. attaching data values to specific elements in the gmphc. starting the ),-axis of the graph at zerod. using different colo6 for different variables

PART lll . ACCOUNTING INFORMATION SYSTEMS APPLICATIONS
Diseussion @uestioms
76.7. Although XBRL facilitates the electronic exchange of financidl information, some exter-nal users do not think it goes far enough. They would like accd.ss to the entire generalledger, notjust to XBRl-tagged financial repons that summarlze general ledger accounts.Should companies provide extemal users with such access? Wfry or why not?
16.2. How can responsibility accounting and flexible budgets improle morale?
16.3. Why is the audit trail an impotant control? II
16.4. The balanced scorecard measures organizational performance along four dimensions. Is itpossible that measures on the customer, intemal operations, and innovation and leamingdimensions could be improving without any positive change in the financial dimension?If so, what are the implications of such a pattern?
16.5. Do you think that mandatory standards should be developed for the design of graphs offinancial data that are included in annual reports and other periodic communicatibns toinvestoB? Why or why not?
FrohEeums
16.1. Match the term in the left column with its appropdate definition from the right column:
- 1. Joumal voucher file
- 2. Instance document
- 3. XBRL element
- 4. Balanced scoreca.rd
- 5. XBRL extension
taxonomy
- 6. Audit trait
- 7. XBRL taxonomy
- 8. XBRL linkbase
- 9. XBRL schema
- 10. XBRL style sheet
- 11. Responsibility
accounting
- 12. Flexible budget
a. An individual financial statement item
b. Evaluating performance based on contollable costs
c. Evaluating performance by computing standards inlight o[actual activity levels i
d. The set ofjoumal enkies that updated the general ledger
e. A set of files that defines XBRL elements andspecifies the relationships among them
f. A multidimensional performancoreport .
g. A file that defines relationships among XBRL elements
h. A file that de6nes the atributes oI XBRL elemrlnrs ^i. A detective cantrol that can be used to tace changes
in general ledger account balances back to s6-tiice
documents
j. A file that explains how to display an XBRL instancedn.llment
k. A file that contains specific data values for a set ofXBRL elements for a specific time period or pointin time
l. A file containing a set of customized tags to definenew XBRL elements that are unique to a specificorganization
16.2. Which control procedure would be most effective in addressing the following problems?a. When entedng ajoumal entry to record issuance of new debt, the teasurer inadver-
tently transposes two digits in the debit amount. 'a
b. The spreadsheet used to calculate accruals had an error in a formula. As a result, thecontroller's adjusting entry was for the wrong amount.
c. The conftoller forgot to make an adjusting entry to record depreciation.d. A sales manager tipped off friends that the company's financial results, tole released
tomonow, were unexpectedly good.

CHAPTER 16 . GENERAL LEDGERAND REPORTING sYsTEM
e. ThE general ledger master file is stored on disk. For some reason, the disk is no longerreadable. It takes the accounting department a week to reenter the past month's tans-acrions Som source documents in order tq create a new general ledger master flle.
f. The coniroller sent a spreadsheet containing a preliminary drafl of the income statement, to the CFO by e-mail. An investor intercepted the e-mail aad used tfre information to
sell his slock in the company before news ot t]e disappointing results became public.g. A comp{ny's XBRL business report was incorect because the contoller selected the
*rorg "iem.rt
from the taxonomy.h, Instead {f a zero, an employee entered the letter o when ryping in data values in an
XBRL instance document.
16.3. Explain the components of an audit kail for verifying changes to accounts payable. Your
answer should specify how those components can be used to Yerify the accuracy, com-pleteness, and validity of all purchases, purchase rcturns, purchase discounts, debit
memos, and cash disbursements.
16.4. As manager of a local pizza parlor, you want to develop a balanced scorecard so you can
more effectively monitor the restaurant's performance.
Requiiidai..-Fropose at least two goals for each dimension, and explain why those goals are impor-
' . - - tant to the overall success of the pizza parlor One goal should be purely performance- oriented, and the other should be risk related.b. Suggest specific measures for each goal developed in part a.
' c. Explain how to gather the data needed for each measurc developed in part b.
16.5. Use Table 16-1 to create a questionnairc checklist that can be used to evaluate controls intlte general ledger and reporting cycle.a. For each control issue, write a Yes/No question such that a "No" answer represents a
control yeakness. For example, one question might be "Is access to the general ledger
restrictdd?"b. For each YesA.lo question, wdte a bdef explanation of why a "No" answer rcpresents a
control weakness.
16.6. Visit the SEC website (www.sec.gov), and explore what is available in terms of interac-
tive data (the SEC'S term for XBRL reports). Use the SEC'S viewer software, and exam-
ine the annual reports for lwo companies.
16.7. Obtain the annual report of a company assigned by your professor Read the management
discussion and analysis section, and develop a balanced scoreca.rd that reflects that com-
pany's vision, mission, and strategy. Create both performance-oriented and risk-based
goals and measures for each section of the balanced scorecard.
16.8. Exbel Problem. Objective: Practice graph design principles.
Required (continues on next page)
Use the data in Table 16-3 to create the following graphs:
a. Sales
b. Sales and Gross Marginc. Eamilgs per Share
TABLE 16-3 Data for Problem l6-8
2006200820092010
Sales
Cost of Goods Sold
Gross Margin
Eamings Per Share
598,000
350,000
248,000
12.52
640,000
400,000
240,000
t2.10
575,000
375,000
200,000
11.95
s60,000
330,000
230,000
11.66
530,000
300,000
230,000
10.50
PART lll . ACCOUNTING INFORMATION SYSTEMS APPLICATIONS
Which principles of gaph desiSn, if any, did you have to manually implement to
override the default graphs created by Excel?
16.9- Exdel ProblemI
Objective: Create pivot tables for what-if aualysis.
Rlquired I
Rehd the article "Make Excel an Instant Know-It-AIl" by Roberta Ann Jones in the
March 2004 issue of the Joumal of Accoantancy (a\allable at www.aicpa.org).
a. Follow the instructions in the article to create a spreadsheet with pivot tables.
b. Print out a report that shows sales by month for each salesperson.
c. Assume that Brown and David are in sales group 1 and that the other three salespeo-
ple are in sales group 2. Print out a report that shows monthly sales for each group.
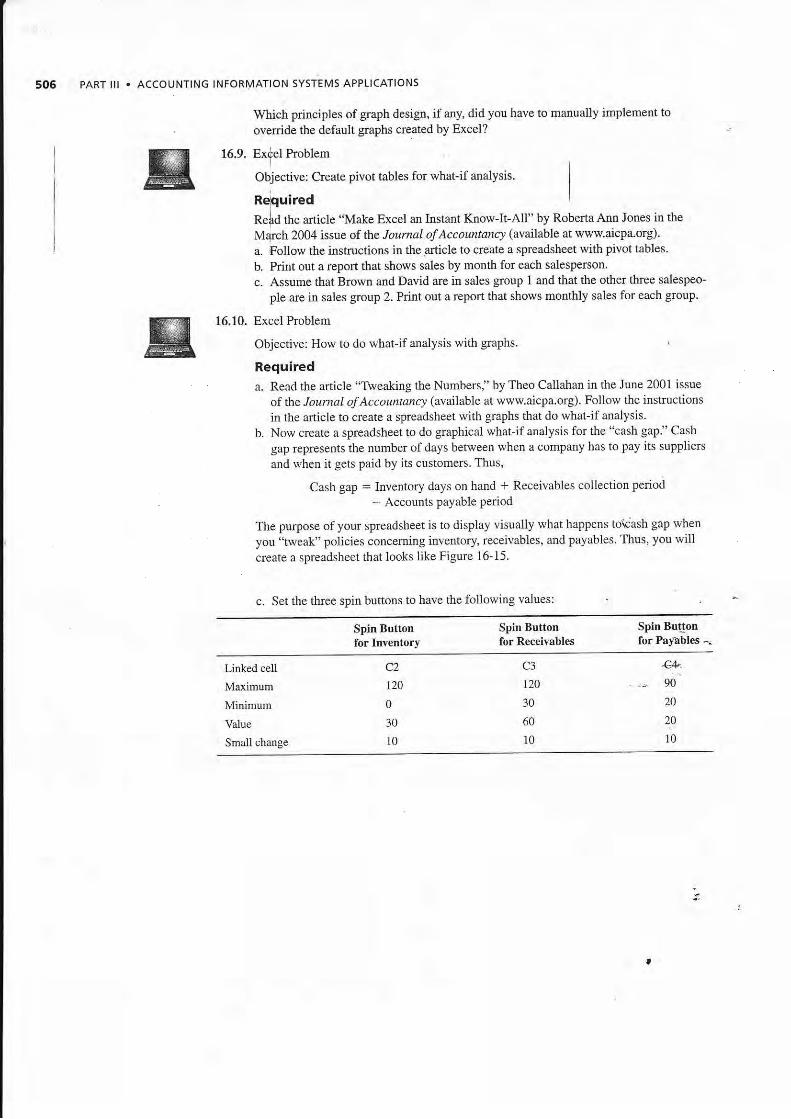
g'"'" ::::lui::*todowhat-iranarysiswith graphs.
Requireda. Read the article "Tweaking the Numbers," by Theo Callahan in the June 2001 issue
of the Joumal ofAccountancy (avalTable at www.aicpa.org). Follow the instructions
in the article to create a spreadsheet with graphs that do what-if analysis.
b. Now creaie a spreadsheet to do graphical what-if analysis for the "cash gap." Cash
gap represents the number of days between when a company has to pay its suppliers
and when it gets paid by its custome$. Thus,
Cash gap : Inventory days on hand * Receivables collection period
- Accounts payable Period
The purpose of your spreadsheet is to display visually what happens tokash gap when
you "tweat" policies conceming inventory, receivables, and payabtes. Thus, you willcreate a spreadsheet that looks like Figure l6-15.
c. Set the thrce spin buttons to have the following values:
Spin Buttonfor Inventory
Spin Buttonfor ReceiYables
Spin Buttotrfor Payables -.
Linked cell
Maximum
Minimum
Value
Small change
c2120
0
30
10
C3
120
30
60
l0
4!. .,." 90
20
29
t0
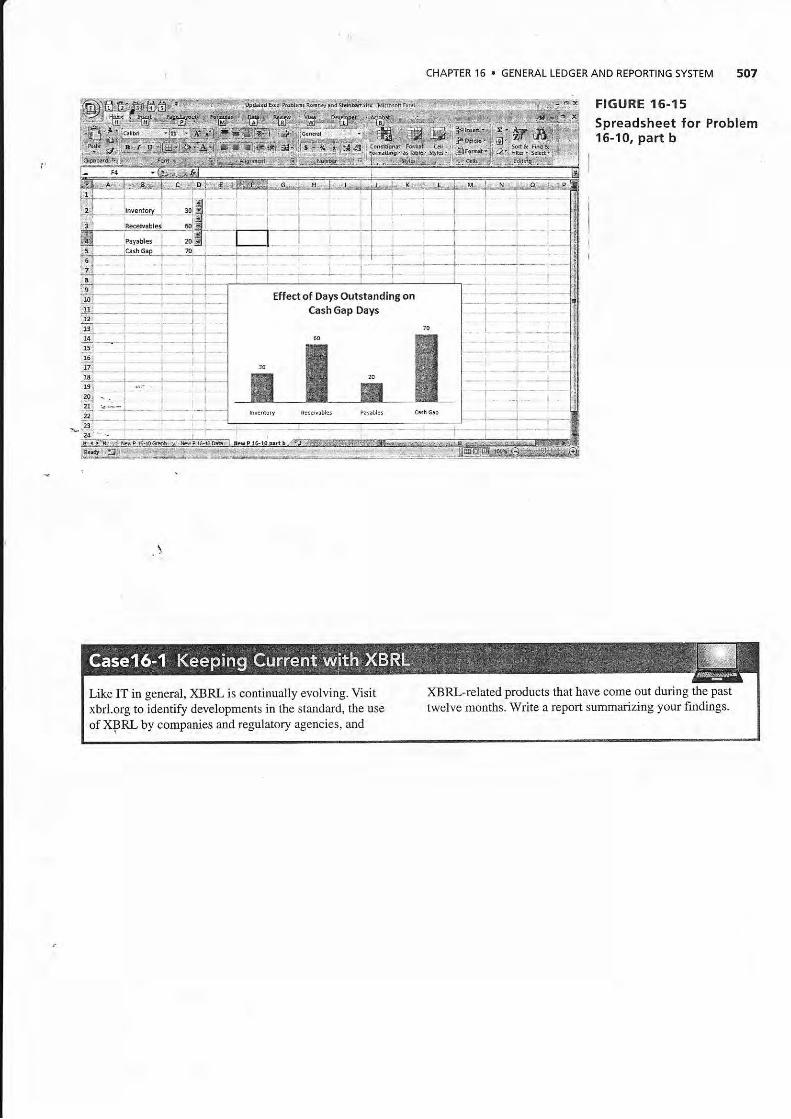
CHAPTER 16 . GEN ERAL LEDGER AND REPORTING sYsTEM 507
FIGURE 16-1 5
Spreadsheet for Problem16-10, part b
Like IT in general, XBRL is continually evolving. Visitxbrl.org to identify developments in the standard, the use
of XPRL by companies and regulatory agencies, and
XBRl-related products that have come out during the past
twelve months. W te a report summarizing your findings.

508 PART lll . ACCOUNTING INFORMATION SYSTEMS AppLtCATIONS
Accounting magazines such as loumal of Accountancy andS\tategic Finance periodjcally publish reviews oI accountings$ftware. Obtain a copy of a recent software review anicle. andrdad its commens about a general ledger package to rhich youhave access. Using the software, write a report that indicateswhether, and why, you agree or disagree with the review's opin-ioff about lhe following features of the general ledger package:
a. Ease of installationb. Flexibility in the initial setup ofthe charr of accounts and
during subsequent modifications
c. Frequency of updates from subsystems (sales, cashreceipts, etc.) i
d. Control procedu{es available to restrict accesse. Control.procedurles to ensure accuracy of input and
processrng :
f. Repon flexibility,(how easy il is to design reports, erc.)g. Adequacy o[ *le audit trail (e.g.. what reference data are
automatically provided versus how much of the audit trailhas to be manually consrructed)
.,!,,/;-:r i,{x\f m,#]flf ffi ,flqc S#f, {"d?-$ffi ru'S,i"2lu;i= Ke1,'
1. From where do adjusting entries usually come?a. tueasurcr (Inconect. Adjusting entries are entered by the controller aftdf.the trial
balance has been prepared. The treasurer makes regularjournal entdes to rccordfinancing activities, such as issuing or retiring debt.)
:. contoller (Corect. Adjusting entries are entered by the conholler after the trialbalance has been prepared.)
c. various accounting cycle subsystems, such as sales order entry (Incorect. Subsystemssend summary regularjoumal entries, not adjusting entries, to the general ledger.)
d. unit managers (Incorrect. Unit managers should not make any journal entries.) -2, Preparing performance reports that contain data or y about items that a specifrc organiza-
tional unit controls is an example of which of the following? -='-a, flexible budget system (Incorrect. Flexible budgets adjust targets based on aetual inputs.)
iI o. responsibility accounting system (Corect. This is the essence and purpose of responsi-bility accounting.)
c. closing the books (Incorrect. Closing the books is a process performed at the end ofa fiscal period to prepare financial statements.)
d. management by exception (Incorrect. Management by exception is a repotingtechnique that focuses on unusual variations from standards.)
3. The definition of an XBRL element, including such information as whether its normalaccount balance is a debit or a credit, is found in which of the following?a, linkbase (Incorect. The linkbase files in the taxonomy provide information about
relationships among elements.)b. instance document (Incorect. The instance document contains the value of an element
and contextual information, but not its full dehnition.),,- t , schema (Correct. The schema file in the taxonomy contains definitions of XBRL i
elements.)d. style sheet (Incorrect. The style sheet specifies how to display an instance document
on either a computer screen or on a printed report.)

CHAPTER 15 . GENERAL LEDGER AND REPORTING SYSTEM
4. Which of the following shows the implied linkages among the portions of the balancedscoretard?a. Financial J Intemal , Innovation and leaming -+ Customer (Incorrect.)
) b. Innovation and learDirg -+ Intemal --) Customer -t Financial (Correct. The theoryunderlying the balanced scorecard is that leami4g and innovation will improve internal
i measures of perfomance, which will in turn imfrove customer satisfaction, which willlhen be reflected in betler financial performancd.l
c. Customer -+ Fina[cial -) Intemal -J Innovation and leaming (Incorrect.)d. Intemal -, Customu -+ Innovation and leaming -J Financial (Incorlect.)
5. Which of the following XBRL documents contains the acfual data values for a company'snet income for a particular year?
a. style sheets (Incorect. Style sheets provide information about how to display theinformation in an instance document.)
b. schema (Incorrect. Schemas define elements of financial statements, such as netincome, but do not provide actual data values for those elements.)
c.- linkbases (Incorect. Linkbases describe relationships among taxonomy elements.)) d. instance document (Corect. An instance document contains specific values for finan-
cial statement elements.)
6. -ltre nJmUer of orders shipped per warehouse worker each day is a metric t}tat would'ii'6'st
likely appear in which part of the balanced scorecard?
=- . a. innovation aad leaming (Incorrect. The proposed metric is a measure of process effi-- ciency and, therefore, would appear in the intenal operations section ofthe balanced
scorecard.)' b. customer (Incorect. The proposed metric is a measure of process efficiency and,
therefore, would appear in the intemal operations section of the balanced scorecard.)> c. irtemal operations (Corect.)
d. financial (Incorrect, The proposed metuic is a measure ofprocess efficiency and, there-fore, would appear in the intemal operations section of the balanced scorecard.)
\7. Which of'the following is an important part of the audit trail?) a. joumal vouchers (Corect. Joumal vouchers provide information concerning the
source of changes to the general ledger accounts.)b. flexible budgets (Incorrect. Flexible budgets are a pedormance evaluation tool.)c. trial balance (Incorrect. The fiial balance is a step in the preparation of financial
statements.)d. data warehouse (Incorrect. A data warehouse is used for business intelligence.)
8. An adjusting joumal enfty to record interest revenue that has been earned but not yetreceived is an exampte of which of the following?
) a. accrual (Correct.)b, deferral (Incorrect. A deferral would involye postponing recognition of at event for
'which cash has already been exchanged in advance of performing the event.)c. estimate (Incorect. An estimate is an entry used to record the results ofjudgmental
analysis. )
d. revaluation (Incorrect. A revaluation entry is used to correct a prior error.)
9. Which of the following is designed primarily to improve the efficiency of financialreporting?a. XML (Incorrect. XML is a general-purpose language but is not designed for financial
reportirg.)) b. XBRL (Correct. The extensible Business Reporting Language was developed, in part,
by accountants to facilitate business reporting.)c. IFRS (Incorrect.IFRS is an altemative to GAAP.)d. the The balanced scorecard (Incorrect. The bala[ced scorecard is a multidimensional
performance repon..1
510
I
PART III . ACCOUNTING INFORMATION SYSTEMS APPLICATIONS
10. Which of the following graph design principles is most important for ensuring thatfinancial data is accurately interpreted?a. including a title that summarizes the point of the graph (Incorrect. This principle
improves readability but is not specifically designed to ensure that the graph isaccurarely interpreted.)
I
b. attaching data values to specific element{ in tire graph tlncorrect. This principlefacilitates making mental calculations but is not specifically designed to ensurc thatthe graph is accurately interpreted.)
> c. starting the ,-axis of the gaph at zero (Corect. Starting the y-axis at zero accuratelydepicts the magnitude of changes in the data.)
d. using different colors for different variables (Incorrect. This principle improvesreadability but is not specifically designed to ensure that the graph is accuratelyinterpreted.)