Embed Size (px)
Citation preview

I‐95 Corridor
Transit and TDM Plan
Technical Memorandum #2: I‐95 Corridor Transit and TDM
Needs
DRAFT
Prepared for:
Prepared by:
September 20, 2011

I‐95 Transit and TDM Plan Page i September 20, 2011 Tech Memo #2 – I‐95 Corridor Needs (Draft)
Table of Contents
1.0 Introduction ............................................................................................................................. 1
2.0 Non‐Rail Park‐and‐Ride Lot Needs Assessment ......................................................................... 3
2.1 Fairfax County District Needs Assessment .................................................................................... 3
2.2 Prince William District #1 .............................................................................................................. 6
2.3 Prince William District #2 .............................................................................................................. 8
2.4 Prince William District #3 ............................................................................................................ 10
2.5 North Stafford County District .................................................................................................... 12
2.6 South Stafford County District .................................................................................................... 13
2.7 Spotsylvania County/Fredericksburg District .............................................................................. 15
2.8 Summary of Non‐Rail Park‐and‐Ride Space Needs ..................................................................... 17
3.0 Bus Transit Services ................................................................................................................ 19
3.1 Fairfax County Needs Assessment .............................................................................................. 19
3.2 Prince William County Needs Assessment .................................................................................. 22
3.3 Stafford and Spotsylvania Counties Needs Assessment ............................................................. 26
3.4 BRAC‐Related Needs Assessment ............................................................................................... 29
3.5 Summary of Transit Service Needs ............................................................................................. 30
4.0 Virginia Railway Express Service and Facilities ........................................................................ 33
5.0 Transportation Demand Management Programs .................................................................... 38
6.0 Destination End Facilities ........................................................................................................ 44

I‐95 Transit and TDM Plan Page 1 September 20, 2011 Tech Memo #2 – I‐95 Corridor Needs (Draft)
1.0 Introduction Virginia is addressing critical transportation needs for the I‐95 Corridor. Through a concurrent package of improvements, the Commonwealth will deliver congestion relief, enhance transit and provide new choices on I‐95. These concurrent efforts related to the overall strategy to enhance travel and safety are listed below.
1. I‐95 HOT/HOV Lanes 2. VDOT Seminary HOV/Transit ramp 3. Transit Improvements
The I‐95 Corridor Transit and TDM Plan is being developed to provide the Commonwealth of Virginia with recommendations for transit and Transportation Demand Management (TDM), including both operations and capital investments, to complement the I‐95 HOT/HOV lanes improvements. It pivots off of the 2008 DRPT I‐95/I‐395 Transit/TDM Study. This plan is being developed with the intent of maximizing utilization of the HOT/HOV lanes network and responding to the demand for increased public transportation and ridesharing. The I‐95 Transit and TDM Plan is being developed in collaboration with the Secretary of Transportation and the Virginia PPTA (Public‐Private Transportation Act) Office. A multi‐jurisdictional Stakeholder Group was formed early in the study process to provide technical input into the study, with meetings at three key points during the course of the study. This second Technical Memorandum presents a refined assessment of transit and TDM service and facility needs for the I‐95 corridor. Specifically, it addresses transit and TDM service and facility improvements that would maximize the capacity of the I‐95 HOT/HOV lanes, as well as other needs in the larger I‐95 corridor. The prior study effort involved extensive stakeholder outreach efforts and technical analyses that included travel demand modeling. This current study effort is much shorter in duration, and does not include ridership forecasting efforts with the travel demand model. Therefore, this current work effort has concentrated on refining service and facility need recommendations from the prior study through completion of the following steps:
Identify existing service and facility deficiencies.
Review and document recommendations from the prior I‐95/I‐395 Transit & TDM Study. The prior study identified service and facility needs through 2030, of which a portion of those recommendations were included in the study’s Fiscally Constrained Plan.
Review and document recent plans and projects that have occurred since completion of the prior study.
Review and document anticipated demographic growth within the corridor through 2035.
Discuss and gather input on needs plan recommendations with affected corridor stakeholders.
Based on the assessment of current deficiencies, recent plans and projects, anticipated demographic growth, and corridor stakeholder input, either validate prior study’s identified needs, or revise the list of service and facility needs.

I‐95 Transit and TDM Plan Page 2 September 20, 2011 Tech Memo #2 – I‐95 Corridor Needs (Draft)
The above approach has been applied to the following subject areas:
Non‐rail park‐and‐ride lots
Bus transit services
VRE services and facilities
TDM programs
Destination end facilities Needs within each subject area have been identified primarily to maximize the capacity of the I‐95 HOT/HOV lanes south of I‐495. Other relevant, but not directly related, needs within the larger I‐95 corridor area have also been identified.

I‐95 Transit and TDM Plan Page 3 September 20, 2011 Tech Memo #2 – I‐95 Corridor Needs (Draft)
2.0 Non‐Rail Park‐and‐Ride Lot Needs The prior I‐95/I‐395 Transit and TDM Study identified an overall need for an additional 2,935 non‐rail park‐and‐ride spaces in the Fairfax and Prince William Counties portion of the corridor. Of this total, 1,900 spaces were included in the study’s Fiscally Constrained Plan. This study also identified the need for an additional 3,375 spaces in the Stafford and Spotsylvania Counties portion of the corridor. Of this total, 2,600 spaces were included in the Fiscally Constrained Plan. In total, the prior study identified a corridor need for 6,310 non‐rail park‐and‐ride spaces, of which 4,500 spaces were included in the study’s Fiscally Constrained Plan. To determine if the prior study’s stated needs were still valid, the I‐95 corridor was divided into the following seven (7) districts south of I‐495:
Fairfax County District
Prince William District #1 (Lake Ridge Area)
Prince William District #2 (Dale City/Potomac Mills area)
Prince William District #3 (Dumfries/Montclair area)
North Stafford County
South Stafford County
Spotsylvania County/Fredericksburg Existing park‐and‐ride utilization was determined for each defined district to identify existing park‐and‐ride lot deficiencies. Prior I‐95/I‐395 Transit and TDM Study recommendations were reviewed, and known park‐and‐ride expansion plans were documented. Demographic forecasts for each district were then determined, and an assessment was then made on whether the prior study’s stated needs were still valid, or if there was a basis to modify those recommendations. All of the park‐and‐ride improvements discussed in this section would maximize the capacity of the I‐95 HOT/HOV lanes.
2.1 Fairfax County District Needs Assessment Existing Park‐and‐Ride Lot Utilization The “Fairfax County District” portion of the I‐95 corridor and locations of non‐rail park‐and‐ride lots in this district is illustrated in Figure 2‐1. Estimated lot capacities and lot occupancy rates are presented in Table 2‐1 (source: VDOT 2010 park‐and‐ride inventory and Fairfax County TDP). The overall park‐and‐ride lot supply for this district is estimated at 2,806 spaces, and the occupancy rate for this district is 66 percent. However, it is important to look closer at the occupancy rates of individual lots. The Fairfax Connector provides service to two park‐and‐ride lots (the Sydenstricker and Backlick North park‐and‐ride lots are served by Route 380‐D). Recent lot counts indicate the Sydenstricker lot is operating above capacity. The American Legion Post and Springfield Methodist Church lots are also operating at capacity. However, recent observations indicate that perhaps demand at these lots have eased somewhat with the addition of the Circuit City lot. The Rolling Valley park‐and‐ride lot is served by Metrobus 18, and is 70 percent utilized. It is important to note, that lots in this district are used by a variety of users. In addition to use by commuter routes (18 and 380‐D), lots are used by park‐and‐riders

I‐95 Transit and TDM Plan Page 4 September 20, 2011 Tech Memo #2 – I‐95 Corridor Needs (Draft)
going to/from Franconia‐Springfield Metrorail Station via local bus routes, carpoolers and sluggers (slugging occurs at the Rolling Valley park‐and‐ride lot and at the Circuit City park‐and‐ride lot).
Figure 2‐1 Fairfax County District Park‐and‐Ride Lot Locations
Table 2‐1 Fairfax County District Park‐and‐Ride lot Inventory
Note: Lots shown in red are near or at capacity.
Lot Name Lot Location Lot Capacity Lot Occ. Pct. Occ.
Rolling Valley Old Keene Mill Road and Shiplett Boulevard 664 463 70%Springfield Mall - Macy's Deck Spring Mall Dr. Macy's garage 500 410 82%Backlick North 6831 Backlick Road, Springfield 279 109 39%Circuit City Site 7039 Old Keene Mill Road, Springfield 270 130 48%Springfield Plaza Bland St. btwn Old Keene Mill Rd and Amherst Ave 254 254 100%Gambrill Lot Gambrill Road at Hooes Road 225 137 61%Sydenstricker Road Sydenstricker Road at Hooes Road 170 174 102%Lorton Lot Gunston Cove Road at Lorton Road 170 25 15%American Legion Post Amherst Ave. at Springfield Blvd. 100 100 100%Lorton Market Street 9405 Lorton Market St., Lorton 65 3 5%Springfield Methodist Church 7047 Old Keene Mill Road 57 57 100%South Run District Park Reservation Dr. off of Fairfax County Parkway 52 0 0%TOTAL 2,806 1,862 66%

I‐95 Transit and TDM Plan Page 5 September 20, 2011 Tech Memo #2 – I‐95 Corridor Needs (Draft)
Prior Study Recommendations The prior I‐95/I‐395 Transit & TDM Study identified the following parking needs for the Fairfax County portion of the corridor:
Springfield/Lorton area – 450 additional spaces All 450 spaces were included in the study’s Fiscally Constrained Plan. In addition to these spaces, the prior study noted a need for an additional 1,925 spaces at the Franconia‐Springfield Metrorail Station, which was not addressed as part of the prior study effort. Planned/Programmed Lot Expansion VDOT is proceeding with plans to construct a 600‐space park‐and‐ride lot in the Saratoga area. This lot will be located at the Fairfax County Parkway/Rolling Road/Barta Road interchange (southeast corner of the new interchange). The lot will include direct access onto the eastbound Fairfax County Parkway entrance ramp. This lot is to be open by 2013. Demographic Projections Anticipated population and employment characteristics for this district are noted in Table 2‐2 and reflect an employment growth rate that is higher than the district’s population growth rate.
Table 2‐2 Fairfax County District Demographic Characteristics
Demographic 2011 2015 2020 2035 ‘2035‐2011growth
Population 182,767 188,196 192,980 207,333 13.4%
Employment 75,676 86,324 89,140 97,589 29.0%
Pop/Empl. Ratio 2.42 2.18 2.16 2.12 n/aSource: socioeconomic data used in the MWCOG 2010 Constrained Long‐Range Transportation Plan
Fairfax District Needs The addition of the 600‐space park‐and‐ride lot at Saratoga addresses overall park‐and‐ride lot needs for this district. However, as noted above, lots in the Old Keene Mill Road corridor are well‐utilized. The Saratoga lot provides park‐and‐ride opportunities for residents in the Saratoga area, but is not conveniently located for commuters in the Old Keene Mill Road corridor. Additional spaces are needed in this corridor. To keep up with anticipated population growth, an additional 250 spaces are recommended, in addition to the 600 spaces at the proposed VDOT Saratoga lot. There is an opportunity to expand the “Old Circuit City” lot that the County is pursuing, which can help address this need. It is estimated 180 spaces could be added through the purchase of two adjacent parcels and the addition of surface spaces. More spaces can be obtained by constructing a parking structure on this site (an option presently under consideration by Fairfax County). The need for these additional spaces could become more pronounced should the Springfield Mall redevelopment plans commence, and leased spaces at the Macy’s parking garage are lost. There may also be a greater need for these additional spaces should the HOT lane project result in increased parking demands at Franconia‐Springfield Station.

I‐95 Transit and TDM Plan Page 6 September 20, 2011 Tech Memo #2 – I‐95 Corridor Needs (Draft)
2.2 Prince William District #1 Existing Park‐and‐Ride Lot Utilization The “Prince William District #1” portion of the I‐95 corridor and its existing park‐and‐ride lots are illustrated in Figure 2‐2. Estimated lot capacities and lot occupancy rates are presented in Table 2‐3 (source: VDOT & PRTC park‐and‐ride inventory). There are an estimated 2,224 spaces in this district and the overall occupancy rate is 79 percent. There are four lots presently operating at or over capacity: Lake Ridge, Hechinger’s, Tackett’s Mill and Old Bridge Festival Shopping Center. PRTC OmniRide serves all of these lots. Slugging also occurs at the Old Bridge Road/Route 123 and the Lake Ridge park‐and‐ride lots.
Figure 2‐2 Prince William District #1 Park‐and‐Ride Lot Locations

I‐95 Transit and TDM Plan Page 7 September 20, 2011 Tech Memo #2 – I‐95 Corridor Needs (Draft)
Table 2‐3 Prince William District #1 Park‐and‐Ride Lot Inventory
Note: Lots shown in red are near or at capacity. Prince William County Stadium spaces included in District #2 because of proximity to Prince William County Parkway.
Prior Study Recommendations The prior study did not include any specific plans for park‐and‐ride lot expansion within this district, as it is defined for this study. Planned/Programmed Lot Expansion There are no current plans for lot expansion within this district. Demographic Projections Anticipated population and employment characteristics for this district are noted in Table 2‐3 and reflect an employment growth rate that is similar to the district’s population growth rate.
Table 2‐3
Prince William District #1 Demographic Characteristics Demographic 2011 2015 2020 2035 ‘2035‐2011
growth
Population 69,886 73,792 79,900 98,224 40.6%
Employment 14,573 15,524 16,757 20,455 40.4%
Pop/Empl. Ratio 4.80 4.75 4.77 4.80 n/aSource: socioeconomic data used in the MWCOG 2010 Constrained Long‐Range Transportation Plan
Prince William District #1 Needs As noted above, three lots in this district are currently experiencing demand that exceeds available capacity. At least 150 spaces are needed to bring the utilization rates at these lots down to 90 percent. An additional 950 spaces are needed to keep pace with the anticipated 40.6 percent population growth between 2011 and 2035, resulting in a need for 1,100 spaces, as shown below. Existing deficiency needs – 150 spaces Population growth needs – 950 spaces Total additional spaces – 1,100 spaces
Lot Name Lot Location Lot Capacity Lot Occ. Pct. Occ.Lake Ridge Commuter Lot Minnieville Road & Old Bridge Road 638 632 99%Hechinger's - Old Bridge & Rte 123 Intersection Rte 123 and Old Bridge Road 580 598 103%I-95/123 Loop Interchange Intersection I-95 and Rte 123, Exit 160 580 292 50%Harbor Drive Harbor Drive and Minnieville Road 200 0 0%Tackett's Mill Specialty Center Minnieville Rd & Old Bridge Rd in shopping center 170 169 99%Old Bridge Festival Shopping Center Old Bridge Road and Smoketown Road 56 56 100%TOTAL 2,224 1,747 79%

I‐95 Transit and TDM Plan Page 8 September 20, 2011 Tech Memo #2 – I‐95 Corridor Needs (Draft)
2.3 Prince William District #2 Existing Park‐and‐Ride Lot Utilization The “Prince William County District #2” portion of the I‐95 corridor and locations of park‐and‐ride lots within this district are illustrated in Figure 2‐3. Estimated lot capacities and lot occupancy rates are presented in Table 2‐5 (source: VDOT & PRTC park‐and‐ride inventory). There are an estimated 4,506 spaces in this district and the overall occupancy rate is 85 percent. Lots operating at or over capacity include: Horner Road, Potomac Mills Mall and the PRTC Transit Center (there is an adjacent gravel lot that is accommodating overflow at this location). The Dale City lot is also experiencing higher utilization (especially after the reduction in spaces at Potomac Mills Mall). Significant slugging activity occurs at Horner Road, and also at Potomac Mills Mall.
Figure 2‐3 Prince William District #2 Park‐and‐Ride Lot Locations

I‐95 Transit and TDM Plan Page 9 September 20, 2011 Tech Memo #2 – I‐95 Corridor Needs (Draft)
Table 2‐5 Prince William District #2 Park‐and‐Ride Lot Inventory
Note: Lots shown in red are near or at capacity. Prince William County Stadium spaces included in District #2 because of proximity to Prince William County Parkway.
Prior Study Recommendations The prior study identified a need for a total of 2,000 additional spaces in this area, of which 1,450 were included in the Fiscally Constrained Plan. The prior study’s Fiscally Constrained Plan recommended a 1,200‐space expansion of the Horner Road lot, and a 250‐space expansion in the Potomac Mills area. Planned/Programmed Lot Expansion VDOT is proceeding with construction of a 700‐space lot at Telegraph Road (across from the Horner Road lot and north of Prince William Parkway). This lot is to be constructed by 2012 at an estimated cost of $8 million. These spaces will replace the 725 spaces lost at Potomac Mills Mall. The existing lease of spaces at First Baptist Church will end upon opening of the Telegraph Road lot. Demographic Projections Anticipated population and employment characteristics for this district are noted in Table 2‐6 and reflect an employment growth rate that is much higher than the district’s population growth rate.
Table 2‐6
Prince William County District #2 Demographic Characteristics Demographic 2011 2015 2020 2035 ‘2035‐2011
growth
Population 141,533 149,511 154,321 168,751 19.2%
Employment 32,596 34,933 38,030 47,320 45.2%
Pop/Empl. Ratio 4.34 4.28 4.06 3.57 n/aSource: socioeconomic data used in the MWCOG 2010 Constrained Long‐Range Transportation Plan
Prince William District #2 Needs As noted above, three lots in this district are currently experiencing demand that exceeds available capacity. The proposed Telegraph Road park‐and‐ride lot will address the recent loss of spaces at Potomac Mills Mall. However, additional spaces will be needed to accommodate the anticipated 19 percent growth in population in this district. An additional 950 spaces are estimated to be required to keep pace with population growth between 2011 and 2035. This is within the prior study’s previously proposed 1,200 space expansion at Horner Road.
Lot Name Lot Location Lot Capacity Lot Occ. Pct. Occ.Horner Road Commuter Lot Prince William Parkway at I-95 2,363 2,488 105%Dale City Commuter Lot Minnieville Road and Dale Boulevard 580 544 94%First Baptist Church 13600 Minnieville Road 375 20 5%Potomac Mills Mall Potomac Mills Mall across from Pier I imports 275 275 100%Hillendale Commuter Lot Hillendale Road and Dale Boulevard 248 73 29%Lindendale Commuter Lot Lindendale Road and Dale Boulevard 216 100 46%PRTC Transit Center Potomac Mills Road at Telegraph Road 124 198 160%K-Mart, Dale City Intersection Dale Blvd & Gideon Dr. 90 75 83%Prince William Square Smoketown Road and Gideon Drive 45 0 0%Prince William County Stadium Off Davis Ford Road at Stadium 190 58 31%TOTAL 4,506 3,831 85%

I‐95 Transit and TDM Plan Page 10 September 20, 2011 Tech Memo #2 – I‐95 Corridor Needs (Draft)
2.4 Prince William District #3 Existing Park‐and‐Ride Lot Utilization The “Prince William County District #3” portion of the I‐95 corridor and locations of park‐and‐ride lots within this district are illustrated in Figure 2‐4. Estimated lot capacities and lot occupancy rates are presented in Table 2‐7 (source: VDOT & PRTC park‐and‐ride inventory). There are an estimated 978 spaces in this district and the overall occupancy rate is 99 percent. Most of this district’s parking is at the VDOT US1/Route 234 park‐and‐ride lot. This lot is chronically over‐capacity, with cars parked on adjacent streets. Significant slugging activity occurs at this lot.
Figure 2‐4 Prince William District #3 Park‐and‐Ride Lot Locations
Table 2‐7
Prince William District #3 Park‐and‐Ride Lot Inventory
Note: Lots shown in red are near or at capacity.
Lot Name Lot Location Lot Capacity Lot Occ. Pct. Occ.US 1/VA 234 VA 234 & US 1 843 883 105%Montclair Commuter Lot VA 234 North of Stockbridge Drive 50 38 76%Brittany Neighborhood Park Exeter Drive off VA 234 85 50 59%TOTAL 978 971 99%

I‐95 Transit and TDM Plan Page 11 September 20, 2011 Tech Memo #2 – I‐95 Corridor Needs (Draft)
Prior Study Recommendations The prior study identified a need for 500 spaces in the Dumfries area. These spaces were not included in the Fiscally Constrained Plan. However, the Route 234 lot was being expanded at that time, and it was anticipated that those spaces would address the identified future need. Planned/Programmed Lot Expansion There are no current plans for lot expansion within this district. Demographic Projections Anticipated population and employment characteristics for this district are noted in Table 2‐8 and reflect an employment growth rate that is higher than the district’s population growth rate.
Table 2‐8
Prince William District #3 Demographic Characteristics Demographic 2011 2015 2020 2035 ‘2035‐2011
growth
Population 48,403 53,816 56,211 63,394 31.0%
Employment 24,752 26,804 29,465 37,448 51.3%
Pop/Empl. Ratio 1.96 2.01 1.91 1.69 n/aSource: socioeconomic data used in the MWCOG 2010 Constrained Long‐Range Transportation Plan
Prince William District #3 Needs As noted above, this district has a substantial parking capacity deficiency. Part of the demand at the Route 234 lot may be Stafford County residents. However, there have been no recent surveys to document commuter resident locations at this lot. At least 100 spaces are needed to bring the current utilization rate at this lot down to 90 percent. An additional 300 spaces are needed to keep pace with the anticipated 31 percent population growth in this district, resulting in a need for 400 additional spaces, as shown below. Existing deficiency needs – 100 spaces Population growth needs – 300 spaces Total additional spaces – 400 spaces

I‐95 Transit and TDM Plan Page 12 September 20, 2011 Tech Memo #2 – I‐95 Corridor Needs (Draft)
2.5 North Stafford County District Existing Park‐and‐Ride Lot Utilization The “North Stafford County District” portion of the I‐95 corridor and locations of park‐and‐ride lots within this district are illustrated in Figure 2‐5. Estimated lot capacities and lot occupancy rates are shown in Table 2‐9 (source: VDOT & GWRideConnect park‐and‐ride inventory and counts). There are an estimated 1,575 spaces in this district and the overall occupancy rate exceeds 100 percent. Both lots in this district are chronically over‐capacity, with an on‐going problem of illegally‐parked cars. There is significant carpool, vanpool and slugging activity at both lots.
Figure 2‐5 North Stafford County District Park‐and‐Ride Lot Locations
Table 2‐9
North Stafford County District Park‐and‐Ride Lot Inventory
Note: Lots shown in red are near or at capacity.
Lot Location Lot CapacityGarrisonville Rd. North-Staffordsborough 825Garrisonville Rd. North - Mine Road 750TOTAL 1,575
100%+100%+
Estimated Occ.
100%+

I‐95 Transit and TDM Plan Page 13 September 20, 2011 Tech Memo #2 – I‐95 Corridor Needs (Draft)
Prior Study Recommendations The prior study identified a need for 2,125 spaces in this area. All of these spaces were included in the Fiscally Constrained Plan. A recent park‐and‐ride study conducted by FAMPO has identified a need for 3,650 spaces in this area, based on anticipated demand as identified in the FAMPO Long‐Range Transportation Plan. Planned/Programmed Lot Expansion VDOT is in the process of developing plans to expand the Garrisonville Road North‐Staffordborough Blvd. lot by up to 1,000 spaces. Estimated construction costs for this lot expansion is $5.8 million. The expanded lot is anticipated to be open by 2015, which coincides with the I‐95 HOT/HOV lane opening. Demographic Projections Anticipated population and employment characteristics for this district are noted in Table 2‐10 and reflect an employment growth rate that is similar to the district’s population growth rate.
Table 2‐10
North Stafford County District Demographic Characteristics Demographic 2011 2015 2020 2035 ‘2035‐2011
growth
Population 64,924 72,010 81,198 108,762 67.5%
Employment 16,055 18,899 21,104 27,718 72.6%
Pop/Empl. Ratio 4.04 3.81 3.85 3.92 n/aSource: socioeconomic data used in the FAMPO Long‐Range Transportation Plan
North Stafford County District #1 Needs As noted above, this district has a substantial parking capacity deficiency. VDOT’s planned expansion of the Staffordborough lot is anticipated to alleviate existing deficiencies and address potential demand for a few years. However, to accommodate this district’s anticipated population growth between 2015 and 2035 (51%), an additional 1,300 spaces are anticipated to be needed (in addition to VDOT’s planned 1,000 spaces at the Staffordborough lot).
2.6 South Stafford County District Existing Park‐and‐Ride Lot Utilization The “South Stafford County District” portion of the I‐95 corridor and locations of park‐and‐ride lots within this district are illustrated in Figure 2‐6. Estimated lot capacities and lot occupancy rates are presented in Table 2‐11 (source: VDOT & GWRideConnect park‐and‐ride inventory and counts). There are an estimated 1,785 spaces in this district and the overall occupancy rate is estimated to be approximately 85 percent. Neither lot in this district has chronic capacity problems.

I‐95 Transit and TDM Plan Page 14 September 20, 2011 Tech Memo #2 – I‐95 Corridor Needs (Draft)
Figure 2‐6 South Stafford County District Park‐and‐Ride Lot Locations
Table 2‐9
South Stafford District Park‐and‐Ride Lot Inventory
Note: Lots shown in red are near or at capacity.
Prior Study Recommendations The prior study did not specifically identify a need for parking spaces in this geographic area. Planned/Programmed Lot Expansion VDOT is in the process of developing plans to expand the Garrisonville Road North‐Staffordborough Blvd. lot by up to 1,000 spaces. Estimated construction costs for this lot expansion is $5.8 million. The expanded lot is anticipated to be open by 2015, which coincides with the I‐95 HOT/HOV lane opening. There are no current plans for lot expansion within this district.
Lot Location Lot CapacityRoute 630 - Stafford 750Falmouth (Route 17) 1,035TOTAL 1,785 85%
Estimated Occ.
<85%85%+

I‐95 Transit and TDM Plan Page 15 September 20, 2011 Tech Memo #2 – I‐95 Corridor Needs (Draft)
Demographic Projections Anticipated population and employment characteristics for this district are noted in Table 2‐12 and reflect a population growth rate that is much higher than the district’s projected employment growth rate.
Table 2‐12 South Stafford County District Demographic Characteristics
Demographic 2011 2015 2020 2035 ‘2035‐2011 growth
Population 38,338 48,665 55,197 74,792 95.1%
Employment 21,811 24,412 26,881 34,286 57.2%
Pop/Empl. Ratio 1.76 1.99 2.05 2.18 n/aSource: socioeconomic data used in the FAMPO Long‐Range Transportation Plan
South Stafford County District Needs As noted above, this district does not have a current parking capacity deficiency. However, this district is anticipated to experience a 54 percent population growth rate between 2015 and 2035. To accommodate this growth rate, it is estimated that an additional 950 spaces are needed in this district.
2.7 Spotsylvania County/Fredericksburg District Existing Park‐and‐Ride Lot Utilization The “Spotsylvania County/Fredericksburg District” portion of the I‐95 corridor and locations of park‐and‐ride lots within this district are illustrated in Figure 2‐7. Estimated lot capacities and lot occupancy rates are presented in Table 2‐13 (source: VDOT & GWRideConnect park‐and‐ride inventory and counts). There are an estimated 2,165 spaces in this district and the overall occupancy rate is estimated to be approximately 85 percent. Utilization rates at both lots along Route 3 are nearing capacity.

I‐95 Transit and TDM Plan Page 16 September 20, 2011 Tech Memo #2 – I‐95 Corridor Needs (Draft)
Figure 2‐7 Spotsylvania County /Fredericksburg District Park‐and‐Ride Lot Locations
Table 2‐11
Spotsylvania County/Fredericksburg District Park‐and‐Ride Lot Inventory
Note: Lots shown in red are near or at capacity.
Prior Study Recommendations The prior study identified a need for 1,250 spaces in this area of the corridor. The Fiscally Constrained Plan included 475 of these 1,250 spaces. A recent park‐and‐ride study conducted by FAMPO has identified a need for 1,100 additional spaces in the Route 3 area, and an additional 1,200 spaces in the Massaponax area, based on anticipated demand as identified in the FAMPO Long‐Range Transportation Plan.
Lot Location Lot Capacity
Rte 3 West/Gordon Road 645Route 3 East/Salem Church Road 705
VA 208/Houser Drive 815TOTAL 2,165
Estimated Occ.
90%+90%+
<75%85%+

I‐95 Transit and TDM Plan Page 17 September 20, 2011 Tech Memo #2 – I‐95 Corridor Needs (Draft)
Planned/Programmed Lot Expansion VDOT is planning to add up to 1,000 spaces in the Route 3 corridor. Two potential sites have been identified. Estimated opening year is 2017. Demographic Projections Anticipated population and employment characteristics for this district are noted in Table 2‐14 and reflect population and employment growth rates that are similar.
Table 2‐14 Spotsylvania County/Fredericksburg District Demographic Characteristics
Demographic 2011 2015 2020 2035 ‘2035‐2011 growth
Population 107,337 116,848 129,130 165,974 54.6%
Employment 53,145 56,741 63,104 82,192 54.7%
Pop/Empl. Ratio 2.02 2.06 2.05 2.02 n/aSource: socioeconomic data used in the FAMPO Long‐Range Transportation Plan
Spotsylvania County/Fredericksburg District Needs Expansion of park‐and‐ride spaces in the Route 3 corridor (up to 1,000 spaces) is anticipated to address near‐term park‐and‐ride demands through 2020. Beyond that, an additional 1,325 spaces are anticipated to be needed to keep pace with this district’s anticipated 42 percent population growth rate between 2020 and 2035.
2.8 Summary of Non‐Rail Park‐and‐Ride Space Needs The district‐level assessment of existing park‐and‐ride lot utilization and anticipated expansion needs presented in this Technical Memorandum has resulted in the determination of needs that are greater than what was proposed in the prior I‐95/I‐395 Transit and TDM Study. Expansion needs that are anticipated to be needed to address existing lot capacity deficiencies and anticipated population growth within the I‐95 travel shed corridor are as follows: Additional Space Needs in Fairfax & Prince William Counties 4,000 spaces Additional Space Needs in Stafford and Spotsylvania Counties 5,575 spaces Total Estimated Park‐and‐Ride Space Requirement 9,575 spaces The estimated need of 9,575 spaces is much higher than the prior study’s estimated need of 6,325 spaces. As noted in the prior sections, VDOT is proceeding with plans to construct 3,300 spaces. Thus, the estimated net additional need is for 6,275 spaces. Although this need is higher than what was identified in the prior study, it is supported by the following observations:
Since completion of the prior study, park‐and‐ride spaces have been added in the corridor, yet utilization rates have increased, with select lots continuing to have chronic capacity issues.

I‐95 Transit and TDM Plan Page 18 September 20, 2011 Tech Memo #2 – I‐95 Corridor Needs (Draft)
Since completion of the prior study, FAMPO has initiated a study that is determining potential sites for an additional 5,950 spaces in the I‐95 corridor (at Garrisonville Road, Route 3, and the Massaponax areas). This estimated need is similar to the need for 5,575 spaces that has been identified in this study effort.
Park‐and‐ride space needs for the I‐95 corridor were discussed with corridor stakeholders, all of which expressed an opinion that the current need for park‐and‐ride lot expansion was likely greater than what was identified in the prior study.
A summary of revised park‐and‐ride space requirements for the I‐95 corridor is presented below in Table 2‐15. Although space requirements are shown by district, flexibility should be provided to shift supply based on land availability and anticipated transit services within each district.
Table 2‐15 Summary of Revised Park‐and‐Ride Space Needs Estimates
Corridor Area District Needs Estimate
VDOT Programmed Spaces
Remaining P&R Space Needs
North Corridor Fairfax 850 600 250
P.W. District #1 1,100 0 1,100
P.W. District #2 1,650 700 950
P.W. District #3 400 0 400
North Corridor Total 4,000 1,300 2,700
South Corridor North Stafford 2,300 1,000 1,300
South Stafford 950 0 950
Spotsy./Fred. 2,325 1,000 1,325
South Corridor Total 5,575 2,000 3,575
Entire Corridor 9,575 3,300 6,275

I‐95 Transit and TDM Plan Page 19 September 20, 2011 Tech Memo #2 – I‐95 Corridor Needs (Draft)
3.0 Bus Transit Service Expansion Needs The prior I‐95/I‐395 Transit and TDM Study identified a need for significant expansion of bus services in the corridor. To determine if the prior study’s stated needs were still valid and appropriate, recommendations from the prior study were identified at a county‐level basis (similar to the methodology followed for the park‐and‐ride assessment). Existing bus service utilization was considered, and current service plan proposals were obtained from the corridor’s service providers. Demographic forecasts for each district were determined to assess whether the prior study’s stated service needs were still valid, or if there was a basis to modify those recommendations.
3.1 Fairfax County Needs Assessment Existing Bus Service Characteristics This area of the I‐95 corridor is served by both Fairfax Connector and Metrobus routes. Routes that operate on I‐95/I‐395 to/from the Pentagon Metrorail station from this portion of the I‐95 corridor are as follows:
Route 18 E/F/G/H/J/P – There are 22 a.m. peak direction and 29 p.m. peak direction trips on these route patterns that operate to and from the Pentagon. The Rolling Valley park‐and‐ride lot is the anchor for some of these trips. Other park‐and‐ride lots that are served by these patterns of Route 18 include Springfield Plaza, the Circuit City site, the American Legion Post and Springfield Methodist Church. Three of these lots currently operate at or beyond capacity. Ridership data from WMATA indicates that typical loads on the 18E and 18P are 15‐20 riders per trip, and ridership loads on the 18G/H are 30‐35 riders per trip.
Route 380‐D – This Fairfax Connector route provides service along Franconia‐Springfield Parkway and provides service to the Gambrill and Backlick North park‐and‐ride lots. There are 11 a.m. and 11 p.m. peak direction trips to/from the Pentagon on this route. Ridership data from Fairfax Connector suggests that typical loads are around 25 riders per trip.
There are also several Fairfax Connector routes that provide service in the I‐95 corridor to and from the Metrorail Blue Line’s Franconia‐Springfield Station. Those include:
171 – Richmond Highway
304‐ Saratoga
305 – Newington Forest
310 – Franconia Road‐Rolling Valley
321/322 – Springfield Clockwise/Counterclockwise
331/332 – I‐95 Clockwise/Counterclockwise
I‐95 Transit and TDM Plan Page 20 September 20, 2011 Tech Memo #2 – I‐95 Corridor Needs (Draft)
Prior Study Recommendations The prior study identified the following three potential new routes for the Fairfax County portion of the corridor:
Lorton VRE‐EPG‐Ft. Belvoir Shuttle
Franconia‐Springfield Metro‐EPT‐Ft. Belvoir Shuttle
Lorton/Laurel Hill‐EPG‐Pentagon Express The Lorton/Laurel Hill‐EPG‐Pentagon Express route was not included in the prior study’s “Refined Alternative.” Only the Lorton VRE‐EPG‐Ft. Belvoir shuttle was included in the Fiscally Constrained Plan. Planned/Programmed Transit Services Since completion of the prior I‐95/I‐395 Transit & TDP Study, Fairfax County has completed a TDP that includes detailed service recommendations for this portion of the I‐95 corridor. Fairfax County is proceeding with implementation of many of the service proposals that were identified in the TDP, with some adjustments to the original TDP service plans. Current County service plans that are proposed for implementation this fall include the following: I‐495 HOT/HOV Lane Express Routes to Tysons
Sydenstricker‐Lorton park‐and‐ride‐Lorton VRE‐Tysons
Franconia/Springfield‐Tysons
Burke Centre‐Tysons (non‐I‐95 corridor service)
All routes would operate at 15‐minute frequencies in the peak periods I‐95/I‐395 Express Routes
Route 380‐D would be re‐labeled as Route 395, with no change in service Fairfax Connector Local Route Changes
Route 171 would be broken into two routes – 171 and 371. Route 171 would terminate at Lorton VRE, and Route 371 would operate from Lorton VRE to Franconia‐Springfield.
Route 331 and 332 (I‐95 circulators) would be re‐labeled as Routes 333/334, with new routing.
Routes 305 and 307 would be combined and called Route 305. Fort Belvoir Service
A new route has recently been proposed from Franconia‐Springfield Metrorail to Fort Belvoir. This route would be either Metro or Connector‐operated.
Fairfax County District Service Needs As noted above, several service changes are to be implemented this Fall by Fairfax Connector, thus are considered as “committed” service improvements. Other service modifications from the Fairfax County TDP that would benefit the Fairfax County portion of the I‐95 corridor have also been identified. As noted in Section 3.0, VDOT will soon start construction on the Saratoga park‐and‐ride lot. Some of the improvements would serve this new park‐and‐ride lot.

I‐95 Transit and TDM Plan Page 21 September 20, 2011 Tech Memo #2 – I‐95 Corridor Needs (Draft)
Maximization of I‐95 HOT/HOV Lane Capacity Some service plans are already under development for implementation in the fall of 2011 that would maximize the capacity of the I‐95 HOT/HOV lanes. These are as follows:
Re‐label Fairfax Connector Route 380‐D as Route 395.
Proposed I‐95/I‐495 service using the I‐495 HOT/HOV lanes, from both Sydenstricker‐Lorton VRE and Franconia‐Springfield Metrorail.
Additional needs have also been identified through this study effort, as follows:
Restructure Metrobus Route 18. In the near‐term, Routes G/H and P alignments should be streamlined. Routes 18E/F should be extended south to provide service to the Saratoga park‐and‐ride lot. This provides a means to provide express service between Saratoga and the Pentagon Station, without increasing bus volumes at the Pentagon.
Restructure committed I‐95/I‐495 service to and from Tysons Corner to include service to the Saratoga park‐and‐ride lot. This should include restructuring the Sydenstricker‐Lorton VRE‐Tysons route to include a stop at Saratoga, as well as extending the proposed Franconia‐Springfield Metrorail‐Tysons route pattern to begin/end at Saratoga.
Begin new service from Saratoga park‐and‐ride to/from the Pentagon Station. It is recommended that this new service include at least 5 a.m. and 5 p.m. trips. It was previously noted that the extension of Routes 18 E/F to the Saratoga park‐and‐ride was recommended as a near‐term service change. Longer‐term, as demand increases, there may be the need to operate a new route that provides direct service to/from the Pentagon Station. It is important to note, however, that bus bay capacity at Pentagon Station is very constrained. Thus, the implementation of this route would require adjustments in schedules of other Pentagon routes, or require the routing of this or other corridor routes other destinations, such as the Franconia‐Springfield Metrorail station.
The additional service needs maximizing the capacity of the I‐95 HOT/HOV lanes are estimated to add 3,953 annual revenue‐hours of service. This is in addition to revenue‐hours already identified in the Fairfax TDP. Other I‐95 Corridor Needs Service needs that would not directly maximize the capacity of the I‐95 HOT/HOV lanes have also been identified. Route modifications for which service plans are currently under development are as follows:
Restructure Fairfax Connector Route 171/371
Modify Fairfax Connector Route 331/332 into Route 333/334 I‐95 circulators
Modify Fairfax Connector Route 305/307 and label as Route 305

I‐95 Transit and TDM Plan Page 22 September 20, 2011 Tech Memo #2 – I‐95 Corridor Needs (Draft)
Additional needs have also been identified through this study effort, as follows:
Replace Metrobus Route 18R and 18S with Route 18A and 18B
Fairfax Connector Route 304 – Restructure alignment and operate at 30 peak/60 midday (this route alignment adjustment could provide direct service from the Saratoga park‐and‐ride lot to Franconia‐Springfield Station).
Fairfax Connector Route 310 – Improve peak period frequencies from 30 to 20 minutes
Fairfax Connector Route 321/322 – Improve service frequencies to 20 peak/30 midday
Implement new Fairfax Connector Routes 341/342 – Springfield Circulator at 12 peak/12 midday frequencies. This circulator could provide connectivity between off‐site parking in the Springfield area and the Franconia‐Springfield Metrorail station.
Implement a Saratoga‐Fort Belvoir shuttle Fairfax Connector route. This proposed new route is suggested as a 30‐minute peak period route that would include a stop at the Lorton VRE station.
The additional service needs in the larger I‐95 corridor area are estimated to add 41,241 annual revenue‐hours of service.
3.2 Prince William County Needs Assessment Existing Bus Service Characteristics Existing bus service characteristics are described by service area. PRTC OmniRide routes are generally grouped as Lake Ridge routes, Dale City/Potomac Mills‐area routes, and Dumfries/Montclair (South Route 1) routes. Lake Ridge Area There are a total of 54 PRTC OmniRide bus trips that operate to and from this area (Prince William District #1 in the park‐and‐ride assessment). The total number of bus trips that serve this district and destinations served are noted below in Table 3‐1. The OmniRide routes serve five park‐and‐ride lots in this district, four of which are operating near or at capacity. Bus loads on these routes are very high, with typical loads often above 40 riders per trip, and with some trips over seated capacity.
Table 3‐1 Existing Lake Ridge Area OmniRide Service Characteristics
(Prince William District #1)
Time Period D.C. Pentagon D.C. & Pent. Tysons* Total
AM 10 6 2 4 22
PM 12 9 6 5 32
Total 22 15 8 9 54 * Tysons Service originates at the Woodbridge VRE Station
Dale City/Potomac Mills Area This area (Prince William District #2 in the park‐and‐ride assessment) is also served by PRTC OmniRide service, with many of those trips originating from the Dale City area. There are a total of 82 OmniRide

I‐95 Transit and TDM Plan Page 23 September 20, 2011 Tech Memo #2 – I‐95 Corridor Needs (Draft)
bus trips that operate to and from this district. The total number of bus trips that serve this district and destinations served are noted below in Table 3‐2. The OmniRide routes serve seven park‐and‐ride lots in this district, three of which are operating near or at capacity. Bus loads on these routes are very high, with typical loads often above 40 riders per trip, and with some trips over seated capacity.
Table 3‐2 Existing Dale City/Potomac Mills Area OmniRide Service Characteristics
(Prince William District #2)
Time Period D.C. Pentagon D.C. & Pent. Rosslyn/Pent. Total
AM 22 8 5 4 39
PM 21 7 11 4 43
Total 43 15 16 8 82
Montclair/Dumfries Area This area (Prince William District #3 in the park‐and‐ride assessment) has a total of 33 OmniRide bus trips that operate to and from this district. The total number of bus trips that serve this district and destinations served are noted below in Table 3‐3. The OmniRide routes serve three park‐and‐ride lots in this district, with the Route 234 park‐and‐ride lot operating at capacity. Bus loads on these routes are very high, with typical loads often above 40 riders per trip, and with some trips over seated capacity.
Table 3‐3
Existing Montclair/Dumfries OmniRide Service Characteristics (Prince William District #3)
Time Period D.C. Pentagon D.C. & Pent. Total
AM 15 0 0 15
PM 0 1 17 18
Total 15 1 17 33
Prior Study Recommendations The prior I‐95/I‐395 Transit and TDM Study identified the following potential service expansion projects for the Prince William County portion of the I‐95 corridor. Proposed service improvements that were included in the Fiscally Constrained Plan were:
Daly City/Navy Yard OmniRide – add 2 additional trips per peak period
Route 1 OmniRide to D.C. – add 6 additional trips per peak period, one midday and one late evening trip
Route 1 OmniLink –Extend route to Ft. Belvoir in the peak periods
Prince William MetroDirect – Modify route to include circulation in Springfield area
Woobridge‐Lorton‐Tysons‐Merrifield – New OmniRide route
Central Prince William‐Downtown Alexandria – New OmniRide route
Lake Ridge‐Seminary Road – New OmniRide route

I‐95 Transit and TDM Plan Page 24 September 20, 2011 Tech Memo #2 – I‐95 Corridor Needs (Draft)
Other proposed service improvements that were included in the study’s Refined Alternative, but did not make it into the Fiscally Constrained Plan were:
Dale City/Lake Ridge‐EPG – New OmniRide route
Woodbridge‐EPG – New OmniRide route
Central Prince William‐Pentagon/DC – New OmniRide route
Dale City/Seminary Road – New OmniRide route Improvements that were included in the Fiscally Constrained Plan were estimated to add about 66 daily revenue‐hours to PRTC service. Other improvements that were in the Refined Alternative, but not included in the Fiscally Constrained Plan add another 31 daily revenue‐hours. Planned/Programmed Transit Services Since completion of the prior I‐95/I‐395 Transit & TDP Study, PRTC has completed a TDP. Many of the improvement needs identified in the PRTC TDP are based on recommendations from the prior I‐95/I‐395 study. Any significant PRTC service expansion is contingent on the opening of a second maintenance facility on the western side of the service area. Currently, PRTC has one bus maintenance and storage facility, which is located at the PRTC Transit Center. Constructed in 1996 to 1997, the maintenance facility and storage yard has capacity for 124 buses. PRTC’s current fleet consists of 139 buses, which is increasing to 148 (including contingency) by late 2012. PRTC is constrained by the site from being able to add any more bus storage. To address the storage capacity problem, PRTC has been storing its contingency bus fleet off‐site but in close proximity to the Transit Center for the last several years. Thus, PRTC is at practical capacity with regards to bus storage. In addition to the bus storage capacity issue, the number of available maintenance bays at the facility is becoming a limiting factor. Bus bays at the existing facility were designed to handle the original lot configuration of 100 buses, so they are significantly over capacity. To make room for new vehicles, reduce deadheading costs (miles and fuel), and expand its maintenance capacity, PRTC has been actively pursuing the development of a second maintenance facility on the western side of the service area for the past several years. PRTC proposes to have this second maintenance facility operational in FY 2016. Estimated costs for this facility are $12 million. Also, since the completion of the TDP in early 2011, PRTC’s OmniRide services have been experiencing chronic overcrowding (currently on 17% of its scheduled trips). On July 7, 2011 the PRTC Board approved an “overcrowding relief” plan that does not require additional subsidy or the acquisition of any additional buses. Three buses that are over 18‐years old have been kept in service for overcrowding relief, with eight morning trips and three afternoon trips added to the schedule. All but two of the additional trips have been added to routes serving the I‐95 corridor (Dale City/State Department, Dale City/Pentagon/Navy Yard, and Montclair). Implementation of this plan substantially improves the situation, but has not entirely eliminated overcrowding. Prince William County Service Needs After review of the prior study’s recommendations, the PRTC TDP and discussion with PRTC staff, a number of service needs have been identified for this portion of the I‐95 corridor.

I‐95 Transit and TDM Plan Page 25 September 20, 2011 Tech Memo #2 – I‐95 Corridor Needs (Draft)
Maximization of I‐95 HOT/HOV Lane Capacity Address Immediate Bus Trip Overcrowding As noted in the prior section PRTC recently implemented eight new a.m. and three new p.m. OmniRide trips to address immediate concerns with bus trip overloads. Bus loads in the a.m. peak have improved, but several p.m. peak trips are still overcrowded. Expand OmniRide Service to Keep Pace with Population Growth The I‐95 commuter travel shed area is expected to have a population growth rate of 27 percent between 2011 and 2025. An additional 25 a.m. and 25 p.m. OmniRide commuter trips are needed to keep pace with this growth. In addition, through discussions with PRTC staff, it is estimated that an additional 8 a.m. and 12 p.m. trips are needed to address current capacity deficiencies (in addition to the short‐term overcrowding plans described above). Specific service proposals that would address this general service level growth are listed below. It is important to consider the following proposed improvements as representative service improvements that fit within the general needs for Prince William County. Specific service improvements should be tailored to address specific needs at the time of implementation.
OmniRide Service from the Lake Ridge Area o Add 3 a.m. and 4 p.m. trips to/from downtown Washington, D.C. o Add 3 a.m. and 3 p.m. trips to Pentagon o Modify trips that presently serve both Pentagon and Washington, D.C. to serve just
Washington, D.C. (to free up bus capacity to provide expanded trips that serve just the Pentagon)
o Begin new service to the Mark Center. Start with 4 a.m. and 4 p.m. trips
OmniRide Service from the Dale City/Potomac Mills Area o Add 4 a.m. and 5 p.m. trips to D.C. Some of these trips should go to the Navy Yard area. o Add 3 a.m. and 4 p.m. trips to Pentagon o Adjust trips that presently serve both Pentagon and Rosslyn to serve just Rosslyn (to free up
bus capacity to provide expanded trips that serve just the Pentagon) o Add 2 am. and 2 p.m. trips to Rosslyn/Balston o Begin new service to the Mark Center. Start with 4 a.m. and 4 p.m. trips. o Begin new service to Merrifield via the I‐95/I‐495 HOT/HOV lanes. Start with 4 a.m. and 4
p.m. trips.
OmniRide Service from the Montclair/Dumfries Area o Add 2 a.m. and 3 p.m. trips to Pentagon/D.C. o Split evening service patterns so select trips from Washington, D.C. do not stop at the
Pentagon (to free up capacity to expand trips that would just serve the Pentagon). o Begin new service to Tysons Corner. Start with 4 a.m. and 4 p.m. trips

I‐95 Transit and TDM Plan Page 26 September 20, 2011 Tech Memo #2 – I‐95 Corridor Needs (Draft)
Increase Prince William MetroDirect Service Levels It is also recommended that service frequencies on the MetroDirect to Franconia‐Springfield be improved from 30 to 20 minutes in the peak periods. This will provide improved connectivity to the Metrorail Blue Line and to commuter destinations served by the Blue Line. Many of the above‐noted improvements are consistent with improvements identified in the prior I‐95/I‐395 Transit & TDM Study. Expansion of the OmniRide service adds 33 a.m. and 37 p.m. trips, and is estimated to add 26,775 annual revenue‐hours (slightly more than what was identified in the prior I‐95/I‐395 Transit and TDM Study). Peak period frequency improvements to the Prince William MetroDirect are estimated to add 2,040 additional annual revenue‐hours and one peak bus. Other I‐95 Corridor Needs Extend OmniLink Service to Fort Belvoir The extension of Route 1 OmniLink service to Fort Belvoir in the peak periods is also an identified need in the larger I‐95 corridor area and is consistent with the prior I‐95/I‐395 Transit & TDM Study. Service would remain outside of the post, with transfers for continuation inside the post (via Fort Belvoir’s planned internal shuttle, the REX and the proposed Franconia‐Springfield‐Fort Belvoir shuttle route). The extension of peak period Route 1 OmniLink service is estimated to add 2 additional peak buses and 4,080 additional annual revenue‐hours of service.
3.3 Stafford and Spotsylvania Counties Needs Assessment Existing Bus Service Characteristics Stafford and Spotsylvania Counties are served by Martz and Quicks bus service. Park‐and‐ride lots that are served by these private bus operators are:
Garrisonville Road – Staffordborough Blvd.
Garrisonville Road – Mine Road
Route 17 ‐ Falmouth
Route 630 – Stafford
Route 3 – Gordon Road
Route 3 – Salem Church Road
Route 208 – Houser Road Trip patterns for each service provider were noted in Tech Memo #1. There are a total of 24 a.m. and 24 p.m. peak period Quick’s and Martz trips originating from Stafford and Spotsylvania Counties. Most bus trips serve more than one park‐and‐ride lot. The current number of trips to/from destinations are as follows:
Washington, D.C. – 13 a.m. and 15 p.m. trips
Pentagon/Crystal City – 5 a.m. and 5 p.m. trips
Pentagon/Washington, D.C. – 2 a.m. and 0 p.m. trips
Rosslyn – 1 a.m. and 1 p.m. trip

I‐95 Transit and TDM Plan Page 27 September 20, 2011 Tech Memo #2 – I‐95 Corridor Needs (Draft)
Navy Yard/DOT – 1 a.m. and 1 p.m. trip
Mark Center/Bailey’s Crossroad – 1 a.m. and 1 p.m. trip
Fort Belvoir – 1 a.m. and 1 p.m. trip Prior Study Recommendations The prior I‐95/I‐395 Transit and TDM Study did not have recommendations for service to/from specific park‐and‐ride lots at the south end of the corridor. It did, however, include the following proposed service improvements that were included in the Fiscally Constrained Plan:
Fredericksburg‐D.C. – 30‐minute peak period frequencies
Fredericksburg‐Pentagon/Crystal City – 30‐minute peak period frequencies
Massaponax‐D.C. – 30‐minute peak period frequencies Other proposed service improvements that were included in the study’s Refined Alternative, but did not make it into the Fiscally Constrained Plan were:
Fredericksburg‐Tysons‐Merrifield
Fredericksburg‐EPG‐Ft. Belvoir The prior study also considered a Fredericksburg‐Rosslyn‐Balston route, which was not included in the study’s Refined Alternative. Improvements that were included in the Fiscally Constrained Plan were estimated to require about 61 daily revenue‐hours. Other improvements that were in the Refined Alternative, but not included in the Fiscally Constrained Plan require 31 daily revenue‐hours. Planned/Programmed Transit Services Since this portion of the corridor is served by private bus operators, there are no specific expansion plans. Service expansion by the private operators will be triggered by a demonstrated demand, with the ability for the operator(s) to provide the service in a profitable manner. The potential to attract new riders, however, is presently severely limited because of park‐and‐ride lot capacity constraints. As noted earlier, many of the lots in this portion of the corridor are operating at or beyond capacity. Parking lot expansion will be required to accommodate any significant increase in bus service levels. Stafford and Spotsylvania County Service Needs Population within the commuter bus travel shed corridor for Stafford and Spotsylvania Counties is estimated to grow by 66 percent between now and 2035. To keep up with this growth, it is estimated that commuter bus service should grow by at least 16 trips in each peak period. The implementation of expanded transit service and specific new route patterns by the existing private operators will need to be based on a demonstrated ridership demand. For purposes of this study, it is assumed that transit service demand will increase at a rate commensurate with population growth, and that the private operators will find it profitable to expand transit service to meet this demand through subscription bus service.

I‐95 Transit and TDM Plan Page 28 September 20, 2011 Tech Memo #2 – I‐95 Corridor Needs (Draft)
Maximization of I‐95 HOT/HOV Lane Capacity A potential service expansion plan has been defined for purposes of this study, and is presented below. Again, this plan assumes the private operators will find demand sufficient to profitably expand transit services at a rate that keeps pace with anticipated population growth. Thus, there is no certainty that demand will warrant service expansion as assumed under this service plan. Washington, D.C. Service
Existing Trips ‐ 13 a.m. and 15 p.m. trips
Proposed Additional Trips = 6 a.m. and 6 p.m. trips Pentagon Service
Existing Trips ‐ 5 a.m. and 5 p.m. trips
Proposed Additional trips = 2 a.m. and 2 p.m. trips Mark Center Service
Existing Trips ‐ 1 a.m. and 1 p.m. trip
Proposed Additional Trips ‐ 2 a.m. and 2 pm. trips Navy Yard/DOT Service
Existing Trips ‐ 1 a.m. and 1 p.m. trip
Proposed Additional Trips ‐ 1 a.m. and 1 p.m. trip Rosslyn Service
Existing Trips ‐ 1 a.m. and 1 pm. trip
Proposed Additional Trips ‐ 2 a.m. and 2 p.m. trips Fort Belvoir Service
Existing trips ‐ 1 a.m. and 1 p.m. trip
Proposed Additional Trips ‐ 1 a.m. and 1 p.m. trip Tysons Corner Service
Existing trips ‐ No existing service
Proposed Additional Trips ‐ 2 a.m. and 2 p.m. trips In addition to the proposed service expansion, it is likely that increased demand will necessitate the consolidation of bus stop patterns at Stafford and Spotsylvania County park‐and‐ride lots. Demand will likely increase to a level that supports more direct commuter bus routing, without mid‐route stops at additional park‐and‐ride lots. It is also important to note that transit capacity at the Pentagon Station is very constrained (a major destination for commuters from this portion of the I‐95 corridor). Further expansion of commuter bus trips to and from the Pentagon will be difficult. Prior to implementation, it will be necessary to determine available bus bay capacity. Existing Pentagon‐destined commuter bus trips also presently operate to/from Crystal City. There is no additional capacity to add bus service at proposed Crystal City transitway bus stops (described later in this Technical Memorandum). Thus, any additional bus service from the I‐95 corridor will need to identify alternative stop locations in the Crystal City area, or consider

I‐95 Transit and TDM Plan Page 29 September 20, 2011 Tech Memo #2 – I‐95 Corridor Needs (Draft)
turning back service in the Pentagon City area. It may be necessary to route commuter bus trips to the Franconia‐Springfield Station instead of to the Pentagon. Proposed expansion of the private operator service from Stafford and Spotsylvania Counties, as reflected in this Needs Plan, adds 16 a.m. and 16 p.m. trips, and is estimated to add about 12,240 annual revenue‐hours of service.
3.4 BRAC‐Related Needs Assessment Transportation Management Plans (TMPs) have been developed for the BRAC sites at Mark Center (BRAC‐133) and Ft. Belvoir/Ft. Belvoir North. Access to the BRAC‐133 Facility at Mark Center will be aided by the I‐95 at Seminary Road HOV/Transit ramp. All of the plans that follow are considered as committed service improvements serving the larger I‐95 corridor area. Other I‐95 Corridor Needs Proposed transit service plans for the BRAC‐133 site include:
Alexandria Transit Company’s DASH system is proposed to include shuttle service from King Street Metro to the BRAC‐133 Facility at the Mark Center with ten‐minute headways during peak periods. The general public can ride the express buses on a fare basis; Department of Defense Mark Center personnel and contractors ride free by showing appropriate ID.
The Department of Defense (DoD) has proposed funding and operating shuttles from the Franconia‐Springfield Metrorail Station to the BRAC‐133 facility.
WMATA is planning on implementing the following new services and changes to existing service effective Fall 2011: o Mark Center‐Pentagon Line, Route 7M: New express service between the Pentagon and
Mark Center via I‐395. Will operate every 10‐15 minutes from 5:40 a.m. to 7 p.m. DoD employees ride free with I.D.
o Lincolnia‐Park Center‐Pentagon Line, Routes 7W, 7X: Reroute via Mark Center and modify routing/stops in Southern Towers
o Foxchase‐Seminary Valley Line, Route 8W: Extend from Seminary Rd. & Library La. to Mark Center
Also, Routes 7A and 7F which currently operate via Mark Center every 30‐60 minutes seven days a week will continue with no changes in route or schedule at this time. DoD employees with I.D. will be allowed to ride free on any Route 7 line bus (7A, F, M, W, X) operating via Mark Center.
Additional possible changes for December 2011 or later include:
o Extend Route 28X Leesburg Pike limited stop service from Baileys Crossroads to Mark Center o Modify Routes 25C,D and/or 28F,G to operate via Mark Center o All routes starting/ending at Southern Towers (7B,D,E,Y) extend to start/end at Mark Center
I‐95 Transit and TDM Plan Page 30 September 20, 2011 Tech Memo #2 – I‐95 Corridor Needs (Draft)
Transit plans for Fort Belvoir and Fort Belvoir North include:
Recently implemented internal circulator at Fort Belvoir. It is a 15‐passenger van with 30 minute headways, since the installation plans to start small and build up. There is a bus stop at Pence Gate on Belvoir Road near the new Hospital.
The Department of Defense (DoD) has proposed funding and operating shuttles from the Franconia‐Springfield Metrorail Station to Fort Belvoir North.
A publicly‐operated shuttle is also proposed between Franconia‐Springfield Station and Fort Belvoir. This shuttle would enter onto the base.
The existing REX route will run extended evening service until 11 p.m. for Fort Belvoir hospital late night shifts.
3.5 Summary of Transit Service Needs Tables 3‐4 and 3‐5 present a summary of transit service needs that have been identified in this Needs Plan. Route improvements that would specifically maximize the capacity of the I‐95 HOT/HOV lanes are included in Table 3‐4. Table 3‐5 presents route improvements in the larger I‐95 corridor area. Several of the proposed service improvements are presently included in other planning efforts. Most of the improvements also are consistent with improvements previously identified in the I‐95/I‐395 Transit & TDM Study. It is important to note that for purposes of this study, specific service patterns have been proposed. However, flexibility should be allowed to each service provider to refine specific service patterns as needed, to reflect anticipated actual demand patterns.

I‐95 Transit and TDM Plan Page 31 September 20, 2011 Tech Memo #2 – I‐95 Corridor Needs (Draft)
Table 3‐4 Summary of Bus Transit Service Needs to Maximize Capacity of I‐95 HOT/HOV Lanes
Geographic Area Imrpr. Status Operator Improvement Description
Fairfax County Committed Service Fairfax Re‐label Route 380‐D as Route 395
Improvements Fairfax I‐495 HOT Lane Service ‐ Lorton‐Tysons
Fairfax I‐495 HOT Lane Service ‐ Franconia/Springfield‐Tysons
Additional WMATA Route 18 G/H/J/P Restructuring
Service Needs WMATA Extension of Route 18E/F to Saratoga pnr
Fairfax Restructure Tysons service to stop at Saratoga pnr
Fairfax New: Saratoga‐Pentagon Express ‐ 5 a.m. and 5 p.m. trips
Prince William Committed Service PRTC Add 8 morning and three afternoon OmniRide trips to address
County Improvements current overcrowding issues
Additional OmniRide Lake‐Ridge‐Washington, D.C. ‐ add 3 a.m. and 4 pm. trips
Service Needs OmniRide Lake Ridge‐Pentagon/Crystal City ‐ add 3 a.m. and 3 p.m. trips
OmniRide New Service ‐ Lake Ridge to Mark Center ‐ 4 a.m. and 4 p.m. trips
OmniRide Dale City/Potomac Mills‐Washington, D.C. ‐ add 4 a.m. and 5 p.m. trips
OmniRide Dale City/Potomac Mills‐Pentagon/Crystal City ‐ add 3 a.m. and 4 p.m. trips
OmniRide Dale City/Potomac Mills‐Rosslyn/Balston ‐ add 2 a.m. and 2 p.m. trips
OmniRide New Service: Dale City/Potomac Mills‐Mark Center ‐ 4 a.m. and 4 p.m. trips
OmniRide New Service: Dale City/Potomac Mills‐Merrifield ‐ 4 a.m. and 4 p.m. trips
OmniRide Monclair/Dumfries‐Pentagon/DC ‐ Add 2 a.m. and 3 p.m. trips
OmniRide New Service: Montclair/Dumfries‐Tysons Corner ‐ 4 a.m. and 4 p.m. trips
MetroDirect Prince William MetroDirect ‐ Increase peak period frequencies to 20‐min.
Stafford and Additional Private Op's. Washington D.C. Service ‐ add 6 trips each peak period
Spotsylvania Service Needs Private Op's. Pentagon/Crystal City Service ‐ add 2 trips each peak period
Counties Private Op's. Mark Center Service ‐ add 2 trips each peak period
Private Op's. Navy Yard/DOT Service ‐ add 1 trip each peak period
Private Op's. Rosslyn Service ‐ add 2 trips each peak period
Private Op's. Fort Belvoir Service ‐ add 1 trip each peak period
Private Op's. Tysons Corner Service ‐ new service, 2 trips each peak period

I‐95 Transit and TDM Plan Page 32 September 20, 2011 Tech Memo #2 – I‐95 Corridor Needs (Draft)
Table 3‐5 Summary of Bus Transit Service Needs in Larger I‐95 Corridor Area
Geographic Area Imrpr. Status Operator Improvement Description
Fairfax County Committed Service Fairfax 171/371 Route restructuring
Improvements Fairfax Modify 331/332 into 333/334 I‐95 circulators
Fairfax Modify 305/307 and label as Route 305
Additional WMATA Replace 18R & 18S with 18A & 18B
Service Needs Fairfax Restructure Route 304 ‐ 30 pk/60 midday
Fairfax Improve Route 310 service frequencies ‐ 20 pk/30 midday
Fairfax Improve 321/322 service frequencies ‐ 20 pk/30 midday
Fairfax Route 341/342 Springfield Circulators ‐ 12 pk/12 midday
Fairfax New: Saratoga‐Fort Belvoir Shuttle ‐ 30 peak
Prince William Additional OmniLink Route 1 OmniLink ‐ extend from Woodbridge VRE to Fort Belvoir ‐ peak per.
County Service Needs
BRAC‐Related Committed Service WMATA New: Route 7M ‐ Pentagon‐Mark Center
Service Improvements WMATA Routes 7W, 7X, 8W ‐ Route modifications to serve Mark Center
WMATA REX ‐ extend evening service for Fort Belvoir Hospital shifts
Alexandria DASH Shuttle ‐ King St. to Mark Center
DoD Franconia‐Springfield‐Mark Center Shuttle
DoD Franconia‐Springfield‐Fort Belvoir North Shuttle
DoD Fort Belvoir Internal Shuttle
TBD New: Franconia‐Springfield‐Fort Belvoir shuttle ‐ 30 pk/60 midday

I‐95 Transit and TDM Plan Page 33 September 20, 2011 Tech Memo #2 – I‐95 Corridor Needs (Draft)
4.0 Virginia Railway Express Service and Facility Needs The prior I‐95/I‐395 Transit and TDM Study also identified a need for significant expansion of VRE facilities and services in the corridor. These needs are not directly related to maximizing the capacity of the I‐95 HOT/HOV lanes, but would serve the larger I‐95 corridor area. To determine if the prior study’s stated needs were still valid and appropriate, a general assessment of existing VRE service and facilities was completed. Prior I‐95/I‐395 Transit & TDM Study recommendations were documented, as were current VRE service and facility plans, as documented in the VRE Strategic Plan and the VRE FY 2012 budget. VRE service and facility needs were then refined based on more current VRE Plans, anticipated demographic growth for the VRE Fredericksburg Line travel shed and discussions with VRE and VDRPT rail staff. Existing VRE Service and Facility Characteristics VRE continues to experience substantial ridership growth on its Fredericksburg Line. Current average daily ridership is about 10,000 riders a day, and is 15 percent higher than last year’s (FY 2010) ridership. VRE operates 7 a.m. and 7 p.m. trips (peak direction only), with trainsets ranging from 4 to 8‐car trains. Two of the seven morning trips typically experience loads over seated capacity. Four of the seven afternoon trips typically experience loads over seated capacity. The mix of train sets, resulting seated capacity and average May 2011 ridership is shown below in Table 4‐1.
Table 4‐1 VRE Train Capacity/Ridership Comparison
(May 2011)
Trainset AM Trains PM Trains
4‐Car Trains 1 1
5‐Car Trains 1 1
6‐Car Trains 4 4
8‐Car Trains 1 1
Seated Capacity 5,606 5,606
Ridership 5,211 5,393
Ridership/Capacity Ratio 0.93 0.96
Parking demand is also high at several VRE stations, particularly at stations at the southern end of the Fredericksburg line. The Brooke, Leeland Road and Fredericksburg Stations typically have occupancy rates over 90 percent. FRED operates two feeder routes to and from the Fredericksburg VRE station. Finally, it is important to note that VRE has midday storage constraints. The Ivy City yard is presently used for midday storage in Washington, D.C. This yard is presently operating at capacity. VRE recently constructed a siding at L’Enfant Station, and will soon be installing a switch at the north end of this siding to allow for the storage of up to two trains at this location.

I‐95 Transit and TDM Plan Page 34 September 20, 2011 Tech Memo #2 – I‐95 Corridor Needs (Draft)
Prior Study Recommendations The prior I‐95/I‐395 Transit and TDM Study included the following VRE recommendations in both the Refined Alternative, and the Fiscally Constrained Plan:
Increase train size so 3 trains have 8 cars and 4 trains have 6 cars
Increase number of VRE trains from 14 to 20 per day
Extend platforms at 4 stations to more easily accommodate 8‐car trains
Expand overnight storage in Fredericksburg
Add 1,500 parking spaces at VRE stations – 200 at Brooke, 500 at Leeland and 800 at Fredericksburg
The prior study assumed an agreement with Amtrak would be in place to expand midday storage at Ivy City and construct L’Enfant Station storage tracks. In addition to the improvement recommendations identified above, the I‐95/I‐395 Transit & TDM Study considered the following VRE improvements that did not make it into the Refined Alternative:
Further expand train trips from 20 to 32 trips per day
Construct a new station in Spotsylvania County
Construct a new station at Widewater in Stafford County Planned/Programmed Transit Services VRE completed a Strategic Plan in 2004, and is presently updating the Strategic Plan. The Strategic Plan identified three potential phased capital growth strategies: targeted growth, aggressive growth and deferred growth. The following capital improvement elements were identified for each growth strategy: Station Parking Expansion
Proposed parking expansion on the Fredericksburg line ranged from 785 (low growth) to 2,775 (high growth).
Suburban Station Improvements
Fredericksburg – Additional parking at Fredericksburg Station if Spotsylvania Station is not built
Quantico – Rehabilitation of the Quantico historic station building
Woodbridge – A second passenger platform on west side of tracks and a second parking garage
Cherry Hill – a new station between Rippon and Quantico Stations, with 200‐300 initial spaces, 600 spaces in the future
Rolling Stock
100‐160 coach cars and 20‐27 locomotives, depending on growth strategy (for full VRE system) Operating Improvements
Expand from 7 to 8 trains/peak period by 2015
Expand from 8 to 9 trains/peak period by 2025

I‐95 Transit and TDM Plan Page 35 September 20, 2011 Tech Memo #2 – I‐95 Corridor Needs (Draft)
Other System Improvements
Service extension to Spotsylvania County
Expansion of existing midday storage at the Ivy City Coach Yard at Washington Terminal
Continual rail infrastructure improvements In addition to VRE’s Strategic Plan, the VRE FY 2012 budget includes a six‐year (FY 2012‐FY 2017) Capital Improvements Program (CIP). This document more accurately reflects VRE’s intended capital projects for the near‐term period. Major capital projects in the CIP that directly impact the Fredericksburg Line are as follows:
Spotsylvania County third track project – completion proposed by 2015, fully funded
Midday storage expansion – completion proposed by 2016, partially funded
Rolling stock replacement/expansion – purchases proposed through 2016, partially funded
Heavy maintenance repair facility – completion proposed by 2017, partially funded
Positive train control – completion proposed by 2014 – unfunded Demographic Growth Projections The Fredericksburg Line’s commuter travel shed is anticipated to experience significant population growth through 2035, as noted below in Table 4‐2, with a much higher growth rate at the southern end of the corridor. Presently, 60 percent of the travel shed’s population resides in Fairfax and Prince William Counties. By 2035, nearly ½ of the travel shed’s population will be in Stafford and Spotsylvania Counties.
Table 4‐2 Population Growth Projections Along the Fredericksburg Line
Corridor Area 2011 2035 % Change
Fairfax & Prince William Counties
442,590 537,702 21%
Stafford, Fredericksburg & Spotsylvania Counties
299,553 504,937 69%
Total 742,143 1,042,639 40% Notes:
1. Fairfax and Prince William population totals are for areas along the VRE/I‐95 corridor only, and are based on MWCOG demographic projections.
2. Stafford, Fredericksburg & Spotsylvania population totals are for the entire jurisdictions and are based on FAMPO demographic projections.
VRE Service and Facility Needs The prior I‐95/I‐395 Transit & TDM Study does not include the planned Spotsylvania County VRE Station (those plans moved forward after completion of the I‐95/I‐395 study). Further, the prior study’s proposed growth in train service does not take into consideration VRE’s available “train slots” with CSX and existing available capacity. Therefore, VRE recommendations for the Needs Plan are more consistent with those presented in the VRE Strategic Plan and the VRE proposed FY 2012 budget.

I‐95 Transit and TDM Plan Page 36 September 20, 2011 Tech Memo #2 – I‐95 Corridor Needs (Draft)
Train Capacity Expansion
Immediate term – expand trainsets to four 6‐car and three 8‐car trains (48 cars/peak period – a 17 percent increase in passenger capacity over existing levels). This recommendation is consistent with the prior I‐95/I‐395 study.
Longer‐term – add two train trips in each peak period (per the VRE Strategic Plan). Six‐car trainsets (in combination with proposed immediate term trainset expansion proposals) result in a 46 percent increase in passenger capacity over today.
New Stations
Immediate‐term – Construct Spotsylvania County station (project already committed)
Longer‐term – Construct Cherry Hill station Station Platform Extensions
Extend station platforms at Rippon, Brooke, Leeland and Quantico to more easily accommodate 8‐car trains
Station Parking Expansion
Construct 1,000 spaces at Spotsylvania Station (project already committed)
Construct 500 spaces at Brooke and Leeland Road Stations (projects already committed)
Construct 800‐space garage at either Fredericksburg or Leeland/Brooke stations Midday Storage
Complete north switch at L’Enfant Plaza siding for midday storage use of up to two trains (project already committed)
Expand storage capacity at north end of service area Track Capacity Improvements
Construct 3rd track at Spotsylvania Station (project already committed)
Construct 3rd track at Cherry Hill
Add positive train control Other Improvement Needs
Expand overnight storage at Crossroads
Construct heavy maintenance facility Table 4‐3 summarizes the VRE service and facility needs and the funding commitment status of each.

I‐95 Transit and TDM Plan Page 37 September 20, 2011 Tech Memo #2 – I‐95 Corridor Needs (Draft)
Table 4‐3 Funding Commitment Status of VRE Service and Facility Needs
Funding Remains
Improvement Description Committed Unfunded
Train Capacity Expansion
Increase train size, so 3 trains have 8‐cars and 4 have six cars
Aditional 7 peak/9 fleet passenger cars required X
Expand train trips from 7 to 8 trips per peak period (6‐car trains)
Additional 6 peak/8 fleet passenger cars required X
Further expand train trips from 8 to 9 trips per peak period (6‐car trains)
Additional 6 peak/7 fleet passenger cars required X
Subtotal
New Stations
Construct Spotsylvania County Station (2013) Locally Funded
Construct Cherry Hill Station (developer funded?) Locally Funded
Subtotal
Station Platforms
Extend station platforms at 4 stations X
Subtotal
Station Parking
Construct 1,000 spaces at Spotsylvania Station (2013) Locally Funded
Construct 500 surface spaces at Brooke and Leeland Road Stations X
Construct 800‐space garage at Fredericksburg Station or at Brooke/Leeland X
Subtotal
Midday Storage
Switch at L'Enfant Plaza Station X
Expand storage capacity at north end of service area
Subtotal
Track Capacity
3rd Track at Spotyslvania (2.5 miles) X
3rd track at Cherry Hill (11.4 miles) X
Positive Train Control
Subtotal
Other
Overnight storage at Spotsylvania County Station X
Heavy Maintenance Facility
Partially Committed
Partially Committed
To Be Determined

I‐95 Transit and TDM Plan Page 38 September 20, 2011 Tech Memo #2 – I‐95 Corridor Needs (Draft)
5.0 Transportation Demand Management Program Needs Existing TDM Programs There are several TDM programs in place in the I‐95 corridor that provide ridesharing opportunities to corridor commuters, and provide opportunities to reduce commuter trips. Those programs include: Telework Programs The Telework!VA program by DRPT provides telework training and financial incentives for Virginia businesses to establish or expand telework programs for their employees. Participation in the Telework!VA program has increased exponentially in recent years, especially in Northern Virginia. There are also three privately‐operated telework centers operated by the GWRC ‐ the Fredericksburg Regional Telework Center, the Fredericksburg Telework Center North (also known as the Stafford Telework Center), and the Woodbridge Telework Center. Finally, it is important to note that there is new legislation that supports telework for federal employees. The Telework Enhancement Act of 2010 (HR 1722) requires each federal agency to designate a Telework Managing Officer, and monitor progress towards a goal of 20 percent of eligible federal workforce teleworking an average of one day per week. Federal telework is supported by Telework Exchange, a public‐private partnership. Slugging/Dynamic Ridesharing A 2006 study by VDOT estimated that a.m. slugs along the I‐95 corridor numbered about 6,450. The 2006 estimates were based on a.m. peak counts at 15 slug line locations along the Virginia I‐95 corridor (including slug lines in Fairfax and Prince William counties in the VDOT Northern Virginia District as well as locations in Stafford County and Fredericksburg in the VDOT Fredericksburg District). Over one half of sluggers originate in Prince William County. One third of all sluggers are destined to the Pentagon. Commuter Connections Commuter Connections is a regional network of transportation organizations coordinated by the MWCOG, and provides information on the commute options for those who live or work in the Metropolitan Washington, D.C. area. Commuter Connections serves as an umbrella organization across member jurisdictions for regional awareness and marketing services related to improved air quality and reduced automobile emissions. Commuter Connections is a program of the National Capital Region Transportation Planning Board at the MWCOG and is funded by the District, Maryland and Virginia Departments of Transportation as well as the U.S. Department of Transportation. TDM agencies within the I‐95 corridor that are part of the Commuter Connections Network include:
Local Motion – City of Alexandria
Fairfax County Transportation Services Group (FCTSG)
OmniMatch – Potomac and Rappahannock Transportation Commission (PRTC)
GWRideConnect – George Washington Regional Commission (GWRC)
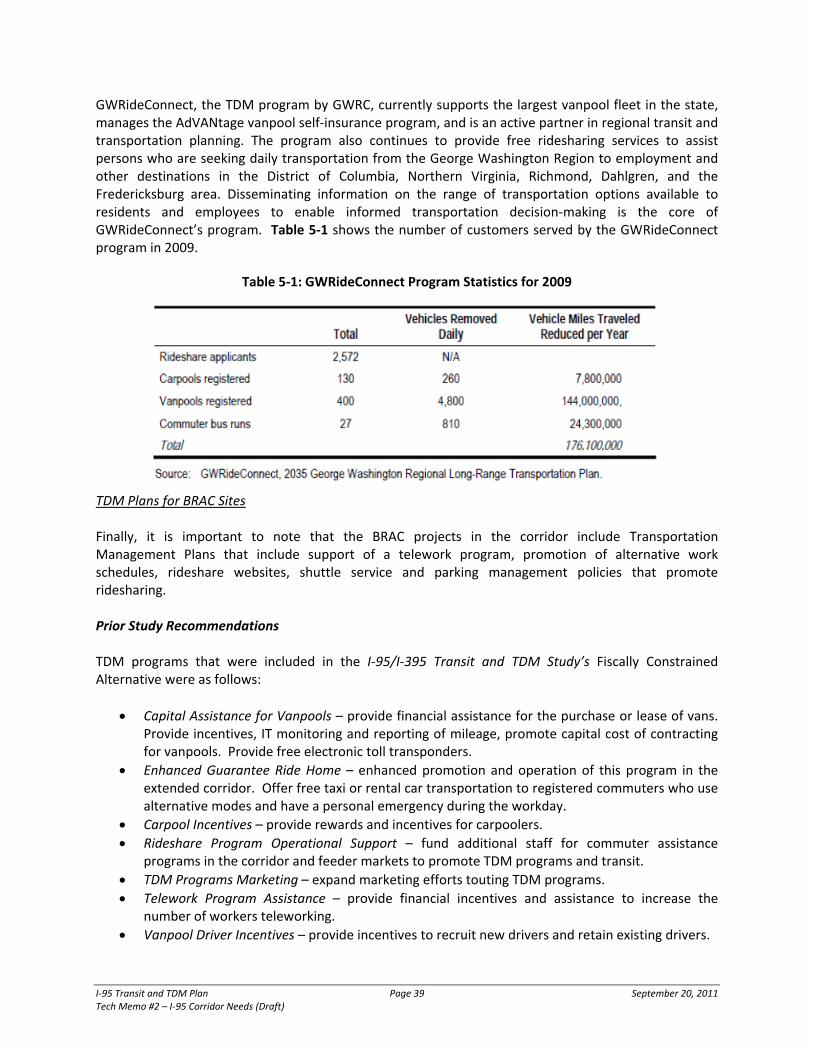
I‐95 Transit and TDM Plan Page 39 September 20, 2011 Tech Memo #2 – I‐95 Corridor Needs (Draft)
GWRideConnect, the TDM program by GWRC, currently supports the largest vanpool fleet in the state, manages the AdVANtage vanpool self‐insurance program, and is an active partner in regional transit and transportation planning. The program also continues to provide free ridesharing services to assist persons who are seeking daily transportation from the George Washington Region to employment and other destinations in the District of Columbia, Northern Virginia, Richmond, Dahlgren, and the Fredericksburg area. Disseminating information on the range of transportation options available to residents and employees to enable informed transportation decision‐making is the core of GWRideConnect’s program. Table 5‐1 shows the number of customers served by the GWRideConnect program in 2009.
Table 5‐1: GWRideConnect Program Statistics for 2009
TDM Plans for BRAC Sites Finally, it is important to note that the BRAC projects in the corridor include Transportation Management Plans that include support of a telework program, promotion of alternative work schedules, rideshare websites, shuttle service and parking management policies that promote ridesharing. Prior Study Recommendations TDM programs that were included in the I‐95/I‐395 Transit and TDM Study’s Fiscally Constrained Alternative were as follows:
Capital Assistance for Vanpools – provide financial assistance for the purchase or lease of vans. Provide incentives, IT monitoring and reporting of mileage, promote capital cost of contracting for vanpools. Provide free electronic toll transponders.
Enhanced Guarantee Ride Home – enhanced promotion and operation of this program in the extended corridor. Offer free taxi or rental car transportation to registered commuters who use alternative modes and have a personal emergency during the workday.
Carpool Incentives – provide rewards and incentives for carpoolers.
Rideshare Program Operational Support – fund additional staff for commuter assistance programs in the corridor and feeder markets to promote TDM programs and transit.
TDM Programs Marketing – expand marketing efforts touting TDM programs.
Telework Program Assistance – provide financial incentives and assistance to increase the number of workers teleworking.
Vanpool Driver Incentives – provide incentives to recruit new drivers and retain existing drivers.

I‐95 Transit and TDM Plan Page 40 September 20, 2011 Tech Memo #2 – I‐95 Corridor Needs (Draft)
Vanpool Insurance – increase vanpool insurance premium pool buy‐down for vanpools.
VanStart/VanSave – provide additional financial support to cover the cost of vacant seats for new vanpools during start‐up operations, and established vanpools that have temporary vacancies.
Other programs that were included in the prior study’s Refined Alternative, but not included in the Fiscally Constrained Plan were:
HOVER Pilot Program – a facilitated park and ride‐share system that tracks participant usage, and shares costs and benefits through a combination of financial and “HOVER Ride Credit accounts.
Vanpool Tracking for NuRide – a tracking mechanism to track vans used for vanpools and vanpool riders for NuRide.
In total, the prior I‐95/I‐395 Study’s Refined Alternative includes $59.8 million in TDM programs, of which $20 million was included in the Fiscally‐Constrained Plan (2010 dollars). TDM Program Needs Prior study recommendations were reviewed with TSM program administrators in the corridor. The majority of the TDM program recommendations made in the prior I‐95/I‐395 Transit and TDM Study are still valid for their potential to maximize the capacity of the I‐95 HOT/HOV lanes. However, some recommendations were revisited in light of new programs and updated plans for existing programs. Table 5‐2 indicates the TDM recommendations along with the source study and the location/method of implementation.
Vanpools In FY 2011, over 500 vanpools were operated in the study area. Of these, 392 were operated in the GWRC area. The GWRC vanpools transported 4,704 persons daily (or about 1,176,000 annually) and reduced 7,769 work trips daily (1,942,250 trips annually). This translated into 466,124 vehicle miles traveled (VMT) reduced daily (116,531,000 VMT reduced annually), and a savings of 23,306 gallons of gasoline daily (5,826,000 gallons annually). The following recommendations support and enhance the vanpool program:
VanStart and VanSave: Additional funding for these programs is a need which would provide short term support (up to six months) to cover the cost of vacant seats until regular riders can be found during the start‐up phase or in case of temporary vacancies. Currently, VanSave is in need of funding. VanStart is currently funded through CMAQ. This recommendation was made in the 2008 I‐95/I‐395 Transit/TDM Study and is still valid. As an example of this program’s effectiveness, in 2011, GWRideConnect used $20,000 of VanSave funding which helped keep 17 vans in operation.

I‐95 Transit and TDM Plan Page 41 September 20, 2011 Tech Memo #2 – I‐95 Corridor Needs (Draft)
Table 5‐2: TDM Program Recommendations
Improvement Description
I‐95/I‐395 Transit/TDM
Study Long Range TDM Plans Other Reference
LOCATION
VANPOOLS
Van Start and Van Save X X Corridor‐wide
Vanpool Insurance ‐ AdVANtage X X Corridor‐wide
NTD Vanpool Program Set Up X NTD Study Corridor‐wide
TELEWORK
Telework!VA program funding X Corridor‐wide
EDUCATION AND MARKETING
Coordinated I‐95 education and marketing campaign Corridor‐wide
TDM Program Staff X X by local program
TECHNOLOGY UPGRADES
Updated trip‐planning, ride matching, and cost sharing technology X Corridor‐wide
SUPPORTING PROGRAMS
Enhanced Guaranteed Ride Home X Commuter Connections
Carpool incentives X Commuter Connections
Vanpool Insurance – AdVANtage: Additional funding for the existing AdVANtage program is a need which would stabilize the existing vanpool self‐insurance pool and increase the pool to provide more protection to vanpools at a lower cost. This program was begun with $500,000 instead of the $2 million that was identified in the original I‐95/I‐395 Transit & TDM Study. The program is operated by GWRideConnect and the Division of Risk Management for all vanpools in the State. Vanpool operators self‐insure themselves with premiums paid into the pool. This program saves vanpool operators thousands of dollars per year and provides up to $14 million more liability protection than previous insurance programs. Currently 180 vanpools are participating in the program, most from GWRC.
National Transit Database (NTD) Vanpool Reporting Program Set‐up: Another need identified for vanpools is the establishment of an NTD Vanpool Program which would require vanpools within the program to track trips and passengers served and report this data to the NTD. The program would help obtain 5307 funding for vanpools, and could be self‐sustaining in due course. However, funding is required in the initial phase to get it up and running. A recommendation was made in the 2008 I‐95/I‐395 Transit/TDM Study for vanpool driver incentives and subsidies for capital costs for vanpools (including purchase/lease of vans and GPS tracking devices). Vanpools that opt into the NTD Vanpool Program will be eligible to receive funding that may be passed on to vanpool drivers and passengers to cover costs or as incentives. This recommendation will need to be coordinated with the current NTD Vanpool study.

I‐95 Transit and TDM Plan Page 42 September 20, 2011 Tech Memo #2 – I‐95 Corridor Needs (Draft)
Telework Program Recommendations
Telework!VA Program Funding: There is a need to increase funding for this program which provides financial incentives and training for employers that start new telework programs, funding for home‐based equipment costs, and consulting support. In FY 2011, the program provided 35,000/employer to about 25 employers. There is potential to increase the impact of this program to fund 40 employers per year for the next five years. Since telework reduces two trips per teleworking employee per day, this program has a significant impact on maximizing use of the I‐95 corridor by removing avoidable trips. This recommendation was made in the 2008 I‐95/I‐395 Transit/TDM Study and is still valid.
Education and Marketing
Coordinated I‐95 education and marketing campaign: Develop an integrated education and marketing campaign for all travel services and options in the I‐95 corridor, including the HOT/HOV facility, park‐and‐ride facilities, transit services, and TDM services. The campaign would develop customized resources to disseminate information including websites, maps, brochures, and electronic/social media blasts. The campaign would be ongoing, with two intensive periods of outreach around the opening dates of the northern and southern segments, respectively. While CommuterConnections coordinates a regional marketing program, a targeted I‐95 program does not exist currently. This recommendation was made in the 2008 I‐95/I‐395 Transit/TDM Study and is still valid, but with refinements based on input from corridor stakeholders.
TDM Program Staff TDM Staff Expansion: Add three part‐time staff persons to provide TDM program support and
commuter assistance in the corridor and feeder markets. A recommendation for additional rideshare program operational support was made in the 2008 I‐95/I‐395 Transit/TDM Study. This recommendation has been refined based on feedback from stakeholders. To illustrate the potential impact of TDM programs, GWRideConnect helps transport 5,844 persons daily (1,461,000 persons annually) and reduces 9,789 work trips daily (2,447,250 trips annually). This translates into 587,324 VMT reduced daily (146,831,000 VMT reduced annually) and 29,366 gallons of gasoline saved daily (7,341,500 gallons annually).
Technology Upgrades
Updated trip planning, ride matching, and cost sharing technology: Upgrade or implement new technology for trip planning and real‐time updates, especially to enhance use of transit, dynamic ridesharing, and ride‐matching for carpools/vanpools. This would involve reviewing the latest available technology and conducting a pilot study before complete roll‐out. Options to be evaluated would include upgrading the existing ride matching databases maintained by local jurisdictions, as well as upgrading and improving integration with the CommuterConnections database. This is a new recommendation based on Long Range TDM Plans and feedback from stakeholders. A pilot study is to be conducted in FY 2013/14, with full roll‐out planned for FY 2015

I‐95 Transit and TDM Plan Page 43 September 20, 2011 Tech Memo #2 – I‐95 Corridor Needs (Draft)
Supporting Programs
Enhanced Guaranteed Ride Home: Enhance promotion and operation of Guaranteed Ride Home (GRH) services in the extended corridor. Offer free taxi or rental car transportation to registered commuters who use alternative modes and have a personal emergency during the workday. This recommendation was made in the 2008 I‐95/I‐395 Transit/TDM Study and is still valid.
Incentive programs for Various Commute Modes: Expand existing incentive programs or institute new programs that support various work commutes (transit, vanpool, carpool, slugging, bike, walk, or telework). Existing programs include Pool Rewards and NuRide. A recommendation was made in the 2008 I‐95/I‐395 Transit/TDM Study for carpool incentives and is still valid. Potential incentives have been broadened to support various commute modes.
Other Recommended TDM Activities
Establish a coordinated monitoring program: Work with stakeholder organizations to jointly identify performance goals for I‐95 travel demand and implementation strategies that support corridor TDM goals.

I‐95 Transit and TDM Plan Page 44 September 20, 2011 Tech Memo #2 – I‐95 Corridor Needs (Draft)
6.0 Destination End Facility Needs When the I‐95/I‐395 Transit and TDM Study was completed in 2008, the HOT/HOV lanes project was proposed to extend nearly 9 miles north of the current project limits along I‐395 to the Potomac River. Thus, the prior study included service and facility recommendations for the portion of the study corridor inside I‐495. As noted in the introduction section, service and facility improvement recommendations are focused on the needs that would maximize the capacity of the I‐95 HOT/HOV lanes south of I‐495. However, consideration has also been given to potential infrastructure impacts and needs at I‐95 commuter trip destinations north of I‐495. To determine if the prior study’s stated needs were still valid and appropriate, a general assessment of existing destination end facilities was first completed. Prior I‐95/I‐395 Transit and TDM Study recommendations were documented, as were current destination end facility plans. Existing and proposed bus transit service levels at key facilities were identified to assess whether the prior study’s stated needs were still valid, or if there was a basis to modify those recommendations. Existing Destination End Service and Facility Characteristics I‐395 Bus Volumes As documented in Technical Memorandum #1, a significant number of bus routes provide service on I‐395 south of the Pentagon (i.e., north of the I‐95 HOT/HOV Lanes project). Public operators with bus routes on I‐395 include PRTC, Fairfax Connector, WMATA, DASH, ART, Martz and Quick’s. Most of these routes terminate at WMATA’s Pentagon Metrorail Station/Transit Center, though many PRTC and Martz trips also continue into central Washington, D.C. via the 14th Street Bridge. Just south of the Potomac River, several WMATA and Loudoun County Transit (LCT) trips also enter I‐395 and continue north across the 14th Street Bridge into central Washington, D.C. Pentagon Metrorail Transit Center At the Pentagon Metrorail Transit Center, there are 21 existing bus bays that are split between a lower and upper level. Most of the 11 upper bays are dedicated to WMATA routes, though ART is the primary user of one bay. Of the 10 lower bus bays, five are dedicated to WMATA, two to PRTC, one to DASH, one is shared by Fairfax Connector and Martz, and one is shared by LCT and Quick’s. Specific bus bay assignments were presented in Technical Memorandum #1. Table 6‐1 presents the afternoon bus volumes departing Pentagon Metrorail Transit Center in both the peak period and the peak hour. The average bus bay utilization in the p.m. peak hour is 6.5 bus trips per bus bay. Trips operated from the I‐95 corridor account for approximately 18 percent of the peak period trips and 15 percent of the peak hour trips in the afternoon. It is important to note that these figures do not include Department of Defense shuttles that also operate into and out of this facility. Overall, bus bay utilization at the Pentagon Transit Center is very high, with bus bays operating at capacity. There is also severe bus congestion getting into and out of the Transit Center.

I‐95 Transit and TDM Plan Page 45 September 20, 2011 Tech Memo #2 – I‐95 Corridor Needs (Draft)
Table 6‐1 P.M. Peak Period & Peak Hour Revenue Bus Trips
Departing Pentagon Station Bus Routes Operated by: P.M. Peak Period
Bus Trips (3‐7 p.m.) P.M. Peak Hour
Bus Trips (4:30‐5:30 p.m.)
WMATA 262 92
DASH 22 6
ART 29 9
LCT 7 5
PRTC 50 17
Fairfax Connector 18 5
Martz/Quick’s 5 3
TOTAL 393 trips 137 trips Note: does not include Department of Defense shuttle trips
Crystal City/Pentagon City Area Many of PRTC’s commuter routes and Quick’s and MARTZ buses also serve the Pentagon City/Crystal City area. Generally, morning buses first drop off at the Pentagon Transit Center, and then continue to Pentagon City and Crystal City. Afternoon buses typically start in Crystal City, travel through the Pentagon City to the Pentagon Transit Center, and then head south on I‐395. There are high bus volumes and limited curb space for passenger pick‐ups and drop‐offs in this area. As noted below under the section “Planned/Programmed Improvements”, a Crystal City/Potomac Yard Transitway Project is to be constructed that will impact I‐95 commuter bus operations in the Crystal City area. Franconia‐Springfield Metrorail Station The Franconia‐Springfield Metrorail Station is the end‐of‐the‐line station for the Blue Line, and is located near the northern terminus of the current I‐95 HOT/HOV project. At the Franconia‐Springfield Metrorail Transit Center, there are eight existing bus bays. Five of the bays are dedicated to Fairfax Connector routes, one to PRTC, one to WMATA, and one to Greyhound. Table 6‐2 presents the afternoon bus volumes departing Franconia‐Springfield Metrorail Transit Center in both the peak period and the peak hour. The average bus bay utilization in the p.m. peak hour is 5.4 bus trips per bus bay.
Table 6‐2 P.M. Peak Period & Peak Hour Revenue Bus Trips
Departing Franconia‐Springfield Station Bus Routes Operated by: P.M. Peak Period
Bus Trips (3‐7 p.m.) P.M. Peak Hour
Bus Trips (4:30‐5:30 p.m.)
WMATA 43 13
PRTC 7 1
Fairfax Connector 96 29
TOTAL 146 trips 43 trips

I‐95 Transit and TDM Plan Page 46 September 20, 2011 Tech Memo #2 – I‐95 Corridor Needs (Draft)
Parking demand is also high at the Franconia‐Springfield Station. Of the approximately 5,120 parking spaces, more than 4,800 were reported full at maximum occupancy in the 2009 WMATA Real‐Time Parking Information Feasibility Study. This equates to a 95 percent occupancy rate. The nearby Springfield Mall Macy’s garage is also used by many Metrorail commuters for supplemental free parking. Prior Study Recommendations The prior I‐95/I‐395 Transit and TDM Study included the following destination end facility recommendations:
Pentagon Metrorail Transit Center—Facility improvements, including 3 new bus bays and canopies, real time passenger information, traffic circulation/access/egress and security
Franconia‐Springfield Metrorail Transit Center—Facility improvements, including 3 new bus bays and canopies, real time passenger information, traffic circulation/access/egress and security
Franconia‐Springfield Metrorail—Additional 1,925 parking spaces
Metrorail Extension from Franconia‐Springfield to Lorton/Ft. Belvoir
Metrorail Extension from Lorton/Ft. Belvoir to Potomac Mills The Metrorail extensions were not included in the prior study’s “Refined Alternative.” The prior study noted that the demand for additional parking spaces at the Franconia‐Springfield Station was not being addressed as part of the study. Only the facility improvements at the Pentagon and Franconia‐Springfield Metrorail Transit Centers were included in the Fiscally Constrained Plan. Planned/Programmed Improvements WMATA’s TIGER Grant for priority bus transit includes funding for station improvements supporting bus priority in the I‐95/I‐395 corridor. This includes funding for two new bus bays at the Pentagon to address bus bay capacity needs for existing service, and two or three bus bays at the Franconia‐Springfield Metrorail Station. The Department of Defense (DoD) is currently analyzing bus activity at the bays as part of a Transportation Management Plan (TMP), with fieldwork to be completed this summer to determine bus bay utilization rates during peak periods. The purpose of the Pentagon TMP is to identify opportunities to make the Pentagon’s transportation system more secure, safer, more efficient and sustainable. Arlington County and the City of Alexandria are also proceeding with plans to implement a Crystal City/Potomac Yard Transitway. This project will affect commuter bus operations from the I‐95 corridor. Dedicated bus lanes are proposed along Crystal Drive, Bell Street and Clark Street in the Crystal City area with bus stops at designated locations. The project’s current definition is to permit stop activity for existing commuter bus trips, but there is anticipated to be insufficient capacity to accommodate expanded bus service. In addition to the projects noted above, a transit center will be opening within the Mark Center on Mark Center Drive. This facility will have five bus bays to accommodate service from WMATA, DASH and commuter bus operators.

I‐95 Transit and TDM Plan Page 47 September 20, 2011 Tech Memo #2 – I‐95 Corridor Needs (Draft)
Destination End Facility Needs Maximization of I‐95 HOT/HOV Lane Capacity Mark Center There are five bus bays at this new transit center. Buses from the I‐95 corridor will be able to access the Mark Center via the proposed I‐95 HOV ramp to Seminary Road, with a left turn from Seminary Road onto Mark Center Drive. WMATA and DASH will be operating several routes to/from this facility. There does, however, appear to be adequate bus bay capacity to accommodate additional commuter bus trips from the I‐95 corridor that are proposed in this plan. Bus schedules and operations among the different service providers, however, will need to be carefully managed. Franconia‐Springfield Metrorail Station As noted earlier, two or three bus bays will be added at this station through a TIGER grant. With these additional bays, there appears to be adequate bus bay capacity to accommodate proposed I‐95 service expansion, as described in this plan. However, coordination will still be needed in the assignment of bus service to bus bays at this station, for there are also planned service increases at this station by the Fairfax Connector and by DoD shuttles. Parking demand, however, is very high at this station, with the existing parking structure operating near capacity. There may be increased parking demand with the HOT lanes ending north of I‐495 (and HOV lanes narrowing from three to two lanes). The extent of this additional demand is not presently known. A potential strategy to address increased parking demands is the expansion of off‐site parking, with the off‐site parking structure connected to the Metrorail station with frequent bus shuttle service. Other I‐95 Corridor Needs Pentagon Metrorail Transit Center As noted earlier, two bus bays are to be added at the Pentagon, but these bays are being added to address existing bus bay capacity deficiencies. Further expansion of bus service at the Pentagon is challenging. Potential strategies to accommodate any further bus service expansion include:
Careful scheduling management that redistributes bus trips outside of the “peak of the peak” time periods. This requires verification of bus bay utilization at specific times.
Splitting trips that presently serve multiple destinations. For example, an existing bus trip that serves both the Rosslyn and the Pentagon can be split into two bus trips – one that serves just Rosslyn and the other that serves just the Pentagon. This would increase “seat capacity to the Pentagon (by taking Rosslyn‐bound trips off the bus), without increasing vehicle trips into and out of the Pentagon.
Route new bus trips to the Franconia‐Springfield Metrorail station instead of the Pentagon, with passengers continuing their trip via the Metrorail Blue Line.
Longer‐term, consider an off‐site bus staging area, with ITS measures in place that could possibly increase bus bay utilization (e.g., real‐time information to let a driver know that his/her designated bus bay is available). This measure would require coordination with

I‐95 Transit and TDM Plan Page 48 September 20, 2011 Tech Memo #2 – I‐95 Corridor Needs (Draft)
Arlington County to determine an appropriate off‐site location that is in close proximity to the Pentagon.
The Pentagon Transit Center is a major regional transit facility that is served by numerous transit service providers. Thus, capacity expansion issues affect not only I‐95 service providers, but other providers as well. Crystal City/Pentagon City Area The proposed Crystal City‐Potomac Yard Transitway project, as presently defined, restricts expansion of commuter bus service at designated Transitway stops. Potential service strategies in the Crystal City area include:
Turning back select bus trips at the Pentagon or Pentagon City.
Splitting trips that presently serve multiple destinations. Trips that presently serve both the Pentagon and Crystal City can be split into two bus trips – one that serves just the Pentagon and the other that serves Pentagon City and Crystal City, thus increasing “seat capacity” to both destinations, but not the number of vehicle trips at each destination.
Route new bus trips to the Franconia‐Springfield Metrorail station instead of Crystal City, with passengers continuing their trip via the Metrorail Blue Line.
Longer‐term, consider a transit center near the Crystal City Metro station. The Crystal City/Pentagon City area is a major regional destination that is served by numerous transit service providers. Thus, it is important to note that capacity expansion issues affect not only I‐95 service providers, but other providers as well. Other Destination End Facility Needs In addition to the facility needs described above, other potential destination facility management needs include the management and coordination of slugging locations and bus drop‐off/pick‐up locations within Washington, D.C. and Arlington.