Embed Size (px)
Citation preview
Plant Physiol. (1979) 63, 1089-10940032-0889/79/63/1089/06/$O0.50/0
Hysteresis in the Responses of Membrane Potential, MembraneResistance, and Growth Rate to Cyclic Temperature Change'
Received for publication August 8, 1978 and in revised form January 19, 1979
HADASSAH MELAMED-HAREL AND LEONORA REINHOLDDepartment of Botany, Hebrew University of Jerusalem, Israel
ABSTRACT
Measurements of electrical potential membrane resistance, and elon-gation rate have been carried out on the developing pollen tube of OenotheraUMmondia.Tbe plasmalemma potential was observed to be -138 millivolts ± 19
(SD). Approximately 70% of this potential was apparently due to theoperation of an electrogenic pump(s). KCN rapidly and reversibly depolar-ized the potential to about -40 milUvolts. Lowering the temperature from20 to 4 C brought about similar rapid depolarization. The effects of KCNand of temperature were in no degree additive. KCN had only a small effecton membrane resistance. In contrast, the latter was markedly increased bylowering the temperature.When the polen tubes were submitted to cyclic temperature changes
striking hysteresis effects were observed in the response of all threeparameters, membrane potential, resistance, and growth rate. The hyster-esis pattern for potential differed from that for resistance but resembledthat for growth rate (measured simultaneously on the same pollen tube).The correlation coefficient between potential and growth rate was veryhighhThe probable relevance to our results of the hysteresis phenomena
associated with "clustering" and phase transition in lipids is pointed out.Attention is also drawn to the possible significance of the large differencebetween the electrc potentials at the start of the cooling and heatingpaths, respectively.
The germinating pollen tube has a number of important advan-tages from the point of view of electrophysiological studies. It isa single cell of dimensions far exceeding those of most higherplant cells, reaching a length of many mm in vitro and a diameterof about 18 um. This facilitates the insertion of microelectrodes.Since it is an isolated cell, its electric phenomena can be studiedwithout interference from neighboring cells (cf. 20). Moreover, itis fast growing; cell elongation can be followed over short timeintervals and compared with the electric potential measurementsmade simultaneously on the same cell. Growth and potentialmeasurements have hitherto rarely been collected simultaneously;and where they have been, growth has been assessed from theaggregate growth rate of a tissue segment (e.g. 19). These consid-erations led us to undertake a simultaneous study of the electricalproperties and the growth of the developing pollen tubes ofOenothera drummondiiDuring the course of our investigation Jaffe, Weisenseel, and
their collaborators have published a number of interesting obser-vations (13, 27, 28) with regard to electric currents traversing the
'The data are taken from a dissertation to be submitted by H. M.-H. tothe Hebrew University of Jerusalem in partial fulfillment of the require-ments for a Ph.D. degree.
length of lily pollen tubes as measured by extemal electrodes.They have reported a rapid and parallel reduction in growth andcurrent when the K+ concentration was reduced.
In this first communication we present evidence for the opera-tion of an electrogenic pump and report on marked hysteresispatterns discernible in the responses ofmembrane potential, mem-brane resistance, and cell elongation rate to cyclic temperaturechanges.
MATERIALS AND METHODS
Flowers of 0. drummondii Hook were picked on the campus ofthe University immediately after their evening opening. They werestored for a maximum of 3 days at 2 C, during which period fullviability of the pollen grains was maintained. Before experimentspollen grains were removed from the flowers and placed on blocksof 1% agar of the following standard composition: 1 mm K+, 1.3mM Ca21, 1 mM Mg2, 3.7 mM N03, I mM So42-, 1.7 mM H3BO3,300 mm sucrose. The pH of this culture medium was between 5.5and 6.0. The pollen grains germinated within 20 min at 26 C andwhen the pollen tubes had reached a length of 30 to 100 Am theywere transferred to the laboratory and used for the experiments at20 C.
Electrical Measurements. Micropipettes were prepared andfilled with a filtered solution of 2 M KCI in 1% agar (3). The highviscosity of the latter countered the tendency of the cytoplasm toplug the electrode tip. The pipettes used were less than 0.5 ,um indiameter with a tip potential of 20 to 30 mv and a resistance of 20to 40 m12 as measured in the culture medium. They were held byelectrode holders (EH-2R, W. P. Instruments). The referenceelectrode was of the type RC- I supplied by the same company.The electrodes were connected to a high impedance amplifier(locally constructed). The voltage was displayed on a Tektronixstorage oscilloscope, model 5103 N/D 15 with 5 A 20N dual traceamplifier and 5 B ION time base amplifier. It was also recordedon an X-Y recorder (Yokogawa Technicorder 3078).Membrane resistance was measured by application through an
inserted microelectrode of a sinusoidal current (frequency 1 Hz,amplitude 3 vamp cm-2) supplied by an HF VGG generator(Wavetek model 12). This current electrode was connected to ahigh impedance input electrometer amplifier (Keithley 603) andto X axis of the recorder. A second electrode, which measured thepotential, was connected to the Y axis. It was inserted into thepollen tube approximately 150 ,um from the first. The resistancewas calculated from the slope of the long axis of the ellipticalcurve relating voltage to current. Correction for phase angle(equation 4.6 of ref. 4) would only raise the estimated resistanceby at most 5%. On the other hand, since the space constant wasestimated to be 1.5 mm, the membrane resistance will have beenunderestimated by about 10%o because of the cable effect. (Thespace constant observed is intermediate between that reported forAcetabularia [41 and that quoted for higher plant cells [4]. It ispossible to insert two electrodes in pollen tubes considerablyfurther apart than is feasible in most higher plant cells, and this
1089 www.plant.org on May 2, 2016 - Published by www.plantphysiol.orgDownloaded from
Copyright © 1979 American Society of Plant Biologists. All rights reserved.

MELAMED-HAREL AND REINHOLD
may lessen membrane injury and therefore current leakage.)Routinely, the microelectrodes were inserted into the pollen
tubes under a binocular microscope (Nikon) at a magnification ofx40, using micromanipulators (Narishige).Growth Measurements. Elongation of the pollen tubes was
followed by photographing them through the binocular micro-scope with a Nikon semiautomatic microflex EFM M355 camera.Substage illumination was provided by a flashlight (Metz Meca-blitz III). Elongation rate was assessed by comparison ofsequentialphotographs taken at known time intervals (Fig. 1). The operationof the flashlight induced a brief change in current in the recordingsystem, thus indicating on the tracing the timing of the photo-graphs and providing a means of synchronizing growth andpotential measurements.
Experiments Involving Changes in Temperature. A glass cellwas constructed with inlet and outlet tubes through which waterat various temperatures could be circulated from a Hetofrig ther-mostatted bath. A deep depression in the upper surface of thisglass cell contained the thin agar block (I mm thick) bearing thepollen tubes. A thermistor (RFL Industries 27687-5) was fixed tothe upper surface of the glass cell next to the agar block andconnected to an electrometer (Keithley Par-TM model 134). Thetemperature was calculated from the measured resistance.
RESULTS
The membrane potential of Oenothera pollen tubes germinatingon our standard agar was -138 mv ± 19 (SD). This figure is basedon over 100 separate determinations. The standard deviationindicates that the potential varied comparatively little over theseasons and the years of this investigation. This potential can beregarded as the plasmalemma potential, since first, it was observedwhen the electrode was inserted with'in 200 ,um of the tip, whereno vacuole or tonoplast is yet observable; and second the tonoplast(vacuolar) potential is in any case small compared with theplasmalemma potential, as will be demonstrated in a future com-
50Sm
A
-4ZY..R . *R .
B
FIG. 1. Sequential photographs of tip of elongating pollen tube as used
for estimating elongation rate. Time interval between A and B, 100 s;between B and C, 70 s.
E
a
0._
0
0
.0A
25
20 2
15 a
10 ES
5
Temperature (C)FIG. 2. Effect of temperature on membrane potential. A: tracings of
potential (V) and of temperature (T) from experiment where temperaturewas first lowered and then raised again. B: analysis of potential shown inA as a function of temperature. Points indicate half-min intervals. Forexplanation of letters and dotted lines, see text. C: potential as a functionof temperature obtained in another experiment by simultaneous recordingon an X-Y recorder. Note: In all three figures the temperature scale isnonlinear.
munication (Melamed-Harel and Reinhold, in preparation). Itscontribution to the sum of the two potentials in cases where theelectrode penetrates the tonoplast is small enough to lie within theexperimental error of the determination of the plasmalemmapotential. The potential accords well with that observed byMatschkal and Weisenseel (27) in lily pollen tubes.
Effect of Temperature on Membrane Potential. In the experi-ment shown in Figure 2 the temperature was lowered from 26 to4 C over the course of about 6 min (see thermistor trace in Fig.2A). An immediate effect is seen on the potential which droppedat first rapidly and then more slowly to reach a level approximately30%o of the initial value. When the temperature was raised again,a rise in potential followed only after a lag period of about 2.5min. The rise in potential was then steep.When the changes in potential described above were analyzed
as a function of temperature, a hysteresis pattern clearly emerged(Fig. 2B). Figure 2C is an example of a pattern obtained in asubsequent experiment by direct recording of potential versustemperature on an X-Y recorder. The cooling pathway differsfrom the heating pathway. The former shows three phases: a steepdrop in potential, followed by a more gradual drop, followedagain by a steeper drop. On reheating, on the other hand, there isat first a phase of little or no rise in potential, followed by a sharprise. (We judge it desirable to present the actual recorder tracingsin these experiments, though this necessitates a temperature scale
1090 Plant Physiol. Vol. 63, 1979
I, M:.4 .)IJpqIJFW. ."- Ef
't, .40:
www.plant.org on May 2, 2016 - Published by www.plantphysiol.orgDownloaded from Copyright © 1979 American Society of Plant Biologists. All rights reserved.
HYSTERESIS IN MEMBRANE POTENTIAL AND GROWTH
nonlinear at its extremes, due to the characteristics of the therm-istor. Replotting the data on a linear temperature scale changesthe picture to only a very slight extent.)
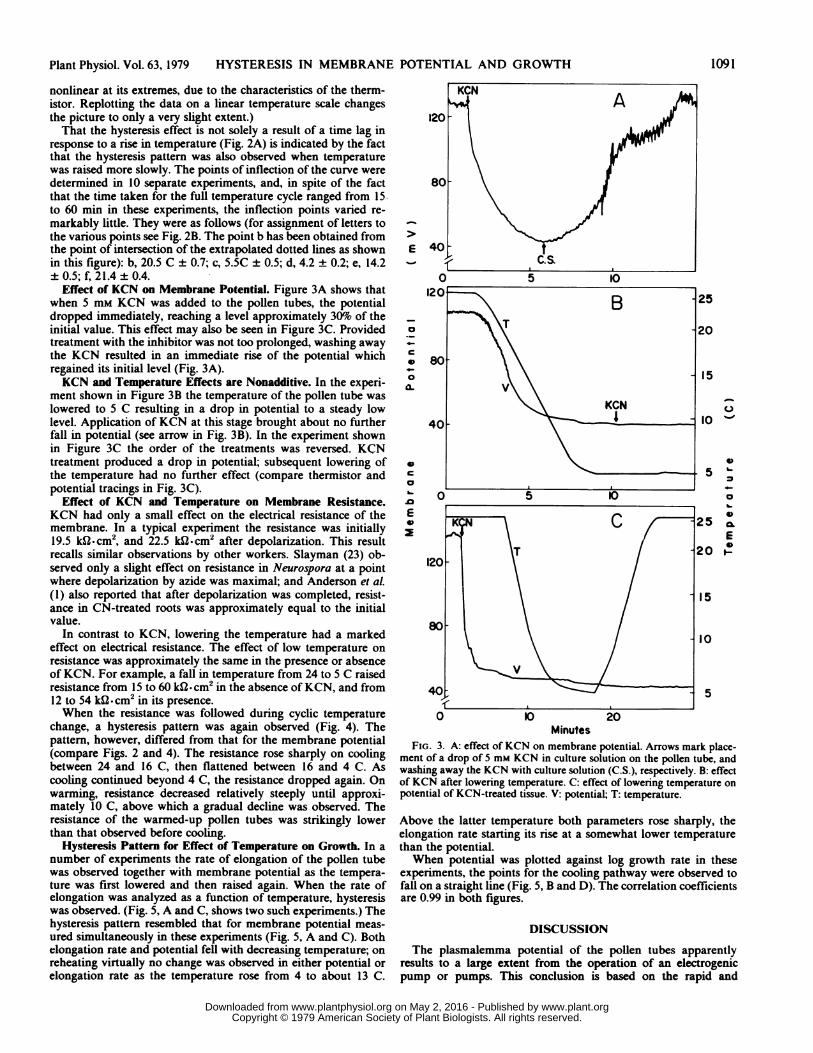
That the hysteresis effect is not solely a result of a time lag inresponse to a rise in temperature (Fig. 2A) is indicated by the factthat the hysteresis pattern was also observed when temperaturewas raised more slowly. The points of inflection of the curve weredetermined in 10 separate experiments, and, in spite of the factthat the time taken for the full temperature cycle ranged from 15-to 60 min in these experiments, the inflection points varied re-markably little. They were as follows (for assignment of letters tothe various points see Fig. 2B. The point b has been obtained fromthe point of intersection of the extrapolated dotted lines as shownin this figure): b, 20.5 C ± 0.7; c, 5.5C ± 0.5; d, 4.2 ± 0.2; e, 14.2± 0.5; f, 21.4 ± 0.4.
Effect of KCN on Membrane Potential. Figure 3A shows thatwhen 5 mm KCN was added to the pollen tubes, the potentialdropped immediately, reaching a level approximately 30%o of theinitial value. This effect may also be seen in Figure 3C. Providedtreatment with the inhibitor was not too prolonged, washing awaythe KCN resulted in an immediate rise of the potential whichregained its initial level (Fig. 3A).KCN and Temperature Effects are Nonadditive. In the experi-
ment shown in Figure 3B the temperature of the pollen tube waslowered to 5 C resulting in a drop in potential to a steady lowlevel. Application of KCN at this stage brought about no furtherfall in potential (see arrow in Fig. 3B). In the experiment shownin Figure 3C the order of the treatments was reversed. KCNtreatment produced a drop in potential; subsequent lowering ofthe temperature had no further effect (compare thermistor andpotential tracings in Fig. 3C).
Effect of KCN and Temperature on Membrane Resistance.KCN had only a small effect on the electrical resistance of themembrane. In a typical experiment the resistance was initially19.5 kSl.cm2, and 22.5 kW-cm' after depolarization. This resultrecalls similar observations by other workers. Slayman (23) ob-served only a slight effect on resistance in Neurospora at a pointwhere depolarization by azide was maximal; and Anderson et al.(1) also reported that after depolarization was completed, resist-ance in CN-treated roots was approximately equal to the initialvalue.
In contrast to KCN, lowering the temperature had a markedeffect on electrical resistance. The effect of low temperature onresistance was approximately the same in the presence or absenceof KCN. For example, a fall in temperature from 24 to 5 C raisedresistance from 15 to 60 k. cm2 in the absence ofKCN, and from12 to 54 kl.cm2 in its presence.When the resistance was followed during cyclic temperature
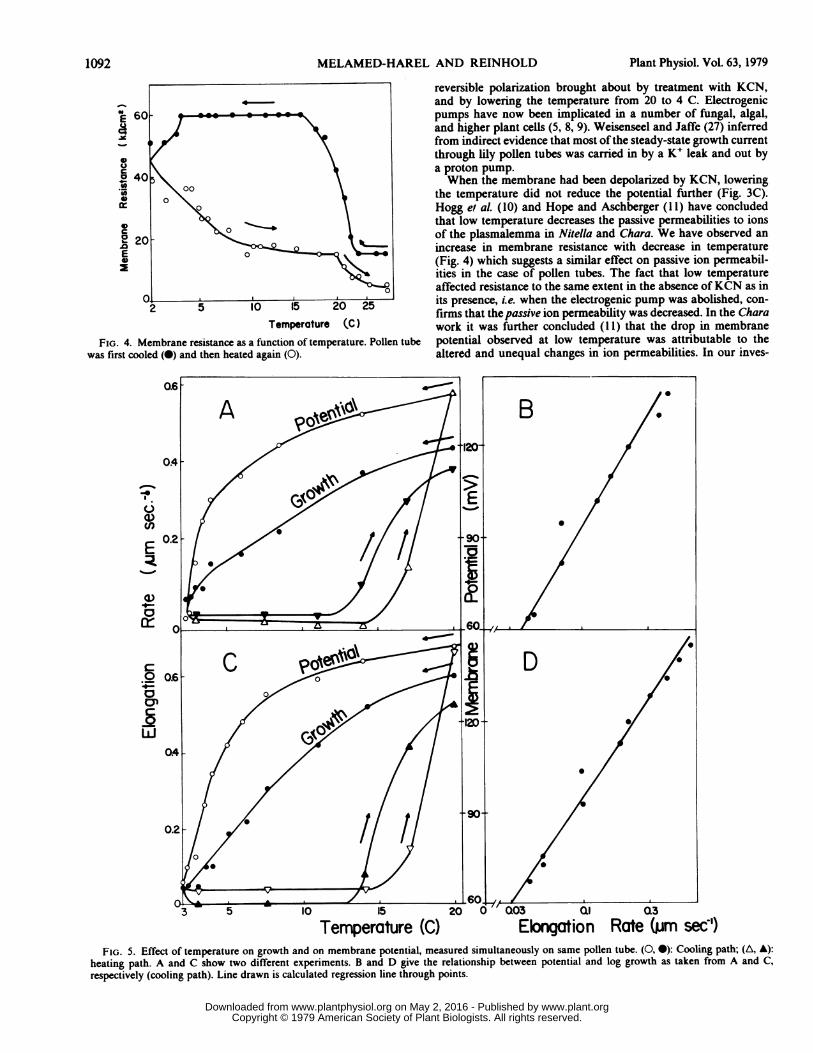
change, a hysteresis pattern was again observed (Fig. 4). Thepattern, however, differed from that for the membrane potential(compare Figs. 2 and 4). The resistance rose sharply on coolingbetween 24 and 16 C, then flattened between 16 and 4 C. Ascooling continued beyond 4 C, the resistance dropped again. Onwarming, resistance decreased relatively steeply until approxi-mately 10 C, above which a gradual decline was observed. Theresistance of the warmed-up pollen tubes was strikingly lowerthan that observed before cooling.
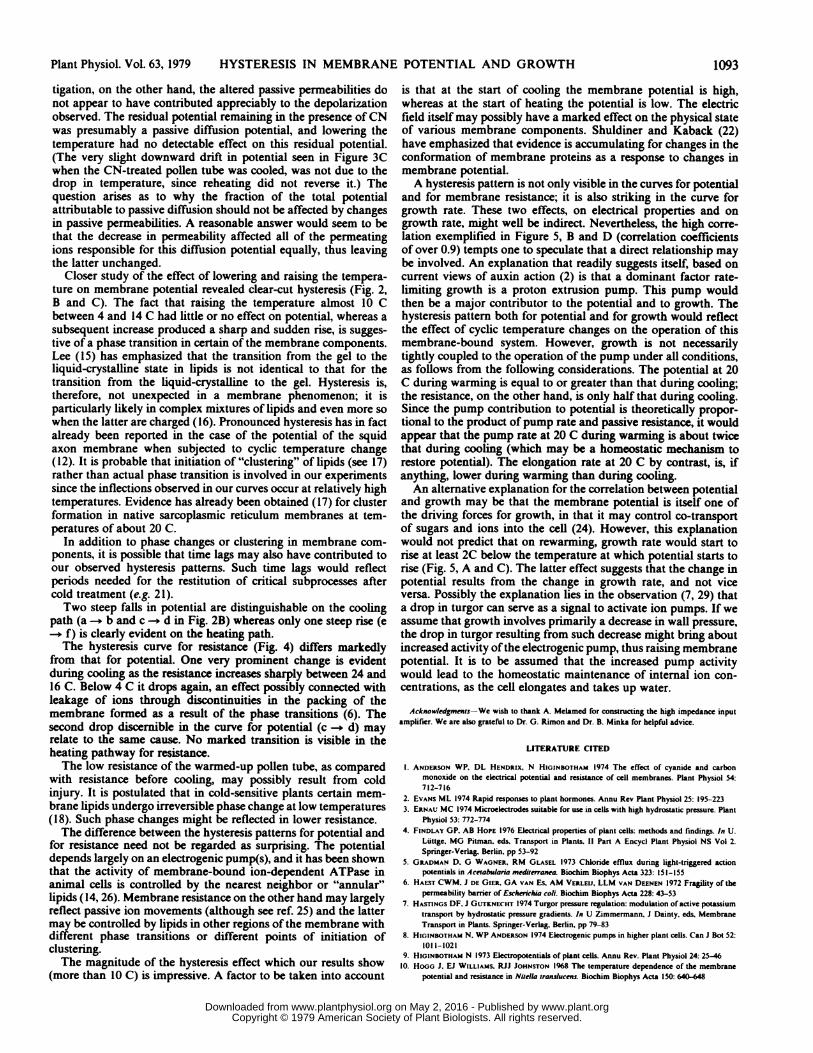
Hysteresis Pattern for Effect of Temperature on Growth. In anumber of experiments the rate of elongation of the pollen tubewas observed together with membrane potential as the tempera-ture was first lowered and then raised again. When the rate ofelongation was analyzed as a function of temperature, hysteresiswas observed. (Fig. 5, A and C, shows two such experiments.) Thehysteresis pattern resembled that for membrane potential meas-ured simultaneously in these experiments (Fig. 5, A and C). Bothelongation rate and potential fell with decreasing temperature; onreheating virtually no change was observed in either potential orelongation rate as the temperature rose from 4 to about 13 C.
E%-
0
0--
c0
0iL
0c
a.0
.02
U
0
0.
E0I.-
MinutesFIG. 3. A: effect of KCN on membrane potential. Arrows mark place-
ment of a drop of 5 mM KCN in culture solution on the pollen tube, andwashing away the KCN with culture solution (C.S.), respectively. B: effectof KCN after lowering temperature. C: effect of lowering temperature onpotential of KCN-treated tissue. V: potential; T: temperature.
Above the latter temperature both parameters rose sharply, theelongation rate starting its rise at a somewhat lower temperaturethan the potential.When potential was plotted against log growth rate in these
experiments, the points for the cooling pathway were observed tofall on a straight line (Fig. 5, B and D). The correlation coefficientsare 0.99 in both figures.
DISCUSSION
The plasmalemma potential of the pollen tubes apparentlyresults to a large extent from the operation of an electrogenicpump or pumps. This conclusion is based on the rapid and
Plant Physiol. Vol. 63, 1979 1091
www.plant.org on May 2, 2016 - Published by www.plantphysiol.orgDownloaded from Copyright © 1979 American Society of Plant Biologists. All rights reserved.
MELAMED-HAREL AND REINHOLD
E860-
40
2 0
20
E
2 5S10 15 20 25Temperature (C)
FIG. 4. Membrane resistance as a function of temperature. Pollen tubewas first cooled (0) and then heated again (0).
reversible polarization brought about by treatment with KCN,and by lowering the temperature from 20 to 4 C. Electrogenicpumps have now been implicated in a number of fungal, algal,and higher plant cells (5, 8, 9). Weisenseel and Jaffe (27) inferredfrom indirect evidence that most of the steady-state growth currentthrough lily pollen tubes was carried in by a K+ leak and out bya proton pump.When the membrane had been depolarized by KCN, lowering
the temperature did not reduce the potential further (Fig. 3C).Hogg et al. (10) and Hope and Aschberger (11) have concludedthat low temperature decreases the passive permeabilities to ionsof the plasmalemma in Nitella and Chara. We have observed anincrease in membrane resistance with decrease in temperature(Fig. 4) which suggests a similar effect on passive ion permeabil-ities in the case of pollen tubes. The fact that low temperatureaffected resistance to the same extent in the absence ofKCN as inits presence, i.e. when the electrogenic pump was abolished, con-firms that the passive ion permeability was decreased. In the Charawork it was further concluded (11) that the drop in membranepotential observed at low temperature was attributable to thealtered and unequal changes in ion permeabilities. In our inves-
a) 0
0 60-~~~~~~~~~~~~~~~~~~~~~~~~
0.6 C
04-
0.24
--6013 5 10 15 20 0 Q03 Ql Q3
Temnperature (C) Elgation Rate (mm sec')FIG. 5. Effect of temperature on growth and on membrane potential, measured simultaneously on same pollen tube. (0, 0): Cooling path; (A, A):
heating path. A and C show two different experiments. B and D give the relationship between potential and log growth as taken from A and C,respectively (cooling path). Line drawn is calculated regression line through points.
Plant Physiol. Vol. 63, 19791092
www.plant.org on May 2, 2016 - Published by www.plantphysiol.orgDownloaded from Copyright © 1979 American Society of Plant Biologists. All rights reserved.
HYSTERESIS IN MEMBRANE POTENTIAL AND GROWTH
tigation, on the other hand, the altered passive permeabilities donot appear to have contributed appreciably to the depolarizationobserved. The residual potential remaining in the presence of CNwas presumably a passive diffusion potential, and lowering thetemperature had no detectable effect on this residual potential.(The very slight downward drift in potential seen in Figure 3Cwhen the CN-treated pollen tube was cooled, was not due to thedrop in temperature, since reheating did not reverse it.) Thequestion arises as to why the fraction of the total potentialattributable to passive diffusion should not be affected by changesin passive permeabilities. A reasonable answer would seem to bethat the decrease in permeability affected all of the permeatingions responsible for this diffusion potential equally, thus leavingthe latter unchanged.
Closer study of the effect of lowering and raising the tempera-ture on membrane potential revealed clear-cut hysteresis (Fig. 2,B and C). The fact that raising the temperature almost 10 Cbetween 4 and 14 C had little or no effect on potential, whereas asubsequent increase produced a sharp and sudden rise, is sugges-tive of a phase transition in certain of the membrane components.Lee (15) has emphasized that the transition from the gel to theliquid-crystalline state in lipids is not identical to that for thetransition from the liquid-crystalline to the gel. Hysteresis is,therefore, not unexpected in a membrane phenomenon; it isparticularly likely in complex mixtures of lipids and even more sowhen the latter are charged (16). Pronounced hysteresis has in factalready been reported in the case of the potential of the squidaxon membrane when subjected to cyclic temperature change(12). It is probable that initiation of "clustering" of lipids (see 17)rather than actual phase transition is involved in our experimentssince the inflections observed in our curves occur at relatively hightemperatures. Evidence has already been obtained (17) for clusterformation in native sarcoplasmic reticulum membranes at tem-peratures of about 20 C.
In addition to phase changes or clustering in membrane com-ponents, it is possible that time lags may also have contributed toour observed hysteresis patterns. Such time lags would reflectperiods needed for the restitution of critical subprocesses aftercold treatment (e.g. 21).Two steep fails in potential are distinguishable on the cooling
path (a -* b and c -. d in Fig. 2B) whereas only one steep rise (e- f) is clearly evident on the heating path.The hysteresis curve for resistance (Fig. 4) differs markedly
from that for potential. One very prominent change is evidentduring cooling as the resistance increases sharply between 24 and16 C. Below 4 C it drops again, an effect possibly connected withleakage of ions through discontinuities in the packing of themembrane formed as a result of the phase transitions (6). Thesecond drop discernible in the curve for potential (c -. d) mayrelate to the same cause. No marked transition is visible in theheating pathway for resistance.The low resistance of the warmed-up pollen tube, as compared
with resistance before cooling, may possibly result from coldinjury. It is postulated that in cold-sensitive plants certain mem-brane lipids undergo irreversible phase change at low temperatures(18). Such phase changes might be reflected in lower resistance.The difference between the hysteresis patterns for potential and
for resistance need not be regarded as surprising. The potentialdepends largely on an electrogenic pump(s), and it has been shownthat the activity of membrane-bound ion-dependent ATPase inanimal cells is controlled by the nearest neighbor or "annular"lipids (14, 26). Membrane resistance on the other hand may largelyreflect passive ion movements (although see ref. 25) and the lattermay be controlled by lipids in other regions of the membrane withdifferent phase transitions or different points of initiation ofclustering.The magnitude of the hysteresis effect which our results show
(more than 10 C) is impressive. A factor to be taken into account
is that at the start of cooling the membrane potential is high,whereas at the start of heating the potential is low. The electricfield itself may possibly have a marked effect on the physical stateof various membrane components. Shuldiner and Kaback (22)have emphasized that evidence is accumulating for changes in theconformation of membrane proteins as a response to changes inmembrane potential.A hysteresis pattern is not only visible in the curves for potential
and for membrane resistance; it is also striking in the curve forgrowth rate. These two effects, on electrical properties and ongrowth rate, might well be indirect. Nevertheless, the high corre-lation exemplified in Figure 5, B and D (correlation coefficientsof over 0.9) tempts one to speculate that a direct relationship maybe involved. An explanation that readily suggests itself, based oncurrent views of auxin action (2) is that a dominant factor rate-limiting growth is a proton extrusion pump. This pump wouldthen be a major contributor to the potential and to growth. Thehysteresis pattern both for potential and for growth would reflectthe effect of cyclic temperature changes on the operation of thismembrane-bound system. However, growth is not necessarilytightly coupled to the operation of the pump under all conditions,as follows from the following considerations. The potential at 20C during warming is equal to or greater than that during cooling;the resistance, on the other hand, is only half that during cooling.Since the pump contribution to potential is theoretically propor-tional to the product of pump rate and passive resistance, it wouldappear that the pump rate at 20 C during warming is about twicethat during cooling (which may be a homeostatic mechanism torestore potential). The elongation rate at 20 C by contrast, is, ifanything, lower during warming than during cooling.An alternative explanation for the correlation between potential
and growth may be that the membrane potential is itself one ofthe driving forces for growth, in that it may control co-transportof sugars and ions into the cell (24). However, this explanationwould not predict that on rewarming, growth rate would start torise at least 2C below the temperature at which potential starts torise (Fig. 5, A and C). The latter effect suggests that the change inpotential results from the change in growth rate, and not viceversa. Possibly the explanation lies in the observation (7, 29) thata drop in turgor can serve as a signal to activate ion pumps. If weassume that growth involves primarily a decrease in wall pressure,the drop in turgor resulting from such decrease might bring aboutincreased activity ofthe electrogenic pump, thus raising membranepotential. It is to be assumed that the increased pump activitywould lead to the homeostatic maintenance of internal ion con-centrations, as the cell elongates and takes up water.
Acknowledgments-We wish to thank A. Mclamed for constructing the high impedance inputamplifier. We are also grateful to Dr. G. Rimon and Dr. B. Minka for helpful advice.
LITERATURE CITED
1. ANDERSON WP. DL HENDRIX, N HIGINBOTHAM 1974 The effect of cyanide and carbonmonoxide on the electrical potential and resistance of cell membranes. Plant Physiol 54:712-716
2. EVANS ML 1974 Rapid responses to plant hormones. Annu Rev Plant Physiol 25: 195-2233. ERNAU MC 1974 Microeectrodes suitable for use in cells with high hydrostatic pressure. Plant
Physiol 53: 772-7744. FINDLAY GP. AB HOPE 1976 Eklctrical properties of plant cells: methods and findings. In U.
Luttge, MG Pitman. eds. Transport in Plants, 11 Part A Encycl Plant Physiol NS Vol 2.Springer-Verlag, Berlin. pp 53-92
5. GRADMAN D. G WAGNER, RM GLASEL 1973 Chloride efflux during light-triggered actionpotentials in Aceiabularia medierramea Biochim Biophys Acta 323: 151-155
6. HAEST CWM. J DE GIER GA VAN Es. AM VERLEU, LLM VAN DEENEN 1972 Fragility of thepermeability barrier of Escherichia coli. Biochim Biophys Acta 228: 43-53
7. HAsnNGs DF. J GUTICNECHT 1974 Turgor pressure regulation: modulation of active potassiumtransport by hydrostatic pressure gradients. In U Zimmermann, J Dainty. eds. MembraneTransport in Plants. Springer-Verlag. Berlin. pp 79-83
8. HIGINBOTHAM N. WP ANDERSON 1974 Electrogenic pumps in higher plant cells. Can J Bot 52:1011-1021
9. HIGINBOTHAm N 1973 Eletropotentials of plant cells. Annu Rev. Plant Physiol 24: 25-4610. HOGG J. EJ WILLIAMS. RJJ JOHNSTON 1968 The temperature dependence of the membrane
potential and resistance in Nisella translucens. Biochim Biophys Acta 150: 640-648
Plant Physiol. Vol. 63, 1979 1093
www.plant.org on May 2, 2016 - Published by www.plantphysiol.orgDownloaded from Copyright © 1979 American Society of Plant Biologists. All rights reserved.
1094 MELAMED-HAREL AND REINHOLD Plant Physiol. Vol. 63, 1979
11. HOPE AB, PA ASCHBERGER 1970 Effects of temperature on membrane permeability to ions. 21. REBHUN Ll. JR ROSENBAUM, P LEFEBVRE. G SMITH 1974 Reversible restoration of theAust J Biol Sci 23: 1047-1060 birefringence of cold treated isolated mitotic apparatus of surf clam eggs with chick brain
12. INOUE 1, Y KOBATAKE, I TASAKI 1973 Excitability. instability and phase transitions in squid tubulin. Nature 249: 113-115axon membrane under internal perfusion with dilute salt solutions. Biochim Biophys Acta 22. SHULDINER S. HR KABACK 1977 Fluorescent galactosides as probes for the lac carrier protein.307: 471-477 Biochim Biophys Acta 472: 399-418
13. JAFFE LA. MH WEISENSEEL, LF JAFFE 1975 Calcium accumulations within the growing tips of 23. SLAYMAN CL 1965 Electrical properties of Neurospora crassa respiration and the intracellularpollen tubes. J Cell Biol 67: 488-492 potential. J Gen Physiol 49: 93-116
14. JOST PC. OH GRIFFITH, RA CAPALDI, G VANDERKOOI 1973 Evidence for boundary lipid in 24. SLAYMAN CL 1974 Proton pumping and generalized energetics of transport: a review. In Umembranes. Proc Nat Acad Sci USA 70: 480-484 Zimmermann. J Dainty, eds, Membrane Transport in Plants. Springer-Verlag, Berlin, pp
15. LEE AG 1977 Lipid phase transitions and phase diagrams. 1. Lipid phase transition. Biochim 107-119Biophys Acta 472: 237-281 25. SPANSWICK RM 1972 Evidence for an electrogenic ion pump in Nitella iranslucens. 1. The
16. LEE AG 1977 Lipid phase transitions and phase diagrams. II. Mixtures involving lipids. Effects of pH. K+. Na'. light and temperature on the membrane potential and resistance.Biochim Biophys Acta 472: 285-344 Biochim Biophys Acta 288: 73-89
17. LEE AG, JM BIRDSALL, JC METCALFE, PA TOON, GB WARREN 1974 Clusters in lipid bilayers 26. WARREN GB, HD HOUSI-AY. JC METCALFE 1975 Cholesterol is excluded from the phospholipidand interpretation of thermal effects in biological membranes. Biochemistry 13: 3699-3705 annulus surrounding an active calcium transport protein. Nature 255: 684-687
18. LYONS JM 1973 Chilling injury in plants. Annu Rev Plant Physiol 24: 445-466 27. WEISENSEEL MH, LF JAFFE 1976 The major growth current through lily pollen tubes enters as19. NELLES A 1977 Short-term effect of plant hormones on membrane potential and membrane K+ and leaves as Ht. Planta 133: 1-7
permeability of dwarf maize coleoptile cells (Zea maYs L. di) in comparison with growth 28. WEISENSEEL MH. R NUCCITEI.I.I LF JAFFE 1975 Large electrical currents traverse growingresponse. Planta 137: 293-298 pollen tubes. J Cell Biol 66: 556-567
20. PICKARD BG 1972 Spontaneous electrical activity in shoots of Ipomea, Pisum and Xanthium. 29. ZIMMERMAN U. E STEUDLE, PI LELKES 1976 Turgor pressure regulation in Valonia uliricularis.Planta 102: 91-114 Plant Physiol 58: 608-613
www.plant.org on May 2, 2016 - Published by www.plantphysiol.orgDownloaded from Copyright © 1979 American Society of Plant Biologists. All rights reserved.