Embed Size (px)
Citation preview

Seediscussions,stats,andauthorprofilesforthispublicationat:https://www.researchgate.net/publication/319931354
Hysteresismodellingofreinforcedconcretecolumnsunderpurecyclictorsionalloading
ArticleinStructuralEngineering&Mechanics·October2017
DOI:10.12989/sem.2017.64.1.000
CITATIONS
0
READS
57
3authors:
Someoftheauthorsofthispublicationarealsoworkingontheserelatedprojects:
BehaviourofPrecastPrestressedHollowcoreslabswithopeningsandtheirstrengtheningusingFRP
compositesViewproject
BEHAVIOUROFPRESTRESSEDHOLLOWCORESLABSHYBRIDSTRENGTHENEDUSINGBONDED
OVERLAYANDFRPCOMPOSITESUNDERFLEXURE-SHEARViewproject
TarutalGhoshMondal
PurdueUniversity
12PUBLICATIONS27CITATIONS
SEEPROFILE
SriharshaReddyKothamuthyala
IndianInstituteofTechnologyHyderabad
2PUBLICATIONS0CITATIONS
SEEPROFILE
SuriyaPrakashShanmugam
IndianInstituteofTechnologyHyderabad
55PUBLICATIONS173CITATIONS
SEEPROFILE
AllcontentfollowingthispagewasuploadedbySuriyaPrakashShanmugamon11October2017.
Theuserhasrequestedenhancementofthedownloadedfile.

Structural Engineering and Mechanics, Vol. 64, No. 1 (2017) 11-21
DOI: https://doi.org/10.12989/sem.2017.64.1.011 11
Copyright © 2017 Techno-Press, Ltd. http://www.techno-press.com/journals/sem&subpage=7 ISSN: 1225-4568 (Print), 1598-6217 (Online)
1. Introduction
Reinforced concrete (RC) members undergo torsional
loading under various conditions (Mondal and Prakash
2015a). Torsion in bridge columns can be induced by
skewed or horizontally curved bridges, bridges with
outrigger bents and unequal spans or column heights.
Therefore, RC columns should be properly designed to
dissipate seismic energy adequately through inelastic
deformation under vibrations during earthquakes in the
presence of torsional loading. Seismic analysis of RC
columns requires development of accurate hysteresis model
that can predict the stiffness degradation, strength
degradation, ductility and damage characteristics of the
members under cyclic loading (Prakash 2009, Prakash and
Belarbi 2010, Belarbi et al. 2010, Goodnight et al. 2013).
Moreover, understanding the effects of torsion on hysteretic
energy dissipation is essential for developing the damage
based design approaches for designing new structural
elements as well as for determining retrofit solutions for
existing elements. Owing to all these reasons it is important
to have a proper hysteresis model which can accurately
predict the cyclic torsional behavior of RC members
considering strength and stiffness degradation along with
the pinching effects.
A review of previous studies indicates that, hysteresis
modelling approaches adopted by different researchers in
Corresponding author, Professor
E-mail: [email protected]
the past are predominantly of two types, namely polygonal
hysteresis models (PHMs) and smooth differential models
(SDM). In polygonal hysteresis models, the response of an
entity is represented by a set of path defining piecewise
linear or nonlinear functions. The PHMs are governed by
empirical laws derived based on experimental observations
representing a certain range of the parameters that influence
the behavior under cyclic loading. On the other hand,
smooth differential models predict the response of a
member to a reversed cyclic loading using set of ordinary
differential equations.
In polygonal hysteresis models, the hysteresis response
of the structural member is predicted using set of control
points and paths defined by piecewise linear or nonlinear
functions. The control points are established where the
change in slope occurs due to the opening and closing of
cracks or due to the pinching effect in the case of cyclic
loading. The control points and the rules governing the
behavior are established from experimental observations
and analyzing the experimental data closely. The response
of the member is analyzed and is observed to vary with the
selected sectional and geometric parameters, the
corresponding trend in variation will be the law that
governs the behavior. Polygonal hysteresis model by
Clough and Johnston (1966) is well known in literature,
which uses bilinear primary curve. The primary curve is the
response of the member under monotonic loading which
acts as basic envelope or backbone and is essential in close
prediction of the cyclic response. The accuracy in
predicting the cyclic response depends on the accuracy in
prediction of the primary curve. Takeda et al. (1970)
proposed a tri-linear primary curve by including the
Hysteresis modelling of reinforced concrete columns under pure cyclic torsional loading
Tarutal Ghosh Mondal1, Sriharsha R. Kothamuthyala2 and S. Suriya Prakash2
1School of Civil Engineering, Purdue University, United States
2Department of Civil Engineering, Indian Institute of Technology Hyderabad, India
(Received May 17, 2017, Revised June 3, 2017, Accepted June 10, 2017)
Abstract. It has been observed in the past that, the reinforced concrete (RC) bridge columns are very often subjected to
torsional moment in addition to flexure and shear during seismic vibration. Ignoring torsion in the design can trigger unexpected
shear failure of the columns (Farhey et al. 1993). Performance based seismic design is a popular design philosophy which calls
for accurate prediction of the hysteresis behavior of structural elements to ensure safe and economical design under earthquake
loading. However, very few investigations in the past focused on the development of analytical models to accurately predict the
response of RC members under cyclic torsion. Previously developed hysteresis models are not readily applicable for torsional
loading owing to significant pinching and stiffness degradation associated with torsion (Wang et al. 2014). The present study
proposes an improved polygonal hysteresis model which can accurately predict the hysteretic behavior of RC circular and
square columns under torsion. The primary curve is obtained from mechanics based softened truss model for torsion. The
proposed model is validated with test data of two circular and two square columns. A good correlation is observed between the
predicted and measured torque-twist behavior and dissipated energy.
Keywords: polygonal hysteresis model; RC column; torsion; primary curve; unloading and reloading rules

Tarutal Ghosh Mondal, Sriharsha R. Kothamuthyala and S. Suriya Prakash
(a) H/D(6)-T/M(∞)-0.73%
(b) H/D(3)-T/M(∞)-1.32%
Fig. 1 Primary curves of circular columns under torsion
stiffness change at cracking point in the primary curve and
the rules governing the behavior were proposed based on
the experimental observations. In the pivot hysteresis model
developed by Dowell et al. (1998), the envelope curve
under monotonic loading had four branches characterizing
elastic stiffness, strain hardening, strength degradation and
linearly decreasing residual strength. The loading and
unloading paths were governed by two pivot points which
determine the level of softening with increasing
displacement and also the degree of pinching on load
reversal. Some other notable works in PHM include Fukada
(1969), Aoyama (1971), Atalay and Penzien (1975), Nakata
et al. (1978), Mansur and Hsu (2005) which were
developed from the study of flexure and shear. However, all
these models are incapable of predicting the torsional
behavior (Wang et al. 2014) due to significant pinching,
strength and stiffness degradation. Notable work in studying
the behavior of structural members under torsion were that
of Tirasit and Kawashima (2007), Wang et al. (2014). The
authors conducted experimental study on behavior of
columns under torsion and proposed a semi-empirical
approach for predicting the primary curve. In their
approach, the yielding torsional moment in the primary
curve was calculated using space truss analogy (Rahal and
Collins 1995, Mo and Yang 1996) which has its own
limitations.
Among all SDMs studied previously, the one proposed
by Bouc (1967), Baber and Wen (1981) is most widely used
owing to its versatility and robustness. It is also
(a) TP-92
(b) Missouri
Fig. 2 Primary curves of square columns under torsion
computationally efficient and mathematically tractable. The
model was subsequently modified by Baber and Noori
(1985, 1986) to include the effect of strength and stiffness
degradation and pinching and the improved model is
popularly known as Bouc-Wen-Baber-Noori (BWBN)
model. In the past, Bouc-Wen type models have been used
to predict the cyclic response of different structural systems
such as, reinforced concrete beams and beam-column joints
(Kunnath et al. 1997, Sengupta and Li 2013). However,
BWBN models have limitations in predicting the torsion
dominant behavior which exhibit significant pinching,
strength and stiffness degradation.
2. Research significance
Only a few investigations in the past have focused on
understanding the shear dominant hysteresis behavior
including torsion which is the focus of the present
investigation. A mechanics based approach using tension
stiffened softened truss model previously developed by the
authors for circular and square columns (Mondal and
Prakash 2015b, 2015c, Ganganagoudar et al. 2016a, 2016b)
is used for predicting the primary curve. By adopting a
more reliable primary curve, torsional hysteresis response
can be better predicted. Torsional stiffness reduces
drastically after cracking and this important behavior was
ignored in the previous models. This stiffness change is
accurately captured in the proposed model. Loading and
12

Hysteresis modelling of reinforced concrete columns under pure cyclic torsional loading
Fig. 3 Idealized primary curve
unloading rules for hysteresis behavior is formulated
depending upon the trend observed during the statistical
analysis of the experimental data. An additional control
point has been introduced in the unloading path to capture
the pinching behavior more accurately. The comparison of
predictions indicates that the proposed model is able to
predict the measured experimental behavior closely as
explained in the following sections. The proposed model
can also be extended to understand the hysteresis behavior
under combinations of flexure, shear and torsion loading.
3. Experimental corroboration
The experimental data of circular and square columns
used in this study were tested at University of Missouri
Rolla under pure cyclic torsion (Prakash et al. 2010). One
square column (TP-92) was tested at University of Tokyo
(Tirasit and Kawashima 2007). The circular columns had
different aspect ratio and percentage of transverse
reinforcement. The square column tested at University of
Missouri (Prakash et al. 2012) had octagonal ties. However,
the column tested at University of Tokyo had usual square
ties. More details about the experiments can be found
elsewhere (Prakash and Belarbi 2009, Tirasit and
Kawashima 2007). Due to paucity of test data, development
of the proposed model was based on experimental results of
limited number of test specimens. Validation of the model
for a larger database is a scope of future work.
4. Description of hysteresis model
The model consists of a primary envelope curve (Figs.
1-3) and a set of loading and unloading rules (Fig. 4). The
control points (Figs. 4(b) and 4(d)) which are estimated by
the loading and unloading rules predict the hysteresis loops.
Branches that join the successive points are shown in Figs.
4(a) and 4(c). The transition from one control point to
another is governed by a set of rules that are determined
(a) Definition of parameters ( )
(b) Hysteresis paths ( )
(c) Definition of parameters ( )
(d) Hysteresis paths ( )
Fig. 4 Characteristics of hysteresis loops
ymc ~~~
ymc ~~~
ym ~~
ym ~~
13

Tarutal Ghosh Mondal, Sriharsha R. Kothamuthyala and S. Suriya Prakash
empirically from the experimental data. The details of the
model are described in the following sections. Analytical
prediction for the primary curves are obtained using tension
stiffened-softened truss model (TS-STM) (Mondal and
Prakash 2015b, 2015c) developed by the authors.
4.1 Unloading rules
Unloading rules are determined by statistical analysis of
experimental data. It was found that the unloading rules are
not singular and that they depend on the load reversal point
(Fig. 4). Accordingly, separate set of rules were proposed
based on the position of the load reversal point on the
primary curve. For torsional hysteresis, the unloading rules
are mainly governed by physical phenomenon like
pinching.
1. The unloading path follows the initial stiffness of the
primary curve (path 1→0, 5→0) (Fig. 4) if torsion at the
beginning of the unloading is less than the cracking
torsion (cm TT
~~ ), and
cT~
has not been previously
exceeded in either direction.
2. After cracking, the unloading path becomes a function
of internal variables such as displacement (rotational)
ductility (cm
~~ for
ymc ~~~
, ym
~~ for
ym ~~
)
and current deformation level. From a given unloading
point on the primary curve (mm T
~,
~ ), the hysteresis path
is directed towards (11
~,
~urur T ) (path 2→3, 6→7, 11→12,
15→16, a→b, f→g, m→n, t→u) (Fig. 4) which is
estimated using the expressions shown in Eq. (1) (Figs.
5, 6, 7, and 8).
a. Circular columns:
0498.1~
~
0028.0~
~1
c
m
m
ur
, ymc
~~~ (1a)
0047.1~
~
0004.0
y
m
, ym
~~ (1b)
8527.0~
~
0009.0~
~1
c
m
m
ur
T
T
, ymc
~~~ (1c)
8623.0~
~
0006.0
y
m
, ym
~~ (1d)
b. Square columns
0143.1~
~
0224.0~
~1
c
m
m
ur
,
ymc ~~~
(1e)
931.0~
~
0013.0
c
m
, ym
~~
(1f)
9195.0~
~
0341.0~
~1
c
m
m
ur
T
T
, ymc
~~~ (1g)
8515.0~
~
0125.0
c
m
, ym
~~ (1h)
3. In case of unloading beyond the yield point (ym
~~ ),
from (11
~,
~urur T ), the unloading path leads to (
22
~,
~urur T )
(path b→c, g→h, n→o, u→v) (Fig. 4), which is given
by Eq. (2) (Figs. 9 and 10). However, this branch is non-
existent for unloading before the yield point (
ymc ~~~
).
a. Circular columns:
7101.0~
~
0363.0~
~2
y
m
m
ur
(2a)
3243.0~
~
0126.0~
~2
y
m
m
ur
T
T
(2b)
b. Square columns:
5065.0~
~
0141.0~
~2
y
m
m
ur
(2c)
3121.0~
~
0097.0~
~2
y
m
m
ur
T
T
(2d)
4. Next, the hysteresis loop proceeds straight towards (
0,~
su ) on the zero load axis (path 3→4, 7→8, 12→13,
16→17, c→d, h→i, o→p, v→w) (Fig. 4). The reloading
point ( 0,~
su ) can be calculated as shown in Eq. (3) (Figs.
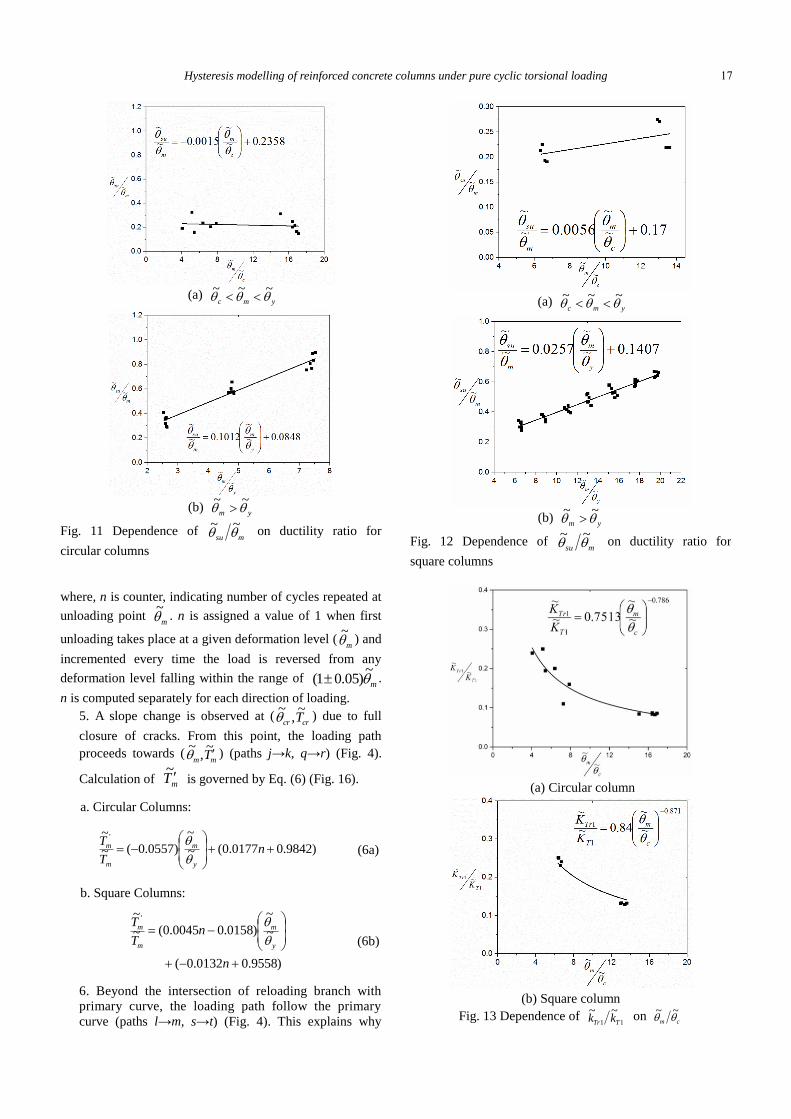
11 and 12). It may be noted here that, at this point there
is some residual deformation even though torsional
resistance is zero. This can be attributed to the inelastic
behavior of the materials.
a. Circular columns:
2358.0~
~
0015.0~
~
c
m
m
su
, ymc
~~~ (3a)
0848.0~
~
1012.0
y
m
, ym
~~ (3b)
b. Square columns:
17.0~
~
0056.0~
~
c
m
m
su
,
ymc ~~~
(3c)
1407.0~
~
0257.0
y
m
,
ym ~~
(3d)
4.2 Loading/reloading rules Loading/reloading rules are another essential component
of PHMs which are generally governed by physical
14

Hysteresis modelling of reinforced concrete columns under pure cyclic torsional loading
(a)
ymc ~~~
(b)
ym ~~
Fig. 5 Dependence of mur
~~1
on ductility ratio for
circular columns
phenomena like strength and stiffness degradation.
1. Initial loading and reloading follow the primary
curve (path 1→0, 5→0) (Fig. 4) until the load is
reversed at a level higher than the cracking load.
2. After cracking, the first loading in the opposite
direction is directed towards the cracking load in the
opposite direction (path 4→5) (Fig. 4).
3. When cracking load on both directions has been
reached, the reloading path, till yielding, the load path
follows a straight line (paths 8→9, 13→14) (Fig. 4)
having a slope given by Eq. (4) (Fig. 13) and it extends
up to the rotational level from where load was reversed
in the previous half-cycle. Since the rotation of the
target point is known, and the slope of the branch is also
known, therefore, the torsional moment at the target
point can be easily computed.
a. Circular columns:
786.0
1
1~
~
7513.0~
~
c
m
T
Tr
K
K
(4a)
b. Square columns:
871.0
1
1~
~
84.0~
~
c
m
T
Tr
K
K
(4b)
4. After yielding, reloading path up to cr
~ (i→j, p→q)
(Fig. 4) follows a straight line passing through (pm T
~,
~ ).
(a)
(b)
Fig. 6 Dependence of mur
~~1
on ductility ratio for square
columns
cr~ can be estimated from Eq. (5a) or Eq. (5c) (Figs.
14(a) and 15(a)) depending upon the shape of the cross-
section. m
~ is the rotation level from where load was
reversed in the previous half-cycle, which is known. pT
~
is obtained from the relation shown in Eq. (5b) or, Eq.
(5d) (Figs. 14(b) and 15(b)). crT
~ can be computed
utilizing the knowledge of the values for m
~,
pT~
and
cr~
.
a. Circular columns:
)0037.00782.0(
~
~
)0766.00067.0(~
~
n
ny
m
m
cr
(5a)
1
~
~
)9425.00783.0(~
~ )3943.11155.0(
n
y
m
m
pn
T
T
(5b)
b. Square columns:
)0184.00867.0(
~
~
)0243.00039.0(~
~
n
ny
m
m
cr
(5c)
ymc ~~~
ym ~~
15

Tarutal Ghosh Mondal, Sriharsha R. Kothamuthyala and S. Suriya Prakash
(a)
(b)
Fig. 7 Dependence of on ductility ratio for circular
columns
(a)
(b)
Fig. 8 Dependence of on ductility ratio for square
columns
Fig. 9 Dependence of and on for
circular columns
Fig. 10 Dependence of and on
for square columns
1
~
~
)4065.22616.0(~
~ )8597.00615.0(
n
y
m
m
pn
T
T
(5d)
ymc ~~~
ym ~~
mur TT~~
1
ymc ~~~
ym ~~
mur TT~~
1
mur ~~
2 mur TT~~
2 ym ~~
mur ~~
2 mur TT~~
2 ym ~~
16
Hysteresis modelling of reinforced concrete columns under pure cyclic torsional loading
(a)
(b)
Fig. 11 Dependence of msu
~~ on ductility ratio for
circular columns
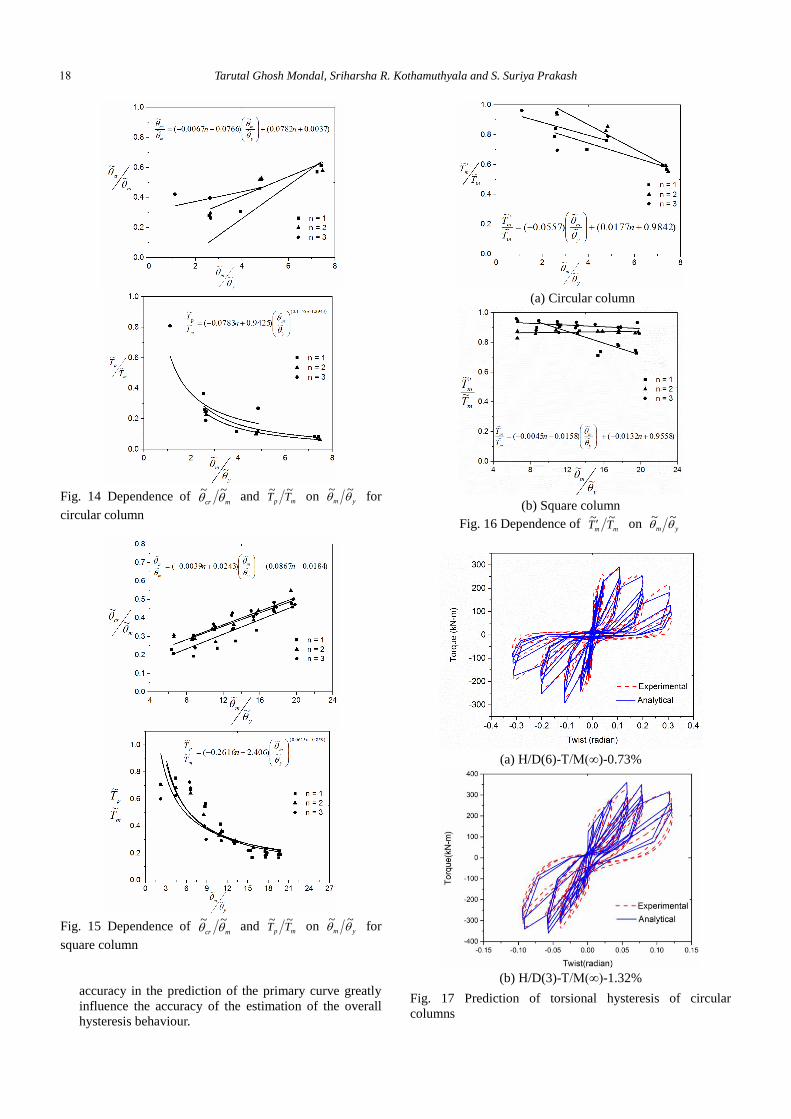
where, n is counter, indicating number of cycles repeated at
unloading point m
~. n is assigned a value of 1 when first
unloading takes place at a given deformation level (m
~) and
incremented every time the load is reversed from any
deformation level falling within the range of m
~)05.01( .
n is computed separately for each direction of loading.
5. A slope change is observed at (crcr T
~,
~ ) due to full
closure of cracks. From this point, the loading path
proceeds towards (mm T
~,
~ ) (paths j→k, q→r) (Fig. 4).
Calculation of mT~ is governed by Eq. (6) (Fig. 16).
a. Circular Columns:
)9842.00177.0(~
~
)0557.0(~
~ '
n
T
T
y
m
m
m
(6a)
b. Square Columns:
)9558.00132.0(
~
~
)0158.00045.0(~
~ '
n
nT
T
y
m
m
m
(6b)
6. Beyond the intersection of reloading branch with
primary curve, the loading path follow the primary
curve (paths l→m, s→t) (Fig. 4). This explains why
(a)
(b)
Fig. 12 Dependence of msu
~~ on ductility ratio for
square columns
(a) Circular column
(b) Square column
Fig. 13 Dependence of on
ymc ~~~
ym ~~
ymc ~~~
ym ~~
11
~~TTr kk cm
~~
17
Tarutal Ghosh Mondal, Sriharsha R. Kothamuthyala and S. Suriya Prakash
Fig. 14 Dependence of and on for
circular column
Fig. 15 Dependence of and on for
square column
accuracy in the prediction of the primary curve greatly
influence the accuracy of the estimation of the overall
hysteresis behaviour.
(a) Circular column
(b) Square column
Fig. 16 Dependence of on
(a) H/D(6)-T/M(∞)-0.73%
(b) H/D(3)-T/M(∞)-1.32%
Fig. 17 Prediction of torsional hysteresis of circular
columns
mcr ~~
mp TT~~
ym ~~
mcr ~~
mp TT~~
ym ~~
mm TT~~
ym
~~
18

Hysteresis modelling of reinforced concrete columns under pure cyclic torsional loading
(a) TP-92
(b) Missouri
Fig. 18 Prediction of torsional hysteresis of square columns
5. Results and discussions
5.1 Prediction of torque–twist behavior
The torque-twist behaviour predicted by the proposed
analytical approach is presented and compared with
experimental data in Figs. 17 and 18. It is observed that, the
model predicted the experimental response of the columns
reasonably well. It can also be inferred from the graphs that
the model was able to capture complex phenomena like
strength and stiffness degradation along with the pinching
with reasonable accuracy.
5.2 Comparison of dissipated energy Energy dissipation capacity is one of the most important
parameters for damage assessment and health monitoring of
reinforced concrete members. The dissipated energy is
calculated from the area under the torque twist curves. The
comparison of estimated and observed values of dissipated
energy for all the columns considered in this study is
presented in Fig. 19. Each point in the figures represent
energies corresponding to a complete cycle of deformation.
The figures show that the proposed analytical model can
predict the energy dissipation capacity reinforced concrete
columns under torsional moment with reasonable accuracy.
(a) H/D(6)-T/M(∞)-0.73% (b) H/D(3)-T/M(∞)-1.32%
(c) TP-92 Square column (d) Missouri Square column
Fig. 19 Comparison of experimental and analytical hysteretic energy
19

Tarutal Ghosh Mondal, Sriharsha R. Kothamuthyala and S. Suriya Prakash
5. Conclusions
An improved PHM is proposed in this study for
reinforced concrete circular and square columns subjected
to torsion. The proposed model represents an initial
development of a performance based design approach for
RC bridge columns under torsional loading. A mechanics
based primary curve is used in this study. A slope change
has been suggested at the cracking point unlike in the
previous models for capturing the behavior more precisely.
Unloading and reloading rules are derived based on
experimental observations. An additional control point is
also introduced in the unloading branch for more accurate
prediction of the hysteresis behavior. The predictions of
torque-twist behavior showed close correlation with
experimental data. Comparison of energy dissipation
between square and circular columns of similar sectional
details indicate that square columns exhibited lesser energy
dissipation due to warping effect when compared to circular
columns. The proposed model can be extended in future to
predict the hysteretic response of bridge columns under
combined loading including torsion. Future studies should
also focus on computer implementation of this hysteresis
model to realize its utility fully on seismic analysis of
bridge systems under torsional loading.
Acknowledgments
This research was sponsored by SERB, India. Grant
number is SB/S3/CEE/0060/2013. The authors gratefully
acknowledge their generous support. The authors declare
that they have no conflict of interest.
References
Aoyama, H. (1971), “Analysis on a school building damaged
during the Tockachi-Oki earthquake”, Proceedings of Kanto
District Symposium, Arch. Inst. of Japan, Tokyo, Jan.
Atalay, M.B. and Penzien, J. (1975), “The seismic behaviour of
critical regions of reinforced concrete components influenced
by moment, shear and axial force”, Report No.
UCB/EERC/75/19, University of California, Berkeley.
Baber, T.T. and Noori, M.N. (1985), “Random vibration of
degrading, pinching systems”, J. Eng. Mech., 111(8), 1010-
1026.
Baber, T.T. and Noori, M.N. (1986), “Modeling general hysteresis
behavior and random vibration applications”, J. Vib. Acoust.
Stress Reliab. Des., 108(4), 411-420.
Baber, T.T. and Wen, Y.K. (1981), “Random vibration of hysteretic
degrading systems”, J. Eng. Mech., 107(6), 1069-1087.
Belarbi, A., Prakash, S.S. and Silva, P.F. (2010), “Incorporation of
decoupled damage index models in the performance-based
evaluation of RC circular and square bridge columns under
combined loadings”, ACI Special Publication-SP271, Vol. 271,
79-102.
Bouc, R. (1967), “Forced vibration of mechanical systems with
hysteresis”, Proceedings of 4th conference on Nonlinear
Oscillations (extended abstract).
Clough, R.W. and Johnston, S.B. (1966), “Effects of stiffness
degradation on earthquake ductility requirements”, Proceedings
of the 2nd Japan Earthquake Engineering Symposium, 227-232.
Dowell, R.K., Seible, F. and Wilson, E.L. (1998), “Pivot hysteresis
model for reinforced concrete members”, ACI Struct. J., 95(5),
607-617.
Farhey, D.N., Adin, M.A. and Yankelevsky, D.Z. (1993), “RC flat
slab-column subassemblages under lateral loading”, J. Struct.
Eng., 119(6), 1903-1916.
Fukada, Y. (1969), “A study on the restoring force characteristics
of reinforced concrete buildings”, Proceedings of Kanto District
Symposium, Arch. Inst. of Japan, Tokyo, Japan, No. 40. (in
Japanese)
Ganganagoudar, A.G., Mondal, T.G. and Prakash, S.S. (2016a),
“Analytical and finite element studies on behaviour of FRP
strengthened beams under torsion”, Compos. Struct. J., 153,
876-885.
Ganganagoudar, A.G., Mondal, T.G. and Prakash, S.S. (2016b),
“Improved softened membrane model for reinforced concrete
circular bridge columns under torsion”, J. Bridge Eng., ASCE,
21(7), 04016037.
Goodnight, J., Kowalsky, M. and Nau, J. (2013), “Effect of load
history on performance limit states of circular bridge columns”,
J. Bridge Eng., ASCE, 18(12), 1383-1396.
Kunnath, S.K., Mander, J.B. and Fang, L. (1997), “Parameter
identification for degrading and pinched hysteretic structural
concrete systems”, Eng. Struct., 19(3), 224-232.
Mansour, M. and Hsu, T. (2005), “Behaviour of reinforced
concrete elements under cyclic shear. I: Experiments”, J. Struct.
Eng., ASCE, 131(1), 44-53.
Mo, Y.L. and Yang, R.Y. (1996), “Response of reinforced/
prestressed concrete box structures to dynamically applied
torsion”, Nucl. Eng. Des., 165(1), 25-41.
Mondal, T.G. and Prakash, S.S. (2015a), “Nonlinear finite
element analysis of RC bridge columns under torsion with and
without axial compression”, J. Bridge Eng., 21(2), 04015037.
Mondal, T.G. and Prakash, S.S. (2015b), “Effect of tension
stiffening on the behaviour of reinforced concrete circular
columns under torsion”, Eng. Struct., 92(1), 186-195.
Mondal, T.G. and Prakash, S.S. (2015c), “Effect of tension
stiffening on the behaviour of square RC columns under
torsion”, Struct. Eng. Mech., 54(3), 501-520.
Nakata, S., Sproul, T. and Penzien, J. (1978), “Mathematical
modeling of hysteresis loops for reinforced concrete columns”,
Report No. UCB/EERC/78/11, University of California,
Berkeley, California.
Prakash, S., Belarbi, A. and You, Y.M. (2010), “Seismic
performance of circular RC columns subjected to axial force,
bending, and torsion with low and moderate shear”, Eng.
Struct., 32(1), 46-59.
Prakash, S.S. (2009), “Seismic behavior of RC circular columns
under combined loading including torsion.”, PhD Thesis, Thesis
number: T 9562, Department of Civil Engineering, Missouri
University of Science and Technology, Missouri, USA.
Prakash, S.S. and Belarbi, A. (2009), “Bending-shear-torsion
interaction features of RC circular bridge columns-An
experimental study”, Special Publication-SP265, Vol. 265, 427-
454.
Prakash, S.S. and Belarbi, A. (2010), “Towards damage-based
design approach for RC bridge columns under combined
loadings using damage index models”, J. Earthq. Eng., 14(3),
363-389.
Prakash, S.S., Li, Q. and Belarbi, A. (2012), “Behaviour of
circular and square RC bridge columns under combined loading
including torsion”, ACI Struct. J., 109(3), 317.
Rahal, K.L. and Collins, M.P. (1995), “Analysis of sections
subjected to combined shear and torsion-a theoretical model”,
ACI Struct. J., 92, 459-459.
Sengupta, P. and Li, B. (2013), “Modified Bouc-Wen model for
hysteresis behavior of RC beam-column joints with limited
20

Hysteresis modelling of reinforced concrete columns under pure cyclic torsional loading
transverse reinforcement”, Eng. Struct., 46, 392-406.
Takeda, T., Sozen, M.A. and Nielsen, N.N. (1970), “Reinforced
concrete response to simulated earthquakes”, J. Struct. Div.,
ASCE, 96, 2557-2573.
Tirasit, P. and Kawashima, K. (2007), “Seismic performance of
square reinforced concrete columns under combined cyclic
flexural and torsional loadings”, J. Earthq. Eng., 11, 425-452.
Wang, P., Han, Q. and Du, X. (2014), “Seismic performance of
circular RC bridge columns with flexure-torsion interaction”,
Soil Dyn. Earthq. Eng., 66, 13-30.
PL
Notations θc : Twist at cracking point on the primary curve.
θy : Twist at yield point on the primary curve.
θd : Twist at the peak on the primary curve.
θu : Twist at the point where ultimate failure occurs in the
primary Curve.
θm : Twist at the point from where load in reversed.
θur1 : Twist at first control point on the unloading path.
θur2 : Twist at second control point on the unloading path.
θsu : Twist on θ axis where unloading ends and reloading
starts.
θcr : Twist where slope changes while reloading.
cT~ : Torque at cracking point on the primary curve.
yT~ : Torque at yield point on the primary curve.
dT~ : Peak torque on the primary curve.
uT~ :
Torque at point where ultimate failure occurs on the
primary curve.
1
~urT Torque at first control point on the unloading path.
2
~urT : Torque at second control point on the unloading path.
'~mT :
Reduced strength attained while reloading at the point
from where load was reversed.
KTr1
: Reloading stiffness for
KTr
: Initial pre-crack stiffness of the primary curve.
ymc ~~~
21
View publication statsView publication stats