Embed Size (px)
Citation preview
1
Hypoxia and tissue destruction in pulmonary tuberculosis
Moerida Belton1, Sara Brilha1, Roido Manavaki 2, Francesco Mauri3, Kuldip Nijran4, Young T.
Hong5, Neva H. Patel4, Marcin Dembek1, Liku Tezera6, Justin Green1, Rachel Moores1,
Franklin Aigbirhio5, Adil Al-Nahhas4, Tim D. Fryer5, Paul T. Elkington1,6, Jon S. Friedland1
1 Section of Infectious Diseases and Immunity, Imperial College London, UK
2 Department of Radiology, School of Clinical Medicine, University of Cambridge, UK
3 Department of Histopathology, Hammersmith Campus, Imperial College London, UK
4 Radiological Science Unit Charing Cross Campus, Department of Nuclear Medicine, Charing
Cross Campus, Imperial College NHS Trust, London, UK
5 Wolfson Brain Imaging Centre, School of Clinical Medicine, University of Cambridge, UK
6NIHR Respiratory Biomedical Research Unit, Faculty of Medicine, University of
Southampton, UK
Corresponding author: Jon S Friedland
Section of Infectious Diseases and Immunity
Du Cane Road, London W12 0NN
United Kingdom
E-mail: [email protected]
Tel: 44 (0)20 8383 8521 Fax: 44 (0)20 8383 3394
Key words: Tuberculosis, hypoxia, HIF-1α, MMP-1
Word Count 2,997
brought to you by COREView metadata, citation and similar papers at core.ac.uk
provided by Spiral - Imperial College Digital Repository

2
ABSTRACT
Background: It is unknown whether lesions in human tuberculosis (TB) are hypoxic or
whether this influences disease pathology. Human TB is characterized by extensive lung
destruction driven by host MMPs, particularly collagenases such as MMP-1.
Methods: We investigated tissue hypoxia in five patients with PET imaging using the tracer
[18F]-fluoromisonidazole ([18F]FMISO) and by immunohistochemistry. We studied regulation
of MMP secretion in primary human cell culture model systems in normoxia, hypoxia,
chemical hypoxia and by siRNA inhibition.
Results: [18F]FMISO accumulated in regions of TB consolidation and around pulmonary
cavities, demonstrating for the first time severe tissue hypoxia in man. Patlak analysis of
dynamic PET data showed heterogeneous levels of hypoxia within and between patients. In
Mycobacterium tuberculosis (M.tb)-infected human macrophages, hypoxia (1% pO2)
upregulated MMP-1 gene expression 170-fold, driving secretion and caseinolytic activity.
Dimethyloxalyl glycine, a small molecule inhibitor which stabilises the transcription factor
Hypoxia Inducible Factor (HIF)-1α, similarly upregulated MMP-1. Hypoxia did not affect
mycobacterial replication. Hypoxia increased MMP-1 expression in primary respiratory
epithelial cells via intercellular networks regulated by TB. HIF-1α and NF-κB regulated
increased MMP-1 activity in hypoxia. Furthermore, M.tb infection drove HIF-1α
accumulation even in normoxia. In human TB lung biopsies, epithelioid macrophages and
multi-nucleate giant cells express HIF-1α. HIF-1α blockade including by targeted siRNA
inhibited TB-driven MMP-1 gene expression and secretion.

3
Conclusions: Human TB lesions are severely hypoxic and M.tb drives HIF- 1α accumulation,
synergistically increasing collagenase activity which will lead to lung destruction and
cavitation

4
What is the key question?
Is there functionally important hypoxia within human pulmonary TB lesions?
What is the bottom line?
Human TB lesions are severely hypoxic, and hypoxia exacerbates matrix metalloproteinase-
mediated inflammatory tissue destruction.
Why read on?
This study uses PET-CT to demonstrate for the first time that human lung lesions are
severely hypoxic and demonstrates that hypoxia, at the level seen in humans, potently
upregulates matrix metalloproteinase-1, a collagenase central to both cavity formation and
spread of infection.

5
INTRODUCTION
Mycobacterium tuberculosis (M.tb) is solely a pathogen of humans and infects one third of
the global population, killing 1.5 million people each year [1]. Drug resistance in
tuberculosis is increasing and there relatively few new drugs on the horizon. Novel
approaches to therapy require an understanding of the immune-pathology of TB. Lung
tissue destruction is a hallmark of pulmonary tuberculosis (TB) [2] and is key for
transmission of infection. Reduced tissue oxygenation has been noted in animal models of
TB [3, 4], but hypoxia in human disease has not been investigated although may have a
significant effect on the host response. The pathology of human TB is different to most
animal models [2]. Furthermore, although extensive lung damage is found in TB, the effect
of hypoxia on proinflammatory tissue destruction in TB has not been explored.
MMPs are emerging as key proteases causing TB immunopathology. Recent evidence
implicates MMPs, particularly collagenases such as MMP-1, as key in driving tissue
destruction during pulmonary TB [5-7]. Since MMPs may cause uncontrolled proteolytic
destruction, MMP activity is tightly regulated at the transcriptional level, by cleavage of the
proenzyme to an active form and by specific Tissue Inhibitors of Metalloproteinases (TIMPs)
which negatively regulate protease activity. Regulation of MMPs by hypoxia in TB has not
been studied.
The cellular response to hypoxia is orchestrated by HIF-1, a heterodimeric transcription
factor considered a master regulator of the host response to oxygen deprivation [8, 9]. In
addition to regulating oxygen homeostasis, emerging evidence implicates HIF-1 in infectious
6
and inflammatory diseases [10]. HIF-1 is comprised of two subunits; oxygen-responsive HIF-
1α and constitutively expressed HIF-1β. In normoxia, HIF-1α is hydroxylated by prolyl-4-
hydroxylase proteins (PHDs) [11, 12], allowing binding of the von Hipple-Lindau protein
which targets HIF-1α for proteosomal degradation [13]. Under hypoxic conditions PHD
activity declines, resulting in HIF-1α accumulation and HIF-1 heterodimer stabilization [14].
This HIF-1 complex binds to promoter regions of hypoxia-inducible genes, upregulating an
array of genes including those involved in cell survival, angiogenesis, apoptosis,
erythropoiesis, glucose metabolism and pH regulation [11]. HIF is responsive to a variety of
stimuli, with the inflammatory transcription factor NF-κB being of particular importance in
modulation of HIF expression [9]. The complex interaction between HIF-1α and NF-κB
signifies a synergistic link between hypoxia and immune responses, indicating a potential
role of hypoxia in driving TB immunopathology.
In this study, we show for the first time that lesions in pulmonary TB infection are severely
hypoxic in man. There is heterogeneity both within and between lesions in the extent of
hypoxia. In primary human monocyte-derived macrophages (MDMs) and normal human
bronchial epithelial cells (NHBEs), hypoxia synergistically upregulates HIF-1α-dependent
MMP-1 (collagenase) gene expression and secretion during M.tb infection. In addition, M.tb
stabilizes HIF-1α even in the absence of hypoxia. HIF-1α accumulation is necessary for
MMP-1 secretion and HIF-1α is highly expressed in macrophages in human TB granulomas.

7
METHODS
Full methods are provided in the online supplement.
Patient Recruitment
Ethical approval for the study was obtained from East London and City Research Ethics
Committee and Imperial College Healthcare Trust Joint Research Office, with further
approval by the UK Administration of Radioactive Substances Advisory Committee (ARSAC).
Patients were recruited from Imperial College Healthcare NHS Trust with a confirmed
microbiological diagnosis of TB, either on acid-fast smear and / or M.tb culture. All patients
had abnormal plain chest radiographs and had received less than 2 weeks of anti-TB
therapy. Informed consent was obtained from all study participants.
18F-MISO PET-CT scans
PET-CT scans were performed on a Siemens mCT (Siemens Medical, Erlangen, Germany) at
the Department of Nuclear Medicine Charing Cross Hospital, Imperial College NHS Trust,
London. [18F]FMISO was synthesized in the Wolfson Brain Imaging Centre, University of
Cambridge. Patient scanning protocol and data analysis are described in the online
supplement.
M.tb culture
M.tuberculosis H375v was cultured in Middlebrook 7H9 medium as previously described
[15].

8
Cell Culture Experiments
Monocyte-derived primary human macrophages were infected with M.tb H37Rv as
described [15]. Primary human bronchial epithelial cells (Lonza, Slough, UK) were cultured
and stimulated with conditioned media from Mtb-infected monocytes (CoMtb) and A549
cells transiently transfected as described [16].
Hypoxia workstation
A custom designed hypoxia workstation was commissioned for the biological safety level 3
facility (Coy Laboratories, USA).
Casein Zymography
Casein zymography was performed as previously described [15].
Real-time PCR
Macrophages were lysed using Tri-Reagent (Sigma-Aldrich, Dorset, UK), and total RNA was
extracted using PureLink RNA® Mini Kit (Invitrogen, Paisley, UK). RNA was reverse
transcribed using QuantiTect Reverse Transcriptase Kit (Qiagen, Manchester, UK). qPCR
reactions were performed in an ABI Prism 7700 (Applied Biosystems, Paisley, UK).
Measurement of MMP and TIMP concentrations
Total MMP and TIMP secretion in cell culture supernatants was measured by ELISA (R&D
Systems, Abdingdon, UK) or on the Luminex 200 platform using MMP Luminex multiplex
array (R&D Systems, Abingdon, UK) according to the manufacturer’s instructions. The
minimum level of detection for MMP-1 was 10 pg/ml.

9
HIF-1α Western analysis
Western blotting was performed using anti-HIF1α Ab (BD Biosiences, UK) and goat anti-
mouse IgG horseradish peroxidase (HRP)-conjugate secondary Ab (Jackson
ImmunoResearch). Loading control was performed using the rabbit-anti β-actin Ab and goat
anti-mouse IgG horseradish peroxidase (HRP)-conjugate secondary Ab (Jackson
ImmunoResearch). Luminescence was detected with the ECL system (Amersham, UK)
according to manufacturer’s protocol.
Confocal microscopy
Primary human monocyte-derived macrophages were infected with M.tb H37RV in
Permanox plastic chamber slides (Thermo Fisher Scientific Inc. UK). MMP-1 staining was
performed using anti-MMP-1 primary Ab (Abcam, UK) and goat anti-mouse secondary Ab
(Abcam, UK) according to the manufacturers’ instructions. Nuclei were visualized using
DAPI.
SiRNA
MDMs were transfected using DharmaFECT 3 transfection reagent with either non-targeting
control siRNA or HIF-1α siRNA smartpool (Dharmacon, FisherScientific, Loughborough, UK),
according to the supplier’s instructions.
Immunohistochemistry
HIF-1α immunohistochemistry was performed on formalin-fixed, paraffin-embedded lung
biopsies from six patients with culture-proved M.tb infection and six non-infected control
samples. Immunohistochemistry staining was performed using Bond III fully automated
10
staining system with the Bond Polymer Refine Detection system and associated reagents
(Leica Microsystems, Newcastle-Upon-Tyne, UK). HIF-1α was detected using HIF1-α
antibody (Abcam AB1).
Statistics
Statistical analysis was performed using GraphPad PRISM 6. Data was analyzed with
Kruskal-Wallis for comparison between 3 or more groups and Dunn’s test for pairwise
comparisons. A P value of 0.05 was considered significant. For all experiments, bars
represent mean values ± SD from a minimum of two independent experiments performed in
triplicate.

11
RESULTS
Regions of severe hypoxia are present in human pulmonary TB lesions
To investigate hypoxia in TB patients, we performed PET-CT scans in patients who had acid-
fast bacilli identified in respiratory specimens that were subsequently culture confirmed to
be M.tb (Patient demographics and microbiology are in Supplementary table 1). The
average duration of pulmonary symptoms was 2.4 months and all patients were HIV
negative (Patient laboratory data are presented in Supplementary table 2). To investigate
hypoxia, we used the hypoxia-specific tracer 18F-fluoromisonidazole ([18F]FMISO), which has
been used to study tumour biology [17]. [18F]FMISO is selectively trapped in severely
hypoxic regions (pO2<10mmHg) [18-20]. PET-CT scans in 5 patients demonstrated extensive
uptake of [18F]FMISO in radiologically abnormal areas of the lung, as assessed by [18F]FMISO
target-to-background (TBR) (Figure 1A), with the lateral muscle used as a background
representing normoxic tissue. TBR values significantly greater than unity were found in one
or more lesions in all patients (Figure 1B).
To provide a more specific measure of hypoxia than TBR, Patlak Ki mapping was applied,
which demonstrated the presence of severe hypoxia within areas of consolidation and in the
regions immediately surrounding pulmonary cavities (Figure 2A and Supplementary Table
3). All patients had Ki values greater than a hypoxia threshold in at least one region of
interest (Figure 2B). Heterogeneous levels of hypoxia were seen within patients with the
exception of Patient 2, who demonstrated evidence of severe hypoxia in all ROIs. Finally,
time-activity curves demonstrated significantly higher levels of [18F]FMISO within ROIs
compared to peripheral blood (Figure 2C). Together, these data demonstrate for the first
time the presence of severe hypoxia within TB lesions in man.

12
Hypoxia increases M.tb-driven MMP-1 expression in human macrophages
Next, the effect of hypoxia (1% pO2) on gene expression and secretion of MMP-1 was
investigated. Hypoxia significantly increased MMP-1 gene expression in M.tb-infected
human MDMs compared to infection in normoxia (21% pO2), resulting in a 170-fold
increase in MMP-1 mRNA accumulation at 24h (Figure 3A, p<0.0001 by Kruskal-Wallis test).
Increased MMP-1 accumulation under hypoxic conditions in M.tb-infected MDMs was
confirmed by confocal microscopy (Figure 3B). In both normoxia and hypoxia, M.tb was a
more potent stimulus to MMP-1 secretion than LPS (Figure 3C, p<0.05 and p<0.01
respectively). Casein zymography demonstrated that the increased MMP-1 secretion in
hypoxia was proteolytically active (Figure 3D).
Next, we used dimethyloxalyl glycine (DMOG) to block prolyl hydroxylase activity, thereby
stabilizing HIF-1α and activating the HIF-1 pathway. Consistent with findings in 1% pO2,
DMOG significantly increased MMP-1 secretion in M.tb-infected macrophages, causing a
dose-dependent increase in secretion and caseinolytic activity (Figure 3E). Hypoxia caused
no difference in M.tb colony forming units 72 hrs post infection (data not shown),
demonstrating that intracellular replication of M.tb was not altered.
Hypoxia increases M.tb-dependent MMP-1 expression in respiratory epithelial cells
Next, we investigated the effect of hypoxia on respiratory epithelial cell MMP-1 secretion,
as stromal cell networks are important sources of MMPs in TB [16]. Conditioned media
from M.tb-infected monocytes (CoMTb) stimulation of primary NHBEs in hypoxia (5% and
1% pO2) increased MMP-1 secretion (Figure 4A; p<0.05). LDH release assay showed that
13
hypoxia did not increase cell cytotoxicity (Supplementary Figure 1). Such MMP-1 secretion is
potentially open to modification by small molecules, since stabilization of HIF-1α by DMOG
also increased MMP-1 secretion in CoMTb-stimulated NHBEs in a dose-dependent manner
(Figure 4B, p<0.01). In addition, 0.25mM DMOG increased NHBE cell MMP-9 secretion and
proteolytic activity on gelatin zymography (Supplementary Figure 2).
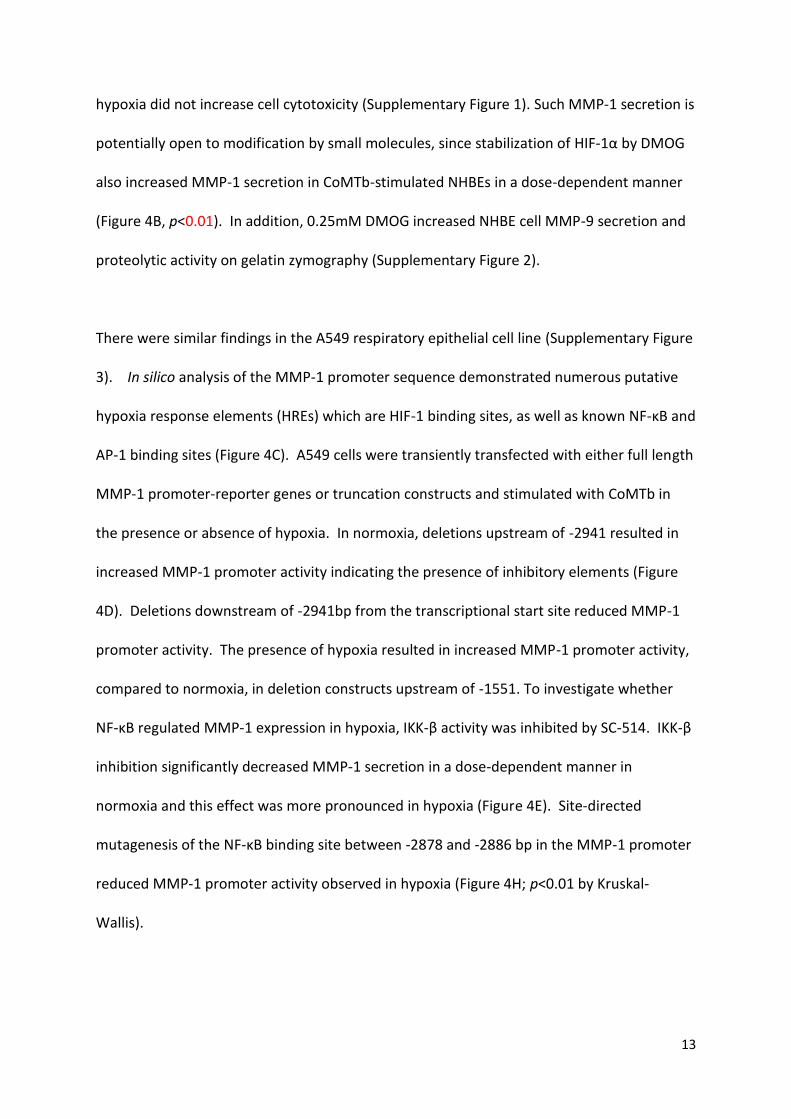
There were similar findings in the A549 respiratory epithelial cell line (Supplementary Figure
3). In silico analysis of the MMP-1 promoter sequence demonstrated numerous putative
hypoxia response elements (HREs) which are HIF-1 binding sites, as well as known NF-κB and
AP-1 binding sites (Figure 4C). A549 cells were transiently transfected with either full length
MMP-1 promoter-reporter genes or truncation constructs and stimulated with CoMTb in
the presence or absence of hypoxia. In normoxia, deletions upstream of -2941 resulted in
increased MMP-1 promoter activity indicating the presence of inhibitory elements (Figure
4D). Deletions downstream of -2941bp from the transcriptional start site reduced MMP-1
promoter activity. The presence of hypoxia resulted in increased MMP-1 promoter activity,
compared to normoxia, in deletion constructs upstream of -1551. To investigate whether
NF-κB regulated MMP-1 expression in hypoxia, IKK-β activity was inhibited by SC-514. IKK-β
inhibition significantly decreased MMP-1 secretion in a dose-dependent manner in
normoxia and this effect was more pronounced in hypoxia (Figure 4E). Site-directed
mutagenesis of the NF-κB binding site between -2878 and -2886 bp in the MMP-1 promoter
reduced MMP-1 promoter activity observed in hypoxia (Figure 4H; p<0.01 by Kruskal-
Wallis).
14
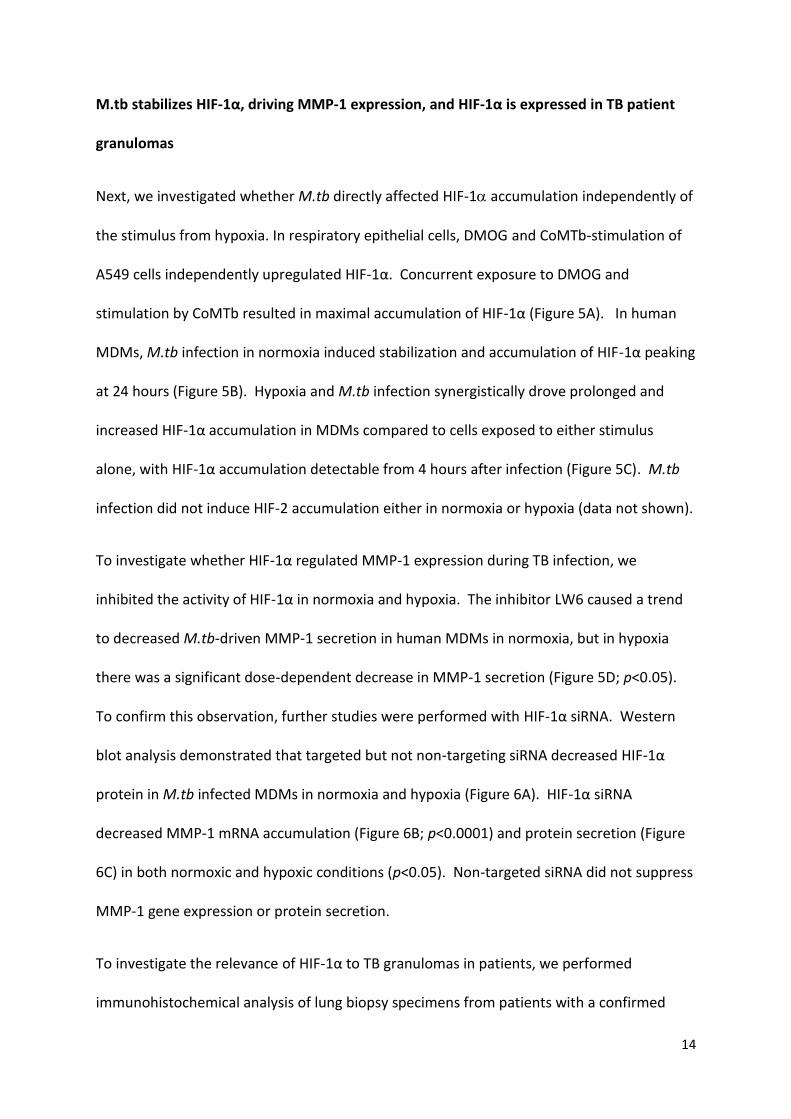
M.tb stabilizes HIF-1α, driving MMP-1 expression, and HIF-1α is expressed in TB patient
granulomas
Next, we investigated whether M.tb directly affected HIF-1 accumulation independently of
the stimulus from hypoxia. In respiratory epithelial cells, DMOG and CoMTb-stimulation of
A549 cells independently upregulated HIF-1α. Concurrent exposure to DMOG and
stimulation by CoMTb resulted in maximal accumulation of HIF-1α (Figure 5A). In human
MDMs, M.tb infection in normoxia induced stabilization and accumulation of HIF-1α peaking
at 24 hours (Figure 5B). Hypoxia and M.tb infection synergistically drove prolonged and
increased HIF-1α accumulation in MDMs compared to cells exposed to either stimulus
alone, with HIF-1α accumulation detectable from 4 hours after infection (Figure 5C). M.tb
infection did not induce HIF-2 accumulation either in normoxia or hypoxia (data not shown).
To investigate whether HIF-1α regulated MMP-1 expression during TB infection, we
inhibited the activity of HIF-1α in normoxia and hypoxia. The inhibitor LW6 caused a trend
to decreased M.tb-driven MMP-1 secretion in human MDMs in normoxia, but in hypoxia
there was a significant dose-dependent decrease in MMP-1 secretion (Figure 5D; p<0.05).
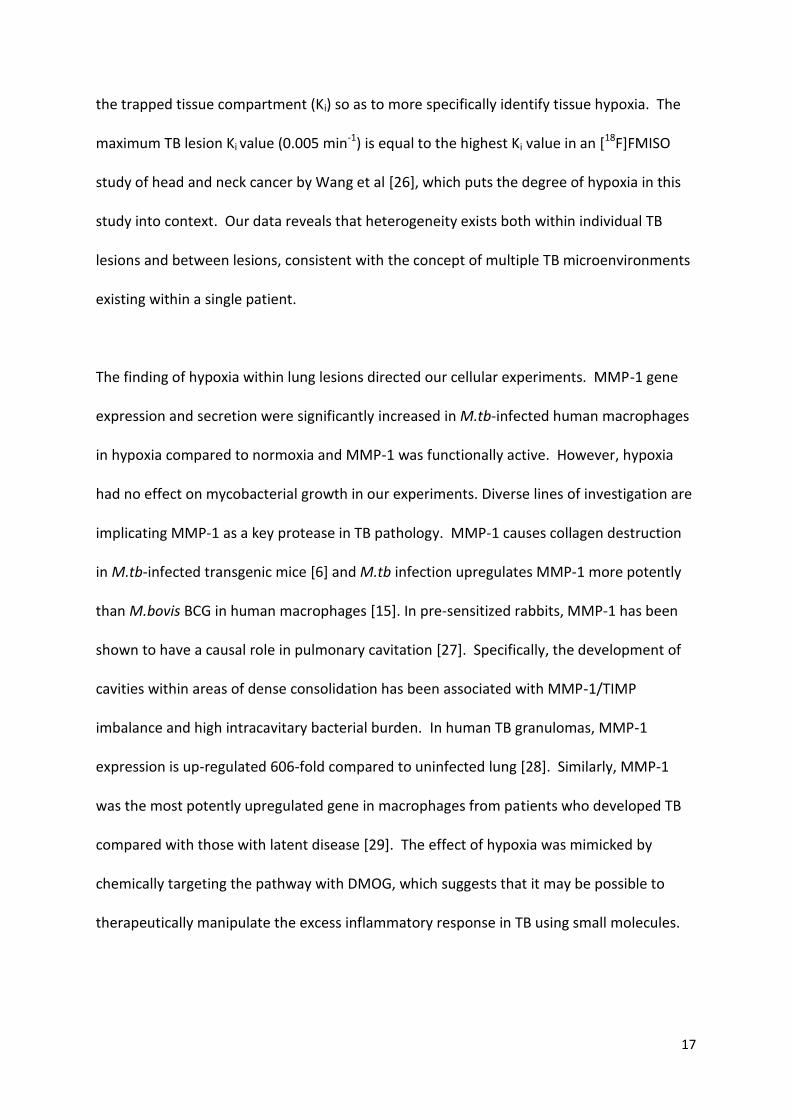
To confirm this observation, further studies were performed with HIF-1α siRNA. Western
blot analysis demonstrated that targeted but not non-targeting siRNA decreased HIF-1α
protein in M.tb infected MDMs in normoxia and hypoxia (Figure 6A). HIF-1α siRNA
decreased MMP-1 mRNA accumulation (Figure 6B; p<0.0001) and protein secretion (Figure
6C) in both normoxic and hypoxic conditions (p<0.05). Non-targeted siRNA did not suppress
MMP-1 gene expression or protein secretion.
To investigate the relevance of HIF-1α to TB granulomas in patients, we performed
immunohistochemical analysis of lung biopsy specimens from patients with a confirmed

15
diagnosis of TB. Epithelioid macrophages and Langerhans giant cells were immunoreactive
for HIF-1α staining within TB granulomas (Figure 6D i,ii) compared to uninfected control
lung tissue (Figure 6D iii), demonstrating that TB infection causes HIF-1α accumulation.

16
DISCUSSION
In this first detailed study of hypoxia in human tuberculosis, we demonstrate the presence
of severe hypoxia within areas of lung consolidation and around pulmonary cavities in
human TB. Hypoxia increases gene expression and secretion of MMP-1, a key collagenase
that causes tissue destruction and immunopathology in pulmonary TB. In addition, M.tb
infection directly drives HIF-1α accumulation, which is further increased in hypoxia to
synergistically activate immunopathogenic signalling pathways.
We demonstrated hypoxia in human TB using [18F]FMISO PET-CT scanning for the first time
in patients with an infectious disease. Hypoxia has not previously been found in man
although reported in animal models of TB, all of which have somewhat different pathology
to human disease [3, 4]. Until now, the investigation of hypoxia and TB has focussed
primarily on pathogen responses to oxygen restriction, controlled by the two-component
regulation system dosR/dosS (or dosR regulon) [21, 22]. Direct assessment of hypoxia in
vivo typically involves the utilization of polagraphic oxygen electrodes which can provide
absolute measurements of tissue oxygenation at the sampling location. However, this
procedure is technically demanding and suffers from a number of limitations including
invasiveness, high susceptibility to sampling errors and the fact that only easily accessible
locations can be interrogated [23]. [18F]FMISO PET-CT scans define regions of hypoxia
without the need for invasive probes, as previously shown in tumour biology [24] and
cerebral ischaemia [25]. Since high tracer uptake, as quantified by standardized uptake
value (SUV) or TBR, may represent high tracer delivery to a region of interest rather than
tracer trapping under hypoxic conditions, we determined the influx rate of [18F]FMISO into
17
the trapped tissue compartment (Ki) so as to more specifically identify tissue hypoxia. The
maximum TB lesion Ki value (0.005 min-1) is equal to the highest Ki value in an [18F]FMISO
study of head and neck cancer by Wang et al [26], which puts the degree of hypoxia in this
study into context. Our data reveals that heterogeneity exists both within individual TB
lesions and between lesions, consistent with the concept of multiple TB microenvironments
existing within a single patient.
The finding of hypoxia within lung lesions directed our cellular experiments. MMP-1 gene
expression and secretion were significantly increased in M.tb-infected human macrophages
in hypoxia compared to normoxia and MMP-1 was functionally active. However, hypoxia
had no effect on mycobacterial growth in our experiments. Diverse lines of investigation are
implicating MMP-1 as a key protease in TB pathology. MMP-1 causes collagen destruction
in M.tb-infected transgenic mice [6] and M.tb infection upregulates MMP-1 more potently
than M.bovis BCG in human macrophages [15]. In pre-sensitized rabbits, MMP-1 has been
shown to have a causal role in pulmonary cavitation [27]. Specifically, the development of
cavities within areas of dense consolidation has been associated with MMP-1/TIMP
imbalance and high intracavitary bacterial burden. In human TB granulomas, MMP-1
expression is up-regulated 606-fold compared to uninfected lung [28]. Similarly, MMP-1
was the most potently upregulated gene in macrophages from patients who developed TB
compared with those with latent disease [29]. The effect of hypoxia was mimicked by
chemically targeting the pathway with DMOG, which suggests that it may be possible to
therapeutically manipulate the excess inflammatory response in TB using small molecules.
18
Hypoxia-dependent, monocyte driven up-regulation of MMP-1 gene expression in human
respiratory epithelial cells required the transcription factor NF-κB. NF-κB and HIF-1α
interact to regulate innate immunity and inflammation [9, 10]. NF-κB critically regulates
MMP activity in TB infection of the central nervous system [30], but has not been
investigated in the context of hypoxia-driven MMP expression in TB infection. NF-κB is
both directly affected by hypoxia and modulates HIF-1α expression as well as being
regulated by prolyl hydroxylases [31]. The precise nature of the interaction between HIF-
1α, prolyl hydroxylases and NF-κB in TB is currently being investigated by our group.
M.tb caused significant accumulation of HIF-1α in direct infection and via a networking
effect even in the absence of hypoxia, with a synergistic increase in HIF-1α expression in
hypoxia or following treatment with DMOG. To our knowledge, this is the first time that
hypoxia-independent HIF-1α stabilization has been observed in any mycobacterial infection,
although similar effects have been reported in other infections [32, 33]. Interestingly,
recent gene expression profiling in peripheral whole blood demonstrated significant up-
regulation of HIF-1α gene expression in TB patients compared to controls [34]. Our findings
are consistent with the demonstration of activation of HIF-1α signalling pathways following
infection in a zebrafish model of TB infection [35]. We showed expression of HIF-1α within
TB granulomas, localizing the activity to epithelioid macrophages and multi-nucleate giant
cells, which we have previously shown are key in secretion of several MMPs [15]. We
demonstrate that HIF-1α regulates MMP-1 expression in TB. Since the chemical inhibitor
LW6 can lack specificity we used targeted siRNA to confirm this finding. Consistent with our
data in TB, hypoxia and HIF-1α regulate MMP-driven tissue destruction in hypoxic
fibroblasts within rheumatoid synovium [36].

19
In summary, we show for the first time that human TB lesions are severely hypoxic. Hypoxia
increases MMP-1 gene expression and secretion during M.tb infection, and M.tb infection
independently increases HIF-1α activity even under conditions of normoxia. Taken
together, our data suggests the M.tb drives a HIF-1α-dependent proinflammatory tissue
destructive cascade that may lead to cavitation and promote disease transmission,
representing a potential future therapeutic target in the era of increasing drug resistant TB.
20
FOOTNOTES
Acknowledgements
The authors would like to acknowledge Dr Rob Smith and Robert Bielik, Wolfson Brain
Imaging Centre, University of Cambridge for their support in coordinating synthesis and
transportation of [18F]FMISO.
Funding
Supported by Medical Research Council (UK) Clinical Research Training Fellowships (MB, JG),
Wellcome Trust Clinical Research Training Fellowship (RM), Fundacao Ciencia Tecnologia,
Portugal (SB), Imperial College Healthcare Charity, UK , The Mason Medical Research
Foundation UK grant, NIHR Cambridge Biomedical Research Centre (RM), and The Imperial
College Biomedical Research Centre UK (PE, JSF).
Declaration of interests
None
Author contributions
M.B., T.D.F., Y.T.H., F.A., K.N, A.A., P.T.E., and J.S.F conceived and designed the clinical study,
and M.B., N.H.P., R.M., Y.T.H., and T.D.F collected and analyzed the clinical data. M.B.
recruited the clinical cohort. M.B., S.B., L.T., J.G., M.D. and R.M. were involved in the cellular
studies. F.A.M. performed the histological analysis. All authors contributed to the writing of
the manuscript and approved the final submitted version.

21
REFERENCES
1. WHO, Global Tuberculosis Report 2012. 2012. 2. Helke, K.L., J.L. Mankowski, and Y.C. Manabe, Animal models of cavitation in pulmonary
tuberculosis. Tuberculosis, 2006. 86(5): p. 337-348. 3. Via, L.E., et al., Tuberculous Granulomas Are Hypoxic in Guinea Pigs, Rabbits, and Nonhuman
Primates. Infection and Immunity, 2008. 76(6): p. 2333-2340. 4. Harper, J., et al., Mouse Model of Necrotic Tuberculosis Granulomas Develops Hypoxic
Lesions. Journal of Infectious Diseases, 2012. 205(4): p. 595-602. 5. Volkman, H.E., et al., Tuberculous Granuloma Induction via Interaction of a Bacterial
Secreted Protein with Host Epithelium. Science, 2010. 327(5964): p. 466-469. 6. Elkington, P., et al., MMP-1 drives immunopathology in human tuberculosis and transgenic
mice. J Clin Invest, 2011. 121(5): p. 1827-33. 7. Walker, N.F., et al., Doxycycline and HIV Infection Suppress Tuberculosis-induced Matrix
Metalloproteinases. American Journal of Respiratory and Critical Care Medicine, 2012. 185(9): p. 989-997.
8. Nizet, V. and R.S. Johnson, Interdependence of hypoxic and innate immune responses. Nat Rev Immunol, 2009. 9(9): p. 609-617.
9. Rius, J., et al., NF-[kgr]B links innate immunity to the hypoxic response through transcriptional regulation of HIF-1[agr]. Nature, 2008. 453(7196): p. 807-811.
10. Eltzschig, H.K. and P. Carmeliet, Hypoxia and Inflammation. New England Journal of Medicine, 2011. 364(7): p. 656-665.
11. Semenza, G.L., HIF-1: mediator of physiological and pathophysiological responses to hypoxia. Journal of Applied Physiology, 2000. 88(4): p. 1474-1480.
12. Schofield, C.J. and P.J. Ratcliffe, Oxygen sensing by HIF hydroxylases. Nat Rev Mol Cell Biol, 2004. 5(5): p. 343-354.
13. Huang, L.E., et al., Regulation of hypoxia-inducible factor 1α is mediated by an O2-dependent degradation domain via the ubiquitin-proteasome pathway. Proceedings of the National Academy of Sciences, 1998. 95(14): p. 7987-7992.
14. Semenza, G.L., HIF-1, O2, and the 3 PHDs: How Animal Cells Signal Hypoxia to the Nucleus. Cell, 2001. 107(1): p. 1-3.
15. Elkington, P.T.G., et al., Mycobacterium tuberculosis, but Not Vaccine BCG, Specifically Upregulates Matrix Metalloproteinase-1. American Journal of Respiratory and Critical Care Medicine, 2005. 172(12): p. 1596-1604.
16. Elkington, P.T.G., et al., Mycobacterium tuberculosis Up-Regulates Matrix Metalloproteinase-1 Secretion from Human Airway Epithelial Cells via a p38 MAPK Switch. The Journal of Immunology, 2005. 175(8): p. 5333-5340.
17. Kizaka-Kondoh, S. and H. Konse-Nagasawa, Significance of nitroimidazole compounds and hypoxia-inducible factor-1 for imaging tumor hypoxia. Cancer Science, 2009. 100(8): p. 1366-1373.
18. Lawrentschuk, N., et al., Assessing regional hypoxia in human renal tumours using 18F-fluoromisonidazole positron emission tomography. BJU International, 2005. 96(4): p. 540-546.
19. Gagel, B., et al., pO2 Polarography Versus Positron Emission Tomography ([18F] Fluoromisonidazole, [18F]-2-Fluoro-2’-Deoxyglucose). Strahlentherapie und Onkologie, 2004. 180(10): p. 616-622.
20. Prekeges, J.L., et al., Reduction of fluoromisonidazole, a new imaging agent for hypoxia. Biochem Pharmacol, 1991. 42(12): p. 2387-95.
21. Gideon, H.P., et al., Hypoxia Induces an Immunodominant Target of Tuberculosis Specific T Cells Absent from Common BCG Vaccines. PLoS Pathog, 2010. 6(12): p. e1001237.
22
22. Honaker, R.W., et al., Unique Roles of DosT and DosS in DosR Regulon Induction and Mycobacterium tuberculosis Dormancy. Infection and Immunity, 2009. 77(8): p. 3258-3263.
23. Mortensen, L.S., et al., Identifying hypoxia in human tumors: A correlation study between 18F-FMISO PET and the Eppendorf oxygen-sensitive electrode. Acta Oncologica, 2010. 49(7): p. 934-940.
24. Carlin, S. and J.L. Humm, PET of Hypoxia: Current and Future Perspectives. Journal of Nuclear Medicine, 2012. 53(8): p. 1171-1174.
25. Takasawa, M., et al., Single-subject statistical mapping of acute brain hypoxia in the rat following middle cerebral artery occlusion: A microPET study. Experimental Neurology, 2011. 229(2): p. 251-258.
26. Wang, W., et al., Pharmacokinetic Analysis of Hypoxia 18F-Fluoromisonidazole Dynamic PET in Head and Neck Cancer. Journal of Nuclear Medicine, 2010. 51(1): p. 37-45.
27. Kubler, A., et al., Mycobacterium tuberculosis dysregulates MMP/TIMP balance to drive rapid cavitation and unrestrained bacterial proliferation. J Pathol, 2015. 235(3): p. 431-44.
28. Kim, M.-J., et al., Caseation of human tuberculosis granulomas correlates with elevated host lipid metabolism. EMBO Molecular Medicine, 2010. 2(7): p. 258-274.
29. Caws, M., et al., The Influence of Host and Bacterial Genotype on the Development of Disseminated Disease with <italic>Mycobacterium tuberculosis</italic>. PLoS Pathog, 2008. 4(3): p. e1000034.
30. Green, J.A., et al., Mycobacterium tuberculosis-infected human monocytes down-regulate microglial MMP-2 secretion in CNS tuberculosis via TNFalpha, NFkappaB, p38 and caspase 8 dependent pathways. J Neuroinflammation, 2011. 8: p. 46.
31. Fujita, N., et al., Prolyl hydroxylase 3 (PHD3) modulates catabolic effects of tumor necrosis factor-alpha (TNF-alpha) on cells of the nucleus pulposus through co-activation of nuclear factor kappaB (NF-kappaB)/p65 signaling. J Biol Chem, 2012. 287(47): p. 39942-53.
32. Haeberle, H.A., et al., Oxygen-Independent Stabilization of Hypoxia Inducible Factor (HIF)-1 during RSV Infection. PLoS ONE, 2008. 3(10): p. e3352.
33. Peyssonnaux, C., et al., HIF-1α expression regulates the bactericidal capacity of phagocytes. The Journal of Clinical Investigation, 2005. 115(7): p. 1806-1815.
34. Maertzdorf, J., et al., Common patterns and disease-related signatures in tuberculosis and sarcoidosis. Proceedings of the National Academy of Sciences, 2012. 109(20): p. 7853-7858.
35. Elks, P.M., et al., Hypoxia Inducible Factor Signaling Modulates Susceptibility to Mycobacterial Infection via a Nitric Oxide Dependent Mechanism. PLoS Pathog, 2013. 9(12): p. e1003789.
36. Lee, Y.-A., et al., Hypoxia differentially affects IL-1β-stimulated MMP-1 and MMP-13 expression of fibroblast-like synoviocytes in an HIF-1α-dependent manner. Rheumatology, 2012. 51(3): p. 443-450.

23
FIGURE LEGENDS
Figure 1. [18F]FMISO PET-CT demonstrates increased tracer uptake within TB lesions
(A) [18F]FMISO PET-CT images. Transverse, coronal and sagittal slices through the
[18F]FMISO target-to-background (TBR) and CT images of patient 2. Top row, CT images
show consolidation and a pulmonary cavity in the right upper lobe with a smaller, non-
cavitating lesion in the left lung. Middle row, [18F]FMISO TBR map demonstrates intense
uptake of tracer in the right upper lobe lesion and the liver, the site of metabolism of
[18F]FMISO. Bottom row, co-registered CT and TBR images. (B) Target-to-background (TBR)
values greater than unity were found for at least one lesion in all patients (each individual
bar represents one region of interest, ROI).
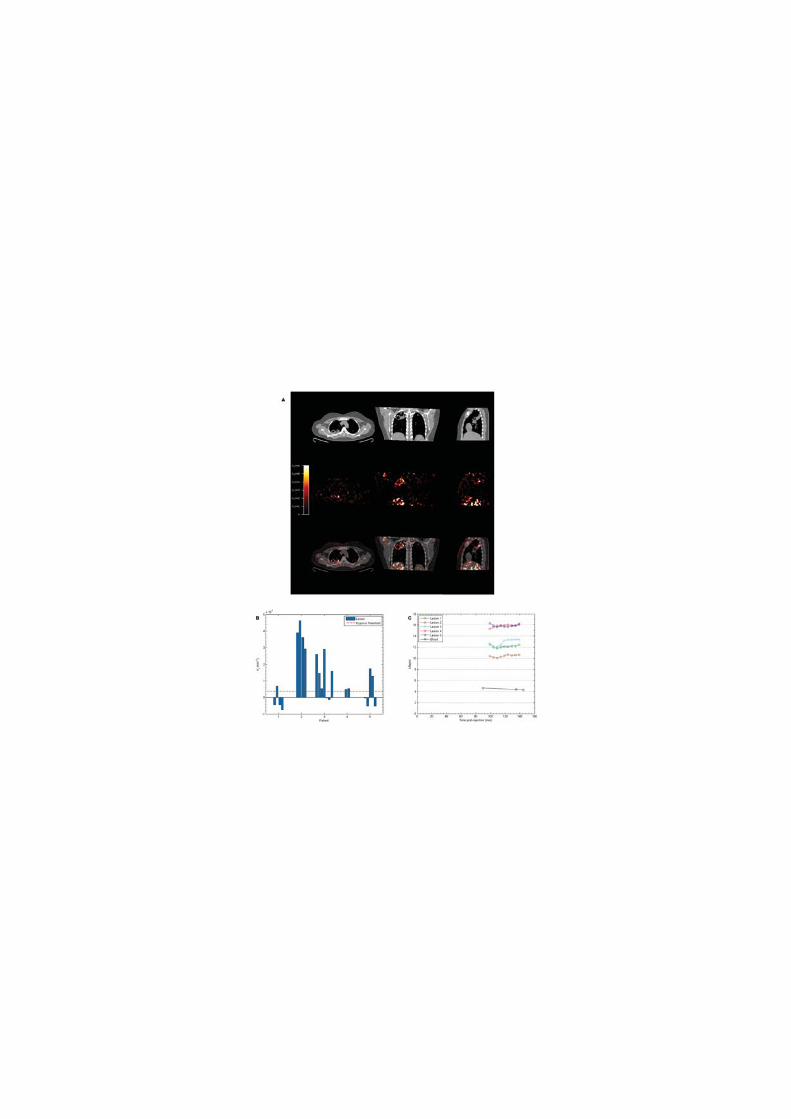
Figure 2. Severe hypoxia is present within human pulmonary TB lesions
(A) Patlak Ki images from dynamic PET-CT scanning for Patient 2 demonstrate intense
retention of [18F]FMISO in the right upper lobe of the lung (middle row). Co-registered PET-
CT images (bottom row) confirm localization of hypoxia to the region of the right upper lobe
cavity. (B) Regional Ki values demonstrate heterogenous trapping of [18F]FMISO within and
between patients. The hypoxia threshold (0.00037 min-1) was determined from the mean +
3 standard deviations of the Ki values in the normoxic lateral muscle background regions
across the patient group. (C) Time-activity measurements of five ROIs from patient 3
demonstrate high tissue levels compared to peripheral blood values.
Figure 3. Hypoxia increases M.tb-driven MMP-1 expression and secretion by human
monocyte-derived macrophages (MDMs).
24
(A) Hypoxia (1% pO2) increases MMP-1 gene expression in primary human MDMs infected
with M.tb at 24 hours. (B) Hypoxia increases intracellular MMP-1 accumulation on
confocal microscopy at 72hrs in MDMs infected with M.tb (MOI=1) compared to normoxia
or control uninfected cells. (C) Mtb infection increases MMP-1 secretion by infected MDMs
greater than LPS (100ng/ml) in both normoxia and hypoxia analyzed 72h after infection. (D)
MMP-1 activity is increased in M.tb-infected but not control human macrophages analyzed
by casein zymography, and hypoxia further increases caseinolytic activity. (E) Stabilization of
HIF-1α by DMOG (range 0.05-0.5mM) significantly increases MMP-1 secretion analyzed by
ELISA and proteolytic activity measured by zymography in a dose-dependent manner. N =
21% O2; 5% CO2, H = 1% O2; 5% CO2. ****p< 0.0001, ***p< 0.001, **p< 0.01, *p< 0.05.
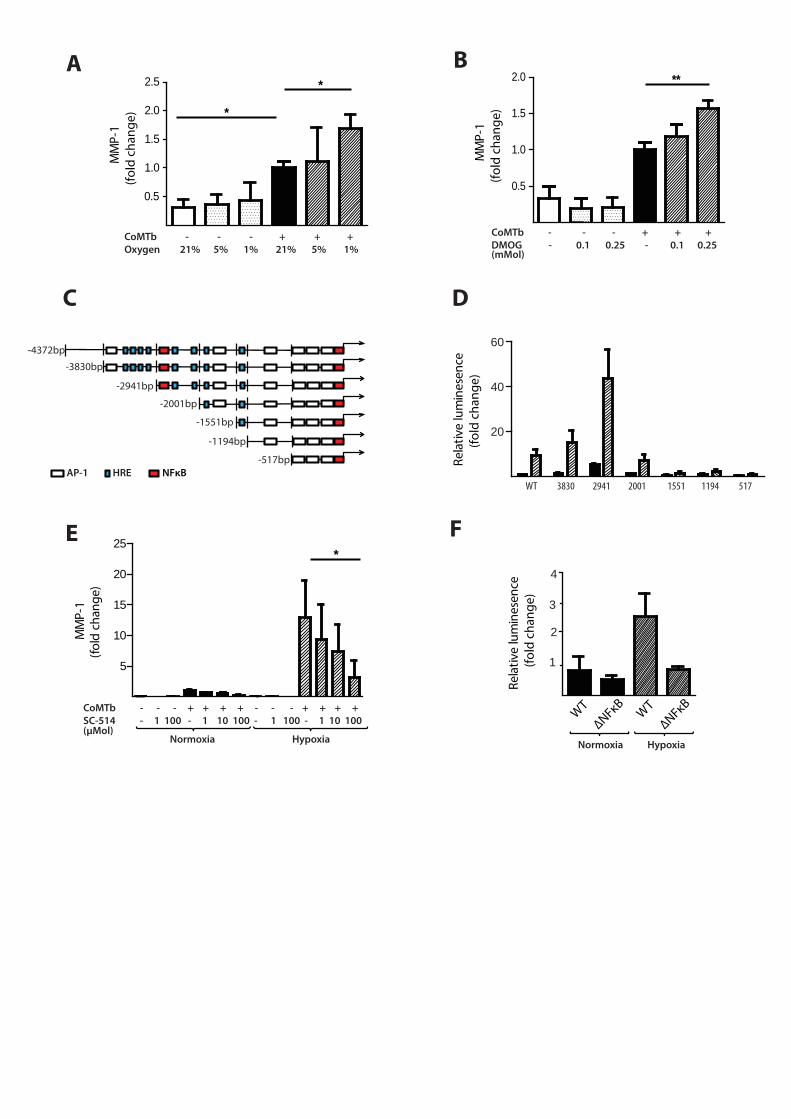
Figure 4. Hypoxia upregulates MMP-1 in human respiratory epithelial cells.
(A) Hypoxia increases MMP-1 secretion from NHBE cells stimulated with control medium or
CoMTb incubated in 21%, 5% or 1% oxygen. (B) DMOG (range 0.1-0.25mM) drives dose-
dependent MMP-1 secretion from CoMTb-stimulated NHBE cells. (C) In silico analysis of the
MMP-1 promoter reveals putative hypoxic response element (HRE) binding sites as well as
consensus NF-κB and AP-1 binding sites. (D) Relative luminescence following transfection
of A549 respiratory epithelial cells with either WT-MMP-1 promoter or a series of MMP-1
promoter deletion constructs in normoxia (solid bars) or hypoxia (shaded bars). The effect
of hypoxia in increasing promoter activity is absent in constructs -1551, -1194 and -517. (E)
IKKβ inhibition in hypoxia with SC-514 in CoMTb stimulated cells resulted in a dose-
dependent decrease in MMP-1 secretion. (F) Site-directed mutagenesis of the NF-κB
binding site at -2878 to -2886bp decreases MMP-1 promoter activity in response to CoMTb
in normoxia (solid bars) or hypoxia (shaded bars). **p< 0.01, * p< 0.05.

25
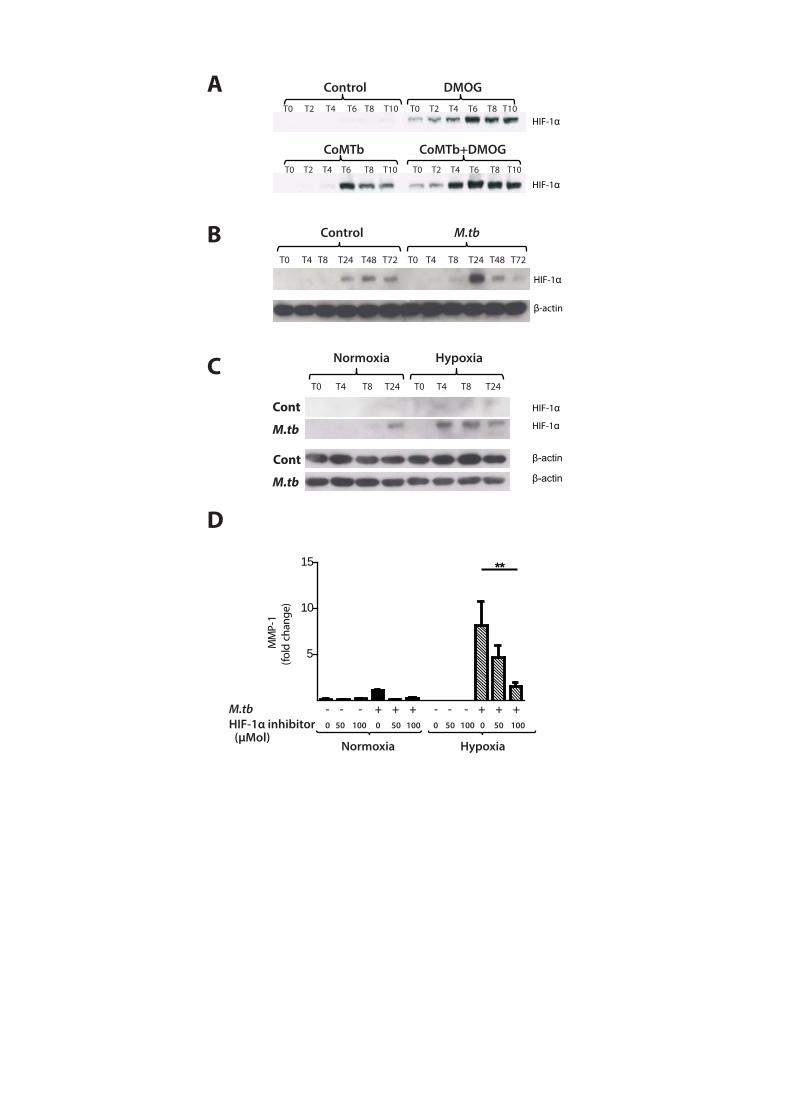
Figure 5. M.tb infection drives HIF-1α accumulation in normoxia
(A) In A549 cells, CoMTb stimulation and DMOG (0.25mM) results in early HIF-1α
stabilization. Pre-incubating A549 cells with DMOG (0.25mM) and subsequent stimulation
with CoMTb markedly increases HIF-1α accumulation, peaking at 6 hrs. (B) M.tb infection
increases HIF-1α accumulation and stabilization in normoxia in primary human MDMs,
peaking at 24hrs. (C) Combined infection with M.tb and exposure to hypoxia causes greater
HIF-1α accumulation than either stimulus alone, peaking at 4hrs and persisting until 24hr.
(D) Inhibition of HIF-1α by LW6 (range 50-100µM) results in decreased MMP-1 secretion in
M.tb-infected MDMs in hypoxia (hatched bars). **p< 0.01.
Figure 6. HIF-1α is necessary for MMP-1 gene expression and secretion during M.tb
infection.
(A) HIF-1α western blot at 24hrs demonstrates suppression of HIF-1α protein by HIF-1α
siRNA in MDMs in both normoxia and hypoxia, with no knockdown observed with non-
targeting (NT) siRNA. (B) HIF-1α siRNA decreases MMP-1 gene expression at 24hrs in M.tb
infected MDMs incubated in hypoxia. (C) HIF-1α siRNA causes a significant decrease in
MMP-1 secretion at 48hrs under conditions of normoxia (solid bars) and hypoxia (hatched
bars). No significant change in MMP-1 gene expression or secretion is seen with non-
targeting siRNA. (D) Lung biopsies from patients with pulmonary TB (i, ii) are
immunoreactive for HIF-1α compared with uninfected control biopsies (iii). HIF-1α staining
is pronounced within macrophages and multinucleated giant cells (arrow, ii). Scale bars,
100 µm. ****p< 0.0001, *p< 0.05.


M.tb - - + - - +LPS - + - - + -
Normoxia Hypoxia
C
M.tb
Nor
mox
iaM
.tb
Hyp
oxia
Cont
rol
Hyp
oxia
Cont
rol
Nor
mox
ia
DAPI MMP-1 MergeStd
M.tb - + - +Oxygen N N H H
DMMP-1
A
M.tb - - + + - - + +Time 0 24 0 24 0 24 0 24
MM
P-1
mRN
A (f
old
chan
ge)
Normoxia Hypoxia
M.tb - + - - + + + +DMOG - - 0.1 0.5 0.05 0.1 0.25 0.5
E
MMP-1
Std
(mMol)
****
100
200
300
*
**
1
2
3
4
****
5
10
15
20
MM
P-1
(fol
d ch
ange
)M
MP-
1
(f
old
chan
ge)
CoMTb - - - + + +Oxygen 21% 5% 1% 21% 5% 1%
A
CoMTb - - - + + + DMOG - 0.1 0.25 - 0.1 0.25
B
Rela
tive
lum
ines
ence
(fo
ld c
hang
e)
Rela
tive
lum
ines
ence
(fo
ld c
hang
e)
ΔNFκB
ΔNFκB
WT
WT
Normoxia Hypoxia
C
E F
D
-4372bp -3830bp
-2941bp
-2001bp
-1551bp
-1194bp
-517bp
CoMTb - - - + + + + - - - + + + +SC-514 - 1 100 - 1 10 100 - 1 100 - 1 10 100 Normoxia Hypoxia
AP-1 HRE NFκB
(μMol)
(mMol)
0.5
1.0
1.5
2.0
2.5 *
*M
MP-
1
(fo
ld c
hang
e)
0.5
1.0
1.5
2.0 **
WT 3830 2941 2001 1551 1194 517
20
40
60
2
4
MM
P-1
(fol
d ch
ange
)
5
10
15
20
25 *
MM
P-1
(fold
cha
nge)
1
3
B
T0 T2 T4 T6 T8 T10 T0 T2 T4 T6 T8 T10
T0 T2 T4 T6 T8 T10 T0 T2 T4 T6 T8 T10
Control DMOG
CoMTb CoMTb+DMOG
A
T0 T4 T8 T24 T48 T72 T0 T4 T8 T24 T48 T72
Control M.tb
HIF-1
β-actin
CT0 T4 T8 T24 T0 T4 T8 T24
Normoxia Hypoxia
M.tb
HIF-1
HIF-1
HIF-1
HIF-1
D
M.tb - - - + + + - - - + + + HIF-1α inhibitor 0 50 100 0 50 100 0 50 100 0 50 100
Normoxia Hypoxia
Cont
Cont
M.tb
(μMol)
MM
P-1
(fol
d ch
ange
)
5
10
15 **

Normoxia Hypoxia
Control M.tb M.tb M.tb Control M.tb M.tb M.tb
HIF-1α siRNA - - + - - - + -NT siRNA - - - + - - - +
A
HIF-1
B
M.tb - + + + - + + + NT siRNA - - + - - - + -HIF-1α siRNA - - - + - - - +
Normoxia Hypoxia
M.tb - + + + - + + + NT siRNA - - + - - - + -HIF-1α siRNA - - - + - - - +
Normoxia Hypoxia
C
D
(i) (ii) (iii)
5
10
15
20****
MM
P-1
mRN
A (f
old
chan
ge/1
8S)
10
20
30
40
MM
P-1
(fol
d ch
ange
)
*
Hypoxia and HIF-1α-dependent MMP-1 secretion in human pulmonary
tuberculosis
Moerida Belton, Sara Brilha, Roido Manavaki , Francesco Mauri, Kuldip Nijran,
Young T Hong, Neva Patel, Marcin Dembek, Liku Tezera, Justin Green,
Rachel Moores, Franklin Aigbirhio, Adil Al-Nahhas, Tim D Fryer, Paul T
Elkington, Jon S Friedland
Online data supplement

Methods
18F-MISO PET-CT scans
PET-CT scans were performed on a Siemens mCT (Siemens Medical, Erlangen, Germany) at
the Department of Nuclear Medicine Charing Cross Hospital, Imperial College NHS Trust,
London. [18F]FMISO was synthesized in the Wolfson Brain Imaging Centre, Cambridge
University. Patients received 406 ±6 MBq [18F]FMISO intravenously followed by a 90 minute
uptake period to promote contrast between normoxic and hypoxic tissue on tissue-to-
background (TBR) images, and also to allow the free [18F]FMISO concentration in tissue to
reach equilibrium with that in blood, a pre-requisite for Patlak plot determination of influx
rate (Ki) [1]. Immediately following a low dose CT scan for attenuation correction, patients
underwent a 45 minute single bed position PET scan acquired in list mode. As Patlak
analysis requires knowledge of the input function to the tissue, three venous blood samples
(90, 135 and 145 minutes post-injection) were taken in order to scale to a population-based
[18F]FMISO arterial plasma function. The latter was produced from 6 controls scanned at
The Wolfson Brain Imaging Centre, University of Cambridge as part of a study on stroke (PI:
Prof J-C Baron), which included late venous sampling as part of the study protocol.
[18F]FMISO PET-CT data analysis
List mode PET data were reconstructed into 9x5min frames using OSEM [2] (8 subsets, 4
iterations, 5mm FWHM 3D Gaussian post-smoothing filter) into a 168x168x74 array with
voxel dimensions 4.07 x 4.07 x 3.00mm. Corrections were applied for randoms, dead time,
normalization, scatter, attenuation, sensitivity and radioactive decay. To reduce the impact

of patient motion during PET acquisition, the last 8 frames of the dynamic PET image series
were non-rigidly registered to the first frame using symmetric normalization (SyN) with
mutual information as the similarity metric [3]. All PET frames were then registered to CT
using affine transformation. The last three of the registered frames (120-135mins post
injection) were converted to a TBR image through normalization with the radioactivity
concentration in a bilateral lateral muscle region assumed to represent normoxic tissue. All
9 frames were used to produce a Ki map using Patlak plot analysis. Regions of interest (ROI)
were defined on the TBR images and ROI values were determined by placing the ROIs on the
TBR and Ki maps.
M.tb culture
M.tuberculosis H375v was cultured in Middlebrook 7H9 medium supplemented with 10%
OADC enrichment medium (BD Biosciences, Oxford, UK), 0.2% glycerol and 0.02% Tween 80.
Cultured cells were infected with M.tb at mid-logarithmic growth at an optical density of 0.6
(Biowave cell density meter, WPA, Cambridge, UK). To count intracellular bacilli, infected
MDMs were lysed with 0.1% Triton-X. Aliquots of cell lysates were serially diluted 10-fold in
7H9 liquid and 4 dilutions of each sample were plated on 7H11 agar and incubated for 14
days befoe determining the number of CFU.
Monocyte Purification and Maturation
Monocytes were isolated from single donor leucocyte cones (National Blood Transfusion
Service, London, UK) by density gradient centrifugation (Amersham Biosciences) and re-
suspended in RPMI. Monocytes were purified by adhesion for 1 hour followed by washing
6 times in HBSS to remove non-adherent cells. Monocytes were matured for 4 days in
100ng/ml M-CSF and then rested for 1 day in RPMI containing no M-CSF. The resultant
monocyte-derived macrophages (MDMs) were infected with M.tuberculosis H37RV at an
MOI of 1. MMP gene expression was analyzed at 24 hours and MMP secretion measured at
3 days after infection. Conditioned media from M.tb infected monocytes (CoMTb) was
produced by infecting monocytes at a multiplicity of infection (MOI) of 1. After 24 hours,
cell culture medium was harvested, centrifuged at 13,000rpm for 5 minutes and filtered to
remove infectious material using a 0.2μm Anopore filter (Whatman, UK) [4].
Epithelial cell culture
Normal human bronchial epithelial cells (NHBE) (Lonza, Basel, Switzerland) and the human
type II alveolar A549 cell line were acquired as cryopreserved cells and regenerated
according to the manufacturers’ instructions. A549 cells were maintained in RMPI 1640
with 10% FCS, 2mM glutamine, and 10mg/ml ampicillin. Experiments were performed on
cells between passage 8-16 and unless otherwise stated, cell culture supernatants were
harvested at 72 hours and MMPs analysed by ELISA or Luminex array. Cell viability was
assessed by trypan blue exclusion. Chemical inhibition experiments were performed using
dimethyloxalylglycine (DMOG conc. range 0.05-0.5mM) (Inochem, Carnforth, UK), helenalin
SC-514 (conc. range 1-100µM) and 3-(2-(4-Adamantan-1-yl-phenoxy)-acetylamino)-4-
hydroxybenzoic acid methyl ester, LW6 (conc. range 50-100µM) (all MerckMillipore,
Darmstatd, Germany). All inhibitors were dissolved in DMSO according to manufacturers
instructions.

Hypoxia workstation
A custom designed hypoxia workstation was commissioned for the biological safety level 3
facility (Coy Laboratories, USA). The workstation comprised a sealed environment with an
inbuilt humidified incubator accessed by air-tight gloves. Materials and reagents were
passed in and out of the workstation via a sealed airlock, such that the atmosphere
remained constant at all times. Temperature and CO2 were maintained at 370C and 5%
respectively and O2 levels (by N2 displacement) adjusted according to the experimental
requirements. All parameters were monitored by digital sensors throughout and
adjustments made automatically. In experiments comparing multiple oxygen levels, a
hypoxic incubator was also used for 5% O2 (Galaxy 14S, New Brunswick, UK)
Casein Zymography
To analyze MMP-1 activity, samples were electrophoresed on 0.05% casein gels (Invitrogen)
and incubated in collagenase buffer at 37oC for 48h. All gels were run with a 5ng
recombinant MMP-1 (Calbiochem, Merck Biosciences, UK) to standardise between gels.
Caseinolytic activity was revealed by Coomassie blue staining (Pharmacia) for one hour
followed by destain in methanol: acetic acid: water [5].
Real-time PCR
Macrophages were lysed using Tri-Reagent (Sigma-Aldrich, Dorset, UK), and total RNA was
extracted using PureLink RNA® Mini Kit (Invitrogen, Paisley, UK). 1µg RNA was reverse
transcribed using QuantiTect Reverse Transcriptase Kit (Qiagen, Manchester, UK). qPCR
reactions were performed in an ABI Prism 7700 (Applied Biosystems, Paisley, UK). MMP-1

cycle thresholds were quantified by comparison to an MMP-1 standard curve generated
using known MMP-1 concentrations generated from a plasmid standard and then
standardised to 18S rRNA. HIF-1α mRNA samples were analysed using the comparative
threshold method. The Ct values of both calibrator and samples were normalized to 18S
rRNA.
Measurement of MMP and TIMP concentrations
Total MMP and TIMP secretion in cell culture supernatants was measured by ELISA (R&D
Systems, Abdingdon, UK) or on the Luminex 200 platform using MMP Luminex multiplex
array (R&D Systems, Abingdon, UK) according to the manufacturer’s instructions. The
minimum level of detection for MMP-1 was 10 pg/ml.
HIF-1α Western analysis
Cells were washed 3 times in sterile PBS and then lysed in SDS sample buffer (62.5mM Tris,
2% SDS, 10% glycerol, 50mM DDT, 0.01% bromophenol blue). For macrophages directly
infected with M.tb H37RV, samples were sterile filtered through a 0.2μm Anopore filter
(Whatman, UK). After heat-denaturation, samples were separated by electrical gradient on
a NuPAGE Bis-Tris 4-12% gel (Invitrogen, Paisley, UK), electro-transferred to a nitrocellulose
membrane (Amersham, UK) and blocked with 5% milk protein/0.1% Tween-20. The
membrane was probed with anti-HIF1α Ab (1:1,000 dilution) (BD Biosiences, UK) overnight,
washed, and incubated with goat anti-mouse IgG horseradish peroxidase (HRP)-conjugate
secondary Ab (1:1,000 dilution, Jackson ImmunoResearch). Loading control was performed
using the rabbit-anti β-actin Ab (1:5,000 dilution) and goat anti-mouse IgG horseradish
peroxidase (HRP)-conjugate secondary Ab (1:5,000 dilution, Jackson ImmunoResearch).
Luminescence was detected with the ECL system (Amersham, UK) according to
manufacturer’s protocol.
Confocal microscopy
Primary human monocytes were matured to macrophages in 4-well Permanox plastic
chamber slides (Thermo Fisher Scientific Inc. UK). Cells were fixed for 3 days following
infection with 4% paraformaldehyde in PBS for 30 minutes. Cells were permeabilized with
0.5% saponin and blocked with 1% BSA for 1 hr. Cells were incubated with anti-MMP-1
primary Ab (1:200, Abcam, UK) overnight, washed and incubated with goat anti-mouse
secondary Ab (1:100, Abcam, UK) and labelled with FITC for 2 hrs. Nuclei were visualized
using DAPI. The images were scanned under an x60 oil immersion objective and to avoid
bleed-through effects, each dye was scanned independently by a Leica TCS SP5 equipped
with an argon-krypton mixed gas laser. Image analysis was with Leica confocal software
(Leica Microsystems, Germany) and Image J v1.48a.
Promoter-reporter assay
A549 cells were transfected with either wild-type, truncation or deletion constructs of the
MMP-1 promoter DNA inserted into the firefly luciferase expression plasmid pGL2-basic (gift
from Dr. I. Clarke, University of East Anglia, U.K.) and control reporter plasmid, pRL-TK,
constitutively expressing Renilla luciferase activity, with FuGene 6 (Roche) [6]. Cells were

stimulated with CoMTb in the presence or absence of hypoxia then lysed after 24 h.
Luciferase activity was measured using the Dual-Luciferase Reporter Assay System
(Promega, Southampton, UK) analyzed with the Bio-Orbit 1253 luminometer (Labtech
International). Renilla luciferase activity was used to normalize firefly activity to control for
transfection efficiency.
siRNA
Monocytes were isolated and differentiated into MDMs. MDMs were transfected using
DharmaFECT 3 transfection reagent with either non-targeting control siRNA or HIF-1α siRNA
smartpool (Dharmacon, FisherScientific, Loughborough, UK), according to the supplier’s
instructions. Transfection medium was replaced with RPMI at 8hrs and cells allowed to rest
for 16hrs, at which time the MDMs were infected with M.tb H37Rv (MOI= 1). Cell culture
supernatant and cell lysates were harvested for HIF-1α and MMP-1 mRNA and protein
secretion analyses. To access transfection efficiency, MDMs were also transfected with
25nM FAM conjugated non-targeting control siRNA, detached from the plates with cell
dissociation buffer (Gibco, Invitrogen) and analysed by flow cytometry (FACSCalibur, BD
Biosciences).
Immunohistochemistry
HIF-1α immunohistochemistry was performed on formalin-fixed, paraffin-embedded lung
biopsies from six patients with culture-proved M.tb infection and six non-infected control
samples. Immunohistochemistry staining was performed using Bond III fully automated
staining system with the Bond Polymer Refine Detection system and associated reagents
(Leica Microsystems, Newcastle-Upon-Tyne, UK). Antigen retrieval was carried out using
Epitope retrieval pH 6 (ER1) at 100°C for 30mins. The antibody HIF1-α (Abcam AB1) was
applied for 30mins at a dilution of 1/500. The detection system uses DAB as chromogen and
section were counterstained with haematoxylin.
Statistics
Statistical analysis was performed using GraphPad PRISM 6. Data was analyzed with one-
way ANOVA and Tukey’s post-test performed to account for multiple comparison of
variables. A P value of 0.05 was considered significant. For all experiments, bars represent
mean values of 3 samples ± SD. All graphs are representative of at least duplicate
experiments.
References
1. Patlak, C.S., R.G. Blasberg, and J.D. Fenstermacher, Graphical Evaluation of Blood-to-Brain Transfer Constants from Multiple-Time Uptake Data. J Cereb Blood Flow Metab, 1983. 3(1): p. 1-7.
2. Hudson, H.M. and R.S. Larkin, Accelerated image reconstruction using ordered subsets of projection data. Medical Imaging, IEEE Transactions on, 1994. 13(4): p. 601-609.
3. Avants, B.B., et al., Symmetric diffeomorphic image registration with cross-correlation: Evaluating automated labeling of elderly and neurodegenerative brain. Medical Image Analysis, 2008. 12(1): p. 26-41.
4. Elkington, P., Filter sterilization of highly infectious samples to prevent false negative analysis of matrix metalloproteinase activity. J Immunol Methods, 2006. Feb 20: p. 309(1-2).
5. Troeberg, L. and H. Nagase, Zymography of Metalloproteinases, in Current Protocols in Protein Science. 2001, John Wiley & Sons, Inc.
6. O'Kane, C.M., et al., STAT3, p38 MAPK, and NF-kappaB drive unopposed monocyte-dependent fibroblast MMP-1 secretion in tuberculosis. Am J Respir Cell Mol Biol, 2010. 43(4): p. 465-74.

Patient 1 1P
Patient 2
Patient 3
Patient 4
Patient 5
Sex (M/F)
M
F
F
F
F
Age (years) 49 22 31 37 62
Country of origin Romania Mongolia Nepal Philippines Morocco
Height (cm) 178 160 153 157 156 Weight (kg) 64 53.2 44.9 45.3 48
Duration of symptoms 6 months 3 months 1 month 1 month 1 month
Symptoms
Cough Weight loss Fever Haemoptysis GI symptoms Lethargy
+ + + + - -
+ - + - - -
+ + + - + -
+ + + - - -
+ - + - - +
Smoking status Current 30 pack years
Never Never Never Never
CXR Consolidation Cavitation Fibrosis
+ + -
+ + -
+ - +
+ + -
+ + -
Sputum smear AFB +++ AFB +++ AFB + AFB + AFB +++
Days to M.tb culture positivity Antibiotic sensitivity
3 days
Fully sensitive
7 days
Resistant isoniazid +
streptomycin
26 days
Fully sensitive
7 days
Resistant rifampicin, isoniazid +
prothionomide
5 days
Fully sensitive
Supplementary Table 1. Patient demographics, chest radiograph and microbiology results
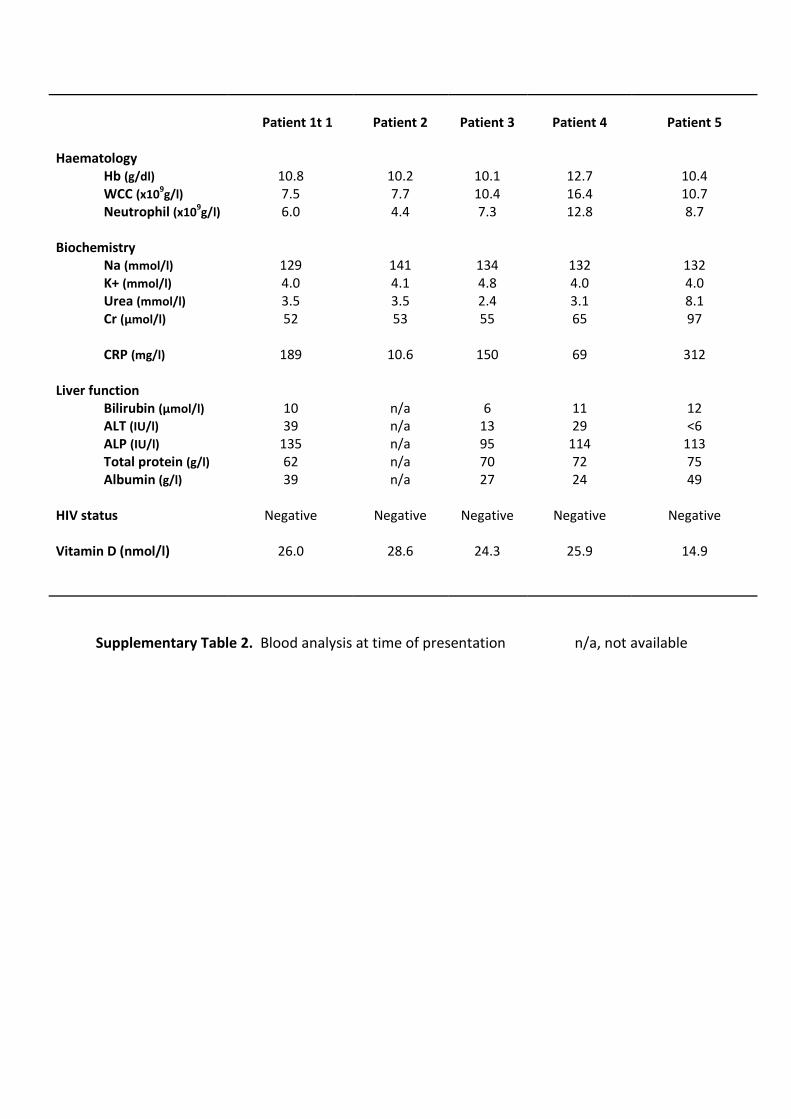
Patient 1t 1
Patient 2
Patient 3
Patient 4
Patient 5
Haematology
Hb (g/dl) WCC (x10
9g/l)
Neutrophil (x109g/l)
Biochemistry
Na (mmol/l)
K+ (mmol/l)
Urea (mmol/l)
Cr (µmol/l)
CRP (mg/l)
Liver function
Bilirubin (µmol/l)
ALT (IU/l)
ALP (IU/l)
Total protein (g/l)
Albumin (g/l)
HIV status Vitamin D (nmol/l)
10.8 7.5 6.0
129 4.0 3.5 52
189
10 39
135 62 39
Negative
26.0
10.2 7.7 4.4
141 4.1 3.5 53
10.6
n/a n/a n/a n/a n/a
Negative
28.6
10.1 10.4 7.3
134 4.8 2.4 55
150
6 13 95 70 27
Negative
24.3
12.7 16.4 12.8
132 4.0 3.1 65
69
11 29
114 72 24
Negative
25.9
10.4 10.7 8.7
132 4.0 8.1 97
312
12 <6
113 75 49
Negative
14.9
Supplementary Table 2. Blood analysis at time of presentation n/a, not available

Supplementary Table 3. Appearance on CT and binary hypoxic scale for each lesion
examined.
Patient number Lesion number CT appearance Hypoxic*
1 1 Consolidation -
2 Consolidation +
3 Consolidation -
4 Consolidation -
2 1 Consolidation +
2 Consolidation +
3 Cavity wall +
4 Consolidation +
3 1 Consolidation +
2 Consolidation +
3 Consolidation +
4 Consolidation +
5 Consolidation -
6 Consolidation -
7 Consolidation +
4 1 Cavity wall +
2 Cavity wall +
5 1 Cavity wall -
2 Cavity wall -
3 Consolidation +
4 Consolidation +
5 Consolidation -
*The binary hypoxic scale denotes whether the lesion ROI Ki value is above a hypoxia threshold (0.00037 min-1) determined from the mean + 3SD of the Ki values within the lateral muscle background ROIs, assumed to represent normoxic tissue.
Figure Legends Supplementary figures
Figure S1. Hypoxia does not cause cytotoxicity in NHBE cells
NHBE cells were stimulated with CoMTb and incubated in normoxia or hypoxia (1% or 5%
pO2; 5% CO2). Supernatant were harvested at 72 hrs. Hypoxia did not cause an increase in
LDH release in either control or CoMTb stimulated cells.
Figure S2. DMOG up-regulates MMP-9 secretion in NHBE cells stimulated with CoMTb.
NHBE cells were pre-incubated with DMOG (0.25mM) for 2 hours before stimulation with
CoMTb. Supernatants were harvested at 72 hours. (A) Gelatin zymography shows DMOG
increases MMP-9 gelatinolytic activity compared to control cells. A marked increase in
MMP-9 proteolytic activity is seen in CoMTb stimulated cells. (B) DMOG and CoMTb
stimulation increases MMP-9 secretion compared to cells treated with DMOG or CoMTb
alone. *p<0.05
Figure S3. Hypoxia and DMOG up-regulates MMP-1 secretion in A549 cells stimulated
with CoMTb.
A549 cells were incubated in hypoxia (pO2 1%) or pre-incubated with DMOG (0.25mM) for 2
hours and then stimulated with CoMTb. Supernatants were harvested at 72 hours and
MMP-1 concentrations measured by ELISA. (A) Hypoxia significantly increases MMP-1
secretions compared to cells incubated in normoxia. (B) DMOG significantly up-regulates
MMP-1 secretion compared to cells treated with DMOG or CoMTb alone. ***p<0.001