Embed Size (px)
Citation preview
Louisiana State UniversityLSU Digital Commons
LSU Doctoral Dissertations Graduate School
2005
Hydrophobic guar gum derivatives prepared bycontrolled grafting processes for hydraulic facturingapplicationsAhmad BahamdanLouisiana State University and Agricultural and Mechanical College, [email protected]
Follow this and additional works at: https://digitalcommons.lsu.edu/gradschool_dissertations
Part of the Chemistry Commons
This Dissertation is brought to you for free and open access by the Graduate School at LSU Digital Commons. It has been accepted for inclusion inLSU Doctoral Dissertations by an authorized graduate school editor of LSU Digital Commons. For more information, please [email protected].
Recommended CitationBahamdan, Ahmad, "Hydrophobic guar gum derivatives prepared by controlled grafting processes for hydraulic facturing applications"(2005). LSU Doctoral Dissertations. 3384.https://digitalcommons.lsu.edu/gradschool_dissertations/3384
HYDROPHOBIC GUAR GUM DERIVATIVES PREPARED BY CONTROLLED GRAFTING PROCESSES FOR HYDRAULIC FRACTURING APPLICATIONS
A Dissertation
Submitted to the Graduate Faculty of the Louisiana State University and
Agricultural and Mechanical College in partial fulfillment of the
requirements for the degree of Doctor of Philosophy
In
The Department of Chemistry
by Ahmad Bahamdan
B.S., King Fahd University of Petroleum and Minerals, Saudi Arabia, 1989 M.S., University of Arkansas at Little Rock, AR, 1995
August 2005

ii
ACKNOWLEDGEMENTS
First of all I would like to express my sincere appreciation to my advisor and
mentor, Professor William H. Daly, for his kindness, guidance, and encouragement
during the entire course of this work. His encouragement, advices, patience helped me
going through the difficulties and crises I met during the path of this work.
I would like to thank everyone who has contributed to this work. And I would like
to thank my committee members: Prof. Ioan Negulescu, Prof. Gudrun Schmidt, Prof.
David Spivak, and Prof. Douglas Harrison for reviewing my work and making valuable
suggestions and critical comments.
I would also like to extend my appreciation to Prof. Daly research group members
for their support and friendship.
I am truly grateful to my parents, wife, children, and whole family for their
support, prayers, and best wishes.
I was fortunate to receive a scholarship from Saudi Aramco to pursue my higher
education. I would like to appreciate and thank Saudi Aramco for their support and I
would like to express my thanks to my Saudi Aramco advisor Mr. Brad Brumfield and
every one who assisted me to achieve my goal.
iii
TABLE OF CONTENTS
ACKNOWLEDGEMENTS ………………………………………………………………ii LIST OF TABLES ………………………………………………………………………..v LIST OF FIGURES ……………………………………………………………………...vi ABSTRACT..……………………………………………………………………………...x CHAPTER 1. INTRODUCTION ………………………………………………………...1 1.1 Background ……………………………………………………………………….1 1.2 Principal of Hydraulic Fracturing Process……………………………………….. 2 1.3 The Composition of Fracturing Fluids ……………………………………………4 1.3.1 Guar Gum……...…………………………………………………………….4 1.3.2 Guar Gum Derivatives ………...…………………………………………....6 1.3.3 Hydrophobically Modified Guar Gum ...……………………………………7 1.3.4 The Crosslinking Agent …………………...………………………………..9 1.3.5 Gel Breakers ………...……………………………………………………..13 1.4 This Project………………………………………………………………………14
CHAPTER 2. SYNTHESIS AND CHARACTERIZATION OF CARBOXYMETHYL GUAR……………………………………………………………………………………17 2.1 Introduction………………………………………………………………………17 2.2 Experimental Procedures………………………………………………………...18 2.2.1 Preparation of Sodium Carboxymethyl Guar (NaCMG) From CAA …......18 2.2.2 Preparation of Sodium Carboxymethyl Guar (NaCMG) From SCA .……..19 2.2.3 Conversion of NaCMG to The Acid From………………………………...20 2.2.4 Determination of The Degree of Substitution via Titration……………......20 2.2.5 NMR Analysis of CMG-Triton B Salt …………………………………….21 2.3 Result and Discussion……………………………………………………………21
2.3.1 Preparation of Sodium Carboxymethyl Guar (NaCMG) From CAA and SCA………………………………………………………………………...21 2.3.2 Degree of Substitution (D.S.) Determination …...………………………...22 2.3.3 NMR Analysis of CMG-Triton B Salt………………...…………………...25
CHAPTER 3. GRAFT COPOLYMERIZATION OF GUAR GUM VIA XANTHATE AND RAFT PROCESSES……………………………………………………………….29 3.1 Introduction………………………………………………………………………29 3.2 Reversible Addition-Fragmentation Chain Transfer (RAFT)……………………31 3.3 Experimental Procedure …………………………………………………………35 3.3.1 Reagent and Solvents…………………………………………………...….35 3.3.2 Guar Gum Activation Process……………………………………………..35 3.3.3 Guar Gum Xanthate Graft Copolymerization……………………………...36 3.3.4 Synthesis of RAFT Agent………………………………………………….37
iv
3.3.5 Graft Polymerization of Acrylic Acid (AA) onto Guar Gum via RAFT Process…………………………………………………………………......37 3.3.6 Graft Polymerization of MMA onto Guar Gum via RAFT Process……….38
3.4 Result and Discussion……………………………………………………………38 3.4.1 Synthesis of Guar Gum Grafts Utilizing RAFT and Xanthates…...……….38 CHAPTER 4. SYNTHESIS AND CHARACTERIZATION OF THE POLYOXYALKYLENEAMINES-GUAR GUM DERIVATIVES...…………………..44 4.1 Introduction………………………………………………………………………44 4.2 Experimental Procedures………………………………………………………...45 4.2.1 Reagents and Solvents…………………………………………...………...45 4.2.2 Preparation of Methyl Carboxymethyl Guar (MCMG)………………..…..45 4.2.3 Polyoxyalkyleneamines Derivatives …………………………………...….46 4.3 Results and Disscussion………………………………………………………….47 4.3.1 Preparation of Methyl Carboxymethyl Guar (MCMG)…………………....47 4.3.2 Synthesis of CMG and CMHPG Polyoxyalkyleneamines Derivatives…....47 4.3.3 Characterization of Guar Gum Grafted Products…………………………..52 4.3.4 Determination of Graft Percentage via NMR………………………...……55 4.3.5 Viscosity Determination……………………………………..…….………59
CHAPTER 5. VISCOSITY TRENDS OF THE CROSSLINKED GELS…….………..63 5.1 Introduction………………………………………………………………………63 5.2 Experimental Procedure………………………………………………………….64 5.2.1 Instrumentation and Viscosity Calaculation…………………...…………..64 5.2.2 Viscosity Measurements………………………………………...…………66 5.3 Results and Discussion…………………………………………………………..67 5.3.1 Carboxymethylated Guar Derivatives (BMCMGGW45)………………….68 5.3.2 Carboxymethylhydroxypropyl Guar Derivatives (BM12CMHPG)……….74 5.3.3 Carboxymethylhydroxypropyl Guar Derivatives (BM13CMHPG)……….78 5.3.4 Gel Strength………………………………………………………………..82 5.3.5 Summary…………………………………………………………………...88 CHAPTER 6. GEL BREAKING………………………………………………………...92 6.1 Introduction………………………………………………………………………92 6.2 Experimental Procedure………………………………………………………….92 6.3 Results and Discussion…………………………………………………………..93 CHAPTER 7. SUMMARY AND FUTURE WORK…………………………………..102 7.1 Conclusions …………………………………………………………………….102 7.2 Future Work…………………………………………………………………….104 REFERENCES…………………………………………………………………………107 VITA……………………………………………………………………………………110
v
LIST OF TABLES
Table 1.1: Guar gum substitution patterns ………………………………………………..7
Table 2.1: Carboxymethyl guar produced with varying amounts of NaOH and CAA…..24 Table 2.2: Carboxymethyl guar produced with varying amounts of NaOH and SCA ….24 Table 2.3: Degree of substitution of commercial products determined by titration …….24 Table 2.4: CMG D.S. values calculated from triton B-NMR method versus the values calculated from titration …………………………………………………………………28 Table 4.1: Name and structure of different polyoxyalkyleneamines used in this study…50 Table 4.2: Percent yield, degree of substitution, (D.S.) and graft percentage of grafted CMHPG products………………………………………………………………………..58 Table 4.3: Percent yield, degree of substitution, (D.S.) and graft percentage of grafted CMG products……………………………………………………………………………59 Table 4.4: Brookfield viscosity of the base material compared to the grafted derivatives at room temperature, 0.48% solutions, and 20 RPM……………………………………….61 Table 4.5: Fann 35A viscosity of the base material compared to the grafted derivatives at room temperature, 0.48% solutions, and 60 RPM……………………………………….62 Table 5.1: Average viscosity of crosslinked BMCMGGW-45 control sample and its derivatives (37.7/s, 2.4g/L, pH >10, 0.4ml of Zr crosslinking agent)…………………...71 Table 5.2: Average viscosity of crosslinked BMCMGGW-45 control sample and its derivatives (37.7/s, 4.8g/L, pH >10, 0.5ml of Zr crosslinking agent)…………………...74 Table 5.3: Average viscosity of crosslinked BM12CMHPG control sample and its derivatives (37.7/s, 2.4g/L, pH >10, 0.4ml of Zr crosslinking agent)…………………...77 Table 5.4: Average viscosity of crosslinked BM12CMHPG control sample and its derivatives (37.7/s, 4.8g/L, pH >10, 0.5ml of Zr crosslinking agent)…………………...77 Table 5.5: Average viscosity of crosslinked BM13CMHPG control sample and its derivatives (37.7/s, 2.4g/L, pH >10, 0.4ml of Zr crosslinking agent)…………………...81 Table 5.6: Average viscosity of crosslinked BM13CMHPGcontrol sample and its derivatives (37.7/s, 4.8g/L, pH >10, 0.5ml of Zr crosslinking agent)…………………...81
vi
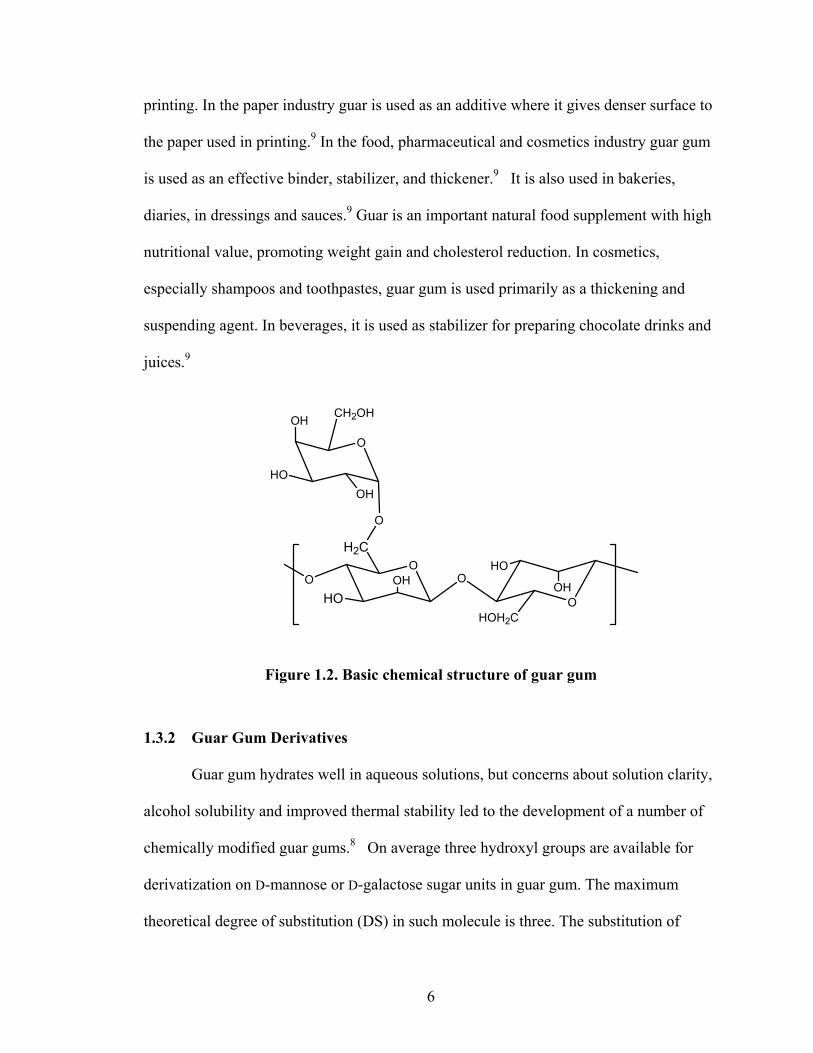
LIST OF FIGURES Figure 1.1: Photo shows the Cyamopsis tetragonoloba seed envelop, the seeds, the split seed and the grounded seed and different products of guar gum………………………….5 Figure 1.2: Basic chemical structure of guar gum………………………………………...6 Figure 1.3: Scheme shows the equilibrium of borate ion complexation with cis-hydroxy pairs on a Guar Gum molecule leading to the formation of gel………………………….11 Figure 1.4: Hydrogen-bonding mechanism for zirconium-guar………………………... 13 Figure 1.5: Covalent bonding mechanism for zirconium-guar………………………......13 Figure 2.1: FT-IR spectra of guar gum compared CMG ………………………………..23 Figure 2.2: NMR spectrum of BMCMGGW45-Triton B derivative in D2O ……………26 Figure 2.3: NMR spectrum of BM12CMHPG-Triton B derivative in D2O……………..27 Figure 3.1: Reaction mechanism suggested by Dimov and Pavlov for the xanthate promoted grafting………………………………………………………………………...31 Figure 3.2: Scheme show the RAFT mechanism………………………………………...34 Figure 3.3: Synthesis of carboxyl-terminated trithio-carbonates water soluble RAFT agent……………………………………………………………………………………...35 Figure 3.4: Proposed mechanism of the reaction of guar gum with selected initiator in presence of RAFT agent and monomer………………………………………………….39 Figure 3.5: FT-IR spectrum from styrene grafting experiment after Soxhelt extraction, precipitate collected when solvent cooled down. ……………………………………….40 Figure 3.6: FT-IR spectra of cyclohexane soluble fraction from styrene grafting experiment……………………………………………………………………….……….40 Figure 3.7: FT-IR spectra of residue after cyclohexane extraction compared to guar gum spectrum …………………………………………………………………………………40 Figure 3.8: FT-IR spectra of PMMA extracted by acetone after Soxhelt extraction of the product resulted from graft copolymerization of MMA onto guar gum via RAFT process…………………………………………………………………………………...41
vii
Figure 3.9: FT-IR spectra of residue left behind in the thimble compared to guar gum after Soxhelt extraction of the product resulted from graft copolymerization of MMA onto guar gum via RAFT Process………………………………………………………..42 Figure 4.1: Synthesis of guar gum polyoxyalkyleneamine derivatives………………….48
Figure 4.2: FT-IR spectra illustrate the growth of the ester peak and the diminishing of the acid peak with time when CMG is reacted with DMS at 60°C and under N2.……...49 Figure 4.3: FT-IR spectra of a carboxymethylated guar with a DS of 0.54 compared with the corresponding methyl ester…………………………………………………………..49 Figure 4.4: FT-IR spectra of a carboxymethylated guar with a DS of 0.58 compared with the corresponding methyl ester made by using DMSO………………………………….50 Figure 4.5: FT-IR spectrum of the starting BMCMGGW45 compared to the BMCMGGW45-CH3 ester intermediate, and polyoxyalkyleneamines derivative………53 Figure 4.6: 1H NMR spectra recorded in D2O of BMCMGGW45, Surfonamine M-1000, and BMCMGGW45-g-M1000…………………………………………………………...53 Figure 4.7: 1HNMR spectra recorded in D2O of BMCMGGW45, Surfonamine MNPA-1000, and BMCMGGW45-g-MNPA-1000……………………………………………...54 Figure 4.8: 1HNMR spectra recorded in D2O of BMCMGGW45, Surfonamine B30, and BMCMGGW45-g-B30…………………………………………………………………..54 Figure 4.9: 1HNMR spectra recorded in D2O of BM13CMHPG-Control, Surfonamine M600, and BM13CMHPG-g-M600……………………………………………………..55 Figure 4.10: 1HNMR spectra recorded in D2O of BM12CMHPG-Control, Surfonamine L300, and BM12CMHPG-g-L300……………………………………………………….57 Figure 4.11: Brookfield viscosity of 0.48% solutions of BMCMGGW-45-M1000 compared to that of the BMCMGGW-45 control sample……………………………….58 Figure 5.1: Fann 35 A viscometer F-1 model a) disassembled, b) assembled and running during measurement……………………………………………………………………...65 Figure 5.2: Viscosity values of zirconium-crosslinked BMCMGGW-45 control sample compared to its grafted derivatives as a function shear rate (2.4g/L, pH >10, 0.4ml Zr crosslinking agent, 25°C)………………………………………………………………...70 Figure 5.3: Viscosity values of zirconium-crosslinked BMCMGGW45-45-B30 samples as a function of shear rate reported twice (2.4g/L, pH>10, 22°C)……………………….70
viii
Figure 5.4: Viscosity values of zirconium-crosslinked BMCMGGW-45 control sample compared to its grafted derivatives as a function shear rate (4.8g/L, pH >10, 0.5ml Zr crosslinking agent, 25°C)………………………………………………………………...71 Figure 5.5: Viscosity values of zirconium-crosslinked BM12CMHPG control sample compared to its grafted derivatives as a function of shear rate (2.4g/L, pH >10, 0.4ml Zr crosslinking agent, 25°C)………………………………………………………………...75 Figure 5.6: Viscosity values of zirconium-crosslinked BM12CMHPG control sample compared to its grafted derivatives as a function of shear rate (4.8g/L, pH >10, 0.5ml Zr crosslinking agent, 25°C)………………………………………………………………...75 Figure 5.7: Viscosity values of zirconium-crosslinked BM13CMHPG control sample compared to its grafted derivatives as a function of shear rate (2.4g/L, pH >10, 0.4ml Zr crosslinking agent, 25°C)………………………………………………………………...80 Figure 5.8: Viscosity values of zirconium-crosslinked BM13CMHPG control sample compared to its grafted derivatives as a function of shear rate (4.8g/L, pH >10, 0.5ml Zr crosslinking agent, 25°C)………………………………………………………………...80 Figure 5.9: Rigid structure of BMCMGGW-45-B30 derivative (40lb/1000gal, pH 10.3) crosslinked with 0.5 ml zirconium crosslinking agent…………………………………...83 Figure 5.10: Comparing the gel strength of the control CMGGW45 and its derivatives at 20lb/1000gal, and room temperature. …………………………………………………..86 Figure 5.11: Comparing the gel strength of the control CMGGW45 and its derivatives at 20lb/1000gal, and 90°C. ………………………………………………………………..86 Figure 5.12: Comparing the gel strength of the control CMGGW45 and its derivatives at 40lb/1000gal, and room temperature. …………………………………………………..86 Figure 5.13: Comparing the Gel strength of the control CMGGW45 and its derivatives at 40lb/1000gal, and 90°C. ………………………………………………………………..87 Figure 5.14: Comparing the gel strength of the control BM12CMHPG and its derivatives at 20lb/1000gal, and room temperature. ………………………………………………..87 Figure 5.15: Comparing the gel strength of the control BM12CMHPG and its derivatives at 20lb/1000gal, and 90°C. ……………………………………………………………..87 Figure 5.16: Comparing the gel strength of the control BM12CMHPG and its derivatives at 40lb/1000gal, and room temperature. ………………………………………………..90 Figure 5.17: Comparing the gel strength of the control BM12CMHPG and its derivatives at 40lb/1000gal, and 90°C. ……………………………………………………………..90
ix
Figure 5.18: Comparing the gel strength of the control BM13CMHPG and its derivatives at 20lb/1000gal, and room temperature. ………………………………………………..90 Figure 5.19: Comparing the gel strength of the control BM13CMHPG and its derivatives at 20lb/1000gal, and 90°C. ……………………………………………………………..91 Figure 5.20: Comparing the gel strength of the control BM13CMHPG and its derivatives at 40lb/1000gal, and room temperature. ………………………………………………..91 Figure 5.21: Comparing the gel strength of the control BM13CMHPG and its derivatives at 40lb/1000gal, and 90°C. ……………………………………………………………..91
Figure 6.1: BM12CMHPG control sample broken by the enzyme (left), and extracted with toluene (right)………………………………………………………………………94
Figure 6.2: BM13CMHPG control sample broken by the \ enzyme breaker (left), and extracted with toluene (right)…………………………………………………………….94
Figure 6.3: BM13CMGGW-45 control sample broken by the enzyme left), and extracted with toluene (right)………………………………………………………………………96 Figure 6.4: BM12CMHPG-MNPA1000 sample broken by the enzyme (left), and extracted with toluene (right)…………………………………………………………….97 Figure 6.5: BM13CMHPG-M715 (left), BM12CMHPG-M1000 (middle), and BM12CMHPG-M600 (right) samples broken by the enzyme…………………………...97 Figure 6.6: BM13CMHPG-M715 (left), BM12CMHPG-M1000 (middle), and BM13CMHPG-M600 (right) samples after extracted with toluene……………………..98 Figure 6.7: BM13CMHPG-B30 (left), BMCMGGW45-L300 (middle), and BMCMGGW45-MNPA1000 (right) samples broken by the enzyme…………………...98 Figure 6.8: BM13CMHPG-B30 (left), BMCMGGW45-L300 (middle), and BMCMGGW45-MNPA1000 (right) samples after extracted with toluene……………...99 Figure 6.9: FT-IR spectrum of the solid collected from the water phase of BMCMGGW45-B30 after treatment with the enzyme and extraction with toluene…...100 Figure 6.10: FT-IR spectrum of the solid collected from the toluene phase of BMCMGGW45-B30 after treatment with the enzyme and extraction with toluene…...101 Figure 6.11: MALDI-MS spectrogram of the toluene extract of the enzyme degraded BMCMGGW45-MNPA1000…………………………………………………………...101
x
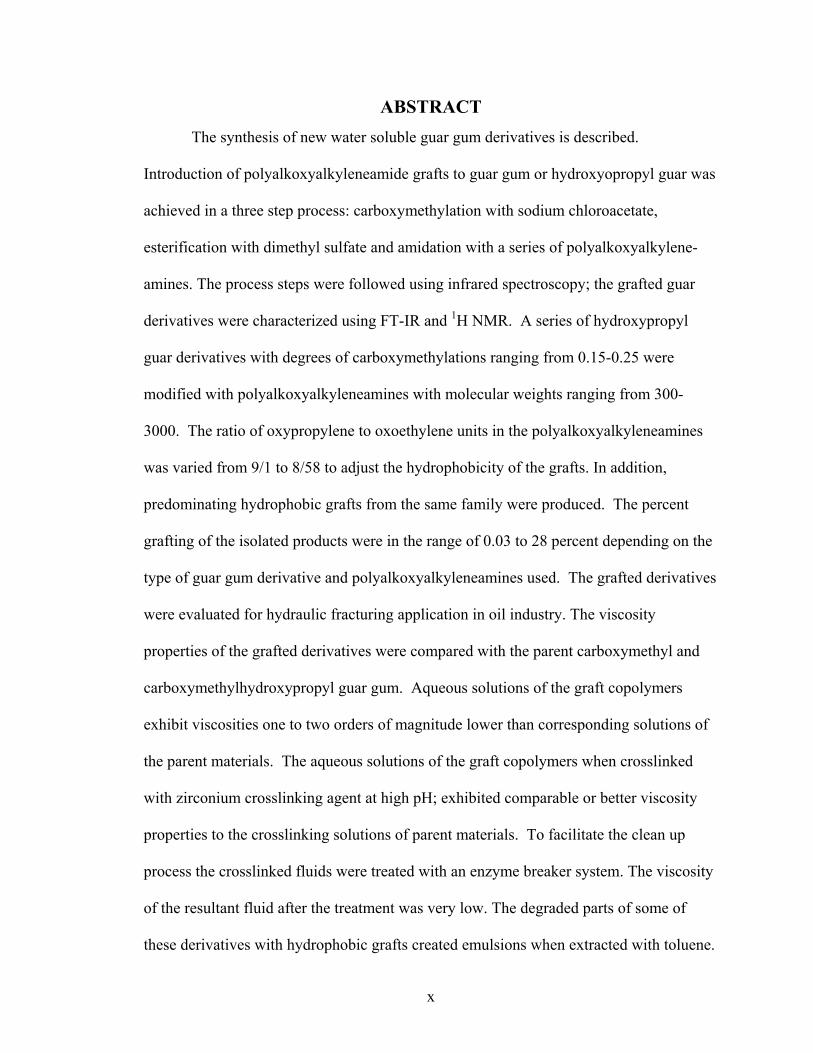
ABSTRACT The synthesis of new water soluble guar gum derivatives is described.
Introduction of polyalkoxyalkyleneamide grafts to guar gum or hydroxyopropyl guar was
achieved in a three step process: carboxymethylation with sodium chloroacetate,
esterification with dimethyl sulfate and amidation with a series of polyalkoxyalkylene-
amines. The process steps were followed using infrared spectroscopy; the grafted guar
derivatives were characterized using FT-IR and 1H NMR. A series of hydroxypropyl
guar derivatives with degrees of carboxymethylations ranging from 0.15-0.25 were
modified with polyalkoxyalkyleneamines with molecular weights ranging from 300-
3000. The ratio of oxypropylene to oxoethylene units in the polyalkoxyalkyleneamines
was varied from 9/1 to 8/58 to adjust the hydrophobicity of the grafts. In addition,
predominating hydrophobic grafts from the same family were produced. The percent
grafting of the isolated products were in the range of 0.03 to 28 percent depending on the
type of guar gum derivative and polyalkoxyalkyleneamines used. The grafted derivatives
were evaluated for hydraulic fracturing application in oil industry. The viscosity
properties of the grafted derivatives were compared with the parent carboxymethyl and
carboxymethylhydroxypropyl guar gum. Aqueous solutions of the graft copolymers
exhibit viscosities one to two orders of magnitude lower than corresponding solutions of
the parent materials. The aqueous solutions of the graft copolymers when crosslinked
with zirconium crosslinking agent at high pH; exhibited comparable or better viscosity
properties to the crosslinking solutions of parent materials. To facilitate the clean up
process the crosslinked fluids were treated with an enzyme breaker system. The viscosity
of the resultant fluid after the treatment was very low. The degraded parts of some of
these derivatives with hydrophobic grafts created emulsions when extracted with toluene.
1
CHAPTER 1 INTRODUCTION
1.1 Background
Hydraulic Fracturing Technology (HFT) as used in oil and natural gas production
is approximately fifty years-old. The technique is routinely used in the oil and gas
industry to improve or stimulate the recovery of hydrocarbons from underground
formations. HFT is typically employed to stimulate wells which produce from low
permeability underground formations. In such formations, recovery efficiency is
typically limited by a flow mechanism related to the low permeability zones. Applying
the HFT allows oil or natural gas to move more freely from the rock formation and low
permeability zones where they are trapped to a producing well that can bring the oil or
gas to the surface. “Since their introduction, fracturing fluids have been continuously
improved from simple oils to sophisticated water-based polymer gels”.1 During the early
years2, the basic focus of fracturing fluids development was directed at building fluid
systems that would result in successful placement of the planned proppant volume. Then
the focus was diverted to improve post fracturing production and field operation. After
that, the focus was in developing new fracturing fluids with enhanced rheological
properties. As technology advanced through the last two decades the research began to
center on developing gel breakers in hope to minimize the damage caused by residues of
fracturing fluids and achieve better fracture permeability. During the last few years many
new fracturing fluid systems were introduced to the industry. For example, surfactant-
based fluids were developed to promote oil diffusion in the formation, but their
viscosities were too low to seal the fracture walls. Thus they rapidly diffused from the
2
fracture to surrounding formation. The resultant deep invasion of the filtrate into the
formation lead to difficulty in fluid recovery from the formation during the clean up
process.2 Designing a fracturing fluid that combines the low damage performance of
surfactant fluids with the rhelogical properties and fluid-loss control of conventional
polymer-based gels could offer the industry significantly enhanced post-fracture
production potential.2
1.2 Principal of Hydraulic Fracturing Process
After a well is drilled into a rock formation that contains oil, natural gas, and
water, every effort is made to maximize the production of oil and gas. One way to
improve or maximize the flow of fluids to the well bore is to connect many pre-existing
fractures, pockets, and flow pathways in the reservoir rock with a larger created fracture.
This larger, created hydraulic fracture starts at the well and extends out into the reservoir
rock for as much as several hundred feet.3
A hydraulic fracture is formed when a fluid is pumped down the well at high pressures
for short periods of time (hours). The high pressure fluid (usually formed by aqueous
swelling of specialty high viscosity fluid additives to form highly viscose fluid or gel)
exceeds the rock strength and opens a fracture in the rock. A proppant, usually sand or
other coarse particles carried by the high viscosity fluid, is pumped into the fractures, and
the mixture fills the fracture. The viscosity of the mixture must be sufficient at this point
in the process to prevent the settling of the proppant particles. The pressure is then
released, allowing closure of the fracture onto the fluid/proppant mixture. After the
treatment, the proppant remains in the created fracture in the form of permeable pack that
serves to keep the fracture open.4 These proppant packs form conductive pathways for the
3
hydrocarbons to flow into the wellbore, which will allow more extensive production at
higher flow rates than otherwise possible. Leaving the gel in the fracture zone would
cause formation damage by decreasing oil or gas production. Thus to complete the
process, the fracturing fluid must be recovered from the formation. A well known method
used to recover or remove the fracturing fluids from the created fracture is to degrade the
fluid chemically or/and thermally, then to flush it from the fracture back to the surface by
the clean up step (flowing back the well).5 A successful fracturing treatment must allow
oil and gas to easily flow through the fractured zone to the well bore and to the surface.
The effective fracture length is not just a function of width and length of the resulting
fracture but also of good conductivity through the proppant and at the formation
environment. There are two sides to effective fracturing process. One is actually placing
the proppant deep in the formation and the other is how well the fracturing fluids can be
removed.2
One of the key elements in this process is to obtain sufficiently high fluid
viscosity at down-hole temperature and pressure to create a fracture in the reservoir and
transport as much of the intended volume of proppant particles into the newly created
fracture as possible, as well as to impair loss of fracturing fluids to the formation during
the treatment. In addition, an adequately viscous fluid shall prevent proppant settling
which may cause lines plugging and creating undesirable solid handling problems.1
Viscosity is used to evaluate fluids for its proppant suspension characteristics. “An
established criterion for a fluid’s capability to transport solids is that the fluid should have
a minimum viscosity of 100cP at a shear rate of 100/s over 3 hours test performance at
desired temperature”.1 The viscosity should be measured according to an American
4
Petroleum Institute (API) procedure for evaluating fracturing fluids.1 An alternate
source suggests that viscosities above 1000cP at low shear rate of 0.03/s are also
acceptable.6
1.3 The Composition of Fracturing Fluids
Fracturing fluids normally consist of many additives that serve two main
purposes: to enhance fracture creation and proppant carrying capability and to minimize
formation damage.3 Viscosifiers, such as polymers and crosslinking agents, temperature
stabilizers, pH-control agents, and fluid-loss control materials are among the additives
that assist fracture creation. Breakers, biocides, surfactants, and others fall under the
additives that minimize the formation damage.
Many polymers are used for this purpose. This list include: carboxymethyl cellulose
(CMC), hydroxyl ethyl cellulose (HEC), and carboxymethyl hydroxylethyl cellulose
(CMHEC). One of the must widely used polymers for this purpose is guar gum. “Guar
gum and its derivatives account for possibly 90% of all gelled fracturing fluids”.2 Guar
gum is a natural non-ionic hydrophilic polygalactomannan extracted from the seed of
Cyamopsis tetragonoloba (Figure 1.1) an annual leguminous plant originating from India
and Pakistan, but also cultivated in the United States.7,8 Typically guar gum exhibits a
high molecular weight (around 2×10⁶ Da).5
1.3.1 Guar Gum
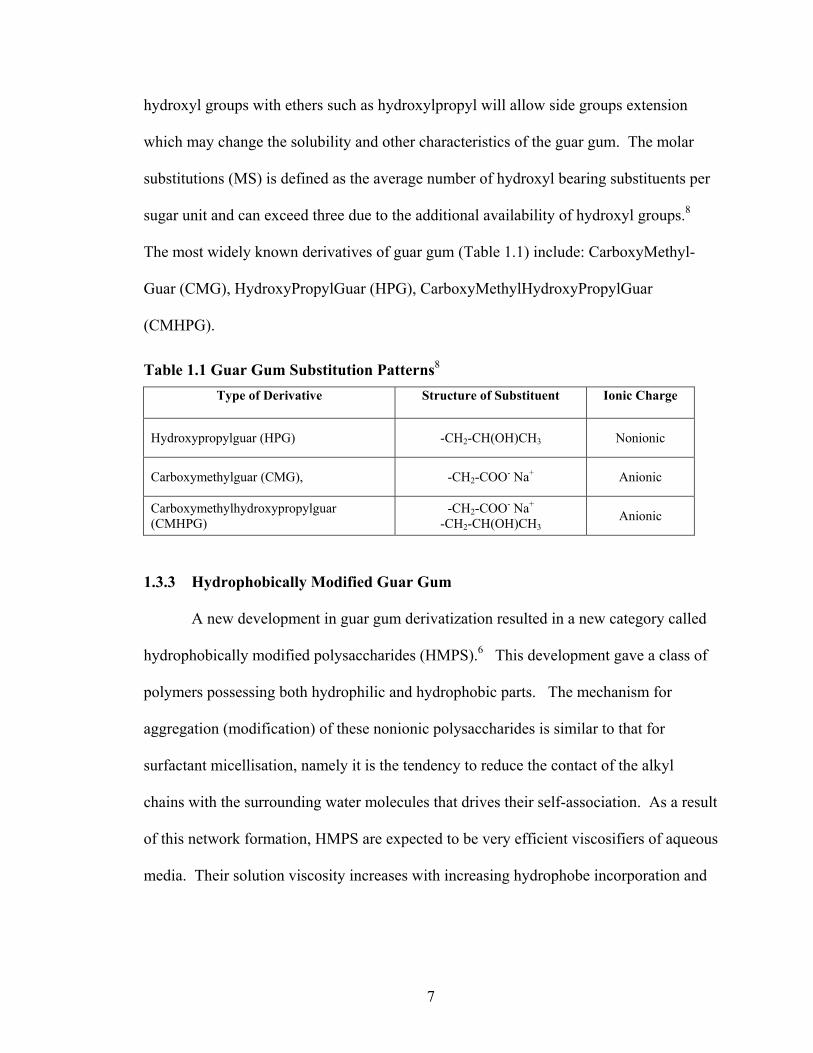
The chemical structure of guar gum (Figure 1.2) consists of D-mannose monomer units
linked to each other by β-(1→4) linkage, in order to form the main chain with D-galactose
branches joined by α-(1→6) bonds. On the average, the galactose branches occur on
every other mannose unit.7 The exact ratio of galactose to mannose varies with the
5
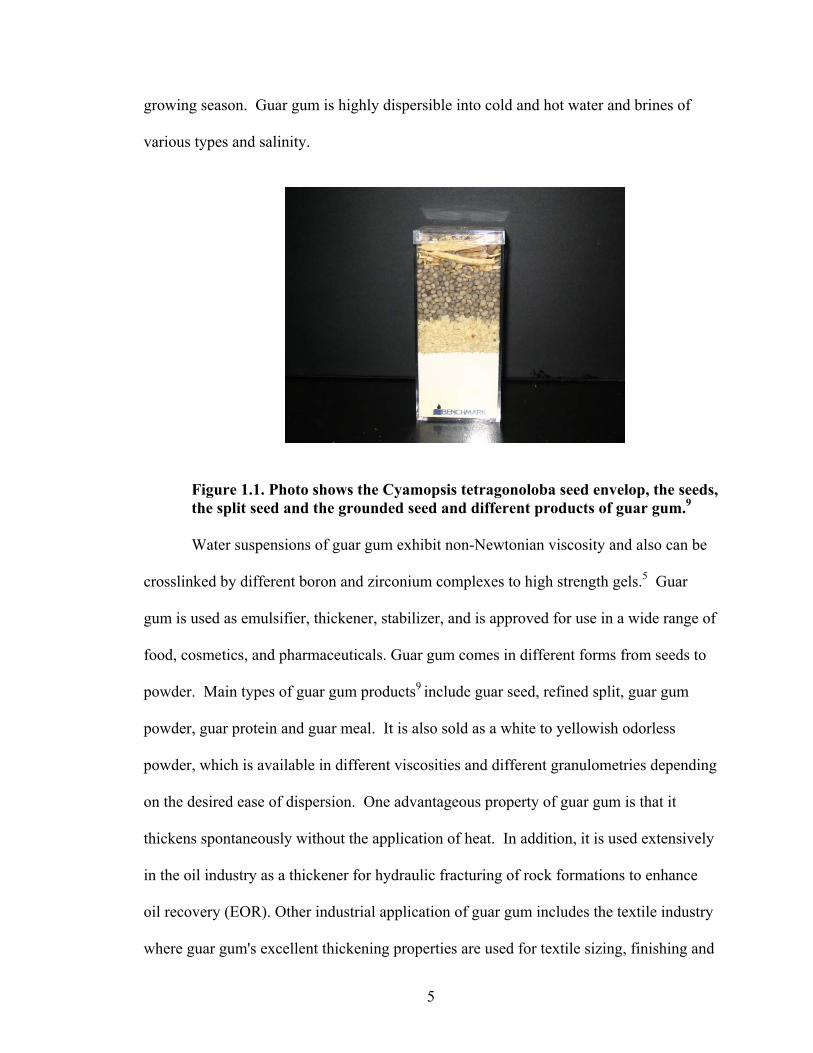
growing season. Guar gum is highly dispersible into cold and hot water and brines of
various types and salinity.
Figure 1.1. Photo shows the Cyamopsis tetragonoloba seed envelop, the seeds, the split seed and the grounded seed and different products of guar gum.9
Water suspensions of guar gum exhibit non-Newtonian viscosity and also can be
crosslinked by different boron and zirconium complexes to high strength gels.5 Guar
gum is used as emulsifier, thickener, stabilizer, and is approved for use in a wide range of
food, cosmetics, and pharmaceuticals. Guar gum comes in different forms from seeds to
powder. Main types of guar gum products9 include guar seed, refined split, guar gum
powder, guar protein and guar meal. It is also sold as a white to yellowish odorless
powder, which is available in different viscosities and different granulometries depending
on the desired ease of dispersion. One advantageous property of guar gum is that it
thickens spontaneously without the application of heat. In addition, it is used extensively
in the oil industry as a thickener for hydraulic fracturing of rock formations to enhance
oil recovery (EOR). Other industrial application of guar gum includes the textile industry
where guar gum's excellent thickening properties are used for textile sizing, finishing and
6
printing. In the paper industry guar is used as an additive where it gives denser surface to
the paper used in printing.9 In the food, pharmaceutical and cosmetics industry guar gum
is used as an effective binder, stabilizer, and thickener.9 It is also used in bakeries,
diaries, in dressings and sauces.9 Guar is an important natural food supplement with high
nutritional value, promoting weight gain and cholesterol reduction. In cosmetics,
especially shampoos and toothpastes, guar gum is used primarily as a thickening and
suspending agent. In beverages, it is used as stabilizer for preparing chocolate drinks and
juices.9
OO O
OHOH2C
OH
HOH2C
O
O
OH
CH2OHOH
HO
OHHO
Figure 1.2. Basic chemical structure of guar gum 1.3.2 Guar Gum Derivatives
Guar gum hydrates well in aqueous solutions, but concerns about solution clarity,
alcohol solubility and improved thermal stability led to the development of a number of
chemically modified guar gums.8 On average three hydroxyl groups are available for
derivatization on D-mannose or D-galactose sugar units in guar gum. The maximum
theoretical degree of substitution (DS) in such molecule is three. The substitution of
7
hydroxyl groups with ethers such as hydroxylpropyl will allow side groups extension
which may change the solubility and other characteristics of the guar gum. The molar
substitutions (MS) is defined as the average number of hydroxyl bearing substituents per
sugar unit and can exceed three due to the additional availability of hydroxyl groups.8
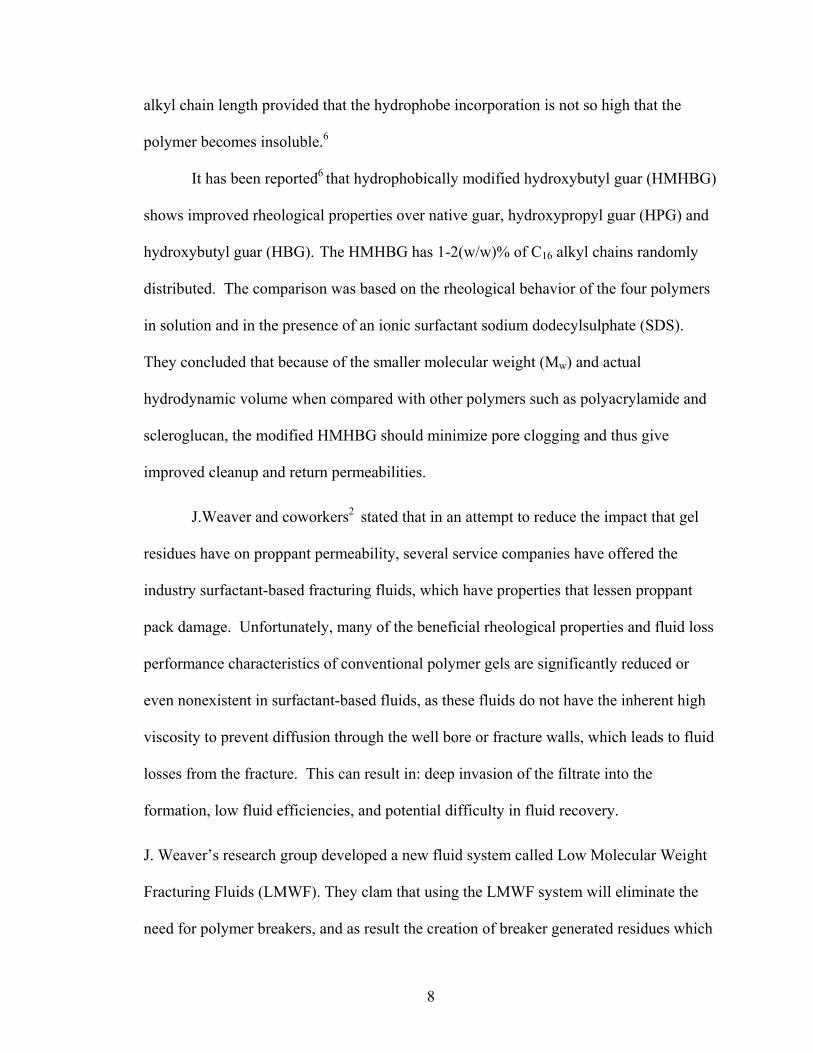
The most widely known derivatives of guar gum (Table 1.1) include: CarboxyMethyl-
Guar (CMG), HydroxyPropylGuar (HPG), CarboxyMethylHydroxyPropylGuar
(CMHPG).
Table 1.1 Guar Gum Substitution Patterns8 Type of Derivative Structure of Substituent Ionic Charge
Hydroxypropylguar (HPG) -CH2-CH(OH)CH3 Nonionic
Carboxymethylguar (CMG), -CH2-COO- Na+ Anionic
Carboxymethylhydroxypropylguar (CMHPG)
-CH2-COO- Na+
-CH2-CH(OH)CH3 Anionic
1.3.3 Hydrophobically Modified Guar Gum
A new development in guar gum derivatization resulted in a new category called
hydrophobically modified polysaccharides (HMPS).6 This development gave a class of
polymers possessing both hydrophilic and hydrophobic parts. The mechanism for
aggregation (modification) of these nonionic polysaccharides is similar to that for
surfactant micellisation, namely it is the tendency to reduce the contact of the alkyl
chains with the surrounding water molecules that drives their self-association. As a result
of this network formation, HMPS are expected to be very efficient viscosifiers of aqueous
media. Their solution viscosity increases with increasing hydrophobe incorporation and
8
alkyl chain length provided that the hydrophobe incorporation is not so high that the
polymer becomes insoluble.6
It has been reported6 that hydrophobically modified hydroxybutyl guar (HMHBG)
shows improved rheological properties over native guar, hydroxypropyl guar (HPG) and
hydroxybutyl guar (HBG). The HMHBG has 1-2(w/w)% of C16 alkyl chains randomly
distributed. The comparison was based on the rheological behavior of the four polymers
in solution and in the presence of an ionic surfactant sodium dodecylsulphate (SDS).
They concluded that because of the smaller molecular weight (Mw) and actual
hydrodynamic volume when compared with other polymers such as polyacrylamide and
scleroglucan, the modified HMHBG should minimize pore clogging and thus give
improved cleanup and return permeabilities.
J.Weaver and coworkers2 stated that in an attempt to reduce the impact that gel
residues have on proppant permeability, several service companies have offered the
industry surfactant-based fracturing fluids, which have properties that lessen proppant
pack damage. Unfortunately, many of the beneficial rheological properties and fluid loss
performance characteristics of conventional polymer gels are significantly reduced or
even nonexistent in surfactant-based fluids, as these fluids do not have the inherent high
viscosity to prevent diffusion through the well bore or fracture walls, which leads to fluid
losses from the fracture. This can result in: deep invasion of the filtrate into the
formation, low fluid efficiencies, and potential difficulty in fluid recovery.
J. Weaver’s research group developed a new fluid system called Low Molecular Weight
Fracturing Fluids (LMWF). They clam that using the LMWF system will eliminate the
need for polymer breakers, and as result the creation of breaker generated residues which
9
may result in formation damage. Further, they claim that this system also exhibits
excellent rheological properties. Their system employed a low molecular weight guar
gum polymer produced by controlled cleavage of polymer backbone to oligomers which
yields low viscosity aqueous solutions. However, they claim this system developed into
very robust fracturing fluids in the presence of boron-based crosslinkers. They observed
that this system exhibits: stable rheological properties during pumping but it returned to
its original low viscosity shortly after fracture closer. A fluid that has a high density of
crosslinks and high concentrations of fully hydrated material can be formulated in water
so that a simply dilution is all that is necessary to perform fracturing treatment, saving of
time, equipment and chemicals required for conventional system. This system is a pH
sensitive reversible gel i.e. below 8 the system is not crosslinked and above 8.5 it is
crosslinked and has a high viscosity. When flowing back the well the pH drops causing
the crosslinks dissociate and the fluid reverts to its original low viscosity. The recovered
fluid can be recycled because the Mw of the guar oligomers is unchanged.2
1.3.4 The Cross Linking Agent
The second major part of a fracturing fluid is the cross linking agent. High
viscosity may be attained by either increasing the polymer concentration or by cross
linking the polymer. Increasing the polymer concentration is normally not cost-effective
and may cause operational problems.3 As mentioned above guar gum and its derivatives
are widely used as thickeners for the hydraulic fracturing processes. Low concentrations
of guar gum (e.g., 0.3-0.5%) dissolved or suspended in water, will significantly increase
the viscosity of the fluid (e.g., from 1 to 150 cP), while the addition of millimolar
amounts of a cross linking agent such as borate ion to the guar gum solution will
10
substantially increase the viscosity several orders of magnitude (e.g., to 5700 cP, as
measured at low shear rate).5 Although cross linking occurs between guar and
polyvalent hydroxyl complexes i.e., Ti, Zr, Al, Cr, the guar borate chemistry is unique in
that the viscosities of these gels are reversible by mechanical shear.5 In other words, the
guar/borate complexation reaction is reversible.5 Aqueous based borate cross linked
fracturing fluids was first introduced in the 1950’s.8 It is generally believed that the
increase in viscosity is due to the formation of borate/guar complexes whereby borate
links two guar units at adjacent cis-hydroxy groups on the mannose backbone.5
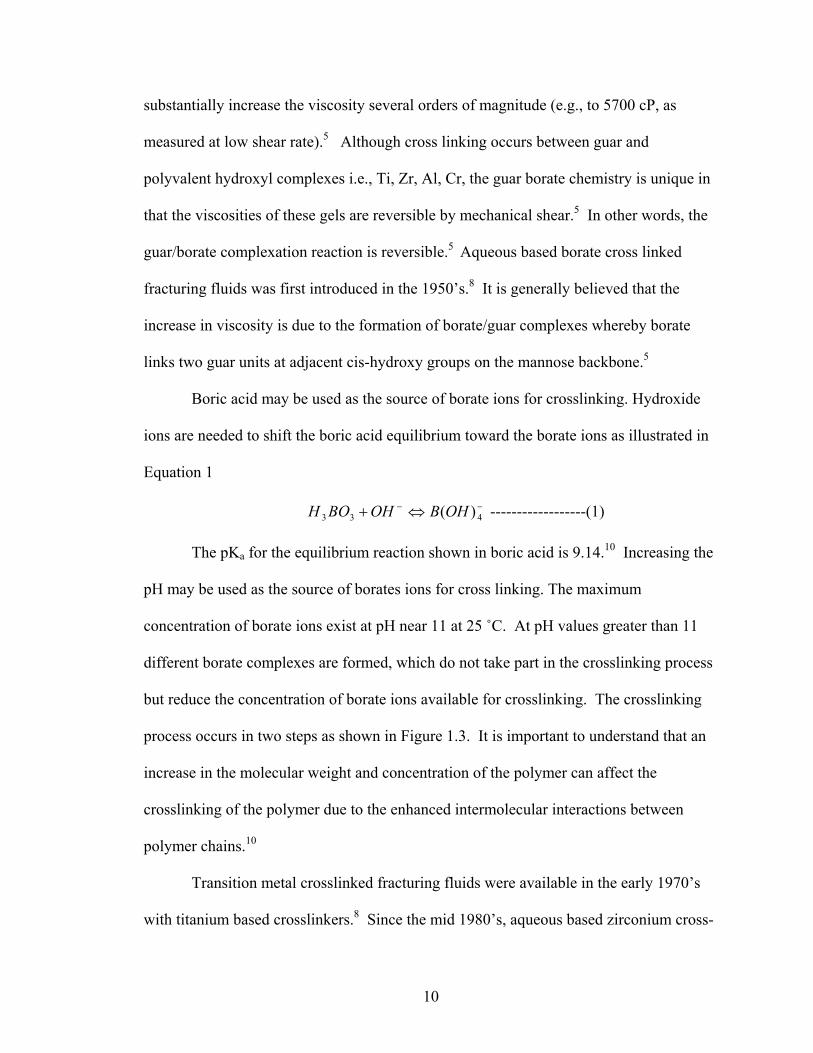
Boric acid may be used as the source of borate ions for crosslinking. Hydroxide
ions are needed to shift the boric acid equilibrium toward the borate ions as illustrated in
Equation 1
−− ⇔+ 433 )(OHBOHBOH ------------------(1)
The pKa for the equilibrium reaction shown in boric acid is 9.14.10 Increasing the
pH may be used as the source of borates ions for cross linking. The maximum
concentration of borate ions exist at pH near 11 at 25 ˚C. At pH values greater than 11
different borate complexes are formed, which do not take part in the crosslinking process
but reduce the concentration of borate ions available for crosslinking. The crosslinking
process occurs in two steps as shown in Figure 1.3. It is important to understand that an
increase in the molecular weight and concentration of the polymer can affect the
crosslinking of the polymer due to the enhanced intermolecular interactions between
polymer chains.10
Transition metal crosslinked fracturing fluids were available in the early 1970’s
with titanium based crosslinkers.8 Since the mid 1980’s, aqueous based zirconium cross-
11
linkers been used widely.8,11 Zirconium crosslinkers can be used with many polymer
systems, in a wide range of pH’s from less than 1 to greater than 12, and temperatures
ranging from 37°C to 205°C.11 Zirconium crosslinkers are introduced as different
complexes such as lactate or citrate12 but the precise mode of crosslinking has not been
determined. Ralph Morhouse and coworkers8 stated that “it is well known that zirconium
crosslinking can occur through the hydroxyls present on guar or its derivatives, or
through the carboxyl-functionality on carboxyalkyl derivatives of guar”. They also listed
three possible crosslinking mechanisms for zirconium.
O
OH
OH
+ BHO
HO OH
OHO
O
O
B
OH
OH
+ 2H2O
1:1 Complex Formation
O
HO
HO
O
O
O
B
O
OO 2H2O+
2:1 Complex Formation (Gel Cross linking)
Guar Gum
Borates
Guar Gum
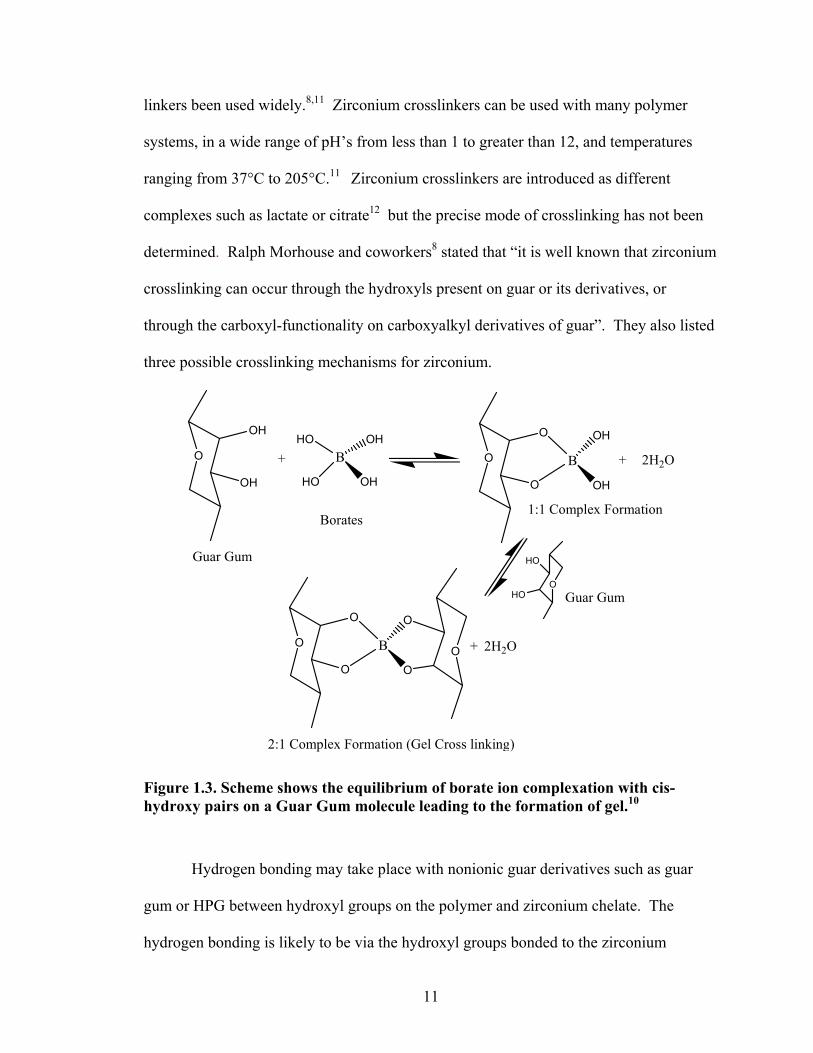
Figure 1.3. Scheme shows the equilibrium of borate ion complexation with cis-hydroxy pairs on a Guar Gum molecule leading to the formation of gel.10
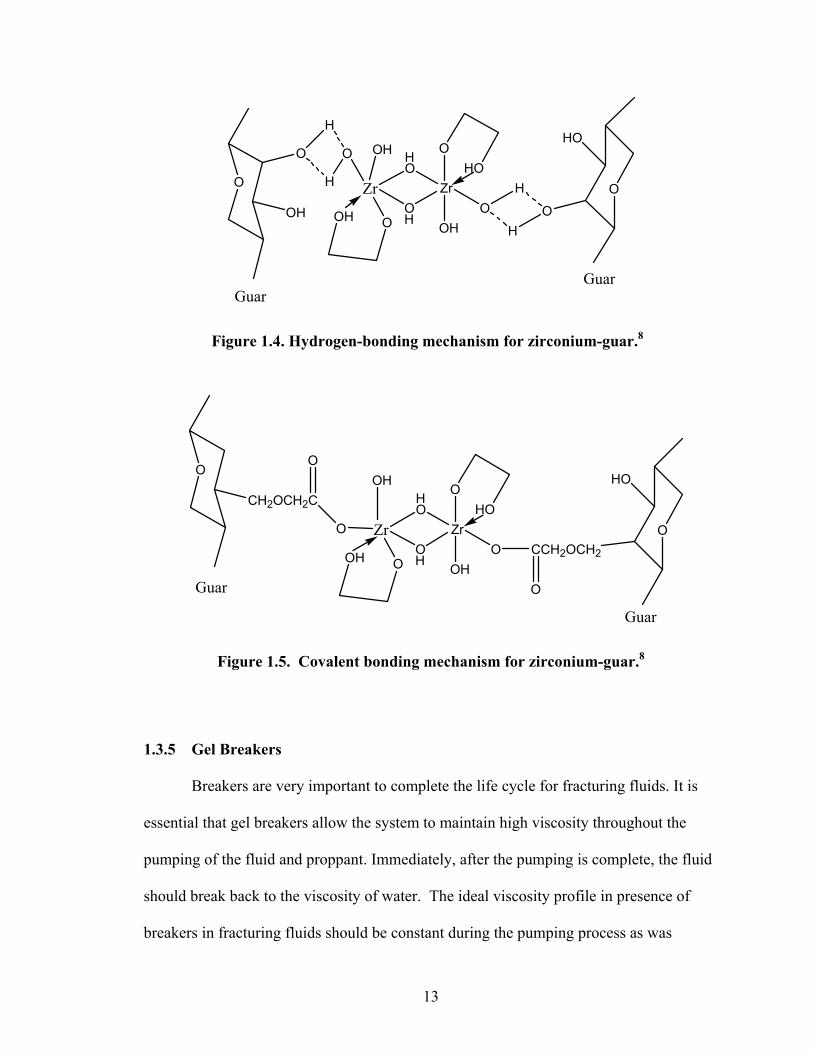
Hydrogen bonding may take place with nonionic guar derivatives such as guar
gum or HPG between hydroxyl groups on the polymer and zirconium chelate. The
hydrogen bonding is likely to be via the hydroxyl groups bonded to the zirconium
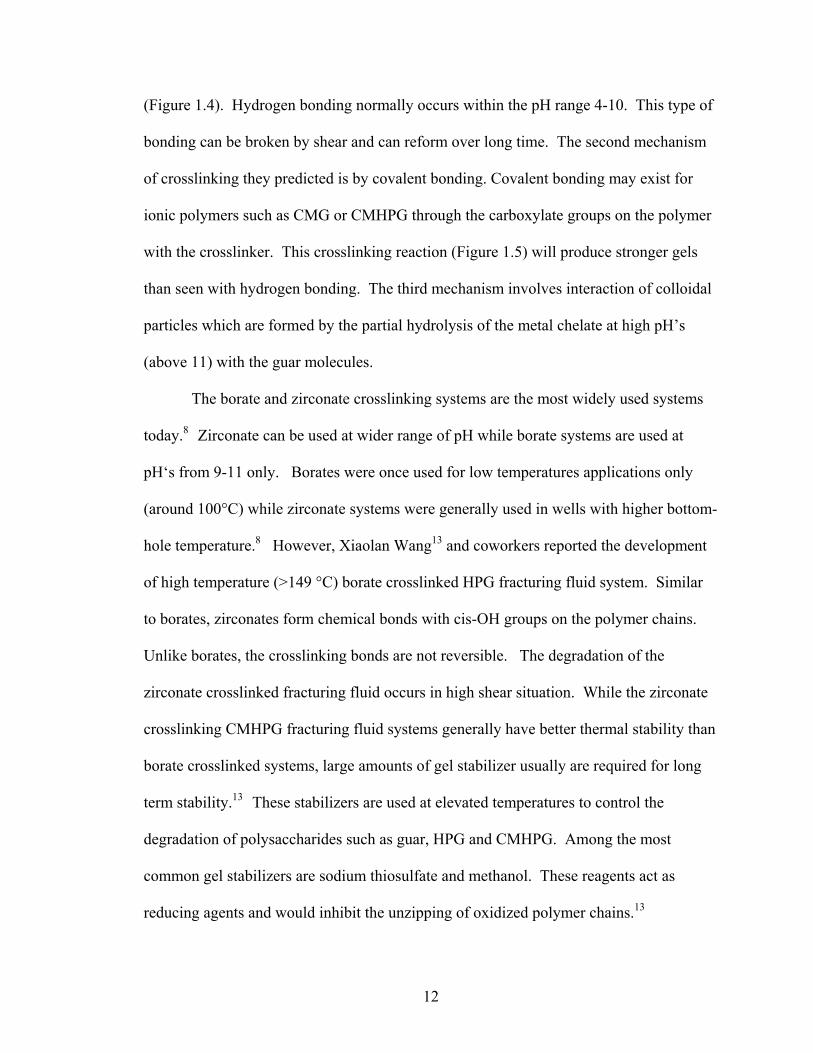
12
(Figure 1.4). Hydrogen bonding normally occurs within the pH range 4-10. This type of
bonding can be broken by shear and can reform over long time. The second mechanism
of crosslinking they predicted is by covalent bonding. Covalent bonding may exist for
ionic polymers such as CMG or CMHPG through the carboxylate groups on the polymer
with the crosslinker. This crosslinking reaction (Figure 1.5) will produce stronger gels
than seen with hydrogen bonding. The third mechanism involves interaction of colloidal
particles which are formed by the partial hydrolysis of the metal chelate at high pH’s
(above 11) with the guar molecules.
The borate and zirconate crosslinking systems are the most widely used systems
today.8 Zirconate can be used at wider range of pH while borate systems are used at
pH‘s from 9-11 only. Borates were once used for low temperatures applications only
(around 100°C) while zirconate systems were generally used in wells with higher bottom-
hole temperature.8 However, Xiaolan Wang13 and coworkers reported the development
of high temperature (>149 °C) borate crosslinked HPG fracturing fluid system. Similar
to borates, zirconates form chemical bonds with cis-OH groups on the polymer chains.
Unlike borates, the crosslinking bonds are not reversible. The degradation of the
zirconate crosslinked fracturing fluid occurs in high shear situation. While the zirconate
crosslinking CMHPG fracturing fluid systems generally have better thermal stability than
borate crosslinked systems, large amounts of gel stabilizer usually are required for long
term stability.13 These stabilizers are used at elevated temperatures to control the
degradation of polysaccharides such as guar, HPG and CMHPG. Among the most
common gel stabilizers are sodium thiosulfate and methanol. These reagents act as
reducing agents and would inhibit the unzipping of oxidized polymer chains.13
13
O
O
OH
Zr O
HO
O
O
H
H
OH O
HO
OH
Zr
O
OHO
HOH
H
OH
GuarGuar
Figure 1.4. Hydrogen-bonding mechanism for zirconium-guar.8
O
CH2OCH2C
Zr O
HO
OH O
HO
OH
Zr
O
OHO
HO
O
O
OH
CCH2OCH2
O
Guar
Guar
Figure 1.5. Covalent bonding mechanism for zirconium-guar.8
1.3.5 Gel Breakers
Breakers are very important to complete the life cycle for fracturing fluids. It is
essential that gel breakers allow the system to maintain high viscosity throughout the
pumping of the fluid and proppant. Immediately, after the pumping is complete, the fluid
should break back to the viscosity of water. The ideal viscosity profile in presence of
breakers in fracturing fluids should be constant during the pumping process as was
14
illustrated by J.M. Terracina et al.14,15 In most cases in reality, as they illustrated, a quick
initial drop in viscosity occurs followed by a rather gradual decline in viscosity until the
fluid is completely broken. Breakers used with fracturing fluids are classified into
oxidizers and enzymes. Oxidizers such as persulfates, are effective from 120-175 °F but
at higher temperatures these materials react too quickly and cause uncontrolled break and
premature gel degradation.14 A premature gel break will lead to poor proppant transport
and other process problems. Encapsulation can provide a slow release of oxidant or
breaker improving the break profile at low and moderate temperatures (at around 200°F),
but this method at higher temperatures offers only limited control.15 On the other hand,
enzymes are typically limited to lower temperatures (150 °F and lower) and at pH range
of 5 to 8. Recent developments in this field showed these pH and temperature limits can
be slightly expanded.15 The use of encapsulation can slightly improve the stability of
both oxidizers and enzymes. J.M. Terracina15 and coworkers reported the development of
high temperature viscosity controlling oxidizing breaker system which can be used in
fracturing fluids from 200 to 325°F.
1.4 This Project
The suggested idea in this work is to utilize slightly hydrophobically or hydro-
phobically modified polymers since the clean up process of the polymers must operate in
the presence of both brine and oil or condensate (liquefied gas). The benefit of using
such aggregated polymers is that the problems of pore clogging are overcome because the
oil flow will dissociate the aggregates and hence the actual hydrodynamic volume of
single chains is much smaller than the polymer complex. The clogged material will be
driven out from the formation by the flow back of either the water or the oil/condensate.6
15
Greater well productivity requires the development of less damaging completion and
stimulation fluids.
In this project, novel guar gum derivatives were developed. Guar gum and its
derivatives account possibly for 90% of all gelled fracturing fluids used today. The base
polymers used in this work was carboxymethyl, and carboxymethylhydroxypropyl guar
gum derivatives (CMG and CMHPG). These derivatives were derivatized with
polyoxyalkylene amines with different hydrophobicity and hydrophilicity. Procedures
for crosslinking those materials were developed. These derivatives may be cross linked
with a zirconium crosslinking agent to form gels, which were evaluated for the hydraulic
fracturing application according to the oil industry standards. Furthermore, the gels can
be degraded by using an enzyme breaker to illustrate the cleanup process. These
derivatives then may be introduced into oil wells in process such as hydraulic fracturing
treatments. It is very important to assure that these products will not produce damaging
byproducts that may cause damage to the formation. The synthesized guar gum
derivatives, possesses extraordinary features. If compared with the parent polymer the
low viscosity of the grafted guars make them less damaging material to the formation. It
can be removed from down whole either by the flow back of oil, condensate or water.
The surfactant behavior of degraded guar adducts should facilitate the clean up process.
In addition to oil and gas Industry, these derivatives may find applications in paint
and ink industry. They may work as dispersants and thinning agents due to their ability to
lower viscosity and reduce shear thinning. Other application may include the synthesis of
surfactants from the hydrophobically modified grafts of CMG. This can be reached by
controlled breaking these grafts to oligomers. These grafted products have very similar
16
structure for products used in formulating personal care products which make them a
candidate for those applications.
The synthesis, characterization, evaluation of these derivatives, and the results
obtained during this research project are described here in detail.
17
CHAPTER 2 SYNTHESIS AND CHARACTERIZATION OF CARBOXYMETHYL GUAR
2.1 Introduction
Carboxymethyl guar (CMG) is typically formed by derivatizing the guar seed
endosperm (refered to as split).4 Guar splits are prepared directly by separating the seed
coats from beans. The splits are typically covered with aqueous caustic solution to form
an alkoxy guar intermediate, which is treated with sodium chlorocetate in an amount
necessary to provide a desired CMG D.S. value. Using this approach the surface of the
split exhibits a high degree of carboxymethylation while polymers deep in the split have
been exposed to less caustic and chloroacetate. This resultant derivatives are
inhomogeneous samples with respect to extent of modification. The conditions typically
used in this method lead to 60% of sodium chloroacetate (SCA) consumed in making the
target derivative while 40% is consumed to form undesirable byproducts such as glycolic
acid.4 Jeffery C. Dawson and coworkers4 reported a different method of making CMG
from guar gum powder utilizing heterogeneous conditions achieved by slurring the guar
powder in refined aliphatic oil. While rapidly stirring and degassing the reactor with N2,
40% aqueous caustic solution was added drop-wise to the slurry. Then the slurry was
allowed to swell for thirty minutes. A 40% solution of SCA was added drop-wise to the
swollen alkoxy guar gum. When 90% of the SCA solution had been added, the slurry was
heated to 85°C while continuing to add the rest SCA, then the reaction was kept at 85°C
for two hours. After that the solid was filtered, washed with 80% aqueous methanol, and
dried. In another report, T. Schult and S. Moe16 summarized another simple method of
making sodium carboxymethyl cellulose from cellulose using 87wt% 2-propanol aqueous
18
solution as the solvent. After swelling the cellulose in the 2-propanol solution under N2,
NaOH dissolved in 2-propanol aqueous solution was added over 30 minutes and then it
was allowed to swell more for l hour at room temperature. A saturated solution of
chloroacetic acid (CAA) in 2-propanol alcohol was added. After 1 hour the reaction
temperature was raised to 75°C during 1 hour and the reaction was then allowed to
proceed for one more hour under stirring before it was quenched with acetic acid to
decrease the pH to 7. Finally the solid was filtered and washed with 87%w/w 2-propanol
aqueous solution and then aqueous methanol (70% w/w) in a Soxhlet extractor.
In this work we used a method derived from these two procedures. Our aim was
to synthesize CMG products with different D.S. values which are not commercially
available. Basically, we used the T. Schult and S. Moe16 procedure but we found it is
difficult to form the sodium salt derivative using CAA. We found it is easier to produce
the sodium carboxymethyl guar using SCA as described below.
2.2 Experimental Procedures
2.2.1 Preparation of Sodium Carboxymethyl Guar (NaCMG) from CAA
Guar gum provided by Dowell Schlumberger was used without further
purification. The guar gum had an average molecular weight (Mw) of 1.053×10⁶ g/mol
and an average R.M.S. radius, Rw, for the particles as revealed by GPC/MALS of about
56.87 nm. NaCMG was first synthesized from guar gum and CAA under heterogeneous
conditions following a slight modification of the method reported by T. Schult and S.
Moe16 for the synthesis of carboxymethyl cellulose. Guar gum (30-60 g) was swollen in
400-600 mL of 2-propanol/water (87wt% 2-propanol) for 30 min with stirring and under
nitrogen. After adding 2-16 g of NaOH dissolved in 20-40 ml of DI water over a period
19
of 30 min the mixture was allowed to react for 1h at room temperature. Then depending
upon the D.S. desired, a solution of 2.67 – 21.5 g chloroacetic acid in 25-40 ml of 2-
propanol was added to the mixture and left for 1 h to react. The temperature of the
reaction was then raised to 70°C during 1 h. The reaction was then allowed to proceed
for another hour at 70°C. The mixture was allowed to cool to room temperature before it
was filtered. The solid was washed with 80% (v/v) methanol/water and then was soaked
in 80% (v/v) methanol solution for 30 min to remove inorganic salts. Then the pale
yellow color product was isolated by filtration, washed with bulk methanol, and dried in
an oven at 60°C overnight. The ATR FT-IR spectrum of the solid product showed peaks
at 3235 cm-1 (w, O-H), 2913 cm-1 (w, C-H), 1593 cm-1 (vs, acid carbonyl), and at 1017
cm-1 (vs, C-O).
2.2.2 Preparation of Sodium Carboxymethyl Guar (NaCMG) from SCA
NaCMG was synthesized from guar gum and SCA under heterogeneous
conditions following the above method simply by substituting CAA with SCA. A 70 g
sample of guar gum was swelled in 400 ml of 2-propanol under nitrogen with stirring.
Then 24.8g of NaOH solution (40% w/w) was added over a period of 20 min and the
mixture was allowed to stand for further swelling for 30-60 min at room temperature.
Then a 60g solution of SCA (40% w/w) was added to the mixture over a period of 30 min
and the mixture was allowed to react for 1 hour. The temperature of the reaction was
then raised to 70 °C within 1 hour. The reaction was then allowed to proceed for 2-3
hour at 70 °C. The sodium carboxymethyl guar was isolated as described above. The
FT-IR spectrum for this product is similar to the one shown in Figure 2.1.
20
2.2.3 Conversion of NaCMG to The Acid Form
NaCMG (10g) was transferred to acid form by slurring the NaCMG in 150 ml of
ethyl alcohol (95%). A 6-12 mL 70% HNO3 (specific gravity 1.42) was added and
stirred for 20 minutes. While stirring the slurry was heated to boil for 5 minutes, then the
heat was removed, and the stirring continued for 15-20 minutes. The cooled mixture was
filtered and the residue was washed with three 150 mL aliquots of 80% aqueous methanol
to remove salts and excess acid. Finally it was washed with methanol and dried in oven
at 60°C overnight.
2.2.4 Determination of the Degree of Substitution via Titration
The dried acid form samples made in the previous step (1g) were transferred to
200ml Erlenmeyer flasks and suspended in distilled water (100 ml) until they dissolved
completely. An excess of 0.5-1.0 N NaOH (10-15 ml) solution was added with stirring
and stirring was continued for 15 more minutes before solution was heated to boil for 15-
30 min. While the solution was hot excess NaOH was back titrated with 0.5 N HCl to a
phenolphthalein end point. The amount of acid consumed was recorded and the D.S. was
calculated according to equation 2.1 and listed in Tables 2.1, 2.2 and 2.3.
D.S. = 0.162 A/ (1-0.058A) --------------------------------------------- (2.1)
Where A = (BC-DE)/F
A= acid consumed per gram of sample B= NaOH solution Added, ml C= Normality of NaOH D= HCl required for titration of the excess NaOH, ml, E= Normality of HCl, F= CMG used, g 162= grams molecular mass of anhydroglucose unit of Guar Gum, and 58= net increase in molecular mass of anhydroglucose unit for each carboxymethyl group substituted.
21
2.2.5 NMR Analysis of CMG-Triton B Salt
Approximately 1 g of the acid form of CMG or CMHPG was swollen in 50 ml 70
v% aqueous methanol for 1-2 h. Before adding 0.5 g of 40% triton B in methanol
solution the mixture was allowed to react at room temperature for 30 min and then was
heated to a boil for 5-10 min, and allowed to cool for another half an hour. Then the
solution volume was reduced to 10mL and the derivative was isolated by precipitating
into methanol. The solid product was washed with pure methanol three times to remove
traces of water and Triton B. Finally, the collected solid was dried in an oven overnight.
The proton NMR analysis was done on D2O solutions (around 5%) of CMG-triton B salt.
The NMR analyses were performed using Bruker NMR DPX 250 and DPX 300 at 10s as
D1 and using 24 scans. The D.S. was calculated using equation 2.2 and listed in Table
2.4.
DS= (a/5) / (b-c/20) ------------------------------------------------------- (2.2)
a : integration of phenyl (base of integration mostly 1)
b : integration of CMG peaks (3.2 -4.2 ppm)
c : integration of methyl peak at 1 ppm in case of CMHPG samples
2.3 Results and Discussion
2.3.1 Preparation of Sodium Carboxymethyl Guar (NaCMG) from CAA and SCA
Different CMG products with various degrees of substitution were synthesized by
altering the amounts of NaOH and CAA or SCA as shown in Table 2.1 and Table 2.2.
We observed change in color of the guar gum from white to pale yellow after the reaction
with NaOH. This color is an indication of the presence of the alkoxy sodium salt of the
guar gum. The presence of this color after the addition of CAA or SCA until the end of
22
the reaction period is a mark of the successful production of NaCMG. In the other hand,
if the yellow color changed to milky then it is an indication that the acid form CMG is
produced. This was observed a lot when using CAA for the carboxymethylation. If
CAA must be used then the ratio of NaOH to CAA must be adjusted to give the NaCMG.
It was observed also that the resulted product swells when the NaOH was added and the
swelling increases when the CAA or SCA was added and the reaction temperature was
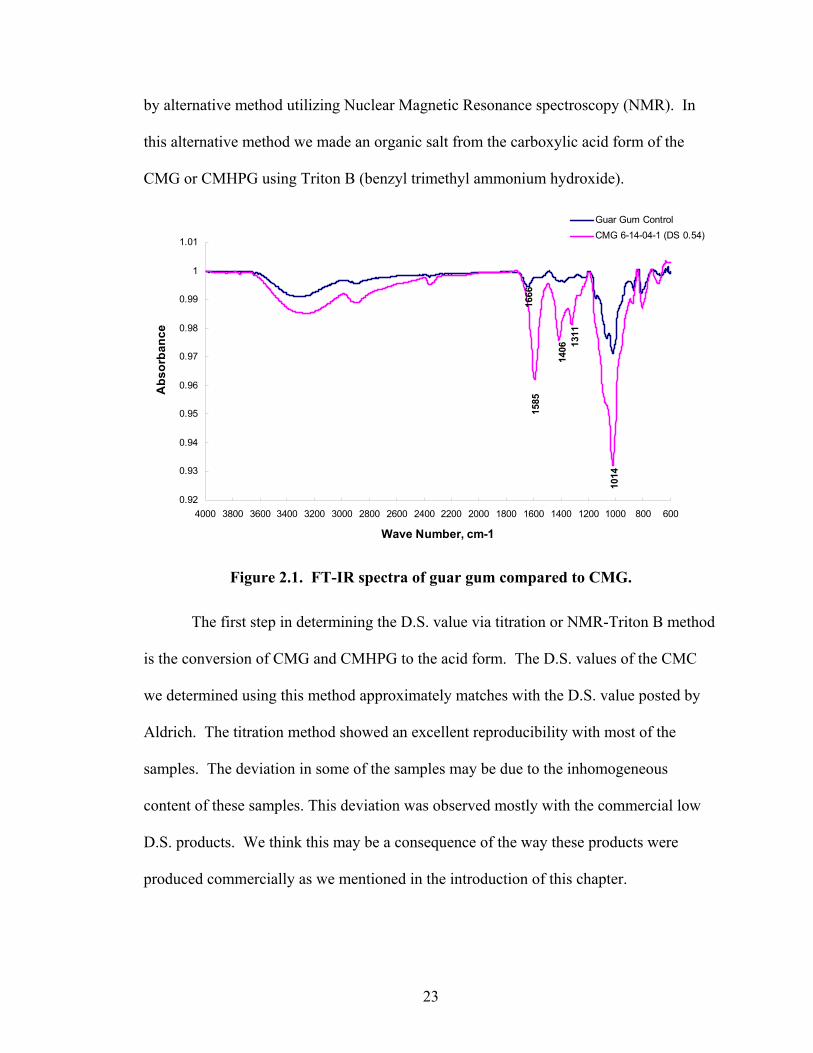
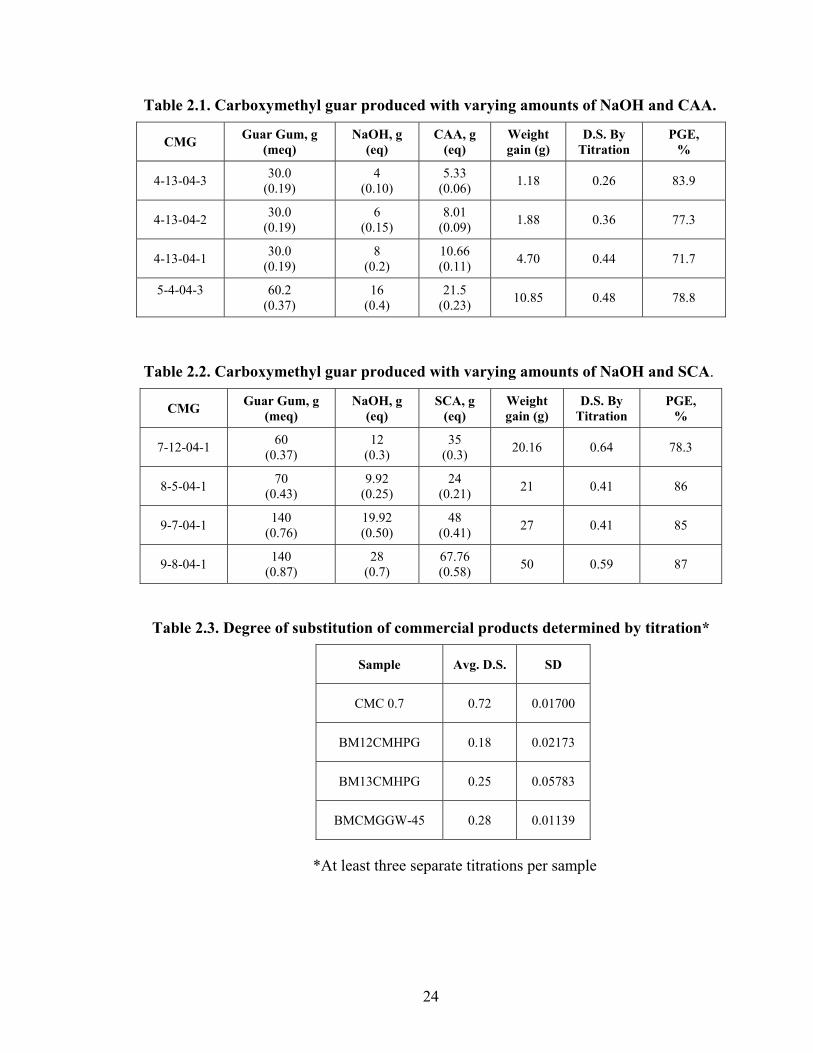
raised to 70°C. The Percent Grafting Efficiency (PGE) was calculated according to
equation 2.3.
PGE= [(meq of guar × titration D.S.)/(eq. of CAA or SCA used)]×100 ----(2.3)
The PGE values shown indicated that we were able to produce CMG with
grafting efficiency higher than 70%. But also it is clear as we stated in the introduction
of this chapter that large amount of the CAA and SCA is consumed toward making
undesirable byproducts. We also observed that using SCA was more efficient and gave
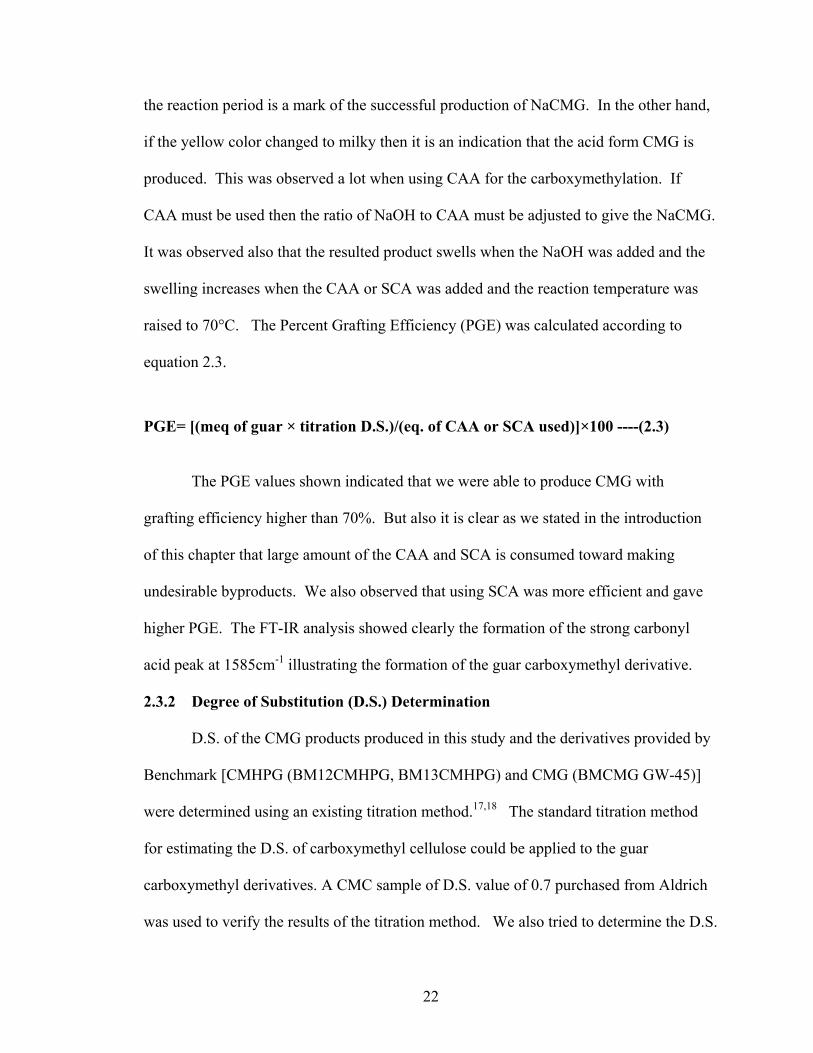
higher PGE. The FT-IR analysis showed clearly the formation of the strong carbonyl
acid peak at 1585cm-1 illustrating the formation of the guar carboxymethyl derivative.
2.3.2 Degree of Substitution (D.S.) Determination
D.S. of the CMG products produced in this study and the derivatives provided by
Benchmark [CMHPG (BM12CMHPG, BM13CMHPG) and CMG (BMCMG GW-45)]
were determined using an existing titration method.17,18 The standard titration method
for estimating the D.S. of carboxymethyl cellulose could be applied to the guar
carboxymethyl derivatives. A CMC sample of D.S. value of 0.7 purchased from Aldrich
was used to verify the results of the titration method. We also tried to determine the D.S.
23
by alternative method utilizing Nuclear Magnetic Resonance spectroscopy (NMR). In
this alternative method we made an organic salt from the carboxylic acid form of the
CMG or CMHPG using Triton B (benzyl trimethyl ammonium hydroxide).
1666
1585
1406 13
11
1014
0.92
0.93
0.94
0.95
0.96
0.97
0.98
0.99
1
1.01
6008001000120014001600180020002200240026002800300032003400360038004000
Wave Number, cm-1
Abs
orba
nce
Guar Gum ControlCMG 6-14-04-1 (DS 0.54)
Figure 2.1. FT-IR spectra of guar gum compared to CMG.
The first step in determining the D.S. value via titration or NMR-Triton B method
is the conversion of CMG and CMHPG to the acid form. The D.S. values of the CMC
we determined using this method approximately matches with the D.S. value posted by
Aldrich. The titration method showed an excellent reproducibility with most of the
samples. The deviation in some of the samples may be due to the inhomogeneous
content of these samples. This deviation was observed mostly with the commercial low
D.S. products. We think this may be a consequence of the way these products were
produced commercially as we mentioned in the introduction of this chapter.
24
Table 2.1. Carboxymethyl guar produced with varying amounts of NaOH and CAA.
CMG Guar Gum, g (meq)
NaOH, g (eq)
CAA, g (eq)
Weight gain (g)
D.S. By Titration
PGE, %
4-13-04-3 30.0 (0.19)
4 (0.10)
5.33 (0.06) 1.18 0.26 83.9
4-13-04-2 30.0 (0.19)
6 (0.15)
8.01 (0.09) 1.88 0.36 77.3
4-13-04-1 30.0 (0.19)
8 (0.2)
10.66 (0.11) 4.70 0.44 71.7
5-4-04-3
60.2 (0.37)
16 (0.4)
21.5 (0.23) 10.85 0.48 78.8
Table 2.2. Carboxymethyl guar produced with varying amounts of NaOH and SCA.
CMG Guar Gum, g (meq)
NaOH, g (eq)
SCA, g (eq)
Weight gain (g)
D.S. By Titration
PGE, %
7-12-04-1 60 (0.37)
12 (0.3)
35 (0.3) 20.16 0.64 78.3
8-5-04-1 70 (0.43)
9.92 (0.25)
24 (0.21) 21 0.41 86
9-7-04-1 140 (0.76)
19.92 (0.50)
48 (0.41) 27 0.41 85
9-8-04-1 140 (0.87)
28 (0.7)
67.76 (0.58) 50 0.59 87
Table 2.3. Degree of substitution of commercial products determined by titration*
Sample Avg. D.S. SD
CMC 0.7 0.72 0.01700
BM12CMHPG 0.18 0.02173
BM13CMHPG 0.25 0.05783
BMCMGGW-45 0.28 0.01139
*At least three separate titrations per sample
25
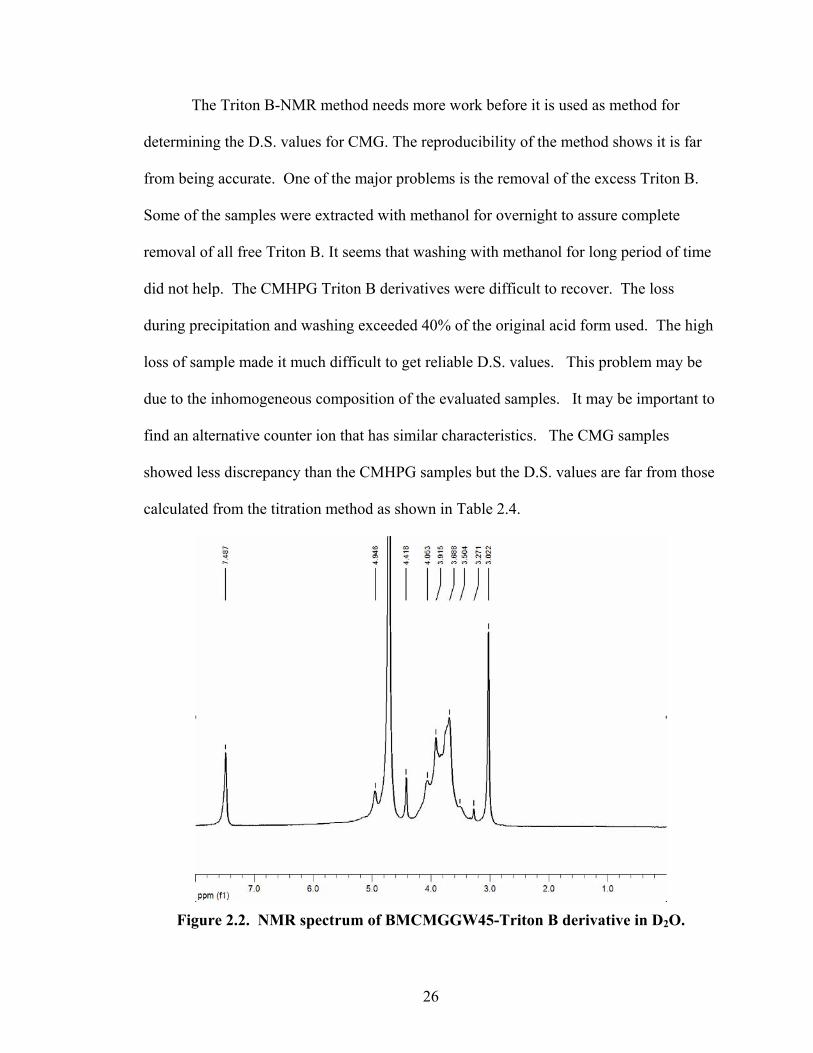
2.3.3 NMR Analysis of CMG-Triton B Salt
In this alternative method we tried to make an organic salt with a distinctive
counter ion by the reaction of the acid form of the CMG with Triton B. The rational for
selecting this counter ion is based upon the presence of peak in the NMR spectra which
do not overlap with guar gum spectrum and thus should be easy to quantify. The
spectrum of Triton B consists of three peaks 7.43 ppm (singlet, 5H, phenyl), 3.02 ppm
(singlet, 9H, trimethyl), 4.41 ppm (singlet, 2H, benzyl). The peaks related to the CMG
were mostly in the interval 3.2-4.2 ppm which represent approximately 20 1H per repeat
unit. Three other protons are located outside of this interval. The signal at 4.73ppm (2H)
is assigned to the anomeric protons of the two mannose in the repeat units, and the signal
at 5.0ppm is assigned to the corresponding galactose anomeric proton.19
The calculation of the D.S. was based on the phenyl group (5 H) of the Triton B
and on the main area of the CMG at 3.2-4.2 ppm (20 H). The phenyl group was selected
because it has a well defined peak located far from the main peaks area, and has no
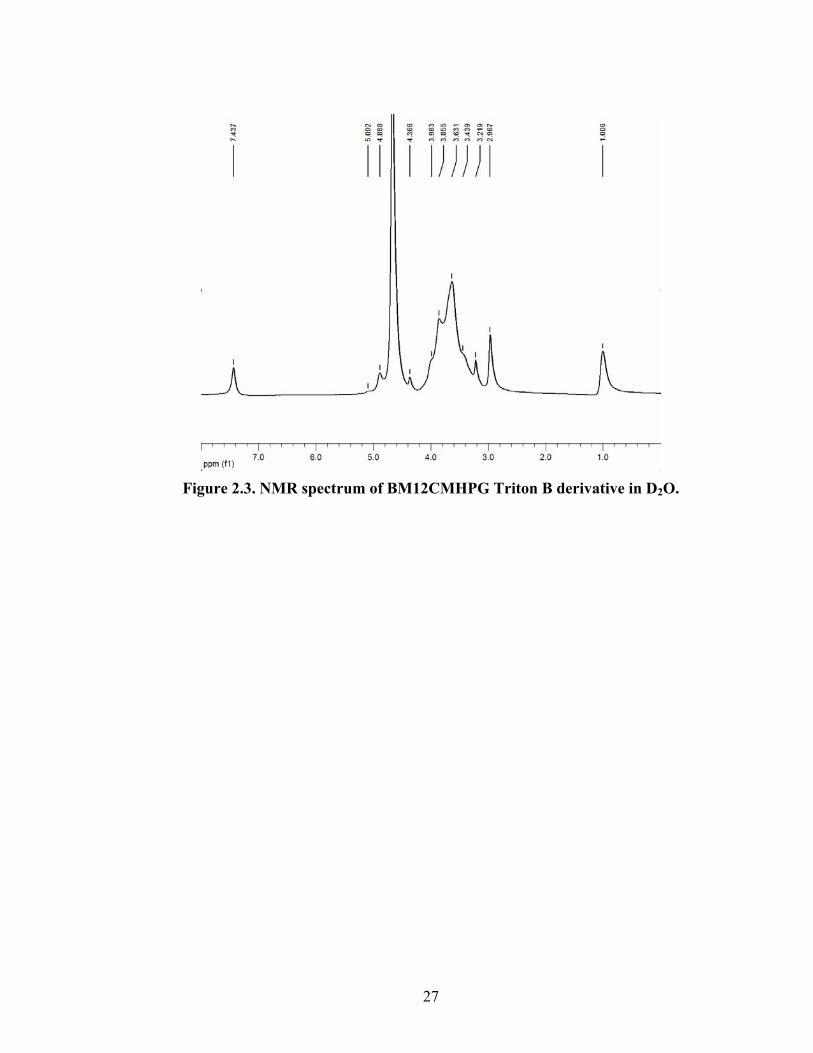
interference with other peaks. In case of CMHPG samples we had to subtract the area
corresponds to the hydroxypropyl graft. This was done by subtracting the integration of
the peaks located at 1 ppm which represent three methyl 1H in the hydroxypropyl moiety.
The area of these three protons is equivalent to the area of three other protons exist in the
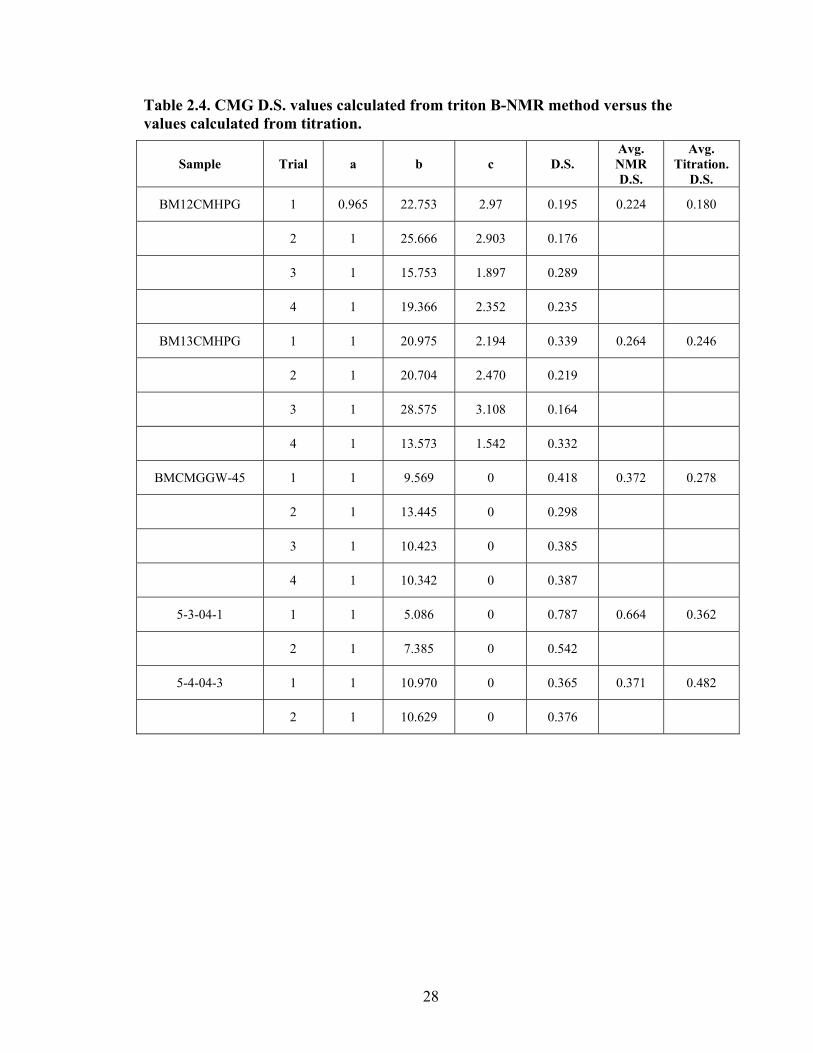
main area at 3.2-4.2ppm. Table 2.4 show the results for the D.S. calculated from the
triton B NMR method compared to the D.S. calculated from the titration method. Figure
2.2 and Figure 2.3 show the NMR spectra of BMCMGGW45 and BM12CMHPG Triton
B salts.
26
The Triton B-NMR method needs more work before it is used as method for
determining the D.S. values for CMG. The reproducibility of the method shows it is far
from being accurate. One of the major problems is the removal of the excess Triton B.
Some of the samples were extracted with methanol for overnight to assure complete
removal of all free Triton B. It seems that washing with methanol for long period of time
did not help. The CMHPG Triton B derivatives were difficult to recover. The loss
during precipitation and washing exceeded 40% of the original acid form used. The high
loss of sample made it much difficult to get reliable D.S. values. This problem may be
due to the inhomogeneous composition of the evaluated samples. It may be important to
find an alternative counter ion that has similar characteristics. The CMG samples
showed less discrepancy than the CMHPG samples but the D.S. values are far from those
calculated from the titration method as shown in Table 2.4.
Figure 2.2. NMR spectrum of BMCMGGW45-Triton B derivative in D2O.
27
Figure 2.3. NMR spectrum of BM12CMHPG Triton B derivative in D2O.
28
Table 2.4. CMG D.S. values calculated from triton B-NMR method versus the values calculated from titration.
Sample Trial a b c D.S. Avg. NMR D.S.
Avg. Titration.
D.S.
BM12CMHPG 1 0.965 22.753 2.97 0.195 0.224 0.180
2 1 25.666 2.903 0.176
3 1 15.753 1.897 0.289
4 1 19.366 2.352 0.235
BM13CMHPG 1 1 20.975 2.194 0.339 0.264 0.246
2 1 20.704 2.470 0.219
3 1 28.575 3.108 0.164
4 1 13.573 1.542 0.332
BMCMGGW-45 1 1 9.569 0 0.418 0.372 0.278
2 1 13.445 0 0.298
3 1 10.423 0 0.385
4 1 10.342 0 0.387
5-3-04-1 1 1 5.086 0 0.787 0.664 0.362
2 1 7.385 0 0.542
5-4-04-3 1 1 10.970 0 0.365 0.371 0.482
2 1 10.629 0 0.376
29
CHAPTER 3 GRAFT COPOLYMERIZATION OF GUAR GUM VIA XANTHATE AND RAFT PROCESSES
3.1 Introduction
Our main objective in this work is to utilize grafting processes to modify
polysaccharide materials, which are widely used in the oil industry in order to develop
hydrophobically modified polysaccharides (HMPS). The HMPS are expected to facilitate
greater well productivity, while introducing less damaging completion and stimulation
fluids. The HMPS mechanism for aggregation of nonionic HMPS is similar to that for
surfactant micellisation which will lead to better cleaning performance. Incorporating
hydrophobic moieties into the hydrophilic structure of the polysaccharide leads to
materials that should exhibit lower viscosities than the parent polysaccharide itself in
aqueous solutions. The cleaved (broken) products of HMPS should form surfactant like
materials that are easily removed from the formation by water or oil/gas during
production. The most widely used polysaccharide polymers nowadays by the industry
(as described in chapter 1) are guar gum and its derivatives which make them the best
candidates to be used for this study. In this chapter we are reporting the utilization of
two free radical polymerization means to achieve this goal.
Many trials were found in the literature reporting the free radical promoted
grafting of guar gum with various monomers. For example, a graft of methylacrylamide
(MAM) onto guar gum, using a potassium chromate/malonic acid redox pair was
reported by Kunj Behari7 and coworkers. In a different study P. Chowdhury20 et al.
reported the graft of methyl methacrylate (MMA) onto guar gum utilizing ceric
ammonium sulfate/dextrose redox pair (CAS/DM). Grafting of acrylic acid (AA) onto
guar gum was reported by Kavita Taunk21 et al. using potassium peroxydiphosphate
30
(PDP)/silver nitrate redox system. In addition, grafting of polyacrylonitrile onto guar
gum utilizing potassium persulfate/ ascorbic acid redox system was also reported.22 The
above examples indicate that grafting of guar with different vinyl monomers via radical
polymerization is feasible.
The xanthate method used for grafting cellulose is another useful method which
seems to be applicable and feasible for grafting monomers onto guar gum. Many studies
were reported using different approaches to grafting styrene and other monomers onto
cellulose xanthate. Cellulose xanthate and xanthates in general have pronounced
reducing properties which make it possible to form a cellulose xanthate-oxidant redox
system which then can be used for obtaining grafted copolymers of cellulose.23 This was
demonstrated by Dimov and Pavlov,24 who reported the modification of cellulose by graft
copolymerization of cotton cellulose-xanthate and acrylonitrile utilizing a xanthogenate-
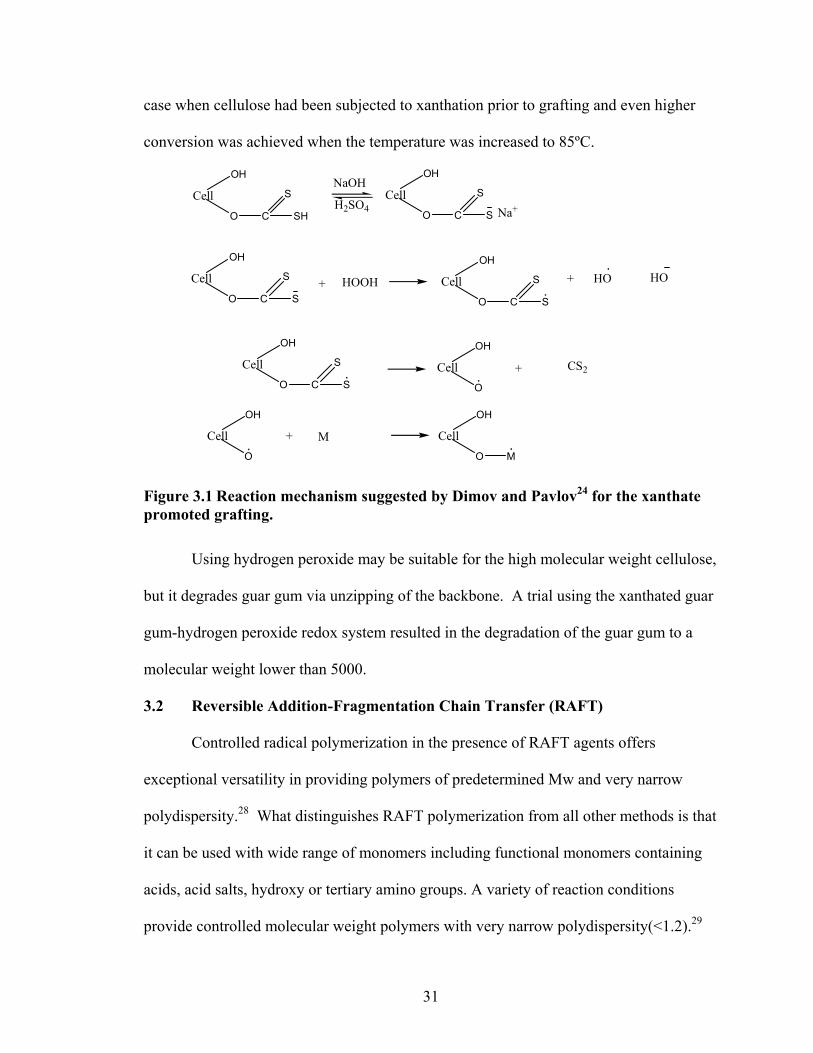
hydrogen peroxide redox system. According to the reaction mechanism suggested by
Dimov and Pavlov (Figure 3.1), the first step is the formation of a dithiocarbonate
radical. In the next step, the xanthate radical decomposes into a hydroxy radical and free
carbon disulfide. The copolymerization is then initiated by the hydroxy radicals in the
presence of suitable monomers.25 According to the suggested mechanism, the graft would
be attached to the cellulose by a relatively strong ether linkage. Using this method the
graft copolymerization of monomers such as acrylonitrile,24,26 styrene,23 and acrylates 25
was reported.
Utilizing potassium persulfate or potassium persulfate/Fe2+ initiation systems
Craczyk and Hornof27 reported the formation of poly(styrene-g-cellulose). They found
that the rate of grafting using this system without xanthation was much slower than in
31
case when cellulose had been subjected to xanthation prior to grafting and even higher
conversion was achieved when the temperature was increased to 85ºC.
Cell
OH
O C SH
S Cell
OH
O C S
S
Cell
OH
O C S
S + HOOH Cell
OH
O C S
S + HO HO
Cell
OH
O C S
S Cell
OH
O
+ CS2
Cell
OH
O
+ M Cell
OH
O M
NaOH
H2SO4 Na+
Figure 3.1 Reaction mechanism suggested by Dimov and Pavlov24 for the xanthate promoted grafting.
Using hydrogen peroxide may be suitable for the high molecular weight cellulose,
but it degrades guar gum via unzipping of the backbone. A trial using the xanthated guar
gum-hydrogen peroxide redox system resulted in the degradation of the guar gum to a
molecular weight lower than 5000.
3.2 Reversible Addition-Fragmentation Chain Transfer (RAFT)
Controlled radical polymerization in the presence of RAFT agents offers
exceptional versatility in providing polymers of predetermined Mw and very narrow
polydispersity.28 What distinguishes RAFT polymerization from all other methods is that
it can be used with wide range of monomers including functional monomers containing
acids, acid salts, hydroxy or tertiary amino groups. A variety of reaction conditions
provide controlled molecular weight polymers with very narrow polydispersity(<1.2).29
32
The RAFT process involves free radical polymerization in the presence of
selected dithio compounds (e.g. dithiobenzoates) which act as highly efficient reversible
addition-fragmentation chain transfer agents and provide the polymerization with living
characteristics.28 Polymerization can be carried out in bulk, solution, emulsion, or
suspension. Common free radical initiators (azo or peroxy) are employed. There appears
to be no particular limitations on solvent or reaction temperature. The living character of
the RAFT process is supported by the resultant narrow polydispersity polymers, linear
molecular weight vs. conversion profile, the predictability of the molecular weight from
the ratio of monomer consumed to transfer agent, and the ability to produce blocks or
higher molecular weight polymers by further monomer addition.29
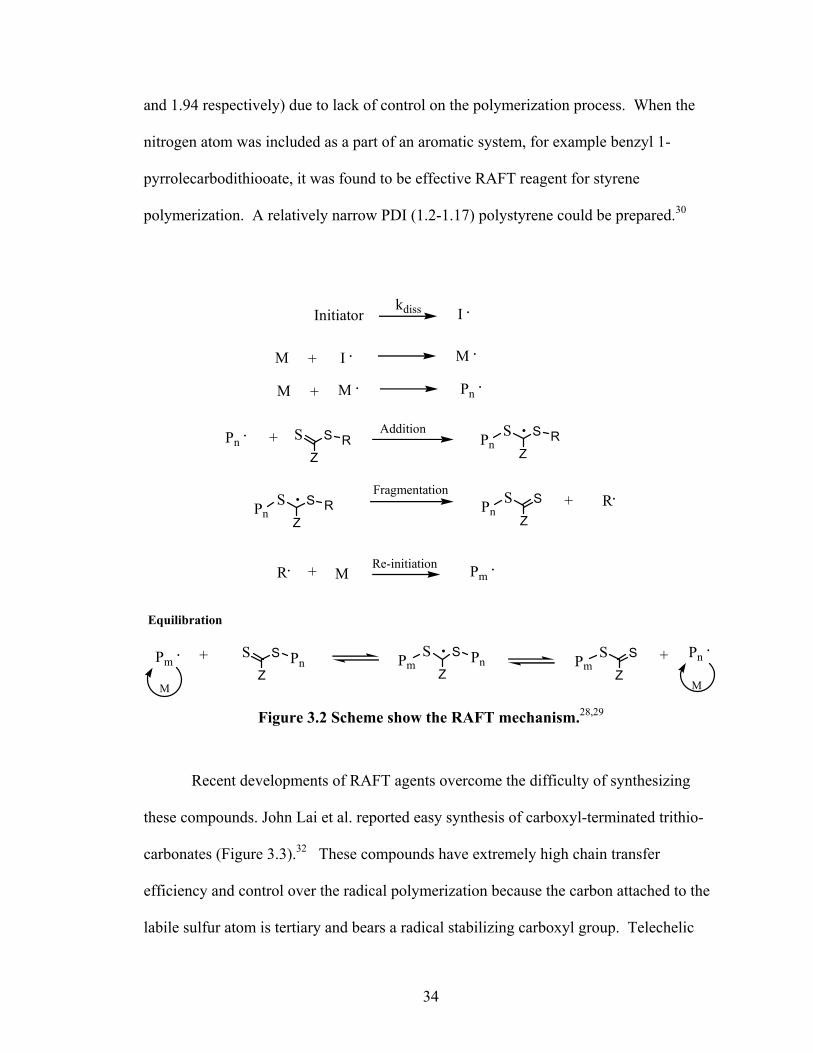
The sequence of events for the polymerization of a selected monomer in the
presence of dithioesters can be summarized as it is shown in Figure 3.2. The early stage
of this process resembles the normal radical polymerization. The first step is the
formation of the radical by the decomposition of the initiator followed by reaction of the
radicals with the monomer forming the propagating radical Pn·. The reagent [S=C(Z)S-R]
is rapidly transformed into a polymeric thiocarbonylthio compound [S=C(Z)S- Pn] by
reacting with a propagating radical (Pn·) by an addition process and releasing another
(R·) by a fragmentation process. The radical librated (R·) reacts with a monomer to form a
new propagation radical (Pm·). Chain extension of the polymeric thiocarbonylthio
compound [S=C(Z)S-Pn] occurs by the same process. The reversible addition-
fragmentation sequence in which the S=C(Z)S- moiety is transferred between dormant
and active chains maintains the living behavior of the polymerization. Because the
33
majority of the chains in the product polymer possess the S=C(Z)S-group, polymerization
can be continued in the presence of a second monomer to give a block copolymer.28
The effectiveness of the RAFT reagent in providing the living character is attributed to
the very high transfer constants, which ensure a rapid rate of exchange between the
dormant and the living chains.29 The requirements for a thiocarbonylthio compound to
be effective RAFT reagent include that both rates of addition and fragmentation must be
fast relative to the rate of propagation and the expelled radical (R·) must be capable of
reinitiating polymerization. The first requirement ensures the rapid consumption of the
initial RAFT agent and fast equilibration of the dormant species while the second ensures
the continuity of the chain process.30 Rate of addition during the process is strongly
influenced by the substituent Z. Radical stabilizing groups such as phenyl will enhance
the rate of addition. On the other hand, when Z is an oxygen or nitrogen substituent, the
reagents are practically inert in the polymerization in case of acrylates, methacrylates and
styrene monomers. This has been attributed to a lowering of the double bond character of
the C=S bond by conjugation with the lone pair of electrons on the heteroatom
substituent. This effect is eliminated when the nitrogen lone pair is part of an aromatic
system. The fragmentation rate will be faster on the desired direction if the (R·) group is
selected to be better homolytic leaving group than the propagating radicals (Pn·). The
homolytic leaving ability of a group increases with increasing radical stability and steric
bulk but this should be balanced with the requirement for efficient reinitiation by the (R·).
Depending on the type of the monomer the selection of Z and R groups is crucial.31 For
example, dithio carbonates compounds are not effective RAFT reagents in case of styrene
and methylmethacrylate (MMA). The resulted polymer was broadly dispersed (PDI 1.86
34
and 1.94 respectively) due to lack of control on the polymerization process. When the
nitrogen atom was included as a part of an aromatic system, for example benzyl 1-
pyrrolecarbodithiooate, it was found to be effective RAFT reagent for styrene
polymerization. A relatively narrow PDI (1.2-1.17) polystyrene could be prepared.30
Initiatorkdiss I .
M + I . M .
M + Pn .M .
Pn . + SZ
S RAddition S
Z
S RPn.
SZ
S RPn. S
Z
SPn+ R.Fragmentation
R. + Pm .MRe-initiation
Pm . SZ
S PnS
Z
SPm++ S
Z
S PnPm. Pn .
MM
Equilibration
Figure 3.2 Scheme show the RAFT mechanism.28,29
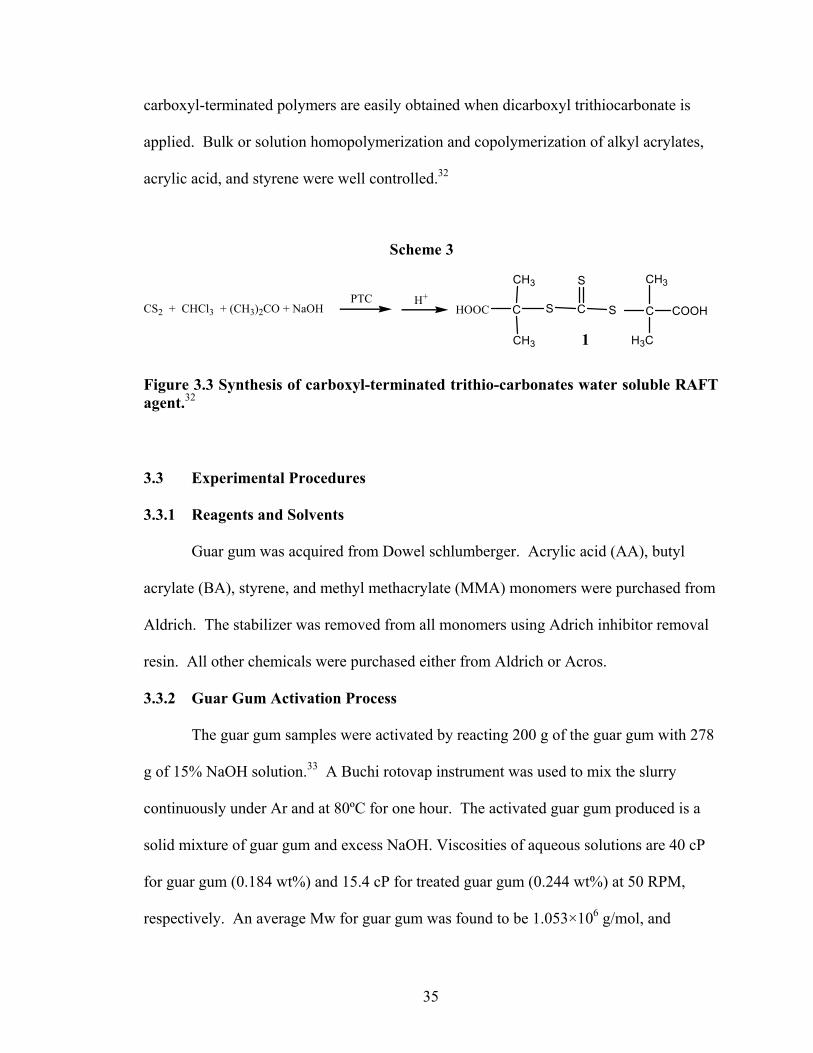
Recent developments of RAFT agents overcome the difficulty of synthesizing
these compounds. John Lai et al. reported easy synthesis of carboxyl-terminated trithio-
carbonates (Figure 3.3).32 These compounds have extremely high chain transfer
efficiency and control over the radical polymerization because the carbon attached to the
labile sulfur atom is tertiary and bears a radical stabilizing carboxyl group. Telechelic
35
carboxyl-terminated polymers are easily obtained when dicarboxyl trithiocarbonate is
applied. Bulk or solution homopolymerization and copolymerization of alkyl acrylates,
acrylic acid, and styrene were well controlled.32
CS2 + CHCl3 + (CH3)2CO + NaOHPTC H+
HOOC C
CH3
CH3
S C S
S
C COOH
CH3
H3C1
Scheme 3
Figure 3.3 Synthesis of carboxyl-terminated trithio-carbonates water soluble RAFT agent.32
3.3 Experimental Procedures
3.3.1 Reagents and Solvents
Guar gum was acquired from Dowel schlumberger. Acrylic acid (AA), butyl
acrylate (BA), styrene, and methyl methacrylate (MMA) monomers were purchased from
Aldrich. The stabilizer was removed from all monomers using Adrich inhibitor removal
resin. All other chemicals were purchased either from Aldrich or Acros.
3.3.2 Guar Gum Activation Process
The guar gum samples were activated by reacting 200 g of the guar gum with 278
g of 15% NaOH solution.33 A Buchi rotovap instrument was used to mix the slurry
continuously under Ar and at 80ºC for one hour. The activated guar gum produced is a
solid mixture of guar gum and excess NaOH. Viscosities of aqueous solutions are 40 cP
for guar gum (0.184 wt%) and 15.4 cP for treated guar gum (0.244 wt%) at 50 RPM,
respectively. An average Mw for guar gum was found to be 1.053×10⁶ g/mol, and
36
8.1×10⁴ for treated guar gum. The average R.M.S. radius, Rw, for the particles revealed
by GPC/MALS was found to be 56.87 nm for guar gum and 15.67 nm after treatment.
3.3.3 Guar Gum Xanthate Graft Copolymerization
The synthesis of grafted guar gum utilizing xanthates was done according to
slightly modified method reported by Graczyk and Hornof27. To approximately 6-7g of
activated guar gum, 10 ml of CS2 was added portionwise over 1.5 hours with mixing at
room temperature. Then it was left under CS2 in closed vial for overnight in refrigerator.
The xanthated guar gum was filtered, dried and found to posses a yellow to orange color.
The viscocity of a 0.252 wt% solution was 10.20 cP, the Mw was 1.51×10⁵ g/mol, and
the average Rw for the particles was found to be 21.13 nm.
The xanthated guar was then washed with slightly acidic DI water (pH= 4.5). The
washed product was dipped into a 0.004% solution of ferrous ammonium sulfate for 2
minutes, filtered and washed again with neutral DI water (pH= 6.5). The washed
xanthated guar was immediately transferred into 500ml reactor equipped with condenser.
The reactor had been previously filled with 300ml DI water, approximately 8-9g of
monomer, 0.08 g of SDS and stirred for 30 min. Following the presoaking/dissolving
step (90 min), the temperature was raised to 85ºC, and 3 g (0.044mol/L) of ammonium
persulfate was added to initiate the copolymerization. The reaction was kept under Ar
atmosphere for two hours then terminated by the addition of hydroquinone. The products
were precipitated in methanol, ethanol or isopropyl alcohol or in an appropriate solvent,
filtered and dried under vacuum. The filtrate was dialyzed and freeze dried. Butyl
acrylate (BA) and styrene were grafted to guar using this technique.
37
In case of a guar gum/styrene trial the product was collected by evaporation of
solvent. A 2.0g aliquot of the product was Soxhelt extracted using cyclohexane. Three
products were collected. The residue (0.24 g) left behind in the thimble IR (KBr/Drift)
3193(wide), 3026, 2927, 1734, 1602, 1493, 1402, 1146, 1034, 872, 814 cm-1. A solid
(0.37 g) precipitated after the cyclohexane cooled down; IR (KBr/Drift) 3327(wide),
3082, 3060, 3026, 2925, 2850, 1943, 1870, 1802, 1737, 1668, 1602, 1493, 1452, 1373,
1182, 1154, 1068, 1029, 907, 758 cm-1. The last fraction (0.84 g) was collected when the
cyclohexane left to evaporate; IR (KBr/Drift) 3589(narrow), 3082, 3060, 3026, 2925,
2850, 1943, 1871, 1803, 1741, 1670, 1602, 1493, 1452, 1402, 1372, 1182, 1154, 1069,
1029, 981, 907, 842 cm-1.
3.3.4 Synthesis of RAFT Agent
The synthesis of RAFT agent S,S-Bis(α,α’-dimethyl-α”-acetic acid)-
trithiocarbonate (1) was conducted according to reference 32. Brown product (7.8g,
37.8%) was collected; mp 170-180 °C (DSC) 1H NMR (DMSO-d6) δ 1.58 (s,12H), 3.5
(s).
3.3.5 Graft Polymerization of Acrylic Acid onto Guar Gum via RAFT Process
Guar gum (1.17 g) and RAFT agent (0.17 g) were soaked with acrylic acid (AA)
monomer (10.01 g) for 15 min after which 400ml DI water solution (modified pH to >9)
was added followed by dextrose monohydrate. After raising the temperature to 50 ˚C,
ceric ammonium sulfate was added to start the initiation process. An argon atmosphere
was maintained throughout the entire reaction. The reaction was contiued for 7h before
terminating by addition of about 10 ml of 10% aqueous solution of hydroquinone. The
product was precipitated in methanol, filtered and dried under reduced pressure. The
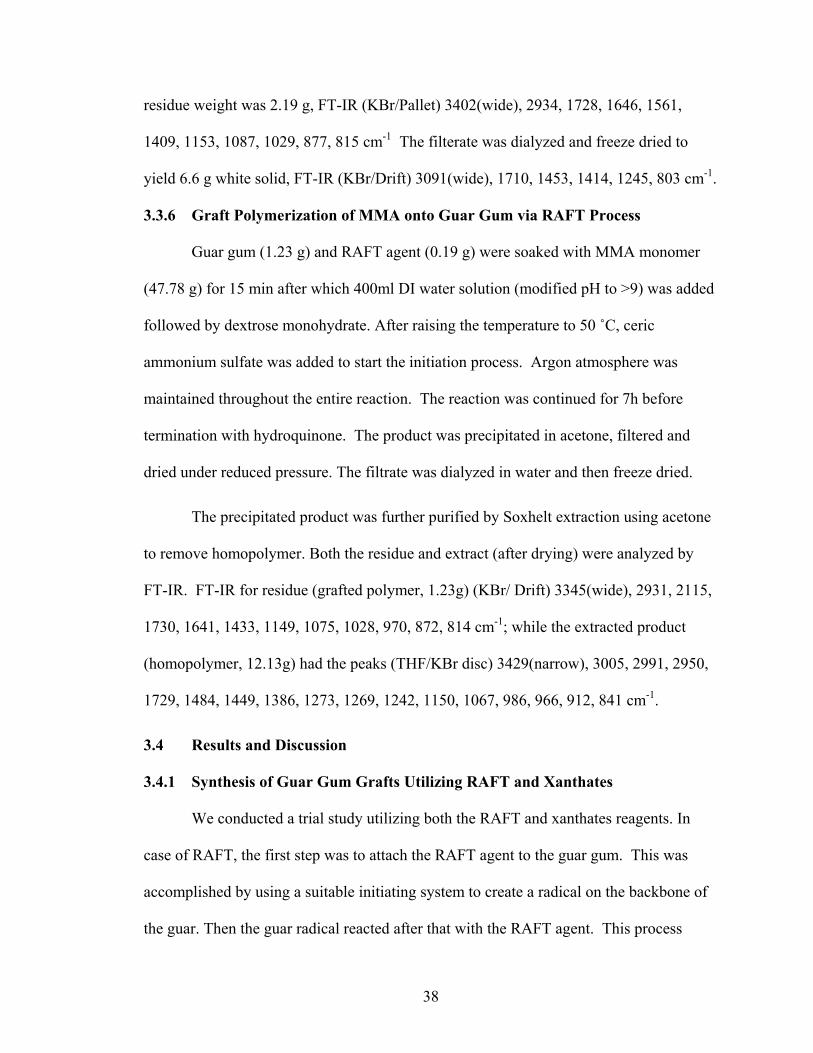
38
residue weight was 2.19 g, FT-IR (KBr/Pallet) 3402(wide), 2934, 1728, 1646, 1561,
1409, 1153, 1087, 1029, 877, 815 cm-1 The filterate was dialyzed and freeze dried to
yield 6.6 g white solid, FT-IR (KBr/Drift) 3091(wide), 1710, 1453, 1414, 1245, 803 cm-1.
3.3.6 Graft Polymerization of MMA onto Guar Gum via RAFT Process
Guar gum (1.23 g) and RAFT agent (0.19 g) were soaked with MMA monomer
(47.78 g) for 15 min after which 400ml DI water solution (modified pH to >9) was added
followed by dextrose monohydrate. After raising the temperature to 50 ˚C, ceric
ammonium sulfate was added to start the initiation process. Argon atmosphere was
maintained throughout the entire reaction. The reaction was continued for 7h before
termination with hydroquinone. The product was precipitated in acetone, filtered and
dried under reduced pressure. The filtrate was dialyzed in water and then freeze dried.
The precipitated product was further purified by Soxhelt extraction using acetone
to remove homopolymer. Both the residue and extract (after drying) were analyzed by
FT-IR. FT-IR for residue (grafted polymer, 1.23g) (KBr/ Drift) 3345(wide), 2931, 2115,
1730, 1641, 1433, 1149, 1075, 1028, 970, 872, 814 cm-1; while the extracted product
(homopolymer, 12.13g) had the peaks (THF/KBr disc) 3429(narrow), 3005, 2991, 2950,
1729, 1484, 1449, 1386, 1273, 1269, 1242, 1150, 1067, 986, 966, 912, 841 cm-1.
3.4 Results and Discussion
3.4.1 Synthesis of Guar Gum Grafts Utilizing RAFT and Xanthates
We conducted a trial study utilizing both the RAFT and xanthates reagents. In
case of RAFT, the first step was to attach the RAFT agent to the guar gum. This was
accomplished by using a suitable initiating system to create a radical on the backbone of
the guar. Then the guar radical reacted after that with the RAFT agent. This process
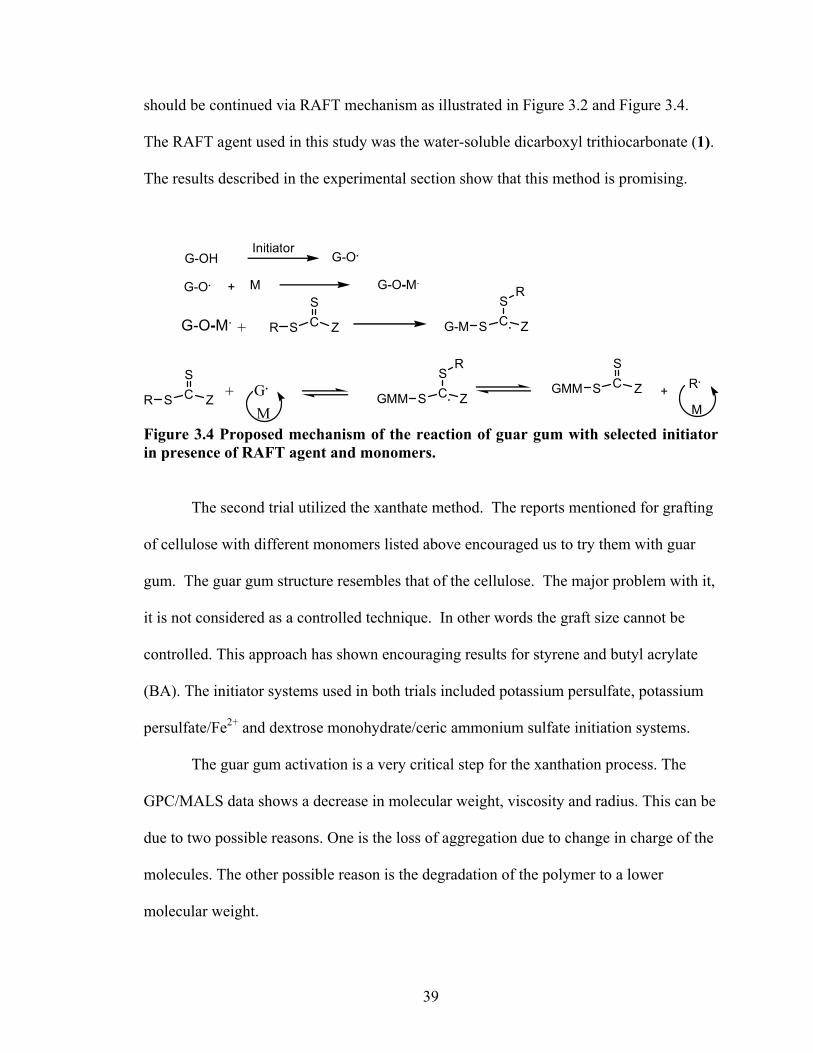
39
should be continued via RAFT mechanism as illustrated in Figure 3.2 and Figure 3.4.
The RAFT agent used in this study was the water-soluble dicarboxyl trithiocarbonate (1).
The results described in the experimental section show that this method is promising.
G-O-M. +
MS C
S
ZGMM
S CS
ZR
Initiator
S C.
S
ZG-M
S CS
ZR
R
S C.
S
ZGMM
R
+ R.+G.
M
G-OH G-O.
G-O. + M G-O-M.
Figure 3.4 Proposed mechanism of the reaction of guar gum with selected initiator in presence of RAFT agent and monomers.
The second trial utilized the xanthate method. The reports mentioned for grafting
of cellulose with different monomers listed above encouraged us to try them with guar
gum. The guar gum structure resembles that of the cellulose. The major problem with it,
it is not considered as a controlled technique. In other words the graft size cannot be
controlled. This approach has shown encouraging results for styrene and butyl acrylate
(BA). The initiator systems used in both trials included potassium persulfate, potassium
persulfate/Fe2+ and dextrose monohydrate/ceric ammonium sulfate initiation systems.
The guar gum activation is a very critical step for the xanthation process. The
GPC/MALS data shows a decrease in molecular weight, viscosity and radius. This can be
due to two possible reasons. One is the loss of aggregation due to change in charge of the
molecules. The other possible reason is the degradation of the polymer to a lower
molecular weight.
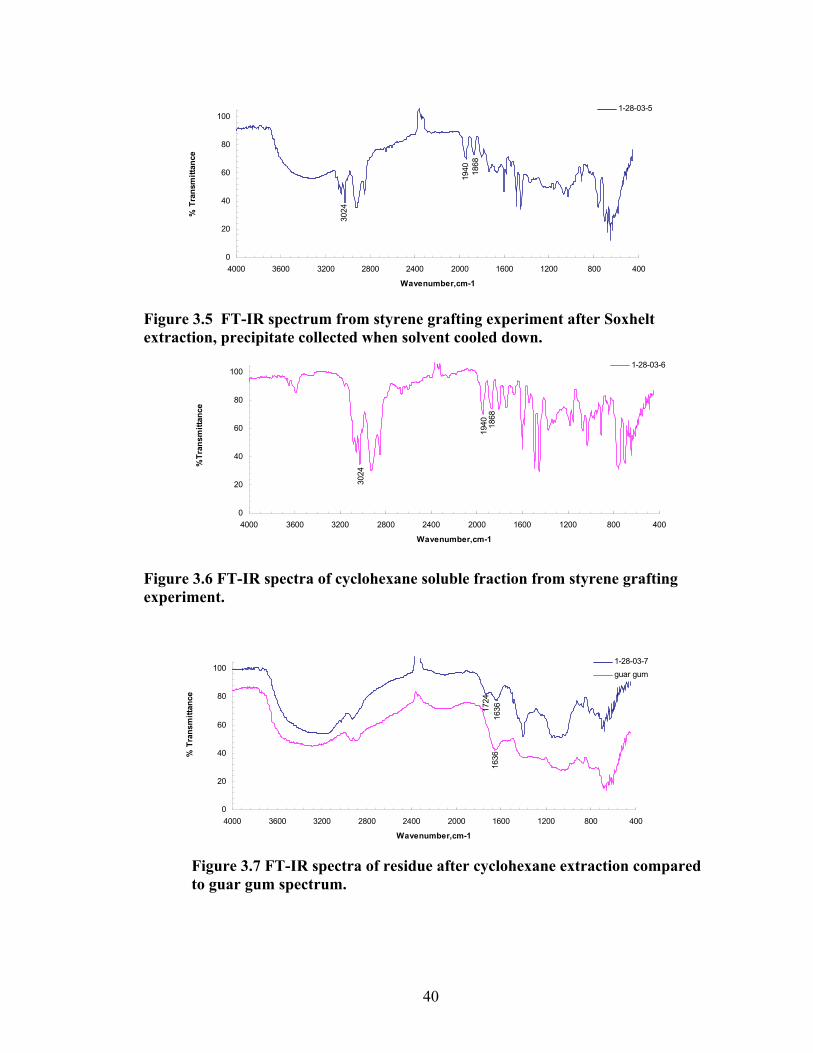
40
1868
3024
1940
0
20
40
60
80
100
40080012001600200024002800320036004000
Wavenumber,cm-1
% T
rans
mitt
ance
1-28-03-5
Figure 3.5 FT-IR spectrum from styrene grafting experiment after Soxhelt extraction, precipitate collected when solvent cooled down.
1868
3024
1940
0
20
40
60
80
100
40080012001600200024002800320036004000
Wavenumber,cm-1
%Tr
ansm
ittan
ce
1-28-03-6
Figure 3.6 FT-IR spectra of cyclohexane soluble fraction from styrene grafting experiment.
163617
2416
36
0
20
40
60
80
100
40080012001600200024002800320036004000
Wavenumber,cm-1
% T
rans
mitt
ance
1-28-03-7guar gum
Figure 3.7 FT-IR spectra of residue after cyclohexane extraction compared to guar gum spectrum.
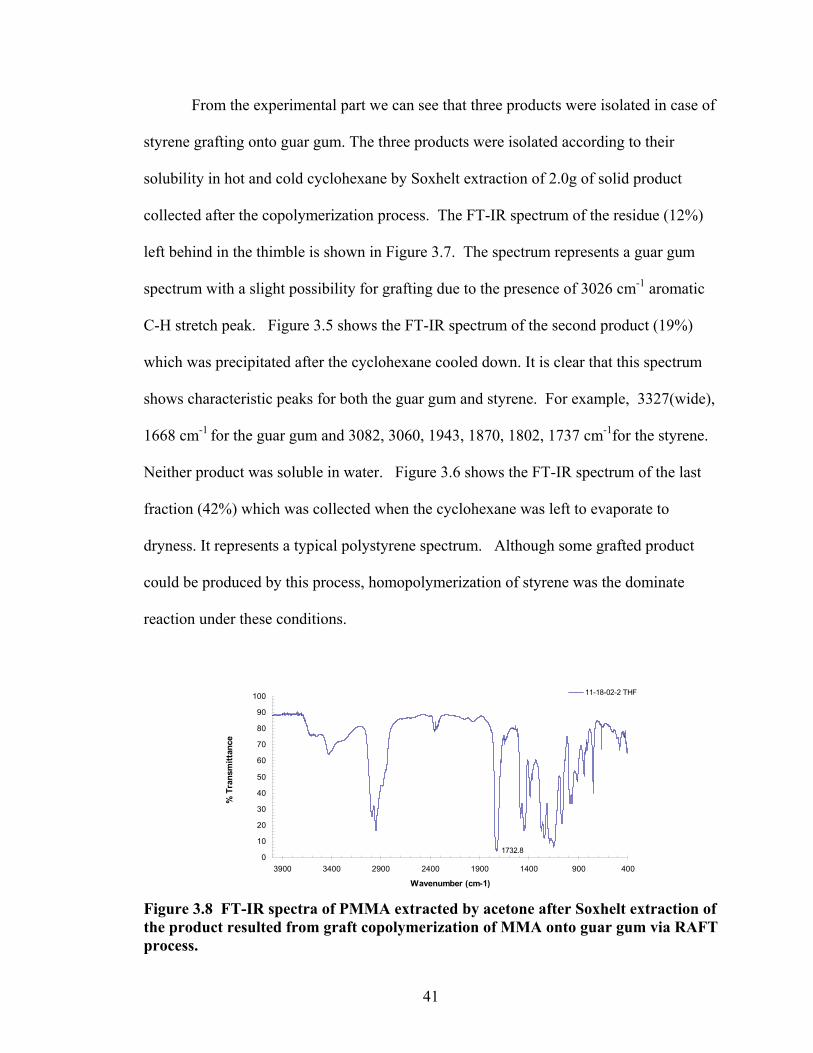
41
From the experimental part we can see that three products were isolated in case of
styrene grafting onto guar gum. The three products were isolated according to their
solubility in hot and cold cyclohexane by Soxhelt extraction of 2.0g of solid product
collected after the copolymerization process. The FT-IR spectrum of the residue (12%)
left behind in the thimble is shown in Figure 3.7. The spectrum represents a guar gum
spectrum with a slight possibility for grafting due to the presence of 3026 cm-1 aromatic
C-H stretch peak. Figure 3.5 shows the FT-IR spectrum of the second product (19%)
which was precipitated after the cyclohexane cooled down. It is clear that this spectrum
shows characteristic peaks for both the guar gum and styrene. For example, 3327(wide),
1668 cm-1 for the guar gum and 3082, 3060, 1943, 1870, 1802, 1737 cm-1for the styrene.
Neither product was soluble in water. Figure 3.6 shows the FT-IR spectrum of the last
fraction (42%) which was collected when the cyclohexane was left to evaporate to
dryness. It represents a typical polystyrene spectrum. Although some grafted product
could be produced by this process, homopolymerization of styrene was the dominate
reaction under these conditions.
1732.80
10
20
30
40
50
60
70
80
90
100
400900140019002400290034003900
Wavenumber (cm-1)
% T
rans
mitt
ance
11-18-02-2 THF
Figure 3.8 FT-IR spectra of PMMA extracted by acetone after Soxhelt extraction of the product resulted from graft copolymerization of MMA onto guar gum via RAFT process.
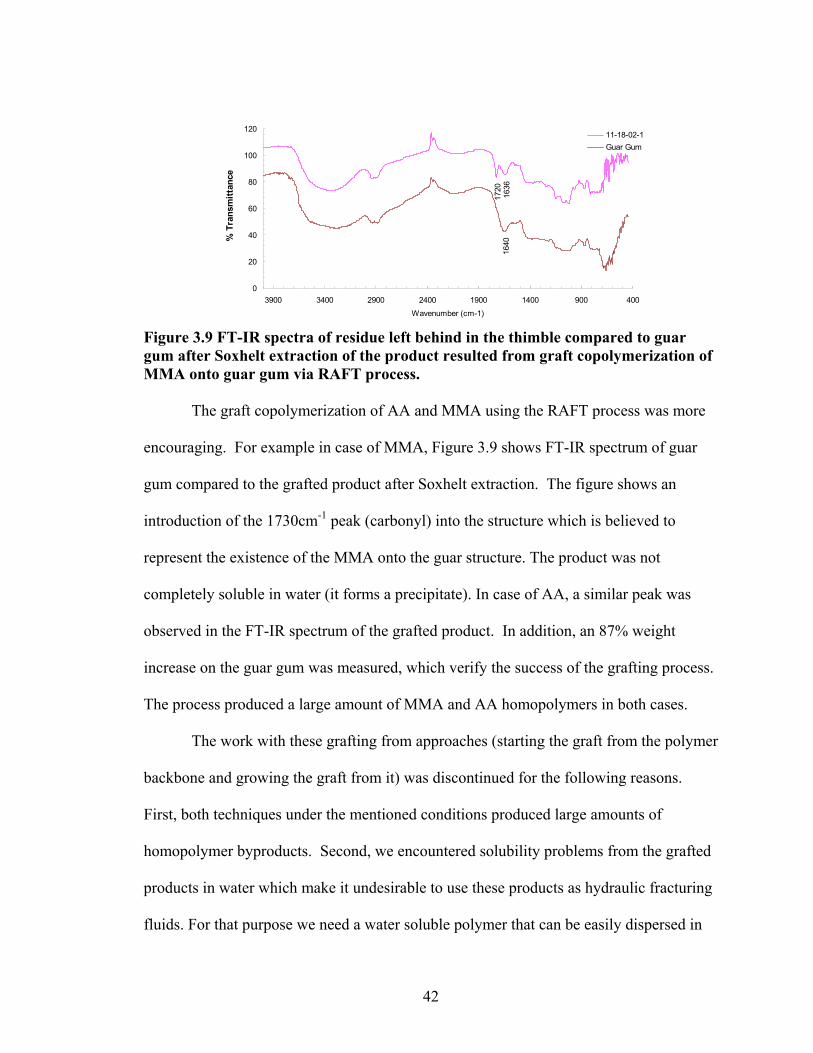
42
1636
1720
1640
0
20
40
60
80
100
120
400900140019002400290034003900
Wavenumber (cm-1)
% T
rans
mitt
ance
11-18-02-1Guar Gum
Figure 3.9 FT-IR spectra of residue left behind in the thimble compared to guar gum after Soxhelt extraction of the product resulted from graft copolymerization of MMA onto guar gum via RAFT process.
The graft copolymerization of AA and MMA using the RAFT process was more
encouraging. For example in case of MMA, Figure 3.9 shows FT-IR spectrum of guar
gum compared to the grafted product after Soxhelt extraction. The figure shows an
introduction of the 1730cm-1 peak (carbonyl) into the structure which is believed to
represent the existence of the MMA onto the guar structure. The product was not
completely soluble in water (it forms a precipitate). In case of AA, a similar peak was
observed in the FT-IR spectrum of the grafted product. In addition, an 87% weight
increase on the guar gum was measured, which verify the success of the grafting process.
The process produced a large amount of MMA and AA homopolymers in both cases.
The work with these grafting from approaches (starting the graft from the polymer
backbone and growing the graft from it) was discontinued for the following reasons.
First, both techniques under the mentioned conditions produced large amounts of
homopolymer byproducts. Second, we encountered solubility problems from the grafted
products in water which make it undesirable to use these products as hydraulic fracturing
fluids. For that purpose we need a water soluble polymer that can be easily dispersed in
43
water for the crosslinking step. The third reason is related to the xanthate approach
which produced an uncontrolled graft length from the guar gum. There were no chain
transfer reagents used in the method to control the graft length. In addition, we had
difficulty in extracting and precipitating the products due to the presence of SDS reagent
which resulted in a stable emulsion when extraction or precipitation of the product by
organic solvents was attempted. Finally, on case of RAFT trial we faced limitation in the
amount of guar gum that can be used during grafting process due to viscosity problems of
guar gum in water (1% guar solution have high viscosity). A grafting to technique is
introduced to achieve our goal in the following chapter. This technique will overcome
many of the disadvantages encountered with the above approaches.
44
CHAPTER 4 SYNTHESIS AND CHARACTERIZATION OF THE POLYOXYALKYLENEAMINES-GUAR GUM DERIVATIVES
4.1 Introduction
In the previous chapter we produced grafts utilizing free radical polymerization
with controlled and non controlled methods to achieve our goal. We concluded that
controlled grafting of the guar gum utilizing free radical intermediates was troublesome
and produced materials with limited solubility in water which defeats our purpose. In
addition, large quantities of homopolymers were produced. In order to achieve a precise
and controllable grafting a “grafting to” technique is used. This technique was developed
in our lab to modify carboxymethyl cellulose (CMC).34 Conversion of CMC to the
corresponding ester intermediate affords a derivative which was reacted with diamines to
produce water soluble aminoamide derivatives of CMC. The work in this chapter
describes the extension of this technique to an interesting family of amide derivatives
based upon amine terminated poly(ethyleneoxide-co-propyleneoxide) oligomers (PEO-
PPO-NH2) and other similar structures. Since the molecular weights and molecular
weight distributions of the oligomers are well defined, this approach presents
opportunities to introduce grafts of controlled lengths, compositions and properties to a
common carboxymethylated guar substrate. Variation of the oligomer molecular weights
and composition as well as adjusting the degree of guar carboxymethylation allowed us
to produce a series of guar derivatives with a range of features, viscosities and potential
applications. A scheme outlining this approach is shown in Figure 4.1.
45
4.2 Experimental Procedures
4.2.1 Reagents and Solvents
The guar gum used in this study was provided by Dowell Schlumberger, sodium
forms of carboxymethylhydroxypropyl (NaCMHPG) and carboxymethyl guar (CMG)
samples (BM12CMHPG, BM13CMHPG, BMCMGGW45) were provided by
Benchmark, polyoxyalkyleneamines (Jeffamines and Surfonamines) were supplied by
Texaco and Huntsman, repectively.
4.2.2 Preparation of Methyl Carboxymethyl Guar (MCMG)
Four CMG samples (0.51 g) were slurried in 1ml of dimethyl sulfate each. The
samples were allowed to react under nitrogen for 2, 4, 6, and 8 hours at 60°C. Each
sample was filtered, washed with large amount of methanol, and dried under vacuum.
The samples were analyzed by FT-IR to select the optimum reactivity time as shown in
Figure 4.2. A reaction period of 8h was found to be enough for a quantitative conversion
of the CMG to the ester form.
NaCMG or NaCMHPG (20.0-40.0 g) was slurried in 35-50 mL of dimethyl
sulfate (DMS). The slurry was continuously stirred for 4-8 hours at 60°C and under
nitrogen. The mixture was filtered, washed and soaked with 450mL of methanol, then
was washed and soaked with 450mL of acetone, and then was dried in the oven at 60°C
for overnight. The MCMG was used without further purification in subsequent synthesis.
The product is insoluble in DI H2O. This synthesis could be scaled up by reacting a ratio
of one gram of NaCMG to a 1.5-2 ml of DMS. HATR FT-IR (cm-1), solid: MCMG,
3393 (w, O-H), 2913 (w, C-H), 1732 (s, ester carbonyl), 1026 (vs, C-O)(Figure 4.3).
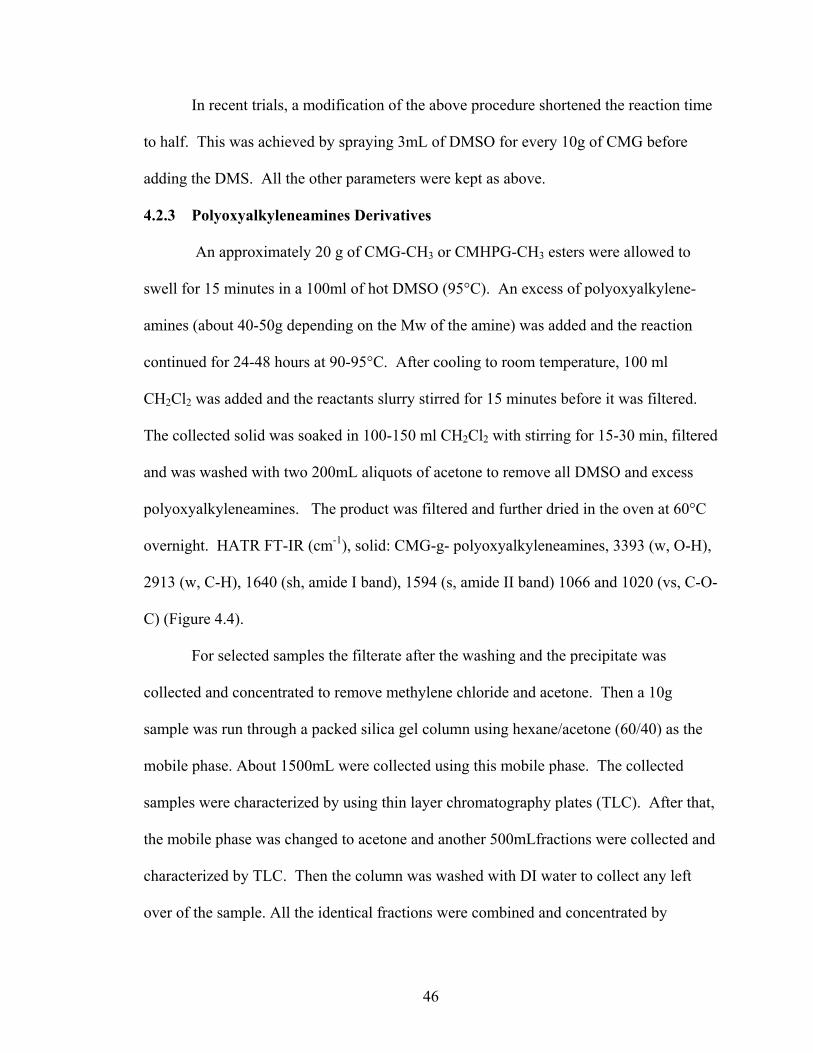
46
In recent trials, a modification of the above procedure shortened the reaction time
to half. This was achieved by spraying 3mL of DMSO for every 10g of CMG before
adding the DMS. All the other parameters were kept as above.
4.2.3 Polyoxyalkyleneamines Derivatives
An approximately 20 g of CMG-CH3 or CMHPG-CH3 esters were allowed to
swell for 15 minutes in a 100ml of hot DMSO (95°C). An excess of polyoxyalkylene-
amines (about 40-50g depending on the Mw of the amine) was added and the reaction
continued for 24-48 hours at 90-95°C. After cooling to room temperature, 100 ml
CH2Cl2 was added and the reactants slurry stirred for 15 minutes before it was filtered.
The collected solid was soaked in 100-150 ml CH2Cl2 with stirring for 15-30 min, filtered
and was washed with two 200mL aliquots of acetone to remove all DMSO and excess
polyoxyalkyleneamines. The product was filtered and further dried in the oven at 60°C
overnight. HATR FT-IR (cm-1), solid: CMG-g- polyoxyalkyleneamines, 3393 (w, O-H),
2913 (w, C-H), 1640 (sh, amide I band), 1594 (s, amide II band) 1066 and 1020 (vs, C-O-
C) (Figure 4.4).
For selected samples the filterate after the washing and the precipitate was
collected and concentrated to remove methylene chloride and acetone. Then a 10g
sample was run through a packed silica gel column using hexane/acetone (60/40) as the
mobile phase. About 1500mL were collected using this mobile phase. The collected
samples were characterized by using thin layer chromatography plates (TLC). After that,
the mobile phase was changed to acetone and another 500mLfractions were collected and
characterized by TLC. Then the column was washed with DI water to collect any left
over of the sample. All the identical fractions were combined and concentrated by
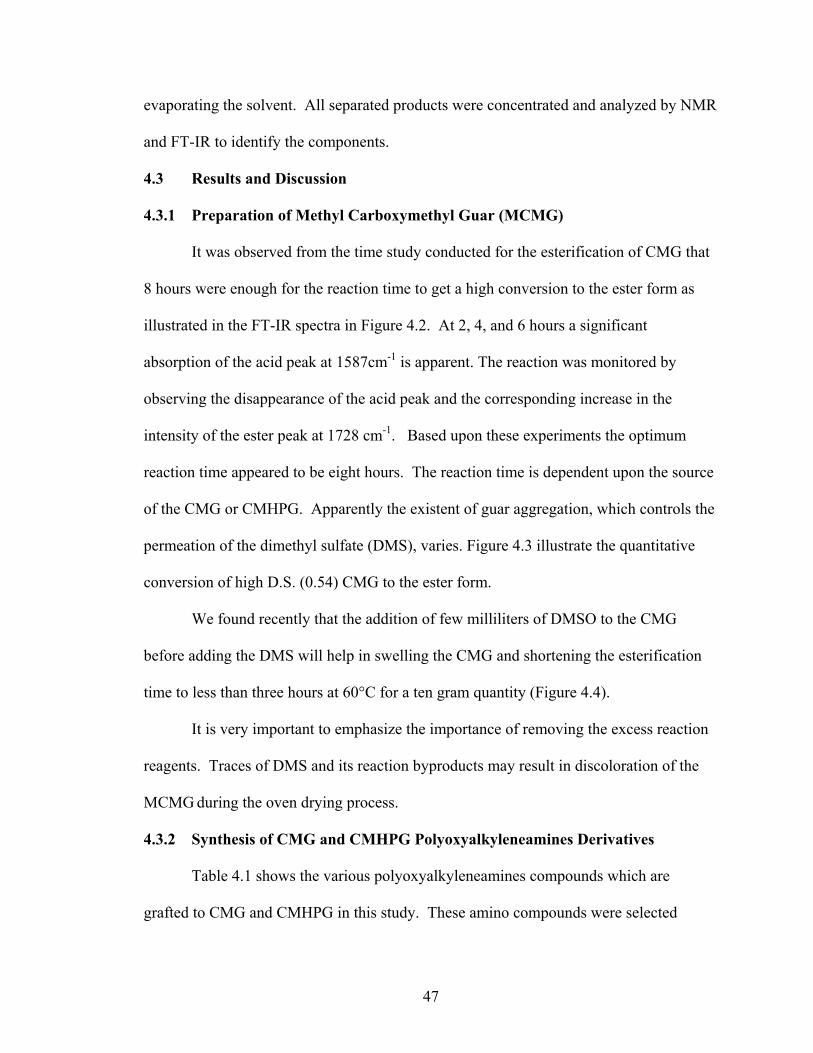
47
evaporating the solvent. All separated products were concentrated and analyzed by NMR
and FT-IR to identify the components.
4.3 Results and Discussion
4.3.1 Preparation of Methyl Carboxymethyl Guar (MCMG)
It was observed from the time study conducted for the esterification of CMG that
8 hours were enough for the reaction time to get a high conversion to the ester form as
illustrated in the FT-IR spectra in Figure 4.2. At 2, 4, and 6 hours a significant
absorption of the acid peak at 1587cm-1 is apparent. The reaction was monitored by
observing the disappearance of the acid peak and the corresponding increase in the
intensity of the ester peak at 1728 cm-1. Based upon these experiments the optimum
reaction time appeared to be eight hours. The reaction time is dependent upon the source
of the CMG or CMHPG. Apparently the existent of guar aggregation, which controls the
permeation of the dimethyl sulfate (DMS), varies. Figure 4.3 illustrate the quantitative
conversion of high D.S. (0.54) CMG to the ester form.
We found recently that the addition of few milliliters of DMSO to the CMG
before adding the DMS will help in swelling the CMG and shortening the esterification
time to less than three hours at 60°C for a ten gram quantity (Figure 4.4).
It is very important to emphasize the importance of removing the excess reaction
reagents. Traces of DMS and its reaction byproducts may result in discoloration of the
MCMG during the oven drying process.
4.3.2 Synthesis of CMG and CMHPG Polyoxyalkyleneamines Derivatives
Table 4.1 shows the various polyoxyalkyleneamines compounds which are
grafted to CMG and CMHPG in this study. These amino compounds were selected
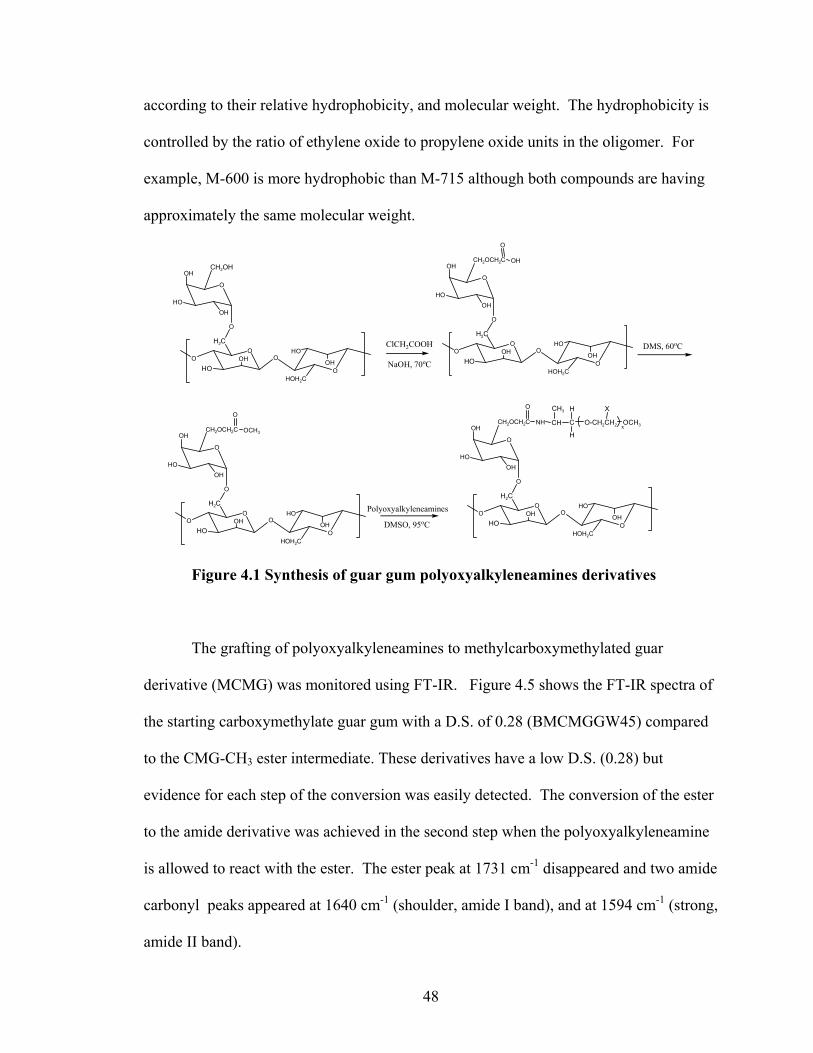
48
according to their relative hydrophobicity, and molecular weight. The hydrophobicity is
controlled by the ratio of ethylene oxide to propylene oxide units in the oligomer. For
example, M-600 is more hydrophobic than M-715 although both compounds are having
approximately the same molecular weight.
OO O
OHOH2C
OH
HOH2C
O
O
OH
CH2OHOH
HO
OHHO
OO O
OHOH2C
OH
HOH2C
O
O
OH
CH2OCH2COH
HO
OHHO
O
OH
ClCH2COOH
NaOH, 70oC
OO O
OHOH2C
OH
HOH2C
O
O
OH
CH2OCH2COH
HO
OHHO
O
OCH3
Polyoxyalkyleneamines
DMS, 60oC
OO O
OHOH2C
OH
HOH2C
O
O
OH
CH2OCH2COH
HO
OHHO
O
NH CH
CH3
C O-CH2CH2 OCH3x
DMSO, 95oC
X
H
H
Figure 4.1 Synthesis of guar gum polyoxyalkyleneamines derivatives
The grafting of polyoxyalkyleneamines to methylcarboxymethylated guar
derivative (MCMG) was monitored using FT-IR. Figure 4.5 shows the FT-IR spectra of
the starting carboxymethylate guar gum with a D.S. of 0.28 (BMCMGGW45) compared
to the CMG-CH3 ester intermediate. These derivatives have a low D.S. (0.28) but
evidence for each step of the conversion was easily detected. The conversion of the ester
to the amide derivative was achieved in the second step when the polyoxyalkyleneamine
is allowed to react with the ester. The ester peak at 1731 cm-1 disappeared and two amide
carbonyl peaks appeared at 1640 cm-1 (shoulder, amide I band), and at 1594 cm-1 (strong,
amide II band).
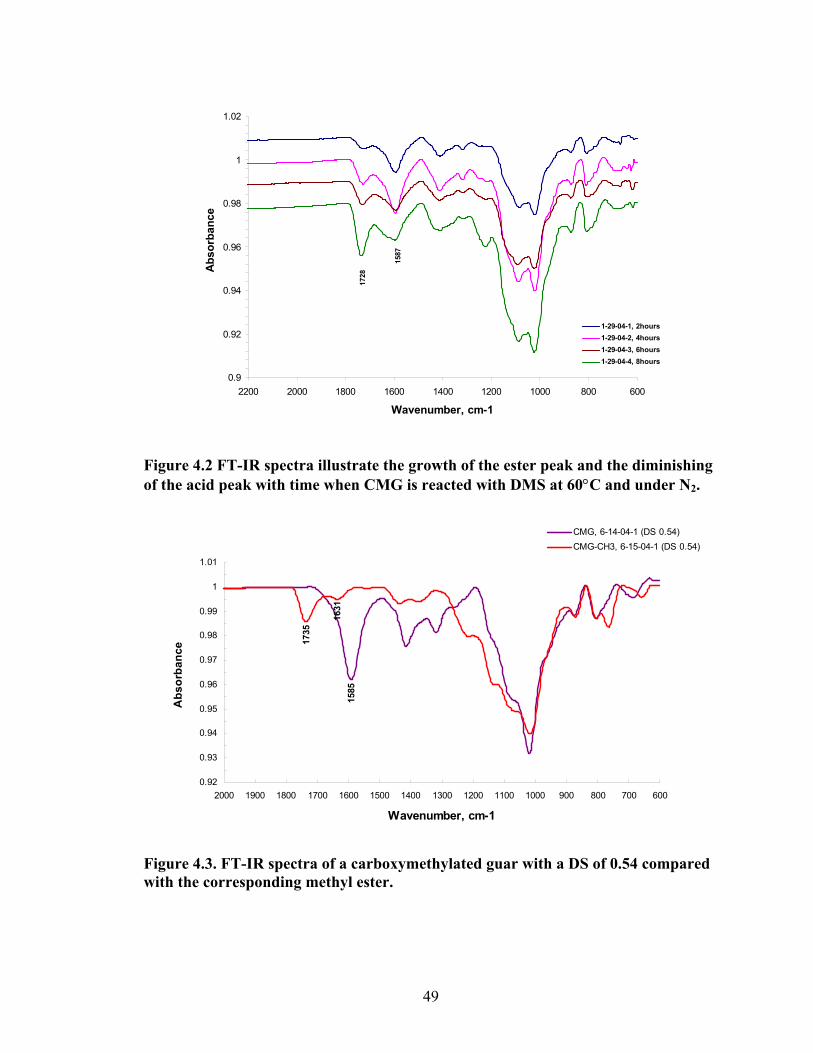
49
1587
1728
0.9
0.92
0.94
0.96
0.98
1
1.02
6008001000120014001600180020002200
Wavenumber, cm-1
Abs
orba
nce
1-29-04-1, 2hours1-29-04-2, 4hours1-29-04-3, 6hours1-29-04-4, 8hours
Figure 4.2 FT-IR spectra illustrate the growth of the ester peak and the diminishing of the acid peak with time when CMG is reacted with DMS at 60°C and under N2.
1585
1631
1735
0.92
0.93
0.94
0.95
0.96
0.97
0.98
0.99
1
1.01
60070080090010001100120013001400150016001700180019002000
Wavenumber, cm-1
Abs
orba
nce
CMG, 6-14-04-1 (DS 0.54)CMG-CH3, 6-15-04-1 (DS 0.54)
Figure 4.3. FT-IR spectra of a carboxymethylated guar with a DS of 0.54 compared with the corresponding methyl ester.
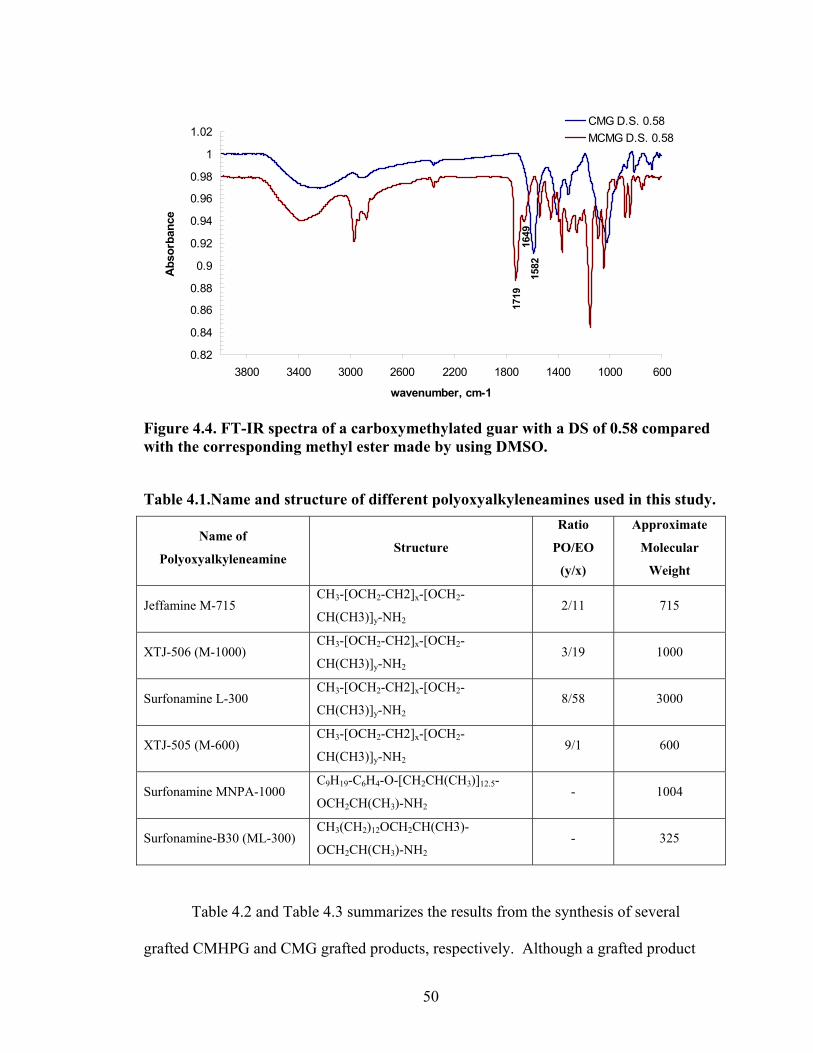
50
1582
1649
1719
0.82
0.84
0.86
0.88
0.9
0.92
0.94
0.96
0.98
1
1.02
60010001400180022002600300034003800
wavenumber, cm-1
Abs
orba
nce
CMG D.S. 0.58MCMG D.S. 0.58
Figure 4.4. FT-IR spectra of a carboxymethylated guar with a DS of 0.58 compared with the corresponding methyl ester made by using DMSO.
Table 4.1.Name and structure of different polyoxyalkyleneamines used in this study.
Name of
Polyoxyalkyleneamine Structure
Ratio
PO/EO
(y/x)
Approximate
Molecular
Weight
Jeffamine M-715 CH3-[OCH2-CH2]x-[OCH2-
CH(CH3)]y-NH2 2/11 715
XTJ-506 (M-1000) CH3-[OCH2-CH2]x-[OCH2-
CH(CH3)]y-NH2 3/19 1000
Surfonamine L-300 CH3-[OCH2-CH2]x-[OCH2-
CH(CH3)]y-NH2 8/58 3000
XTJ-505 (M-600) CH3-[OCH2-CH2]x-[OCH2-
CH(CH3)]y-NH2 9/1 600
Surfonamine MNPA-1000 C9H19-C6H4-O-[CH2CH(CH3)]12.5-
OCH2CH(CH3)-NH2 - 1004
Surfonamine-B30 (ML-300) CH3(CH2)12OCH2CH(CH3)-
OCH2CH(CH3)-NH2 - 325
Table 4.2 and Table 4.3 summarizes the results from the synthesis of several
grafted CMHPG and CMG grafted products, respectively. Although a grafted product
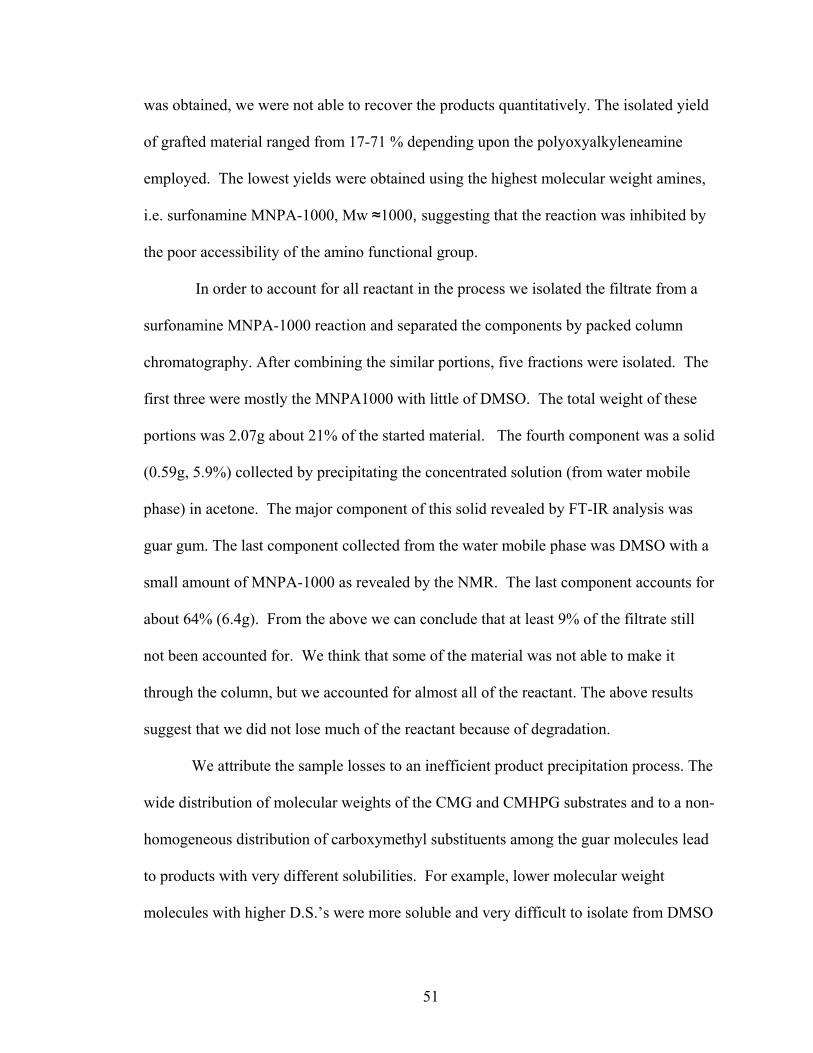
51
was obtained, we were not able to recover the products quantitatively. The isolated yield
of grafted material ranged from 17-71 % depending upon the polyoxyalkyleneamine
employed. The lowest yields were obtained using the highest molecular weight amines,
i.e. surfonamine MNPA-1000, Mw ≈1000, suggesting that the reaction was inhibited by
the poor accessibility of the amino functional group.
In order to account for all reactant in the process we isolated the filtrate from a
surfonamine MNPA-1000 reaction and separated the components by packed column
chromatography. After combining the similar portions, five fractions were isolated. The
first three were mostly the MNPA1000 with little of DMSO. The total weight of these
portions was 2.07g about 21% of the started material. The fourth component was a solid
(0.59g, 5.9%) collected by precipitating the concentrated solution (from water mobile
phase) in acetone. The major component of this solid revealed by FT-IR analysis was
guar gum. The last component collected from the water mobile phase was DMSO with a
small amount of MNPA-1000 as revealed by the NMR. The last component accounts for
about 64% (6.4g). From the above we can conclude that at least 9% of the filtrate still
not been accounted for. We think that some of the material was not able to make it
through the column, but we accounted for almost all of the reactant. The above results
suggest that we did not lose much of the reactant because of degradation.
We attribute the sample losses to an inefficient product precipitation process. The
wide distribution of molecular weights of the CMG and CMHPG substrates and to a non-
homogeneous distribution of carboxymethyl substituents among the guar molecules lead
to products with very different solubilities. For example, lower molecular weight
molecules with higher D.S.’s were more soluble and very difficult to isolate from DMSO
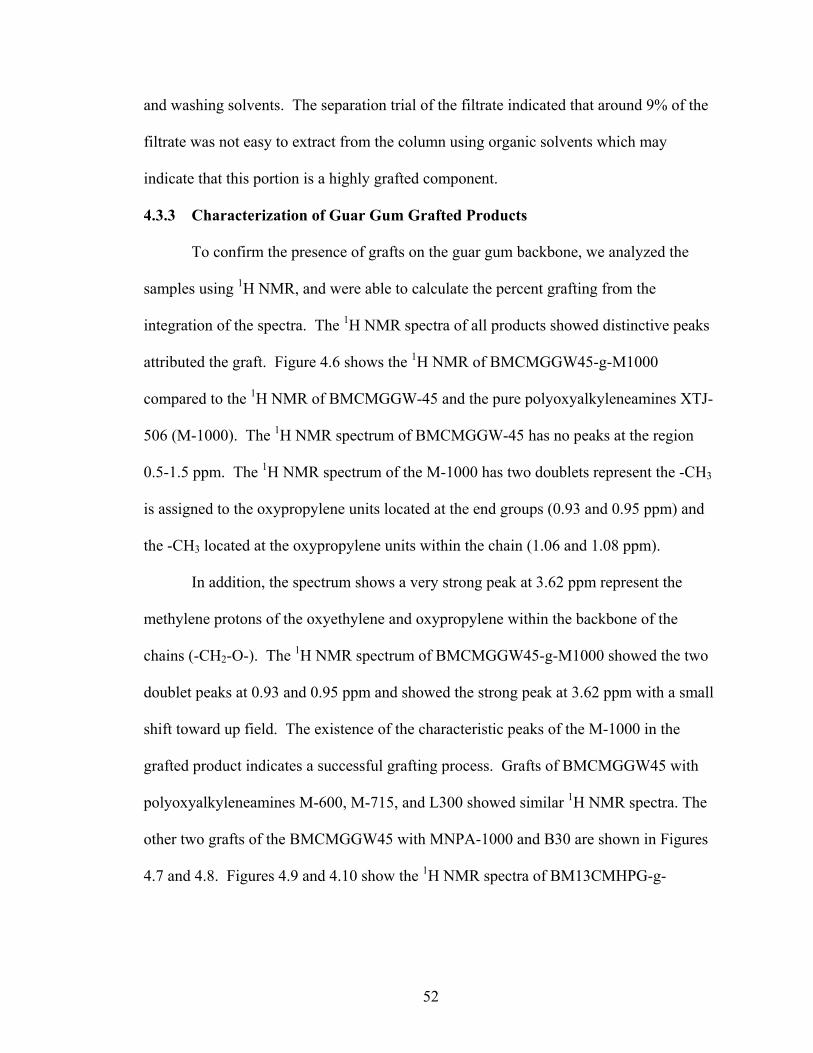
52
and washing solvents. The separation trial of the filtrate indicated that around 9% of the
filtrate was not easy to extract from the column using organic solvents which may
indicate that this portion is a highly grafted component.
4.3.3 Characterization of Guar Gum Grafted Products
To confirm the presence of grafts on the guar gum backbone, we analyzed the
samples using 1H NMR, and were able to calculate the percent grafting from the
integration of the spectra. The 1H NMR spectra of all products showed distinctive peaks
attributed the graft. Figure 4.6 shows the 1H NMR of BMCMGGW45-g-M1000
compared to the 1H NMR of BMCMGGW-45 and the pure polyoxyalkyleneamines XTJ-
506 (M-1000). The 1H NMR spectrum of BMCMGGW-45 has no peaks at the region
0.5-1.5 ppm. The 1H NMR spectrum of the M-1000 has two doublets represent the -CH3
is assigned to the oxypropylene units located at the end groups (0.93 and 0.95 ppm) and
the -CH3 located at the oxypropylene units within the chain (1.06 and 1.08 ppm).
In addition, the spectrum shows a very strong peak at 3.62 ppm represent the
methylene protons of the oxyethylene and oxypropylene within the backbone of the
chains (-CH2-O-). The 1H NMR spectrum of BMCMGGW45-g-M1000 showed the two
doublet peaks at 0.93 and 0.95 ppm and showed the strong peak at 3.62 ppm with a small
shift toward up field. The existence of the characteristic peaks of the M-1000 in the
grafted product indicates a successful grafting process. Grafts of BMCMGGW45 with
polyoxyalkyleneamines M-600, M-715, and L300 showed similar 1H NMR spectra. The
other two grafts of the BMCMGGW45 with MNPA-1000 and B30 are shown in Figures
4.7 and 4.8. Figures 4.9 and 4.10 show the 1H NMR spectra of BM13CMHPG-g-
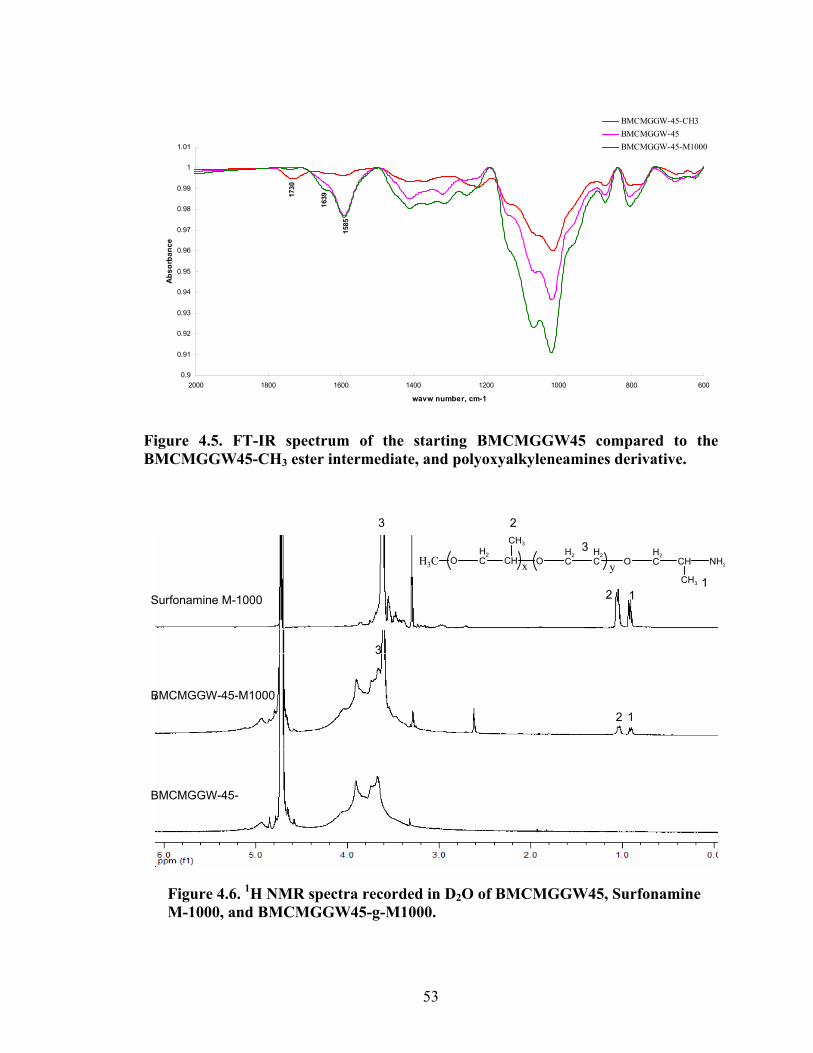
53
1730
1585
1639
0.9
0.91
0.92
0.93
0.94
0.95
0.96
0.97
0.98
0.99
1
1.01
600800100012001400160018002000
wavw number, cm-1
Abs
orba
nce
BMCMGGW-45-CH3BMCMGGW-45BMCMGGW-45-M1000
Figure 4.5. FT-IR spectrum of the starting BMCMGGW45 compared to the BMCMGGW45-CH3 ester intermediate, and polyoxyalkyleneamines derivative.
Figure 4.6. 1H NMR spectra recorded in D2O of BMCMGGW45, Surfonamine M-1000, and BMCMGGW45-g-M1000.
OH3CH2C CH NH2
CH3
OH2C
H2CO
H2C CH
CH3
x y
1 2
3
3
1 2
1
3
2
Surfonamine M-1000
BMCMGGW-45-M1000
BMCMGGW-45-
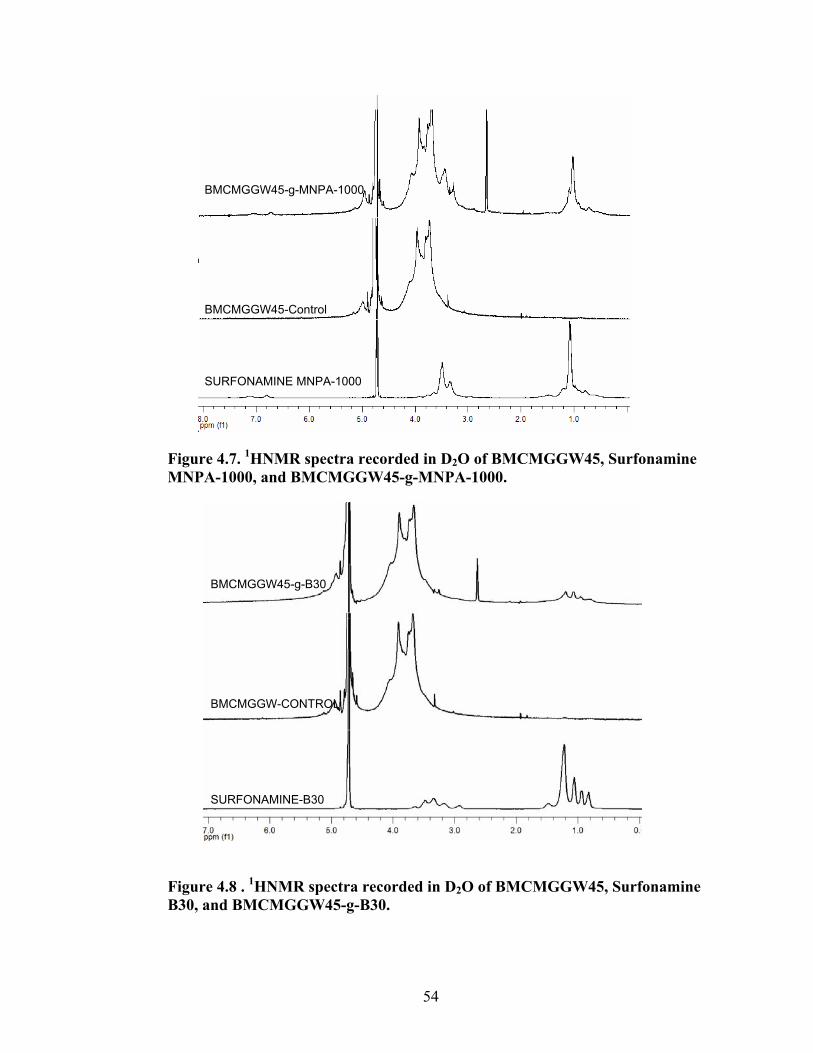
54
Figure 4.7. 1HNMR spectra recorded in D2O of BMCMGGW45, Surfonamine MNPA-1000, and BMCMGGW45-g-MNPA-1000.
Figure 4.8 . 1HNMR spectra recorded in D2O of BMCMGGW45, Surfonamine B30, and BMCMGGW45-g-B30.
SURFONAMINE MNPA-1000
BMCMGGW45-Control
BMCMGGW45-g-MNPA-1000
BMCMGGW45-g-B30
BMCMGGW-CONTROL
SURFONAMINE-B30
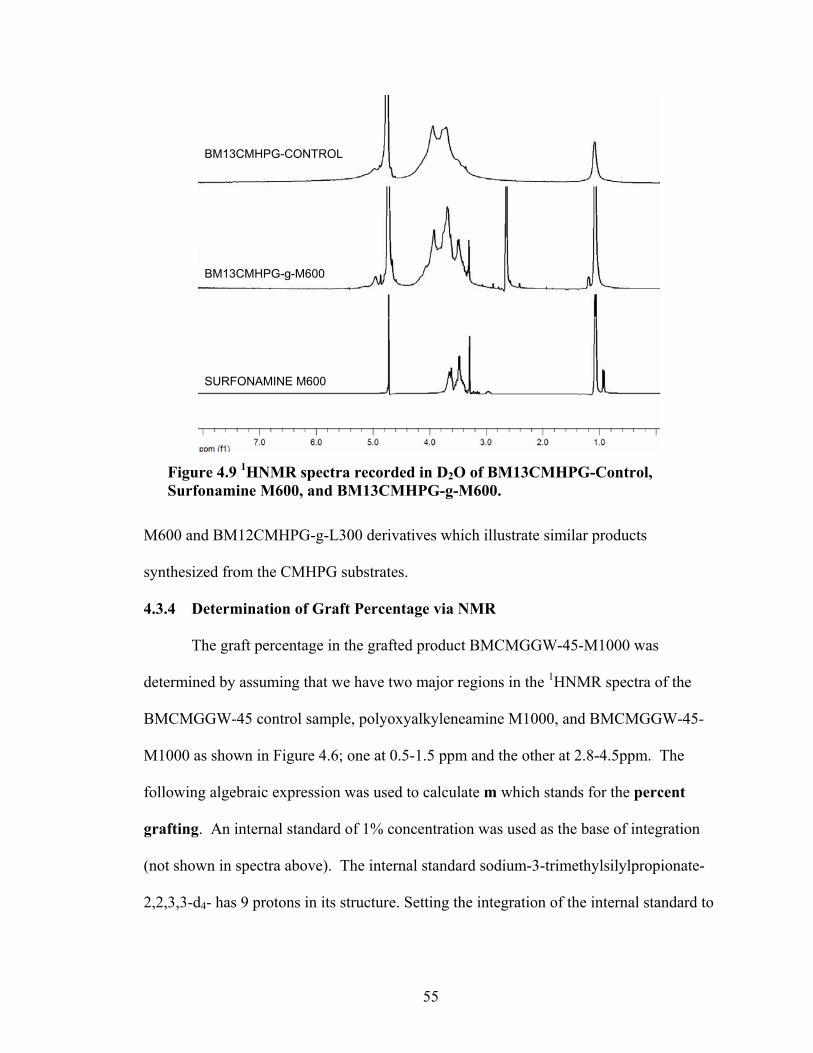
55
Figure 4.9 1HNMR spectra recorded in D2O of BM13CMHPG-Control, Surfonamine M600, and BM13CMHPG-g-M600.
M600 and BM12CMHPG-g-L300 derivatives which illustrate similar products
synthesized from the CMHPG substrates.
4.3.4 Determination of Graft Percentage via NMR
The graft percentage in the grafted product BMCMGGW-45-M1000 was
determined by assuming that we have two major regions in the 1HNMR spectra of the
BMCMGGW-45 control sample, polyoxyalkyleneamine M1000, and BMCMGGW-45-
M1000 as shown in Figure 4.6; one at 0.5-1.5 ppm and the other at 2.8-4.5ppm. The
following algebraic expression was used to calculate m which stands for the percent
grafting. An internal standard of 1% concentration was used as the base of integration
(not shown in spectra above). The internal standard sodium-3-trimethylsilylpropionate-
2,2,3,3-d4- has 9 protons in its structure. Setting the integration of the internal standard to
SURFONAMINE M600
BM13CMHPG-g-M600
BM13CMHPG-CONTROL
56
1, makes every proton equivalent to 0.1111 area unit. Then m was calculated using
equation 4.2.
B = (c × n) + (d × m) ----------------------------------------(4.1)
when n = (1-m) then it resulted in the following
m = {(B - c) / (d – c)} × 100 -----------------------------------------(4.2)
where B= Area under peaks at 0.5-1.5ppm for BMCMGGW-45-M1000, c= Area under
peaks at 0.5-1.5ppm for BMCMGGW-45, b= Area under peaks at 2.8-4.5ppm for
M1000, d= Area under peaks at 0.5-1.5ppm for M1000, m=percent of M1000 exist in
peaks area at 0.5-1.5ppm.
The percent yield was calculated by the following expression
Yield = product wt. / (theo. polyoxy. grafted + wt. of ester used) -------(4.3)
Where
theo. polyoxy. grafted = Mw of polyoxy.× C --------------------------------(4.4)
C is units of anhydroglucose used
C = D.S. × meq. of MCMG ---------------------------------(4.5)
meq. of MCMG = wt. of MCMG/ (D.S. × 234+((1-D.S.)×162)) ----------(4.6)
Both the calculated m values and percent yield are listed in Table 4.2 and Table 4.3. The
m values listed in both tables illustrate mostly the low percent grafting we achieved in the
synthesis process. Some of these values are not that accurate. For example, a negative
value was calculated for BM12CMHPG-M1000 which is impossible. Other values were
too high as a grafting value. This inconsistency in m values is due to many reasons. First,
it was very difficult to make, transfer, and measure solutions of these materials due to
high viscosity problem, and loss of part of the material to the walls of the preparation and
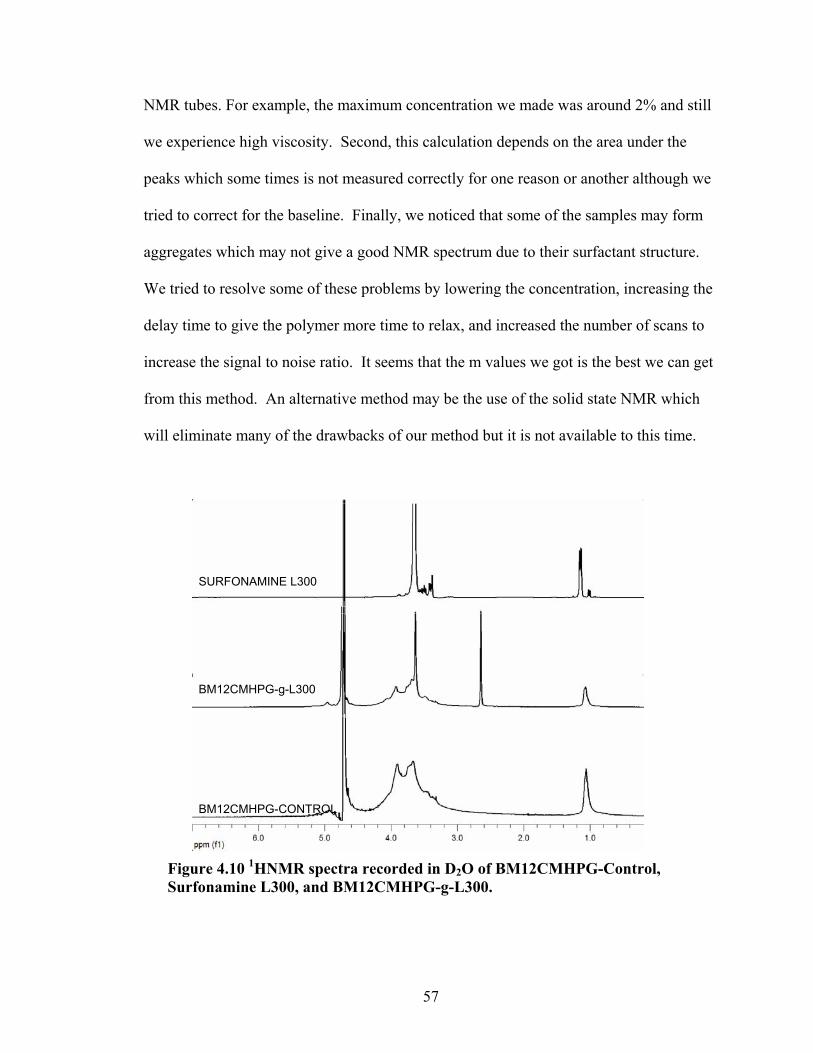
57
NMR tubes. For example, the maximum concentration we made was around 2% and still
we experience high viscosity. Second, this calculation depends on the area under the
peaks which some times is not measured correctly for one reason or another although we
tried to correct for the baseline. Finally, we noticed that some of the samples may form
aggregates which may not give a good NMR spectrum due to their surfactant structure.
We tried to resolve some of these problems by lowering the concentration, increasing the
delay time to give the polymer more time to relax, and increased the number of scans to
increase the signal to noise ratio. It seems that the m values we got is the best we can get
from this method. An alternative method may be the use of the solid state NMR which
will eliminate many of the drawbacks of our method but it is not available to this time.
Figure 4.10 1HNMR spectra recorded in D2O of BM12CMHPG-Control, Surfonamine L300, and BM12CMHPG-g-L300.
BM12CMHPG-g-L300
BM12CMHPG-CONTROL
SURFONAMINE L300
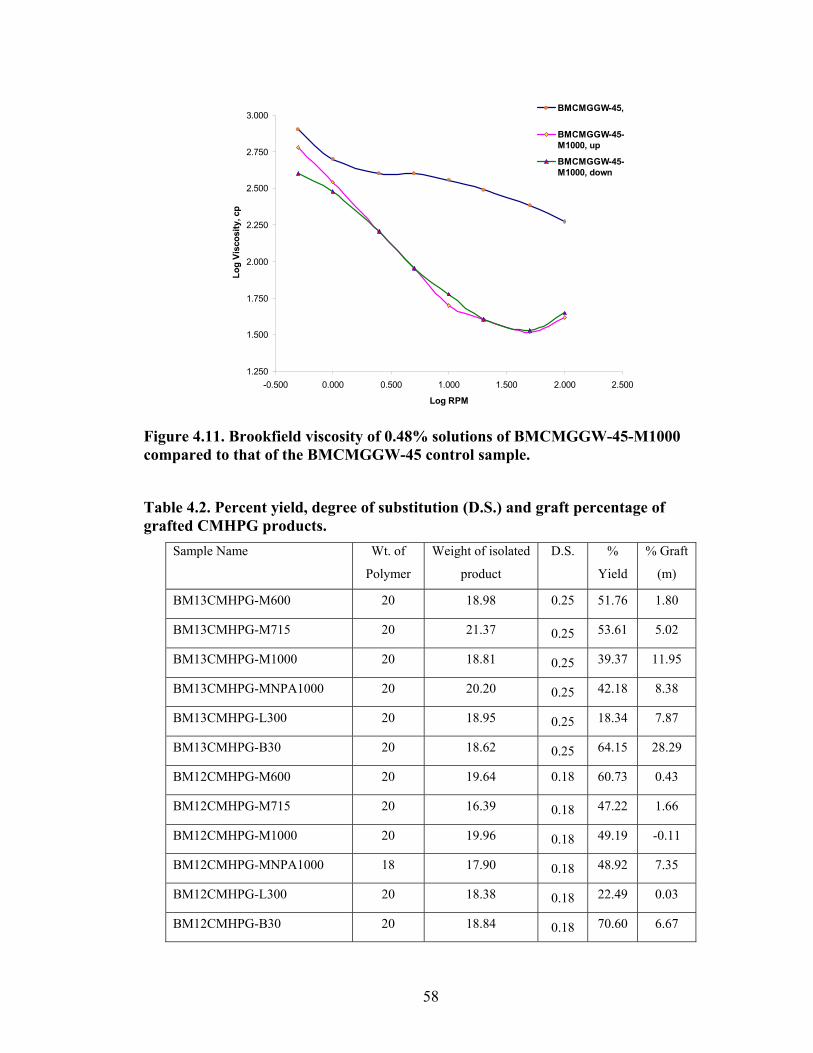
58
1.250
1.500
1.750
2.000
2.250
2.500
2.750
3.000
-0.500 0.000 0.500 1.000 1.500 2.000 2.500
Log RPM
Log
Visc
osity
, cp
BMCMGGW-45,
BMCMGGW-45-M1000, up
BMCMGGW-45-M1000, down
Figure 4.11. Brookfield viscosity of 0.48% solutions of BMCMGGW-45-M1000 compared to that of the BMCMGGW-45 control sample.
Table 4.2. Percent yield, degree of substitution (D.S.) and graft percentage of grafted CMHPG products.
Sample Name
Wt. of
Polymer
Weight of isolated
product
D.S. %
Yield
% Graft
(m)
BM13CMHPG-M600 20 18.98 0.25 51.76 1.80
BM13CMHPG-M715 20 21.37 0.25 53.61 5.02
BM13CMHPG-M1000 20 18.81 0.25 39.37 11.95
BM13CMHPG-MNPA1000 20 20.20 0.25 42.18 8.38
BM13CMHPG-L300 20 18.95 0.25 18.34 7.87
BM13CMHPG-B30 20 18.62 0.25 64.15 28.29
BM12CMHPG-M600 20 19.64 0.18 60.73 0.43
BM12CMHPG-M715 20 16.39 0.18 47.22 1.66
BM12CMHPG-M1000 20 19.96 0.18 49.19 -0.11
BM12CMHPG-MNPA1000 18 17.90 0.18 48.92 7.35
BM12CMHPG-L300 20 18.38 0.18 22.49 0.03
BM12CMHPG-B30 20 18.84 0.18 70.60 6.67
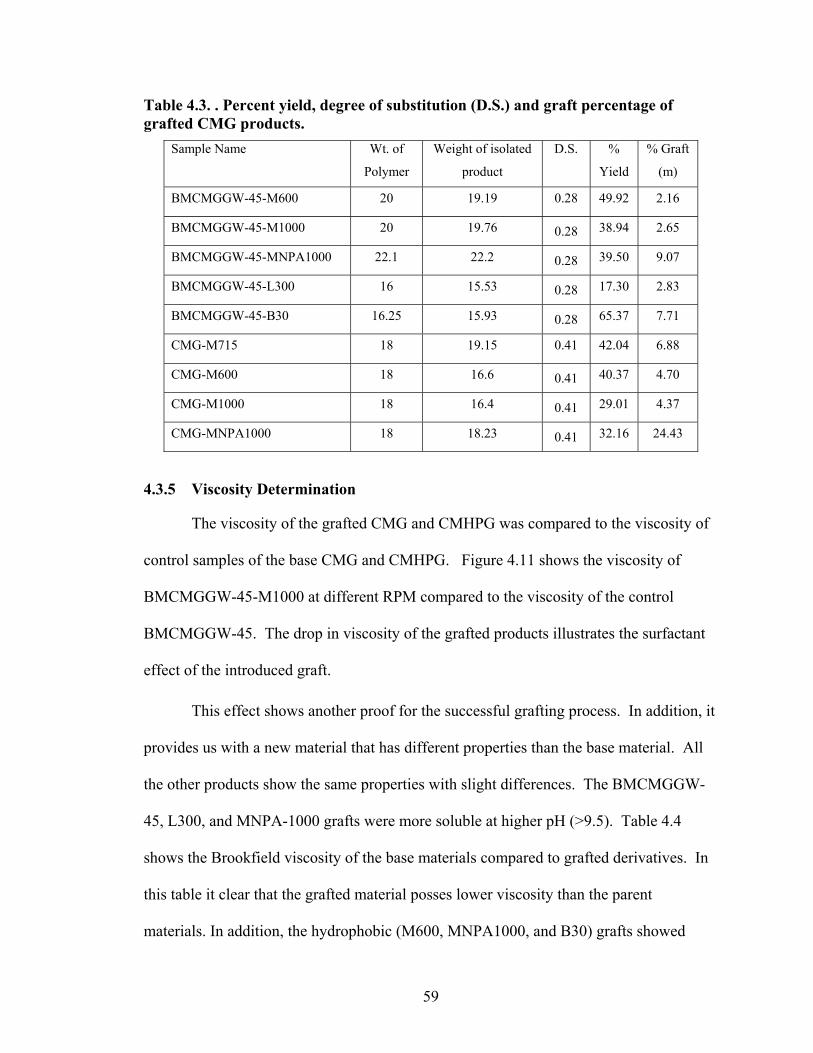
59
Table 4.3. . Percent yield, degree of substitution (D.S.) and graft percentage of grafted CMG products.
Sample Name
Wt. of
Polymer
Weight of isolated
product
D.S. %
Yield
% Graft
(m)
BMCMGGW-45-M600 20 19.19 0.28 49.92 2.16
BMCMGGW-45-M1000 20 19.76 0.28 38.94 2.65
BMCMGGW-45-MNPA1000 22.1 22.2 0.28 39.50 9.07
BMCMGGW-45-L300 16 15.53 0.28 17.30 2.83
BMCMGGW-45-B30 16.25 15.93 0.28 65.37 7.71
CMG-M715 18 19.15 0.41 42.04 6.88
CMG-M600 18 16.6 0.41 40.37 4.70
CMG-M1000 18 16.4 0.41 29.01 4.37
CMG-MNPA1000 18 18.23 0.41 32.16 24.43
4.3.5 Viscosity Determination
The viscosity of the grafted CMG and CMHPG was compared to the viscosity of
control samples of the base CMG and CMHPG. Figure 4.11 shows the viscosity of
BMCMGGW-45-M1000 at different RPM compared to the viscosity of the control
BMCMGGW-45. The drop in viscosity of the grafted products illustrates the surfactant
effect of the introduced graft.
This effect shows another proof for the successful grafting process. In addition, it
provides us with a new material that has different properties than the base material. All
the other products show the same properties with slight differences. The BMCMGGW-
45, L300, and MNPA-1000 grafts were more soluble at higher pH (>9.5). Table 4.4
shows the Brookfield viscosity of the base materials compared to grafted derivatives. In
this table it clear that the grafted material posses lower viscosity than the parent
materials. In addition, the hydrophobic (M600, MNPA1000, and B30) grafts showed
60
slightly higher viscosity than the hydrophilic grafts. For example, the B30 graft is
considered the most hydrophobic graft from its structure and it showed the highest
viscosity when compared to the rest.
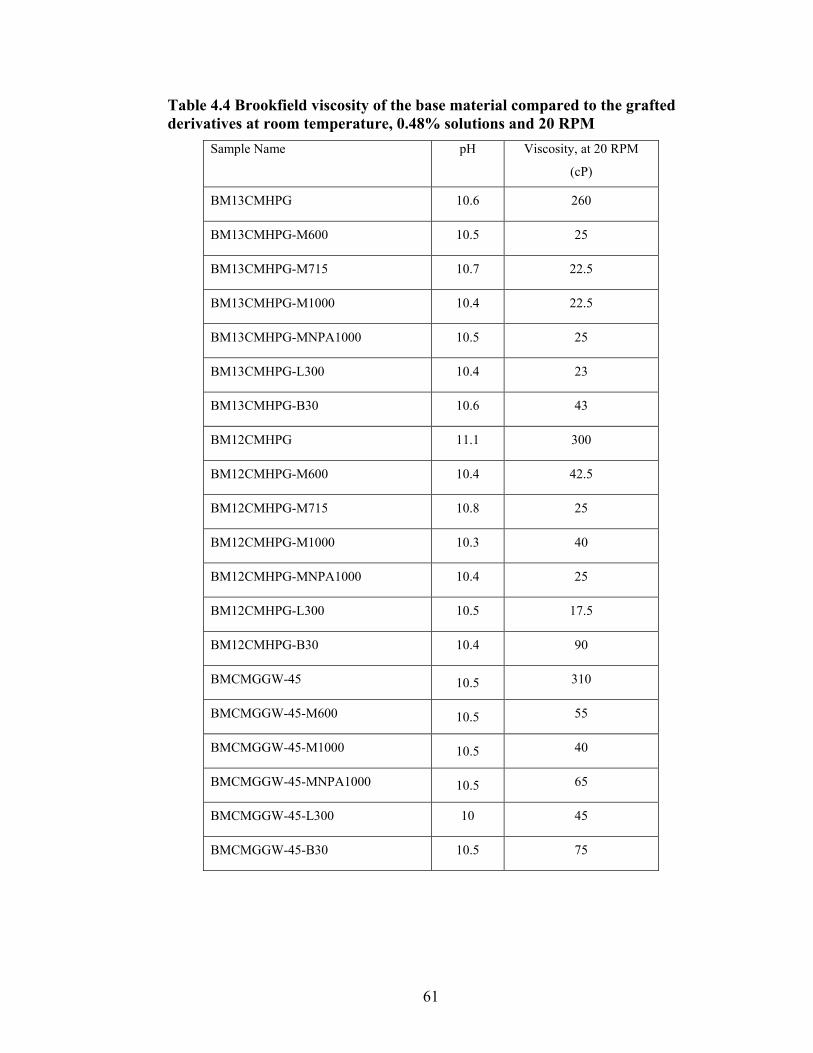
61
Table 4.4 Brookfield viscosity of the base material compared to the grafted derivatives at room temperature, 0.48% solutions and 20 RPM
Sample Name
pH Viscosity, at 20 RPM
(cP)
BM13CMHPG 10.6 260
BM13CMHPG-M600 10.5 25
BM13CMHPG-M715 10.7 22.5
BM13CMHPG-M1000 10.4 22.5
BM13CMHPG-MNPA1000 10.5 25
BM13CMHPG-L300 10.4 23
BM13CMHPG-B30 10.6 43
BM12CMHPG 11.1 300
BM12CMHPG-M600 10.4 42.5
BM12CMHPG-M715 10.8 25
BM12CMHPG-M1000 10.3 40
BM12CMHPG-MNPA1000 10.4 25
BM12CMHPG-L300 10.5 17.5
BM12CMHPG-B30 10.4 90
BMCMGGW-45 10.5 310
BMCMGGW-45-M600 10.5 55
BMCMGGW-45-M1000 10.5 40
BMCMGGW-45-MNPA1000 10.5 65
BMCMGGW-45-L300 10 45
BMCMGGW-45-B30 10.5 75
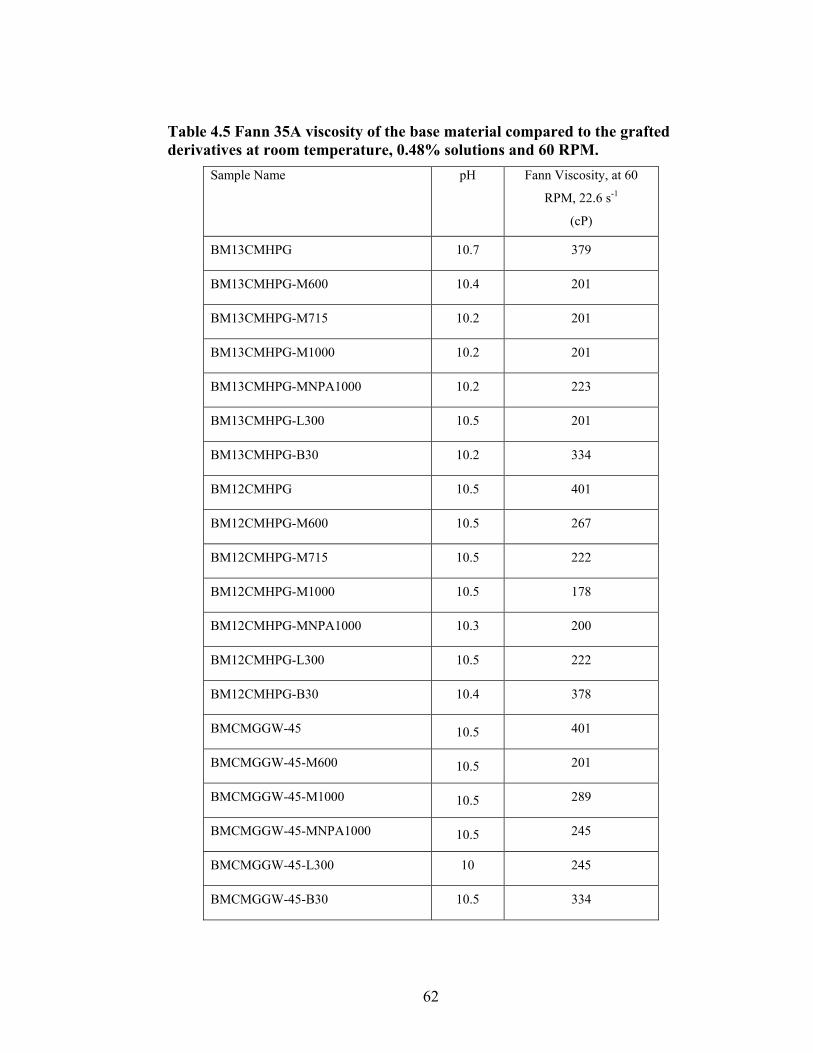
62
Table 4.5 Fann 35A viscosity of the base material compared to the grafted derivatives at room temperature, 0.48% solutions and 60 RPM.
Sample Name
pH Fann Viscosity, at 60
RPM, 22.6 s-1
(cP)
BM13CMHPG 10.7 379
BM13CMHPG-M600 10.4 201
BM13CMHPG-M715 10.2 201
BM13CMHPG-M1000 10.2 201
BM13CMHPG-MNPA1000 10.2 223
BM13CMHPG-L300 10.5 201
BM13CMHPG-B30 10.2 334
BM12CMHPG 10.5 401
BM12CMHPG-M600 10.5 267
BM12CMHPG-M715 10.5 222
BM12CMHPG-M1000 10.5 178
BM12CMHPG-MNPA1000 10.3 200
BM12CMHPG-L300 10.5 222
BM12CMHPG-B30 10.4 378
BMCMGGW-45 10.5 401
BMCMGGW-45-M600 10.5 201
BMCMGGW-45-M1000 10.5 289
BMCMGGW-45-MNPA1000 10.5 245
BMCMGGW-45-L300 10 245
BMCMGGW-45-B30 10.5 334
63
CHAPTER 5 VISCOSITY TRENDS OF THE CROSSLINKED GELS 5.1 Introduction
In designing a fracturing fluid, it is very important to transport as much of the
intended volume of proppant into the newly created fracture as possible. It is also
essential, that the carrier fluid (gel) or its degraded products flow efficiently from the
fracture back to the surface. Efficient removal of gel residues assures minimum damage
to the formation and high conductivity of the newly created flow paths as we explained in
chapter 1. The carrying capacity of the fracturing fluid, i.e., its ability to keep proppant
in suspension during its journey down hole, in the tubing, through the perforations, and
through the fracture, depends upon the viscosity of the fluid. High viscosity fluids (η>
1000 cp) are required to suspend the preferred sand proppants. Removal of the fluid after
the formation has been fractured requires that the polymer solutes be degraded until
fracturing fluid viscosity approaches that of water so it may efficiently flow back to the
surface and out from between the proppant grains. High fluid viscosities are achieved by
either dissolving high concentrations of high molecular weight polymer in the fluid, or
chemically crosslinking a low concentration of the polymer to form gels with infinite
molecular weights. Then, once the proppant is placed in the created fracture, breakers
chemically cleave the polymer backbone to oligomers with a resultant drop in viscosity.
In chapter 4 we illustrated the synthesis of a new family of modified polymers
which upon dissolution in water produce fluids with viscosities ten folds less than the
viscosity of the substrate polymers at comparable concentrations. This feature may make
these modified polymers more attractive, both in the initial mixing stages of the cross-
linking process as well as in their removal during the cleaning process. In this chapter we
64
are going to compare the relative solution viscosity response of polymers modified with
various polyoxyalkylene substituents with the viscosities of their base polymer solutions.
to their base polymers. Measuring viscosity is a well accepted method for evaluating
fracturing fluids in oil industry.1 The viscosity evaluation will include linear and the
corresponding cross linked fluids at different concentrations. The relative stabilities of
the solutions will be evaluated by observing changes in the viscosity in solutions/gels
held at higher temperatures for extended periods of time. Since some of the solutions and
particularly the gels are heterogeneous, it is very important to understand that the
following procedures were used to obtain qualitative information about the various
formulations. Our main objective is to evaluate formulations using procedures that are
standard methods used by members of the oil industry. The heterogeneity of the samples
precluded precise rheological evaluation of the formulations.
5.2 Experimental Procedure
5.2.1 Instrumentation and Viscosity Calculation
Gel viscosities were measured using a Fann Model 35A viscometer35 (F-1 model)
equipped with a heating cup that is capable for heating the fluids to 200 °F (93.3°C). The
viscometer is shown in Figure 5.1 along with a B2 bob and R1 rotor which allows testing
of cross-linked fluids. This apparatus is a couette coaxial cylinder rotational viscometer.
The bob, coupled to a spring sensitive to the torque exerted on the bob, is centered in a
rotating outer cylinder and both the cylinder and the bob are immersed in the sample
solution. The solution fills the gap between the bob and cylinder. The viscosity
measurements are made when the outer cylinder rotates at a known velocity by the drive
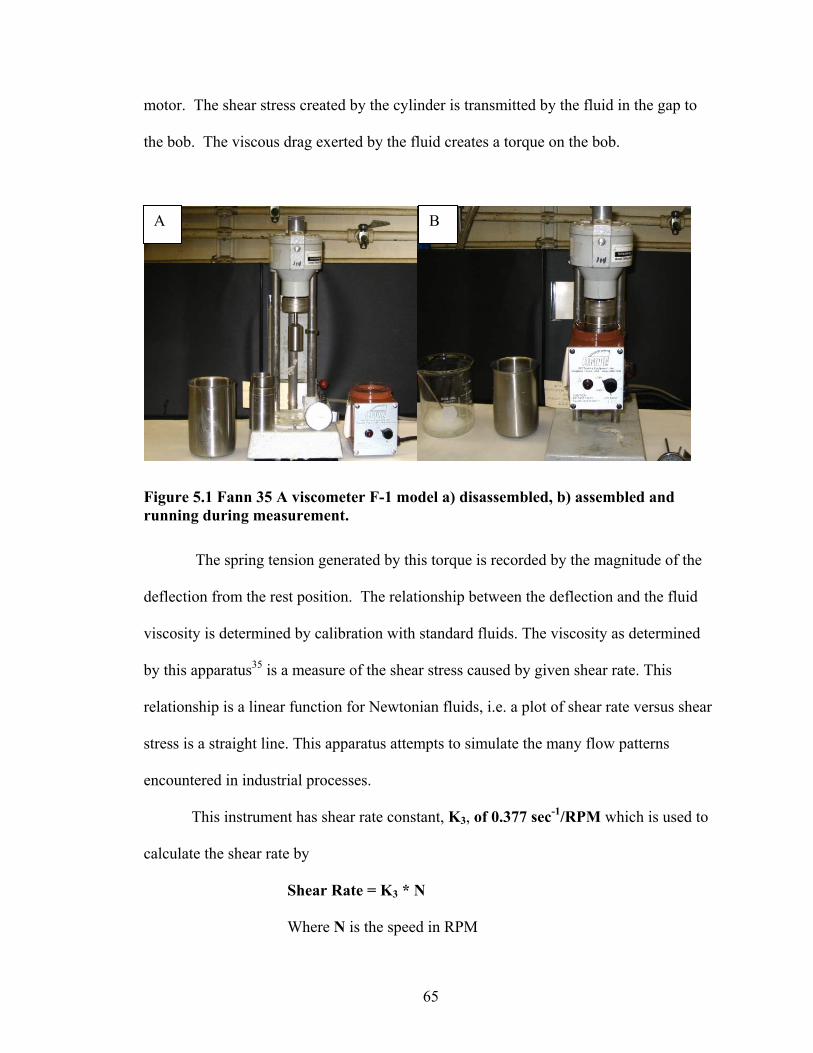
65
motor. The shear stress created by the cylinder is transmitted by the fluid in the gap to
the bob. The viscous drag exerted by the fluid creates a torque on the bob.
Figure 5.1 Fann 35 A viscometer F-1 model a) disassembled, b) assembled and running during measurement.
The spring tension generated by this torque is recorded by the magnitude of the
deflection from the rest position. The relationship between the deflection and the fluid
viscosity is determined by calibration with standard fluids. The viscosity as determined
by this apparatus35 is a measure of the shear stress caused by given shear rate. This
relationship is a linear function for Newtonian fluids, i.e. a plot of shear rate versus shear
stress is a straight line. This apparatus attempts to simulate the many flow patterns
encountered in industrial processes.
This instrument has shear rate constant, K3, of 0.377 sec-1/RPM which is used to
calculate the shear rate by
Shear Rate = K3 * N
Where N is the speed in RPM
A B
66
The viscosity is calculated in cP from the following formula;
Viscosity (cP) = R*S*C*f
Where
R: is the dial reading
f: is the spring factor (in case of F-1 model is 1)
S: is the speed factor (Instruction manual)
C: Rotor-bob factor is equal to 8.915 in case of R1-B2
5.2.2 Viscosity Measurements
The polymer samples were prepared by dispersing the polymers in deionized
water in the industrially recommended concentration3 (4.8 g/L, 40lb/1000 gal) and at
lower concentration of 2.4g/L (20lb/1000gal). The samples were left to hydrate at least
for 30 min. Sodium thiosulfate 1.2 g/L (10lb/1000gal) was added as a gel stabilizer. The
pH was adjusted to >10 by adding 0.6g/L (5lb/1000gal) of sodium carbonate and the
dispersion was stirred until all the carbonate dissolved. The viscosity of the polymer
fluid before crosslinking (linear gel) was measured at different shear rates (0.7, 1.1, 2.3,
11.3, 22.6, 37.7, 113, and 226-1) using the B2 bob and R1 rotor setup as illustrated above.
Then the linear gel was transferred to Waring blender4 and under conditions of excessive
shear, a 0.3-0.5ml of the zirconium cross-linking agent (Benchmark, 8.3% ZrO) was
added. Blending was continued until the vortex disappeared. The resulting gel was
transferred to a heated sample cup and the viscosity was measured at different shear rates
at room temperature (RT). Then the gel strength was measured as described below.
After that, the temperature was raised to 65°C and the gel was sheared continuously at
shear rate of 37.7s-1 (100RPM). The viscosity was measured (every 10 minutes) for two
67
hours. After that, the temperature was raised to 90°C and the viscosity was measured
every 10 minutes for two more hours at the same shear rate. At the end of this period, the
gel strength was measured again at 90°C. A shear rate of 37.7s-1 was selected because it
was believed that this shear rate is in the middle of the average fracture shear, i.e.,
between 10 and 100s-1.36 This test evaluate the stability of the fluids during the injection
process and conversely illustrates if the viscosity drops after exposure to heat and shear.36
The gel strength was measured according to the API practice37 13B-1. First, the
fluid sample was stirred for 10 seconds at 600RPM. Then, the fluid was allowed to stand
undisturbed for 10 seconds. After that, the viscometer was turned on and the maximum
dial deflection at 3 RPM was recorded. The dial deflection is a direct measurement of a
stress/unit area reported as the 10-seconds gel in pounds per 100 square feet (Pascals).
The fluid was sheared at 600RPM for 10 seconds and then was allowed to relax for 10
minutes undisturbed. Then the measurement was repeated using 3RPM and the maximum
reading was recorded. The corresponding stress/unit area was reported as 10-minutes gel
strength. The gel strength was measured at room temperature before and after subjecting
the gel to the thermal stability testing profile.
5.3 Results and Discussion
The concentration of the polymer in all fluids tested in this study was selected to
be 20lb/1000gal (20gel) and 40lb/1000gal (40gel). A concentration of 40lb/1000gal is
within the range recommended3,36 and used by the oil industry. The 20lb/1000gal
concentration was selected to study the behavior of the guar derivatives at a level near the
critical crosslinking concentration Ccc. Cuiyue lei and coworkers38 reported that the
critical crosslinking concentration for the CMG and CMHPG were 0.193 and 0.22 wt%,
68
respectively. Thus the 20 gel concentration (approximately 0.24wt %) has been chosen
to be slightly above the Ccc for the CMG and around that for the CMHPG. The viscosity
behavior of the grafted and non-grafted samples will be discussed below in detail.
5.3.1 Carboxymethylated Guar Derivatives (BMCMGGW45)
Gelation was effected using a constant concentration of zirconium lactate catalyst
as described in the experimental section. Figure 5.2 shows the log viscosity of the 20
gels plotted against the log shear rate for the crosslinked BMCMGGW-45 control sample
and five grafted derivatives prepared from that sample. All the samples show a shear
thinning behavior. The control sample exhibited a slightly higher viscosity than the
grafted samples at low shears, but continued to shear thin throughout the range of shear
rates measured. At higher shear rates (higher than 11.3s-1, 30RPM) the grafted samples
passed through a range of shear rates where shear thickening occurred. Thus at shear
rates above 11.3s-1, all of the derivatives retained higher viscosities than the control
sample. This phenomenon was investigated by running one of the samples (CMGGW45-
B30) twice (Figure 5.3). Rerunning the sample directly after exposing it to a high shear
eliminated the shear thickening; the second run showed a smooth and stable shear
thinning behavior. It appears that this phenomenon was related to the sample history; it
could be removed if the sample is exposed to high shear rates at the end of the
measurement. The other question raised here is why shear thickening happens only with
the grafted samples and not with the control sample? I think the shear history of the
grafted samples is related to the large side chains that were introduced to the control
sample after the grafting process. These side chains may need at least one run at high
shear to align and maximize their contribution to the viscosity of the solution. Further
69
support for this idea may be extracted from the observation that the onset of thickening
occurred earlier for the high molecular weight grafts than it did for the low molecular
weight grafts.
Figure 5.4 compares the viscosities of the 40 gels at different shear rates for the
crosslinked BMCMGGW-45 control sample and its grafted derivatives. With the
exception of the sample with a long hydrophilic chain graft (BMCMG-45-M1000),
minimal shear thickening was observed at this higher concentration. At low shear rates
all samples showed shear thinning with the control sample displaying a higher viscosity
than that of the grafted derivatives. At shear rates higher than 11.3s-1 viscosity of the
grafted samples did not decrease with shear; in fact two of the samples (MNPA1000,
L300) have higher viscosities than the control sample at shear rates above 100s-1. In the
field, the samples will be exposed to high shear immediately before being pumped down
hole so the viscosities measured at high shear rates probably correlate closely with field
conditions.
The stability of the gels was estimated by exposing the samples to a continuous
shear rate of 37.7s-1 at two different temperatures (2h for each temperature). The Fann
Model 35A viscometer has an open sample cup configuration so one can not be assured
that solvent evaporation does not occur during these measurements, but the relative
stability of each gel can be evaluated. Further, the gels tend to foam during the
measurement leading to pronounced variations in the viscosity with time. After exposure
to a given temperature for an hour, the average of the viscosity variations was constant,
indicating that the sample was not degrading at that temperature. Table 5.1 shows the
average viscosity of the
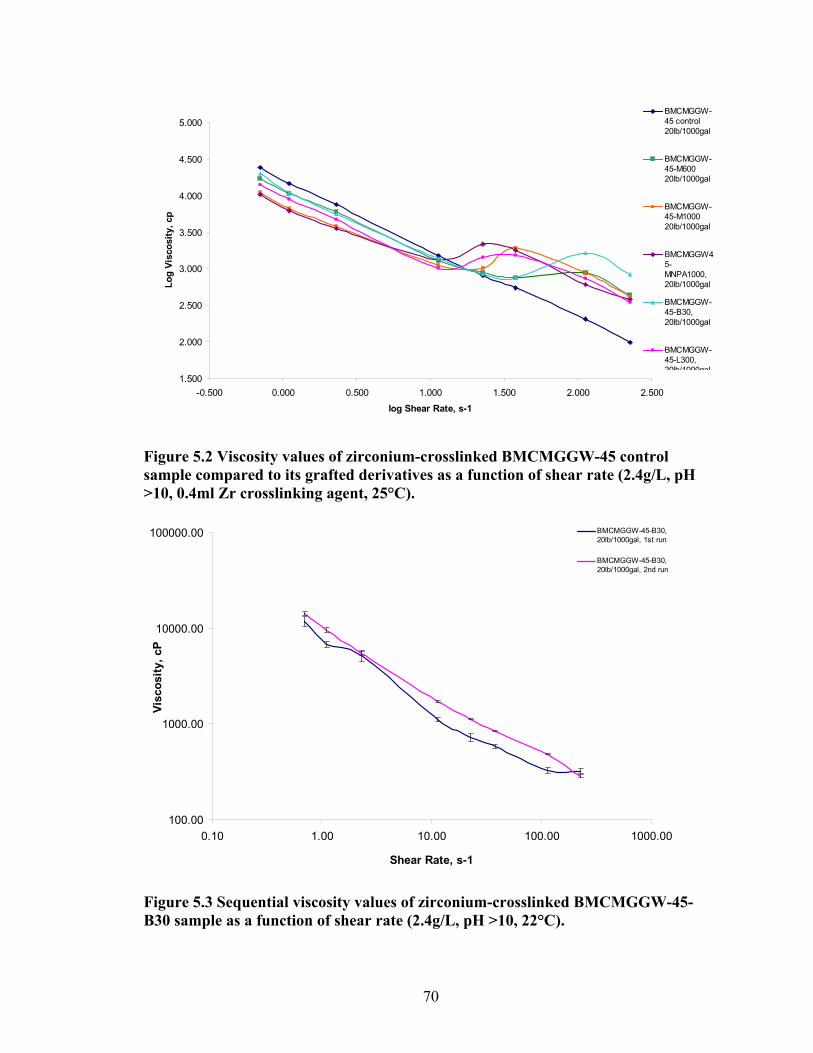
70
1.500
2.000
2.500
3.000
3.500
4.000
4.500
5.000
-0.500 0.000 0.500 1.000 1.500 2.000 2.500
log Shear Rate, s-1
Log
Visc
osity
, cp
BMCMGGW-45 control20lb/1000gal
BMCMGGW-45-M60020lb/1000gal
BMCMGGW-45-M100020lb/1000gal
BMCMGGW45-MNPA1000,20lb/1000gal
BMCMGGW-45-B30,20lb/1000gal
BMCMGGW-45-L300,20lb/1000gal
Figure 5.2 Viscosity values of zirconium-crosslinked BMCMGGW-45 control sample compared to its grafted derivatives as a function of shear rate (2.4g/L, pH >10, 0.4ml Zr crosslinking agent, 25°C).
100.00
1000.00
10000.00
100000.00
0.10 1.00 10.00 100.00 1000.00
Shear Rate, s-1
Visc
osity
, cP
BMCMGGW-45-B30,20lb/1000gal, 1st run
BMCMGGW-45-B30,20lb/1000gal, 2nd run
Figure 5.3 Sequential viscosity values of zirconium-crosslinked BMCMGGW-45-B30 sample as a function of shear rate (2.4g/L, pH >10, 22°C).
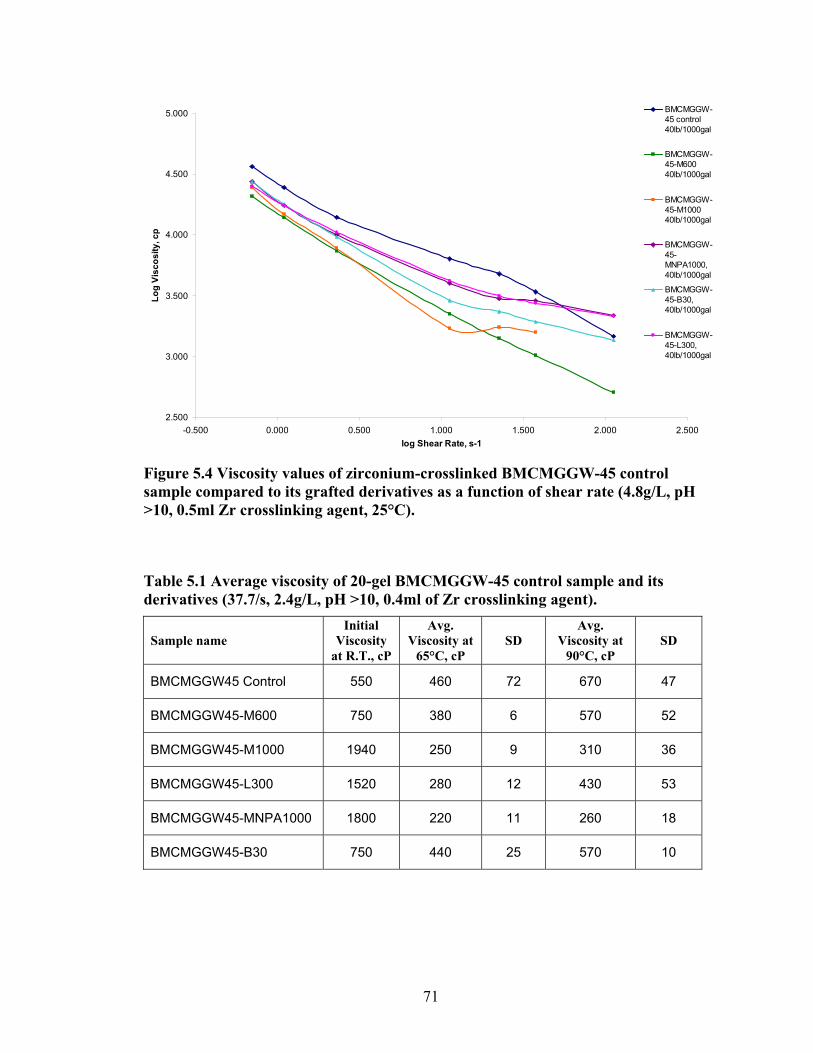
71
2.500
3.000
3.500
4.000
4.500
5.000
-0.500 0.000 0.500 1.000 1.500 2.000 2.500log Shear Rate, s-1
Log
Visc
osity
, cp
BMCMGGW-45 control40lb/1000gal
BMCMGGW-45-M600 40lb/1000gal
BMCMGGW-45-M1000 40lb/1000gal
BMCMGGW-45-MNPA1000, 40lb/1000gal
BMCMGGW-45-B30, 40lb/1000gal
BMCMGGW-45-L300, 40lb/1000gal
Figure 5.4 Viscosity values of zirconium-crosslinked BMCMGGW-45 control sample compared to its grafted derivatives as a function of shear rate (4.8g/L, pH >10, 0.5ml Zr crosslinking agent, 25°C).
Table 5.1 Average viscosity of 20-gel BMCMGGW-45 control sample and its derivatives (37.7/s, 2.4g/L, pH >10, 0.4ml of Zr crosslinking agent).
Sample name Initial
Viscosity at R.T., cP
Avg. Viscosity at
65°C, cP SD
Avg. Viscosity at
90°C, cP SD
BMCMGGW45 Control 550 460 72 670 47
BMCMGGW45-M600 750 380 6 570 52
BMCMGGW45-M1000 1940 250 9 310 36
BMCMGGW45-L300 1520 280 12 430 53
BMCMGGW45-MNPA1000 1800 220 11 260 18
BMCMGGW45-B30 750 440 25 570 10
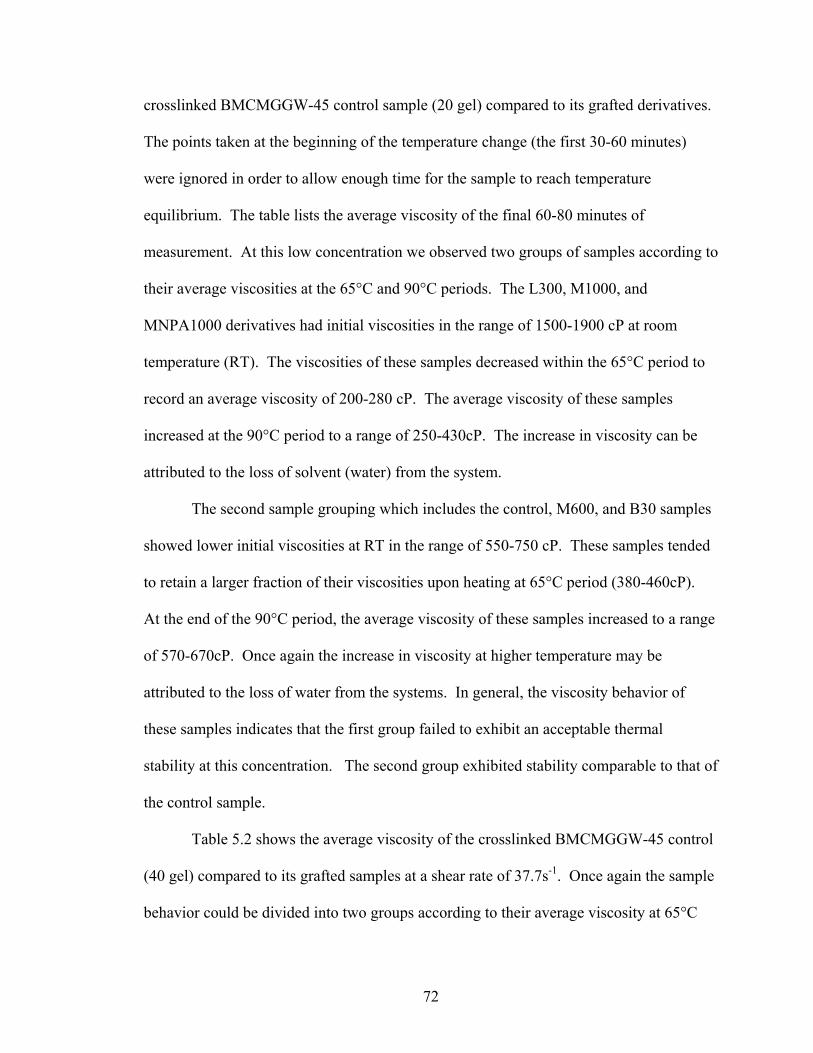
72
crosslinked BMCMGGW-45 control sample (20 gel) compared to its grafted derivatives.
The points taken at the beginning of the temperature change (the first 30-60 minutes)
were ignored in order to allow enough time for the sample to reach temperature
equilibrium. The table lists the average viscosity of the final 60-80 minutes of
measurement. At this low concentration we observed two groups of samples according to
their average viscosities at the 65°C and 90°C periods. The L300, M1000, and
MNPA1000 derivatives had initial viscosities in the range of 1500-1900 cP at room
temperature (RT). The viscosities of these samples decreased within the 65°C period to
record an average viscosity of 200-280 cP. The average viscosity of these samples
increased at the 90°C period to a range of 250-430cP. The increase in viscosity can be
attributed to the loss of solvent (water) from the system.
The second sample grouping which includes the control, M600, and B30 samples
showed lower initial viscosities at RT in the range of 550-750 cP. These samples tended
to retain a larger fraction of their viscosities upon heating at 65°C period (380-460cP).
At the end of the 90°C period, the average viscosity of these samples increased to a range
of 570-670cP. Once again the increase in viscosity at higher temperature may be
attributed to the loss of water from the systems. In general, the viscosity behavior of
these samples indicates that the first group failed to exhibit an acceptable thermal
stability at this concentration. The second group exhibited stability comparable to that of
the control sample.
Table 5.2 shows the average viscosity of the crosslinked BMCMGGW-45 control
(40 gel) compared to its grafted samples at a shear rate of 37.7s-1. Once again the sample
behavior could be divided into two groups according to their average viscosity at 65°C
73
and 90°C periods. The control, M1000, M600, and MNPA1000 derivatives had initial
viscosity at room temperature (RT) of 3410, 1580, 1020, and 800 cP, respectively. These
samples showed a decrease in viscosity within the 65°C period to record an average
viscosity of 590-920 cP. The average viscosity of these samples did not change
significantly upon exposure to 90°C. The second group which includes L300, and B30
samples, showed lower initial viscosities at RT than that of the control sample. However,
the viscosities of these samples increased upon exposure to 65°C; the resultant viscosities
were nearly an order of magnitude higher than that of the control samples (5410 and 6660
cP, respectively, vs 760 cP). At the 90°C period, the average viscosity of these samples
decreased to around 4900 and 5780 cP, respectively, but remained substantially higher
than the viscosity of the control sample.
In general, the viscosity behavior of the first group of these samples at the higher
concentration indicates a lower but more stable average viscosity which can be inferred
from the standard deviation (SD) listed in the table. On the other hand, the second group
with significantly higher viscosities appeared to be unstable at the lower temperature
range (65°C), while at the 90°C their viscosity was more stable, as suggested by the SD
values. At this concentration all samples appeared relatively stable to shear and exposure
to an elevated temperature.
In summary, among the BMCMGGW-45 derivatives, the L300 and B30 grafted samples
would be superior candidates for fracturing fluid applications based upon their high
viscosities during the aging period at the 40 gel concentration. These samples differ
substantially from each other. The L300 sample contains a high molecular weight
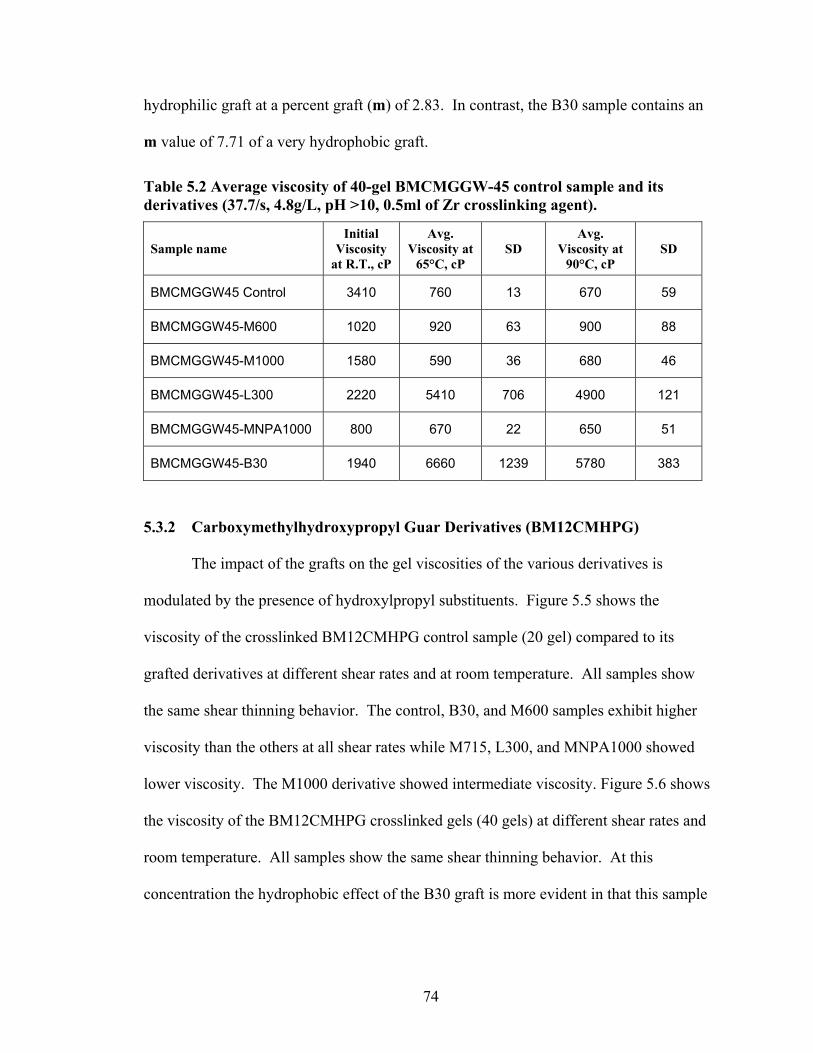
74
hydrophilic graft at a percent graft (m) of 2.83. In contrast, the B30 sample contains an
m value of 7.71 of a very hydrophobic graft.
Table 5.2 Average viscosity of 40-gel BMCMGGW-45 control sample and its derivatives (37.7/s, 4.8g/L, pH >10, 0.5ml of Zr crosslinking agent).
Sample name Initial
Viscosity at R.T., cP
Avg. Viscosity at
65°C, cP SD
Avg. Viscosity at
90°C, cP SD
BMCMGGW45 Control 3410 760 13 670 59
BMCMGGW45-M600 1020 920 63 900 88
BMCMGGW45-M1000 1580 590 36 680 46
BMCMGGW45-L300 2220 5410 706 4900 121
BMCMGGW45-MNPA1000 800 670 22 650 51
BMCMGGW45-B30 1940 6660 1239 5780 383
5.3.2 Carboxymethylhydroxypropyl Guar Derivatives (BM12CMHPG)
The impact of the grafts on the gel viscosities of the various derivatives is
modulated by the presence of hydroxylpropyl substituents. Figure 5.5 shows the
viscosity of the crosslinked BM12CMHPG control sample (20 gel) compared to its
grafted derivatives at different shear rates and at room temperature. All samples show
the same shear thinning behavior. The control, B30, and M600 samples exhibit higher
viscosity than the others at all shear rates while M715, L300, and MNPA1000 showed
lower viscosity. The M1000 derivative showed intermediate viscosity. Figure 5.6 shows
the viscosity of the BM12CMHPG crosslinked gels (40 gels) at different shear rates and
room temperature. All samples show the same shear thinning behavior. At this
concentration the hydrophobic effect of the B30 graft is more evident in that this sample
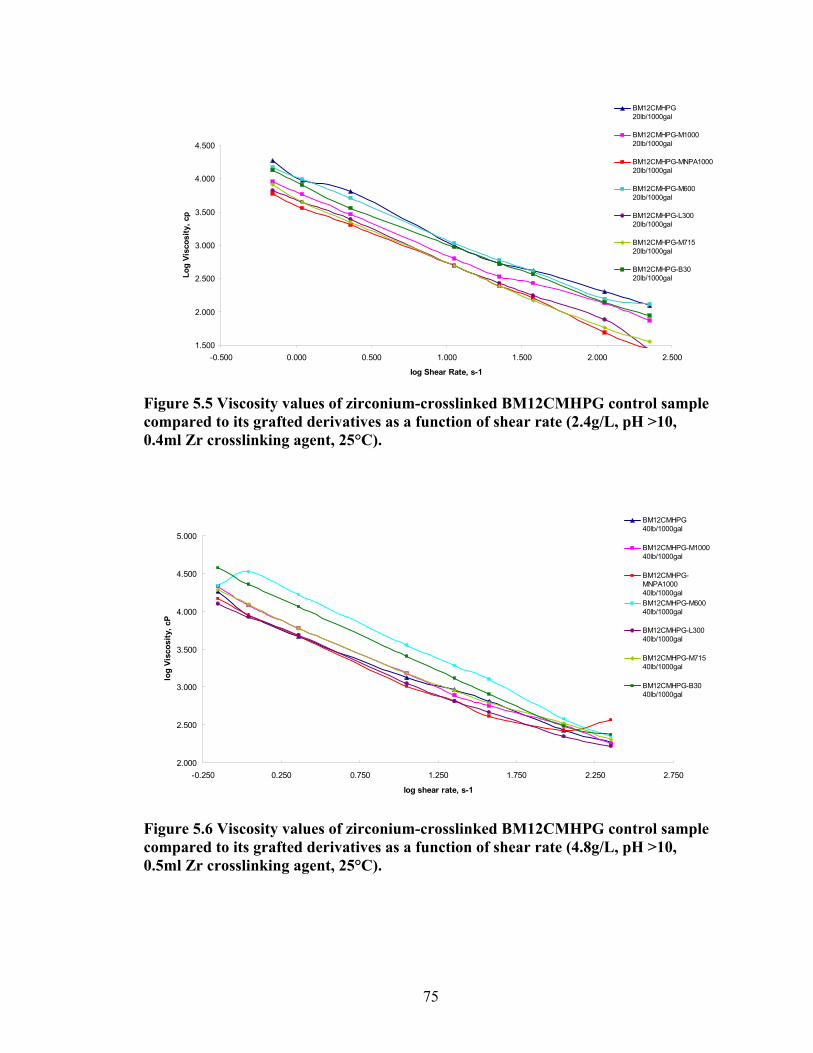
75
1.500
2.000
2.500
3.000
3.500
4.000
4.500
-0.500 0.000 0.500 1.000 1.500 2.000 2.500
log Shear Rate, s-1
Log
Visc
osity
, cp
BM12CMHPG20lb/1000gal
BM12CMHPG-M1000 20lb/1000gal
BM12CMHPG-MNPA100020lb/1000gal
BM12CMHPG-M60020lb/1000gal
BM12CMHPG-L30020lb/1000gal
BM12CMHPG-M71520lb/1000gal
BM12CMHPG-B30 20lb/1000gal
Figure 5.5 Viscosity values of zirconium-crosslinked BM12CMHPG control sample compared to its grafted derivatives as a function of shear rate (2.4g/L, pH >10, 0.4ml Zr crosslinking agent, 25°C).
2.000
2.500
3.000
3.500
4.000
4.500
5.000
-0.250 0.250 0.750 1.250 1.750 2.250 2.750
log shear rate, s-1
log
Visc
osity
, cP
BM12CMHPG40lb/1000gal
BM12CMHPG-M100040lb/1000gal
BM12CMHPG-MNPA100040lb/1000gal BM12CMHPG-M60040lb/1000gal
BM12CMHPG-L30040lb/1000gal
BM12CMHPG-M71540lb/1000gal
BM12CMHPG-B30 40lb/1000gal
Figure 5.6 Viscosity values of zirconium-crosslinked BM12CMHPG control sample compared to its grafted derivatives as a function of shear rate (4.8g/L, pH >10, 0.5ml Zr crosslinking agent, 25°C).
76
exhibited a high viscosity than the control sample. However, the highest viscosities were
obtained with a sample modified with a higher molecular weight hydrophobic graft,
M600.
Table 5.3 compiles the average viscosities of the crosslinked 20 gel of the
BM12CMHPG control sample and its derivatives at continuous shear rate of 37.7s-1. At
this polymer concentration three samples did not gel. They continued to behave as non
crosslinked fluids after addition of the zirconium catalyst, so the table contains the entry,
not determined (ND). It is very important to note that this concentration of these samples
lies on the border of the Ccc for unmodified CMHPG38. The samples modified with
M715, MNPA1000, and L300 grafts appear to have higher Ccc’s and thus will not
crosslink at the concentration studied. The hydrophobic grafted samples, M600 and B30
exhibited gel viscosities and gel stabilities comparable to the control sample at this
concentration.
Table 5.4 shows the average viscosity of the 40 gel of the crosslinked
BM12CMHPG control and its grafted samples at shear rate of 37.7s-1. At this
concentration all of the samples gelled. We observed two groups of samples according to
their average viscosity after heating at 65°C and 90°C. The control, M1000, and L300
derivatives had initial viscosity at room temperature (RT) of around 650, 560, and 470
cP, respectively. These viscosities of each of these samples dropped within the 65°C
period and did not recover during the 90°C period. The second group includes all the
hydrophobic grafts, i.e. M600, MNPA1000, and B30 samples, and a hydrophilic graft the
M715. These derivatives showed higher initial viscosities at RT than the control sample
and retained these higher viscosities during both of the heating exposures.
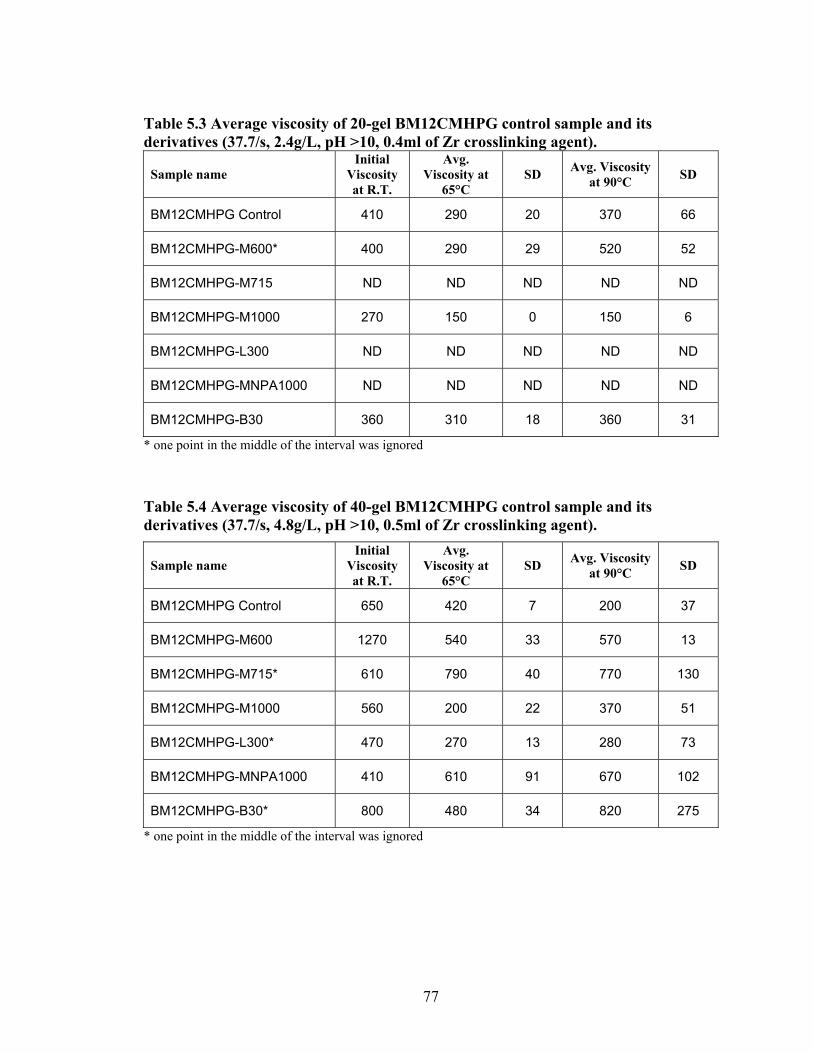
77
Table 5.3 Average viscosity of 20-gel BM12CMHPG control sample and its derivatives (37.7/s, 2.4g/L, pH >10, 0.4ml of Zr crosslinking agent).
Sample name Initial
Viscosity at R.T.
Avg. Viscosity at
65°C SD Avg. Viscosity
at 90°C SD
BM12CMHPG Control 410 290 20 370 66
BM12CMHPG-M600* 400 290 29 520 52
BM12CMHPG-M715 ND ND ND ND ND
BM12CMHPG-M1000 270 150 0 150 6
BM12CMHPG-L300 ND ND ND ND ND
BM12CMHPG-MNPA1000 ND ND ND ND ND
BM12CMHPG-B30 360 310 18 360 31
* one point in the middle of the interval was ignored
Table 5.4 Average viscosity of 40-gel BM12CMHPG control sample and its derivatives (37.7/s, 4.8g/L, pH >10, 0.5ml of Zr crosslinking agent).
Sample name Initial
Viscosity at R.T.
Avg. Viscosity at
65°C SD Avg. Viscosity
at 90°C SD
BM12CMHPG Control 650 420 7 200 37
BM12CMHPG-M600 1270 540 33 570 13
BM12CMHPG-M715* 610 790 40 770 130
BM12CMHPG-M1000 560 200 22 370 51
BM12CMHPG-L300* 470 270 13 280 73
BM12CMHPG-MNPA1000 410 610 91 670 102
BM12CMHPG-B30* 800 480 34 820 275
* one point in the middle of the interval was ignored
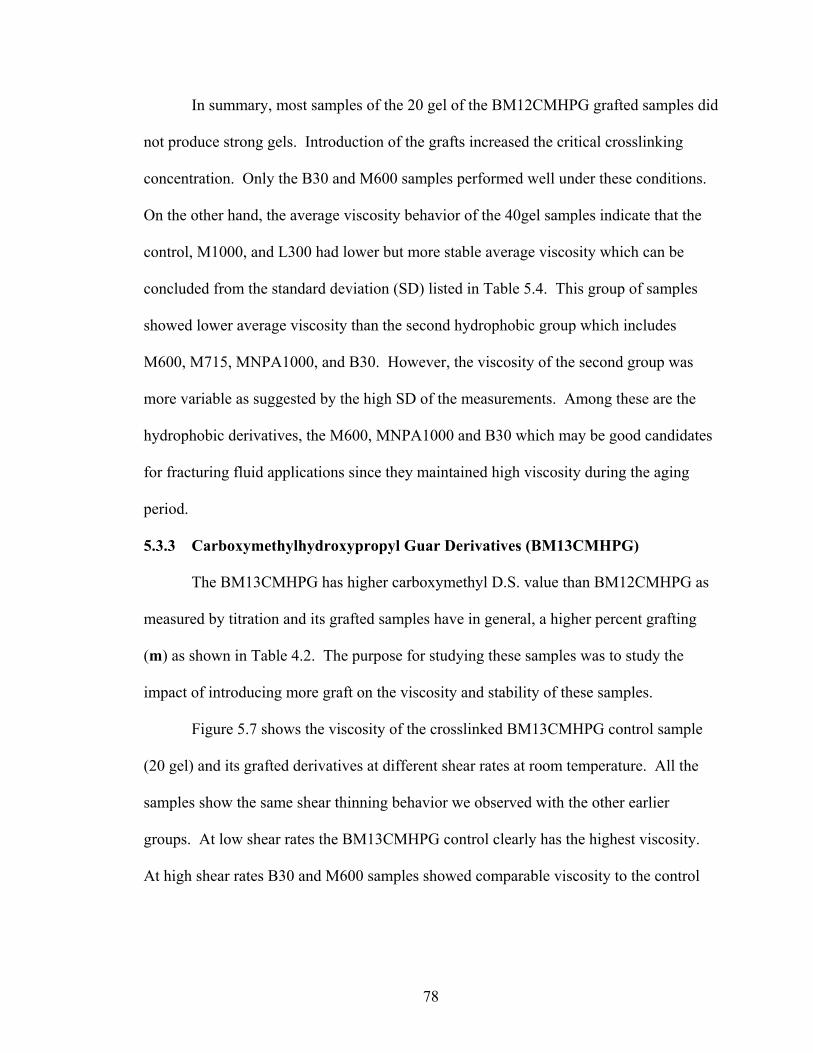
78
In summary, most samples of the 20 gel of the BM12CMHPG grafted samples did
not produce strong gels. Introduction of the grafts increased the critical crosslinking
concentration. Only the B30 and M600 samples performed well under these conditions.
On the other hand, the average viscosity behavior of the 40gel samples indicate that the
control, M1000, and L300 had lower but more stable average viscosity which can be
concluded from the standard deviation (SD) listed in Table 5.4. This group of samples
showed lower average viscosity than the second hydrophobic group which includes
M600, M715, MNPA1000, and B30. However, the viscosity of the second group was
more variable as suggested by the high SD of the measurements. Among these are the
hydrophobic derivatives, the M600, MNPA1000 and B30 which may be good candidates
for fracturing fluid applications since they maintained high viscosity during the aging
period.
5.3.3 Carboxymethylhydroxypropyl Guar Derivatives (BM13CMHPG)
The BM13CMHPG has higher carboxymethyl D.S. value than BM12CMHPG as
measured by titration and its grafted samples have in general, a higher percent grafting
(m) as shown in Table 4.2. The purpose for studying these samples was to study the
impact of introducing more graft on the viscosity and stability of these samples.
Figure 5.7 shows the viscosity of the crosslinked BM13CMHPG control sample
(20 gel) and its grafted derivatives at different shear rates at room temperature. All the
samples show the same shear thinning behavior we observed with the other earlier
groups. At low shear rates the BM13CMHPG control clearly has the highest viscosity.
At high shear rates B30 and M600 samples showed comparable viscosity to the control
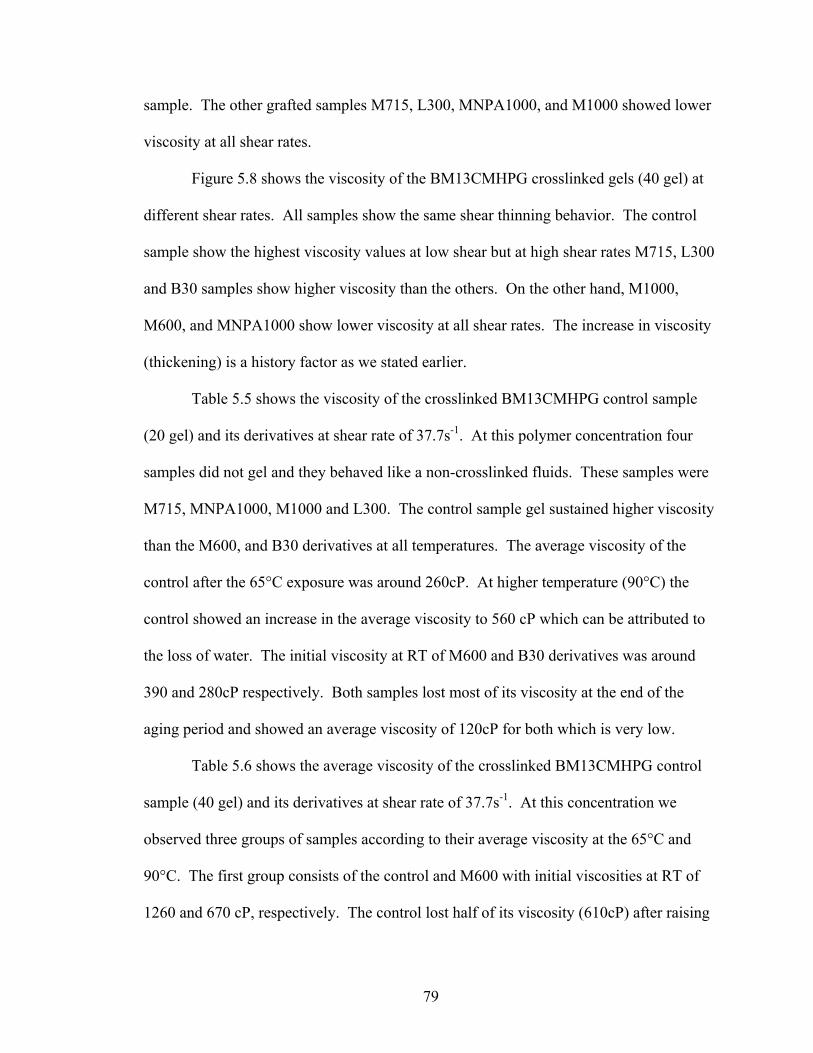
79
sample. The other grafted samples M715, L300, MNPA1000, and M1000 showed lower
viscosity at all shear rates.
Figure 5.8 shows the viscosity of the BM13CMHPG crosslinked gels (40 gel) at
different shear rates. All samples show the same shear thinning behavior. The control
sample show the highest viscosity values at low shear but at high shear rates M715, L300
and B30 samples show higher viscosity than the others. On the other hand, M1000,
M600, and MNPA1000 show lower viscosity at all shear rates. The increase in viscosity
(thickening) is a history factor as we stated earlier.
Table 5.5 shows the viscosity of the crosslinked BM13CMHPG control sample
(20 gel) and its derivatives at shear rate of 37.7s-1. At this polymer concentration four
samples did not gel and they behaved like a non-crosslinked fluids. These samples were
M715, MNPA1000, M1000 and L300. The control sample gel sustained higher viscosity
than the M600, and B30 derivatives at all temperatures. The average viscosity of the
control after the 65°C exposure was around 260cP. At higher temperature (90°C) the
control showed an increase in the average viscosity to 560 cP which can be attributed to
the loss of water. The initial viscosity at RT of M600 and B30 derivatives was around
390 and 280cP respectively. Both samples lost most of its viscosity at the end of the
aging period and showed an average viscosity of 120cP for both which is very low.
Table 5.6 shows the average viscosity of the crosslinked BM13CMHPG control
sample (40 gel) and its derivatives at shear rate of 37.7s-1. At this concentration we
observed three groups of samples according to their average viscosity at the 65°C and
90°C. The first group consists of the control and M600 with initial viscosities at RT of
1260 and 670 cP, respectively. The control lost half of its viscosity (610cP) after raising
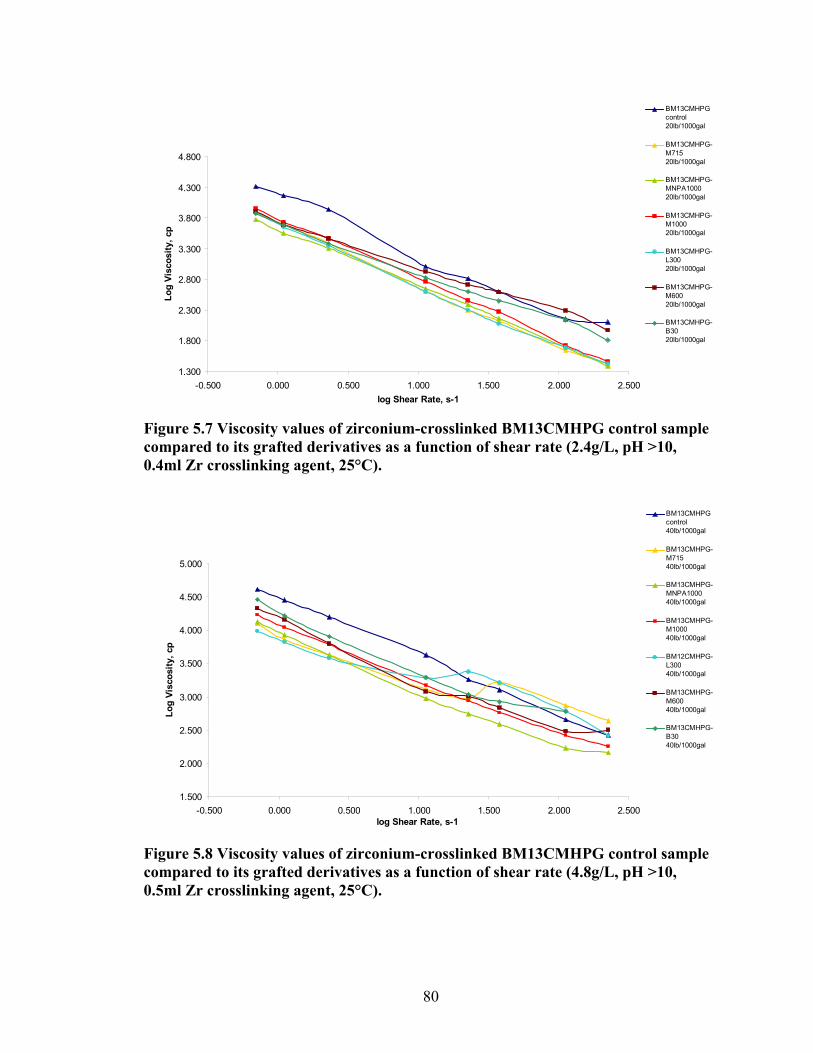
80
1.300
1.800
2.300
2.800
3.300
3.800
4.300
4.800
-0.500 0.000 0.500 1.000 1.500 2.000 2.500log Shear Rate, s-1
Log
Visc
osity
, cp
BM13CMHPGcontrol 20lb/1000gal
BM13CMHPG-M715 20lb/1000gal
BM13CMHPG-MNPA100020lb/1000gal
BM13CMHPG-M100020lb/1000gal
BM13CMHPG-L30020lb/1000gal
BM13CMHPG-M60020lb/1000gal
BM13CMHPG-B3020lb/1000gal
Figure 5.7 Viscosity values of zirconium-crosslinked BM13CMHPG control sample compared to its grafted derivatives as a function of shear rate (2.4g/L, pH >10, 0.4ml Zr crosslinking agent, 25°C).
1.500
2.000
2.500
3.000
3.500
4.000
4.500
5.000
-0.500 0.000 0.500 1.000 1.500 2.000 2.500log Shear Rate, s-1
Log
Visc
osity
, cp
BM13CMHPGcontrol 40lb/1000gal
BM13CMHPG-M715 40lb/1000gal
BM13CMHPG-MNPA100040lb/1000gal
BM13CMHPG-M100040lb/1000gal
BM12CMHPG-L30040lb/1000gal
BM13CMHPG-M60040lb/1000gal
BM13CMHPG-B3040lb/1000gal
Figure 5.8 Viscosity values of zirconium-crosslinked BM13CMHPG control sample compared to its grafted derivatives as a function of shear rate (4.8g/L, pH >10, 0.5ml Zr crosslinking agent, 25°C).
81
Table 5.5 Average viscosity of 20-gel BM13CMHPG control sample and its derivatives (37.7/s, 2.4g/L, pH >10, 0.4ml of Zr crosslinking agent).
Sample name Initial
Viscosity at R.T.
Avg. Viscosity at
65°C SD
Avg. Viscosity at
90°C SD
BM13CMHPG Control 400 260 10 560 86
BM13CMHPG-M600 390 130 13 120 0
BM13CMHPG-M715 ND ND ND ND ND
BM13CMHPG-M1000 ND ND ND ND ND
BM13CMHPG-L300 ND ND ND ND ND
BM13CMHPG-MNPA1000 ND ND ND ND ND
BM13CMHPG-B30 280 180 45 120 0
Table 5.6 Average viscosity of 40-gel BM13CMHPG control sample and its derivatives (37.7/s, 4.8g/L, pH >10, 0.5ml of Zr crosslinking agent).
Sample name Initial
Viscosity at R.T.
Avg. Viscosity at
65°C SD
Avg. Viscosity at
90°C SD
BM13CMHPG Control 1260 610 30 920 38
BM13CMHPG-M600 670 730 60 1210 208
BM13CMHPG-M715 1600 230 18 260 38
BM13CMHPG-M1000 570 370 60 520 98
BM13CMHPG-L300 1630 250 0 310 45
BM13CMHPG-MNPA1000 390 430 20 250 38
BM13CMHPG-B30 840 440 13 520 58
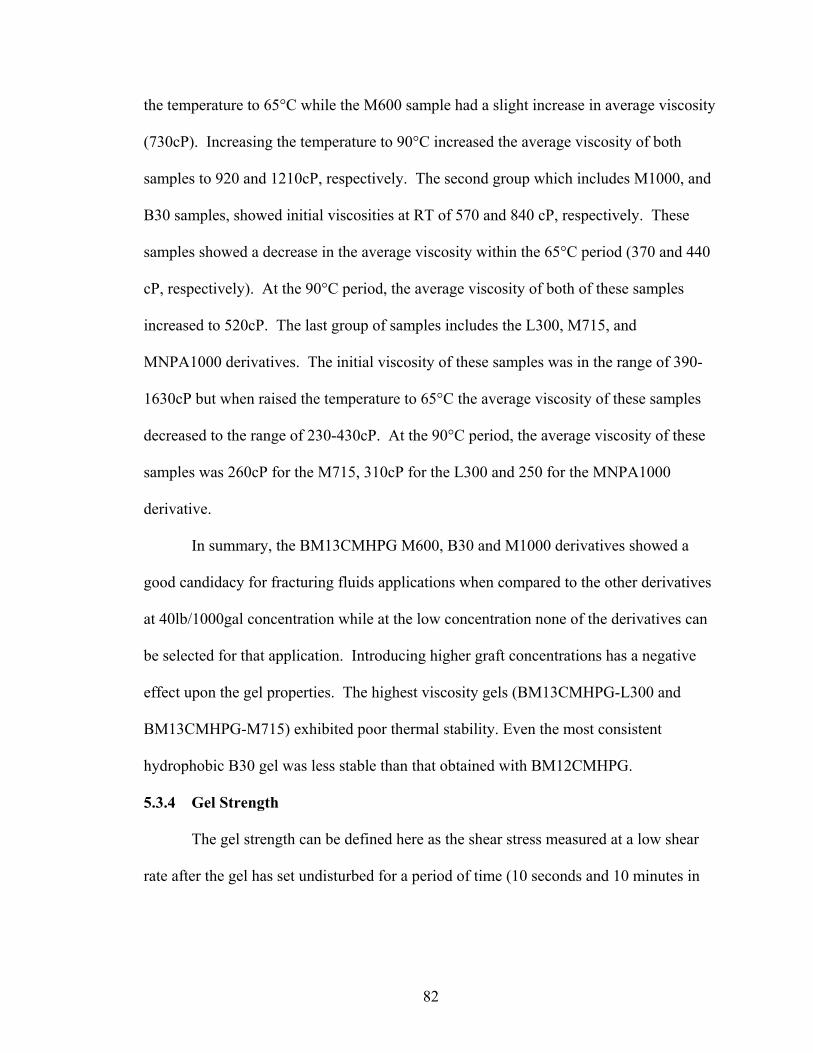
82
the temperature to 65°C while the M600 sample had a slight increase in average viscosity
(730cP). Increasing the temperature to 90°C increased the average viscosity of both
samples to 920 and 1210cP, respectively. The second group which includes M1000, and
B30 samples, showed initial viscosities at RT of 570 and 840 cP, respectively. These
samples showed a decrease in the average viscosity within the 65°C period (370 and 440
cP, respectively). At the 90°C period, the average viscosity of both of these samples
increased to 520cP. The last group of samples includes the L300, M715, and
MNPA1000 derivatives. The initial viscosity of these samples was in the range of 390-
1630cP but when raised the temperature to 65°C the average viscosity of these samples
decreased to the range of 230-430cP. At the 90°C period, the average viscosity of these
samples was 260cP for the M715, 310cP for the L300 and 250 for the MNPA1000
derivative.
In summary, the BM13CMHPG M600, B30 and M1000 derivatives showed a
good candidacy for fracturing fluids applications when compared to the other derivatives
at 40lb/1000gal concentration while at the low concentration none of the derivatives can
be selected for that application. Introducing higher graft concentrations has a negative
effect upon the gel properties. The highest viscosity gels (BM13CMHPG-L300 and
BM13CMHPG-M715) exhibited poor thermal stability. Even the most consistent
hydrophobic B30 gel was less stable than that obtained with BM12CMHPG.
5.3.4 Gel Strength
The gel strength can be defined here as the shear stress measured at a low shear
rate after the gel has set undisturbed for a period of time (10 seconds and 10 minutes in
83
Figure 5.9 Rigid structure of BMCMGGW45-B30 derivative (40lb/1000gal, pH 10.3) crosslinked with 0.5 ml zirconium crosslinking agent.
the standard API procedure). This property is a non-Newtonian rheological parameter
that is used by the oil industry to measure some of the process requirements.39 For
example, a high gel strength may require an excessively high pump pressure to restart an
interrupted flow if something happens during the fracturing process. However, high gel
strength materials may allow us to use less polymer material to achieve a recommended
gel strength. Figure 5.9 show the rigid structure of a BMCMGGW-45-B30 derivative
after crosslinking with the zirconium lactate at high pH. Figures 5.10 to 5.21 show the
gel strengths recorded for the gels described above at room temperature (RT) prior to and
after the end of the 90°C aging period. The gel strength after a short relaxation time is
listed as the 10-seconds gel; the longer relaxation time is designated as 10-minutes gel.
Figure 5.10 to Figure 5.13 show that some of the BMCMGW-45 derivatives
possessed measurable and comparable gel strength to the control sample. For example, at
room temperature and 20lb/1000gal concentration the M1000 and B30 exhibit gel
strength very close to that of the control sample. However, at the end of the 90°C aging
84
period, the gel strength of the grafted samples was very low while the control sample
displayed an increase in the gel strength. The high increase in gel strength for the control
sample may be caused by the phase separation of the water from the gel. This phase
separation was observed in the stock solution of the control sample, which was standing
without agitation in the beaker during the period required to perform the test. We think
that this may also happen when the gel was left in the viscometer heating cup at high
temperature for the 10 seconds or 10 minutes waiting period before performing the test.
If that were true, then the increase in gel strength is caused by the concentrated gel
network left between the bob and the rotor.
At the higher 40 gel concentration (Figure 5.12), the derivatives, M1000,
MNPA1000, L300 and B30 possessed comparable gel strengths to the control sample at
room temperature. On the other hand, at the end of the 90°C aging period the
hydrophobic derivative, M600, exhibited higher high temperature gel strength than the
control sample. L300 and B30 grafted derivatives possessed comparable gel strength to
the control sample. All samples had lower gel strength at the end of the aging test except
for the 20 gel of the control (BMCMGGW-45) and the 40 gel of M600 samples.
Figures 5.14 to 5.15 show that only the M600 and B30 grafted BM12CMHPG
derivatives possessed comparable gel strengths to the control sample at the 20 gel
concentration. However, at the end of the 90°C aging period the hydrophobic M600
sample displayed much higher gel strength than the control sample. The gel strength of
M715, MNPA1000, and L300 samples was not measured because these samples did not
gel.
85
The 40 gel samples at room temperature (Figure 5.16) had similar gel strengths to
the control sample with the exception of the M600 and B30 hydrophobic derivatives
which possessed higher gel strength than the control sample. At the end of the 90°C
testing period (Figure 5.17), the M600 and B30 grafted samples retained much higher gel
strength than the control sample. The relative hydrophobicity of the grafts does not
appear to play a role in the process; the hydrophilic M715 derivative exhibited a similar
performance to those of the hydrophobic M600 and B30 derivatives, however, the
hydrophobic grafts exhibit the highest gel strength.
All the tested 20lb/1000gal samples showed a gel strength increase at the end of
the aging period. The increase of the gel strength can be attributed to the loss of solvent
(water) from the system. At the higher concentration, the increase in the gel strength
was mostly associated with the hydrophobic grafts. The control, M1000, and L300
samples showed decrease in gel strength. However, the M600, B30, MNPA1000
(hydrophobic) and M715 (hydrophilic) samples showed increase in gel strengths. All of
the samples should have lost a similar volume of solvent so other factors are impacting
the gel strength.
Figure 5.18 to Figure 5.21 show that some of the BM13CMHPG derivatives
possessed measurable and comparable gel strength to the control sample at high
concentration only (40lb/1000gal). At 20lb/1000gal none of the samples of this group
had comparable gel strength to the control sample and most of them failed to form useful
gels. At room temperature and higher concentration (40lb/1000gal), all the grafted
samples had lower gel strength when compared to the control sample except the B30
derivative. At the end of the 90°C period the M600 grafted derivative possessed similar
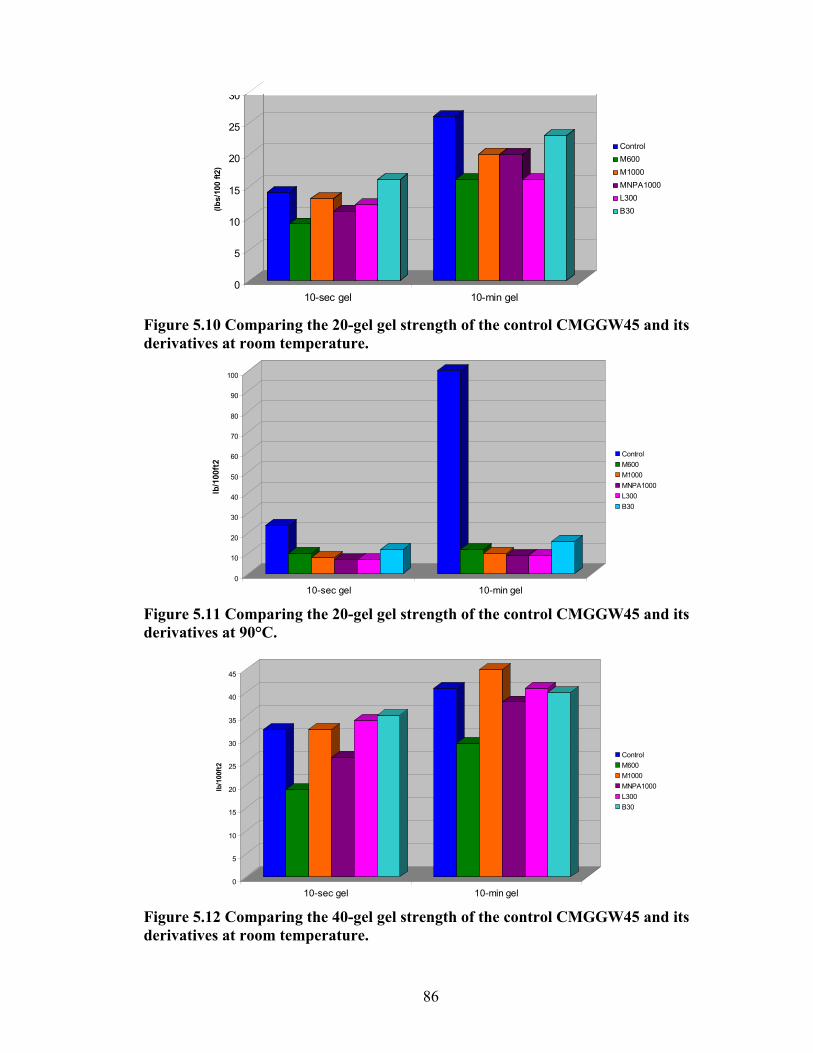
86
0
5
10
15
20
25
30
(lbs/
100
ft2)
10-sec gel 10-min gel
Control M600 M1000 MNPA1000L300B30
Figure 5.10 Comparing the 20-gel gel strength of the control CMGGW45 and its derivatives at room temperature.
0
10
20
30
40
50
60
70
80
90
100
lb/1
00ft
2
10-sec gel 10-min gel
Control M600 M1000 MNPA1000L300B30
Figure 5.11 Comparing the 20-gel gel strength of the control CMGGW45 and its derivatives at 90°C.
0
5
10
15
20
25
30
35
40
45
lb/1
00ft
2
10-sec gel 10-min gel
Control M600 M1000 MNPA1000L300B30
Figure 5.12 Comparing the 40-gel gel strength of the control CMGGW45 and its derivatives at room temperature.
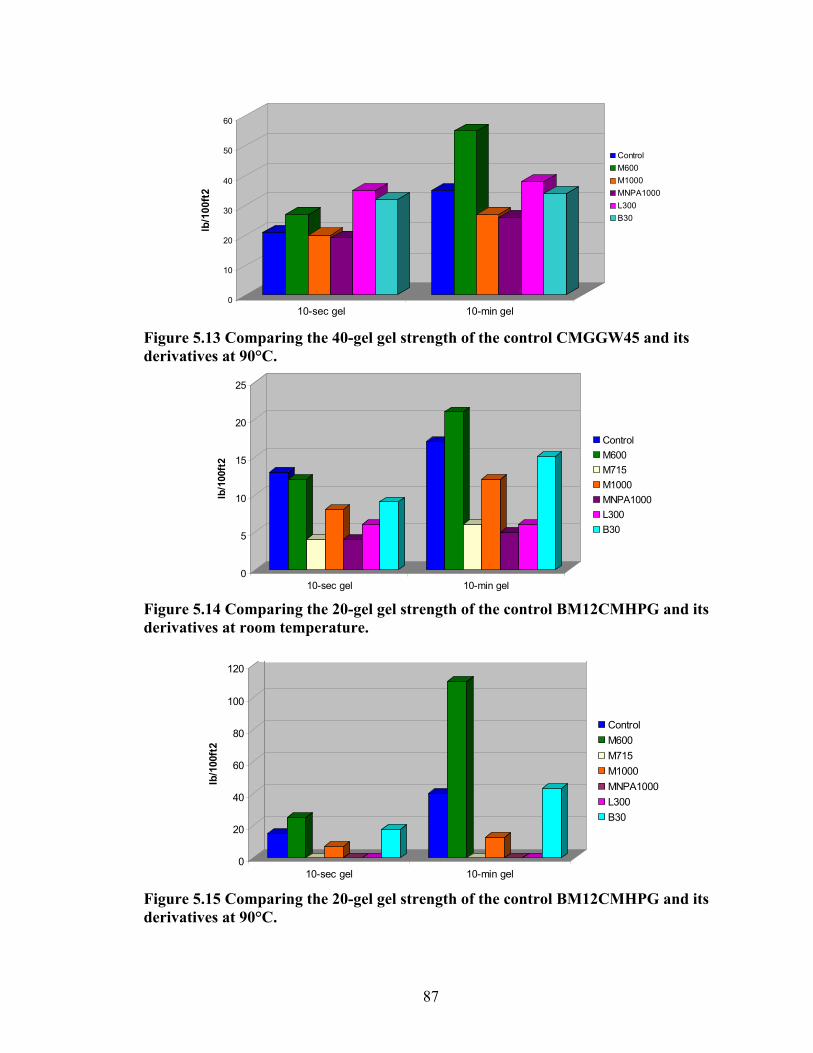
87
0
10
20
30
40
50
60
lb/1
00ft
2
10-sec gel 10-min gel
Control M600 M1000 MNPA1000L300B30
Figure 5.13 Comparing the 40-gel gel strength of the control CMGGW45 and its derivatives at 90°C.
0
5
10
15
20
25
lb/1
00ft
2
10-sec gel 10-min gel
Control M600 M715M1000 MNPA1000L300B30
Figure 5.14 Comparing the 20-gel gel strength of the control BM12CMHPG and its derivatives at room temperature.
0
20
40
60
80
100
120
lb/1
00ft
2
10-sec gel 10-min gel
Control M600 M715M1000 MNPA1000L300B30
Figure 5.15 Comparing the 20-gel gel strength of the control BM12CMHPG and its derivatives at 90°C.
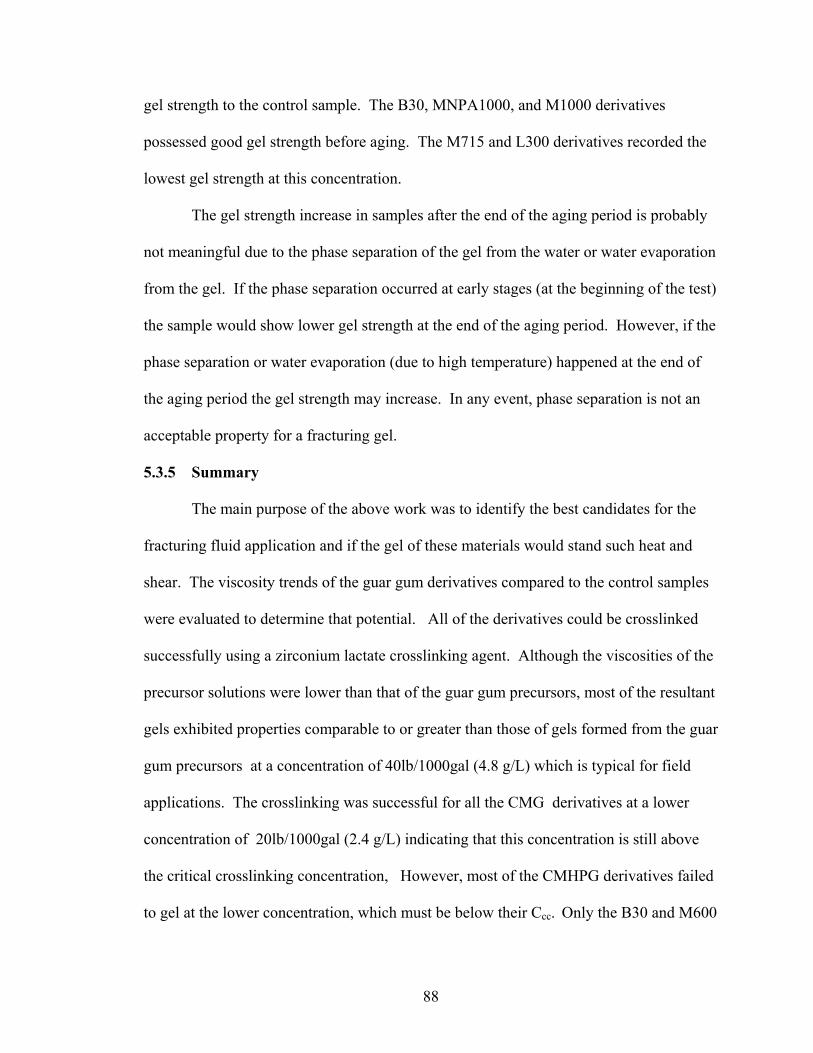
88
gel strength to the control sample. The B30, MNPA1000, and M1000 derivatives
possessed good gel strength before aging. The M715 and L300 derivatives recorded the
lowest gel strength at this concentration.
The gel strength increase in samples after the end of the aging period is probably
not meaningful due to the phase separation of the gel from the water or water evaporation
from the gel. If the phase separation occurred at early stages (at the beginning of the test)
the sample would show lower gel strength at the end of the aging period. However, if the
phase separation or water evaporation (due to high temperature) happened at the end of
the aging period the gel strength may increase. In any event, phase separation is not an
acceptable property for a fracturing gel.
5.3.5 Summary
The main purpose of the above work was to identify the best candidates for the
fracturing fluid application and if the gel of these materials would stand such heat and
shear. The viscosity trends of the guar gum derivatives compared to the control samples
were evaluated to determine that potential. All of the derivatives could be crosslinked
successfully using a zirconium lactate crosslinking agent. Although the viscosities of the
precursor solutions were lower than that of the guar gum precursors, most of the resultant
gels exhibited properties comparable to or greater than those of gels formed from the guar
gum precursors at a concentration of 40lb/1000gal (4.8 g/L) which is typical for field
applications. The crosslinking was successful for all the CMG derivatives at a lower
concentration of 20lb/1000gal (2.4 g/L) indicating that this concentration is still above
the critical crosslinking concentration, However, most of the CMHPG derivatives failed
to gel at the lower concentration, which must be below their Ccc. Only the B30 and M600
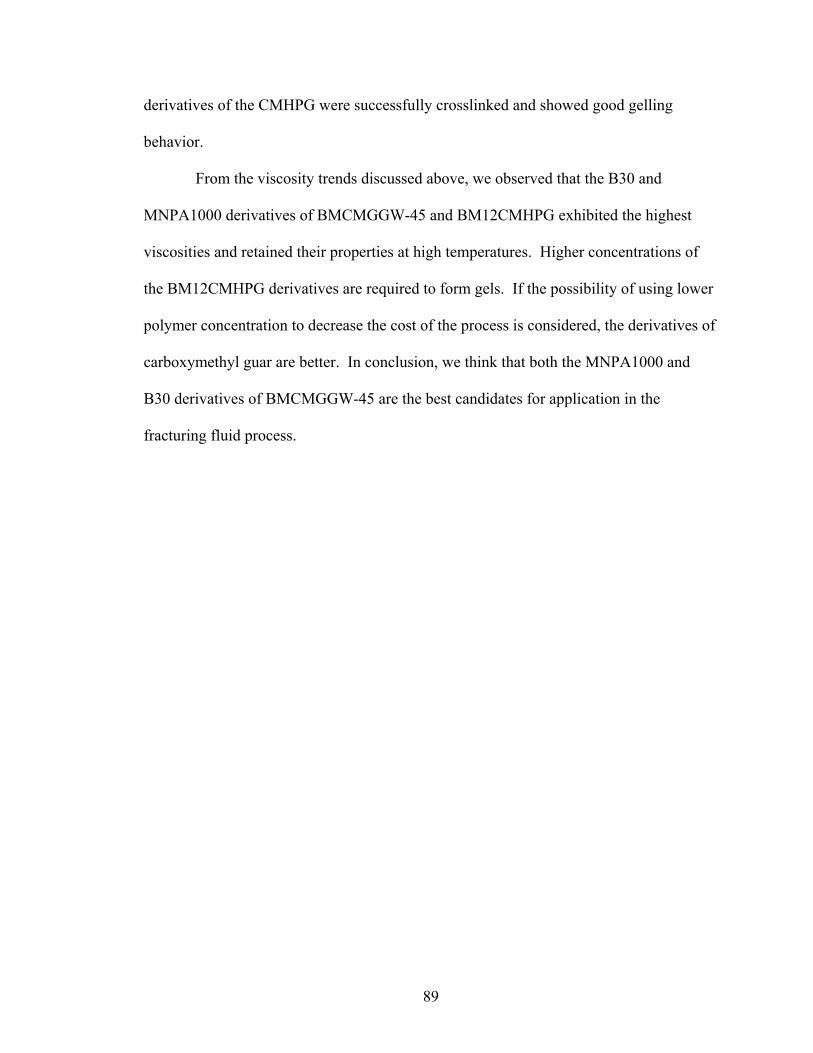
89
derivatives of the CMHPG were successfully crosslinked and showed good gelling
behavior.
From the viscosity trends discussed above, we observed that the B30 and
MNPA1000 derivatives of BMCMGGW-45 and BM12CMHPG exhibited the highest
viscosities and retained their properties at high temperatures. Higher concentrations of
the BM12CMHPG derivatives are required to form gels. If the possibility of using lower
polymer concentration to decrease the cost of the process is considered, the derivatives of
carboxymethyl guar are better. In conclusion, we think that both the MNPA1000 and
B30 derivatives of BMCMGGW-45 are the best candidates for application in the
fracturing fluid process.
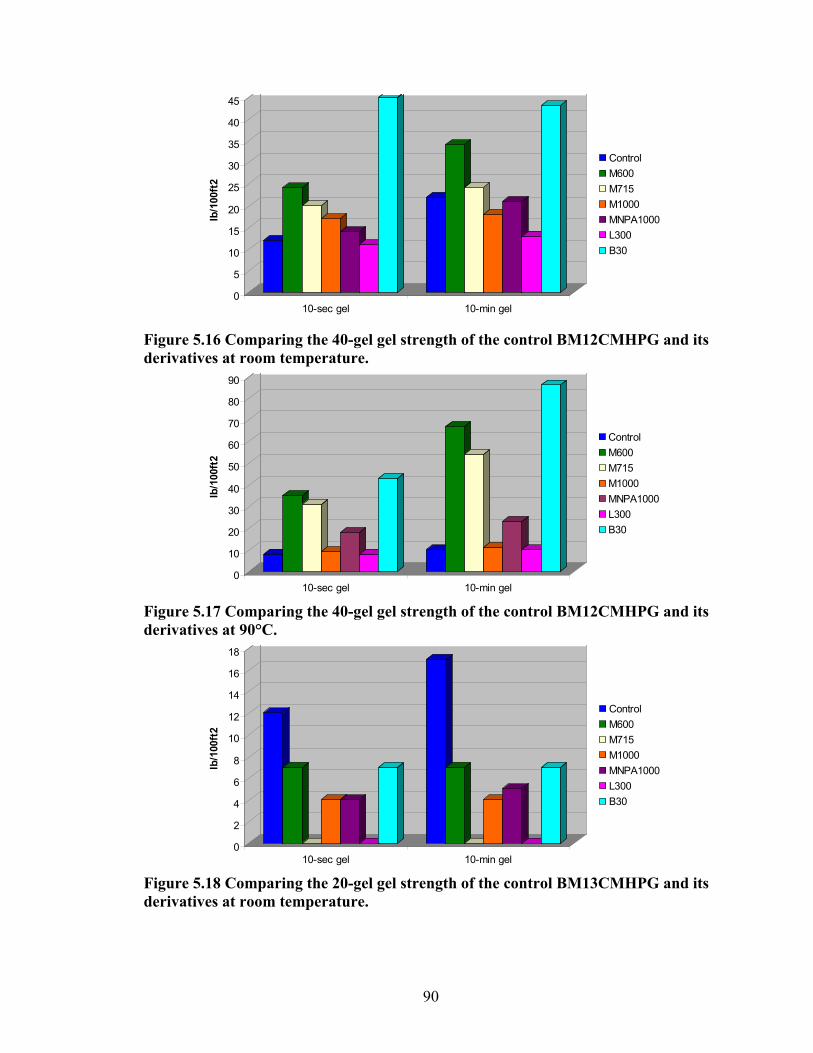
90
0
5
10
15
20
25
30
35
40
45
lb/1
00ft
2
10-sec gel 10-min gel
Control M600 M715M1000 MNPA1000L300B30
Figure 5.16 Comparing the 40-gel gel strength of the control BM12CMHPG and its derivatives at room temperature.
0
10
20
30
40
50
60
70
80
90
lb/1
00ft
2
10-sec gel 10-min gel
Control M600 M715M1000 MNPA1000L300B30
Figure 5.17 Comparing the 40-gel gel strength of the control BM12CMHPG and its derivatives at 90°C.
0
2
4
6
8
10
12
14
16
18
lb/1
00ft
2
10-sec gel 10-min gel
Control M600 M715M1000 MNPA1000L300B30
Figure 5.18 Comparing the 20-gel gel strength of the control BM13CMHPG and its derivatives at room temperature.
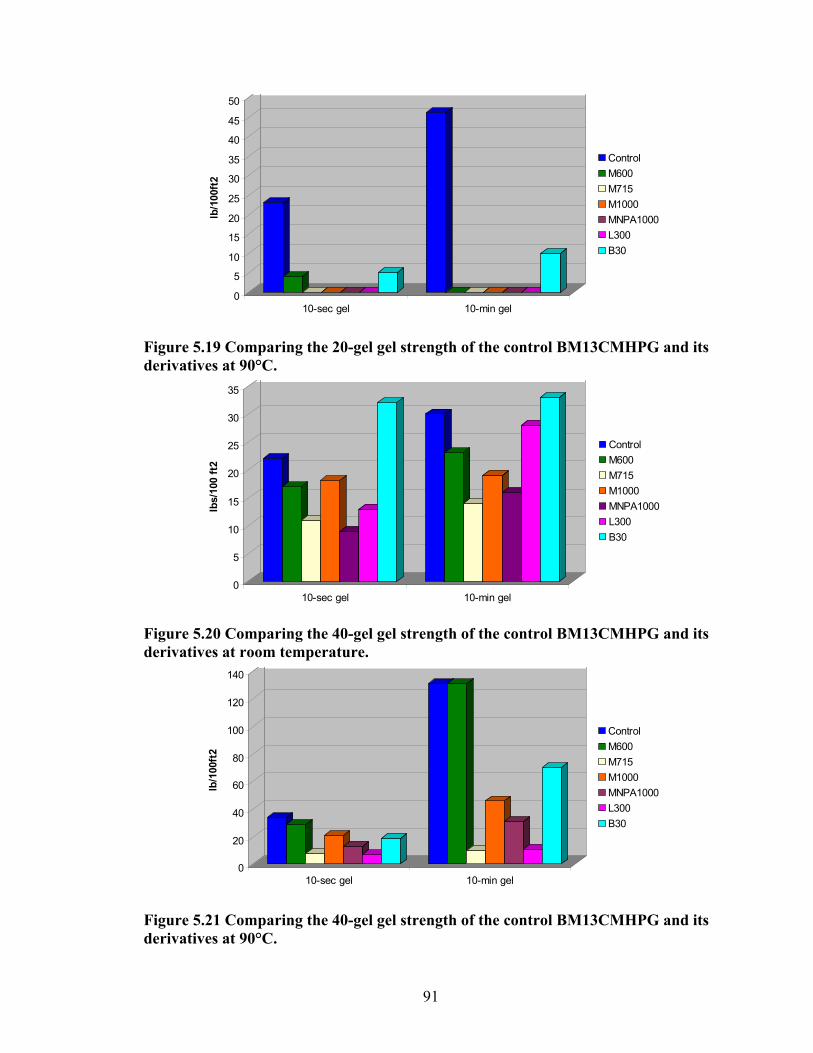
91
0
5
10
15
20
25
30
35
40
45
50
lb/1
00ft
2
10-sec gel 10-min gel
Control M600 M715M1000 MNPA1000L300B30
Figure 5.19 Comparing the 20-gel gel strength of the control BM13CMHPG and its derivatives at 90°C.
0
5
10
15
20
25
30
35
lbs/
100
ft2
10-sec gel 10-min gel
Control M600 M715M1000 MNPA1000L300B30
Figure 5.20 Comparing the 40-gel gel strength of the control BM13CMHPG and its derivatives at room temperature.
0
20
40
60
80
100
120
140
lb/1
00ft
2
10-sec gel 10-min gel
Control M600 M715M1000 MNPA1000L300B30
Figure 5.21 Comparing the 40-gel gel strength of the control BM13CMHPG and its derivatives at 90°C.
92
CHAPTER 6 GEL BREAKING 6.1 Introduction
In this chapter we are going to illustrate the effect of gel breakers on the
crosslinked gels of the grafted samples and compared the viscosities of some of the
resultant fluids with those of control fluids. The degraded samples were also extracted
with toluene to test the clean up process. It is very important to assure that what is placed
in the producing zones of the formation is easily removed or broken to small fragments
that are removed by a simple flow back process. It is advantageous if these fragments
are removed from the formation by either the water phase or by the organic phase (oil or
condensate) of the flowing well. As we mentioned earlier the grafts added to the guar
gum have different degree of hydrophobicity which may act differently and result in
fragments with different properties. The breaker used in this study is an enzyme based
breaker system which is most efficient at temperatures of 45-105°C and pH’s from 5 to 9.
6.2 Experimental Procedure
One percent samples were prepared from the control and the grafted samples.
Some of the samples were crosslinked using zirconium agent at low or high pH. After the
pH of the fluids were modified to around 5-9, 0.3 ml of the enzyme breaker was added
and the temperature was controlled between 55-60°C. After a reaction time of 2 hours,
the mixture was cooled to room temperature. To study the effectiveness of the break and
hydrophobicity of the fragments 15 to 25ml aliquots were extracted with an equal amount
of toluene. The samples were stirred using vortex stirrer and then left to phase separate.
The samples were examined carefully and photographed.
93
For selected group of samples the quantity of the broken fragments of graft in
each layer was measured by first separating the layers then evaporating the solvents. The
samples of interest were also analyzed by FT-IR and matrix assisted laser desorption/
ionization mass spectroscopy (MALDI-MS) to identify the components.
6.3 Results and Disscusion
Figure 6.1 show the BM12CMHPG control sample after being treated with the
enzyme and after extracted with the toluene. The tube in the left side shows a residue
(fogy layer) at the bottom which is not clear in the photo. This illustrates the degradation
of the polymer to small fragments. The fluid also lost its high viscosity after the
treatment. This fluid was crosslinked with zirconium crosslinking agent at low pH. The
viscosity recorded before the treatment was out of the range of the viscometer (higher
than 10000cP) at 20 RPM in the Brookfield viscometer while after the treatment the
viscosity recorded was 100cP at the same speed. The tube in right side shows at least
three layers. The top clear layer is part of the toluene layer, the fogy bottom layer is part
of the water layer and the interface layer which is in between the two layers. It is clear
that the affinity of the fragments is more likely to settle in the interface or in the water
layer. From the structure of the carboxymethylhydroxypropyl guar (CMHPG) it is
expected that these fragments will have some hydrophobicity character due to the
presence of the hydroxypropyl groups. Figure 6.2 and Figure 6.3 show the
BM13CMHPG and BMCMGGW-45 control samples treated with the enzyme breaker
and after extraction with toluene. Both figures show similar behavior to BM12CMHPG
sample.
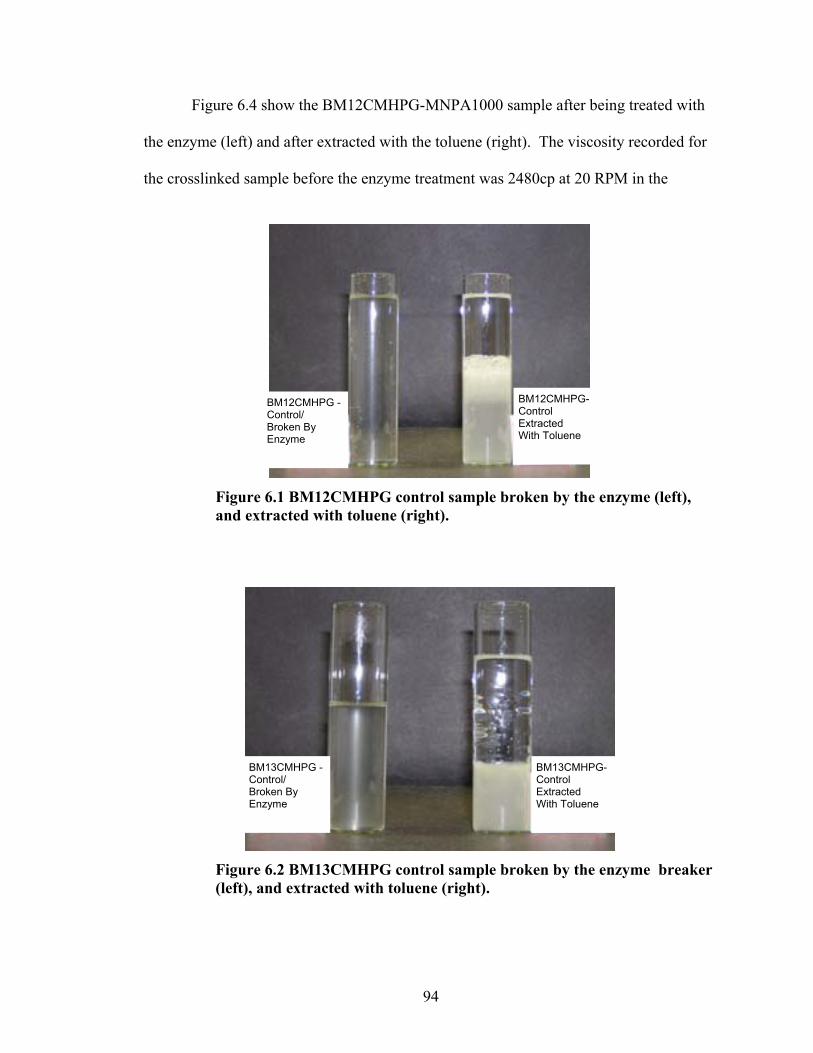
94
Figure 6.4 show the BM12CMHPG-MNPA1000 sample after being treated with
the enzyme (left) and after extracted with the toluene (right). The viscosity recorded for
the crosslinked sample before the enzyme treatment was 2480cp at 20 RPM in the
Figure 6.1 BM12CMHPG control sample broken by the enzyme (left), and extracted with toluene (right).
Figure 6.2 BM13CMHPG control sample broken by the enzyme breaker (left), and extracted with toluene (right).
BM12CMHPG -Control/ Broken By Enzyme
BM12CMHPG-Control Extracted With Toluene
BM13CMHPG -Control/ Broken By Enzyme
BM13CMHPG-Control Extracted With Toluene
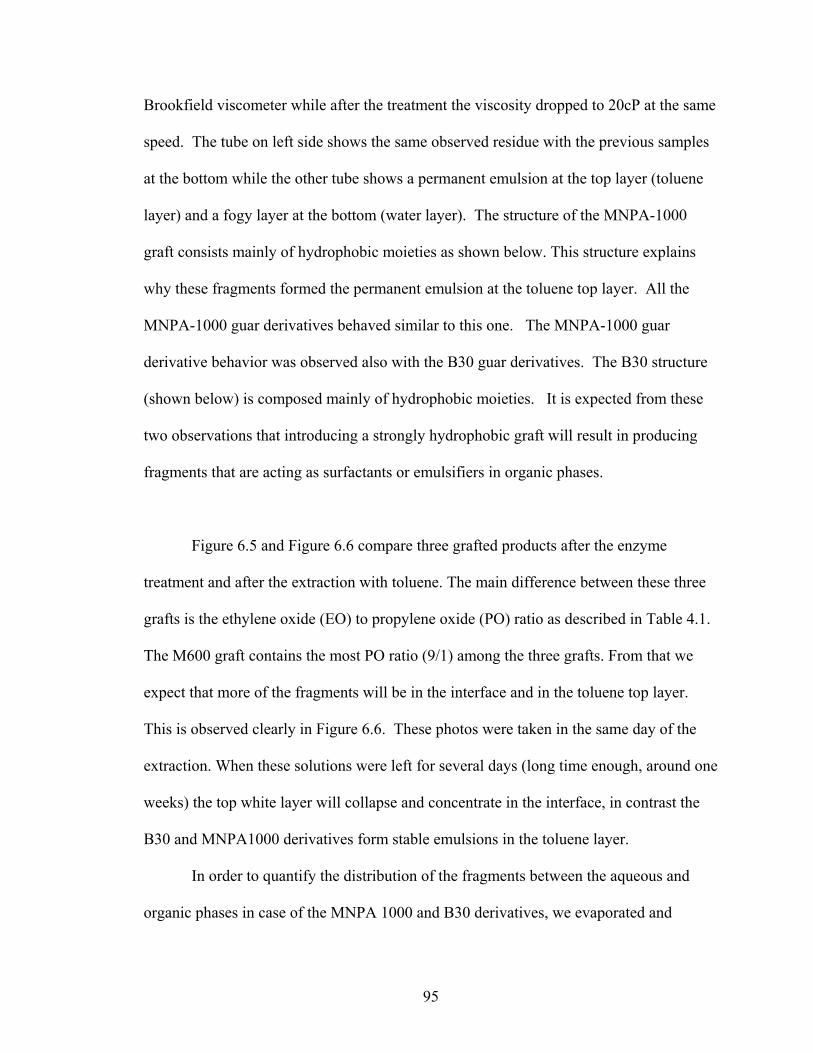
95
Brookfield viscometer while after the treatment the viscosity dropped to 20cP at the same
speed. The tube on left side shows the same observed residue with the previous samples
at the bottom while the other tube shows a permanent emulsion at the top layer (toluene
layer) and a fogy layer at the bottom (water layer). The structure of the MNPA-1000
graft consists mainly of hydrophobic moieties as shown below. This structure explains
why these fragments formed the permanent emulsion at the toluene top layer. All the
MNPA-1000 guar derivatives behaved similar to this one. The MNPA-1000 guar
derivative behavior was observed also with the B30 guar derivatives. The B30 structure
(shown below) is composed mainly of hydrophobic moieties. It is expected from these
two observations that introducing a strongly hydrophobic graft will result in producing
fragments that are acting as surfactants or emulsifiers in organic phases.
Figure 6.5 and Figure 6.6 compare three grafted products after the enzyme
treatment and after the extraction with toluene. The main difference between these three
grafts is the ethylene oxide (EO) to propylene oxide (PO) ratio as described in Table 4.1.
The M600 graft contains the most PO ratio (9/1) among the three grafts. From that we
expect that more of the fragments will be in the interface and in the toluene top layer.
This is observed clearly in Figure 6.6. These photos were taken in the same day of the
extraction. When these solutions were left for several days (long time enough, around one
weeks) the top white layer will collapse and concentrate in the interface, in contrast the
B30 and MNPA1000 derivatives form stable emulsions in the toluene layer.
In order to quantify the distribution of the fragments between the aqueous and
organic phases in case of the MNPA 1000 and B30 derivatives, we evaporated and
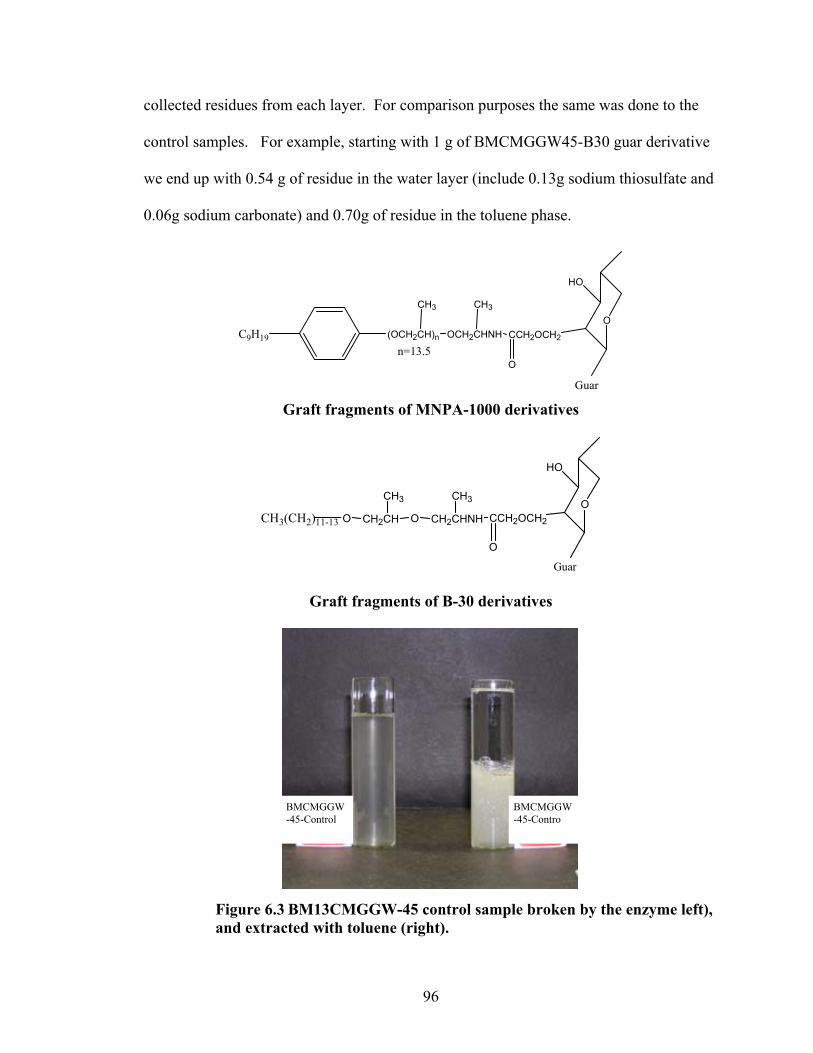
96
collected residues from each layer. For comparison purposes the same was done to the
control samples. For example, starting with 1 g of BMCMGGW45-B30 guar derivative
we end up with 0.54 g of residue in the water layer (include 0.13g sodium thiosulfate and
0.06g sodium carbonate) and 0.70g of residue in the toluene phase.
C9H19 (OCH2CH)n
CH3
OCH2CHNH
CH3
n=13.5
O
HO
CCH2OCH2
O
Guar
Graft fragments of MNPA-1000 derivatives
CH3(CH2)11-13 O CH2CH
CH3
O CH2CHNH
CH3 O
HO
CCH2OCH2
O
Guar
Graft fragments of B-30 derivatives
Figure 6.3 BM13CMGGW-45 control sample broken by the enzyme left), and extracted with toluene (right).
BMCMGGW -45-Control
BMCMGGW -45-Contro
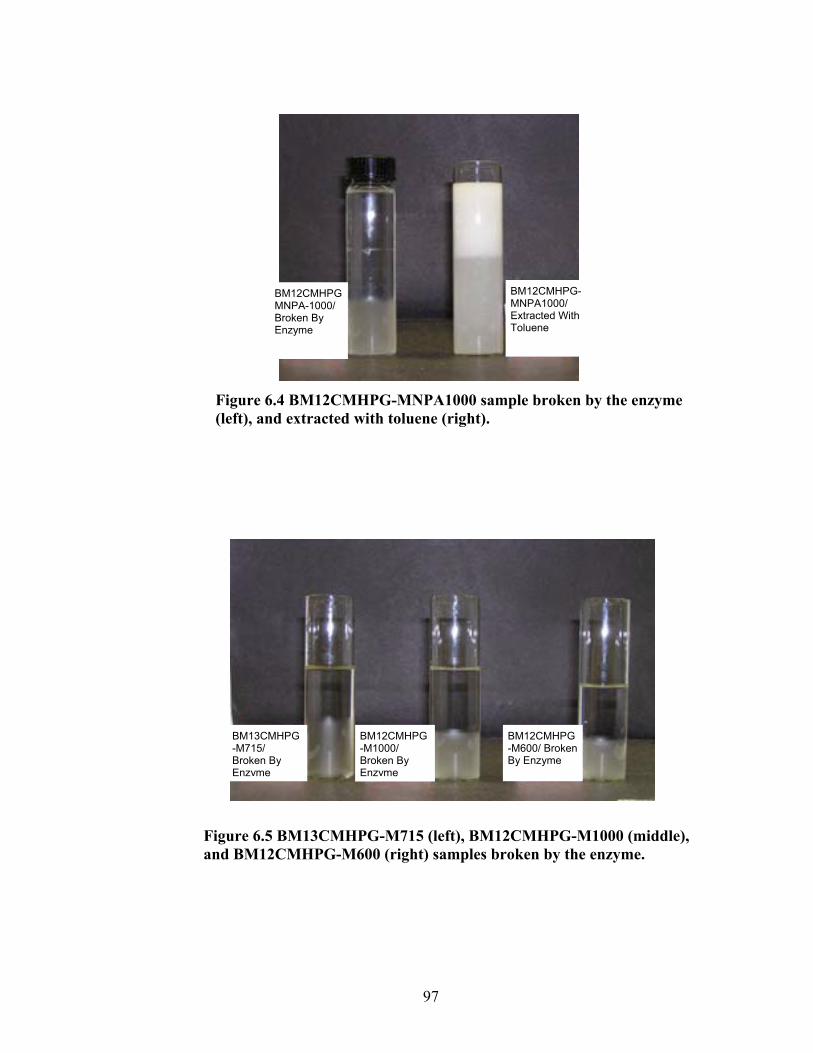
97
Figure 6.4 BM12CMHPG-MNPA1000 sample broken by the enzyme (left), and extracted with toluene (right).
Figure 6.5 BM13CMHPG-M715 (left), BM12CMHPG-M1000 (middle), and BM12CMHPG-M600 (right) samples broken by the enzyme.
BM12CMHPGMNPA-1000/ Broken By Enzyme
BM12CMHPG-MNPA1000/ Extracted With Toluene
BM13CMHPG-M715/ Broken By Enzyme
BM12CMHPG-M1000/ Broken By Enzyme
BM12CMHPG-M600/ Broken By Enzyme
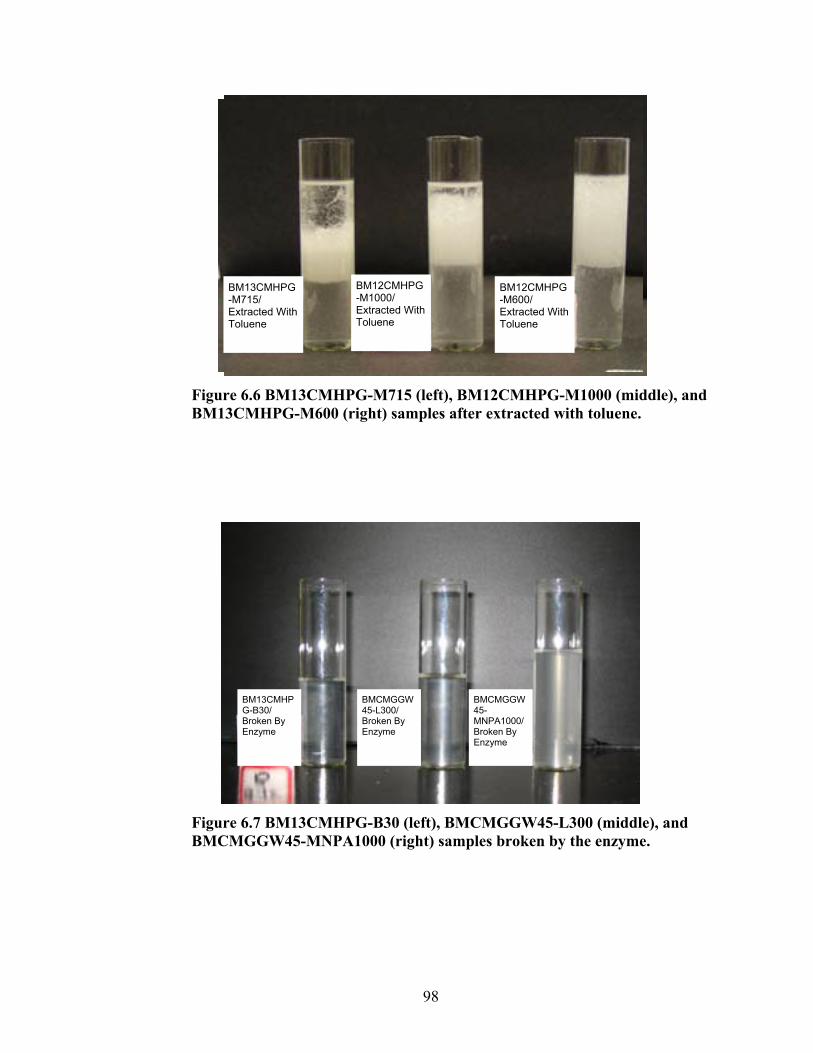
98
Figure 6.6 BM13CMHPG-M715 (left), BM12CMHPG-M1000 (middle), and BM13CMHPG-M600 (right) samples after extracted with toluene.
Figure 6.7 BM13CMHPG-B30 (left), BMCMGGW45-L300 (middle), and BMCMGGW45-MNPA1000 (right) samples broken by the enzyme.
BM13CMHPG-B30/ Broken By Enzyme
BMCMGGW45-L300/ Broken By Enzyme
BMCMGGW45-MNPA1000/ Broken By Enzyme
BM12CMHPG-M715/ Extracted With Toluene
BM13CMHPG-M1000/ Extracted With Toluene
BM13CMHPG-M600/ Extracted With Toluene
BM12CMHPG-M1000/ Extracted With Toluene
BM12CMHPG-M600/ Extracted With Toluene
BM13CMHPG-M715/ Extracted With Toluene
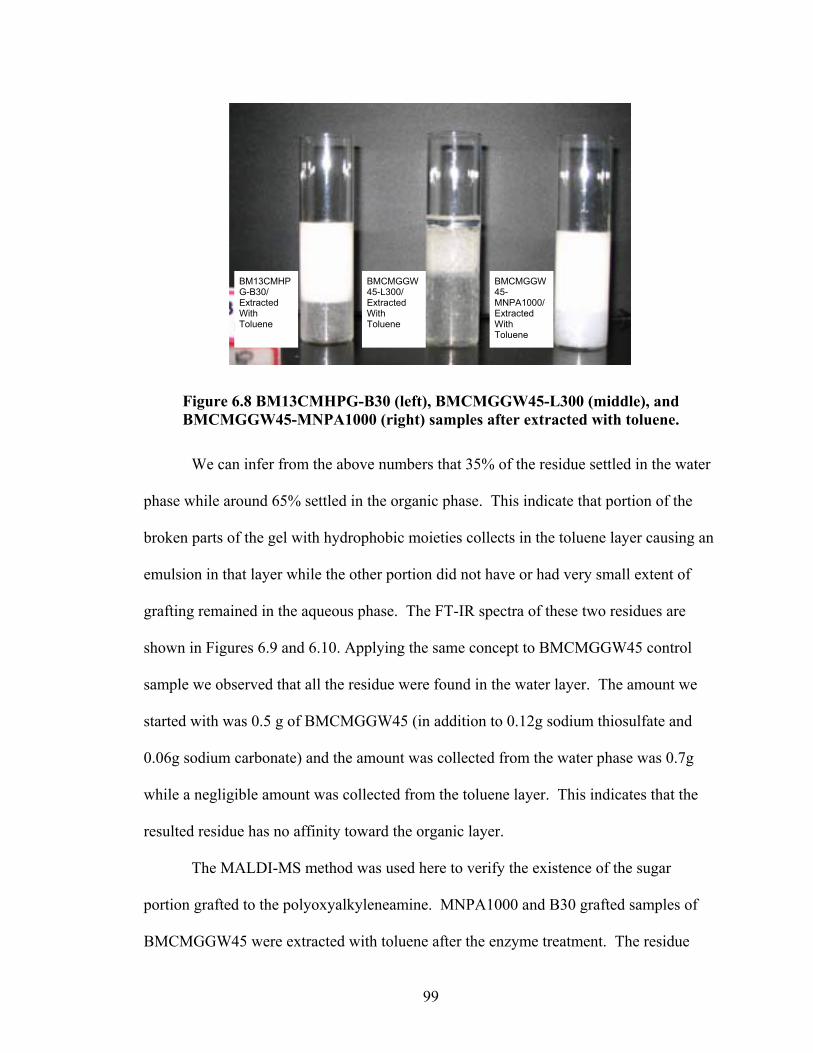
99
Figure 6.8 BM13CMHPG-B30 (left), BMCMGGW45-L300 (middle), and BMCMGGW45-MNPA1000 (right) samples after extracted with toluene.
We can infer from the above numbers that 35% of the residue settled in the water
phase while around 65% settled in the organic phase. This indicate that portion of the
broken parts of the gel with hydrophobic moieties collects in the toluene layer causing an
emulsion in that layer while the other portion did not have or had very small extent of
grafting remained in the aqueous phase. The FT-IR spectra of these two residues are
shown in Figures 6.9 and 6.10. Applying the same concept to BMCMGGW45 control
sample we observed that all the residue were found in the water layer. The amount we
started with was 0.5 g of BMCMGGW45 (in addition to 0.12g sodium thiosulfate and
0.06g sodium carbonate) and the amount was collected from the water phase was 0.7g
while a negligible amount was collected from the toluene layer. This indicates that the
resulted residue has no affinity toward the organic layer.
The MALDI-MS method was used here to verify the existence of the sugar
portion grafted to the polyoxyalkyleneamine. MNPA1000 and B30 grafted samples of
BMCMGGW45 were extracted with toluene after the enzyme treatment. The residue
BMCMGGW45-L300/ Extracted With Toluene
BMCMGGW45-MNPA1000/ Extracted With Toluene
BM13CMHPG-B30/ Extracted With Toluene
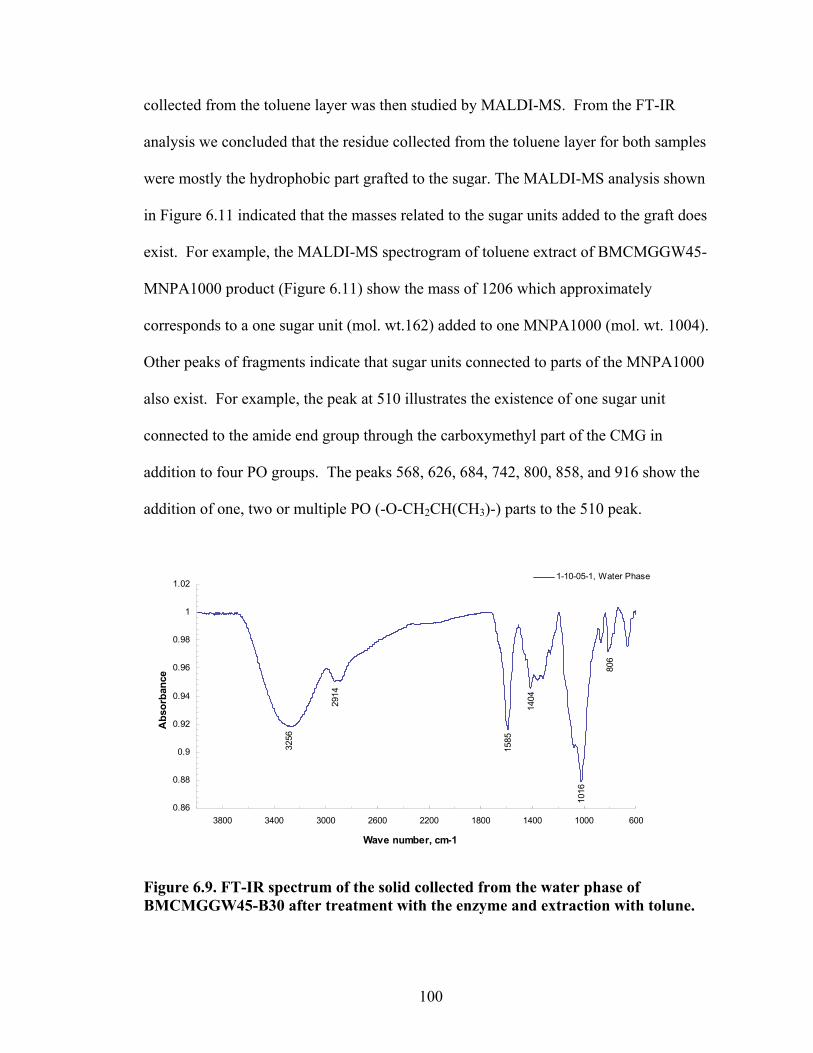
100
collected from the toluene layer was then studied by MALDI-MS. From the FT-IR
analysis we concluded that the residue collected from the toluene layer for both samples
were mostly the hydrophobic part grafted to the sugar. The MALDI-MS analysis shown
in Figure 6.11 indicated that the masses related to the sugar units added to the graft does
exist. For example, the MALDI-MS spectrogram of toluene extract of BMCMGGW45-
MNPA1000 product (Figure 6.11) show the mass of 1206 which approximately
corresponds to a one sugar unit (mol. wt.162) added to one MNPA1000 (mol. wt. 1004).
Other peaks of fragments indicate that sugar units connected to parts of the MNPA1000
also exist. For example, the peak at 510 illustrates the existence of one sugar unit
connected to the amide end group through the carboxymethyl part of the CMG in
addition to four PO groups. The peaks 568, 626, 684, 742, 800, 858, and 916 show the
addition of one, two or multiple PO (-O-CH2CH(CH3)-) parts to the 510 peak.
1016
806
2914
1404
3256
1585
0.86
0.88
0.9
0.92
0.94
0.96
0.98
1
1.02
60010001400180022002600300034003800
Wave number, cm-1
Abs
orba
nce
1-10-05-1, Water Phase
Figure 6.9. FT-IR spectrum of the solid collected from the water phase of BMCMGGW45-B30 after treatment with the enzyme and extraction with tolune.
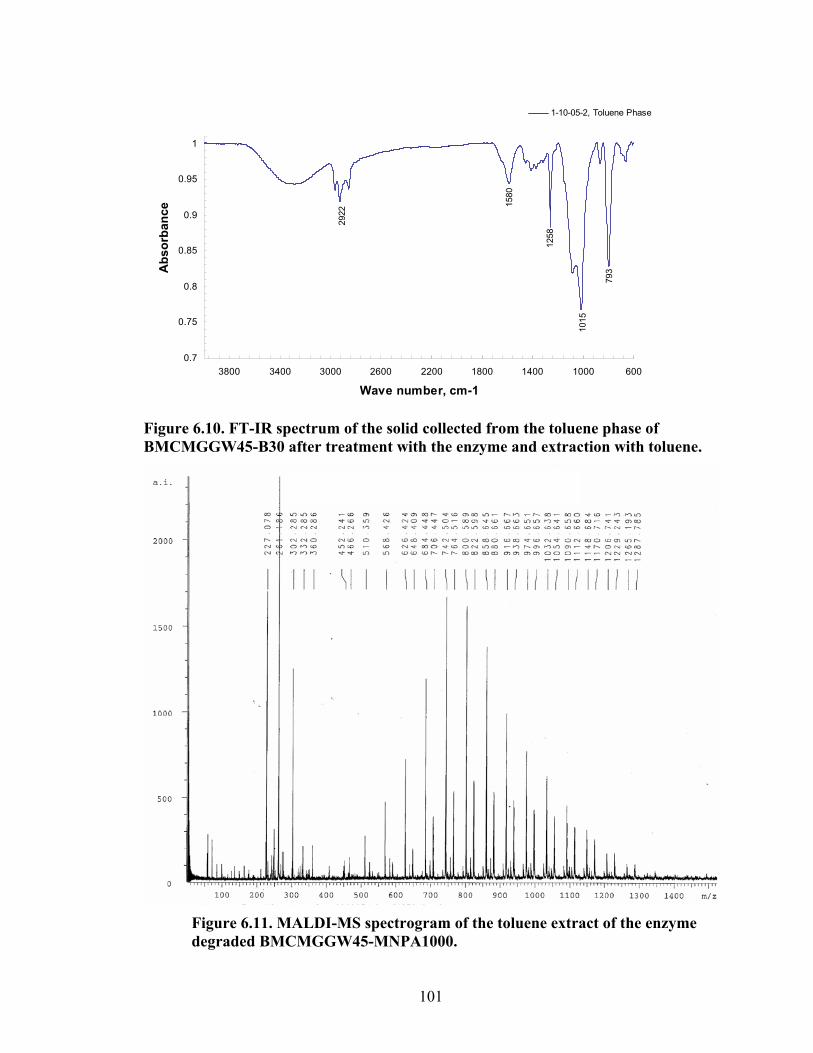
101
1015
2922
793
1258
1580
0.7
0.75
0.8
0.85
0.9
0.95
1
60010001400180022002600300034003800
Wave number, cm-1
Abs
orba
nce
1-10-05-2, Toluene Phase
Figure 6.10. FT-IR spectrum of the solid collected from the toluene phase of BMCMGGW45-B30 after treatment with the enzyme and extraction with toluene.
Figure 6.11. MALDI-MS spectrogram of the toluene extract of the enzyme degraded BMCMGGW45-MNPA1000.
102
CHAPTER 7 . SUMMARY AND FUTURE WORK 7.1 Conclusions
In this work, we have reported the development of novel guar gum derivatives.
These derivatives were synthesized from commercially available polyoxyalkyleneamine
compounds and guar gum derivatives. The successful grafting process was verified and
monitored by the FT-IR and 1H NMR. In contrast to the guar gum solutions, which tend
to be cloudy and heterogeneous, homogeneous aqueous solutions of the new derivatives
could be prepared. The viscosities of these solutions are approximately ten times less
than the viscosities of the parent materials at comparable concentrations. The decrease in
viscosity of the grafted products is attributed to a polysurfactant effect imparted by the
polyoxyalkylene grafts. The low viscosities of the solutions are a processing advantage,
both in the pumping and mixing steps as well as presenting the opportunity to prepare
and ship concentrated master batches that could simply be diluted in the field.
A family of grafted guar gum derivatives was produced by employing
polyoxyalkylene-amines with different hydrophobicity and hydrophilicity. A survey of
the relative viscosities of derivatives prepared from a common guar precursor revealed
that the more hydrophobic polyoxyalkylene grafts imparted higher viscosities. In general
the best yields of the hydrophobic grafted derivatives were achieved with the
Surfonamine B-30, which is a relatively low molecular weight, biodegradable reagent.
We anticipate that this biodegradability will be transfer to the grafted guar products,
which will make them environmentally friendly additives.
Guar gum and its derivatives account possibly for 90% of all gelled fracturing
fluids; the new derivatives are considered excellent candidates for similar applications.
103
The gelation characteristics of the derivatives were determined to evaluate this potential.
All of the derivatives could be crosslinked successfully using a zirconium lactate
crosslinking agent. Although the viscosities of the precursor solutions were lower than
that of the guar gum precursors, most of the resultant gels exhibited properties
comparable to or greater than those of gels formed from the guar gum precursors at a
concentration of 40lb/1000gal (4.8 g/L) which is typical for field applications. The
crosslinking was successful for all the CMG derivatives at a lower concentration of
20lb/1000gal (2.4 g/L) indicating that this concentration is still above the critical
crosslinking concentration, However, most of the CMHPG derivatives failed to gel at
the lower concentration, which must be below their Ccc. Only the B30 and M600
derivatives of the CMHPG were successfully crosslinked and showed good gelling
behavior.
The final step of the fracturing process requires removal of the polymer gel from
the formation. The biodegradability of the gel can be exploited to partially hydrolyze the
carbohydrate backbone with a commercially available enzyme mixture. When
hydrophobically modified derivatives such as MNPA1000 and B30 grafted guar gums are
degraded, the resultant fragments behaved as surfactants that disperse easily into the oil
phase. The low viscosity and the surfactant behavior of the fragments suggest that they
will be less damaging to the formation since they can be removed easily from down hole
either by the flow back of oil, condensate or water. The surfactant behavior of degraded
guar adducts should facilitate the clean up process.
The purpose of this study was to identify the best candidates for the fracturing
fluid application. Hydrophobic grafts were favored because upon degradation they would
104
yield surfactant fragments that are easily driven from the formation. However, the
addition of the hydrophobic grafts should not compromise the viscosity and stability of
the crosslinked gels. The B30 and MNPA1000 derivatives of the three control guars used
in this project should meet our criteria. All these products hydrolyzed to fragments that
behaved as surfactants which should facilitate the cleaning process. From the viscosity
trends discussed in chapter 5, we observed that the B30 and MNPA1000 derivatives of
BMCMGGW-45 and BM12CMHPG exhibited the highest viscosities and retained their
properties at high temperatures. Higher concentrations of the BM12CMHPG derivatives
are required to form gels. If the possibility of using lower polymer concentration to
decrease the cost of the process is considered, the derivatives of carboxymethyl guar are
better. In conclusion, we think that both the MNPA1000 and B30 derivatives of
BMCMGGW-45 are the best candidates for application in the fracturing fluid process.
7.2 Future work
In order to confirm the suitability of these products for the use as hydraulic
fracturing fluids more work is needed. This work should include
1. A study of the compatibility of these materials with formation fluids (each
formation contains different type of fluids). The properties of samples prepared
using brines or fluids from the formation must be evaluated. The presence of salts
or metallic species may cause precipitation of the polymer or affect the strength
and stability of the gels.
2. A method must be developed to prepare homogenous gels while minimizing the
air content. The existence of air bubbles within the fluid will affect the viscosity.
The mixing protocol (using a blender) which we adopted from industry
105
procedures4 may result in inhomogeneous gel that gives irreproducible viscosity.
R. K. Prud’homme and coworkers40 compared gels produced in an impingement
mixer that generate intimate micromixing with gels produced by a blender. They
observed that the viscosity of the batch mixed gel (blender mixed) is higher than
that of the dynamically mixed gel (impingement mixed) but the batch mixed gel is
not reproducible. In future, we need to evaluate the gelation of the most
promising derivatives using a different mixing protocol. The dynamic mixer is a
better model for the type of mixing conducted in the field so its utilization should
be considered.
3. The rheological behavior of these fluids at the reservoir high pressure and
temperature must be evaluated more precisely. We recently acquired a Brookfield
instrument which can operate at temperatures up to 200°C and pressures to about
1000psi. The new instrument will help us to overcome the drawbacks that we
encountered in using the Fann 35A. In particular, problems associated with
solvent evaporation can be eliminated. The new equipment will allow us to test
the samples at temperatures higher that 90°C which were impossible to consider
with an open cup instrument. We can run at higher shear rates (100 s-1 as
recommended by API practice) without being concerned about sample loss.
4. A more accurate procedure to assess graft content must be developed. Solid state
NMR will be employed. Using solid samples will eliminate the effect of solvents,
solubility, or high viscosity that we observed when measuring samples in
solution.
106
5. Optimize the graft concentration for the more promising candidates, i.e. B30 and
MNPA1000. The optimization process can be achieved by controlling the
esterification process by introducing a limited amount of ester groups when
reacting CMG with DMS. Alternatively, the ratio of polyoxyalkyleneamines
reacted with ester (MCMG) will be decreased to limit amide formation.
107
REFERENCES
1 Naval Goel, Subhash N. Shah, Wei-Li Yuan, and Edger A. O’Rear, Journal of Applied Polymer Science, 2001, 82, 2978-2990. 2 Weaver, J., Schmelzl, E., Jamieson, M., and Schiffner, G., paper SPE 75690, presented at the SPE Gas Technology Symposium, Calgary, Alberta, Canada, April30- May 2, 2002. 3 Phillip C. Harris, Journal of Petroleum Technology, October, 1988, SPE 17112, 1277-1278. 4 Jeffery C. Dawson, Subramanian Kesavan, and Hong V. Lee, US patent 6387853B1, May 14, 2002. 5 Rymond Jasinski, David Redwine, and Gene Rose, Journal of Polymer Science:Part B: Polymer Physics, 1996, 34, 1477-1488. 6 Young, N.W.G., Williams, P.A., Meadows, J, and Allen, E., Society of Petroleum Engineering, SPE 39700, 1998, 463-470. 7 Behari, K., Kumar, R. Tripathi, M., and Pandey, P. K., Macromol. Chem. Phys., 2001, 202, 1873-1877. 8 Moorhouse, Ralph, Harry, David N., and Merchant, Uday, Society of Petroleum Engineering , SPE 39531, 1998, 253-269. 9 www.guargum.info. 10 D. J. Power and A. B. Rodd, J. Rheology, 1998, 42(5), 1021-1037. 11 Harry, David N., Moorhouse, Ralph, Matthews, Les, and Chen, Gong, SPE 37280, 1997, 669-674. 12 Jerome Rose, Theodorus J. M. De Bruin, Guy Chauveteau, Rene Tabary, Jean-Louis Hazemann, Olivier Proux, Aziz Omari, Herve Toulhoat, and Jean-Yves Bottero, J.Phys. Chem. B, 2003, 107, 2910-2920. 13 Xiaolan Wang, Qi Qu, Scott McCarthy, Jonathon Null, and Kody Bowen, Society of Petroleum Engineering , SPE 73789, 2002. 14 Chris E. Shuchart, Micheal A. McCabe, John M. Terracina and Micheal L. Walker, SPE 37228, 1997, 175-183. 15 J.M. Terracina, M. A. McCabe, C.E. Shuchart, and M. L. Walker, SPE Prod. & Facilities 14 (2), May 1999.
108
16 T. Schult and S. T. Moe, 9th International Symposium on Wood and Pulping Chemistry, Vol.2, p.99-1 to 99-4. 17 Titration by a modified acid wash procedure described in ASTM D 1439, Vol. 6.03 (1994). 18 K. Tihlarik and M. Pasteka, Cellulose Chemistry and Technology, vol. 22, 481-486 (1988). 19 Vittorio Crescenzi, Mariella Dentini, Daniela Risica, Sara Spadoni, Gudmund Skjak- Braek, Donatella Capitani, Luisa Mannina, and Stephane Viel, Biomacromolecules, 2004, 5(2), 537-546. 20 Chowdhury, P., Samui, S., Kundu, T., and Nandi, M.M., Journal of Applied Polymer Science, 2001, 82, 3520-3525. 21 Taunk, Kavita and Behari, Kunj, Journal of Applied Polymer Science, 2000, 77, 39- 44. 22 Bajpai, U.D.N., Mishra, Veena., and Rai, Sandeep, Journal of Applied Polymer Science, 1993, 47, 717-722. 23 Kokta, B.V. and Valade, J.L.; Tappi, 1972, 55, 366-369. 24 Dimov, Kyril and Pavlov, Pavel; Journal of Polymer Science, 1969, 7, 2775-2792. 25 Rowell, R.M., and Young, R.A.;Modified Cellulosics; Academic Press Inc., New York, 1978, 227-240. 26 Hornof, V., Kokta, B.V. and Valade, J.L.; Journal of Applied Polymer Science, 1975, 19, 545-556. 27 Graczyk, T., and Hornof, Journal of Polymer Science:Polymer Chemistry Edition, 1985, 23, 851-857. 28 Y.K. Chong, Tam P. T. Le, Graeme Moad, Ezio Rizzardo, and San H. Thang. Macromolecules 1999, 32, 2071. 29 John Ghiefari, Y.K. Chong, Frances Ercole, Julia Krstina, Justine Jeffery, Tam P. T. Le, Roshan T. A. Mayadunne, Gordon F. Meijs, Catherine L. Moad, Graeme Moad, Ezio Rizzardo, and San H. Thang. Macromolecules, 1998, 31, 5559. 30 Roshan T. A. Mayadunne, Ezio Rizzardo, John Ghiefari, Y.K. Chong, Graeme Moad, and San H. Thang. Macromolecules, 1999, 32, 6977. 31 Ezio Rizzardo, John Ghiefari, Roshan T. A. Mayadunne, Graeme Moad, and San H. Thang. Polym. Prepr. 1999, 40, 342-343.
109
32 John T Lai, Debby Filla, and Ronald Shea. Macromolecules. 2002, 35, 6754-6756. 33 Ian W. Cottrell, and Michael H. Yeh, Eur. Pat. Appl. (1995), Chem. Abs. 124:120647. 34 Manuszak-Guerrinni, Melissa A., Culberson, Doris A.; Daly, William H., US Patent 5981737 (1999). 35 Fann Model 35A Viscometer Instrument Manual. 36 John W. Ely, Stimulation Engineering Handbook, PennWell Publishing Company, 1994. 37 API Recommended Practice 13B-1, Standard Procedure for Field Testing Water- Based Drilling Fluids, 2nd edition, September 1997. 38 Cuiyue Lei and P. E. Clark, Society of Petroleum Engineering, SPE 90840, 2004. 39 A. T. Bourgoyne, Jr., K. K. Millheim, M. E. Chenevert, and F. S. Young, Jr., Applied Drilling Engineering, SPE text book series vol. 2, 1991. 40 R. K. Prud’homme, S. Ellis, and V. G. Constien, Society of Petroleum Engineering, SPE 18210, 1988.
110
VITA
Ahmad A. Bahamdan obtained the Bachelor of Science in chemistry from King
Fahd University of Petroleum and Minerals, Dhahran, Saudi Arabia, in January 1989. In
April 1989, he joined a PVC manufacturing company called Ibn Hayyan, Jubail, Saudi
Arabia, as a laboratory chemist. In 1990 he joined Dammam Technical College as a
chemistry instructor. In 1993 he was granted a scholarship for higher studies. He then
attended the University of Arkansas at Little Rock, USA, and received his master of
science degree in analytical chemistry in August 1995. In April 1996, he joined Saudi
Aramco R&D Center as a polymer scientist. Ahmad is currently a candidate for the
degree of doctor of philosophy in Department of Chemistry and his area of specialization
is macromolecular science.