Embed Size (px)
Citation preview
Journal of Food Composition and Analysis 29 (2013) 25–31
Original Research Article
Hydrophilic antioxidant capacities of vegetables and fruits commonly consumedin Japan and estimated average daily intake of hydrophilic antioxidants from thesefoods
Jun Takebayashi a,*, Tomoyuki Oki b, Jun Watanabe c, Koji Yamasaki d, Jianbin Chen a,Maki Sato-Furukawa b, Megumi Tsubota-Utsugi e, Kyoko Taku f, Kazuhisa Goto b,Teruki Matsumoto a, Yoshiko Ishimi a
a Department of Food Function and Labeling, Incorporated Administrative Agency, National Institute of Health and Nutrition, 1-23-1 Toyama, Shinjuku-ku, Tokyo 162-8636, Japanb National Agricultural Research Center for Kyushu Okinawa Region, National Agriculture and Food Research Organization, 2421 Suya, Koshi, Kumamoto 861-1192, Japanc National Food Research Institute, National Agriculture and Food Research Organization, 2-1-12 Kannondai, Tsukuba, Ibaraki 305-8642, Japand Taiyo Kagaku Co., Ltd., 1-3 Takara-cho, Yokkaichi, Mie 510-0844, Japane Department of Department of Nutritional Epidemiology, Incorporated Administrative Agency, National Institute of Health and Nutrition, 1-23-1 Toyama, Shinjuku-ku,
Tokyo 162-8636, Japanf Center for International Collaboration and Partnership, Incorporated Administrative Agency, National Institute of Health and Nutrition, 1-23-1 Toyama, Shinjuku-ku,
Tokyo 162-8636, Japan
A R T I C L E I N F O
Article history:
Received 13 February 2012
Received in revised form 15 September 2012
Accepted 2 October 2012
Keywords:
Antioxidant capacity (AOC)
Hydrophilic-oxygen radical absorbance
capacity (H-ORAC) assay
Daily intake
Vegetables and fruits
Polyphenol content
1,1-Diphenyl-2-picrylhydrazyl (DPPH)
assay
Method comparison
Food analysis
Food composition
A B S T R A C T
The sum of hydrophilic antioxidants of 23 vegetables and 13 fruits commonly consumed in Japan was
evaluated by a modified hydrophilic-oxygen radical absorbance capacity (H-ORAC) method. The ‘‘typical
vegetable’’ and ‘‘typical fruit’’ in Japan contained hydrophilic antioxidants that are equivalent to 6.95 and
12.23 mmol of Trolox per g of the edible portion, respectively, on average. Hence, the daily intake of
hydrophilic antioxidants from vegetables and fruits was estimated to be 4423 mmol Trolox equivalent
(TE)/d based on data of the National Health and Nutrition Survey in Japan. However, the biological
significance of these antioxidant values has not yet been clarified. To address this issue, our data will
provide a foundation for high-quality epidemiological studies aimed at elucidating the relationship
between daily intake of antioxidants and health. In addition, the comparison of the results of the H-ORAC
assay with those of polyphenol content and 1,1-diphenyl-2-picrylhydrazyl (DPPH) assay was also
studied. The H-ORAC values had a strong positive correlation with polyphenol contents (r = 0.956), and
were 1.0–18.2-times higher than the antioxidant capacities evaluated by the DPPH assay.
� 2012 Elsevier Inc. All rights reserved.
Contents lists available at SciVerse ScienceDirect
Journal of Food Composition and Analysis
jo u rn al ho m epag e: ww w.els evier . c om / lo cat e/ j fc a
1. Introduction
There is growing evidence that reactive oxygen species (ROS)are related to many diseases and that foods rich in antioxidantsmay contribute to overall health and disease prevention (Lotitoand Frei, 2006; Osawa and Kato, 2005). There is a wide variety ofdifferent types of antioxidants in foods, and these antioxidantsoccasionally act coordinately in the body. Therefore, the efficacy of
* Corresponding author. Tel.: +81 3 3203 8063; fax: +81 3 3205 6549.
E-mail addresses: [email protected] (J. Takebayashi), [email protected] (T. Oki),
[email protected] (J. Watanabe), [email protected] (K. Yamasaki),
[email protected] (M. Tsubota-Utsugi), [email protected] (K. Taku),
[email protected] (K. Goto), [email protected] (T. Matsumoto), [email protected]
(Y. Ishimi).
0889-1575/$ – see front matter � 2012 Elsevier Inc. All rights reserved.
http://dx.doi.org/10.1016/j.jfca.2012.10.006
dietary antioxidants needs to be investigated not only from theviewpoint of individual antioxidants but also from the viewpoint ofthe sum of antioxidants contained in foods, that is, the concept of‘‘antioxidant capacity’’ (AOC) of foods. Valtuena et al. (2008) foundin a human trial that food selection based on AOC of foods canmodify antioxidant intake, systemic inflammation, and liverfunction without altering markers of oxidative stress. Thus, notonly individual antioxidants but also AOC of foods may be helpfulto improve dietary quality for maintenance of good health.
Several observational epidemiologic studies showed significantassociations between AOC intake and health (Brighenti et al., 2005;Psaltopoulou et al., 2011; Puchau et al., 2009, 2010; Serafini et al.,2002), whereas other studies showed no significant association(Devore et al., 2010; Mekary et al., 2010). One possible reason forthis discrepancy in results is that appropriate AOC databases were
J. Takebayashi et al. / Journal of Food Composition and Analysis 29 (2013) 25–3126
not used; i.e., the databases contained data for a limited number offood items and/or AOC values of foods marketed in a foreigncountry. Hence, to obtain more conclusive evidence fromepidemiological studies, an AOC database of higher quality isrequired.
An oxygen radical absorbance capacity (ORAC) method is one ofthe most widely used methods for evaluating AOC due to knownand unknown antioxidants present in tested foods (Prior et al.,2005). Peroxyl radical-scavenging activities of water-soluble andlipid-soluble antioxidants in samples are evaluated by thehydrophilic ORAC (H-ORAC) and lipophilic ORAC (L-ORAC)methods, respectively (Prior et al., 2003). Rautiainen et al.(2008) reported that more than half of ORAC intake from all foodsin Sweden is attributed to vegetables and fruits. In vegetables andfruits, H-ORAC values are usually much higher than L-ORAC values(Wu et al., 2004a).
The final goal of this study is to elucidate the relationshipbetween daily intake of antioxidants and health. For this purpose, areliable analytical method is needed to establish an appropriateAOC database of foods for epidemiological studies. Recently, theanalytical precision of the H-ORAC method was improved(Watanabe et al., 2012). This improved H-ORAC method is oneof the few analytical methods for evaluating AOC of foods validatedby an interlaboratory test in accordance with internationallyharmonized protocol (Horwitz, 1995). Based on this reliablemethod, an antioxidant database of foods suitable for the Japanesepopulation has been developed. This database will enable high-quality epidemiological studies concerning daily intake of anti-oxidants and health in Japan. In our preliminary note (Takebayashiet al., 2010), H-ORAC values of 23 vegetables commonly consumedin Japan have been reported and the daily intake of hydrophilicantioxidants from these vegetables in Japan has been estimated forthe first time to our knowledge. However, the sample size for eachvegetable was very limited (n = 1), and thus representative valuesand variances of the H-ORAC values for each vegetable wereunknown. In addition, foods other than vegetables, especiallyfruits, appear to contribute to the daily AOC intake. Hence, in thisstudy, H-ORAC values of 23 vegetables and 13 fruits from 3independent samples each were obtained and daily intakes ofhydrophilic antioxidants from these vegetables and fruits in Japanwere estimated.
2. Materials and methods
2.1. Selection of vegetable and fruit samples
The most consumed vegetables and fruits in Japan wereselected for this study according to the annual report on the familyincome and expenditure survey in Japan for 2005–2009 (StatisticsBureau; Ministry of Internal Affairs and Communications, Japan).This survey showed annual purchase weights per household forraw vegetables and fruits, and the weight for 23 vegetables shownin Table 1 and 13 fruits shown in Table 2 accounted for 83.4% and84.5% of the total weights for purchased raw vegetables and fruits,respectively. Percentage of intake for each vegetable wascalculated as follows:
Percentage of intake ð%Þ ¼ ½W � ð100 � RÞ=100�½PfW � ð100 � RÞ=100g� � 100;
where W (g) is the annual purchase weight per household of eachvegetable, R (%) is the discarded (or inedible) portion from theStandard Tables of Food Composition in Japan – 2010 – (Council forScience and Technology; Ministry of Education, Culture, Sports,Science and Technology, Japan), and
P{W � (100 � R)/100} (g) is
the sum of the estimated annual intake per household of the 23
vegetables listed in Table 1. Percentage of intake for each fruit wascalculated in the same manner.
2.2. Chemicals
Sodium fluorescein, 2,20-azobis(2-methylpropionamidine)dihydrochloride (AAPH), Folin-Ciocalteu reagent, and 1,1-diphe-nyl-2-picrylhydrazyl (DPPH) were purchased from Wako PureChemical Industries (Osaka, Japan) and Trolox was obtained fromAldrich Chemicals (Milwaukee, WI, USA). All other reagents wereof analytical grade.
2.3. Food sample preparation
The 23 vegetables and 13 fruits shown in Tables 1 and 2 wereindependently purchased in raw form in 3 prefectures of Japan(more details on where and when the samples were collected areshown in the footnotes of Tables 1 and 2). In each case, most ofthe samples were acquired from one local market, but somesamples were bought on the Internet due to unavailability. Atleast 2 units and 200 g in total for each vegetable and fruit werecollected. These samples were cooled on crushed ice beforecutting to avoid loss of antioxidants by enzymes such aspolyphenol oxidases, and inedible portions were removed. Then,sample size was reduced by sub-sampling, and the edibleportions were snap frozen by liquid nitrogen and were promptlyfreeze-dried. The freeze-dried samples were milled untilhomogeneous by using a Grindomix GM 200 knife mill (Retsch,Haan, Germany) and stored at �20 8C. The antioxidants in thefreeze-dried samples were then extracted by using an acceleratedsolvent extraction system (Dionex, ASE-200) as described by Wuet al. (2004b) with some modifications. Briefly, each freeze-driedsample was first subjected to extraction with hexane/dichlor-omethane (1:1) followed by extraction with methanol/water/acetic acid (90:9.5:0.5; MWA), and then the H-ORAC assay,measurement of polyphenol content, and DPPH assay wereperformed using the same MWA extracts.
2.4. H-ORAC assay
The interlaboratory precision of the original H-ORAC method(Prior et al., 2003) has been shown to be insufficient (Watanabeet al., 2010), and some methodological improvements to assuresatisfactory interlaboratory precision have been made (Wata-nabe et al., 2012). In this study, this improved H-ORAC methodwas used. Briefly, the MWA extracts were diluted 10-fold with anassay buffer (75 mM KH2PO4–K2HPO4 at pH 7.4) and then furtherdiluted with the assay buffer containing 10% MWA. Troloxcalibration solutions (6.25, 12.5, 25 and 50 mM in the assay buffercontaining 10% MWA) were made to obtain a standard curve. Thediluted MWA extract, Trolox calibration solution or blank (35 ml),fluorescein (115 ml, 110.7 nM in the assay buffer), and AAPH(50 ml, 31.7 mM in the assay buffer) were incubated in the assaybuffer at 37 8C in a 96-well plate sealed with a plastic film. Thefluorescence (Ex. at 485 nm, Em. at 528 nm) was monitored every2 min for 90 min by a Powerscan HT instrument (DS PharmaBiomedicals, Osaka, Japan). The net area under the curve (AUC)was calculated by subtracting AUC for the blank from that for thesample or standard, and the H-ORAC value for each sample wasdetermined by comparison of net AUC for the sample with thatfor the Trolox standard. More details are shown in the reference(Watanabe et al., 2012). Data are expressed as moles of Troloxequivalent to the amount of water-soluble antioxidants con-tained in a sample, that is, mmol Trolox equivalent (TE) per gramfresh weight of the edible portion (mmol TE/g). Each value is theaverage of determinations for two separately prepared extracts
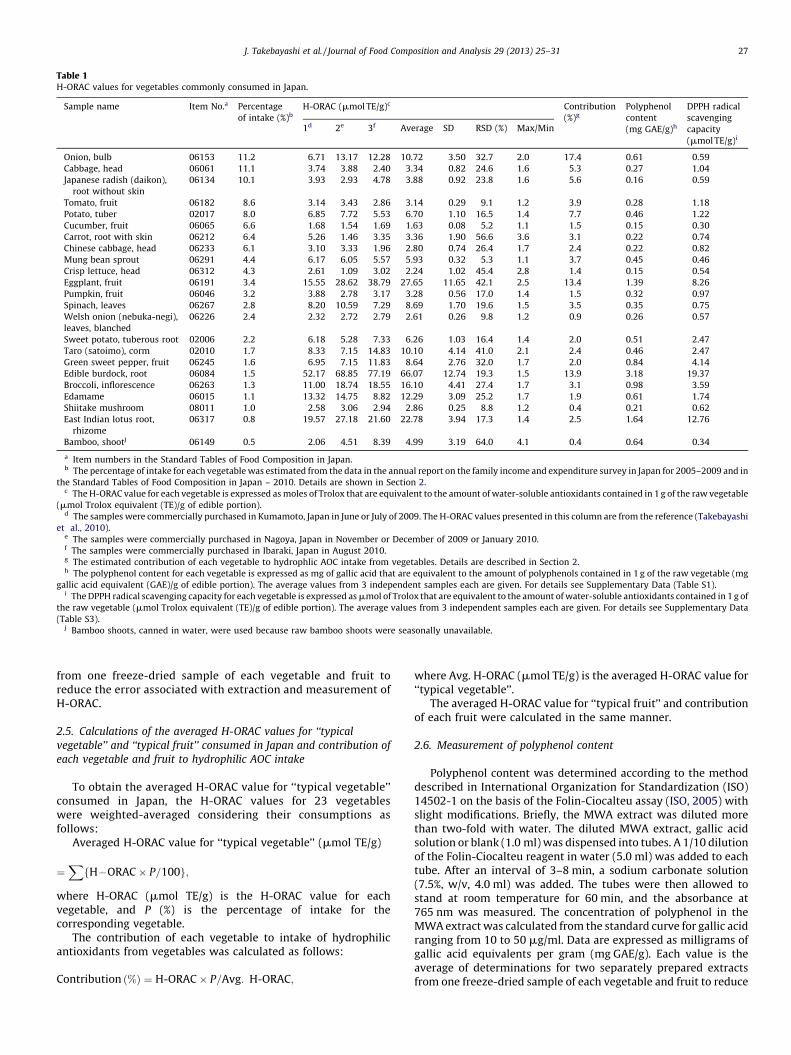
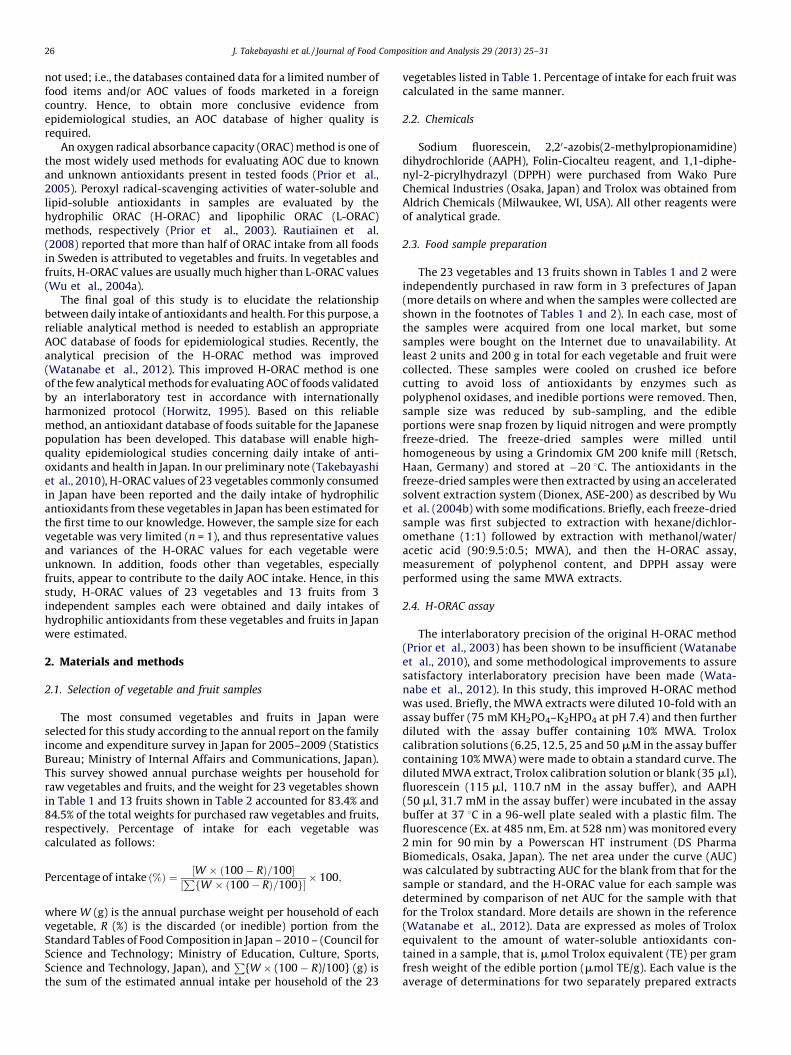
Table 1H-ORAC values for vegetables commonly consumed in Japan.
Sample name Item No.a Percentage
of intake (%)b
H-ORAC (mmol TE/g)c Contribution
(%)g
Polyphenol
content
(mg GAE/g)h
DPPH radical
scavenging
capacity
(mmol TE/g)i
1d 2e 3f Average SD RSD (%) Max/Min
Onion, bulb 06153 11.2 6.71 13.17 12.28 10.72 3.50 32.7 2.0 17.4 0.61 0.59
Cabbage, head 06061 11.1 3.74 3.88 2.40 3.34 0.82 24.6 1.6 5.3 0.27 1.04
Japanese radish (daikon),
root without skin
06134 10.1 3.93 2.93 4.78 3.88 0.92 23.8 1.6 5.6 0.16 0.59
Tomato, fruit 06182 8.6 3.14 3.43 2.86 3.14 0.29 9.1 1.2 3.9 0.28 1.18
Potato, tuber 02017 8.0 6.85 7.72 5.53 6.70 1.10 16.5 1.4 7.7 0.46 1.22
Cucumber, fruit 06065 6.6 1.68 1.54 1.69 1.63 0.08 5.2 1.1 1.5 0.15 0.30
Carrot, root with skin 06212 6.4 5.26 1.46 3.35 3.36 1.90 56.6 3.6 3.1 0.22 0.74
Chinese cabbage, head 06233 6.1 3.10 3.33 1.96 2.80 0.74 26.4 1.7 2.4 0.22 0.82
Mung bean sprout 06291 4.4 6.17 6.05 5.57 5.93 0.32 5.3 1.1 3.7 0.45 0.46
Crisp lettuce, head 06312 4.3 2.61 1.09 3.02 2.24 1.02 45.4 2.8 1.4 0.15 0.54
Eggplant, fruit 06191 3.4 15.55 28.62 38.79 27.65 11.65 42.1 2.5 13.4 1.39 8.26
Pumpkin, fruit 06046 3.2 3.88 2.78 3.17 3.28 0.56 17.0 1.4 1.5 0.32 0.97
Spinach, leaves 06267 2.8 8.20 10.59 7.29 8.69 1.70 19.6 1.5 3.5 0.35 0.75
Welsh onion (nebuka-negi),
leaves, blanched
06226 2.4 2.32 2.72 2.79 2.61 0.26 9.8 1.2 0.9 0.26 0.57
Sweet potato, tuberous root 02006 2.2 6.18 5.28 7.33 6.26 1.03 16.4 1.4 2.0 0.51 2.47
Taro (satoimo), corm 02010 1.7 8.33 7.15 14.83 10.10 4.14 41.0 2.1 2.4 0.46 2.47
Green sweet pepper, fruit 06245 1.6 6.95 7.15 11.83 8.64 2.76 32.0 1.7 2.0 0.84 4.14
Edible burdock, root 06084 1.5 52.17 68.85 77.19 66.07 12.74 19.3 1.5 13.9 3.18 19.37
Broccoli, inflorescence 06263 1.3 11.00 18.74 18.55 16.10 4.41 27.4 1.7 3.1 0.98 3.59
Edamame 06015 1.1 13.32 14.75 8.82 12.29 3.09 25.2 1.7 1.9 0.61 1.74
Shiitake mushroom 08011 1.0 2.58 3.06 2.94 2.86 0.25 8.8 1.2 0.4 0.21 0.62
East Indian lotus root,
rhizome
06317 0.8 19.57 27.18 21.60 22.78 3.94 17.3 1.4 2.5 1.64 12.76
Bamboo, shootj 06149 0.5 2.06 4.51 8.39 4.99 3.19 64.0 4.1 0.4 0.64 0.34
a Item numbers in the Standard Tables of Food Composition in Japan.b The percentage of intake for each vegetable was estimated from the data in the annual report on the family income and expenditure survey in Japan for 2005–2009 and in
the Standard Tables of Food Composition in Japan – 2010. Details are shown in Section 2.c The H-ORAC value for each vegetable is expressed as moles of Trolox that are equivalent to the amount of water-soluble antioxidants contained in 1 g of the raw vegetable
(mmol Trolox equivalent (TE)/g of edible portion).d The samples were commercially purchased in Kumamoto, Japan in June or July of 2009. The H-ORAC values presented in this column are from the reference (Takebayashi
et al., 2010).e The samples were commercially purchased in Nagoya, Japan in November or December of 2009 or January 2010.f The samples were commercially purchased in Ibaraki, Japan in August 2010.g The estimated contribution of each vegetable to hydrophlic AOC intake from vegetables. Details are described in Section 2.h The polyphenol content for each vegetable is expressed as mg of gallic acid that are equivalent to the amount of polyphenols contained in 1 g of the raw vegetable (mg
gallic acid equivalent (GAE)/g of edible portion). The average values from 3 independent samples each are given. For details see Supplementary Data (Table S1).i The DPPH radical scavenging capacity for each vegetable is expressed as mmol of Trolox that are equivalent to the amount of water-soluble antioxidants contained in 1 g of
the raw vegetable (mmol Trolox equivalent (TE)/g of edible portion). The average values from 3 independent samples each are given. For details see Supplementary Data
(Table S3).j Bamboo shoots, canned in water, were used because raw bamboo shoots were seasonally unavailable.
J. Takebayashi et al. / Journal of Food Composition and Analysis 29 (2013) 25–31 27
from one freeze-dried sample of each vegetable and fruit toreduce the error associated with extraction and measurement ofH-ORAC.
2.5. Calculations of the averaged H-ORAC values for ‘‘typical
vegetable’’ and ‘‘typical fruit’’ consumed in Japan and contribution of
each vegetable and fruit to hydrophilic AOC intake
To obtain the averaged H-ORAC value for ‘‘typical vegetable’’consumed in Japan, the H-ORAC values for 23 vegetableswere weighted-averaged considering their consumptions asfollows:
Averaged H-ORAC value for ‘‘typical vegetable’’ (mmol TE/g)
¼XfH�ORAC � P=100g;
where H-ORAC (mmol TE/g) is the H-ORAC value for eachvegetable, and P (%) is the percentage of intake for thecorresponding vegetable.
The contribution of each vegetable to intake of hydrophilicantioxidants from vegetables was calculated as follows:
Contribution ð%Þ ¼ H-ORAC � P=Avg: H-ORAC;
where Avg. H-ORAC (mmol TE/g) is the averaged H-ORAC value for‘‘typical vegetable’’.
The averaged H-ORAC value for ‘‘typical fruit’’ and contributionof each fruit were calculated in the same manner.
2.6. Measurement of polyphenol content
Polyphenol content was determined according to the methoddescribed in International Organization for Standardization (ISO)14502-1 on the basis of the Folin-Ciocalteu assay (ISO, 2005) withslight modifications. Briefly, the MWA extract was diluted morethan two-fold with water. The diluted MWA extract, gallic acidsolution or blank (1.0 ml) was dispensed into tubes. A 1/10 dilutionof the Folin-Ciocalteu reagent in water (5.0 ml) was added to eachtube. After an interval of 3–8 min, a sodium carbonate solution(7.5%, w/v, 4.0 ml) was added. The tubes were then allowed tostand at room temperature for 60 min, and the absorbance at765 nm was measured. The concentration of polyphenol in theMWA extract was calculated from the standard curve for gallic acidranging from 10 to 50 mg/ml. Data are expressed as milligrams ofgallic acid equivalents per gram (mg GAE/g). Each value is theaverage of determinations for two separately prepared extractsfrom one freeze-dried sample of each vegetable and fruit to reduce
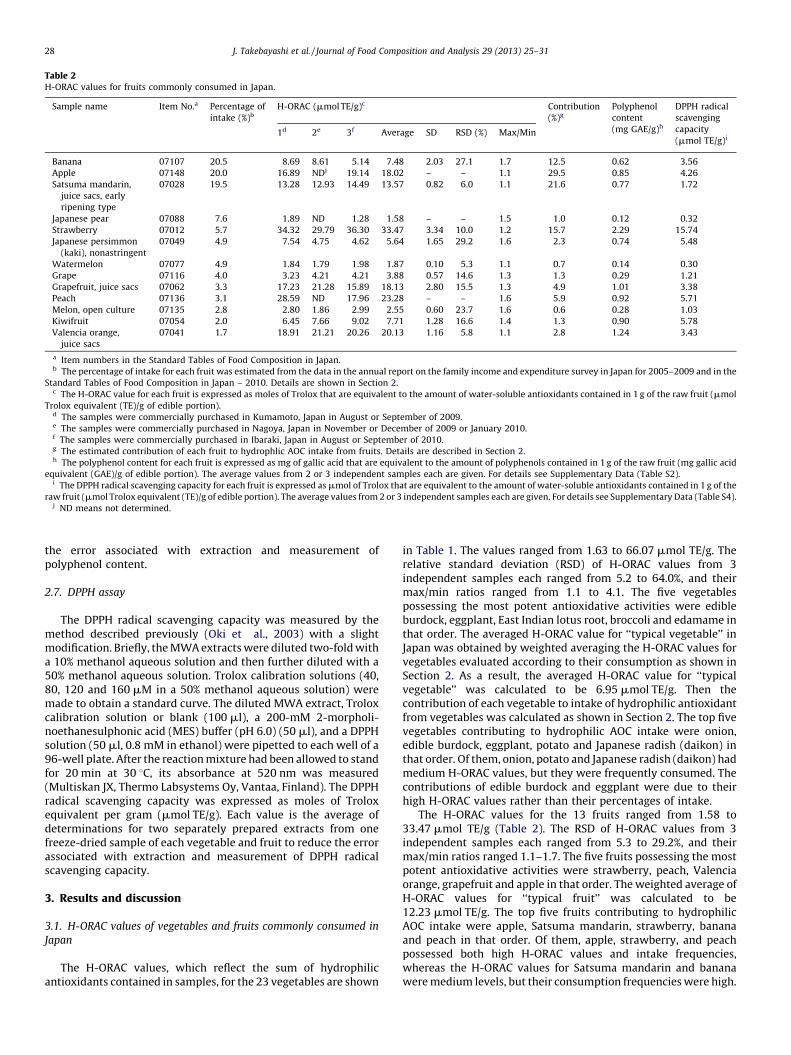
Table 2H-ORAC values for fruits commonly consumed in Japan.
Sample name Item No.a Percentage of
intake (%)b
H-ORAC (mmol TE/g)c Contribution
(%)g
Polyphenol
content
(mg GAE/g)h
DPPH radical
scavenging
capacity
(mmol TE/g)i1d 2e 3f Average SD RSD (%) Max/Min
Banana 07107 20.5 8.69 8.61 5.14 7.48 2.03 27.1 1.7 12.5 0.62 3.56
Apple 07148 20.0 16.89 NDj 19.14 18.02 – – 1.1 29.5 0.85 4.26
Satsuma mandarin,
juice sacs, early
ripening type
07028 19.5 13.28 12.93 14.49 13.57 0.82 6.0 1.1 21.6 0.77 1.72
Japanese pear 07088 7.6 1.89 ND 1.28 1.58 – – 1.5 1.0 0.12 0.32
Strawberry 07012 5.7 34.32 29.79 36.30 33.47 3.34 10.0 1.2 15.7 2.29 15.74
Japanese persimmon
(kaki), nonastringent
07049 4.9 7.54 4.75 4.62 5.64 1.65 29.2 1.6 2.3 0.74 5.48
Watermelon 07077 4.9 1.84 1.79 1.98 1.87 0.10 5.3 1.1 0.7 0.14 0.30
Grape 07116 4.0 3.23 4.21 4.21 3.88 0.57 14.6 1.3 1.3 0.29 1.21
Grapefruit, juice sacs 07062 3.3 17.23 21.28 15.89 18.13 2.80 15.5 1.3 4.9 1.01 3.38
Peach 07136 3.1 28.59 ND 17.96 23.28 – – 1.6 5.9 0.92 5.71
Melon, open culture 07135 2.8 2.80 1.86 2.99 2.55 0.60 23.7 1.6 0.6 0.28 1.03
Kiwifruit 07054 2.0 6.45 7.66 9.02 7.71 1.28 16.6 1.4 1.3 0.90 5.78
Valencia orange,
juice sacs
07041 1.7 18.91 21.21 20.26 20.13 1.16 5.8 1.1 2.8 1.24 3.43
a Item numbers in the Standard Tables of Food Composition in Japan.b The percentage of intake for each fruit was estimated from the data in the annual report on the family income and expenditure survey in Japan for 2005–2009 and in the
Standard Tables of Food Composition in Japan – 2010. Details are shown in Section 2.c The H-ORAC value for each fruit is expressed as moles of Trolox that are equivalent to the amount of water-soluble antioxidants contained in 1 g of the raw fruit (mmol
Trolox equivalent (TE)/g of edible portion).d The samples were commercially purchased in Kumamoto, Japan in August or September of 2009.e The samples were commercially purchased in Nagoya, Japan in November or December of 2009 or January 2010.f The samples were commercially purchased in Ibaraki, Japan in August or September of 2010.g The estimated contribution of each fruit to hydrophlic AOC intake from fruits. Details are described in Section 2.h The polyphenol content for each fruit is expressed as mg of gallic acid that are equivalent to the amount of polyphenols contained in 1 g of the raw fruit (mg gallic acid
equivalent (GAE)/g of edible portion). The average values from 2 or 3 independent samples each are given. For details see Supplementary Data (Table S2).i The DPPH radical scavenging capacity for each fruit is expressed as mmol of Trolox that are equivalent to the amount of water-soluble antioxidants contained in 1 g of the
raw fruit (mmol Trolox equivalent (TE)/g of edible portion). The average values from 2 or 3 independent samples each are given. For details see Supplementary Data (Table S4).j ND means not determined.
J. Takebayashi et al. / Journal of Food Composition and Analysis 29 (2013) 25–3128
the error associated with extraction and measurement ofpolyphenol content.
2.7. DPPH assay
The DPPH radical scavenging capacity was measured by themethod described previously (Oki et al., 2003) with a slightmodification. Briefly, the MWA extracts were diluted two-fold witha 10% methanol aqueous solution and then further diluted with a50% methanol aqueous solution. Trolox calibration solutions (40,80, 120 and 160 mM in a 50% methanol aqueous solution) weremade to obtain a standard curve. The diluted MWA extract, Troloxcalibration solution or blank (100 ml), a 200-mM 2-morpholi-noethanesulphonic acid (MES) buffer (pH 6.0) (50 ml), and a DPPHsolution (50 ml, 0.8 mM in ethanol) were pipetted to each well of a96-well plate. After the reaction mixture had been allowed to standfor 20 min at 30 8C, its absorbance at 520 nm was measured(Multiskan JX, Thermo Labsystems Oy, Vantaa, Finland). The DPPHradical scavenging capacity was expressed as moles of Troloxequivalent per gram (mmol TE/g). Each value is the average ofdeterminations for two separately prepared extracts from onefreeze-dried sample of each vegetable and fruit to reduce the errorassociated with extraction and measurement of DPPH radicalscavenging capacity.
3. Results and discussion
3.1. H-ORAC values of vegetables and fruits commonly consumed in
Japan
The H-ORAC values, which reflect the sum of hydrophilicantioxidants contained in samples, for the 23 vegetables are shown
in Table 1. The values ranged from 1.63 to 66.07 mmol TE/g. Therelative standard deviation (RSD) of H-ORAC values from 3independent samples each ranged from 5.2 to 64.0%, and theirmax/min ratios ranged from 1.1 to 4.1. The five vegetablespossessing the most potent antioxidative activities were edibleburdock, eggplant, East Indian lotus root, broccoli and edamame inthat order. The averaged H-ORAC value for ‘‘typical vegetable’’ inJapan was obtained by weighted averaging the H-ORAC values forvegetables evaluated according to their consumption as shown inSection 2. As a result, the averaged H-ORAC value for ‘‘typicalvegetable’’ was calculated to be 6.95 mmol TE/g. Then thecontribution of each vegetable to intake of hydrophilic antioxidantfrom vegetables was calculated as shown in Section 2. The top fivevegetables contributing to hydrophilic AOC intake were onion,edible burdock, eggplant, potato and Japanese radish (daikon) inthat order. Of them, onion, potato and Japanese radish (daikon) hadmedium H-ORAC values, but they were frequently consumed. Thecontributions of edible burdock and eggplant were due to theirhigh H-ORAC values rather than their percentages of intake.
The H-ORAC values for the 13 fruits ranged from 1.58 to33.47 mmol TE/g (Table 2). The RSD of H-ORAC values from 3independent samples each ranged from 5.3 to 29.2%, and theirmax/min ratios ranged 1.1–1.7. The five fruits possessing the mostpotent antioxidative activities were strawberry, peach, Valenciaorange, grapefruit and apple in that order. The weighted average ofH-ORAC values for ‘‘typical fruit’’ was calculated to be12.23 mmol TE/g. The top five fruits contributing to hydrophilicAOC intake were apple, Satsuma mandarin, strawberry, bananaand peach in that order. Of them, apple, strawberry, and peachpossessed both high H-ORAC values and intake frequencies,whereas the H-ORAC values for Satsuma mandarin and bananawere medium levels, but their consumption frequencies were high.
0
10
20
30
40
50
60
70
0 0.5 1.0 1.5 2.0 2.5 3.0 3.5 4.0Polyphenol co ntent (mg GAE/g)
H-O
RA
C (µ
mol
TE/
g)
r = 0.9 56p < 0.01
Fig. 1. Relationship between H-ORAC value and polyphenol content of vegetables
and fruits commonly consumed in Japan.
Closed circle: vegetable; open circle: fruit; solid line: regression line. The
correlation was calculated by using a Pearson product moment correlation
coefficient (r).
0
10
20
30
40
50
60
70
0 5 10 15 20DPPH (µmol TE/g)
H-O
RA
C (µ
mol
TE/
g) r = 0.894p < 0.01
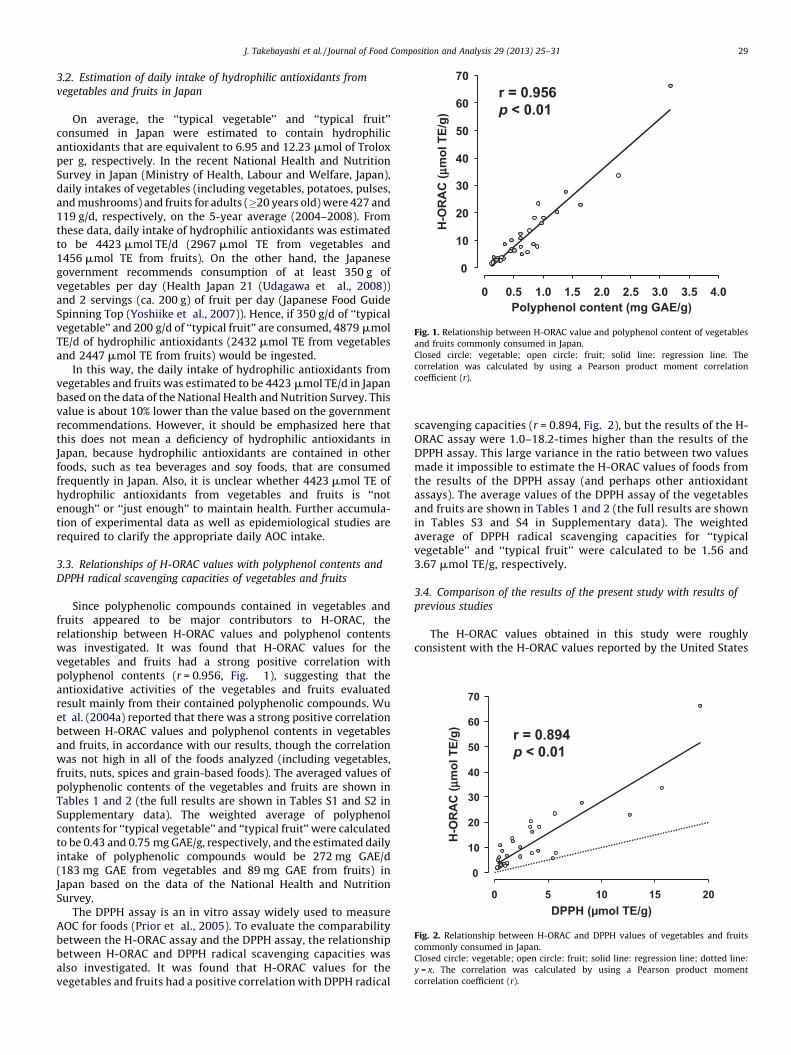
Fig. 2. Relationship between H-ORAC and DPPH values of vegetables and fruits
commonly consumed in Japan.
Closed circle: vegetable; open circle: fruit; solid line: regression line; dotted line:
y = x. The correlation was calculated by using a Pearson product moment
correlation coefficient (r).
J. Takebayashi et al. / Journal of Food Composition and Analysis 29 (2013) 25–31 29
3.2. Estimation of daily intake of hydrophilic antioxidants from
vegetables and fruits in Japan
On average, the ‘‘typical vegetable’’ and ‘‘typical fruit’’consumed in Japan were estimated to contain hydrophilicantioxidants that are equivalent to 6.95 and 12.23 mmol of Troloxper g, respectively. In the recent National Health and NutritionSurvey in Japan (Ministry of Health, Labour and Welfare, Japan),daily intakes of vegetables (including vegetables, potatoes, pulses,and mushrooms) and fruits for adults (�20 years old) were 427 and119 g/d, respectively, on the 5-year average (2004–2008). Fromthese data, daily intake of hydrophilic antioxidants was estimatedto be 4423 mmol TE/d (2967 mmol TE from vegetables and1456 mmol TE from fruits). On the other hand, the Japanesegovernment recommends consumption of at least 350 g ofvegetables per day (Health Japan 21 (Udagawa et al., 2008))and 2 servings (ca. 200 g) of fruit per day (Japanese Food GuideSpinning Top (Yoshiike et al., 2007)). Hence, if 350 g/d of ‘‘typicalvegetable’’ and 200 g/d of ‘‘typical fruit’’ are consumed, 4879 mmolTE/d of hydrophilic antioxidants (2432 mmol TE from vegetablesand 2447 mmol TE from fruits) would be ingested.
In this way, the daily intake of hydrophilic antioxidants fromvegetables and fruits was estimated to be 4423 mmol TE/d in Japanbased on the data of the National Health and Nutrition Survey. Thisvalue is about 10% lower than the value based on the governmentrecommendations. However, it should be emphasized here thatthis does not mean a deficiency of hydrophilic antioxidants inJapan, because hydrophilic antioxidants are contained in otherfoods, such as tea beverages and soy foods, that are consumedfrequently in Japan. Also, it is unclear whether 4423 mmol TE ofhydrophilic antioxidants from vegetables and fruits is ‘‘notenough’’ or ‘‘just enough’’ to maintain health. Further accumula-tion of experimental data as well as epidemiological studies arerequired to clarify the appropriate daily AOC intake.
3.3. Relationships of H-ORAC values with polyphenol contents and
DPPH radical scavenging capacities of vegetables and fruits
Since polyphenolic compounds contained in vegetables andfruits appeared to be major contributors to H-ORAC, therelationship between H-ORAC values and polyphenol contentswas investigated. It was found that H-ORAC values for thevegetables and fruits had a strong positive correlation withpolyphenol contents (r = 0.956, Fig. 1), suggesting that theantioxidative activities of the vegetables and fruits evaluatedresult mainly from their contained polyphenolic compounds. Wuet al. (2004a) reported that there was a strong positive correlationbetween H-ORAC values and polyphenol contents in vegetablesand fruits, in accordance with our results, though the correlationwas not high in all of the foods analyzed (including vegetables,fruits, nuts, spices and grain-based foods). The averaged values ofpolyphenolic contents of the vegetables and fruits are shown inTables 1 and 2 (the full results are shown in Tables S1 and S2 inSupplementary data). The weighted average of polyphenolcontents for ‘‘typical vegetable’’ and ‘‘typical fruit’’ were calculatedto be 0.43 and 0.75 mg GAE/g, respectively, and the estimated dailyintake of polyphenolic compounds would be 272 mg GAE/d(183 mg GAE from vegetables and 89 mg GAE from fruits) inJapan based on the data of the National Health and NutritionSurvey.
The DPPH assay is an in vitro assay widely used to measureAOC for foods (Prior et al., 2005). To evaluate the comparabilitybetween the H-ORAC assay and the DPPH assay, the relationshipbetween H-ORAC and DPPH radical scavenging capacities wasalso investigated. It was found that H-ORAC values for thevegetables and fruits had a positive correlation with DPPH radical
scavenging capacities (r = 0.894, Fig. 2), but the results of the H-ORAC assay were 1.0–18.2-times higher than the results of theDPPH assay. This large variance in the ratio between two valuesmade it impossible to estimate the H-ORAC values of foods fromthe results of the DPPH assay (and perhaps other antioxidantassays). The average values of the DPPH assay of the vegetablesand fruits are shown in Tables 1 and 2 (the full results are shownin Tables S3 and S4 in Supplementary data). The weightedaverage of DPPH radical scavenging capacities for ‘‘typicalvegetable’’ and ‘‘typical fruit’’ were calculated to be 1.56 and3.67 mmol TE/g, respectively.
3.4. Comparison of the results of the present study with results of
previous studies
The H-ORAC values obtained in this study were roughlyconsistent with the H-ORAC values reported by the United States
grape
0
10
20
30
40
50
0 10 20 30 40 50
r = 0.6 96p < 0.01
H-ORA C values o btainedin this stud y (µmol TE/g)
H-O
RA
C v
alue
s re
port
edby
the
USD
A (µ
mol
TE/
g)
pear
eggplant
radish
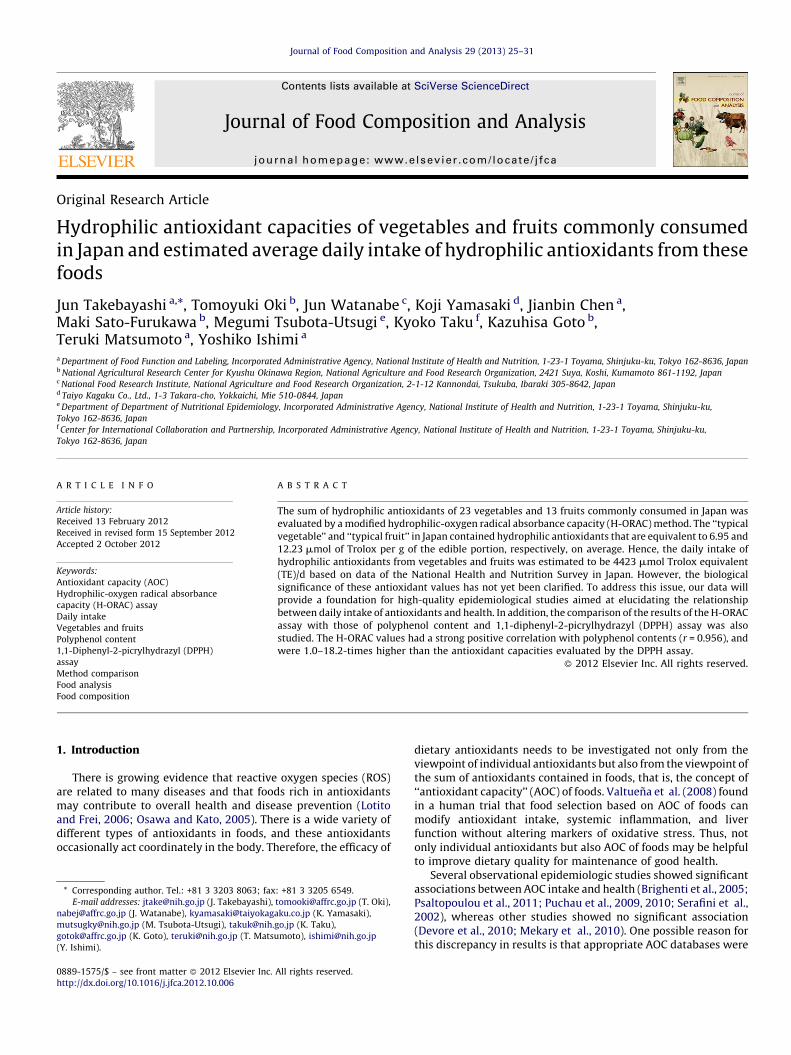
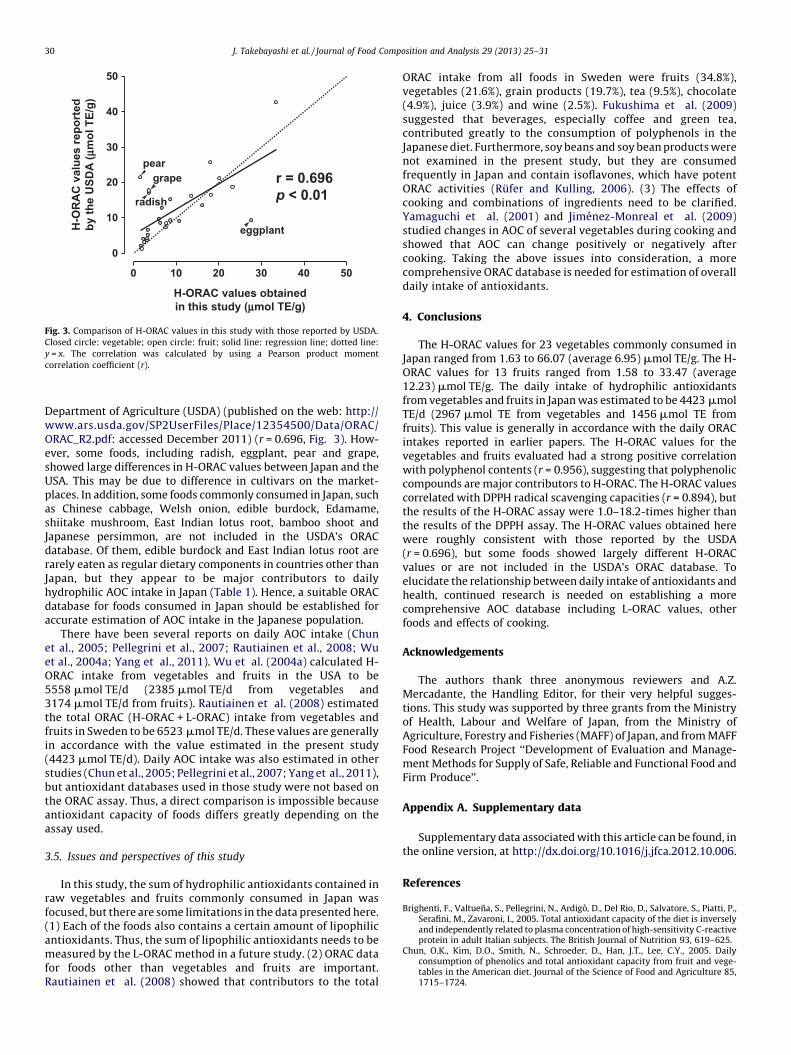
Fig. 3. Comparison of H-ORAC values in this study with those reported by USDA.
Closed circle: vegetable; open circle: fruit; solid line: regression line; dotted line:
y = x. The correlation was calculated by using a Pearson product moment
correlation coefficient (r).
J. Takebayashi et al. / Journal of Food Composition and Analysis 29 (2013) 25–3130
Department of Agriculture (USDA) (published on the web: http://www.ars.usda.gov/SP2UserFiles/Place/12354500/Data/ORAC/ORAC_R2.pdf: accessed December 2011) (r = 0.696, Fig. 3). How-ever, some foods, including radish, eggplant, pear and grape,showed large differences in H-ORAC values between Japan and theUSA. This may be due to difference in cultivars on the market-places. In addition, some foods commonly consumed in Japan, suchas Chinese cabbage, Welsh onion, edible burdock, Edamame,shiitake mushroom, East Indian lotus root, bamboo shoot andJapanese persimmon, are not included in the USDA’s ORACdatabase. Of them, edible burdock and East Indian lotus root arerarely eaten as regular dietary components in countries other thanJapan, but they appear to be major contributors to dailyhydrophilic AOC intake in Japan (Table 1). Hence, a suitable ORACdatabase for foods consumed in Japan should be established foraccurate estimation of AOC intake in the Japanese population.
There have been several reports on daily AOC intake (Chunet al., 2005; Pellegrini et al., 2007; Rautiainen et al., 2008; Wuet al., 2004a; Yang et al., 2011). Wu et al. (2004a) calculated H-ORAC intake from vegetables and fruits in the USA to be5558 mmol TE/d (2385 mmol TE/d from vegetables and3174 mmol TE/d from fruits). Rautiainen et al. (2008) estimatedthe total ORAC (H-ORAC + L-ORAC) intake from vegetables andfruits in Sweden to be 6523 mmol TE/d. These values are generallyin accordance with the value estimated in the present study(4423 mmol TE/d). Daily AOC intake was also estimated in otherstudies (Chun et al., 2005; Pellegrini et al., 2007; Yang et al., 2011),but antioxidant databases used in those study were not based onthe ORAC assay. Thus, a direct comparison is impossible becauseantioxidant capacity of foods differs greatly depending on theassay used.
3.5. Issues and perspectives of this study
In this study, the sum of hydrophilic antioxidants contained inraw vegetables and fruits commonly consumed in Japan wasfocused, but there are some limitations in the data presented here.(1) Each of the foods also contains a certain amount of lipophilicantioxidants. Thus, the sum of lipophilic antioxidants needs to bemeasured by the L-ORAC method in a future study. (2) ORAC datafor foods other than vegetables and fruits are important.Rautiainen et al. (2008) showed that contributors to the total
ORAC intake from all foods in Sweden were fruits (34.8%),vegetables (21.6%), grain products (19.7%), tea (9.5%), chocolate(4.9%), juice (3.9%) and wine (2.5%). Fukushima et al. (2009)suggested that beverages, especially coffee and green tea,contributed greatly to the consumption of polyphenols in theJapanese diet. Furthermore, soy beans and soy bean products werenot examined in the present study, but they are consumedfrequently in Japan and contain isoflavones, which have potentORAC activities (Rufer and Kulling, 2006). (3) The effects ofcooking and combinations of ingredients need to be clarified.Yamaguchi et al. (2001) and Jimenez-Monreal et al. (2009)studied changes in AOC of several vegetables during cooking andshowed that AOC can change positively or negatively aftercooking. Taking the above issues into consideration, a morecomprehensive ORAC database is needed for estimation of overalldaily intake of antioxidants.
4. Conclusions
The H-ORAC values for 23 vegetables commonly consumed inJapan ranged from 1.63 to 66.07 (average 6.95) mmol TE/g. The H-ORAC values for 13 fruits ranged from 1.58 to 33.47 (average12.23) mmol TE/g. The daily intake of hydrophilic antioxidantsfrom vegetables and fruits in Japan was estimated to be 4423 mmolTE/d (2967 mmol TE from vegetables and 1456 mmol TE fromfruits). This value is generally in accordance with the daily ORACintakes reported in earlier papers. The H-ORAC values for thevegetables and fruits evaluated had a strong positive correlationwith polyphenol contents (r = 0.956), suggesting that polyphenoliccompounds are major contributors to H-ORAC. The H-ORAC valuescorrelated with DPPH radical scavenging capacities (r = 0.894), butthe results of the H-ORAC assay were 1.0–18.2-times higher thanthe results of the DPPH assay. The H-ORAC values obtained herewere roughly consistent with those reported by the USDA(r = 0.696), but some foods showed largely different H-ORACvalues or are not included in the USDA’s ORAC database. Toelucidate the relationship between daily intake of antioxidants andhealth, continued research is needed on establishing a morecomprehensive AOC database including L-ORAC values, otherfoods and effects of cooking.
Acknowledgements
The authors thank three anonymous reviewers and A.Z.Mercadante, the Handling Editor, for their very helpful sugges-tions. This study was supported by three grants from the Ministryof Health, Labour and Welfare of Japan, from the Ministry ofAgriculture, Forestry and Fisheries (MAFF) of Japan, and from MAFFFood Research Project ‘‘Development of Evaluation and Manage-ment Methods for Supply of Safe, Reliable and Functional Food andFirm Produce’’.
Appendix A. Supplementary data
Supplementary data associated with this article can be found, inthe online version, at http://dx.doi.org/10.1016/j.jfca.2012.10.006.
References
Brighenti, F., Valtuena, S., Pellegrini, N., Ardigo, D., Del Rio, D., Salvatore, S., Piatti, P.,Serafini, M., Zavaroni, I., 2005. Total antioxidant capacity of the diet is inverselyand independently related to plasma concentration of high-sensitivity C-reactiveprotein in adult Italian subjects. The British Journal of Nutrition 93, 619–625.
Chun, O.K., Kim, D.O., Smith, N., Schroeder, D., Han, J.T., Lee, C.Y., 2005. Dailyconsumption of phenolics and total antioxidant capacity from fruit and vege-tables in the American diet. Journal of the Science of Food and Agriculture 85,1715–1724.
J. Takebayashi et al. / Journal of Food Composition and Analysis 29 (2013) 25–31 31
Devore, E.E., Kang, J.H., Stampfer, M.J., Grodstein, F., 2010. Total antioxidant capacityof diet in relation to cognitive function and decline. The American Journal ofClinical Nutrition 92, 1157–1164.
Fukushima, Y., Ohie, T., Yonekawa, Y., Yonemoto, K., Aizawa, H., Mori, Y., Watanabe,M., Takeuchi, M., Hasegawa, M., Taguchi, C., Kondo, K., 2009. Coffee and greentea as a large source of antioxidant polyphenols in the Japanese population.Journal of Agricultural and Food Chemistry 57, 1253–1259.
Horwitz, W., 1995. Protocol for the design, conduct and interpretation of method-performance studies. Pure and Applied Chemistry 67, 331–343.
ISO (Ed.), 2005. Determination of substances characteristic of green and black tea –part 1: content of total polyphenols in tea – colorimetric method using Folin-Ciocalteu reagent. ISO 14502-1, http://www.iso.org/iso/home/store/catalogue_tc/catalogue_detail.htm?csnumber=31356.
Jimenez-Monreal, A.M., Garcıa-Diz, L., Martınez-Tome, M., Mariscal, M., Murcia,M.A., 2009. Influence of cooking methods on antioxidant activity of vegetables.Journal of Food Science 74, H97–H103.
Lotito, S.B., Frei, B., 2006. Consumption of flavonoid-rich foods and increased plasmaantioxidant capacity in humans: cause, consequence, or epiphenomenon? FreeRadical Biology & Medicine 41, 1727–1746.
Mekary, R.A., Wu, K., Giovannucci, E., Sampson, L., Fuchs, C., Spiegelman, D., Willett,W.C., Smith-Warner, S.A., 2010. Total antioxidant capacity intake and colorectalcancer risk in the Health Professionals Follow-up Study. Cancer Causes &Control 21, 1315–1321.
Oki, T., Osame, M., Masuda, M., Kobayashi, M., Furuta, S., Nishiba, Y., Kumagai, T.,Sato, T., Suda, I., 2003. Simple and rapid spectrophotometric method forselecting purple-fleshed sweet potato cultivars with a high radical-scavengingactivity. Breeding Science 53, 101–107.
Osawa, T., Kato, Y., 2005. Protective role of antioxidative food factors in oxidativestress caused by hyperglycemia. Annals of the New York Academy of Sciences1043, 440–451.
Pellegrini, N., Salvatore, S., Valtuena, S., Bedogni, G., Porrini, M., Pala, V., Del Rio, D.,Sieri, S., Miglio, C., Krogh, V., Zavaroni, I., Brighenti, F., 2007. Development andvalidation of a food frequency questionnaire for the assessment of dietary totalantioxidant capacity. The Journal of Nutrition 137, 93–98.
Prior, R.L., Hoang, H., Gu, L., Wu, X., Bacchiocca, M., Howard, L., Hampsch-Woodill,M., Huang, D., Ou, B., Jacob, R., 2003. Assays for hydrophilic and lipophilicantioxidant capacity (oxygen radical absorbance capacity (ORACFL)) of plasmaand other biological and food samples. Journal of Agricultural and Food Chem-istry 51, 3273–3279.
Prior, R.L., Wu, X., Schaich, K., 2005. Standardized methods for the determination ofantioxidant capacity and phenolics in foods and dietary supplements. Journal ofAgricultural and Food Chemistry 53, 4290–4302.
Psaltopoulou, T., Panagiotakos, D.B., Pitsavos, C., Chrysochoou, C., Detopoulou, P.,Skoumas, J., Stefanadis, C., 2011. Dietary antioxidant capacity is inverselyassociated with diabetes biomarkers: the ATTICA study. Nutrition, Metabolism,and Cardiovascular Diseases 21, 561–567.
Puchau, B., Ochoa, M.C., Zulet, M.A., Marti, A., Martınez, J.A., Members, G., 2010.Dietary total antioxidant capacity and obesity in children and adolescents.International Journal of Food Sciences and Nutrition 61, 713–721.
Puchau, B., Zulet, M.A., Gonzalez de Echavarri, A., Hermsdorff, H.H., Martınez, J.A.,2009. Dietary total antioxidant capacity is negatively associated with somemetabolic syndrome features in healthy young adults. Nutrition 26, 534–541.
Rautiainen, S., Serafini, M., Morgenstern, R., Prior, R.L., Wolk, A., 2008. The validityand reproducibility of food-frequency questionnaire-based total antioxidantcapacity estimates in Swedish women. The American Journal of Clinical Nutri-tion 87, 1247–1253.
Rufer, C.E., Kulling, S.E., 2006. Antioxidant activity of isoflavones and their majormetabolites using different in vitro assays. Journal of Agricultural and FoodChemistry 54, 2926–2931.
Serafini, M., Bellocco, R., Wolk, A., Ekstrom, A.M., 2002. Total antioxidant potential offruit and vegetables and risk of gastric cancer. Gastroenterology 123, 985–991.
Takebayashi, J., Oki, T., Chen, J., Sato, M., Matsumoto, T., Taku, K., Tsubota-Utsugi, M.,Watanabe, J., Ishimi, Y., 2010. Estimated average daily intake of antioxidantsfrom typical vegetables consumed in Japan: a preliminary study. Bioscience,Biotechnology, and Biochemistry 74, 2137–2140.
Udagawa, K., Miyoshi, M., Yoshiike, N., 2008. Mid-term evaluation of Health Japan21: focus area for the nutrition and diet. Asia Pacific Journal of Clinical Nutrition17 (Suppl. 2), 445–452.
Valtuena, S., Pellegrini, N., Franzini, L., Bianchi, M.A., Ardigo, D., Del Rio, D., Piatti, P.,Scazzina, F., Zavaroni, I., Brighenti, F., 2008. Food selection based on totalantioxidant capacity can modify antioxidant intake, systemic inflammation,and liver function without altering markers of oxidative stress. The AmericanJournal of Clinical Nutrition 87, 1290–1297.
Watanabe, J., Oki, T., Takebayashi, J., Yamasaki, K., Takano-Ishikawa, Y., Hino, A.,Yasui, A., 2012. Method validation by interlaboratory studies of improvedhydrophilic oxygen radical absorbance capacity methods for determinationof antioxidant capacities of antioxidant solutions and food extracts. AnalyticalSciences 28, 159–165.
Watanabe, J., Oki, T., Takebayashi, J., Yamasaki, K., Tsushida, T., 2010. Interlabora-tory study of hydrophilic-oxygen radical absorbance capacity, a method formeasuring antioxidant capacity. Nippon shokuhin kagaku kogaku kaishi 57,525–531 Article in Japanese.
Wu, X., Beecher, G.R., Holden, J.M., Haytowitz, D.B., Gebhardt, S.E., Prior, R.L., 2004.Lipophilic and hydrophilic antioxidant capacities of common foods in theUnited States. Journal of Agricultural and Food Chemistry 52, 4026–4037.
Wu, X., Gu, L., Holden, J., Haytowitz, D.B., Gebhardt, S.E., Beecher, G., Prior, R.L., 2004.Development of a database for total antioxidant capacity in foods: a preliminarystudy. Journal of Food Composition and Analysis 17, 407–422.
Yamaguchi, T., Mizobuchi, T., Kajikawa, R., Kawashima, H., Miyabe, F., Terao, J.,Takamura, H., Matoba, T., 2001. Radical-scavenging activity of vegetables andthe effect of cooking on their activity. Food Science and Technology Research 7,250–257.
Yang, M., Chung, S.J., Chung, C.E., Kim, D.O., Song, W.O., Koo, S.I., Chun, O.K., 2011.Estimation of total antioxidant capacity from diet and supplements in US adults.The British Journal of Nutrition 106, 254–263.
Yoshiike, N., Hayashi, F., Takemi, Y., Mizoguchi, K., Seino, F., 2007. A new food guidein Japan: the Japanese food guide Spinning Top. Nutrition Reviews 65, 149–154.


![14] Antioxidants](https://img.pdfslide.us/doc/110x75/577ccfa61a28ab9e78904327/14-antioxidants.jpg)