Embed Size (px)
Citation preview
Hydrologic, Lithologic, and Chemical Data For Sediment in the Shallow Alluvial Aquifer at Two Sites near Fallon, Churchill County, Nevada, 1984-85
By Michael S. Lico, Alan H. Welch, and Jennifer L. Hughes
U.S. GEOLOGICAL SURVEY
Open-File Report 86-250
Carson City, Nevada
1986

UNITED STATES DEPARTMENT OF THE INTERIOR
DONALD PAUL HODEL, Secretary
GEOLOGICAL SURVEY
Dallas L. Peck, Director
For additional information write to:
U.S. Geological Survey Room 227, Federal Building 705 North Plaza Street Carson City, NV 89701
Copies of this report may be purchased from:
Open-File Services Section U.S. Geological Survey Box 25425, Federal Center Denver, CO 80225
Call (303) 236-7476 for ordering information

CONTENTS
ABSTRACT 1
INTRODUCTION 1
METHODS OF STUDY 8
Emplacement of sampling wells and piezometers 8Water levels 9Collection of sediment samples 9Laboratory analysis of sediment samples 9
HYDROGEOLOGIC DATA 15
REFERENCES CITED 43
ILLUSTRATIONS
Figures 1-3. Maps showing:
1. Location of study areas 2
2. Sampling wells, piezometers, andstaff gages at Dodge Ranch study area 3
3. Sampling wells at Harmon Lake study area 4
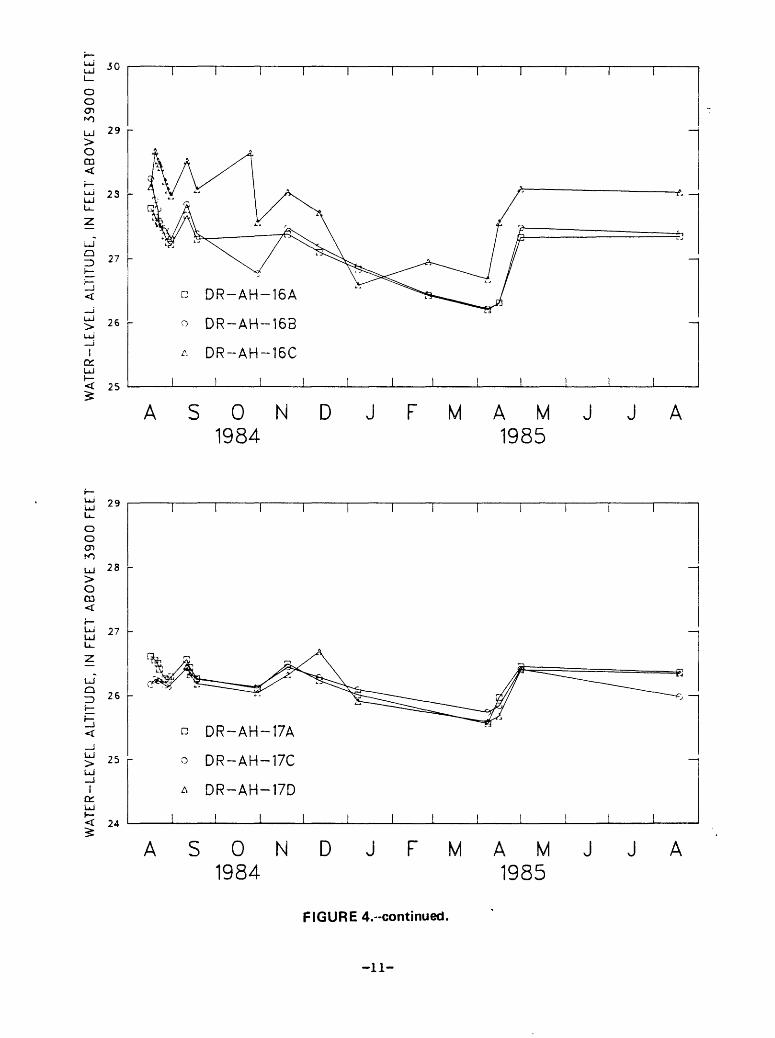
4. Hydrographs showing changes in water-level altitudesat selected wells at Dodge Ranch study area 10
5. Map showing water-level altitudes for September 11,1985, in wells at Dodge Ranch study area 12
6-29. Histograms of grain-size distribution of sediment from:
6. Well DR-AH-9, depth 3.5 feet 317. Well DR-AH-9, depth 6.0 feet 318. Well DR-AH-9, depth 12.5 feet 329. Well DR-AH-14A, depth 3.5 feet 32
10. Well DR-AH-14A, depth 9.0 feet 33
11. Well DR-AH-14A, depth 13.0 feet 3312. Well DR-AH-14A, depth 17.0 feet 3413. Well DR-AH-15A, depth 4.0 feet 3414. Well DR-AH-15A, depth 7.0 feet 3515. Well DR-AH-15A, depth 9.5 feet 35
^^^

Page
Figures 6-29. Continued
16. Well DR-AH-15A, depth 14.0 feet 3617. Well DR-AH-15A, depth 19.5 feet 3618. Well DR-AH-16A, depth 4.5 feet 3719. Well DR-AH-16A, depth 9.5 feet 3720. Well DR-AH-16A, depth 19.5 feet 38
21. Well DR-AH-16A, depth 26.5 feet 3822. Well DR-AH-16A, depth 29.5 feet 3923. Well DR-AH-17A, depth 4.0 feet 3924. Well DR-AH-17A, depth 8.0 feet 4025. Well DR-AH-17A, depth 14.5 feet 40
26. Well DR-AH-17A, depth 15.0 feet 4127. Well DR-AH-17A, depth 19.5 feet 4128. Well DR-AH-17A, depth 24.0 feet 4229. Well DR-AH-17A, depth 25.0 feet 42
TABLES
Table 1. Well locations, numbers, altitudes, and depths 5
2. Staff-gage locations and water-levelaltitudes at Dodge Ranch study area 7
3. Water-level altitudes in wells at Dodge Ranchstudy area 16
4. Water-level altitudes in wells at Harmon Lakestudy area 18
5. Lithologic logs of selected wells at Dodge Ranchstudy area 19
6. Total arsenic in sediment from wells at DodgeRanch study area 22
7. Total selenium in sediment from wells at DodgeRanch study area 25
8. Grain-size distribution of sediment from wells atDodge Ranch study area 26
^v

Table 9. Statistics of grain-size distribution of sediment from wells at Dodge Ranch study area
10. Porosity and hydraulic conductivity of sediment from wells at Dodge Ranch study area
11. Mineralogy of grain-size fraction greaterthan 2 micrometers in sediment from wells at Dodge Ranch study area -
12. Mineralogy of clay fraction (grain size less than 2 micrometers) in sediment from wells at Dodge Ranch study area -
Page
27
28
29
30
CONVERSION FACTORS AND ABBREVIATIONS
"Inch-pound" units of measure used in this report may be converted to International System (metric) units by using the following factors:
Multiply
AcresFeet (ft)Feet per day (ft/d)
Inches (in.) Miles (mi) Square miles
0.40470.30480.3048
25.401.6092.590
To obtain
Square hectometers (hm^)Meters (m)Meters per day (m/d)
Millimeters (mm)Kilometers (km)Square kilometers (km^)
To convert from the phi (<j>) size scale to the millimeter scale: size, in millimeters = io~4>/3 - 322
v

HYDROLOGIC, LITHOLOGIC, AND CHEMICAL DATA FOR SEDIMENT
IN THE SHALLOW ALLUVIAL AQUIFER AT TWO SITES
NEAR FALLON, CHURCHILL COUNTY, NEVADA, 1984-85
By Michael S. Lico, Alan H. Welch, and Jennifer L. Hughes
ABSTRACT
The U.S. Geological Survey collected an extensive amount of hydrogeologic data from the shallow alluvial aquifer at two study sites near Fallen, Nevada, from 1984 through 1985. These data were collected as part of a study to determine the geochemical controls on the mobility of arsenic and other trace elements in shallow ground-water systems. The main study area is approximately 7 miles south of Fallen. A subsidiary study area is about 8 miles east of Fallen. The data collected include litho- logic logs and water-level altitudes for the augered sampling wells and piezometers, and determinations of arsenic and selenium content, grain size, porosity, hydraulic conductivity, and mineralogy for sediment samples from cores.
INTRODUCTION
The U.S. Geological Survey collected hydrologic, lithologic, and chemical data from the shallow alluvial aquifer near Fallen, Nev. (fig. 1) in 1984 and 1985. These data were collected as part of the national Toxic Waste Program of the U.S. Geological Survey. The purpose of this specific study is to ascertain the geochemical controls affecting the mobility of arsenic and other trace elements in a variety of geochemical environments. The data presented in this report are from a study of a shallow alluvial ground-water system. The bulk of the data were collected from an area approximately 7 miles south of the city of Fallen, Nev., designated as the Dodge Ranch study area (fig. 2). Other data were collected approximately 8 miles east of Fallen in the Harmon Lake study area (fig. 3). The Dodge Ranch study area consists of an array of 10 sampling wells, 22 piezometers (water-level monitoring wells), and 4 staff gages within an area of approximately 0.06 square mile. The staff gages are located in irrigation ditches and drains. The Harmon Lake study area consists of nine sampling wells within an area of approximately 0.5 square mile. The locations of wells, piezometers, and staff gages are shown in figures 2 and 3, and basic information regarding the sites is listed in tables 1 and 2.
-1-

118° 45' 118U 35'
39° 30'
39° 25
\_L*; <^o>-''" "-*P?'. I tr;
JTlfSS
- a \.' MATAL *t^illT*rV«II .'
1 ,^^^^^^ ::-''" M c--^; :S;:Sx, ! "Base from U. S. Geological Survey 1:62,500, Soda Lake, Fallen, Carson Lake, 1951; Stillwater 1950
NEVADA
3 MILES
FIGURE 1.--Location of study areas (crosshatched).
-2-

' 1\
5»&
\
rI
R OQ CT '" '^r\» £.v7« c. ----- - - -
DODGE LANE
»4 08 1
020 ° 18 14 o 01 ;° 21 A15 t
023 16 B|A17 B! 19 C >'eZ Oil >. O
(f 9 o22 * >.
o 24 ^
5o >
o7 o 13
o10 ) o12
2o o3 06 >
_ J^-==.=.^== = =^E
>G-3
0 100 200 300 FEET L ____ I i }
: ".,--
SG-1
«̂
i-
EXPLANATION
DRAIN WELL
DITCH STAFF GAGE
SPILLWAY O PIEZOMETER
FIGURE 2.--LocatJons of sampling wells, piezometers, and staff gages at Dodge Ranch study area (SW^NM1̂ of section 6J. Numbers and letters next to well, piezometer, and staff-gage symbols are abbreviated forms of those listed in tables 1 and 2.
-3-

118° 38'R. 30 E.
39° 28'
Base from US. Geological Survey 1:62,500, Carson Lake, 1951 EXPLANATION
WELL
1/2
MILE
FIGURE 3.-Location of sampling wells at Harmon Lake study area. Numbers and letters next to well symbols are abbreviated forms of those listed in table 1.

TABLE 1. Well locationsj numbers, altitudes ., and depths
Location
WellLati tude
Longi tude Well number
DODGE
Land- surface
altitude (feet above sea level)
Well depth^ (feet)
Total depth
drilled (feet)
RANCH STUDY AREA
Sampling Wells
DR-AH-15ADR-AH-15BDR-AH-15CDR-AH-1 6ADR-AH-1 6B
DR-AH-16CDR-AH-1 7ADR-AH-1 7BDR-AH-1 7CDR-AH-1 7D
392208392208392208392208392208
392208392207392207392207392207
11846381184638118463811846421184642
11846421184646118464611846461184646
N17N17N17N17N17
N17N17N17N17N17
E29E29E29E29E29
E29E29E29E29E29
06BCA0706BCA0806BCA0906BCB0206BCB03
06BCB0406BCB0806BCB0906BCB1006BCB18
33333
33333
,932.,932.,932.,931.,931.
,931.,930.,930.,930.,930.
69767
77677
19.11.45.28.20.
9.26.19.9.
19.
73282
72982
19.711.361.529.020.2
9.745.019.99.8
19.2
Piezometers
DR-AH-1DR-AH-2DR-AH-3DR-AH-4DR-AH-5
DR-AH-6DR-AH-7DR-AH-8DR-AH-9DR-AH-1 0
DR-AH-11DR-AH-1 2DR-AH-1 3DR-AH-1 4ADR-AH-1 4B
DR-AH-1 8DR-AH-1 9DR-AH-2 0
392209392159392158392210392205
392158392203392210392207392201
392207392201392203392209392209
392209392207392209
11846341184634118464811846481184634
11846401184648118464211846361184645
11846451184637118464111846341184634
118463711846391184640
N17N17N17N17N17
N17N17N17N17N17
N17N17N17N17N17
N17N17N17
E29E29E29E29E29
E29E29E29E29E29
E29E29E29E29E29
E29E29E29
06BCA0106BCD0306BCC0206BCB1306BCA04
06BCD0106BCC0106BCB0106BCA0506BCC03
06BCB0706BCD0206BCC0406BCA0206BCA03
06BCA0606BCA1006BCA11
33333
33333
33333
333
,933.,932.,929.,930.,933.
,930.,929.,931.,932.,930.
,930.,931.,931.,933.,933.
,933.,932.,932.
24472
98641
98010
032
6.9.8.9.7.
11.11.7.
10.7.
10.9.
12.19.10.
9.9.8.
37896
03011
92363
884
6.39.78.89.97.6
11.011.37.013.07.1
10.99.212.319.610.3
9.89.88.4
-5-

TABLE 1. J/ell locations, numbers, altitudes, and depths Continued
Location
Well
DR-AH-22 DR-AH-23 DR-AH-24
Lati tude
392207 392208 392206
Longi
tude
1184644 1184648 1184647
Well
N17 N17 N17
E29 E29 E29
number
06BCB05 06BCB12 06BCB11
Land-surface
altitude (feet above sea level)
3,930.8 3,930.5 3,930.4
Well depth^ (feet)
9.9 9.8 9.5
Total depth
drilled (feet)
9.9 9.8 9.5
HARMON LAKE STUDY AREA
Sampling Wells
HL-AH-2HL-AH-2AHL-AH-3HL-AH-4HL-AH-5
HL-AH-5AHL-AH-6AHL-AH-6BHL-AH-7
392823392823392823392821392758
392758392828392828392811
11837071183707118362111836151183651
1183651118361211836121183637
N19N19N19N19N19
N19N19N19N19
E30E30E30E30E30
E30E30E30E30
33ABA0233ABA0134BAB0134BAD0133ADB02
33ADB0134BAA0134BAA0233ADD01
33333
3333
,917,917,917,915,915
,916,914,914,914
.4
.1
.3
.2
.9
.0
.2
.2
.8
18.29.21.12.13.
30.25.12.10.
19494
5288
19.030.023.017.013.4
30.525.214.630.0
* Completed well depth is bottom of screened interval, relative to land surface.
fi
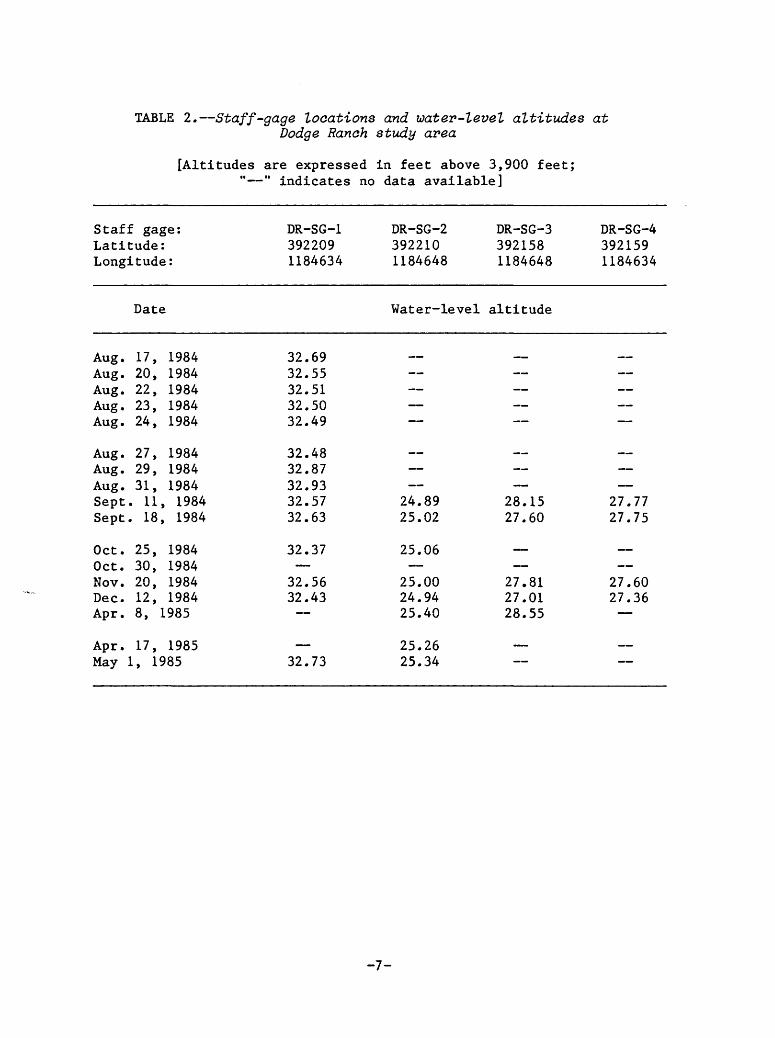
TABLE 2. Staff-gage locations and water-level altitudes atDodge Ranch study area
[Altitudes are expressed in feet above 3,900 feet; " " indicates no data available]
Staff gage:Latitude:Longitude:
DR-SG-13922091184634
DR-SG-23922101184648
DR-SG-33921581184648
DR-SG-43921591184634
Date Water-level altitude
Aug. Aug. Aug. Aug. Aug.
17, 20, 22, 23, 24,
1984 1984 1984 1984 1984
32 32 32 32 32
.69
.55
.51
.50
.49
__ __
Aug. 27, 1984 32.48Aug. 29, 1984 32.87Aug. 31, 1984 32.93 Sept. 11, 1984 32.57 24.89 28.15 27.77Sept. 18, 1984 32.63 25.02 27.60 27.75
Oct. 25, 1984 32.37 25.06 - Oct. 30, 1984 - Nov. 20, 1984 32.56 25.00 27.81 27.60Dec. 12, 1984 32.43 24.94 27.01 27.36Apr. 8, 1985 25.40 28.55 -
Apr. 17, 1985 25.26 - May 1, 1985 32.73 25.34
-7-

The local well numbering system used in this report is based on the rectangular subdivision of the public lands referenced to the Mount Diablo base line and meridian. Each number consists of three units separated by spaces: The first unit is the township, preceded by an N or S to indicate location north or south of the base line. The second unit is the range, preceded by an E to indicate location east of the meridian. The third unit consists of the section number and letters designating the quarter section, quarter-quarter section, and so on (A, B, C, and D indicate the northeast, northwest, southwest, and southeast quarters, respectively), followed by a number indicating the sequence in which the well was recorded. For example, well N17 E29 06BCB06 is the sixth well recorded in NW| of the SWi of the NWi of section 6, Township 17 North, Range 29 East, Mount Diablo base line and meridian.
The site-naming system used in the tables and figures of this report indicates the study area, type of measuring point, and site number. The first segment of the designation indicates study area: DR for Dodge Ranch and HL for Harmon Lake. The second segment indicates the type of measuring site: AH for auger hole (sampling wells and piezometers) and SG for staff gage. The third segment indicates the site number within each study area.
The authors thank William Slentz and Ray Lannen of Island Ranch and Circle D Feeds for access to their property, as well as the U.S. Bureau of Reclamation and the Truckee-Carson Irrigation District for information on irrigation of the Fallen area. We also acknowledge Darrell K. Nordstrom and Ivan Barnes of the U.S. Geological Survey, Menlo Park, Calif., for use of their analytical facilities. Special thanks are extended to Patrick A. Glancy of the U.S. Geological Survey, Carson City, Nev., for his insight into the geochemistry and stratigraphy of the Fallen area.
METHODS OF STUDY
Emplacement of Sampling Wells and Piezometers
Sampling wells and piezometers in the Dodge Ranch and Harmon Lake study areas were drilled with either a 3-inch solid-stem auger or a 7-inch hollow-stem auger. No drilling fluids were used during drilling. The sampling wells and piezometers were logged by noting each change in lithology. Selected logs are listed in table 5. Wells and piezometers were cased with 2-inch inside-diameter polyvinyl chloride (PVC) pipe. Perforated intervals consisted of premanufactured machine-slit PVC well screens (0.006-inch slots). Washed Monterey sand was added to the annulus to cover the screened interval; then bentonite pellets were added to create a seal at least 1 foot thick. The remainder of the annular space was back filled with drill cuttings. A surface seal was emplaced with bentonite pellets. The wells and piezometers were capped and cement water-meter boxes were placed over the wells.
-8-
Water Levels
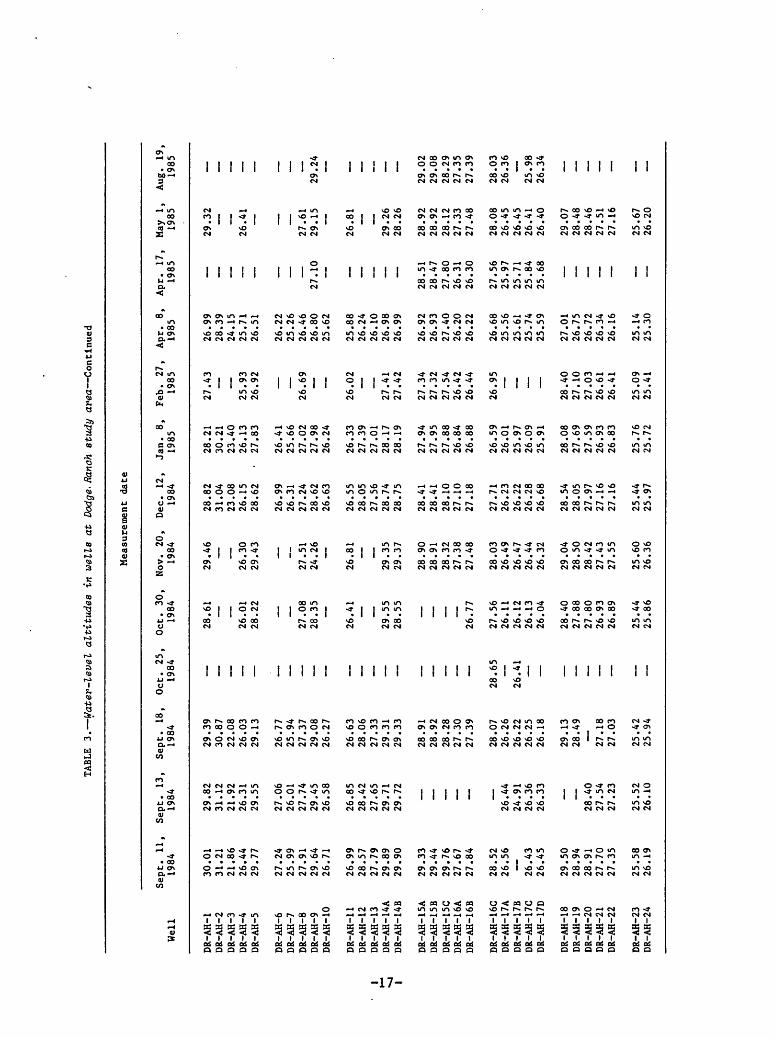
Water levels were periodically measured in the sampling wells and piezometers at the Dodge Ranch and Harmon Lake study areas. These data are tabulated in tables 3 and 4. Hydrographs showing the water-level variations with time in 10 representative wells at the Dodge Ranch area are presented in figure 4. Water levels for a representative date, September 11, 1985, are shown for the Dodge Ranch area in figure 5. Water-level data for the staff gages are listed in table 2.
Collection of Sediment Samples
Sediment samples were collected during the drilling. Cores were taken through the hollow-stem auger with a stainless-steel, split-spoon drive sampler fitted with a polycarbonate liner. The cores were removed from the sampler, capped, and the ends sealed with paraffin. All cores were kept refrigerated until analysis. In addition, bulk sediment samples were obtained as the auger brought the cuttings to land surface. These samples were placed into plastic containers and sealed.
Laboratory Analysis of Sediment Samples
Lithologic and chemical analyses made on the sediment samples from the Dodge Ranch study area included determinations of grain-size, porosity, hydraulic conductivity, total arsenic content, total selenium content, arsenic content of specific grain-size fractions, and arsenic content of specific grain types. Tables 6 through 10 list the results of these analyses.
Grain-size analysis was made on the unconsolidated sediment by standard dry and wet sieving methods (Folk, 1955, p. 33-40). The silt- and clay-sized fractions were analyzed by the pipette method of Folk (1955, p. 37-40).
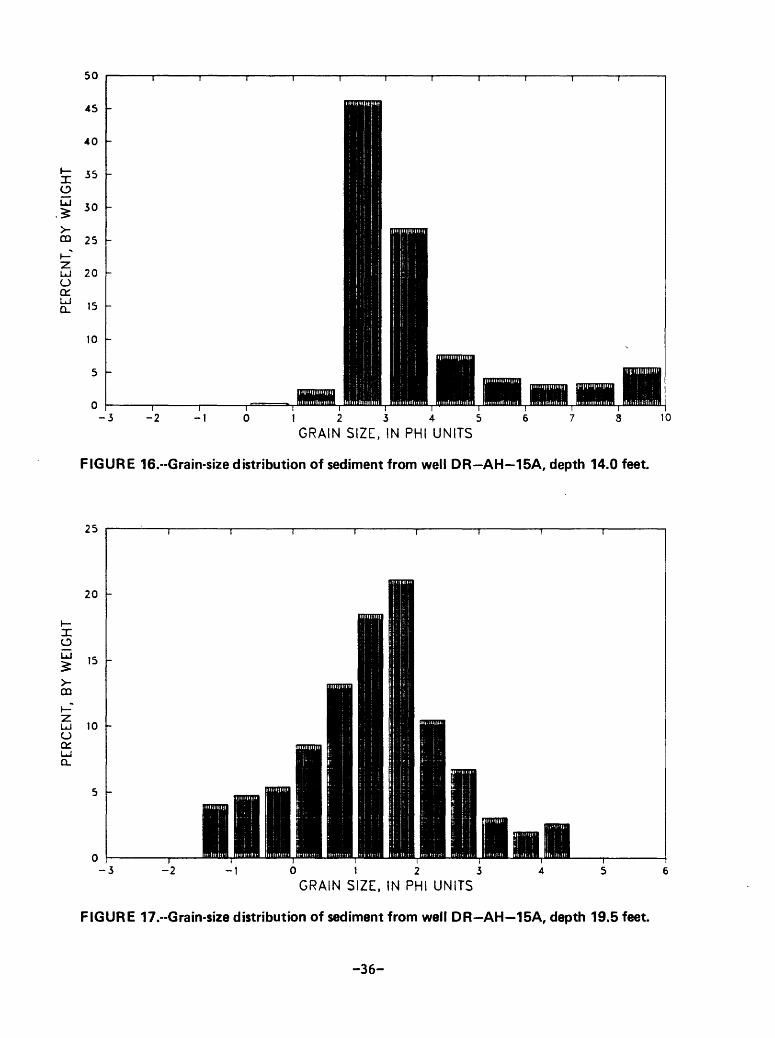
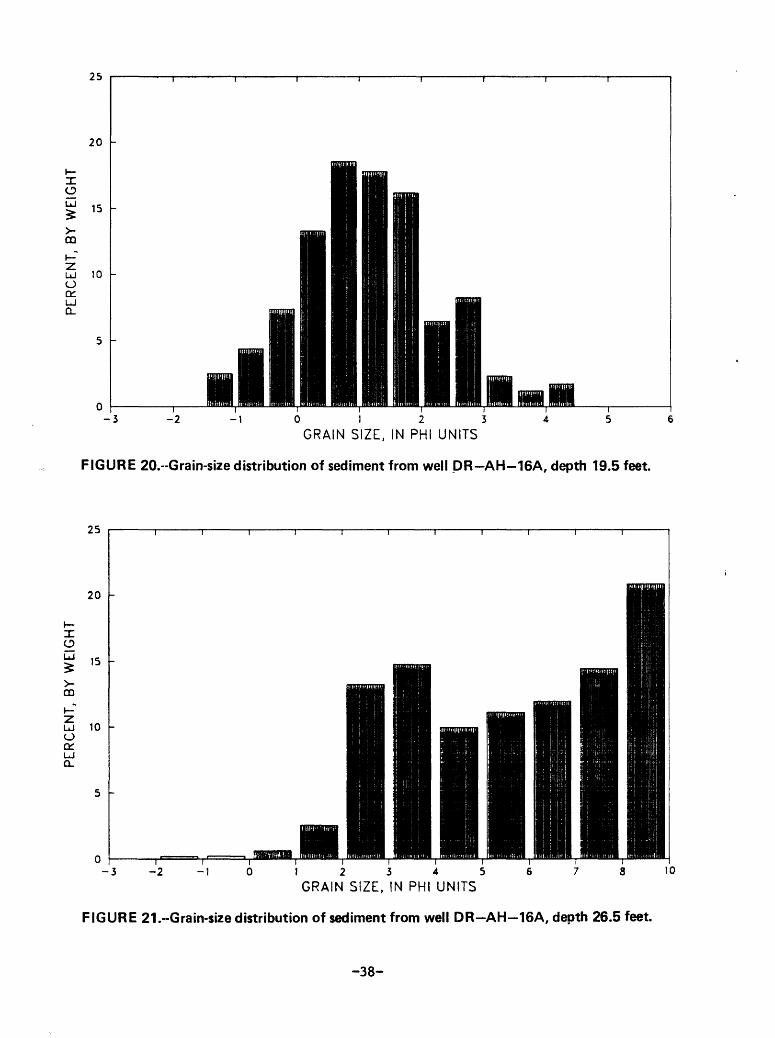
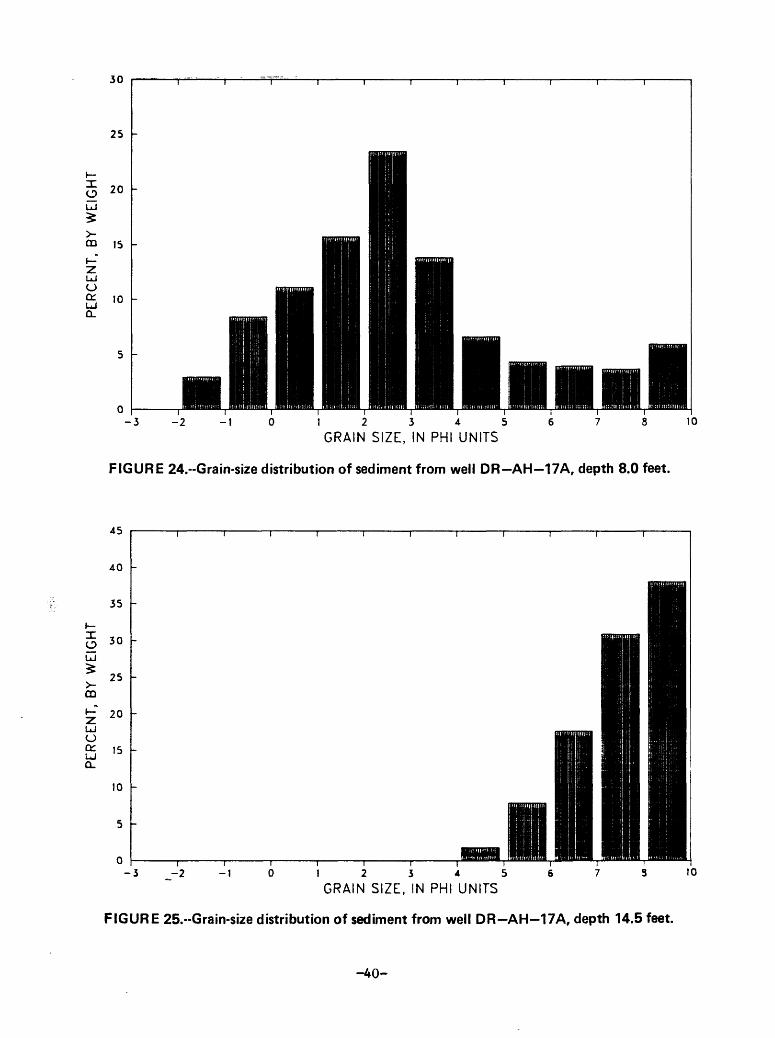
Statistical data for the sieve analysis of sediments from the Dodge Ranch study area were calculated using methods outlined by Folk (1955, p. 42-53) and Pettijohn (1975, p. 39), and are presented in table 9. The grain-size distribution in sediment samples is shown in figures 6-29. To convert the grain sizes from the phi-size scale used in figures 6-29 to the millimeter scale, use the following table:
Phi size Millimeters Phi size Millimeters
-2-1
01234
4.002.001.00
.50
.25
.125
.0625
56789
10
0.0312.0156.0078.0039.0020.00098
-9-

Oo
OCD
40
35
25
I I I I I I I
20
I ccUJ
D DR-AH-9
J___I I
J A S 0 N D 1984
J F M A M 1985
J J A
UJ
o oenro
UJ> oCD
31
30
H 29
UJ Q
UJ> UJ
28
27
26
DR-AH-15A
DR-AH-15B
DR-AH-15C
J_____I
SON 1984
D J F M A M 1985
J J A
FIGURE 4.--Changes in water-level altitudes with time in selected wells at Dodge Ranch study area.
-10-
WA
TE
R-L
EV
EL
ALT
ITU
DE
, IN
FE
ET
AB
OV
E 3
90
0 F
EE
TW
AT
ER
-LE
VE
L. A
LTIT
UD
E,
IN F
EE
T A
BO
VE
3
90
0 F
EE
T
c DO
m I
CO
H)
__
00
O
LD
00 cn
o o
CO
CD
__ 00
O
LD oo cn
cn O

22.33
R. 29. E
DODGE LANE
26.44 27.91 o
25.58e
26.56 26.43| 26.45
026.19
27.70o
26.99
02735
28.91o
29.50o
29.011
27.67 128.52
29.44I2"3 * 29.76
o 28.94
29.8929.90
9 98 30.01-
29.64
o 25.99
26°71
21.86o
25.11
27°79
02857
027.24
o > 29.77
100 200 300 FEET
EXPLANATION
DRAIN WELL
DITCH STAFF GAGE
SPILLWAY o PIEZOMETER
FIGURE 5.--Water-level altitudes for September 11, 1985, in wells at Dodge Ranch study area. Values listed are in feet above 3,900 feet.
-12-

Samples for arsenic and selenium analysis were prepared by grinding the sediment to a fine powder and dissolving it in a mixture of hydro fluoric, hydrochloric, and perchloric acids to which nitric acid was added to maintain oxidizing conditions. Arsenic and selenium were then deter mined by hydride-generation atomic-absorption analysis (Skougstad and others, 1979, p. 61-63).
Porosity was determined using the resaturation method described by Amyx and others (1960, p. 39-57).
Hydraulic conductivity was determined using standard steady-state techniques incorporating the Darcy Law of homogeneous flow (Amyx and others, 1960, p. 71-83). Deionized water was used as the permeating fluid at ambient temperature. These data are listed in table 10.
The sediment from a few wells at the Dodge Ranch study area was analyzed for mineral content by x-ray diffraction analysis using a Picker^ diffractometer. Sediment samples were split into two size fractions (greater than 2 micrometers and less than 2 micrometers) by centrifugation, The two fractions were analyzed by the authors using standard x-ray diffraction techniques (Carroll, 1970, p. 51-61; Nuffield, 1966, p. 130-137). Results of the x-ray diffraction analyses are listed in tables 11 and 12.
^ The use of a trade name in this report is for identification purposes only and does not constitute endorsement by the U.S. Geological Survey.
-13-
l?

HYDROGEOLOGIC DATA
-15-

TABL
E 3. Water-level
altitudes
in we
lls
at Dodge
Ranch
stud
y area
[Values
are
expressed
in fe
et ab
ove
3,90
0 fe
ec; " " in
dica
tes
no data av
aila
ble]
Mea
sure
men
t d
ate
1 i
ON 1
Wel
l
DR
-AH
-1D
R-A
H-2
DR
-AH
-3D
R-A
H-4
DR
-AH
-5
DR
-AH
-6D
R-A
H-7
DR
-AH
-8D
R-A
H-9
DR
-AH
-10
DR
-AH
-11
DR
-AH
-1 2
DR
-AH
-1 3
DR
-AH
-14A
DR
-AH
-14B
DR
-AH
-15A
DR
-AH
-1 5B
DR
-AH
-1 5
CD
R-A
H-1
6AD
R-A
H-1
6B
DR
-AH
-16C
DR
-AH
-17A
DR
-AH
-17B
DR
-AH
-17C
DR
-AH
-1 7D
DR
-AH
-1 8
DR
-AH
-1 9
DR
-AH
-20
DR
-AH
-2 1
DR
-AH
-22
DR
-AH
-23
DR
-AH
-24
June
21
, 19
84
29.3
223
.99
23.7
226
.29
29.1
3
27.2
925
.91
27.4
529
.12
26.4
2
26.8
228
.32
27.2
9 _ _
Jun
e 29
, 19
84
28.8
024
.83
23.7
826
.00
28.6
0
27.0
926
.02
26.9
328
.84
25.9
5
26.5
227
.87
27.0
2 _ _
July
6
, 19
84
30.6
231
.91
24.2
926
.87
30.6
5
27.4
226
.71
28.1
631
.22
26.7
0
27.1
529
.19
28.2
0 _ _
July
20
, 19
84
31
.15
32.0
926
.28
26.9
330
.95
28.0
22
8.9
428
.90
31
.60
28.6
5
27.5
430
.09
29.5
6
July
26
, 19
84
30.3
723
.81
20.1
626
.51
29.7
9
27.3
720
.94
28.0
629
.70
26.8
6
27.0
328
.69
28.0
5 _
Aug
. 17
, 19
84
31.8
1
26.7
8
27.4
8
28.6
3
28.6
3
27.2
630
.16
28.8
431
.54
31.5
6
30.7
93
0.8
0
27.7
828
.24
28.1
126
.61
23.8
326
.17
.
Aug
. 20,
1984
30.4
931
.95
22.9
226
.49
30.3
5
27.1
726
.34
28.0
530
.13
26.7
7
26.9
728
.69
27.8
330
.31
30.3
2
29.7
929
.81
27.6
427
.91
28.6
726
.55
25.2
026
.25
Aug
. 22
, 19
84
30.2
131
.89
22.9
526
.42
30.0
4
27.1
126
.16
27.9
029
.85
26.6
3
26.8
728
.64
27.6
530
.11
30.1
2
29.5
829
.58
27.5
827
.77
28.5
226
.50
25.6
026
.23
Aug
. 23
, 19
84
30.1
131
.82
22.9
726
.38
29.9
3
27.0
626
.10
27.8
429
.77
26.5
8
-
28.5
927
.60
29.9
729
.99
29.4
729
.48
27.5
427
.48
28.4
726
.41
26.2
2
Aug
. 24
, 19
84
30.0
231
.77
21.2
426
.35
29.8
4
27.0
226
.07
27.8
129
.68
26.5
6
26.8
128
.54
27.5
529
.89
29.9
1
29.4
029
.41
28.4
1
Aug
. 27
, 19
84
29.6
831
.56
21.3
426
.12
29.4
9
26.8
425
.95
27.5
329
.35
26.3
1
26.6
728
.66
27.3
829
.56
29.5
8
29.0
929
.11
27.3
527
.47
28.2
026
.26
20.5
626
.16
Aug
. 29
, 19
84
^2
9.4
931
.43
21.3
826
.10
29.2
8
26.8
225
.79
27.3
629
.17
26.2
3
26.6
328
.10
27.2
529
.38
29.3
9
28.9
428
.96
27.2
5
28.0
626
.24
26.1
3
Aug
. 31
, 19
84
29.4
931
.32
21.4
826
.12
29.3
1
26.7
025
.88
27.3
229
.06
26.1
8
26.6
228
.04
27.1
729
.34
29.3
5
28.8
428
.85
27.2
227
.31
27.9
726
.29
TABL
E 3. Water-level
alti
tude
s in w
ells
at
Dodge* Ran
ch s
tudy area Continued
Measurement
date
Wel
l
DR
-AH
-1D
R-A
H-2
DR
-AH
-3D
R-A
H-4
DR
-AH
-5
DR
-AH
-6D
R-A
H-7
DR
-AH
-8D
R-A
H-9
DR
-AH
-10
DR
-AH
-1 1
DR
-AH
-1 2
DR
-AH
-1 3
DR
-AH
-1 4
AD
R-A
H-1
4B
DR
-AH
-15A
DR
-AH
-1 5
BD
R-A
H-1
50
DR
-AH
-1 6
AD
R-A
H-1
6B
DR
-AH
-1 6
0D
R-A
H-1
7 A
DR
-AH
-1 7
BD
R-A
H-1
7CD
R-A
H-1
7D
DR
-AH
-18
DR
-AH
-1 9
DR
-AH
-20
DR
-AH
-2 1
DR
-AH
-22
DR
-AH
-23
DR
-AH
-24
Sep
t.
11,
1984
30.0
131
.21
21.8
626
.44
29
.77
27
.24
25
.99
27
.91
29
.64
26
.71
26.9
928.5
72
7.7
929.8
92
9.9
0
29
.33
29.4
42
9.7
627
.67
27
.84
28
.52
26
.56
26
.43
26
.45
29.5
028
.94
28
.91
27.7
02
7.3
5
25.5
826.1
9
Sep
t.
13,
1984
29
.82
31.1
221.9
226.3
129.5
5
27.0
626.0
12
7.7
42
9.4
52
6.5
8
26.8
52
8.4
22
7.6
529.7
129.7
2
_ _2
6.4
424.9
126.3
62
6.3
3
28.4
027.5
427.2
3
25
.52
26
.10
Sep
t.
18,
1984
29.3
930.8
722.0
826.0
329.1
3
26.7
72
5.9
427.3
729.0
826.2
7
26.6
328.0
627.3
329.3
129.3
3
28.9
128.9
22
8.2
827.3
027.3
9
28
.07
26.2
62
6.2
226.2
526.1
8
29
.13
28.4
9 27.1
82
7.0
3
25
.42
25
.94
Oct
. 2
5,
Oct
. 3
0,
1984
19
84
28.6
1
26.0
1
28
.22
__
_
27
.08
28
.35
26.4
1
29
.55
28
.55
26
.77
28.6
5
27
.56
26.1
126.4
1
26
.12
26
.13
26
.04
28.4
0
27.8
8
27.8
0
26.9
3
26
.89
25
.44
25.8
6
Nov
. 2
0,
1984
29
.46
26
.30
29
.43
_
27
.51
24
.26
26.8
1
29.3
529.3
7
28
.90
28.9
12
8.3
22
7.3
82
7.4
8
28
.03
26
.49
26.4
72
6.4
426.3
2
29
.04
28.5
02
8.4
227.4
32
7.5
5
25
.60
26
.36
Dec
. 12
, 19
84
28.8
231.0
42
3.0
826.1
528.6
2
26.9
926
.31
27.2
428.6
226.6
3
26.5
528.0
527.5
628.7
428.7
5
28.4
12
8.4
12
8.1
02
7.1
02
7.1
8
27.7
12
6.2
326.2
22
6.2
826.6
8
28.5
42
8.0
527.9
72
7.1
627.1
6
25.4
425.9
7
Jan.
8,
1985
28.2
130.2
123.4
02
6.1
3
27
.83
26.4
125.6
627.0
227.9
82
6.2
4
26
.33
27
.39
27.0
12
8.1
72
8.1
9
27
.94
27
.95
27.8
82
6.8
42
6.8
8
26
.59
26.0
125.9
72
6.0
925.9
1
28
.08
27
.69
27
.59
26
.93
26
.83
25.7
62
5.7
2
Feb
. 27
, 19
85
27.4
3
25.9
32
6.9
2
26.6
9
26.0
2
27
.41
27.4
2
27
.34
27
.32
27
.54
26.4
22
6.4
4
26
.95
28.4
027.1
027.0
326.6
126.4
1
25.0
925.4
1
Apr.
8,
1985
26.9
928.3
92
4.1
525.7
126
.51
26.2
225.2
626.4
626.8
025.6
2
25
.88
26.2
426.1
026.9
82
6.9
9
26.9
226.9
32
7.4
026.2
026.2
2
26.6
825.5
625
.61
25.7
425.5
9
27.0
12
6.7
526.7
22
6.3
426.1
6
25
.14
25.3
0
Ap
r.
17,
1985
^.^ _
27.1
0
28
.51
28
.47
27.8
02
6.3
126.3
0
27
.56
25
.97
25
.71
25
.84
25
.68
_
May
1,
19
85
29.3
2
26
.41 __
27
.61
29.1
5
26
.81
29.2
62
8.2
6
28.9
22
8.9
228.1
227.3
32
7.4
8
28
.08
26.4
526.4
52
6.4
12
6.4
0
29.0
728.4
828.4
62
7.5
12
7.1
6
25
.67
26
.20
Aug
. 19
, 19
85
^.^ _
29.2
4
29.0
229.0
828.2
927.3
52
7.3
9
28.0
326.3
6
25.9
826.3
4
_

TABLE 4. Voter-level altitudes in wells at Harmon Lake study area
[Values are expressed in feet above 3,900 feet; " " indicates no data available]
Measurement date
July 17, Aug. 9, Aug. 15, Aug. 16, Aug. 20, Aug. 21, Aug. 24, Aug. 30, Well 1984 1984 1984 1984 1984 1984 1984 1984
HL-AH-2 HL-AH-2A HL-AH-3 HL-AH-4 HL-AH-5
HL-AH-5A HL-AH-6A HL-AH-6B HL-AH-7
6.90
7.42 7.34
Feb. 25, 1985
HL-AH-2 HL-1H-2AHL-fH-3HL-AH-4HL-AH-5
HL-AH-5AHL-AH-6AHL-AH-6BHL-AH-7
8.46 8.277.61
8.15
9.096.186.207.14
6.45
Feb. 26, 1985
8.47 7.487.55 8.09
9.086.196.247.16
7.49 8.46 7.25 6.91 8.66
10.06 6.61 6.03 7.61
Feb. 27, 1985
7.577.868.13
9.046.186.187.14
7.61 7 8.45 8 7.24 7 6.90 6 8.62 8
9.95 9 6.60 6 6.64 6 7.60 7
Apr. 10, 1985
8.60 6.467.707.358.18
8.166.266.297.23
.86 7
.44 8
.22 7
.83 6
.60 8
.80 9
.60 6
.65 6
.58 7
May 1, 1985
8.58 6.897.757.388.22
8.206.326.367.26
.90
.45
.21 7.23 7.23
.83 6.90 6.84
.60 8.60 8.59
.78 8.60 8.58
.59 6.61 6.61
.61 6.64 6.65
.58 7.57 7.55
June 25, 1985
8.21 7.146.926.108.23
8.186.306.289.53
Oct. 28, 1985
9.82 7.407.146.917.86
7.885.965.976.92
-18-

TABLE 5. Lithologio logs of selected wells at the Dodge Ranch study area*
Thickness Depth Material (feet) (feet)
WELL DR-AH-9:
Sand, very-fine-grained, silty, dark yellowish brown (10YR4/2), well-sorted, sub-rounded, quartz-rich, 5 percent muscovite 4.0 4.0
Sand, very-fine-grained, silty, dark yellowish brown(10YR4/2), well-sorted, rounded, quartz-rich 2.5 6.5
Sand, very-fine-grained, silty, dark yellowish brown (10YR4/2), well-sorted, rounded, quartz-rich, 1 percent muscovite 6.5 13.0
WELL DR-AH-14A:
Sand, very-fine- to medium-grained, dark yellowish brown(10YR4/2), quartz-rich, clay pods up to 0.5 inch 5.0 5.0
Sand, very-fine- to fine-grained, dark yellowish brown(10YR4/2), quartz-rich 5.0 10.0
Sand, fine-grained, dark yellowish brown (10YR4/2),moderately well-sorted, well-rounded, quartz-rich 3.0 13.0
Sand, fine-grained, dark yellowish brown (10YR4/2), moderately well-sorted, well-rounded, quartz-rich, 1 percent muscovite 4.0 17.0
Clay, dark yellowish brown (10YR4/2) 2.6 19.6
WELL DR-AH-15C:
Sand, fine-grained, dark yellowish brown (10YR4/2),poorly sorted, quartz-rich 5.0 5.0
Sand, very-fine- to fine-grained, dark yellowish brown(10YR4/2), quartz-rich 5.0 10.0
Sand, fine-grained, dark yellowish brown (10YR4/2),well sorted, quartz-rich 5.0 15.0
Sand, fine- to medium-grained, dark yellowish brown(10YR4/2), quartz-rich 5.0 20.0
-19-

TABLE 5. Lithologic logs of selected wells at the Dodge Ranch study area-* Continued
Thickness Depth Material (feet) (feet)
WELL DR-AH-15C (continued):
Clay, sandy, dark yellowish brown (10YR4/2) 13.0 33.0
Clay, black (Nl), stiff, minor sand lenses, sulfurous odor 28.5 61.5
WELL DR-AH-16A:
Sand, fine- to very-coarse-grained, dark yellowish brown (10YR4/2), poorly sorted, sub-rounded, quartz-rich, minor clay pods 3.0 3.0
Sand, very-coarse-grained, dark yellowish brown(10YR4/2), poorly sorted, sub-angular, quartz-rich 6.0 9.0
Sand, fine- to coarse-grained, silty, dark yellowish brown(10YR4/2), quartz-rich 8.0 17.0
Clay, dark yellowish brown (10YR4/2), silty 2.0 19.0
Sand, fine- to coarse-grained, silty, dark yellowish brown(10YR4/2), quartz-rich 6.0 25.0
Clay, silty, dark yellowish brown .(10YR4/2) 1.0 26.0
Sand, fine- to coarse-grained, silty, dark yellowish brown(10YR4/2), quartz-rich 1.0 27.0
Clay, light olive-gray (5Y5/2) 2.0 29.0
WELL DR-AH-17A:
Sand, fine- to medium-grained, dark yellowish brown(10YR4/2), quartz-rich, minor clay pods 4.5 4.5
Clay, silty, dark yellowish brown (10YR4/2) 3.5 8.0
Sand, fine- to very-coarse-grained, dark yellowish brown(10YR4/2), sub-rounded, quartz-rich, some clay pods 7.0 15.0
Sand, fine-grained, dark yellowish brown (10YR4/2), wellsorted, sub-rounded, quartz-rich, silty in places 10.0 25.0
-20-

TABLE 5. Lithologic logs of selected wells at the Dodge Ranch study area* Continued
Thickness Depth Material (feet) (feet)
WELL DR-AH-17A (continued):
Sand, very-fine- to fine-grained, dark yellowish brown(10YR4/2), sub- rounded to rounded, quartz-rich 2.0 27.0
Clay, light olive-gray (5Y5/2) 18.0 45.0
^ Colors are for undried samples and are based on Rock-Color Chart (Munsell System) distributed by Geological Society of America.
-21-

TABLE 6. Total arsenic in sediment from wells at Dodge Ranch study area
Well
DR-AH-1DR-AH-2DR-AH-2DR-AH-3DR-AH-4
DR-AH-4DR-AH-5DR-AH-7DR-AH-8DR-AH-9
DR-AH-1 0DR-AH-1 2DR-AH-1 4ADR-AH-1 4ADR-AH-1 5A
DR-AH-1 5ADR-AH-1 5ADR-AH-1 5ADR-AH-1 5ADR-AH-1 5A
DR-AH-1 5ADR-AH-1 5ADR-AH-1 5ADR-AH-1 5CDR-AH-1 5C
DR-AH-1 5CDR-AH-1 5CDR-AH-1 5CDR-AH-1 5CDR-AH-1 5C
DR-AH-1 5CDR-AH-1 5CDR-AH-1 5CDR-AH-1 5CDR-AH-1 5C
Depth (feet)
7.04.07.09.07.0
10.04.03.04.013.0
7.510.0
3.5-4.09.0-9.58.5-10
8.5-108.5-1019.5-2019.5-2019.5-20
19.5-2019.5-2019.5-20
4-54-5
4-54-54-54-54-5
2125.5-26.5
50-50.550-50.550-50.5
Size fraction (millimeters)
Whole rockWhole rockWhole rockWhole rockWhole rock
Whole rockWhole rockWhole rockWhole rockWhole rock
Whole rockWhole rock
< 0.0625< 0.0625
0.25-0.125
0.125-0.0625< 0.0625
2.00-1.001.00-0.500.50-0.25
0.25-0.1250.125-0.0625
< 0.06252.00-1.001.00-0.50
0.50-0.250.25-0.125
0.125-0.0625< 0.0625
Whole rock
Whole rockWhole rock0.25-0.1250.125-0.0625
< 0.0625
Total arsenic
(milligrams per kilogram
as As)-*
410676
104
1768
68
13116.0
7.011144.05.0
3.81014127.0
5.06.06.4
104.4
16168.48.07.0
Sediment description
J_u _^
.
.
Fine silty sand
Brown claySandy brown clay
-22-

TABLE 6. Total arsenic in sediment from wells at Dodge Ranchstudy area Continued
Well
DR-AH-15CDR-AH-1 5CDR-AH-1 6ADR-AH-1 6ADR-AH-1 6A
DR-AH-1 6ADR-AH-1 6ADR-AH-1 6ADR-AH-1 6ADR-AH-1 6 A
DR-AH-1 6ADR-AH-1 6 ADR-AH-1 6ADR-AH-1 6ADR-AH-1 6A
DR-AH-1 6ADR-AH-1 6ADR-AH-1 6ADR-AH-1 6ADR-AH-1 6A
DR-AH-1 6 ADR-AH-1 6ADR-AH-1 6ADR-AH-1 6ADR-AH-1 6A
DR-AH-1 6ADR-AH-1 6ADR-AH-1 6ADR-AH-1 6ADR-AH-1 6A
DR-AH-1 6ADR-AH-1 7ADR-AH-1 7ADR-AH-1 7 ADR-AH-1 7A
Depth (feet)
50-50.560-60.5
4.5-5.09.5-109.5-10
9.5-109.5-109.5-109.5-10
19.5-20
19.5-2019.5-2019.5-2019.5-2019.5-20
19.5-2019.5-2019.5-2019.5-2019.5-20
19.5-2019.5-2019.5-2019.5-2019.5-20
29.5-3029.5-3029.5-3029.5-3029.5-30
29.5-309-109-109-109-10
Size fraction (millimeters)
Whole rockWhole rock
< 0.06252.00-1.001.00-0.50
0.50-0.250.25-0.125
0.125-0.0625< 0.0625
1.00-0.71
1.00-0.711.00-0.711.00-0.711.00-0;,711.00-0.71
2.00-1.002.00-1.002.00-1.002.00-1.002.00-1.00
1.00-0.500.50-0.250.25-0.1250.125-0.0625
< 0.0625
2.00-1.001.00-0.500.50-0.250.25-0.125
0.125-0.0625
< 0.06250.25-0.125
0.125-0.0625< 0.0625
Whole rock
Total arsenic
(milligrams per kilogram
as As)^
6.4259.1
144.4
4.08.0
121730
5.11731322.2
0.736280.49.0
3.64.65.6
1019
136.44.05.0
12
1418191518
Sediment description
Black clayBlack clay
.
Red-stained lithicfragments
FeldsparStained feldsparDark lithic fragmentsLight lithic fragmentsClear quartz
FeldsparDark lithic fragmentsLight lithic fragmentsClear quartz
Fine clayey sand
-23-

TABLE 6. Total arsenic in sediment from wells at Dodge Ranchstudy area Continued
Totalarsenic
(milligrams
Well
DR-AH-17ADR-AH-17ADR-AH-17ADR-AH-17ADR-AH-17A
DR-AH-17ADR-AH-17ADR-AH-17ADR-AH-17ADR-AH-17A
Depth (feet)
19.5-2019.5-2019.5-2019.5-2019.5-20
28-2928-2928-2928-29
45.5-46.5
Size fraction (millimeters)
1.00-0.500.50-0.250.25-0.1250.125-0.0625
< 0.0625
0.25-0.1250.125-0.0625
< 0.0625Whole rockWhole rock
per kilogram as As) -^
16189.0
1120
141213167.5
Sediment description
__
Silty sandLight olive-gray clay
1 Analysts: wells DR-AH-1 through 12, U.S. Geological Survey Central Laboratory, Arvada, Colo.; all other wells, Terra-Tek Core Services, Salt Lake City, Utah.
-24-

TABLE 7. Total selenium in sediment from wells at Dodge Ranch study area*
Well
DR-AH-14ADR-AH-14ADR-AH-15ADR-AH-15ADR-AH-15C
DR-AH-15CDR-AH-16ADR-AH-16ADR-AH-16ADR-AH-16A
DR-AH-17ADR-AH-17ADR-AH-17A
Depth(feet)
3.5-4.09.0-9.59.5-10.019.5-20.025.5-26.5
60.0-60.54.5-5.09.5-10.019.5-20.029.5-30.0
19.5-20.028.0-29.045.5-46.5
Size fraction(millimeters)
< 0.0625< 0.0625< 0.0625< 0.0625
Whole rock
Whole rock< 0.0625< 0.0625< 0.0625< 0.0625
< 0.0625Whole rockWhole rock
Selenium(milligrams
perkilogram)
0.03.06.04.03.07
.02
.30< .02< .03
.13
.10
.06
.08
^ Analyst: City, Utah.
Terra-Tek Core Services, Salt Lake
-25-

TABL
E 8. Gr
ain-
size
dis
trib
utio
n of
sediment fr
om wells a
t Do
dge
Ranch
stud
y area
10
Perc
ent,
by
w
eig
ht,
in
ea
ch m
illi
mete
r
Wel
l
'DR
-AH
-9D
R-A
H-9
DR
-AH
-9
DR
-AH
-14A
DR
-AH
-1 4
A
DR
-AH
-1 4
AD
R-A
H-1
4AD
R-A
H-1
5AD
R-A
H-1
5C
DR
-AH
-1 5
A
DR
-AH
-1 5
AD
R-A
H-1
5AD
R-A
H-1
5A
DR
-AH
-1 6
AD
R-A
H-1
6A
DR
-AH
-1 6
AD
R-A
H-1
6A
DR
-AH
-1 6
AD
R-A
H-1
7 A
DR
-AH
-1 7
A
DR
-AH
-1 7
AD
R-A
H-1
7A
DR
-AH
-1 7
AD
R-A
H-1
7A
DR
-AH
-1 7
A
Dep
th
(feet)
3.5
6.0
12
.53.5
9.0
13
.017.0
4.0
4.5
7.0
9.5
14
.019
.54.5
9.5
19.5
26.5
29
.54.0
8.0
14.5
15.0
19.5
24.0
25.0
>2.
00
0.0
5.1
2.0
8.2
2.0
0
.00
.00
.17
.00
.63
.14
.00
4.0
81.
174.
01
2.5
0.2
01.
84 .64
2.9
5
.00
.16
.00
.00
.00
2.0
0-
1.00 0.11 .1
5.1
21.
39 .00
.18
.22
.41
.76
.78
.05
.07
10.1
69.
059.
44
11.7
7.2
36.
611.
638.
41 .00
.58
.04
.43
.18
1.0
0-
0.5
0
0.4
9.3
5.4
27.
51 .03
.28
.91
1.94
8.0
32.0
2
.04
.36
21
.78
28.4
724
.81
31
.82
.63
24.8
64.3
611
.11
.00
1.57 .4
41.
76 .87
0.5
0-
0.25 2.9
54.
012.8
818
.50
.41
4.4
86.
139.5
02
0.2
08.
84
2.62
2.4
439
.61
32.6
835
.67
33.9
62.
5536
.29
7.27
15.7
1
.00
8.32
2.2
06.
433.8
6
0.2
5-
0.1
25
24.1
24
3.5
92
3.2
83
5.9
925
.72
44.5
440
.81
25.9
93
6.1
42
3.6
8
59.8
846
.22
17.2
018
.07
19.0
5
14.7
013
.24
18.1
312
.52
23.4
6
0.0
045
.81
44.3
341
.22
31
.03
0.1
25
- 0.0
625
16.0
22
5.5
229
.66
24.4
75
4.3
0
24
.93
25.3
49.
472
2.2
515
.38
32
.18
26.8
55.
047.
314.9
7
3.53
14.7
87.5
010
.63
13.8
2
3.6
72
0.8
544.0
52
0.4
33
2.9
6
<0.
0625
55.3
526
.25
43.5
711
.92
19.5
5
25.5
42
6.5
952
.51
12.6
148
.65
5.0
92
4.0
82.
613.
242
.00
1.72
68.3
74.7
86
2.9
624
.53
96.3
32
2.6
88.9
529
.72
31.0
8
0.0
62
5-
0.03
1
24.4
49.
3117
.87
12.0
612
.62
14.9
7
17.8
1
7.6
8 __ 9.9
7 4.1
56.
61
1.79
7.0
9
11.3
211
.60
size in
terv
al
0.0
31-
0.01
56
13.5
06.
197.
15 3.4
83.
8513
.04
10.5
0
__ 4.1
2 .
11.1
3 8.84
4.33
7.8
83.
37 5.75
6.8
5
0.0
15
6-
0.0
078
8.2
73.6
97.2
0 2.8
93.3
68
.84 7.72 __ 3.2
0 .
11.9
7
15.9
63.
97
17.6
73.8
9 4.3
53.2
2
0.0
078-
0.00
39
5.5
02.7
81.
83 2.47
2.7
06.
94 5.11 .
3.3
4 .
14.4
4
16.7
73.
67
30.9
33.4
5 3.5
24.
32
0.0
03
9-
0.00
1
3.6
44.2
89.
52 4.6
44
.06
8.7
2 7.51 __ 5.74
20.8
6
17.2
45.
95
38.0
64.8
8 4.7
85
.09

TABLE 9. Statistics of grain-size distribution of sediment from veils at Dodge Ranch atvdy area
Well and depth
Statistical parameter-'
Median: phimm
Mode: phimm
Standarddeviation
Coefficientof sorting
Phi quartiledeviation
Phi deviationmeasure
Inclusiveskewnesa
Coefficientof skewness
Phi quartileskewness
Phi skewnessmeasure
GraphicKurtosis
Kelley'squartilekurtosis
Phi quartilekurtosis
Phi kurtosismeasure
DR-AH-14A 3.5-4 ft
2.650.159
2.750.149
1.103
0.617
0.700
1.100
-0.048
1.040
-0.050
-2.568
1.069
0.209
0.230
0.659
DR-AH-14A 9-9.5 ft
3.300.102
2.750.149
0.666
0.769
0.375
0.620
0.451
0.943
0.075
-4.315
1.284
0.266
0.221
0.895
DR-AH-15A 8.5-10 ft
. 2.870.137
2.750.149
0.476
0.846
0.245
0.415
0.281
0.975
0.035
-6.205
1.480
0.221
0.208
1.133
DR-AH-15A 19.5-20 ft
1.400.379
1.750.297
1.199
0.615
0.700
1.125
-0.104
1.034
-0.050
-1.422
1.230
0.183
0.230
0.867
DR-AH-16A 4.5-5 ft
1.380.384
0.750.595
1.184
0.594
0.750
1.140
0.095
0.986
0.020
-0.996
1.107
0.235
0.248
0.776
DR-AH-16A 9.5-10 ft
1.350.392
1.750.297
1.209
0.574
0.800
1.175
-0.048
1.000
0.000
-1.277
1.050
0.219
0.262
0.745
DR-AH-16A 19.5-20 ft
1.150.451
0.750.595
1.098
0.609
0.715
1.075
0.002
1.009
-0.015
-1.023
1.060
0.231
0.255
0.721
DR-AH-16A 29.5-30 ft
1.450.366
1.250.420
1.214
0.601
0.735
1.125
0.137
0.955
0.130
-0.978
1.199
0.229
0.239
0.911
DR-AH-17A 19.5-20 ft
3.080.118
2.750.149
0.566
0.824
0.280
0.445
0.311
0.957
0.070
-6.169
1.661
0.218
0.206
1.551
1 Statistical parameters are defined as follows (Folk, 1955, p. 42-53; Pettijohn, 1975, p. 39; variables used in equations below are: Pn - nth percentile; Qn - ntH quartile):
Median: Md - P50
Mode: Mo » midpoint of most abundant class
Standard deviation: Sigma (I) - (lP84U)-P16U)]/4)+([P95U)-P5U)]/6.6)
Coefficient of sorting: So »/.J(Q3/qi)
Phi quartile deviation: Sigma (*) - 0.5[Q3(,>)-Q1(*) 1
Phi deviation measure: Sigma U) - 0.5[P84(*)-P16(*>]
Inclusive skewness: Sk (I) - ([P16U)+P84(»)-2P50(»)]/2[P84(»)-P16(») ])+( [P5(»)+P95U)-2P50(»)]/2[P95(»)-P5(»)])
Coefficient of skewness: Sk -^l(Ql)(Q3)/Md]
Phi quartile skewness: Sk(*) - 0.5[(Ql(*)+Q3(*))-2Md(*)]
Phi Skewness meaaure: a(2*) - [0.5(P5($)+P95(*))-2Md(*)]/Sigma(»
Graphic Kurtosis: Kg - [P95(*)-P5(*)]/2.44[P75(*)-P25(*)]
Kelley's quartile kurtosis: K - (Q3-Q1)/2(P90-P10)
Phi quartile kurtosis: K (*) - [Q3(*)-Q1(*)]/2[P90(*)-P10(*)]
Phi kurtosis measure: Beta (*) - (0.5(P95(*)-P5(*))-Sigma(*)]/Sigma(*)
-27-

TABLE 10. Porosity and hydraulic conductivity of sediment from wells at Dodge Ranch study area 1
Hydraulic conductivity
Well
DR-AH-14A DR-AH-14A DR-AH-14A DR-AH-15A
DR-AH-15A DR-AH-15A DR-AH-16A DR-AH-16A
DR-AH-16A DR-AH-16A DR-AH-17A
Depth (feet)
3.5-4.0 9.0-9.5 19.5-20 4.0-4.5
9.5-10 19.5-20 4.5-5.0 9.5-10
19.5-20 29.5-30 19.5-20
Porosity (percent)
44.8 41.3 53.0 22.6
22.4 32.6 30.3 23.7
30.6 29.8 26.3
(feet per day)
1.02 X 10~3 2.50 X 10~5 3.62 X 10~3 1.29 X 10~4
6.16 X 10~4 7.33 X 10~3 1.80 X 10~2 1.77 X 10~3
1.49 X ID"2 4.78 X 10~3 2.74 X 10~6
* Analyst: Terra-Tek Core Services, Salt Lake City, Utah
-28-

TABLE 11. Mineralogy of grain-size fraction greater than 2 micrometers in sediment from wells at Dodge Ranch study area*
Depth Well (feet) Minerals present Minerals possibly present
DR-AH-14A 4.0 Quartz, orthoclase, albite, Muscovite, biotite, augite,anorthite hematite, dolomite
DR-AH-14A 9.5 Quartz, orthoclase, Biotite, tremolite, enstatitemicrocline, albite, anorthite, hornblende, hypersthene
DR-AH-14A 20.0 Quartz, orthoclase, albite, Anorthite, muscovite,microcline, hypersthene arsenopyrite, dolomite
DR-AH-15A 4.5 Quartz, orthoclase, albite, Biotite, hornblende, augite,anorthite, muscovite, dolomite hypersthene, actinolite
DR-AH-15A 10.0 Quartz, orthoclase, albite, Hornblende, actinolite,microcline, anorthite, enstatite, diopside, muscovite hypersthene, calcite,
dolomite
DR-AH-15A 20.0 Quartz, albite, anorthite, Orthoclase, microcline,muscovite, augite, biotite, actinolite,hypersthene arsenopyrite, dolomite
DR-AH-16A 5.0 Quartz, orthoclase, Albite, augiteanorthite, muscovite, biotite, tremolite
DR-AH-16A 10.0 Quartz, orthoclase, albite, Microcline, muscovite,anorthite, biotite actinolite, diopside,
hematite, dimorphite II
DR-AH-16A 20.0 Quartz Orthoclase, microcline,albite, anorthite, hypersthene, gypsum
DR-AH-16A 30.0 Quartz, microcline, albite, Orthoclase, muscovite,anorthite, hematite, biotite, augite, diopside gypsum
DR-AH-17A 20.0 Quartz, orthoclase, Microcline, albite, biotite,anorthite, muscovite hypersthene, gypsum
* X-ray diffraction analysis.
29

TABLE 12. Mineralogy of clay fraction (grain size less than 2 micrometers) in sediment from wells at Dodge Ranch study area*
Depth Well (feet)
DR-AH-14A 4.0
DR-AH-14A 9.5
DR-AH-14A 20.0
DR-AH-15A 4.5
Minerals present ̂ Minerals possibly present
Montmorillonite, illite, chlorite, I-M
Montmorillonite, illite, Halloysite chlorite
Montmorillonite, illite, chlorite
Chlorite Montmorillonite, illite,
DR-AH-15A 10.0
DR-AH-15A 20.0
DR-AH-16A 5.0
DR-AH-16A 10.0
DR-AH-16A 20.0
DR-AH-16A 30.0
DR-AH-17A 20.0
Montmorillonite, illite
Montmorillonite, illite, chlorite
Montmorillonite, M-CH
Montmorillonite, illite, I-M
Montmorillonite, illite, chlorite
dickite
Halloysite, dickite
Dickite
Illite, attapulgite
Chlorite
Dickite
Montmorillonite, chlorite Illite, attapulgite
Montmorillonite, illite, chlorite, I-M
1 X-ray diffraction analysis.
^ Abbreviations: I-M, mixed-layer illite-montmorillonite; M-CH, mixed- layer montmorillonite-chlorite.
-30-

30
25
5 20
Ul
CQ 15
O10
I T r I r r r T i r
12345
GRAIN SIZE, IN PHI UNITS8 10
FIGURE 6.--Grain-size distribution of sediment from well DR-AH-9, depth 3.5 feet.
12345
GRAIN SIZE, IN PHI UNITS
FIGURE 7.--Grain-size distribution of sediment from well DR-AH-9, depth 6.0 feet.
-31-

Xo
>-CO
25
20
Z 1bUJOorLJQ- JO
-3 -2 -1 12345
GRAIN SIZE, IN PHI UNITS
FIGURE 8.--Grain-size distribution of sediment from well DR-AH-9, depth 12.5 feet.
-2 -1 0123
GRAIN SIZE, IN PHI UNITS
10
FIGURE 9.--Grain-size distribution of sediment from well DR-AH-14A, depth 3.5 feet.
-32-

40
35
30f IoUJ 25
CD 20
UJO 15
LJ Q.
10
n \ 7 0123
GRAIN SIZE, IN PHI UNITS-3 -2
FIGURE 10.--Grain-size distribution of sediment from well DR-AH-14A, depth 9.0 feet.
50
45
40
35
30
OUJ
CO 25
2 20Oo:
15
10
-3 -2 12345
GRAIN SIZE, IN PHI UNITS10
FIGURE 11.--Grain-size distribution of sediment from well DR AH 14A, depth 13.0 feet.
-33-

o
>-CO
LJ O
45
40
30
25
20
10
I I I-3 -2 -1 0 12345
GRAIN SIZE, IN PHI UNITS
i i 6 7 8 10
FIGURE 12.--Grain-size distribution of sediment from well DR-AH-14A, depth 17.0 feet.
O Ul
30
25
20
CO 15
zUl O
10
i r
i i r i i i 234567 8 JO
GRAIN SIZE, IN PHI UNITS
FIGURE 13.-Grain-size distribution of sediment from well DR-AH-15A, depth 4.0 feet.
-34-

o
30
25
20
CO 15
LJ CJ
10
I I I I I I
012345673
GRAIN SIZE, IN PHI UNITS
FIGURE 14.--Grain-size distribution of sediment from well DR AH-15A, depth 7.0 feet.
10
55
50
45
40
30
25
20
15
10
5
X
LJ
£>- CQh-~ z.LJ
C£LJ
-3 -2 0123
GRAIN SIZE, IN PHI UNITS
FIGURE 15.--Grain-size distribution of sediment from well DR AH 15A, depth 9.5 feet.
-35-
PE
RC
EN
T, B
Y W
EIG
HT
PE
RC
EN
T, B
Y W
EIG
HT
lu ON
I

Xo
>-CO
oCeLJ Q_
-2 0123GRAIN SIZE, IN PHI UNITS
FIGURE 18.--Grain-size distribution of sediment from well DR-AH-16A, depth 4.5 feet.
-i 0123
GRAIN SIZE, IN PHI UNITS
FIGURE 19.--Grain-size distribution of sediment from well DR-AH-16A, depth 9.5 feet.
-37-
o
012345
GRAIN SIZE, IN PHI UNITS
FIGURE 20.--Grain-size distribution of sediment from well DR-AH-16A, depth 19.5 feet.
2345GRAIN SIZE, IN PHI UNITS
FIGURE 21.--Grain-size distribution of sediment from well DR-AH-16A, depth 26.5 feet.
-38-

25
20
XoLJ
£>- CD
LJ 10OQ:LJ CL
-3-2-10 ! 2 3 4 5
GRAIN SIZE, IN PHI UNITS
FIGURE 22.--Grain-size distribution of sediment from well DR AH-16A, depth 29.5 feet.
-3 -2 I 2 3 4 5
GRAIN SIZE, IN PHI UNITS
FIGURE 23.-Grain-size distribution of sediment from well DR AH-17A, depth 4.0 feet.
-39-
o
30
25
20
CO 15
UJU
I I I T
-3 -2 -1 12345GRAIN SIZE, IN PHI UNITS
10
FIGURE 24.--Grain-size distribution of sediment from well DR-AH-17A, depth 8.0 feet.
45
40
35
30
25
20
10
O
>- CD
ZUJU
-3 -2 -1 12345GRAIN SIZE, IN PHI UNITS
FIGURE 25.--Grain-size distribution of sediment from well DR-AH-17A, depth 14.5 feet.
-40-

PE
RC
EN
T,
BY
WE
IGH
TP
ER
CE
NT
, B
Y W
EIG
HT

-3 -2 -1 12345GRAIN SIZE, IN PHI UNITS
FIGURE 28.--Grain-size distribution of sediment from well DR-AH-17A, depth 24.0 feet.
40
35
30I Io
25
00 20
UJO 15
LJQ.
10
-3 -2 -1 12345GRAIN SIZE, IN PHI UNITS
10
FIGURE 29.--Grain-size distribution of sediment from well DR-AH-17A, depth 25.0 feet.
-42-

REFERENCES CITED
Amyx, J. W., Bass, B. M., and Whiting, R. L., 1960, Petroleum reservoir engineering: New York, McGraw Hill, 610 p.
Carroll, Dorothy, 1970, Clay minerals: A guide to their X-rayidentification: Geological Society of America Special Paper 126, 80 p.
Folk, R. L., 1955, Petrology of sedimentary rocks: Austin, University of Texas Press, 182 p.
Nuffield, E. W., 1966, X-ray diffraction methods: New York, John Wiley, 409 p.
Pettijohn, F. J., 1975, Sedimentary rocks (3rd ed.): New York, Harper and Row, 628 p.
Skougstad, M. W., Fishman, M. J., Friedman, L. C., Erdmann, D. E., andDuncan, S. S., eds., 1979, Methods for the determination of inorganic substances in water and fluvial sediments: U.S. Geological Survey Techniques of Water-Resources Investigations, Book 5, Chap. Al, 626 p,
-43-