Embed Size (px)
Citation preview
HYDROGEOLOGY AND GROUND-WATER-QUALITY CONDITIONS AT THE EMPORIA-LYON COUNTY LANDFILL, EASTERN KANSAS, 1988
By Nathan C. Myers and Philip R. Bigsby
U.S. GEOLOGICAL SURVEY
Water-Resources Investigations Report 90-4043
Prepared in cooperation with the
CITY OF EMPORIA and LYON COUNTY, KANSAS
Lawrence, Kansas
1990
DEPARTMENT OP THE INTERIOR
MANUAL LUJAN, JR., Secretary
U.S. GEOLOGICAL SURVEY
Dallas L. Peck, Director
For additional information Copies of this report canwrite to: be purchased from:
District Chief U.S. Geological SurveyU.S. Geological Survey Books and Open-File ReportsWater Resources Division Denver Federal Center, Bldg. 8104821 Quail Crest Place Box 25425Lawrence, Kansas 66049 Denver, Colorado 80225
ii Hydrogeology and Ground-Water Quality, Emporia-Lyon County Landfill, Eastern Kansas, 1988
CONTENTS
Page
Abstract .............................................................................. 1Introduction .......................................................................... 1
Purpose and scope ............................................................... 1General description of study area .................................................. 2Previous studies ................................................................. 4
Public-landfill solid wastes and effects on water quality ................................... 4
Solid-waste composition .......................................................... 4Solid-waste degradation .......................................................... 4Leachate production ............................................................. 5
Methods of investigation ............................................................... 7
Information survey .............................................................. 7Temporary-well installation ...................................................... 7Monitoring-well installation ...................................................... 7Water-sampling methods ......................................................... 9Hydraulic-conductivity determination ............................................ 10
Regional hydrogeology ................................................................ 11Site description and landfill hydrogeology ............................................... 12
Landfill setting ................................................................. 12Landfill siting, design, and management .......................................... 12Geology ........................................................................ 12Hydrology ..................................................................... 12
Water quality ........................................................................ 23
Regional ....................................................................... 23Landfill ........................................................................ 25
Effect of landfill on water quality ....................................................... 25
Inorganic compounds ........................................................... 25Organic compounds ............................................................. 35
Summary and conclusions ............................................................. 40References cited ...................................................................... 40
Figure Page
1. Maps showing location of Emporia-Lyon County Landfill near Emporia, Kansas ... 2
2. Map showing topographic relief and land use in vicinity of Emporia-Lyon County Landfill, and location of supply wells outside of Emporia city limits and in vicinity of landfill ................................................................... 3
Contents Hi
CONTENTS-Continued
Figure Page
3. Map showing location of temporary, monitoring, and supply wells ................. 8
4. Diagram showing monitoring-well design ..................................... 10
5. Map showing site features and land use ....................................... 13
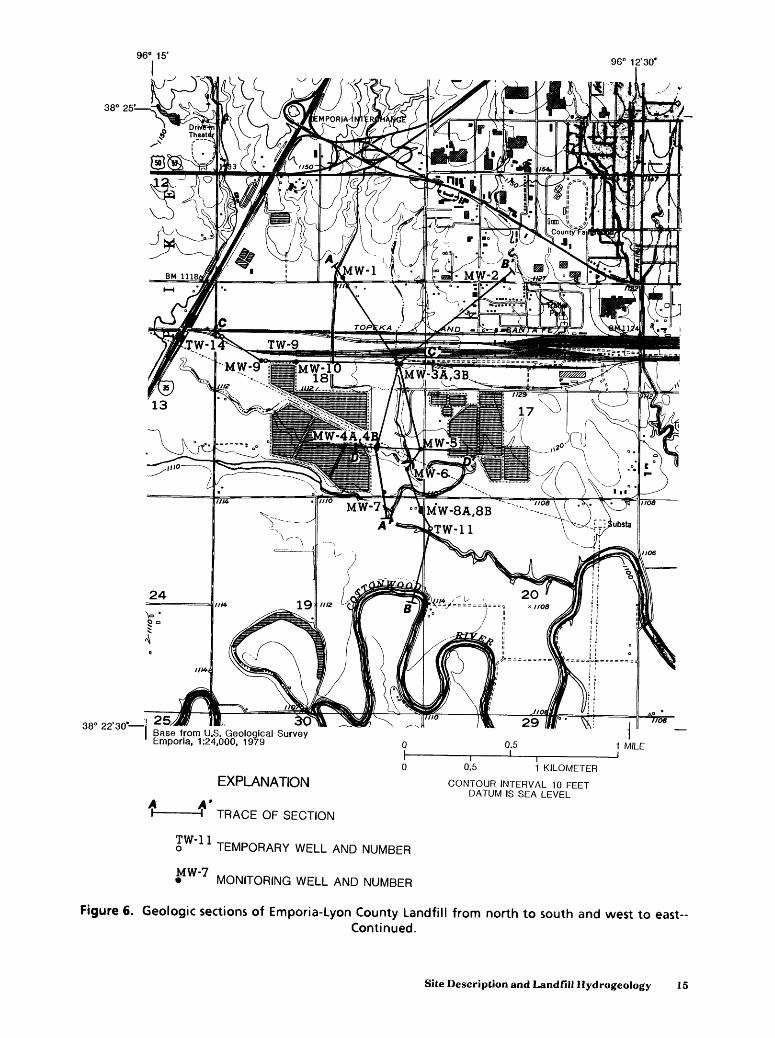
6. Geologic sections of Emporia-Lyon County Landfill from north to south and west toeast ........................................................................ 14
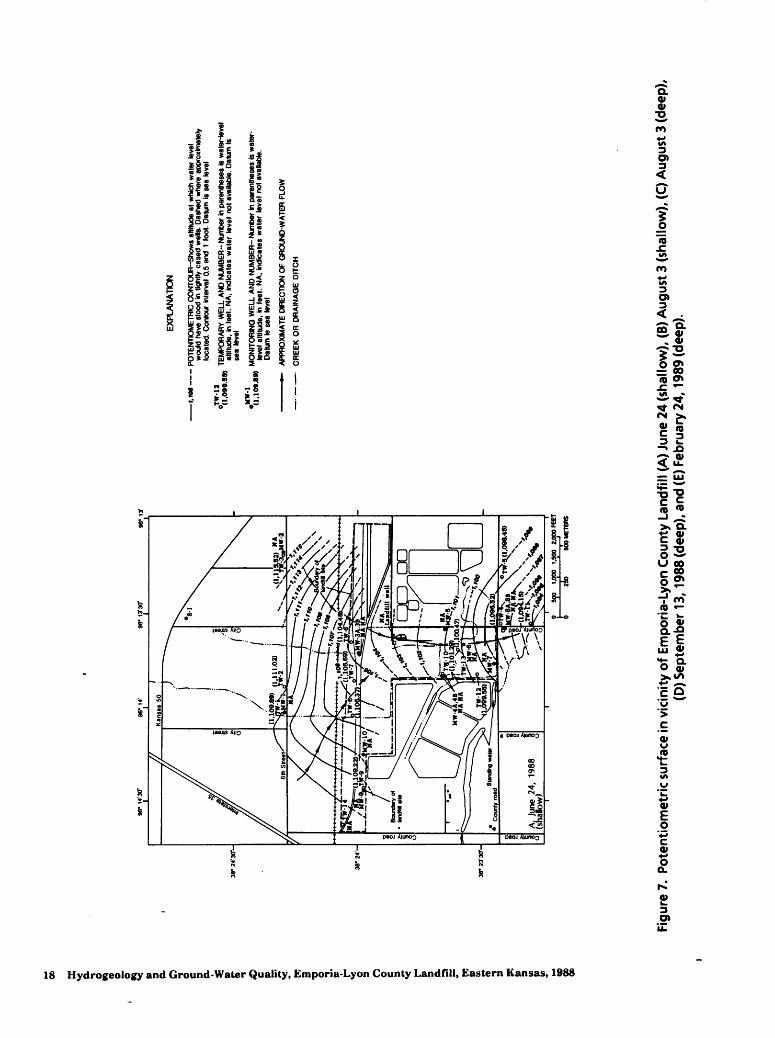
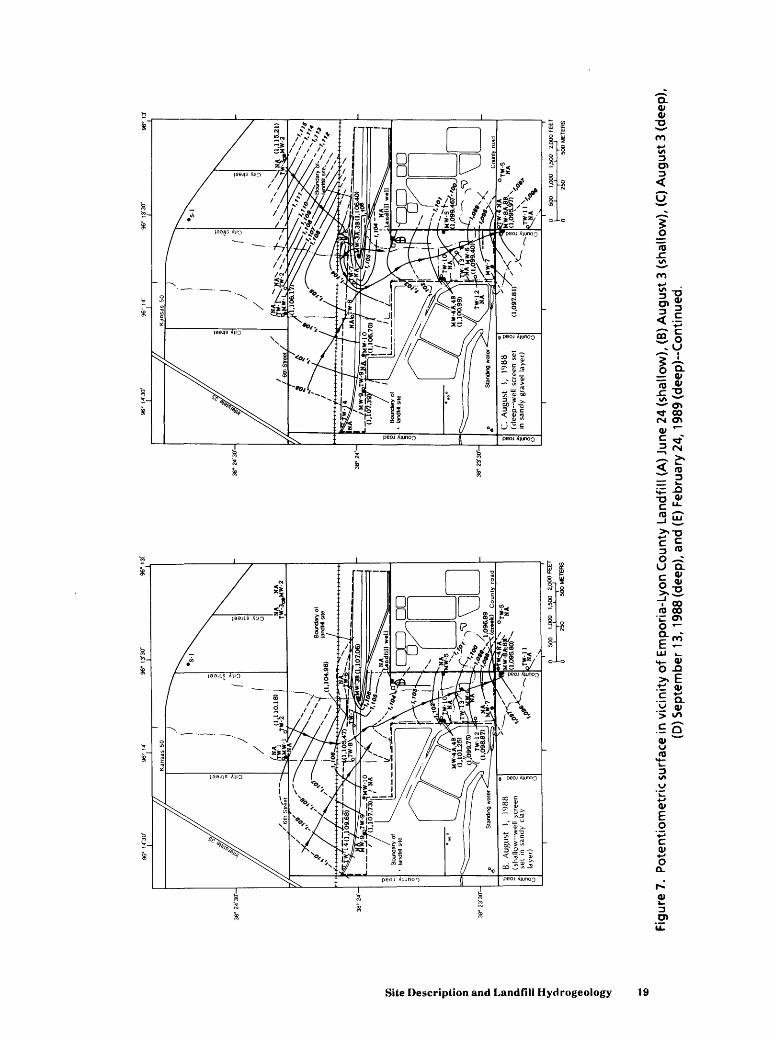
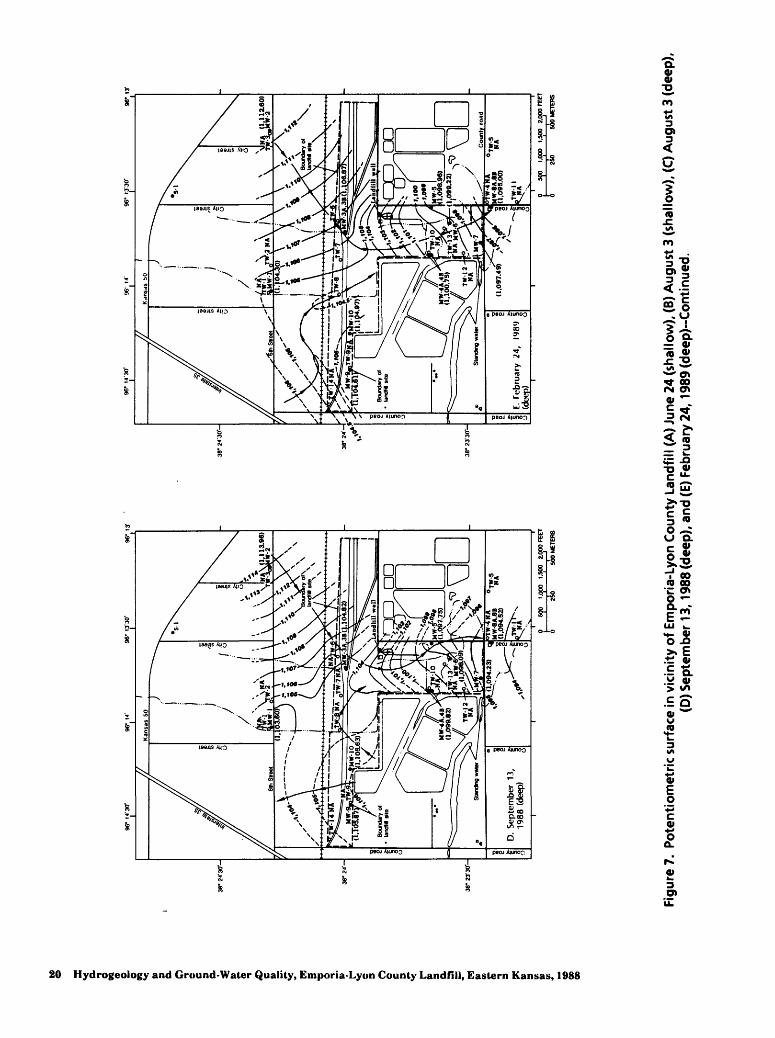
7. Maps showing potentiometric surface in vicinity of Emporia-Lyon County Landfill,June 24, August 3, and September 13,1988, and February 24,1989 .............. 18
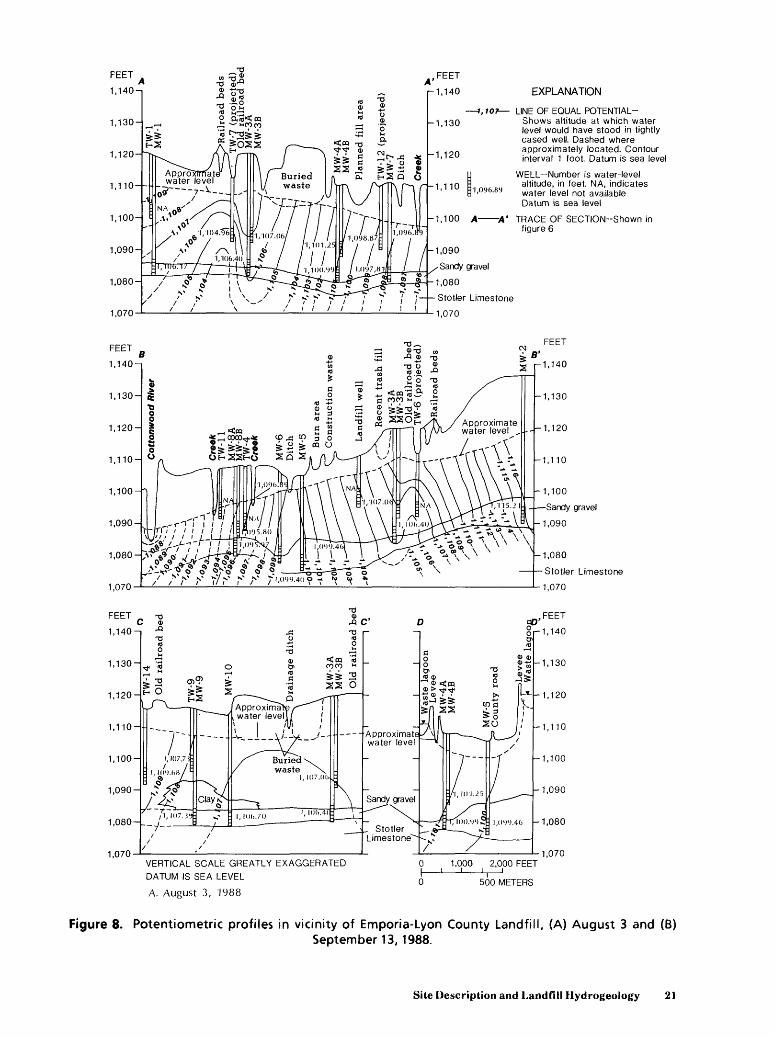
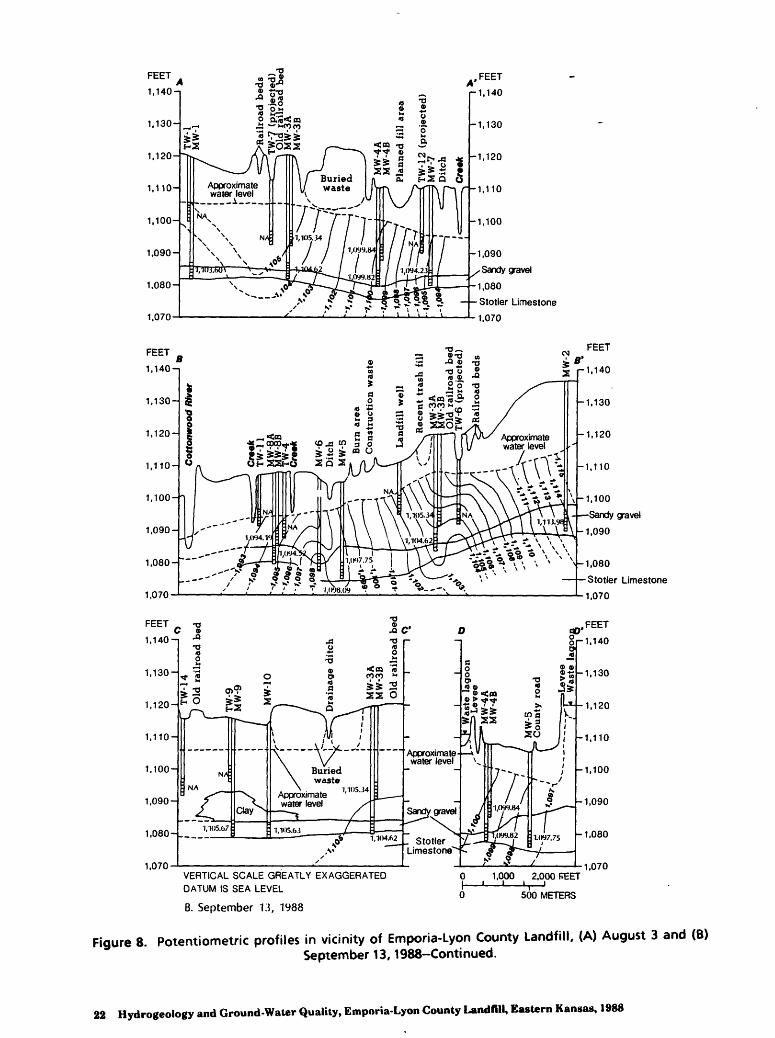
8. Hydrogeologic sections showing potentiometric profiles in vicinity of Emporia-LyonCounty Landfill, August 3 and September 13,1988 ............................. 21
9. Graph showing monthly precipitation at Emporia for 1988 ...................... 23
10. Map showing areal distribution of water-quality constituents in samples collectedfrom monitoring wells, September 1988 ....................................... 26
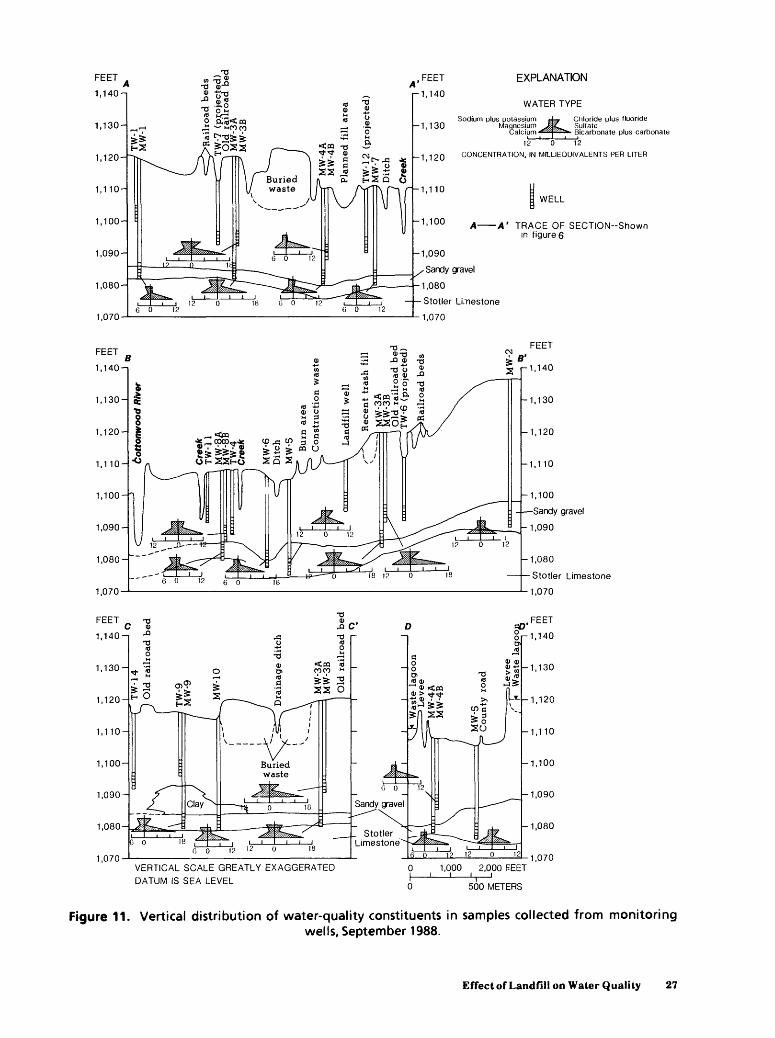
11. Geochemical sections showing vertical distribution of water-quality constituents insamples collected from monitoring wells, September 1988 ....................... 27
12. Map showing values of specific conductance and concentrations of dissolved solids, total alkalinity, ammonia, and nitrate in water from monitoring wells, September 1988 ....................................................................... 33
13. Map showing concentrations of arsenic, barium, iron, manganese, and zinc in waterfrom monitoring wells, September 1988 ....................................... 34
Table Page
1. Typical concentrations of constituents in landfill leachate ........................ 6
2. Top-of-casing altitudes and total depths for temporary wells, monitoring wells,landfill well, and unnamed creek .............................................. 9
3. Water-column volumes purged from monitoring wells before sampling in September1988 ....................................................................... 11
4. Water-level altitudes in temporary wells, monitoring wells, landfill well, andunnamed creek ............................................................. 16
5. Hydraulic conductivity calculated from slug-test data using methods of N guy en andFinder(1984) ............................................................... 17
6. Ranges and median chemical-constituent concentrations in water from wells in alluvial and limestone aquifers in Lyon County, and from wells upgradient of the Emporia-Lyon County Landfill ............................................... 24
iv Hydrogeology and Ground-Water Quality, Emporia-Lyon County Landfill, Eastern Kansas, 1988
CONVERSION FACTORS
For those readers who prefer metric units (International System), the inch-pound units of this report may be converted using the following factors:
Multiply To obtain inch-pound unit By metric unit
inch 2.540 centimeter
foot 0.3048 meter
mile 1.609 kilometer
acre 4,047 square meter
gallon 3.785 liter
gallon per minute 0.06309 liter per second
degree Fahrenheit ("F) (1) degree Celsius (°C)
1 o/~< _ toC = (°F-32)/1.8.
Sea level: In this report, "sea level" refers to the National Geodetic Vertical Datum of 1929-a geodetic datum derived from a general adjustment of the first-order level nets of both the United States and Canada, formerly called "Sea Level Datum of 1929."
vi liydrogeology and Ground-Water Quality, Emporia-Lyon County Landfill, Eastern Kansas, 1988
CONVERSION FACTORS
For those readers who prefer metric units (International System), the inch-pound units of this report may be converted using the following factors:
Multiply To obtain inch-pound unit By metric unit
inch 2.540 centimeter
foot 0.3048 meter
mile 1.609 kilometer
acre 4,047 square meter
gallon 3.785 liter
gallon per minute 0.06309 liter per second
degree Fahrenheit ("F) (1) degree Celsius (°C)
Sea level: In this report, "sea level" refers to the National Geodetic Vertical Datum of 1929--a geodetic datum derived from a general adjustment of the first-order level nets of both the United States and Canada, formerly called "Sea Level Datum of 1929."
vi Hydrogeology and Ground-Water Quality, Emporia-Lyon County Landfill, Eastern Kansas, 1988
HYDROGEOLOGY AND GROUND-WATER-QUALITY CONDITIONS AT THE EMPORIA-LYON COUNTY LANDFILL, EASTERN KANSAS, 1988
By-Nathan C. Myers and Philip R. Bigsby
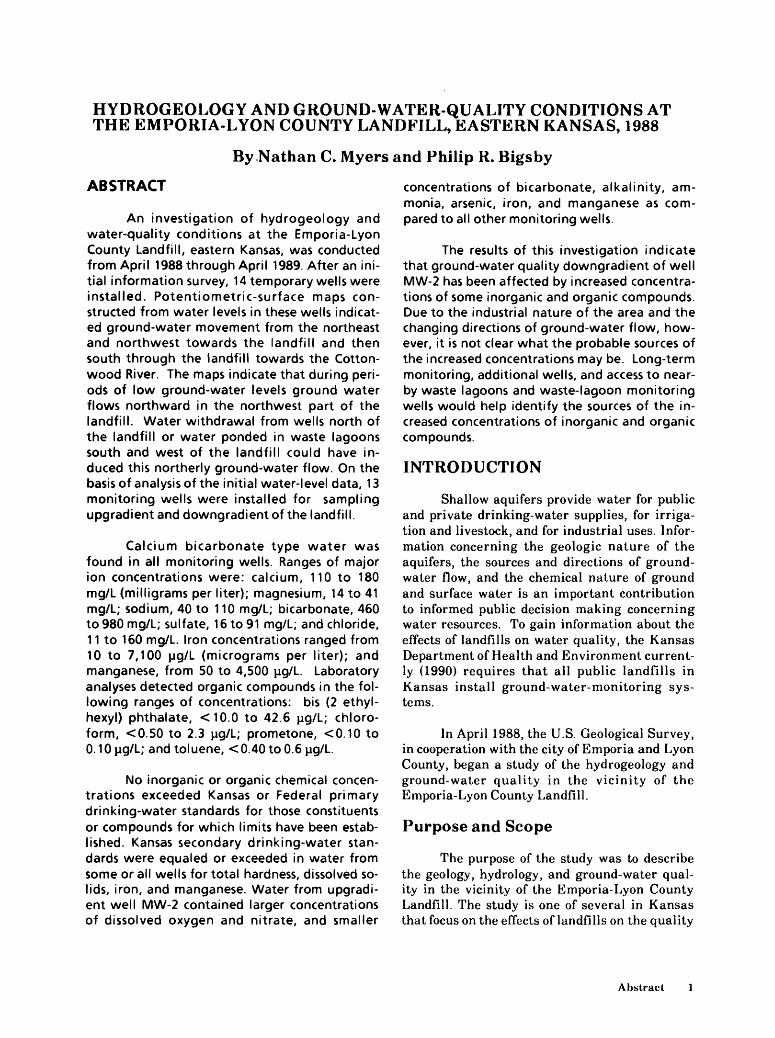
ABSTRACT
An investigation of hydrogeology and water-quality conditions at the Emporia-Lyon County Landfill, eastern Kansas, was conducted from April 1988 through April 1989. After an ini tial information survey, 14 temporary wells were installed. Potentiometric-surface maps con structed from water levels in these wells indicat ed ground-water movement from the northeast and northwest towards the landfill and then south through the landfill towards the Cotton- wood River. The maps indicate that during peri ods of low ground-water levels ground water flows northward in the northwest part of the landfill. Water withdrawal from wells north of the landfill or water ponded in waste lagoons south and west of the landfill could have in duced this northerly ground-water flow. On the basis of analysis of the initial water-level data, 13 monitoring wells were installed for sampling upgradient and downgradient of the landfill.
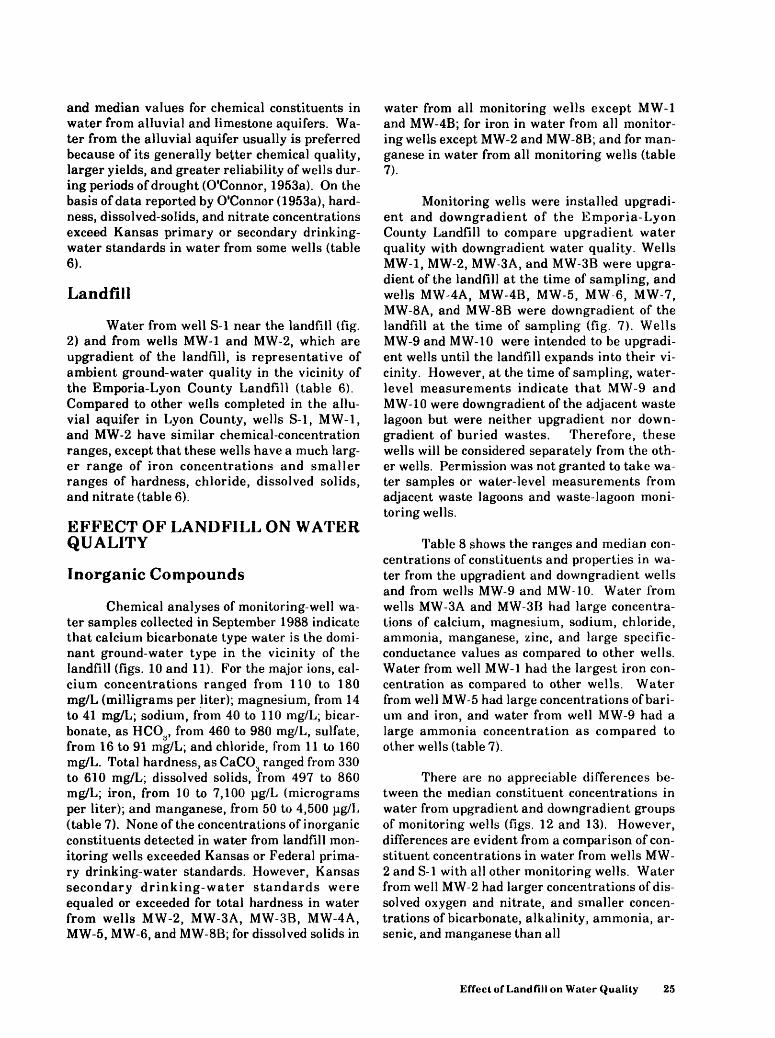
Calcium bicarbonate type water was found in all monitoring wells. Ranges of major ion concentrations were: calcium, 110 to 180 mg/L (milligrams per liter); magnesium, 14 to 41 mg/L; sodium, 40 to 110 mg/L; bicarbonate, 460 to 980 mg/L; sulfate, 16 to 91 mg/L; and chloride, 11 to 160 mg/L. Iron concentrations ranged from 10 to 7,100 ug/L (micrograms per liter); and manganese, from 50 to 4,500 ug/L. Laboratory analyses detected organic compounds in the fol lowing ranges of concentrations: bis (2 ethyl- hexyl) phthalate, <10.0 to 42.6 ug/L; chloro form, <0.50 to 2.3 ug/L; prometone, <0.10 to 0.10pg/L; and toluene, <0.40 to 0.6 ug/L.
No inorganic or organic chemical concen trations exceeded Kansas or Federal primary drinking-water standards for those constituents or compounds for which limits have been estab lished. Kansas secondary drinking-water stan dards were equaled or exceeded in water from some or all wells for total hardness, dissolved so lids, iron, and manganese. Water from upgradi ent well MW-2 contained larger concentrations of dissolved oxygen and nitrate, and smaller
concentrations of bicarbonate, alkalinity, am monia, arsenic, iron, and manganese as com pared to all other monitoring wells.
The results of this investigation indicate that ground-water quality downgradient of well MW-2 has been affected by increased concentra tions of some inorganic and organic compounds. Due to the industrial nature of the area and the changing directions of ground-water flow, how ever, it is not clear what the probable sources of the increased concentrations may be. Long-term monitoring, additional wells, and access to near by waste lagoons and waste-lagoon monitoring wells would help identify the sources of the in creased concentrations of inorganic and organic compounds.
INTRODUCTION
Shallow aquifers provide water for public and private drinking-water supplies, for irriga tion and livestock, and for industrial uses. Infor mation concerning the geologic nature of the aquifers, the sources and directions of ground- water flow, and the chemical nature of ground and surface water is an important contribution to informed public decision making concerning water resources. To gain information about the effects of landfills on water quality, the Kansas Department of Health and Environment current ly (1990) requires that all public landfills in Kansas install ground-water-monitoring sys tems.
In April 1988, the U.S. Geological Survey, in cooperation with the city of Emporia and Lyon County, began a study of the hydrogeology and ground-water quality in the vicinity of the Emporia-Lyon County Landfill.
Purpose and Scope
The purpose of the study was to describe the geology, hydrology, and ground-water qual ity in the vicinity of the Emporia-Lyon County Landfill. The study is one of several in Kansas that focus on the effects of landfills on the quality
Abstract
of water in shallow aquifers. This report presents information on current hydrogeologic and ground-water-quality conditions in the vicinity of the Emporia-Lyon County Landfill, including a description of regional geology and hydrology, a description of alluvial sediments penetrated during drilling of wells in and near the landfill, a description of hydrologic conditions in the allu vial sediments in and near the landfill, and a de scription of inorganic and organic ground-water
chemistry for water samples from 13 monitoring wells in and near the landfill.
General Description of Study Area
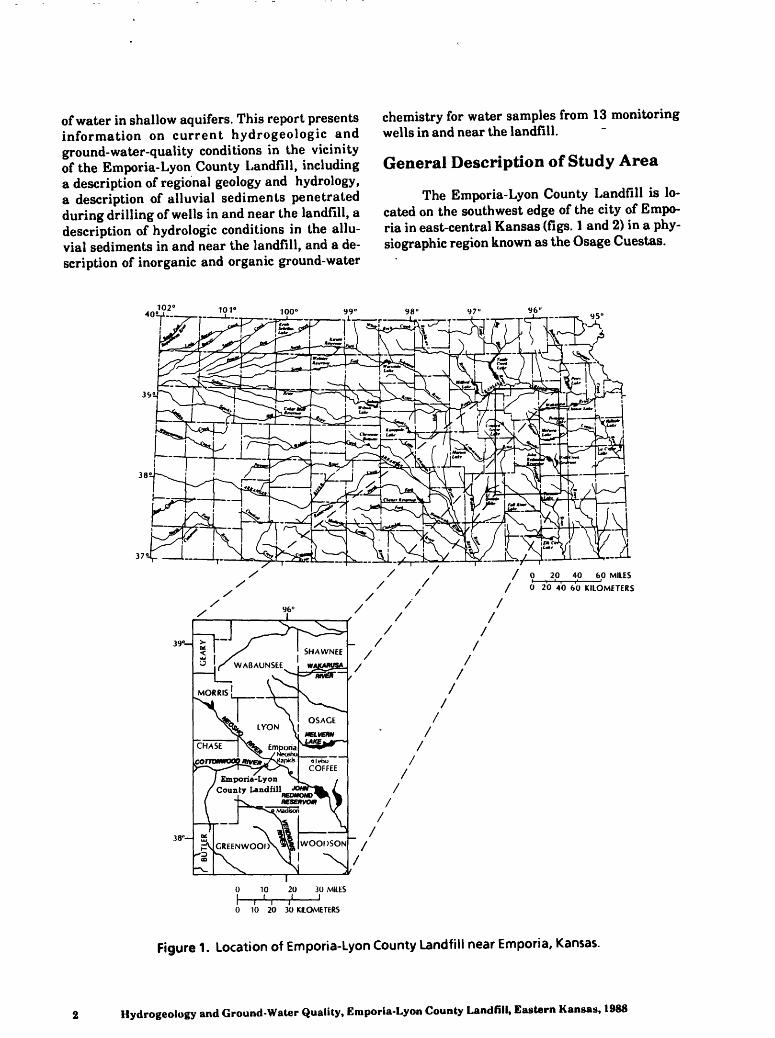
The Emporia-Lyon County Landfill is lo cated on the southwest edge of the city of Empo- ria in east-central Kansas (figs. 1 and 2) in a phy siographic region known as the Osage Cuestas.
95"-V
/ 0 20 40 60 MILES
/ 0 20 40 60 KILOMETERS
38"H
0 10 20 30 KILOMETERS
Figure 1. Location of Emporia-Lyon County Landfill near Emporia, Kansas.
2 Hydrogeology and Ground-Water Quality, Emporia-Lyon County Landfill, Eastern Kansas, 1988
96° 15' 96° 12'30'
38° 25' :
38° 22'30"
ResidentialvShkirow wash wast* ransportation
Commercial
Cropland (m v* *J * vJ
'Boundary ofEmporia-LyonCounty Landfill
Abandoned tracks11 <.
17 /7
Waste lagoons===:Waste laaoons
Cropland *n
Base from U.S. Geological Survey Emporia, 1:24,000, 1979
/toe
1 MILE
S-l
EXPLANATION
SUPPLY WELL AND NUMBER
1 KILOMETER
CONTOUR INTERVAL 10 FEET DATUM IS SEA LEVEL
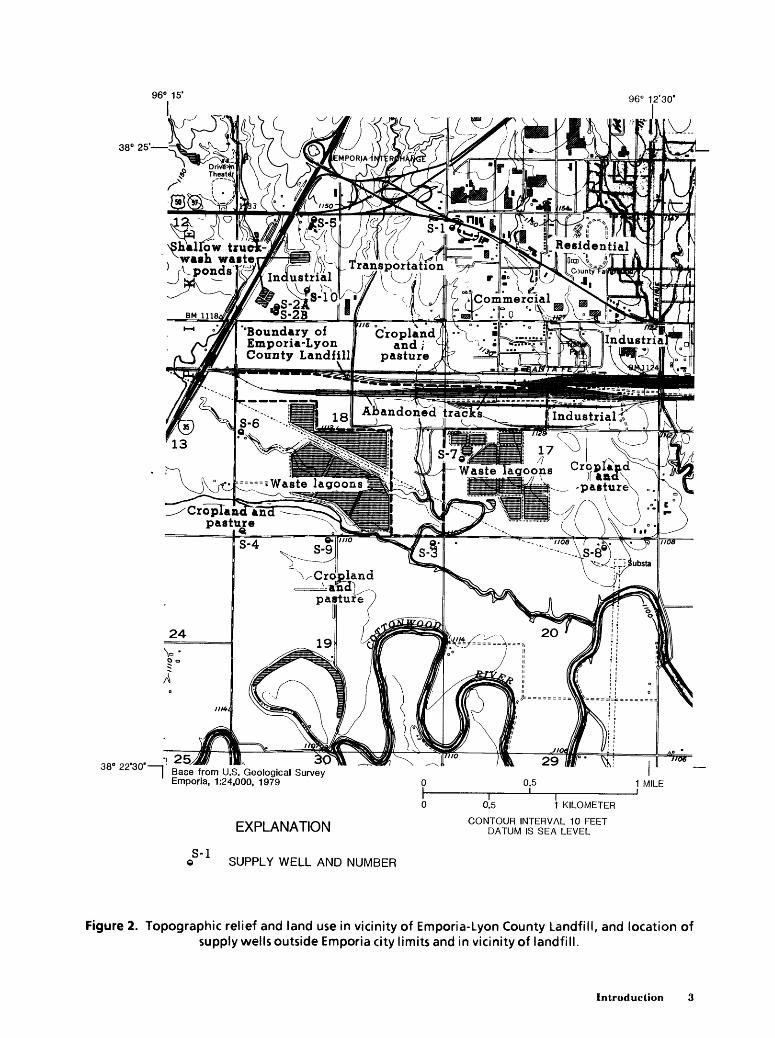
Figure 2. Topographic relief and land use in vicinity of Emporia-Lyon County Landfill, and location of supply wells outside Emporia city limits and in vicinity of landfill.
Introduction
The topography in the Osage Cuestas region is characterized by northeast-southwest irregular ly trending, east-facing escarpments, with gently rolling or flat plains in between (Schoewe, 1949). The major drainage systems in Lyon County are the Cottonwood and Neosho Rivers. The landfill is located in the flood plain of the Cottonwood River.
Climate records from a station at Emporia indicate that, for this area, the mean annual precipitation from 1951-80 was about 37 inches (National Oceanic and Atmospheric Administration, 1988). More than 50 percent of the precipitation occurs during the months of May through July. Temperatures range from below zero to more than 100 °P. On the average, the coldest temperatures are recorded in January, the hottest in July.
Land use in the vicinity of the landfill is varied (fig. 2). Emporia is primarily residential, with some commercial and industrial develop ment. Land adjacent to the landfill is used for beef-packing-plant waste lagoons, railroad yards, and agriculture.
Surface- and ground-water resources sup ply water for municipal, domestic, and industrial uses. The city of Emporia derives most of its wa ter from the Neosho River to the north. Most do mestic and industrial water users within Empo ria use the city water supply, although wells may supply water for lawns and gardens or light in dustrial use. Outside the city limits, near the landfill, ground water is the primary source of water for domestic and industrial purposes. In some places, water for domestic use is hauled in by truck. Figure 2 shows the location of known dug or drilled supply wells outside the Emporia city limits and in the vicinity of the landfill.
Previous Studies
There are no published reports concerning the effect of the Emporia-Lyon County Landfill on ground- or surface-water quality. However, analyses of water from domestic and supply wells in the area are available. Regional studies of ground and surface water are published and in clude data for the Emporia area. Parker (1911) and Ha worth (1913) summarized known data on ground-water supplies in Kansas. O'Connor (1953a) reported on the ground-water resources of Lyon County, including chemical analyses of
water from wells in the Emporia area. The geolo gy of Lyon County has been described by Smith (1903) and O'Connor (1953b). Jewett (1951) re ported on structural features of the rocks of Kan sas.
PUBLIC-LANDFILL SOLID WASTES AND EFFECTS ON WATER QUALITY
The following is a general discussion of solid- waste composition, solid-waste degradation, and leachate production in landfills. Although exact solid-waste composition and chemical processes in the Emporia-Lyon County Landfill are not known, they may be inferred to be similar to the general composition and chemical processes dis cussed in the following paragraphs.
Solid-Waste Composition
Solid wastes are discarded, unwanted ma terials. In the past, landfill sites often were merely convenient depressions, and solid wastes were considered as serviceable fill to level low- lying areas. Pew if any sites were planned as en gineering projects. Wastes commonly were left uncovered in open dumps. As an alternative, the sanitary-landfill method was developed, incorpo rating engineering principles for maximum con finement and containment. Basic design fea tures of a sanitary landfill are an impermeable bottom and sides, exclusion of drainage, compac tion and daily cover of the waste, and final cap ping (Sal vato and others, 1971; Degner, 1974).
Composition of the Emporia-Lyon County Landfill wastes is not known explicitly, but typical nationwide composition, by weight, is 45- percent paper, 15-percent garbage, 11-percent yard and garden trimmings, 9-percent metal, 8- percent glass, 4-percent dirt, ashes, and concrete, 3-percent textiles, 3-percent plastics, and 2- percent wood (Tchobanoglous and others, 1977). About 80 percent is combustible, of which aggregate amounts of fixed carbon, moisture, and volatile organic matter represent 7, 20, and 53 percent of the waste, respectively. Waste composition varies due to climate, season, recycling, demography, packaging, and marketing (Tchobanoglous and others, 1977).
Solid-Waste Degradation
About 20 percent of typical solid waste
4 Hydrogeology and Ground-Water Quality, Emporia-Lyon County Landfill, Eastern Kansas, 1988
essentially is inert or degrades slowly, including glass, wood, rubber, plastics, and synthetic tex tiles. The other 80 percent, mostly paper, gar bage, yard and garden trimmings, and ferrous metal is totally or partly degradable (Tchobano- glous and others, 1977). Initially, while wastes are exposed to the air, the landfill environment is oxidizing. After depletion of trapped or incoming oxygen by aerobic bacteria, the environment be comes reducing. Degradation processes in the landfill include biologic decomposition, solution, precipitation, sorption, ion exchange, and diffu sion of gases (Baedecker and Back, 1979). Suffi cient moisture, 40 to 60 percent, is essential, however, for significant degradation rates.
While oxygen is available, biologic decompo sition is conducted by aerobic bacteria and then, in the absence of oxygen, by anaerobic bacteria. Aerobic decomposition proceeds rapidly and probably begins in easily degradable garbage soon after deposition of the waste. Decomposition by hydrolysis allows bacteria to convert complex organic molecules to smaller, soluble ones that the bacteria can use for growth. Net products are primarily carbon dioxide and water, plus sulfate and ammonia (Baedecker and Back, 1979).
When oxygen is depleted, only anaerobic de composition occurs on the solid waste. Anaerobic decomposition is slower and more complex than aerobic decomposition, and requires symbiotic relationships (Gaudy and Gaudy, 1980). Anaero bic decomposition occurs in two steps. Step one is fermentation by faculative bacteria to soluble smaller molecules, and then to fatty acids and al cohols. Step two is methane formation by obli gate methanogenic bacteria. The actual symbi osis probably involves hydrogen transfer be tween the two types of bacteria and removal in methane. The hydrogen removal prevents build up that would be toxic to methanogens and would suppress fatty-acid production (Gaudy and Gaudy, 1980). End products of fully completed anaerobic decomposition are methane, water, and carbon dioxide (Baedecker and Back, 1979). These end products probably first appear on the periphery of landfills (Metzler, 1975) where higher pH is more favorable to methanogenic bacteria.
At any one time, different parts of the same landfill may be in different stages of decomposi tion. Stage and rate also will vary from one land fill to another, depending primarily on moisture
and degradability. Decomposition stage and rate also depend on temperature and on landfill shredding, mixing, and compacting procedures. Many landfills complete the aerobic stage in a few weeks and go through anaerobiosis quickly enough to allow significant methane production to peak within 2 years and then decline for 25 years or longer (Tchobanoglous and others, 1977). The progress of anaerobic decomposition may be estimated by the attendant conditions. In step one of anaerobic decomposition, the leachate pll is 4 to 5; chemical oxygen demand is relative ly large; and specific conductance, due to acidic solution of metals, is also large (O'Leary and Tansel, 1986). In step two of anaerobic decompo sition, methane-gas concentrations in the land fill are large; leachate pH is 7 to 8; and specific conductance and chemical oxygen demand are relatively small (O'Leary and Tansel, 1986).
Leachate Production
Leachate is generated by the percolation of water through the waste. Because paper prob ably absorbs both original and metabolically generated water, leachate production above the water table requires infiltration of surface water. Solids, gases, and liquids from the waste are in corporated as dissolved, suspended, or sorbed, and miscible or immiscible components. Meta bolic carbon dioxide, produced by bacterial ac tion, dissolves easily, decreasing pi I. The result ing dissolution of calcium carbonate increases hardness and dissolved solids. The solvent capa bility of the leachate is increased also by the bac- terially generated organic acids, allowing some metals in the landfill to be dissolved, notably iron and manganese.
Chemical processes in leachate production are oxidation, reduction, dissolution, precipita tion, ion exchange, and sorbtion; these processes probably are affected by the organic environment (Baedecker and Back, 1979). Physical processes are settlement, movement of evolved and ejected water by differential hydraulic heads, entrain- ment of colloidal and particulate material in flushing water, filtration, change of solute con centration by osmosis and concentration gradi ents, density separation of immiscible phases, and vertical and horizontal migration of gases.
Leachate composition is variable.Some typical concentrations and composition ranges of the most abundant constituents are listed in table 1.
Public-Landfill Solid Wastes and Effects on Water Quality 5
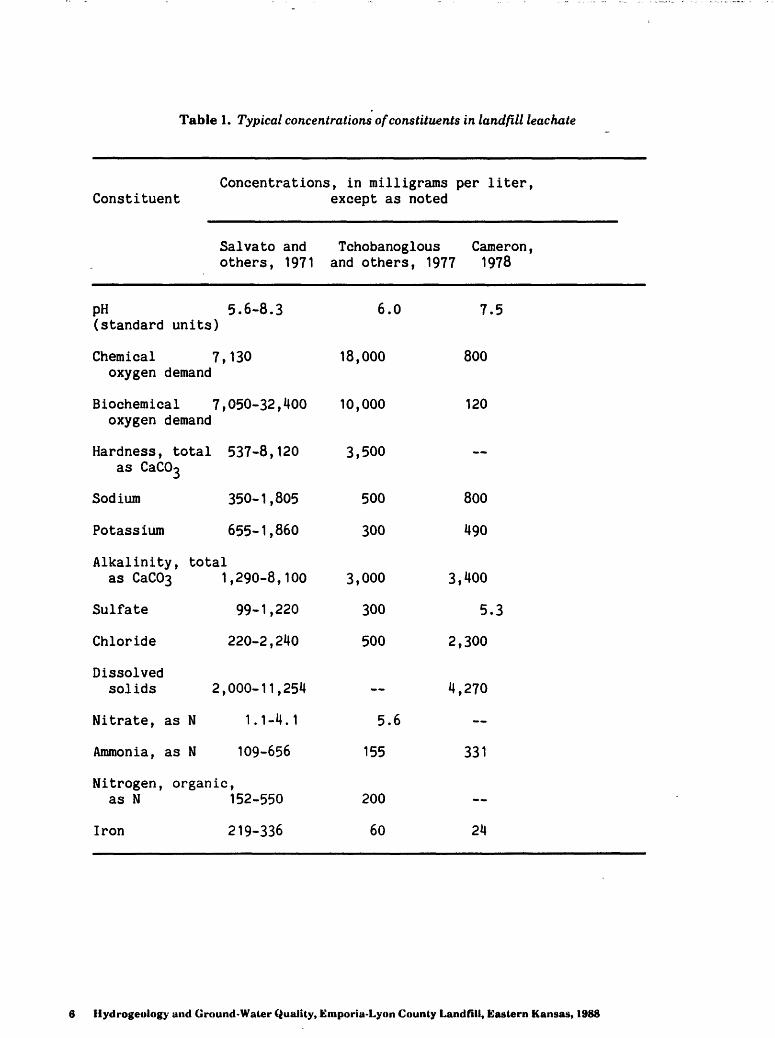
Table 1. Typical concentrations of constituents in landfill leachate
Concentrations, in milligrams per liter, Constituent except as noted
Salvato and Tchobanoglous Cameron, others, 1971 and others, 1977 1978
pH 5.6-8.3 6.0 7.5 (standard units)
Chemical 7,130 18,000 800 oxygen demand
Biochemical 7,050-32,400 10,000 120 oxygen demand
Hardness, total 537-8,120 3,500as CaCO^
Sodium
Potassium
Alkalinity, total as CaC03 1
Sulfate
Chloride
Dissolved solids 2,
Nitrate, as N
Ammonia, as N
Nitrogen, organic as N
Iron
350-1,805
655-1,860
,290-8,100
99-1,220
220-2,240
000-11,254
1.1-4.1
109-656
152-550
219-336
500
300
3,000
300
500
5.6
155
200
60
800
490
3,400
5.3
2,300
4,270
331
24
6 Hydrogeology and Ground-Water Quality, Emporia-Lyon County Landfill, Eastern Kansas, 1988
Where ranges are given, the larger values are ex pected only in newer landfills because newly es tablished landfills have a more-rapid rate early- stage biodegradation, which involves acid pro duction.
Sodium and potassium tend to stay in so lution, unabsorbed by clay when calcium is present. Alkalinity is always very large in leachate because bicarbonate is produced direct ly in anaerobic reactions and indirectly when carbon dioxide dissolves. Bicarbonate is dis solved also from landfill ash, soil, and rock. Sul- fate, derived from ash and treatment wastes, may be reduced within the landfill anaerobic en vironment and precipitated as ferrous sulfide, but sulfate is otherwise conservative. Chloride is nonreactive, and its variation in leachate is due mostly to dilution. Nitrogen is present most ly as ammonia because of pH and redox condi tions stemming from anaerobic decomposition and the presence of dissolved iron (Apgar and Langmuir., 1971). Commonly, iron is present in large concentrations derived both from the waste and with manganese from oxide cements in soil and coatings and cements in soil and rock.
Metals such as cadmium, chromium, co balt, copper, lead, mercury, nickel, strontium, and zinc also may be detected in landfill leachate but are present in small and variable concentra tions because, with the exception of lead, they are either in elemental form in insoluble metals and alloys, or are in special, unusual industrial wastes. Other environmentally significant met als found in landfill leachate include arsenic, bo ron, and selenium. Arsenic originates mainly in toxic compounds, such as insecticides. Boron is found in soap, glazes, and rubber, and selenium in ink and rubber.
METHODS OF INVESTIGATION
There were four phases of investigation in the study of the Emporia-Lyon County Landfill. Data pertaining to the landfill's history, geology, hydrology, and land ownership were compiled during an initial information-gathering phase. On the basis of this information, temporary-well sites and potential monitoring-well sites were selected. The well-installation phase commenced with the drilling of test holes and the installation of temporary wells to determine the hydrology and geology of the area. Monitoring wells were installed on the basis of geologic and hydrologic
information from the temporary wells. In the third phase, water samples were collected from all monitoring wells and from selected surface- water bodies and were analysed by the Kansas Department of Health and Environment (Topeka, Kans.) and U.S. Geological Survey (Arvada, Colo.) laboratories. This report concludes the fourth phase of data interpretation and reporting. The following sections relate details of investigation methods.
Information Survey
Prior to any field work, a survey of pub lished literature, files of the Kansas Department of Health and Environment (Topeka), and files of the City of Emporia and Lyon County was com pleted. Geologic and hydrologic information al lowed estimation of the directions of ground- water flow, depth to bedrock, and geology in the vicinity of the landfill. This information was use ful for planning well locations, field activities, and material requirements.
Temporary-Well Installation
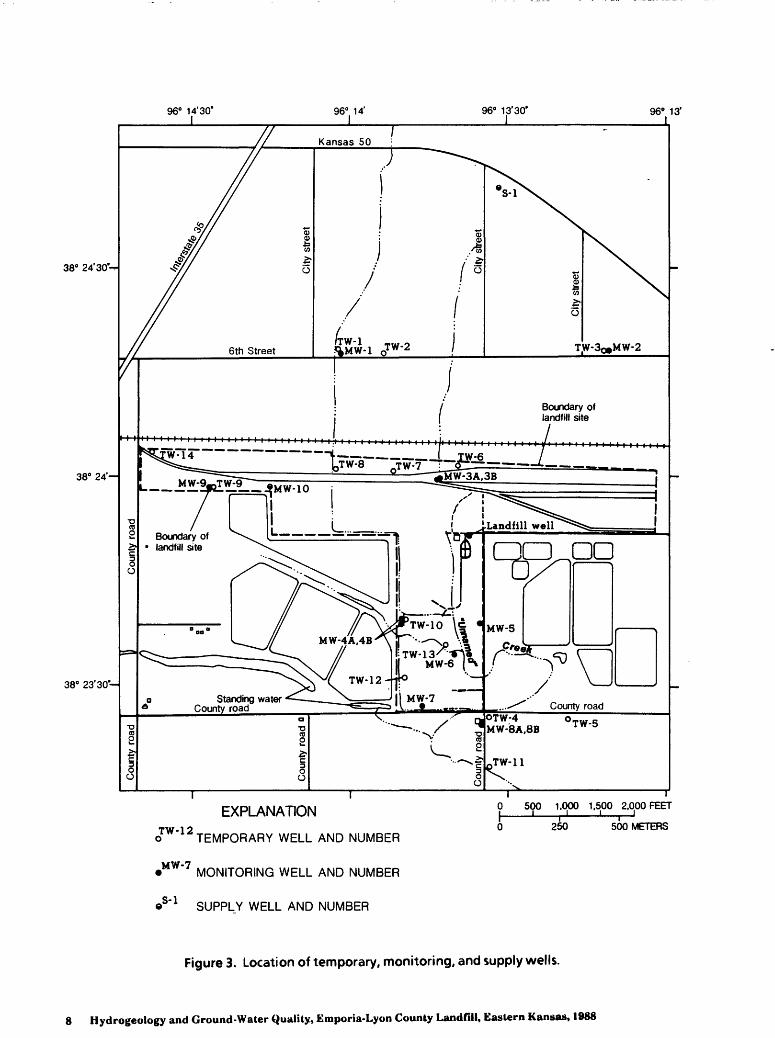
Fourteen temporary wells (TW-1 to TW- 14) were installed using 3 1/4-inch inside diame ter (6 5/8-inch outside diameter) hollow-stem au gers with a center plate over the bottom of the augers to prevent sediment from clogging the in side of the auger bit. In wet sediments it was nec essary to "load" the augers with potable water to prevent formation sand and water from surging into the augers when the bottom plate was knocked out to set the well. Temporary wells con sisted of 1 1/2-inch polyvinyl-chloride pipe with glued joints, capped at the bottom, and slotted with a hacksaw. Temporary wells were set to dif ferent depths at the same site (nested) to evalu ate vertical ground-water movement. The loca tion of temporary wells is shown in figure 3.
After all temporary wells had been in stalled, the top-of-casing altitude for each well was determined (table 2). Water levels in tempo rary wells were measured to the nearest 0.01 foot with a steel tape. Water-level altitudes were used to construct a potentiometric-surface map to indicate directions of ground-water flow.
Monitoring-Well Installation
Thirteen monitoring wells (MW-1 to MW- 10) were installed using 6 1/4-inch inside
Methods of Investigations
96° 14'30' 96°. 14' 96° 13'30*
I
38° 24'30V-
38° 24'
38° 23'30
____ TW-6 /0TW-8 TW-7 LTy g> L -,
EXPLANATION 0 500 1.000 1.500 2.000 FEET
TW-1 2o TEMPORARY WELL AND NUMBER
250 500 METERS
MW-7MONITORING WELL AND NUMBER
.S-lSUPPLY WELL AND NUMBER
Figure 3. Location of temporary, monitoring, and supply wells.
8 Hydrogeology and Ground-Water Quality, Emporia-Lyon County Landfill, Eastern Kansas, 1988
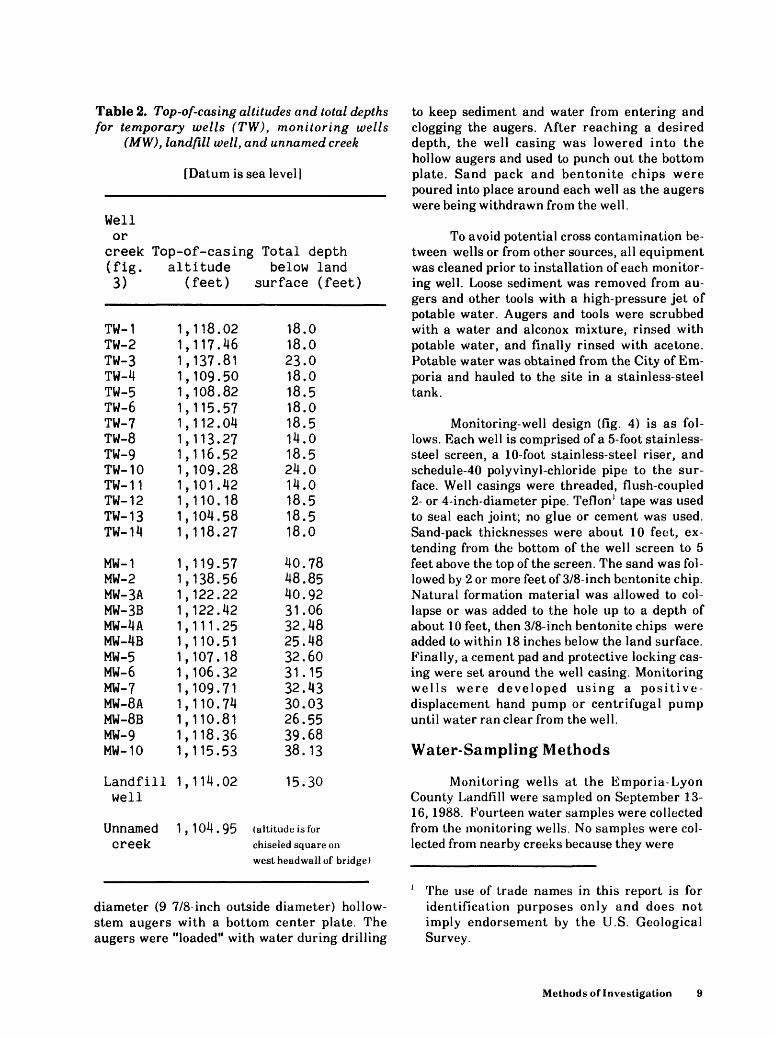
Table 2. Top-of-casing altitudes and total depthsfor temporary wells (TW), monitoring wells
(MW), landfill well, and unnamed creek
[Datum is sea level]
Wellor
creek Top-of-casing Total depth (fig. altitude below land3) (feet) surface (feet)
TW-1TW-2TW-3TW-4TW-5TW-6TW-7TW-8TW-9TW-10TW-11TW-1 2TW-1 3TW-1 4
MW-1MW-2MW-3AMW-3BMW-4AMW-4BMW-5MW-6MW-7MW-8AMW-8BMW-9MW-10
Landfillwell
Unnamedcreek
1,118.021,117.461,137.811,109.501,108.821,115.571,112.041,113.271,116.521,109.281,101.421,110.181,104.581,118.27
1,119.571,138.561,122.221,122.421,111.251,110.511,107.181,106.321,109.711,110.741,110.811,118.361,115.53
1,114.02
1,104.95
18.018.023.018.018.518.018.514.018.524.014.018.518.518.0
40.7848.8540.9231.0632.4825.4832.6031.1532.4330.0326.5539.6838.13
15.30
(altitude is fur
chiseled square on
west head wall of bridge)
to keep sediment and water from entering and clogging the augers. After reaching a desired depth, the well casing was lowered into the hollow augers and used to punch out the bottom plate. Sand pack and bentonite chips were poured into place around each well as the augers were being withdrawn from the well.
To avoid potential cross contamination be tween wells or from other sources, all equipment was cleaned prior to installation of each monitor ing well. Loose sediment was removed from au gers and other tools with a high-pressure jet of potable water. Augers and tools were scrubbed with a water and alconox mixture, rinsed with potable water, and finally rinsed with acetone. Potable water was obtained from the City of Em- poria and hauled to the site in a stainless-steel tank.
Monitoring-well design (fig. 4) is as fol lows. Each well is comprised of a 5-foot stainless- steel screen, a 10-foot stainless-steel riser, and sehedule-40 polyvinyl-chloride pipe to the sur face. Well casings were threaded, flush-coupled 2- or 4-inch-diameter pipe. Teflon 1 tape was used to seal each joint; no glue or cement was used. Sand-pack thicknesses were about 10 feet, ex tending from the bottom of the well screen to 5 feet above the top of the screen. The sand was fol lowed by 2 or more feet of 3/8-inch bentonite chip. Natural formation material was allowed to col lapse or was added to the hole up to a depth of about 10 feet, then 3/8-inch bentonite chips were added to within 18 inches below the land surface. Finally, a cement pad and protective locking cas ing were set around the well casing. Monitoring wells were developed using a positive- displacement hand pump or centrifugal pump until water ran clear from the well.
Water-Sampling Methods
Monitoring wells at the Emporia-Lyon County Landfill were sampled on September 13- 16, 1988. Fourteen water samples were collected from the monitoring wells. No samples were col lected from nearby creeks because they were
diameter (9 7/8-inch outside diameter) hollow- stem augers with a bottom center plate. The augers were "loaded" with water during drilling
1 The use of trade names in this report is for identification purposes only and does not imply endorsement by the U.S. Geological Survey.
Methods of Investigation
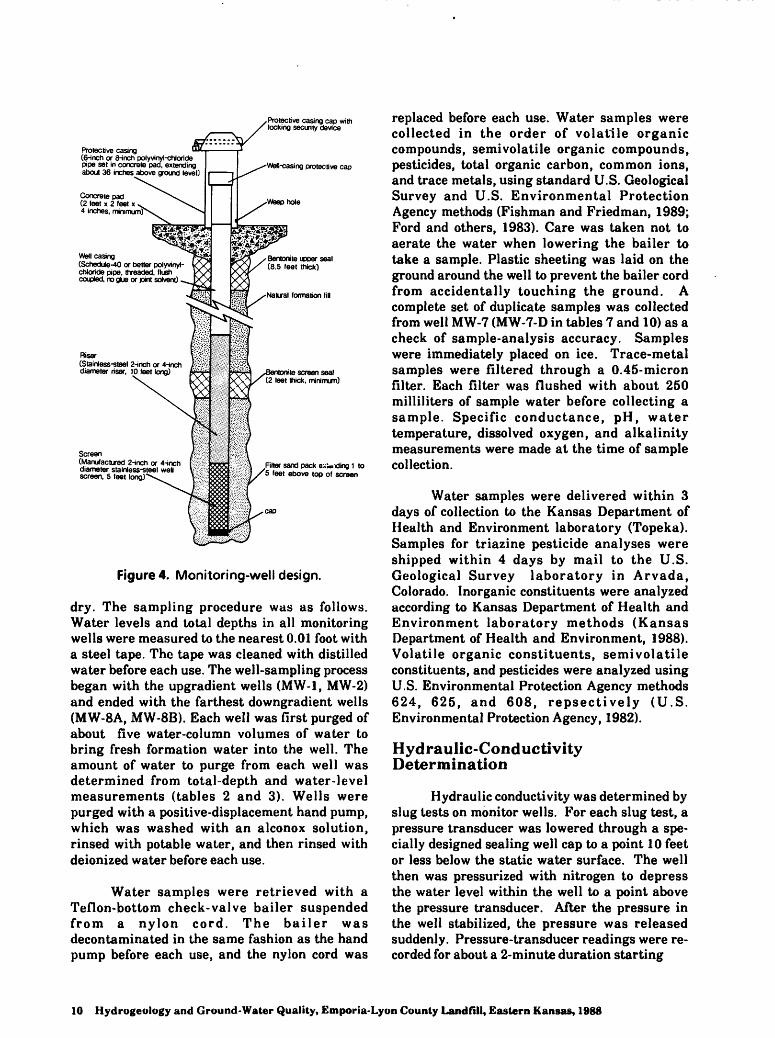
Protective casing(6-inch or 8-inch polyvinyl-chloride pipe set in concrete pad, extending about 36 inches above ground level)
Concrete pad (2 feet x 2 feet x 4 inches, min
31 * ^
imumPv.
h0.kAT'A*.M-:
Well casing(Schedule-40 or better polyvinyl- chloride pipe, threaded, flush coupled, no glue or pint solvent)
Riser(Stainless-steel 2-inch or 4-inchdiameter riser, 10 feet long)
Screen(Manufactured 2-inch or 4-inch diameter stainless-steel weH screen, 5 feet long)
Protective casing cap with locking security device
Well-casing protective cap
Weep hole
Bentonite upper seal (8.5 feet thick)
Natural formation ft!
le screen seal (2 leet thick, minimum)
Fitter sand pack eliding 1 to 5 feet ebove top of screen
Figure 4. Monitoring-well design.
dry. The sampling procedure was as follows. Water levels and total depths in all monitoring wells were measured to the nearest 0.01 foot with a steel tape. The tape was cleaned with distilled water before each use. The well-sampling process began with the upgradient wells (MW-1, MW-2) and ended with the farthest downgradient wells (MW-8A, MW-8B). Each well was first purged of about five water-column volumes of water to bring fresh formation water into the well. The amount of water to purge from each well was determined from total-depth and water-level measurements (tables 2 and 3). Wells were purged with a positive-displacement hand pump, which was washed with an alconox solution, rinsed with potable water, and then rinsed with deionized water before each use.
Water samples were retrieved with a Teflon-bottom check-valve bailer suspended from a nylon cord. The bailer was decontaminated in the same fashion as the hand pump before each use, and the nylon cord was
replaced before each use. Water samples were collected in the order of volatile organic compounds, semivolatile organic compounds, pesticides, total organic carbon, common ions, and trace metals, using standard U.S. Geological Survey and U.S. Environmental Protection Agency methods (Fishman and Friedman, 1989; Ford and others, 1983). Care was taken not to aerate the water when lowering the bailer to take a sample. Plastic sheeting was laid on the ground around the well to prevent the bailer cord from accidentally touching the ground. A complete set of duplicate samples was collected from well MW-7 (MW-7-D in tables 7 and 10) as a check of sample-analysis accuracy. Samples were immediately placed on ice. Trace-metal samples were filtered through a 0.45-micron filter. Each filter was flushed with about 250 milliliters of sample water before collecting a sample. Specific conductance, pH, water temperature, dissolved oxygen, and alkalinity measurements were made at the time of sample collection.
Water samples were delivered within 3 days of collection to the Kansas Department of Health and Environment laboratory (Topeka). Samples for triazine pesticide analyses were shipped within 4 days by mail to the U.S. Geological Survey laboratory in Arvada, Colorado. Inorganic constituents were analyzed according to Kansas Department of Health and Environment laboratory methods (Kansas Department of Health and Environment, 1988). Volatile organic constituents, semivolatile constituents, and pesticides were analyzed using U.S. Environmental Protection Agency methods 624, 625, and 608, repsectively (U.S. Environmental Protection Agency, 1982).
Hydraulic-Conductivity Determination
Hydraulic conductivity was determined by slug tests on monitor wells. For each slug test, a pressure transducer was lowered through a spe cially designed sealing well cap to a point 10 feet or less below the static water surface. The well then was pressurized with nitrogen to depress the water level within the well to a point above the pressure transducer. After the pressure in the well stabilized, the pressure was released suddenly. Pressure-transducer readings were re corded for about a 2-minute duration starting
10 Hydrogeology and Ground-Water Quality, Emporia-Lyon County Landfill, Eastern Kansas* 1988
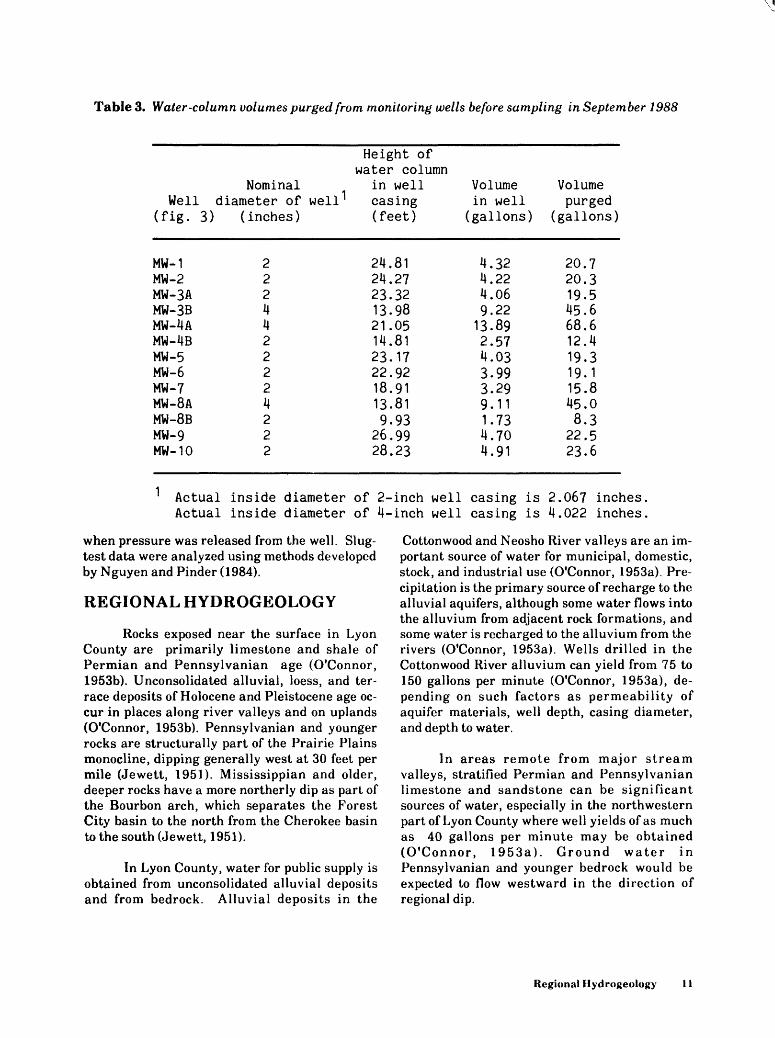
Table 3. Water-column volumes purged from monitoring wells before sampling in September 1988
Height ofwater column
Well(fig.
MW-1MW-2MW-3AMW-3BMW-4AMW-4BMW-5MW-6MW-7MW-8AMW-8BMW-9MW-10
Nominaldiameter of well'
3) (inches)
2224422224222
in wellcasing(feet)
24.8124.2723.3213.9821.0514.8123.1722.9218.9113.819.93
26.9928.23
Volumein well
(gallons)
4.324.224.069.2213.892.574.033.993.299.111.734.704.91
Volumepurged
(gallons)
20.720.319.545.668.612.419.319.115.845.08.3
22.523.6
Actual inside diameter of 2-inch well casing is 2.067 inches. Actual inside diameter of 4-inch well casing is 4.022 inches.
when pressure was released from the well. Slug- test data were analyzed using methods developed by Nguyen and Finder (1984).
REGIONAL HYDROGEOLOGY
Rocks exposed near the surface in Lyon County are primarily limestone and shale of Permian and Pennsylvanian age (O'Connor, 1953b). Unconsolidated alluvial, loess, and ter race deposits of Holocene and Pleistocene age oc cur in places along river valleys and on uplands (O'Connor, 1953b). Pennsylvanian and younger rocks are structurally part of the Prairie Plains monocline, dipping generally west at 30 feet per mile (Jewett, 1951). Mississippian and older, deeper rocks have a more northerly dip as part of the Bourbon arch, which separates the Forest City basin to the north from the Cherokee basin to the south (Jewett, 1951).
In Lyon County, water for public supply is obtained from unconsolidated alluvial deposits and from bedrock. Alluvial deposits in the
Cottonwood and Neosho River valleys are an im portant source of water for municipal, domestic, stock, and industrial use (O'Connor, 1953a). Pre cipitation is the primary source of recharge to the alluvial aquifers, although some water flows into the alluvium from adjacent rock formations, and some water is recharged to the alluvium from the rivers (O'Connor, 1953a). Wells drilled in the Cottonwood River alluvium can yield from 75 to 150 gallons per minute (O'Connor, 1953a), de pending on such factors as permeability of aquifer materials, well depth, casing diameter, and depth to water.
In areas remote from major stream valleys, stratified Permian and Pennsylvanian limestone and sandstone can be significant sources of water, especially in the northwestern part of Lyon County where well yields of as much as 40 gallons per minute may be obtained (O'Connor, 1953a). Ground water in Pennsylvanian and younger bedrock would be expected to flow westward in the direction of regional dip.
Regional Hydrogeology 11
SITE DESCRIPTION AND LANDFILL HYDROGEOLOGY
Landfill Setting
The Emporia-Lyon County landfill is lo cated in the flood plain of the Cottonwood River about 0.5 mile north of the river (fig. 2). The landfill is bordered by beef-packing-plant waste- processing lagoons to the east and west, by crop land, pasture, railroad tracks, and various light industries to the north, and by cropland and pas ture to the south (fig. 2). Surface drainage in the landfill vicinity is from north to south by way of drainage ditches and creeks toward the Cotton- wood River.
Landfill Siting, Design, and Management
The Emporia-Lyon County Landfill began operation in 1974 and expanded to its present (1990) size through a series of land acquisitions. Currently, the Emporia-Lyon County Landfill covers about 250 acres. Of the 250 acres, about 100 acres have been filled, about 20 acres are be ing readied for filling, about 20 acres are being used for sewage-solids disposal, and about 110 acres are being held for future development (fig. 5).
The Emporia-Lyon County Landfill is managed as a sanitary landfill using area-type fill and ramp-type fill methods. Ordinary waste is deposited in cells and covered with soil each day. Disposal areas with bases below the water table are raised with construction and demoli tion debris prior to burial of degradable wastes. Sewage solids are deposited on the ground sur face in the southernmost 20 acres of the landfill (fig. 5). The landfill also receives small quanti ties of hazardous wastes, including asbestos, dy namite, paint residues, caustic mercury, various laboratory chemicals, paint thinner, mud from car-wash pits, paint filters, and hide manure. Asbestos is buried near the south end of the land fill, whereas other hazardous wastes are buried in specified areas of the landfill (fig. 5) or are buried in working fill areas. Drainage ditches have been constructed and maintained through out the landfill area to facilitate runoff and to lower the water table in the area.
Geology
The landfill is located in the alluvium of the present-day and ancestral Cottonwood River. The alluvium consists of a basal 3- to 10-foot thick layer of sandy gravel overlain by 25 to 35 feet of sandy or silty clay and clay layers. Bore hole logs indicate that the basal sandy gravel layer is continuous in the landfill area, but that sandy and silty clay layers, which overlie the basal layer, are discontinuous and grade lateral ly into more clay-rich sediments. The thickest basal gravel layers were found in wells MW-2 and MW-5 (fig. 6). Usually gravel was present in the clay layers overlying the basal gravel layer. The observed vertical and lateral changes in grain size and sediment type are the result of past deposition by the Cottonwood River as it me andered back and forth across its valley.
In the vicinity of the landfill, the alluvium is underlain by shale and limestone of the Upper Pennsylvanian Wabaunsee Group. Red shale was recovered from the auger bit in well MW-2. On the basis of borehole logs presented in O'Connor (1953b), the red shale in MW-2 may be the Dry Shale Member of the Stotler Limestone. The Stotler Limestone is composed of two lime stone members, the Grandhaven Member, and the Dover Member, separated by the Dry Shale Member. The Grandhaven Member consists of 3.5 to 12 feet of interbedded shale and limestone; the Dover Member averages 2 feet in thickness; and the middle Dry Shale Member is 8 to 10 feet thick (O'Connor, 1953b; Zeller, 1968). The lime stone beds in the Stotler Limestone are not con sidered to be a significant source of water (O'Connor, 1953a). In other boreholes drilled at the landfill, hard rock was encountered at total depth, but no samples of this material were re covered.
Hydrology
The direction and rate of ground-water movement in the alluvium in the vicinity of the landfill was determined by water-level measure ments and slug tests (tables 4 and 5). The poten- tiometric surface, based on water-level data from wells and nearby creeks, indicates that ground water generally flows from the northeast and northwest towards the landfill area, then south through the landfill to the Cottonwood River (figs. 7 and 8).
This general flow pattern may change
12 Hydrogeulugy and Ground-Water Quality, Emporia-Lyon County Landfill, Eastern Kansas, 1988
96° 14'3CT 96° 14' 96° 13'30'
38° 24'30-
38° 24'
38° 23'30
Railroad tracksM I l I I ) I l I I
I M ) I I t
Abandoned rail beds
i iaiiuij.ii i , ',, i i^*^area' fill area //Hazardous waste
~ r »» / m _ ... _ _i _ roT"*^--Tornado fill area
Animal carcassesr-n ^/ ii 'p --Construction
-* *' T*ra e4-^i I I
. T . Lagoon New trash- \ 1
0 250 500 METERS
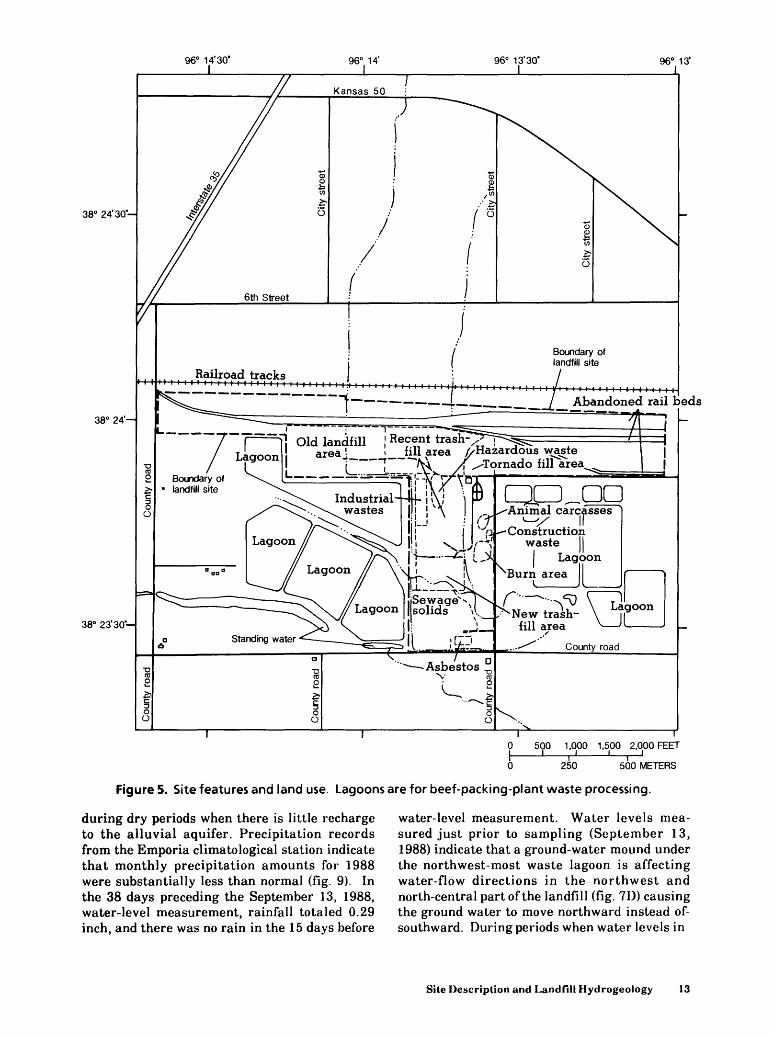
Figure 5. Site features and land use. Lagoons are for beef-packing-plant waste processing.
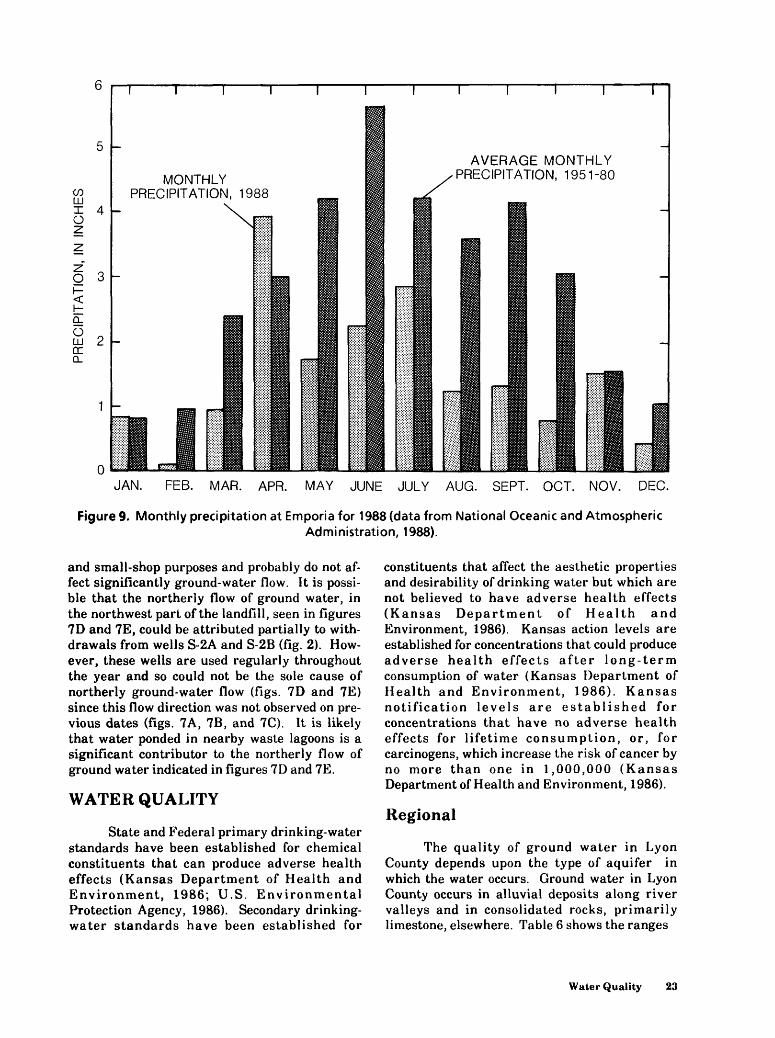
during dry periods when there is little recharge to the alluvial aquifer. Precipitation records from the Emporia climatological station indicate that monthly precipitation amounts for 1988 were substantially less than normal (fig. 9). In the 38 days preceding the September 13, 1988, water-level measurement, rainfall totaled 0.29 inch, and there was no rain in the 15 days before
water-level measurement. Water levels mea sured just prior to sampling (September 13, 1988) indicate that a ground-water mound under the northwest-most waste lagoon is affecting water-flow directions in the northwest and north-central part of the landfill (fig. ID) causing the ground water to move northward instead of- southward. During periods when water levels in
Site Description and Landfill Hydrogeology 13
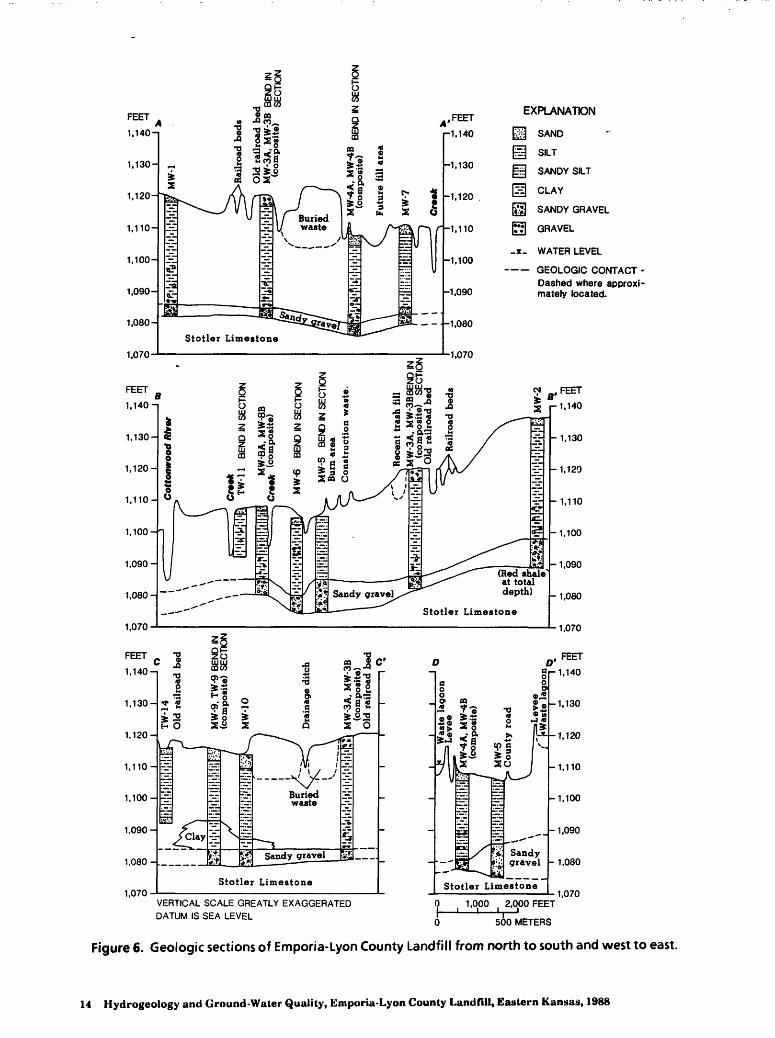
FEET .FEETEXPLANATION
H SAND
^ SILT
H SANDY SILT
[5| CLAY
[§] SANDY GRAVEL
(t?J GRAVEL
-i_ WATER LEVEL
GEOLOGIC CONTACT - Dashed where approxi mately located.
VERTICAL SCALE GREATLY EXAGGERATED DATUM IS SEA LEVEL
1,000 2.000 FEET1,070
0 500 METERS
Figure 6. Geologic sections of Emporia-Lyon County Landfill from north to south and west to east.
14 Hydrogeology and Ground-Water Quality, Emporia-Lyon County Landfill, Eastern Kansas, 1988
96° 15*96° 12'30'
38° 25-
38° 22' 30"
V \lTOPEKA / jf
Base from U.S. Geological Survey Emporia, 1:24,000, 1979 0.5
-I1 MILE
0.5
EXPLANATION1 KILOMETER
A'CONTOUR INTERVAL 10 FEET
DATUM IS SEA LEVEL
TRACE OF SECTION
TW-11o TEMPORARY WELL AND NUMBER
MONITORING WELL AND NUMBER
Figure 6. Geologic sections of Emporia-Lyon County Landfill from north to south and west to east- Continued.
Site Description and Landfill Hydrogeology 15
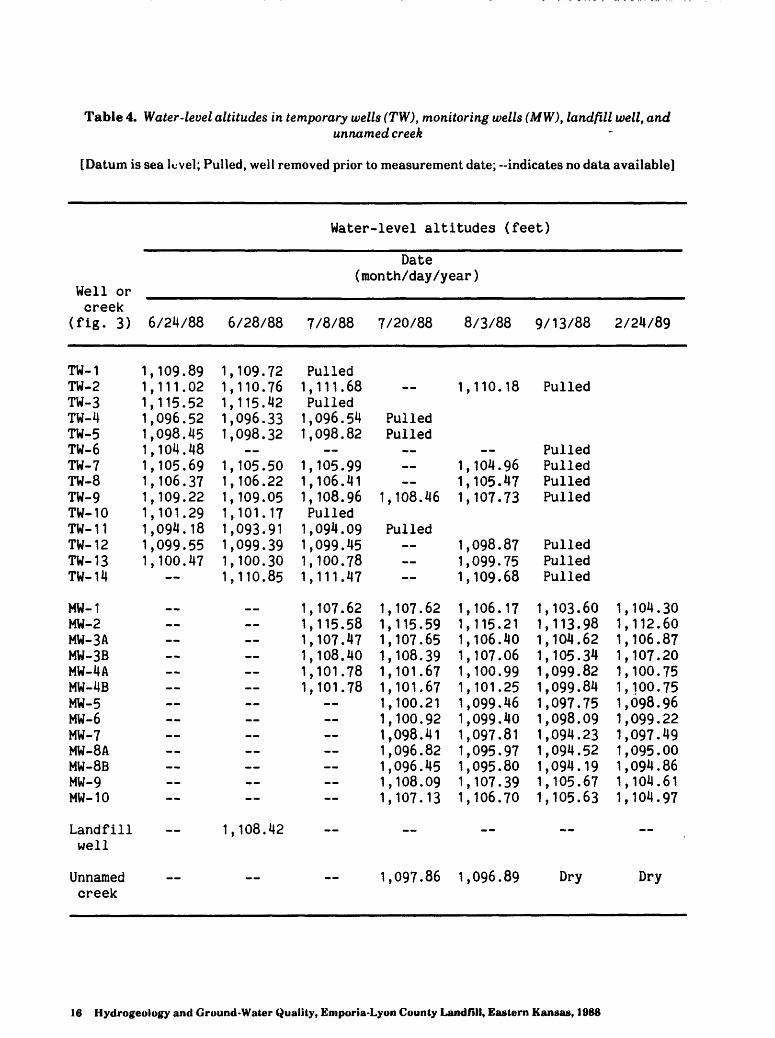
Table 4. Water-level altitudes in temporary wells (TW), monitoring wells (MW), landfill well, andunnamed creek
[Datum is sea level; Pulled, well removed prior to measurement date; -indicates no data available]
Water-level altitudes (feet)
Well or
Date (month/day/year)
creek (fig. 3)
TW-1 TW-2 TW-3 TW-4 TW-5 TW-6 TW-7TW-8TW-9TW-10TW-11TW-1 2TW-1 3TW-1 4
MW-1MW-2MW-3AMW-3BMW-4AMW-4BMW-5MW-6MW-7MW-8AMW-8BMW-9MW-10
Landfillwell
Unnamedcreek
6/24/88
1,109.89 1,111.02 1,115.52 1,096.52 1,098.45 1,104.48 1,105.691,106.371,109.221,101.291,094.181,099.551,100.47
__
__
__
6/28/88
1,109.72 1,110.76 1,115.42 1,096.33 1,098.32
1,105.501,106.221,109.051,101.171,093.911,099.391,100.301,110.85
__
1,108.42
__
7/8/88
Pulled 1,111.68 Pulled 1,096.54 1,098.82
1,105.991,106.411,108.96Pulled1,094.091,099.451,100.781,111.47
1,107.621,115.581,107.471,108.401,101.781,101.78
__
7/20/88
Pulled Pulled
1,108.46
Pulled
1,107.621,115.591,107.651,108.391,101.671,101.671,100.211,100.921,098.411,096.821,096.451,108.091,107.13
__
1,097.86
8/3/88
1,110.18
1,104.961,105.471,107.73
1,098.871,099.751,109.68
1,106.171,115.211,106.401,107.061,100.991,101.251,099.461,099.401,097.811,095.971,095.801,107.391,106.70
_-
1,096.89
9/13/88
Pulled
Pulled PulledPulledPulled
PulledPulledPulled
1,103.601,113.981,104.621,105.341,099.821,099.841,097.751,098.091,094.231,094.521,094.191,105.671,105.63
Dry
2/24/89
1,104.301,112.601,106.871,107.201,100.751,100.751,098.961,099.221,097.491,095.001,094.861,104.611,104.97
Dry
16 Hydrogeology and Ground-Water Quality, Emporia-Lyon County Landfill, Eastern Kansas, 1988
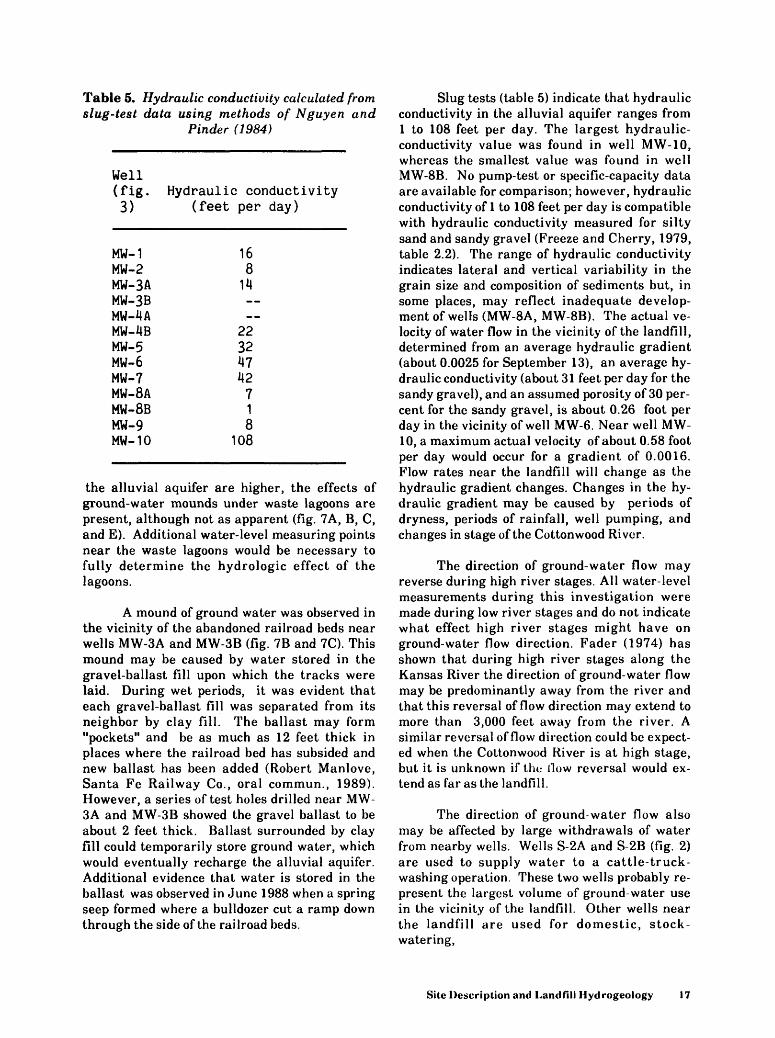
Table 5. Hydraulic conductivity calculated fromslug-test data using methods of Nguyen and
Finder (1984)
Well(fig.3)
MW-1MW-2MW-3AMW-3BMW-4AMW-4BMW-5MW-6MW-7MW-8AMW-8BMW-9MW-10
Hydraulic conductivity(feet per day)
16814
22324742718
108
the alluvial aquifer are higher, the effects of ground-water mounds under waste lagoons are present, although not as apparent (fig. 7A, B, C, and E). Additional water-level measuring points near the waste lagoons would be necessary to fully determine the hydrologic effect of the lagoons.
A mound of ground water was observed in the vicinity of the abandoned railroad beds near wells MW-3A and MW-3B (fig. 7B and 7C). This mound may be caused by water stored in the gravel-ballast fill upon which the tracks were laid. During wet periods, it was evident that each gravel-ballast fill was separated from its neighbor by clay fill. The ballast may form "pockets" and be as much as 12 feet thick in places where the railroad bed has subsided and new ballast has been added (Robert Manlove, Santa Fe Railway Co., oral commun., 1989). However, a series of test holes drilled near MW- 3A and MW-3B showed the gravel ballast to be about 2 feet thick. Ballast surrounded by clay fill could temporarily store ground water, which would eventually recharge the alluvial aquifer. Additional evidence that water is stored in the ballast was observed in June 1988 when a spring seep formed where a bulldozer cut a ramp down through the side of the railroad beds.
Slug tests (table 5) indicate that hydraulic conductivity in the alluvial aquifer ranges from 1 to 108 feet per day. The largest hydraulic- conductivity value was found in well MW-10, whereas the smallest value was found in well MW-8B. No pump-test or specific-capacity data are available for comparison; however, hydraulic conductivity of 1 to 108 feet per day is compatible with hydraulic conductivity measured for silty sand and sandy gravel (Freeze and Cherry, 1979, table 2.2). The range of hydraulic conductivity indicates lateral and vertical variability in the grain size and composition of sediments but, in some places, may reflect inadequate develop ment of wells (MW-8A, MW-8B). The actual ve locity of water flow in the vicinity of the landfill, determined from an average hydraulic gradient (about 0.0025 for September 13), an average hy draulic conductivity (about 31 feet per day for the sandy gravel), and an assumed porosity of 30 per cent for the sandy gravel, is about 0.26 foot per day in the vicinity of well MW-6. Near well MW- 10, a maximum actual velocity of about 0.58 foot per day would occur for a gradient of 0.0016. Flow rates near the landfill will change as the hydraulic gradient changes. Changes in the hy draulic gradient may be caused by periods of dryness, periods of rainfall, well pumping, and changes in stage of the Cottonwood River.
The direction of ground-water flow may reverse during high river stages. All water-level measurements during this investigation were made during low river stages and do not indicate what effect high river stages might have on ground-water flow direction. Fader (1974) has shown that during high river stages along the Kansas River the direction of ground-water flow may be predominantly away from the river and that this reversal of flow direction may extend to more than 3,000 feet away from the river. A similar reversal of flow direction could be expect ed when the Cottonwood River is at high stage, but it is unknown if the How reversal would ex tend as far as the landfill.
The direction of ground-water flow also may be affected by large withdrawals of water from nearby wells. Wells S-2A and S-2B (fig. 2) are used to supply water to a cattle-truck- washing operation. These two wells probably re present the largest volume of ground-water use in the vicinity of the landfill. Other wells near the landfill are used for domestic, stock- watering,
Site Description and Landfill Hydrogeology 17
00 S o 5"
5 § a O
c ta B
I o O o c 3
EX
PL
AN
AT
ION
».«
»
PO
TEN
TIO
MET
HIC
CO
NTO
UR
-Sho
ws
attit
ude
at w
hich
wat
er l
evel
wou
ld h
ave
stoo
d in
tig
htly
cas
ed w
eds.
Das
hed
whe
re a
ppro
xim
atel
y lo
cate
d. C
onto
ur i
nter
val
O.S
and
1 fo
ot.
Dat
um i
s se
a le
vel
°nW
nao
urn
TEM
POR
AR
Y W
ELL
AN
D N
UM
BE
R-N
umbe
r in
par
enth
eses
is w
ater
-leve
l ii.
ovv
.ao
) ai
uiut
je,
in l
eet.
NA
. in
dica
tes
wat
er l
evel
not
ava
ilabl
e. D
atum
is
sea
leve
lU
W-1
.,.'..
MO
NIT
OR
ING
WEL
L A
ND
NU
MB
ER
-Num
ber
in p
aren
thes
es is
wat
er-
ii.io
v.B
vi
teve
| a|tj
tude
)
)ee
, NA
> in
dica
tes
wat
er l
evel
not
ava
ilabl
e.
Dat
um t
e se
a le
vel
^
A
PPR
OXI
MA
TE D
flEC
TIO
N O
F G
RO
UN
D-W
ATE
R F
LOW
_..
_.
C
RE
EK
OR
DR
AIN
AG
E D
ITC
H
0 50
0 1.
000
1.M
O
2,00
0 FE
ET
0 2»
800M
ETC
RS
Figu
re 7
. P
oten
tiom
etri
c su
rfac
e in
vic
inity
of
Empo
ria-L
yon
Cou
nty
Land
fill (
A) J
une
24 (s
hallo
w),
(B) A
ugus
t 3 (
shal
low
), (C
) Aug
ust 3
(de
ep),
(D) S
epte
mbe
r 13
,198
8 (d
eep)
, and
(E) F
ebru
ary
24,1
989
(dee
p).
*t2«
sI'5L
?__
»MW
-io
i^Sk
"/
7(1
, 1
07
.73
) !
/ N
A
I /V
/ i
/
*/ fa"^
vn|»
/ V
-(c
rxk
) C
ounly
B.
August
5,
19
88
(s
hallo
w w
ell
scre
en
set
in
sand
y cl
ay
laye
r)
°TW
-5
500
I.OO
O
1.50
0 2.
0OO
FE
ET
C.
Au
gu
st
5,
ll)8
8
(dee
p--
wel
l sc
reen
set
in
san
dy g
rave
l la
yer)
0 500
1.000
1,50
0 2.0OO FEET
0 250
500 METERS
Fig
ure
7.
Po
ten
tiom
etr
ic s
urfa
ce in
vic
inity
of
Em
poria
-Lyo
n C
ount
y La
ndfil
l (A
.) Ju
ne 2
4 (s
hallo
w),
(B)
Aug
ust 3
(sh
allo
w),
(C
) Aug
ust 3
(de
ep),
(D)
Sep
tem
ber
13,1
988
(dee
p), a
nd (
E) F
ebru
ary
24,1
989
(dee
p)--
Con
tinue
d.
s V! a a
O n
C a <O c W
3 e o £ O e c r a 2J M (C JD a
0 50
0 1,
000
1.50
0 2.
000
FEET
0
MO
50
0 M
ETE
RS
Figu
re 7
. P
oten
tiom
etric
sur
face
in v
icin
ity o
f E
mpo
ria-L
yon
Cou
nty
Land
fill (
A)
June
24
(sha
llow
), (
B) A
ugus
t 3 (
shal
low
), (
C) A
ugus
t 3 (
deep
),(D
) Sep
tem
ber
13,1
988
(dee
p), a
nd (E
) Fe
brua
ry 2
4,19
89 (
deep
)-C
ontin
ued.
,FEET
M.140 EXPLANATION
LINE OF EQUAL POTENTIAL- Shows altitude at which water level would have stood in tightly cased well. Dashed where approximately located. Contour interval 1 foot. Datum is sea level
WELL Number is water-level altitude, in feet. NA, indicates water level not available Datum is sea level
-A' TRACE OF SECTION-Shown in figure 6
-1,100
Sandy gravel
-1,080
Stotler Limestone
1,070
1,080-
1,070
-1,090
-1,080
VERTICAL SCALE GREATLY EXAGGERATED DATUM IS SEA LEVEL
A. August 3, '1988
1,000 2,000 FEET1,070
500 METERS
Figure 8. Potentiometric profiles in vicinity of Emporia-Lyon County Landfill, (A) August 3 and (B)September 13,1988.
Site Description and Landfill Hydrogeulugy 21
1.140-1
1.130-
1.120-
1.110-
1.100-
1.090-
1.080-
1.070
siApproximate water level
- .____.!_.-_
NA
>' Jf ; T~^^2« 5*. 5 - - Stotler Limestone* , J* i* T "* i i * i
S_________/____/____.____. \ i I ; t______ ^ ^-y/\
1.140-
1.130-
1.120-
1,110-
1.100-1
1,090-J
1.080-
1,070
FEET
iHSSnS 2S2
\"\
TJ~
§ w * I * Hz £ I =5 5 <B|I 1
!l ilffi 19-aw 5o 5/1 i S i « o
FEET
---/
Approximate water level
NA
^WrW\- 1 -^V*"*\\\--^^"TTS ^1 IT'-"-- JiX" ^^" x>x ' x > ~ 1>l
/ N III § \J}-ttrjsrv~^*+ '. '/ /__ > J^ r T M>J8.(J9 * ° f *---\ tf-
,080
-Stotler Limestone
Buried waste
Animate '' 1()S-J4 1 water level
VERTICAL SCALE GREATLY EXAGGERATED DATUM IS SEA LEVEL
8. September 13, 1988
1.000 2.000 REET
500 METERS
1.070
Figure 8. Potentiometric profiles in vicinity of Emporia-Lyon County Landfill, (A) August 3 and (B)September 13,1988-Continued.
22 Hydrogeology and Ground-Water Quality, Emporia-Lyon County Landfill, Eastern Kansas, 1988
LLJI 4O
Q 3I-
DC Q_
MONTHLY PRECIPITATION, 1988
AVERAGE MONTHLY PRECIPITATION, 1951-80
0 ES
JAN. FEB. MAR. APR. MAY JUNE JULY AUG. SEPT. OCT. NOV. DEC.
Figure 9. Monthly precipitation at Emporia for 1988 (data from National Oceanic and AtmosphericAdministration, 1988).
and small-shop purposes and probably do not af fect significantly ground-water flow. It is possi ble that the northerly flow of ground water, in the northwest part of the landfill, seen in figures 7D and 7E, could be attributed partially to with drawals from wells S-2A and S-2B (fig. 2). How ever, these wells are used regularly throughout the year and so could not be the sole cause of northerly ground-water flow (figs. 7D and 7E) since this flow direction was not observed on pre vious dates (figs. 7A, 7B, and 7C). It is likely that water ponded in nearby waste lagoons is a significant contributor to the northerly flow of ground water indicated in figures 7D and 7E.
WATER QUALITY
State and Federal primary drinking-water standards have been established for chemical constituents that can produce adverse health effects (Kansas Department of Health and Environment, 1986; U.S. Environmental Protection Agency, 1986). Secondary drinking- water standards have been established for
constituents that affect the aesthetic properties and desirability of drinking water but which are not believed to have adverse health effects (Kansas Department of Health and Environment, 1986). Kansas action levels are established for concentrations that could produce adverse health effects after long-term consumption of water (Kansas Department of Health and Environment, 1986). Kansas notification levels are established for concentrations that have no adverse health effects for lifetime consumption, or, for carcinogens, which increase the risk of cancer by no more than one in 1,000,000 (Kansas Department of Health and Environment, 1986).
Regional
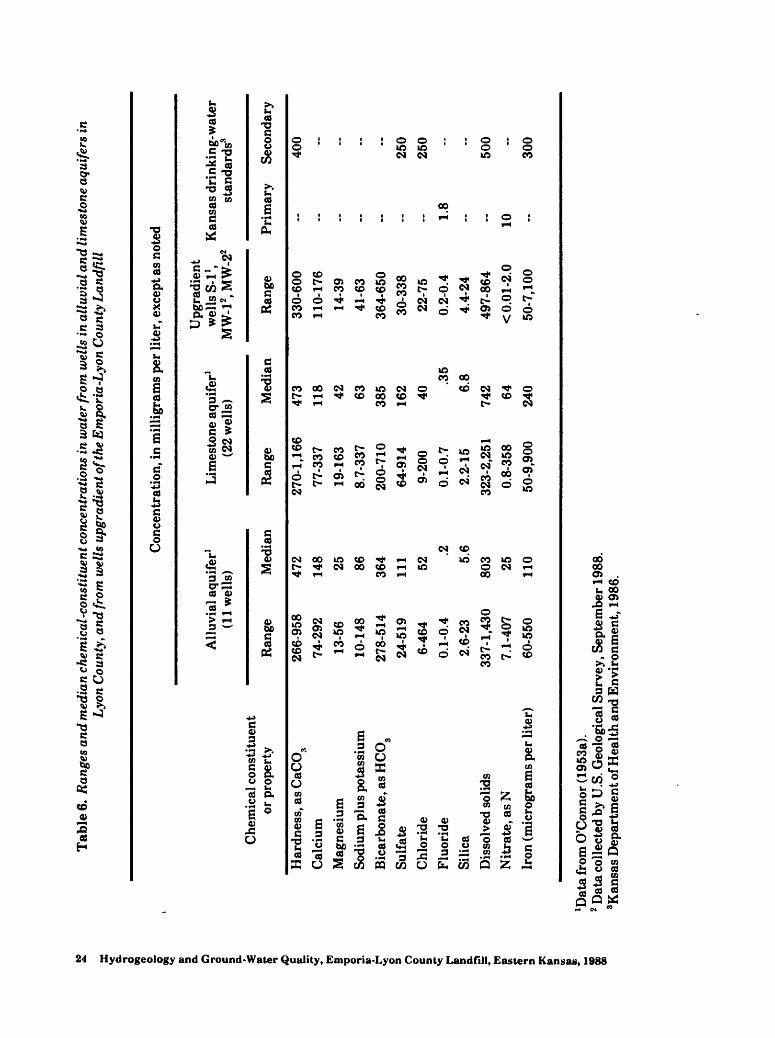
The quality of ground water in Lyon County depends upon the type of aquifer in which the water occurs. Ground water in Lyon County occurs in alluvial deposits along river valleys and in consolidated rocks, primarily limestone, elsewhere. Table 6 shows the ranges
Water Quality 23
Tab
le 6
. R
ange
s an
d m
edia
n ch
emic
al-c
onst
ituen
t con
cent
ratio
ns in
wat
er fr
om w
ells
in a
lluv
ial a
nd li
mes
tone
aqu
ifers
in
Lyo
n C
ount
y, a
nd fr
om w
ells
upg
radi
ent o
f the
Em
pori
a-L
yon
Cou
nty
Lan
dfil
l
a
Ci
3 a
t» v< B v« C o c c
Con
cent
ratio
n, in
mil
ligr
ams
per
lite
r, e
xcep
t as
note
d
Che
mic
al c
onst
itue
nt
or p
rope
rty
Har
dnes
s, a
s C
aCO
,C
alci
umM
agne
sium
Sodi
um p
lus
pota
ssiu
mB
icar
bona
te, a
s H
CO
0 3
Sulf
ate
Chl
orid
eFl
uori
deSi
lica
Dis
solv
ed s
olid
sN
itra
te, a
s N
Iron
(m
icro
gram
s pe
r li
ter)
Allu
vial
aqu
ifer
1 (1
1 w
ells
)
Ran
ge
266-
958
74-2
9213
-56
10-1
4827
8-51
424
-519
6-46
40.
1-0.
42.
6-23
337-
1,43
07.
1-40
760
-550
Med
ian
472
148 25 86 364
111 52
.2 5.6
803 25 110
Lim
esto
ne a
quif
er1
(22
wel
ls)
Ran
ge
270-
1,16
677
-337
19-1
638.
7-33
720
0-71
064
-914
9-20
00.
1-0.
72.
2-15
323-
2,25
10.
8-35
850
-9,9
00
Med
ian
473
118 42 63 385
162 40
.35
6.8
742 64 240
Upg
radi
ent
wel
ls S
-l1,
MW
-12,
MW
-22
Ran
ge
330-
600
110-
176
14-3
941
-63
364-
650
30-3
3822
-75
0.2-
0.4
4.4-
2449
7-86
4<
0.0
1-2.
050
-7,1
00
Kan
sas
drin
king
-wat
er
stan
dard
s3
Pri
mar
y Se
cond
ary
400
-- - - -
250
250
1.8
500
1030
0
*Dat
a fr
om O
'Con
nor
(195
3a).
2 Dat
a co
llect
ed b
y U
.S. G
eolo
gica
l Sur
vey,
Sep
tem
ber
1988
.3K
ansa
s D
epar
tmen
t of H
ealt
h an
d E
nvir
onm
ent,
1986
.
and median values for chemical constituents in water from alluvial and limestone aquifers. Wa ter from the alluvial aquifer usually is preferred because of its generally better chemical quality, larger yields, and greater reliability of wells dur ing periods of drought (O'Connor, 1953a). On the basis of data reported by O'Connor (1953a), hard ness, dissolved-solids, and nitrate concentrations exceed Kansas primary or secondary drinking- water standards in water from some wells (table 6).
Landfill
Water from well S-l near the landfill (fig. 2) and from wells MW-1 and MW-2, which are upgradient of the landfill, is representative of ambient ground-water quality in the vicinity of the Emporia-Lyon County Landfill (table 6). Compared to other wells completed in the allu vial aquifer in Lyon County, wells S-l, MW-1, and MW-2 have similar chemical-concentration ranges, except that these wells have a much larg er range of iron concentrations and smaller ranges of hardness, chloride, dissolved solids, and nitrate (table 6).
EFFECT OF LANDFILL ON WATER QUALITY
Inorganic Compounds
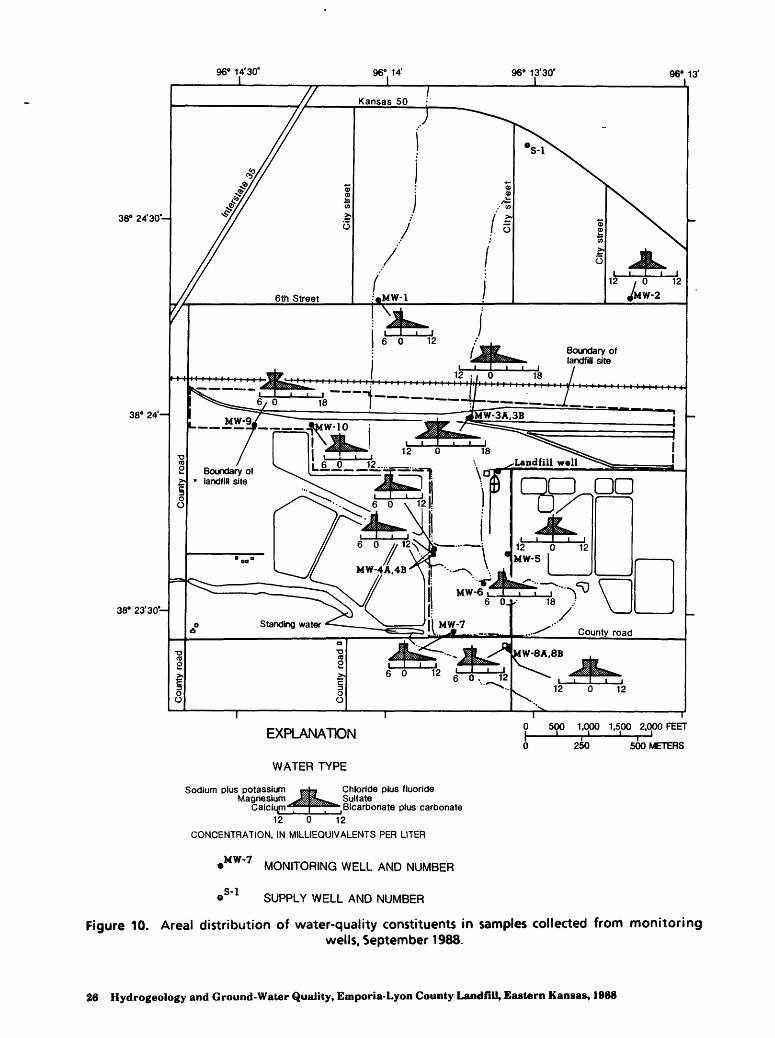
Chemical analyses of monitoring-well wa ter samples collected in September 1988 indicate that calcium bicarbonate type water is the domi nant ground-water type in the vicinity of the landfill (figs. 10 and 11). For the major ions, cal cium concentrations ranged from 110 to 180 mg/L (milligrams per liter); magnesium, from 14 to 41 mg/L; sodium, from 40 to 110 mg/L; bicar bonate, as HCO3 , from 460 to 980 mg/L, sulfate, from 16 to 91 mg/L; and chloride, from 11 to 160 mg/L. Total hardness, as CaCO3 ranged from 330 to 610 mg/L; dissolved solids, from 497 to 860 mg/L; iron, from 10 to 7,100 ug/L (micrograms per liter); and manganese, from 50 to 4,500 ug/L (table 7). None of the concentrations of inorganic constituents detected in water from landfill mon itoring wells exceeded Kansas or Federal prima ry drinking-water standards. However, Kansas secondary drinking-water standards were equaled or exceeded for total hardness in water from wells MW-2, MW-3A, MW-3B, MW-4A, MW-5, MW-6, and MW-8B; for dissolved solids in
water from all monitoring wells except MW-1 and MW-4B; for iron in water from all monitor ing wells except MW-2 and MW-8B; and for man ganese in water from all monitoring wells (table 7).
Monitoring wells were installed upgradi ent and downgradient of the Emporia-Lyon County Landfill to compare upgradient water quality with downgradient water quality. Wells MW-1, MW-2, MW-3A, and MW-3B were upgra dient of the landfill at the time of sampling, and wells MW-4A, MW-4B, MW-5, MW-6, MW-7, MW-8A, and MW-8B were downgradient of the landfill at the time of sampling (fig. 7). Wells MW-9 and MW-10 were intended to be upgradi ent wells until the landfill expands into their vi cinity. However, at the time of sampling, water- level measurements indicate that MW-9 and MW-10 were downgradient of the adjacent waste lagoon but were neither upgradient nor down- gradient of buried wastes. Therefore, these wells will be considered separately from the oth er wells. Permission was not granted to take wa ter samples or water-level measurements from adjacent waste lagoons and waste-lagoon moni toring wells.
Table 8 shows the ranges and median con centrations of constituents and properties in wa ter from the upgradient and downgradient wells and from wells MW-9 and MW-10. Water from wells MW-3A and MW-3B had large concentra tions of calcium, magnesium, sodium, chloride, ammonia, manganese, zinc, and large specific- conductance values as compared to other wells. Water from well MW-1 had the largest iron con centration as compared to other wells. Water from well MW-5 had large concentrations of bari um and iron, and water from well MW-9 had a large ammonia concentration as compared to other wells (table 7).
There are no appreciable differences be tween the median constituent concentrations in water from upgradient and downgradient groups of monitoring wells (figs. 12 and 13). However, differences are evident from a comparison of con stituent concentrations in water from wells MW- 2 and S-l with all other monitoring wells. Water from well MW-2 had larger concentrations of dis solved oxygen and nitrate, and smaller concen trations of bicarbonate, alkalinity, ammonia, ar senic, and manganese than all
Effect of Landfill on Water Quality 25
96° 14'30" I
96° 14' 96° 13'30* 96° 13'
38° 24'30-
38° 24'-
38° 23'30-
Boundary of landfill site
^a /
EXPLANATION
WATER TYPE
Sodium plus potassium g4?? Chloride plus fluoride Magnesium ^/^mm,,.^ Sulfate
Calcium ^' pY'yft*' i Bicarbonate plus carbonate12 0 12
CONCENTRATION, IN MILLIEQUIVALENTS PER LITER
M^T»7 MONITORING WELL AND NUMBER
9s' 1 SUPPLY WELL AND NUMBER
0 500 1.000 1.500 2.000 FEET
250 500 METERS
Figure 10. Areal distribution of water-quality constituents in samples collected from monitoringwells, September 1988.
26 Hydrogeology and Ground-Water Quality, Emporia-Lyon County Landfill* Eastern Kansas, 1988
4 ,FEET
-1,140
EXPLANATION
WATER TYPE
Sodium plus potassium ^1,130 Magnosium
Chloride plus fluoride ignosium Ja/L Sullate Calcium ^ifwSSfc. Bicarbonate plus carbonate
12 0 12
_1 120 CONCENTRATION. IN MILLIEOUIVALENTS PER LITER
-1,110
-1,100
-1,090
Sandy gravel
M.080
- Stotler Limestone
B WELLD
-A' TRACE OF SECTION-Shown in figures
FEET
r-1.140
1,100
-Sandy gravel
1,090
1,080
Stotler Limestone
1,070
VERTICAL SCALE GREATLY EXAGGERATED DATUM IS SEA LEVEL
1,000 2,000 FEET
500 METERS
Figure 11. Vertical distribution of water-quality constituents in samples collected from monitoringwells, September 1988.
Effect of Landfill on Water Quality 27
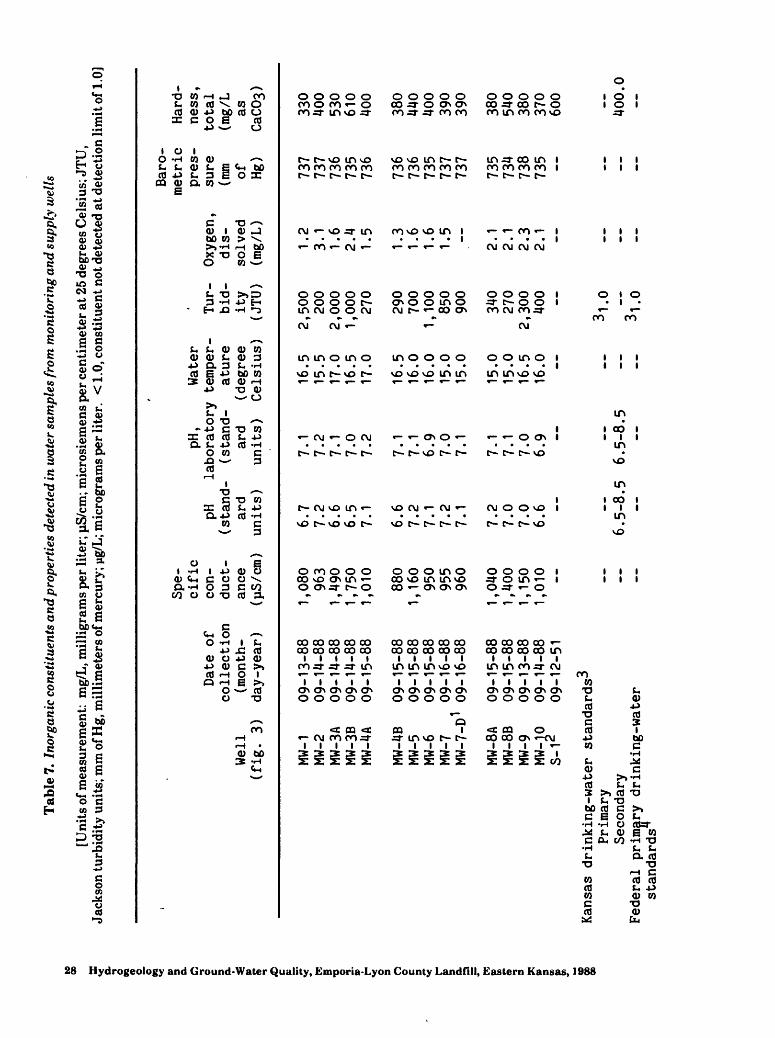
Tab
le 7
. In
orga
nic
cons
titu
ents
and
pro
pert
ies
dete
cted
in w
ater
sam
ples
from
mon
itor
ing
and
supp
ly w
ells
[Uni
ts o
f mea
sure
men
t: m
g/L
, mil
ligr
ams
per
lite
r; p
S/cm
; mic
rosi
emen
s pe
r cen
tim
eter
at 2
5 de
gree
s C
elsi
us; J
TU
, Ja
ckso
n tu
rbid
ity
units
; mm
of H
g, m
illi
met
ers
of m
ercu
ry; p
g/L;
mic
rogr
ams
per
lite
r.
< 1
.0, c
onst
itue
nt n
ot d
etec
ted
at d
etec
tion
lim
it o
f 1.0
]
a
ft
S a ft 3 o o o 3 O o c 4 sr g. ft 8 I
9
1
Well
(fig
. 3)
MW-1
MW-2
MW-3
AMW
-3B
MW-4A
MW-4B
MW-5
MW-6
MW-7
,MW
-7-D
1
MW-8
AMW
-8B
MW-9
MW-1
0S-12
Date
of
coll
ecti
on
(mon
th-
day-year)
09-13-88
09-14-88
09-14-88
09-14-88
09-15-88
09-15-88
09-15-88
09-15-88
09-16-88
09-16-88
09-15-88
09-15-88
09-13-88
09-14-88
09-12-51
Spe
cific
con
duct
ance
(pS/
cm)
1,080
963
1,490
1,750
1,010
880
1,160
950
955
960
1,040
1,400
1,150
1,010 --
pH,
Wate
r pH
labo
rato
ry te
mper
- Tur-
( sta
nd-
(stand-
atur
e bid-
ard
ard
(deg
ree
ity
units)
6 7 6 6 7 6 7 7 7 7 7 7 7 6
.7 .2 .6 .5 .1 .6 .2 .1 .2 .1 .2 .0 .0 .6
units)
Celsius)
(JTU)
7 7 7 7 7 7 7 6 7 7 7 7 7 6
.1 .2 .1 .0 .2 .1 .1 .9 .0 .1 .1 .1 .0 .9
16.5
15.5
17.0
16.5
17.0
16.5
16.0
16.0
15.0
15.0
15.0
15.0
16.5
16.0
Kansas d
rink
ing-
wate
r standards3
Prim
ary
Seco
ndar
y
6. 5-8.5
6. 5-8.5
-- Fe
dera
l pr
imar
y dr
inki
ng-w
ater
2,500
200
2,00
01,
000
270
290
700
1,100
850
900
340
270
2,30
0400
31.0
7 31.0
Oxygen ,
dis
solv
ed(m
g/L)
1.2
3.1
1.6
2.4
1.5
1.3
1.6
1.6
1.5 2.1
2.1
2.3
2.1
Baro
me
tric
pres
sure
(mm of Hg)
737
737
736
735
736
736
736
735
737
737
735
734
738
735
Hard
ness,
total
(mg/
L as
CaCO
s)
330
400
530
610
400
380
440
400
390
390
380
540
380
370
600 400.0
st
andard
s
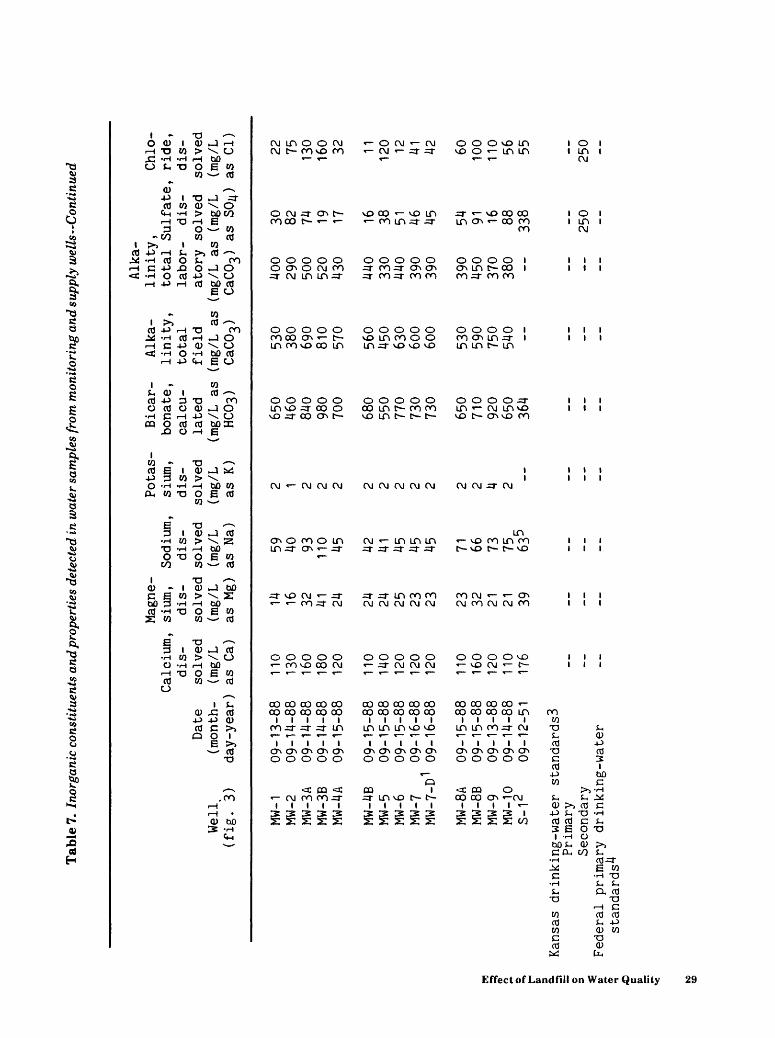
Tab
le 7
. In
orga
nic
cons
titu
ents
and
pro
pert
ies
dete
cted
in w
ater
sam
ples
from
mon
itor
ing
and
supp
ly w
ells
Con
tinu
ed
BS
Q.
Calc
ium,
Well
(fig.
3)
MW-1
MW-2
MW-3
AMW
-3B
MW-4
A
MW-4
BMW
-5MW-6
MW-7
MW-7
-D1
MW-8
AMW
-8B
MW-9
MW-1
0S-12
Date
(mon
th-
day-year)
09-13-88
09-14-88
09-14-88
09-14-88
09-15-88
09-15-88
09-15-88
09-15-88
09-16-88
09-16-88
09-15-88
09-15-88
09-13-88
09-14-88
09-12-51
dis
solv
ed(m
g/L
as Ca
)
110
130
160
180
120
110
140
120
120
120
110
160
120
110
176
Magn
e
sium,
dis
solved
(mg/
Las
Mg)
14 16 32 41 24 24 24 25 23 23 23 32 21 21 39
Sodi
um,
dis
solved
(mg/L
as N
a)
59 40 93 110 45 42 41 45 45 45 71 66 73 75
c;63
5
Potas
sium,
dis
solved
(mg/L
as K
)
2 1 2 2 2 2 2 2 2 2 2 2 4 2--
Bicar
bona
te ,
calc
ulated
(mg/L
asHC
03)
650
460
840
980
700
680
550
770
730
730
650
710
920
650
364
Alka
li
nity
,total
field
(mg/L
asCaC0
3)
530
380
690
810
570
560
450
630
600
600
530
590
750
540 --
Alka
linity
total
labor
ator
y(m
g/L
asCaC0
3)
400
290
500
520
430
440
330
440
390
390
390
450
370
380 --
> Sulf
ate,
dis
solved
(mg/L
as S
0j|)
30 82 74 19 17 16 38 51 46 45 54 91 16 88 338
Chlo
- , ride,
dis
solved
(mg/L
as C
l) 22 75 130
160 32 11 120 12 41 42 60 100
110 56 55
Kans
as drinking-water standards3
Prim
ary
Seco
ndar
yFederal
prim
ary
drinking-water
standards4
250
250
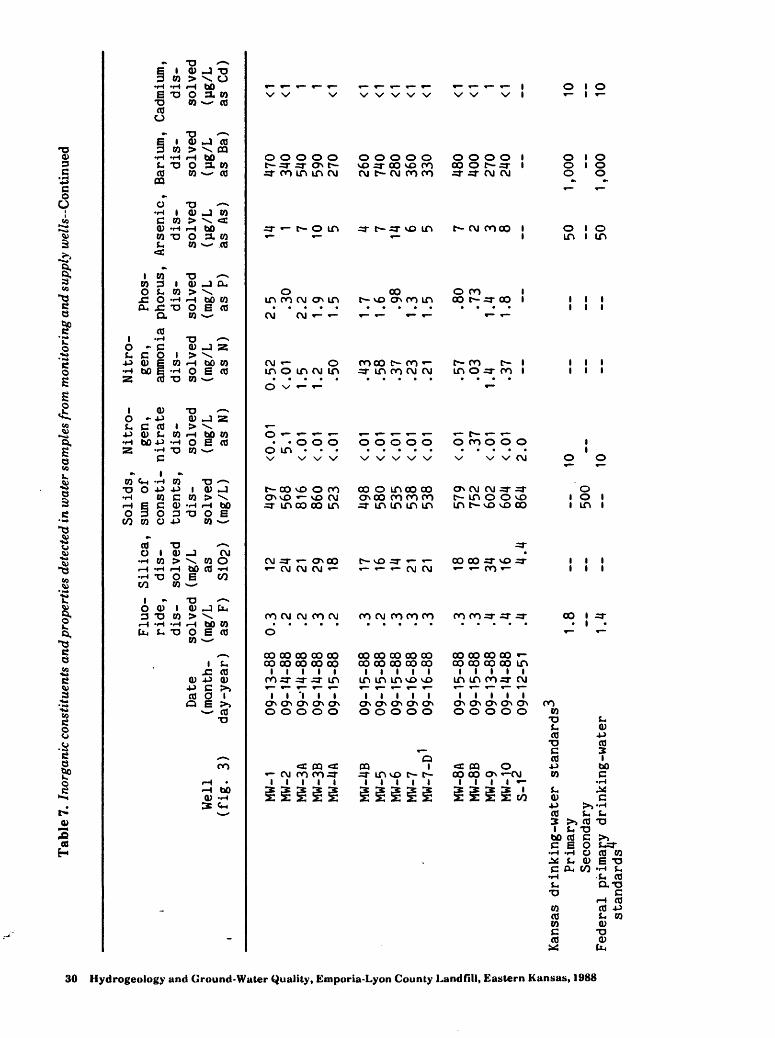
Tab
le 7
. In
orga
nic
cons
titu
ents
and
pro
pert
ies
dete
cted
in w
ater
sam
ples
from
mon
itor
ing
and
supp
ly w
ells
Con
tinu
ed
X
«< a. 3 Q.
ft
C a £ K 3 c c
1
Well
(fig
. 3)
MW-1
MW-2
MW-3
AMW
-3B
MW-4
A
MW-4
BMW-5
MW-6
MW-7
MW-7
-D1
MW-8A
MW-8
BMW-9
MW-1
0S-12
Date
( mon
th -
day -year)
09-1
3-88
09-1
H-88
09--1 1
»-88
09-1
H-88
09-1
5-88
09-1
5-88
09-1
5-88
09-1
5-88
09-1
6-88
09-1
6-88
09-1
5-88
09-1
5-88
09-1
3-88
09-1
H-88
09-12-51
Fluo-
ride
,dis
solved
(mg/L
as F
)
0.3 .2 .2 .3 .2 .3 .2 .3 .3 .3 .3 .3 .4 .4 .4
Sili
ca,
dis
solv
ed(mg/L
as Si02
)
12 24 21 29 18 17 16 14 21 21 18 18 34 16 4.4
Soli
ds,
Nitr
o-
sum
of
gen,
cons
ti-
nitr
ate
tuents,
dis-
dis-
solved
solved
(mg/L
(mg/
L)
as N
)
497
<0.0
1568
5.1
816
<.01
860
<.01
523
<.01
498
<.01
580
<.01
535
<.01
538
<.01
538
<.01
579
<.01
752
.37
602
<.01
604
<.01
864
2.0
Nitr
o
gen,
ammo
nia
dis
solved
(mg/L
as N
)
0.52
< .01
1.5
1.2 .50
.43
.58
.37
.23
.21
.57
.03
1.4 .37
Phos
phorus ,
dis
solved
(mg/
Las
P)
2.5 .30
2.2
1.9
1.5
1.7
1.6 .98
1.3
1.5 .80
.73
1.4
1.8
Arsenic, Ba
rium
, Ca
dmiu
m,dis
solved
(pg/
Las
As
)
14 1 7 10 5 4 7 14 6 5 7 2 3 8
dis
solved
(pg/
Las
Ba)
470
340
540
590
270
260
740
280
360
330
480
400
270
240
dis
solv
ed(p
g/L
as C
d)
<, <1 1 1 <1 <1 <1 <1 <1 <-I <! <11
<1
Kansas d
rink
ing-
wate
r standards^
Primary
Secondary
Federal
primary
drin
king
-wat
er
1.8 1.4
10500
10
50 50
1,000
1,000
10 10st
anda
rds
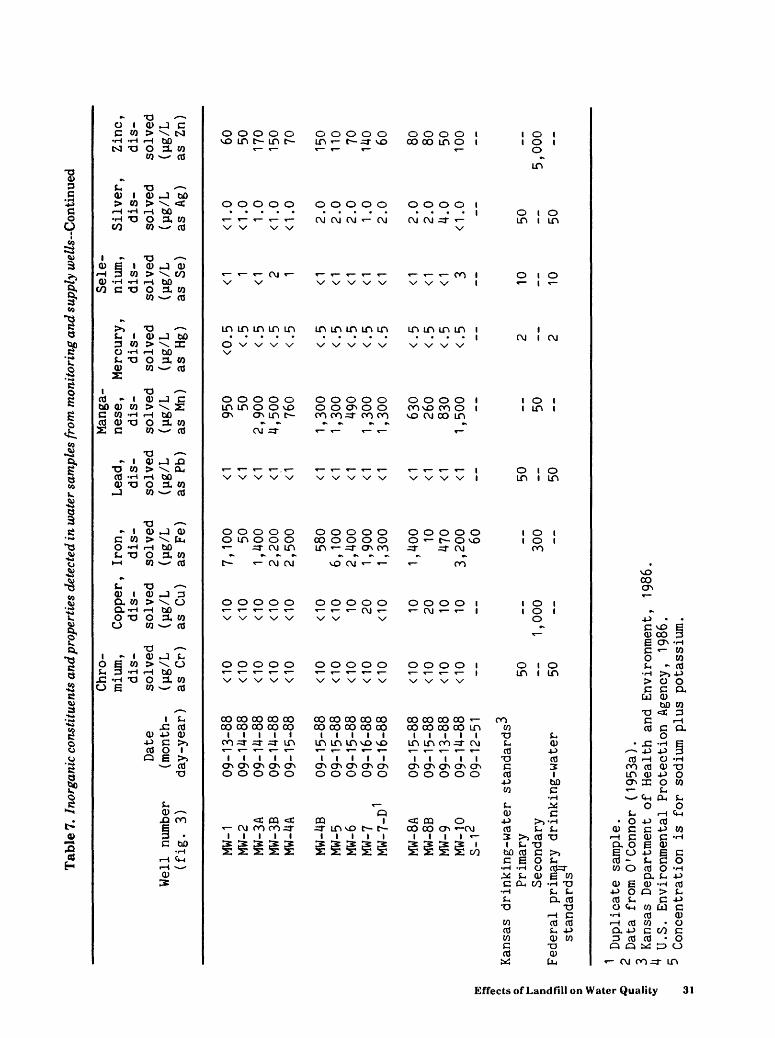
Tab
le 7
. In
orga
nic
cons
titu
ents
and
pro
pert
ies
dete
cted
in w
ater
sam
ples
from
mon
itor
ing
and
supp
ly w
ells
-Con
tinu
ed
V n 1 ,© c K
Date
Well
number
(month-
(fig
. 3)
day -y
ear)
MW-1
09-1
3-88
MW-2
09-14-88
MW-3
A 09
-14-
88MW
-3B
09-1
4-88
MW-4A
09-15-88
MW-4B
09-1
5-88
MW-5
09-1
5-88
MW-6
09-1
5-88
MW-7
09-16-88
MW-7-D
1 09
-16-
88
MW-8
A 09-15-88
MW-8
B 09
-15-
88MW-9
09-1
3-88
MW-1
0 09
-14-
88S-
12
09-1
2-51
Chro
mium
, Copper,
dis-
dis
solv
ed
solv
ed(p
g/L
(pg/
Las Cr)
as Cu)
<10
<10
<10
<10
<10
<10
<10
<10
<10
<10
<10
<10
<10
<10
<10
10<10
20<1
0 <1
0
<10
10<1
0 20
<10
10<1
0 10
Iron
,dis
solv
ed(p
g/L
as Fe)
7,100 50
1,400
2,200
2,50
0
580
6,100
2,400
1,900
1,30
0
1,40
0 1047
03,
200 60
Mang
a-Lead,
nese
, Merc
ury,
dis-
dis-
dis
solved
solved
solved
(pg/L
(pg/
L (pg/L
as P
b)
as Mn)
as Hg
)
<1
950
<0.5
<1
50
<.5
<1
2,900
<.5
<1
4,500
<.5
<1
760
<.5
<1
1,300
<.5
<1
1,300
<.5
<1
490
<.5
<1
1,300
<.5
<1
1,300
<.5
<1
630
<.5
<1
260
<.5
<1
830
<.5
<1
1,50
0 <.
5
Sele
nium,
dis
solv
ed(pg/L
as Se
)
<,1
<1 2 1
<1 <1 <1 < 1
<1 <1 <1 < 1 3
Silv
er,
dis
solv
ed(pg/L
as Ag
)
<1.0
<1 .0
1.0
<1 .0
<1.0 2.0
2.0
2.0
1.0
2.0
2.0
2.0
4.0
< 1 .0
Zinc
,dis
solved
(pg/
Las Zn
)
60 50 170
150 70 150
110 70 140 60 80 80 50 100
Kansas drinki
ng-water st
anda
rds^
Prim
ary
Seco
ndar
yFederal
prim
ary
drinking-water
1 2 3 4 5
stan
dard
s
Dupl
icat
e sa
mple.
Data from 0
' Connor (1953a).
Kansas De
partment of H
ealth
and
501,
000
50
Envi
ronm
ent,
19
86
300
.
50
250
50
2
10 10
50 50
5,000
U.S. En
viro
nmental
Prot
ecti
on Agency,
1986
.Co
ncen
trat
ion
is fo
r sodium p
lus
potassium.
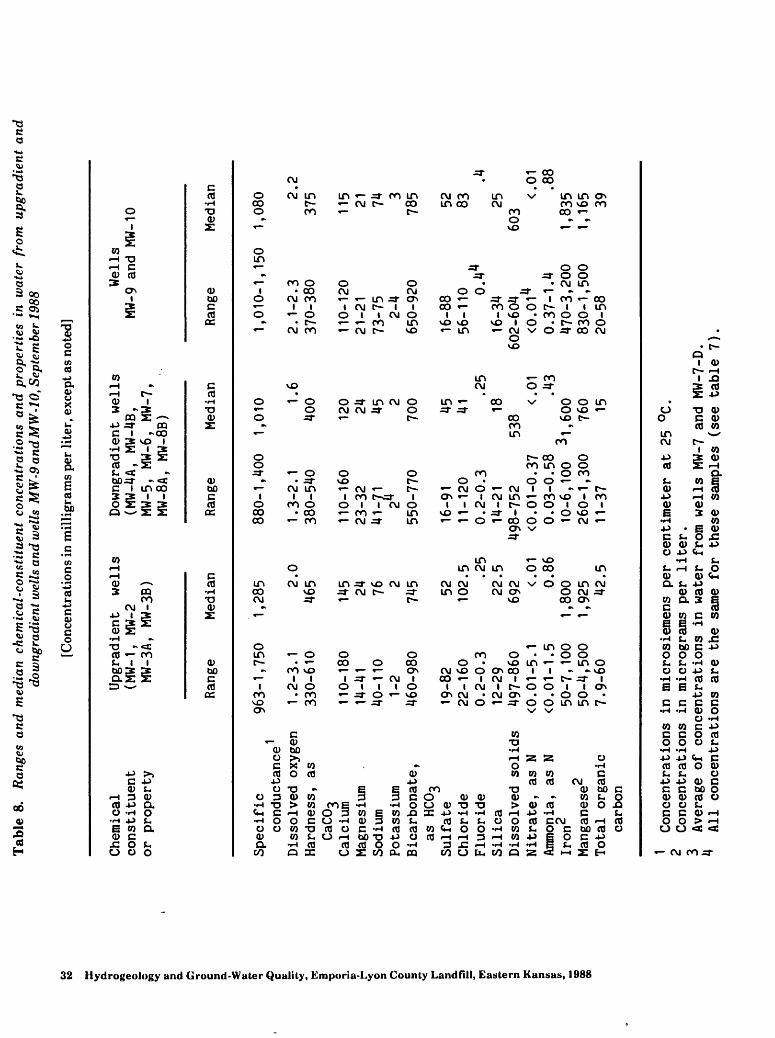
Tab
le 8
. R
ange
s a
nd
med
ian
chem
ical
-con
stit
uent
con
cent
rati
ons
an
d p
rope
rtie
s in
wat
er f
rom
upg
radi
ent
and
dow
ngra
dien
t w
ells
and
wel
ls M
W-9
and
MW
-10,
Sep
tem
ber
1988
[ Con
cent
ratio
ns in
mil
ligr
ams
per
lite
r, e
xcep
t as
note
d]
s V! a V! B a
ft O.
35 69 R 3 D 69 a w 69 to 00 00
Chemical
cons
titu
ent
or p
roperty
Spec
ific
cond
ucta
nce
Diss
olve
d ox
ygen
Hardness,
asCa
COg
Calc
ium
Magnesium
Sodi
umPotassium
Bicarbonate,
as HC03
Sulf
ate
Chlo
ride
Fluo
r id
eSi
lica
Diss
olve
d solids
Nitr
ate,
as
NAmmonia, as
NIron
2Manganese2
Tota
l or
gani
cca
rbon
^ Co
ncen
trat
ions
2 Co
ncen
trat
ions
3 Av
prac
rp of nonr
Upgr
adie
nt
wells
(MW-1, MW-2
MW-3A, MW
-3B)
Range
Medi
an
963-1,750
1,28
5
1.2-3.1
2.0
330-
610
465
110-
180
145
14-41
2440
-110
76
1-2
246
0-98
0 745
19-82
5222
-160
102.5
0.2-
0.3
.25
12-29
22.5
497-
860
692
<0. 01-5.1
<.01
<0.0
1-1.
5 0.86
50-7,100
1,800
50-4,500
1,925
7.9-60
42.5
in m
icro
siem
ens
per
Down
grad
ient
wells
(MW-
4A,
MW-4
B,MW-5,
MW-6,
MW-7,
MW-8A, MW-8B)
Rang
e Me
dian
880-1,400
1,010
1.3-
2.1
1.6
380-540
400
110-160
120
23-32
2441-71
4524
2
550-770
700
16-91
4511
-120
41
0.2-
0.3
.25
14-21
1849
8-75
2 538
<0. 01
-0. 37
<.01
0.03-0.58
.43
10-6
,100
31,600
260-1,300
760
11-37
15
centimeter a
t 25
°C.
Wells
MW-9 a
nd
Rang
e
1,01
0-1,
150
2.1-2.3
370-380
110-
120
21-21
73-7
52-4
650-920
16-88
56-110 0.
4416
-34
602-
604
<0.0
v0.37-1.4
470-3,200
830-
1,50
020-58
MW-1
0
Medi
an
1,080 2.
237
5
115 21 74 3
785 52 83
.425
603
<.01 .88
1,83
51,
165 39
in m
icro
gram
s per
lite
r. »
pnh rah inns in
uiahpr fVnm UIA! 1
<c MU-7 an
ri MW-7-D
All
conc
entr
atio
ns a
re t
he s
ame
for
these
samp
les
(see t
able 7
).
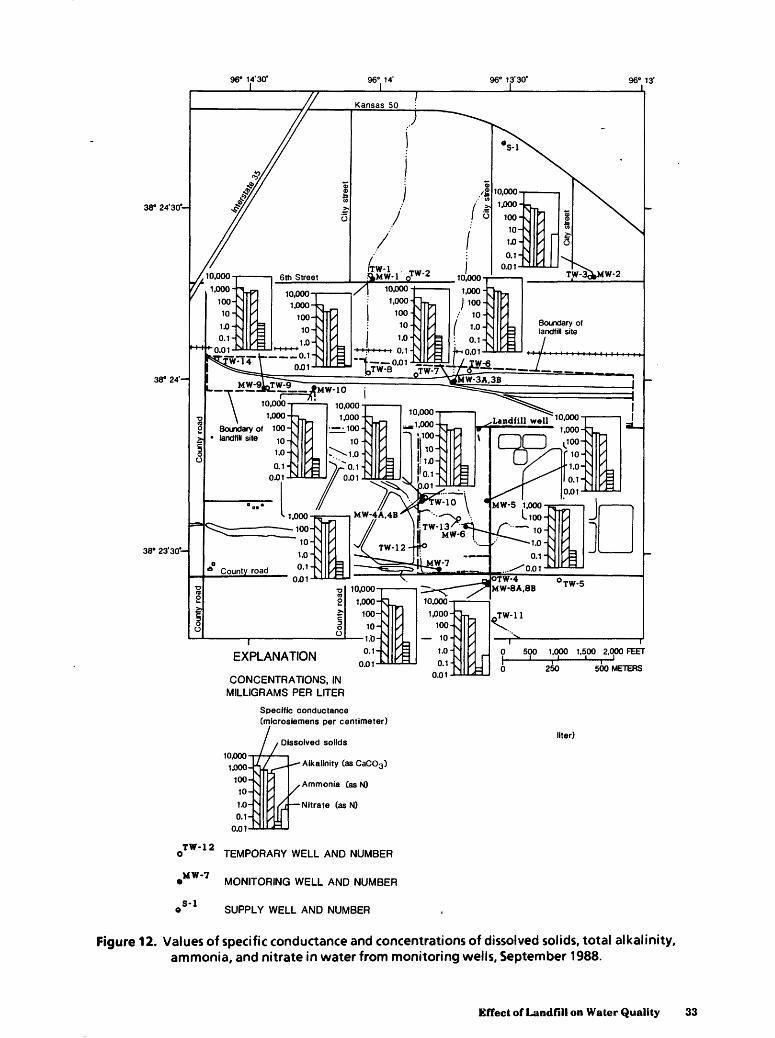
96" 14'30' 96" 13'
36' 24'30
38" 24'
38° 23'30
10,000
1.000-K_
Bcxrdary of 100- 10-
TW-12
MW-7
S-l
EXPLANATION
CONCENTRATIONS, IN MILLIGRAMS PER LITER
Specific conductance Cmlcrostemens per centimeter)
Dissolved solids
Alkalinity (as CaCO3)
Ammonia (as N)
Nitrate (as N)
TEMPORARY WELL AND NUMBER
MONITORING WELL AND NUMBER
SUPPLY WELL AND NUMBER
250 500 METERS
liter)
Figure 12. Values of specific conductance and concentrations of dissolved solids, total alkalinity, ammonia, and nitrate in water from monitoring wells, September 1988.
Effect of Landfill on Water Quality 33
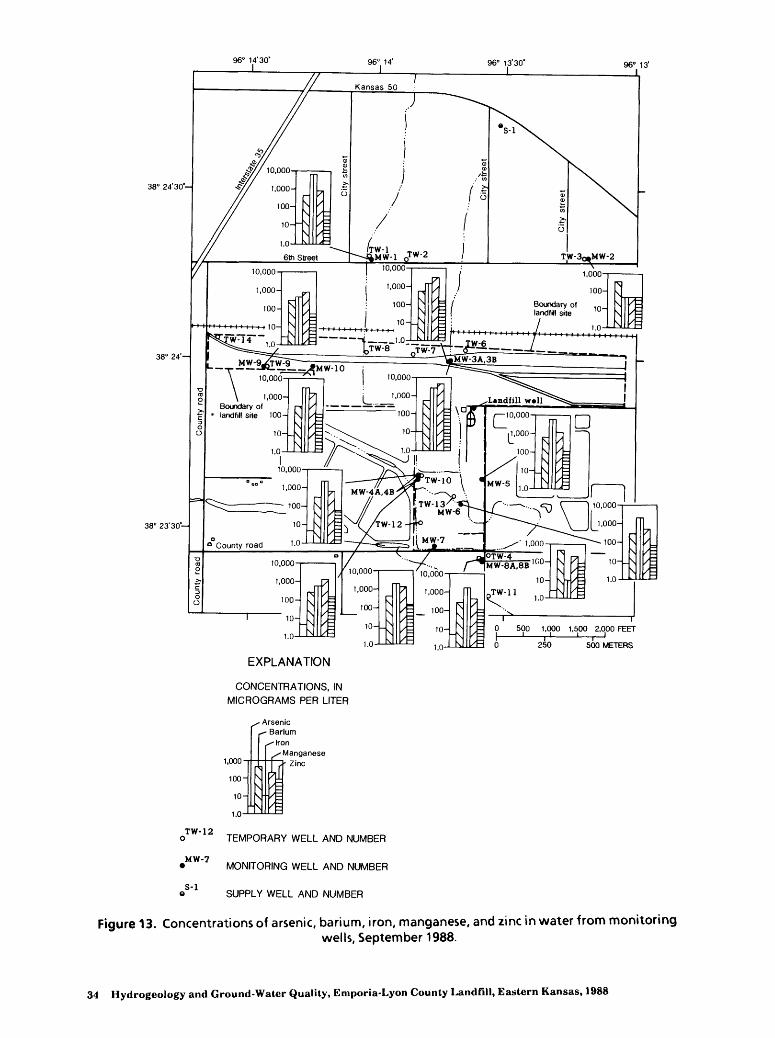
^ I r i ii i t i | i i | y i | | | __i.o-L-^lil/T-i _ . _ /w-8 --sr.--^-^ L_
250 500 METERS
EXPLANATION
CONCENTRATIONS, IN MICROGRAMS PER LITER
Arsenic .- Barium ^hon
Manganese Zinc1,000
100
,000- +-f
- S H
TW-12
MW-7
S-l
1.0-
TEMPORARY WELL AND NUMBER
MONITORING WELL AND NUMBER
SUPPLY WELL AND NUMBER
Figure 13. Concentrations of arsenic, barium, iron, manganese, and zinc in water from monitoringwells, September 1988.
34 Hydrogeolugy and Ground-Water Quality, Emporia-Lyon County Landfill, Eastern Kansas, 1988
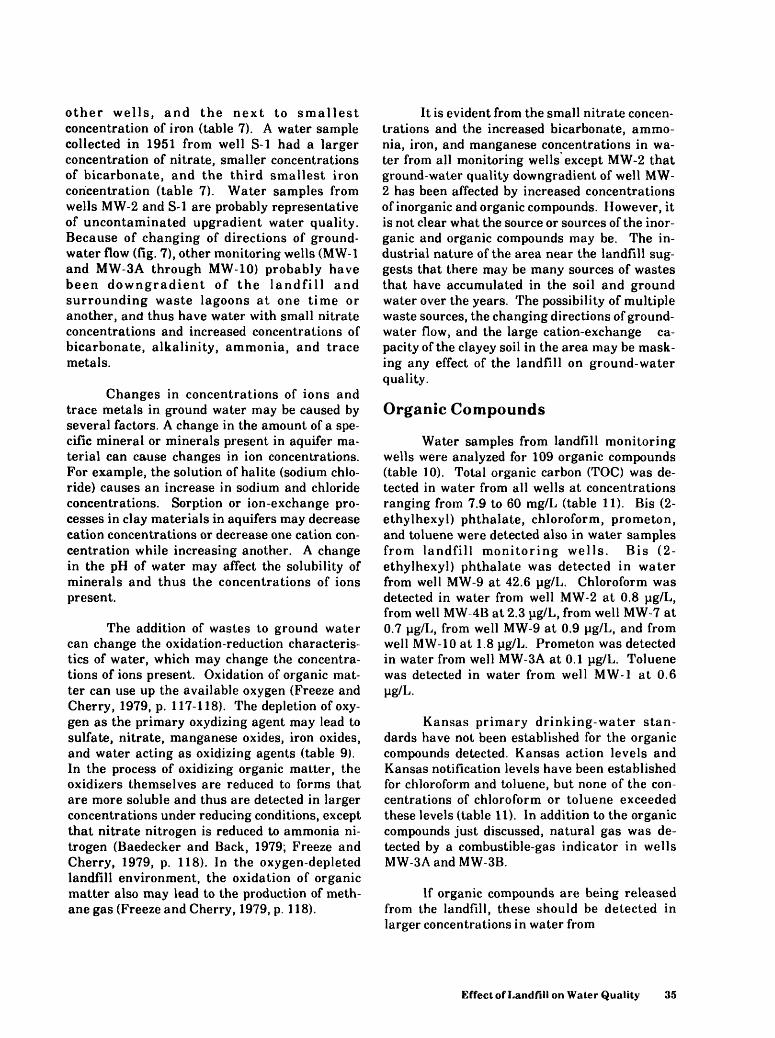
other wells, and the next to smallest concentration of iron (table 7). A water sample collected in 1951 from well S-l had a larger concentration of nitrate, smaller concentrations of bicarbonate, and the third smallest iron concentration (table 7). Water samples from wells MW-2 and S-l are probably representative of uncontaminated upgradient water quality. Because of changing of directions of ground- water flow (fig. 7), other monitoring wells (MW-1 and MW-3A through MW-10) probably have been downgradient of the landfill and surrounding waste lagoons at one time or another, and thus have water with small nitrate concentrations and increased concentrations of bicarbonate, alkalinity, ammonia, and trace metals.
Changes in concentrations of ions and trace metals in ground water may be caused by several factors. A change in the amount of a spe cific mineral or minerals present in aquifer ma terial can cause changes in ion concentrations. For example, the solution of halite (sodium chlo ride) causes an increase in sodium and chloride concentrations. Sorption or ion-exchange pro cesses in clay materials in aquifers may decrease cation concentrations or decrease one cation con centration while increasing another. A change in the pH of water may affect the solubility of minerals and thus the concentrations of ions present.
The addition of wastes to ground water can change the oxidation-reduction characteris tics of water, which may change the concentra tions of ions present. Oxidation of organic mat ter can use up the available oxygen (Freeze and Cherry, 1979, p. 117-118). The depletion of oxy gen as the primary oxydizing agent may lead to sulfate, nitrate, manganese oxides, iron oxides, and water acting as oxidizing agents (table 9). In the process of oxidizing organic matter, the oxidizers themselves are reduced to forms that are more soluble and thus are detected in larger concentrations under reducing conditions, except that nitrate nitrogen is reduced to ammonia ni trogen (Baedecker and Back, 1979; Freeze and Cherry, 1979, p. 118). In the oxygen-depleted landfill environment, the oxidation of organic matter also may lead to the production of meth ane gas (Freeze and Cherry, 1979, p. 118).
It is evident from the small nitrate concen trations and the increased bicarbonate, ammo nia, iron, and manganese concentrations in wa ter from all monitoring wells except MW-2 that ground-water quality downgradient of well MW- 2 has been affected by increased concentrations of inorganic and organic compounds. However, it is not clear what the source or sources of the inor ganic and organic compounds may be. The in dustrial nature of the area near the landfill sug gests that there may be many sources of wastes that have accumulated in the soil and ground water over the years. The possibility of multiple waste sources, the changing directions of ground- water flow, and the large cation-exchange ca pacity of the clayey soil in the area may be mask ing any effect of the landfill on ground-water quality.
Organic Compounds
Water samples from landfill monitoring wells were analyzed for 109 organic compounds (table 10). Total organic carbon (TOC) was de tected in water from all wells at concentrations ranging from 7.9 to 60 mg/L (table 11). Bis (2- ethylhexyl) phthalate, chloroform, prometon, and toluene were detected also in water samples from landfill monitoring wells. Bis (2- ethylhexyl) phthalate was detected in water from well MW-9 at 42.6 pg/L. Chloroform was detected in water from well MW-2 at 0.8 ug/L, from well MW-4B at 2.3 ug/L, from well MW-7 at 0.7 ug/L, from well MW-9 at 0.9 ug/L, and from well MW-10 at 1.8 pg/L. Prometon was detected in water from well MW-3A at 0.1 ug/L. Toluene was detected in water from well MW-1 at 0.6 ug/L.
Kansas primary drinking-water stan dards have not been established for the organic compounds detected. Kansas action levels and Kansas notification levels have been established for chloroform and toluene, but none of the con centrations of chloroform or toluene exceeded these levels (table 11). In addition to the organic compounds just discussed, natural gas was de tected by a combustible-gas indicator in wells MW-3A and MW-3B.
If organic compounds are being released from the landfill, these should be detected in larger concentrations in water from
Effect of Landfill on Water Quality 35
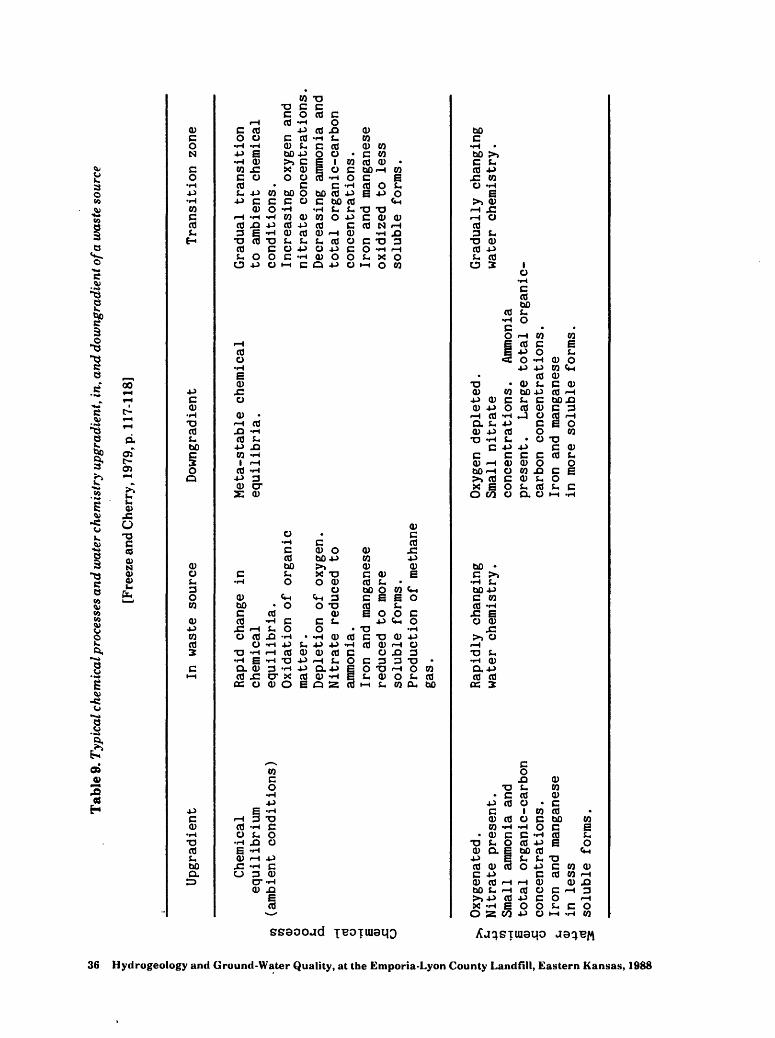
S
v; a
» W
» C_
C
TO v; PS a
Tab
le 9
. Typ
ical
che
mic
al p
roce
sses
and
wat
er c
hem
istr
y up
grad
ient
, in,
and
dow
ngra
dien
t of a
was
te s
ourc
e
[Fre
eze
and
Che
rry,
197
9, p
. 117
-118
]
Upgr
adie
ntIn
waste
sour
ceDo
wngr
adie
ntTransition z
one
.63 I JD C tt A K
3 c o O
3 n o I r
» a
o H E
0) £ o
Chemical
equi
libr
ium
(amb
ient
co
ndit
ions
)
Rapi
d change in
chemical
equi
libr
ia.
Oxidation
of o
rgan
icma
tter
.De
plet
ion
of o
xygen.
Nitr
ate
redu
ced
toam
moni
a.Iron and
mang
anes
ere
duce
d to
more
soluble
forms.
Prod
ucti
on of
met
hane
gas.
Meta-stable
chem
ical
eq
uili
bria
.Gr
adua
l tr
ansi
tion
to
ambient chemical
conditions.
Increasing o
xyge
n and
nitr
ate
concentrations
Decr
easi
ng a
mmonia a
nd
tota
l organic-carbon
concentrations.
Iron
and m
anga
nese
oxidized to less
soluble
form
s.
w H 0)
JC o su 0) -p s
Oxyg
enat
ed.
Nitrate
pres
ent.
Sm
all
ammo
nia
and
tota
l or
gani
c-ca
rbon
co
ncen
trat
ions
. Iron and
manganese
in less
soluble
form
s.
Rapi
dly
changing
water
chem
istr
y.Ox
ygen
depleted.
Smal
l ni
trat
e co
ncen
trat
ions
. Ammonia
present.
Large
tota
l organic-
carb
on co
ncen
trat
ions.
Iron
and m
anga
nese
in m
ore
solu
ble
form
s.
Gradually
changing
water
chem
istr
y.
i
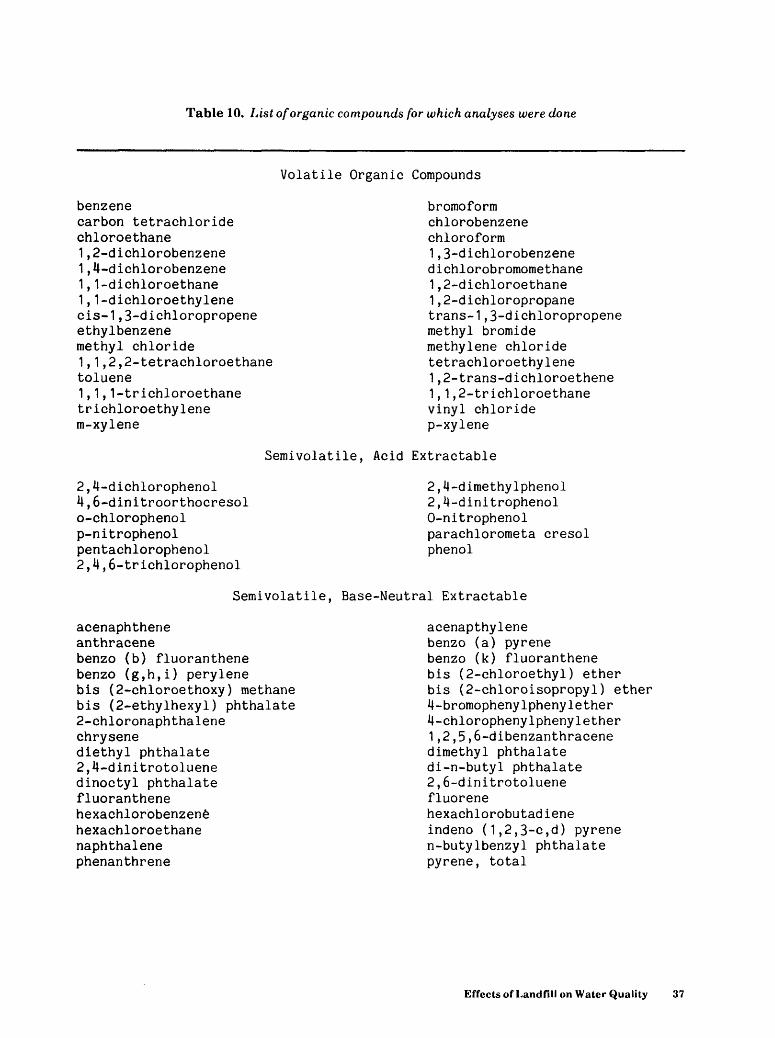
Table 10. List of organic compounds for which analyses were done
Volatile Organic Compounds
benzenecarbon tetrachloridechloroethane1,2-dichlorobenzene1,4-dichlorobenzene1,1-dichloroethane1,1-dichloroethylenecis-1,3-dichloropropeneethylbenzenemethyl chloride1,1,2,2-tetrachloroethanetoluene1,1,1-trichloroethanetrichloroethylenem-xylene
bromoformchlorobenzenechloroform1,3-dichlorobenzenedichlorobromomethane1,2-dichloroethane1,2-dichloropropanetrans-1,3-dichloropropenemethyl bromidemethylene chloridetetrachloroethylene1,2-trans-dichloroethene1,1,2-trichloroethanevinyl chloridep-xylene
Semivolatile, Acid Extractable
2,4-dichlorophenol4,6-dinitroorthocresolo-chlorophenolp-nitrophenolpentachlorophenol2,4,6-trichlorophenol
2,4-dimethylphenol 2,4-dinitrophenol 0-nitrophenol parachlorometa cresol phenol
Semivolatile, Base-Neutral Extractable
acenaphtheneanthracenebenzo (b) fluoranthenebenzo (g,h,i) perylenebis (2-cnloroethoxy) methanebis (2-ethylhexyl) phthalate2-chloronaphthalenechrysenediethyl phthalate2,4-dinitrotoluenedinoctyl phthalatefluoranthenehexachlorobenzenehexachloroethanenaphthalenephenanthrene
acenapthylene benzo (a) pyrene benzo (k) fluoranthene bis (2-chloroethyl) ether bis (2-chloroisopropyl) ether 4-bromophenylphenylether 4-chlorophenylphenylether 1,2,5,6-dibenzanthracene dimethyl phthalate di-n-butyl phthalate 2,6-dinitrotoluene fluorenehexachlorobutadiene indeno (1,2,3-c,d) pyrene n-butylbenzyl phthalate pyrene, total
Effects of Landfill on Water Quality 37
Table 10. List of organic compounds for which analyses were done-Continued
Pesticides and Polychlorinated Biphenyls (PCB's)
alachloralpha BHC (benzene hexachloride)aroclor 1016aroclor 1232aroclor 1248aroclor 1260beta BHCcyanazinedieldrinendosulfan IIendrinheptachlormetolachlorp,p' ODDp,p' DOTprometrynsimazinetoxaphene
aldrinametrynaroclor 1221aroclor 1242aroclor 1254atrazinechlordanedelta BHCendosulfane sulfateendosulphan Igamma BHCheptachlor epoxidemetribuzinp,p' DDEprometonpropazinesimetryntrifluralin
downgradient wells as compared to upgradient wells. Bis (2-ethylhexyl) phthalate was detected in water from well MW-9. Bis (2-ethylhexyl) phthalate is a liquid used in vacuum pumps. Chloroform was detected in water from upgradient well MW-2, downgradient wells MW- 4B, and MW-7, and in water from wells MW-9 and MW-10. Chloroform is used as a refrigerant, an aerosol propellant, in the synthesis of fluorinated resins, as a solvent, in fire extinguishers, and as a pesticide (National Research Council, 1977, p. 713). The U.S. Environmental Protection Agency has found chloroform to be present in 95 to 100 percent of finished chlorinated drinking water, the mean concentration being 20 ug/L (National Research Council, 1977, p. 713). Prometon was detected in water from upgradient well MW-3A. Prometon is a triazine herbicide used to control weeds. Toluene was detected in water from upgradient well MW-1. Toluene is used in the production of benzene derivatives, saccharin, perfumes, dyes, medicines, solvents, TNT, and detergent, and is used as a gasoline component (National Research Council, 1977, p. 770). Toluene has been reported in finished drinking-water supplies at concentrations of 11 ug/L (National Research
Council, 1977, p. 770). Natural gas, primarily methane, is a byproduct in the decomposition of organic wastes in a reducing environment (Freeze and Cherry, 1979).
There are several possible sources for the organic compounds detected in water from moni toring wells. Chloroform and toluene are con tained in a number of products for residential and commercial use and may originate from the landfill. Alternatively, industrial and urban areas of Emporia could be the source of these compounds. Both compounds have been detected in finished drinking water and could have been present in the finished drinking water used dur ing well construction. Prometon may have origi nated from application of this herbicide in the vi cinity of the landfill. The source of bis (2- ethlyhexyl) phthalate is uncertain; it could have come from buried wastes or field or laboratory contamination of the sample. Future analyses of water from well MW-9 would indicate if the sour ce of this compound is in situ or is from post- sampling contamination.
Total organic carbon (TOO was detected in water from all monitoring wells (table 11).
38 Hydrogeology and Ground-Water Quality, Emporia-Lyon County Landfill, Eastern Kansas, 1988
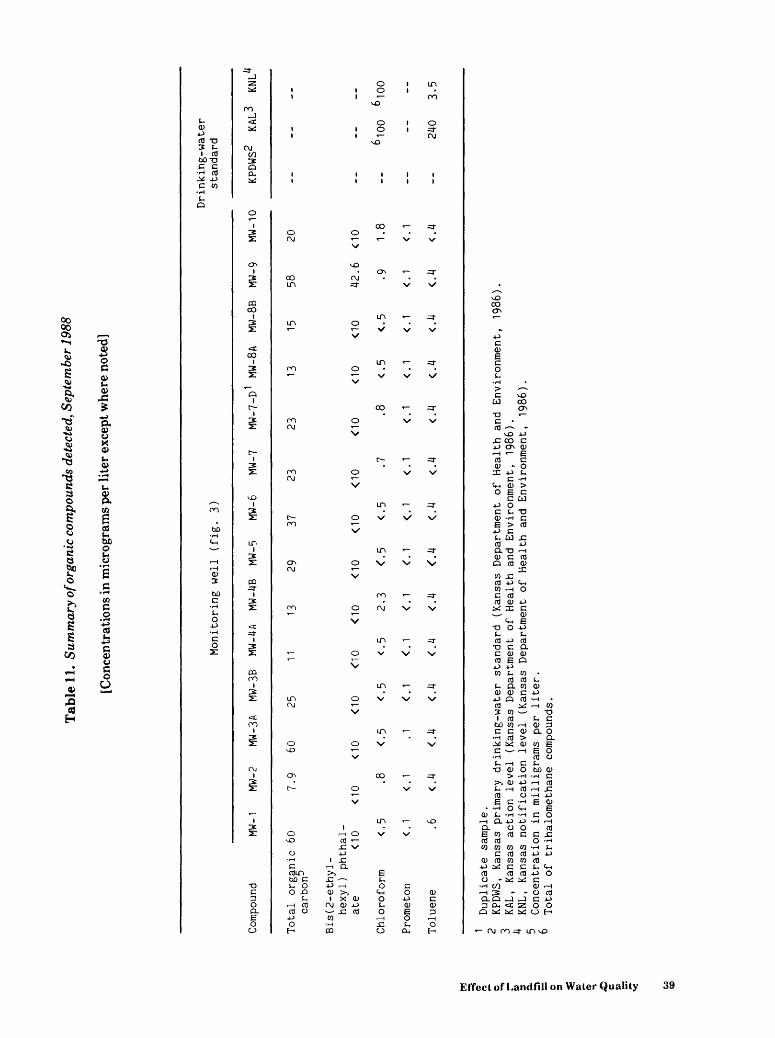
Tab
le 1
1. S
umm
ary
of o
rgan
ic c
ompo
unds
det
ecte
d, S
epte
mbe
r 19
88
[Con
cent
rati
ons
in m
icro
gram
s pe
r li
ter
exce
pt w
here
not
ed]
Monitoring well (fig.
3)Drinking-water
standard
Comp
ound
MW-1
MW
-2
MW-3A
MW-3
B MW
-4A
MW-4
B MW
-5
MW-6
MW-7
MW-7-D
1 MW-8
A MW
-8B
MW-9
MW
-10
KPDW
S2
KAL3
KNL^
Tota
l or
ganic
60
7.9
60
25
11
13
29
37
23
23
13
15
58
20
carbon-*
Bis(2-ethyl-
hexyl) phthal-
ate
<10
<10
<10
<10
<10
<10
<10
<10
<10
<10
<10
<10
42.6
<10
Chloroform
<.5
.8
Prometon
< . 1
<
. 1
Tolu
ene
.6
<.4
2.3
610
0 610
0
3.5
andfi s * »_ K JD
c »
Duplicate
samp
le.
KPDWS, Ka
nsas
primary
drinking-water
standard (Kansas
Department of H
ealth
and
Environmen
t, 19
86).
3
KAL, Ka
nsas ac
tion
level
(Kan
sas
Department of Health and
Environment, 19
86).
KNL, Kans
as no
tifi
cati
on level
(Kansas
Department of
Health and
Environment, 19
86).
~
Conc
entration
in milligrams per
lite
r.
° To
tal
of tr
ihal
omet
hane
co
mpou
nds.
TOG is a measure of the amount of organic car bon that is dissolved and suspended in water and can be an indicator of the presence of organic compounds in water. The largest TOC concentra tions were detected in water from wells MW-1, MW-3A, and MW-9, in which toluene, prometon, and bis (2-ethlyhexyl) phthalate were detected, respectively. TOC concentrations in water from other wells indicate the presence of unidentified organic compounds.
Organic compounds were detected in monitoring-well water samples in the vicinity of the landfill. Organic compounds in wells MW-1, MW-3A, and MW-9 may have originated from a source north, northwest, or northeast of the land fill, or from the landfill, or from adjacent waste lagoons. Movement of contaminants from the landfill or waste lagoons could be caused by pum- page from nearby supply wells or by high river stages changing the direction of ground-water flow. Natural gas, detected in wells MW-3A and MW-3B, probably migrated laterally through the unsaturated zone to the wells from nearby buried trash.
SUMMARY AND CONCLUSIONS
A cooperative study of the ground-water quality in the vicinity of the Emporia-Lyon County Landfill near Emporia, Kansas, was un dertaken during April 1988 to April 1989. Four teen temporary wells were installed to determine the direction of ground-water movement, then 13 monitoring wells were installed in positions up- gradient, in, and downgradient of the landfill.
Chemical analyses of water samples from monitoring wells indicate the presence of organic compounds in upgradient and downgradient wells. The distribution of organic and inorganic compounds indicates that these compounds may originate from sources other than the landfill. Variations in the direction of ground-water flow may have caused upgradient wells, except MW-2, to be contaminated by landfill or lagoon wastes. None of the concentrations of inorganic constitu ents detected in water from landfill-monitoring wells exceeded Kansas or Federal primary drinking-water standards. However, Kansas secondary drinking-water standards were equaled or exceeded for dissolved solids in water from all monitoring wells except MW-1 and MW- 4A; for total hardness in water from wells MW-
2, MW-3A, MW-3B, MW-4A, MW-6, and MW-8B; for iron in water from all monitoring wells except MW-2 and MW-8B; and for manganese in water from all monitoring wells. Kansas primary drinking-water standards have not been estab lished for the organic compounds detected. Kan sas action levels and Kansas notification levels have been established for chloroform and tolu ene, but none of the concentrations of chloroform or toluene exceeded the levels established for these compounds.
To further define the sources of ground- water contaminants near the landfill, additional wells would need to be installed north of the landfill, water levels and samples taken from waste lagoons and waste-lagoon monitoring wells, and pumpage rates established for nearby wells. In addition, yearly analyses of inorganic and volatile organic constituents would provide long-term information on the effect of the landfill on water quality. Quarterly water-level mea surements and short-term continuous water- level measurements would provide a better un derstanding of seasonal fluctuations in ground- water levels and direction of water movement.
REFERENCES CITED
Apgar, M.A., and Langmuir, Donald, 1971,Groundwater pollution potential of a land fill above the water table: Ground Water, v. 9, no. 6, p. 76-93.
Baedecker, M.J., and Back, William, 1979,Hydrogeological processes and chemical reactions at a landfill: Ground Water, v. 17, no. 5, p. 429-437.
Cameron, R.D., 1978, The effects of solid wastelandfill leachate on receiving waters: Journal of the American Water Works As sociation , v. 70, no. 3, p. 173-176.
Degner, D.A., 1974, A chemical investigation of the effect of a flood plain waste disposal site on ground-water quality: Lawrence, University of Kansas, unpublished PhD dissertation, 364 p.
Fader, S.W., 1974, Ground water in the Kansas River valley, Junction City to Kansas City, Kansas: Kansas Geological Survey Bulletin 206, part 2,12 p.
40 Hydrogeology and Ground-Water Quality, Emporia-Lyon County Landfill, Eastern Kansas, 1988
Fishman, M.J., and Friedman, L.C., eds., 1989,Methods for determination of inorganic substances in water and fluvial sediments: U.S. Geological Survey Techniques of Water-Resources Investigations, Book 5, Chapter Al, 545 p.
Ford, P.J., Turina, P.J., and Seely, D.E., 1983,Characterization of hazardous waste sites A methods manual, Volume II, Available sampling methods: U.S. Envi ronmental Protection Agency, Report 600, unnumbered pages.
Freeze, R.A., and Cherry, J.A., 1979,Groundwater: Englewood Cliffs, New Jersey, Prentice-Hall, Inc., 604 p.
Gaudy, A.F., Jr., and Gaudy, E.T., 1980,Microbiology for environmental scientists and engineers: New York, McGraw-Hill Book Co., 736 p.
Haworth, Erasmus, 1913, Special report on well waters in Kansas: Kansas Geological Sur vey Bulletin 1, 110 p.
Jewett, J.M., 1951, Geologic structures inKansas: Kansas Geological Survey Bulle tin 90, part 6, p. 105-172.
Kansas Department of Health and Environment, 1986, Explanation of your drinking water analysis: Topeka, Kansas., October 28, 1986, pamphlet.
1988, Analytical methods and quality assurance guidelines for the inorganic chemistry laboratory: Topeka, Kansas, Kansas Department of Health and Envi ronment, unpublished methods manual, February 1, 1988.
Metzler, S.M., 1975, Sanitary landfillmanagement for ground-water quality protection: Lawrence, University of Kan sas, master's thesis, 158 p.
National Oceanic and AtmosphericAdministration, 1988, Climatological data, annual summary, Kansas: Ashe- ville, North Carolina, v. 102, no. 13, un numbered pages.
National Research Council, 1977, Drinkingwater and health: Washington, D.C., Na tional Academy of Sciences, 939 p.
Nguyen, V., and Pinder, G.F., 1984, Directcalculation of aquifer parameters in slug test analysis, in Rosenshein, J.S., and Bennett, G.A., eds., Groundwater hydrau lics: American Geophysical Union, Water Resources Monograph Series 9, p. 222- 239.
O'Connor, H.G., 1953a, Geology, mineralresources, and ground-water resources of Lyon County, Kansas-Ground-water re sources of Lyon County: Kansas Geologi cal Survey, v. 12, part 3, p. 35-59.
1953b, Geology, mineral resources, and ground-water resources of Lyon County, Kansas-Rock formations of Lyon County: Kansas Geological Survey, v. 12, part 1, p. 5-24.
O'Leary, Phil, and Tansel, Berrin, 1986, Landdisposal of solid wastes-Protecting health and environment: Waste Age, March 1986, p. 14-20.
Parker, H.N., 1911, Quality of the water supplies of Kansas: U.S. Geological Survey Water- Supply Paper 273, 375 p.
Salvato, J.A., Wilkie, W.G., and Mead, B.E.,1971, Sanitary landfill leaching preven tion and control: Journal of the Water Pol lution Control Federation, v. 43, no. 10, p. 2084-2100.
Schoewe, W.H., 1949, The geography of Kansas, part II-Physical geography: Transactions of the Kansas Academy of Science, v. 52, no. 3, p. 280-289.
Smith, A.J., 1903, Geology of Lyon County,Kansas: Transactions of the Kansas Academy of Science, v. 18, p. 99-103.
Tchobanoglous, G., Theisen, H., and Eliassen, P., 1977, Solid wastes-engineering principles and management issues: New York, McGraw-Hill Book Co., 621 p.
References Cited 41
U.S. Environmental Protection Agency, 1982, Zeller, D.E., ed., 1968, The stratigraphicMethods for organic chemical analysis of succession in Kansas: Kansas Geological municipal and industrial waste water: Survey Bulletin 189, 81 p. EPA-600/4-82-057, unnumbered pages.
__1986, Maximum contaminant levels(subpart B of part 141, National primary drinking-water regulations): U.S. Code of Federal Regulations, Title 40, Parts 100 to 149, revised as of July 1,1986, p. 530-533.
42 Hydrogeology and Ground-Water Quality, Emporia-Lyon County Landfill, Eastern Kansas, 1988