Embed Size (px)
Citation preview

Kentucky Geological SurveyDonald C. Haney, State Geologist and Director
University of Kentucky, Lexington
Hydrogeology andGround-Water Monitoringof Coal-Ash Disposal Sitesin a Karst Terrane near Burnside,
South-Central Kentucky
Shelley Minns HutchesonLyle V.A. Sendlein
James S. DingerJames C. CurrensArsin M. Sahba
Report of Investigations 11 Series XI, 1997
ISSN 0075-5591

DISCLAIMER
The Kentucky Geological Survey provides online versions of its publications as a publicservice. Publications are provided as Adobe PDF (portable document format) files. Hard-copy versions are available for purchase by contacting the Survey at:
Kentucky Geological SurveyPublication Sales Office228 Mining and Mineral Resources BuildingUniversity of KentuckyLexington, Kentucky 40506-0107
Phone: 606-257-5500Fax: 606-257-1147
Selected KGS reports published before 1999 have been scanned and converted to PDFformat. Scanned documents may not retain the formatting of the original publication. Inaddition, color may have been added to some documents to clarify illustrations; in thesecases, the color does not appear in the original printed copy of the publication. Everyeffort has been made to ensure the integrity of the text. KGS maps and charts are suppliedeither whole or in part and some are too large to be printed on most plotters. Open-filereports are reproduced from the best available copy provided by the author, and have notundergone KGS technical or editorial review.
The Kentucky Geological Survey disclaims all warranties, representations, orendorsements, expressed or implied, with regard to the information accessed from, or via,this server or the Internet.

Kentucky Geological SurveyDonald C. Haney, State Geologist and Director
University of Kentucky, Lexington
Hydrogeology and Ground-WaterMonitoring of Coal-Ash Disposal Sites in a
Karst Terrane Near Burnside,South-Central Kentucky
Shelley Minns Hutcheson, Lyle V.A. Sendlein,James S. Dinger, James C. Currens, and Arsin M. Sahba
Report of Investigations 11, Series XI, 1997
ISSN 0075-5591
© 1997 by University of Kentucky,Kentucky Geological Survey

ii
UNIVERSITY OF KENTUCKYCharles T. Wethington Jr., PresidentFitzgerald Bramwell, Vice President for Research and
Graduate StudiesJack Supplee, Director, Administrative Affairs, Research
and Graduate Studies
KENTUCKY GEOLOGICAL SURVEYADVISORY BOARDW.A. Mossbarger, Chairman, LexingtonJacqueline Swigart, Vice-Chairman, LouisvilleWilliam W. Bowdy, Fort ThomasSteve Cawood, PinevilleLarry R. Finley, HendersonHugh B. Gabbard, RichmondKenneth Gibson, MadisonvilleRon D. Gilkerson, LexingtonPhil M. Miles, LexingtonHenry A. Spalding, HazardDavid A. Zegeer, LexingtonRalph N. Thomas, Emeritus Member, OwensboroGeorge H. Warren Jr., Emeritus Member, Owensboro
KENTUCKY GEOLOGICAL SURVEYDonald C. Haney, State Geologist and DirectorJohn D. Kiefer, Assistant State Geologist for
AdministrationJames C. Cobb, Assistant State Geologist for Research
ADMINISTRATIVE DIVISIONPersonnel and Finance Section:James L. Hamilton, Administrative Staff Officer IIJackie Perrelli, Administrative Staff Officer
Clerical Section:Jody L. Cruse, Staff Assistant VIIAnjanette Gifford, Staff Assistant VIJuanita G. Smith, Staff Assistant V, Henderson Office
Office of Communications and Technology Transfer:Carol L. Ruthven, ManagerMargaret Luther Smath, Geologic Editor IIITerry D. Hounshell, Chief Cartographic IllustratorMichael L. Murphy, Principal Drafting TechnicianGwenda K. Rulo, Principal Drafting TechnicianShirley D. Dawson, Staff Assistant V
Well Sample and Core Library:Patrick J. Gooding, ManagerRobert R. Daniel, Laboratory Technician B
Office of Geologic Information:Bart Davidson, ManagerRichard A. Smath, Geologist III, ESIC CoordinatorKevin J. Wente, Geologist IWilliam A. Briscoe III, Publication Sales SupervisorRoger S. Banks, Account Clerk VLuanne Davis, Staff Assistant IV
Theola L. Evans, Staff Assistant IV
Computer and Laboratory Services Section:Steven J. Cordiviola, HeadRichard E. Sergeant, Geologist VJoseph B. Dixon, Systems ProgrammerJames M. McElhone, Senior Systems Analyst ProgrammerHenry E. Francis, Associate ScientistKaren Cisler, Senior Research AnalystJanet M. Royer, Senior Research AnalystSteven R. Mock, Research AnalystAlice T. Schelling, Research AnalystMark F. Thompson, Research AnalystMary C. Koewler, Senior Laboratory TechnicianChristopher L. Parsons, Senior Laboratory Technician
GEOLOGICAL DIVISIONCoal and Minerals Section:Donald R. Chesnut Jr., HeadGarland R. Dever Jr., Geologist VIICortland F. Eble, Geologist VStephen F. Greb, Geologist VGerald A. Weisenfluh, Geologist VDavid A. Williams, Geologist V, Henderson OfficeCarlos M. Galcerán, Jr., Geologist IIWilliam M. Andrews Jr., Geologist IJeffrey A. Esterle, Geologist IErnest E. Thacker, Geologist I
Geologic Mapping and Hydrocarbon Resources Section:James A. Drahovzal, HeadWarren H. Anderson, Geologist VDavid C. Harris, Geologist VBrandon C. Nuttall, Geologist VLance G. Morris, Geologist IIThomas N. Sparks, Geologist IIVirginia Marie Sullivan, Geologist IAnna E. Watson, Geologist I
Water Resources Section:James S. Dinger, HeadDaniel I. Carey, Hydrologist VJames C. Currens, Hydrogeologist VDavid R. Wunsch, Hydrogeologist VPhilip G. Conrad, Hydrogeologist IIIR. Stephen Fisher, Hydrogeologist IIIAlex W. Fogle, Hydrologist IIIRobert M. Williams, Hydrogeologist IIIRobert E. Andrews, Hydrogeologist IIE. Glynn Beck, Geologist II, Henderson OfficeDennis H. Cumbie, Hydrogeologist IIC. Douglas R. Graham, Hydrogeologist IITimothy D. Montowski, Geological TechnicianGregory L. Secrist, Geological TechnicianD. Ian Thomas, Geological TechnicianSteven E. Webb, Geological Technician

CONTENTSPage
Abstract ........................................................................................................................................................................................ 1Introduction .................................................................................................................................................................................. 1Methods ........................................................................................................................................................................................ 2
Sinkhole and Spring Survey .................................................................................................................................................... 2Dye Tracing ............................................................................................................................................................................. 2Monitoring Wells ..................................................................................................................................................................... 3Water-Quality Sampling and Analysis ................................................................................................................................... 4
Ash Disposal ................................................................................................................................................................................ 4Site Hydrogeology ........................................................................................................................................................................ 4
Kidder Limestone .................................................................................................................................................................... 5Ste. Genevieve Limestone ....................................................................................................................................................... 5St. Louis Limestone ................................................................................................................................................................. 5Salem and Warsaw Formations ............................................................................................................................................... 6Background Spring and Well Data ......................................................................................................................................... 7
Flow System at the Closed-Out Ash Pond ................................................................................................................................... 7Dye Tracing ............................................................................................................................................................................. 7Water Levels in Wells .............................................................................................................................................................. 7Water Quality ........................................................................................................................................................................... 7
Flow System at the Active Ash Pond ........................................................................................................................................... 9Dye Tracing ............................................................................................................................................................................. 9Water Quality ........................................................................................................................................................................... 9
Flow System at the Coal Stockpile ............................................................................................................................................ 13Delineation of Boundaries ..................................................................................................................................................... 13Water Quality ......................................................................................................................................................................... 13
Conclusions ................................................................................................................................................................................ 13Flow Systems ......................................................................................................................................................................... 13Water Quality ......................................................................................................................................................................... 17
Closed-Out Ash-Pond Flow System ................................................................................................................................. 17Active Ash-Pond Flow System ......................................................................................................................................... 17Coal-Stockpile Flow System............................................................................................................................................. 17
Monitoring Strategy in Karst Systems .................................................................................................................................. 20Epilogue ...................................................................................................................................................................................... 20Acknowledgments ...................................................................................................................................................................... 20References Cited ......................................................................................................................................................................... 21
FIGURESPage
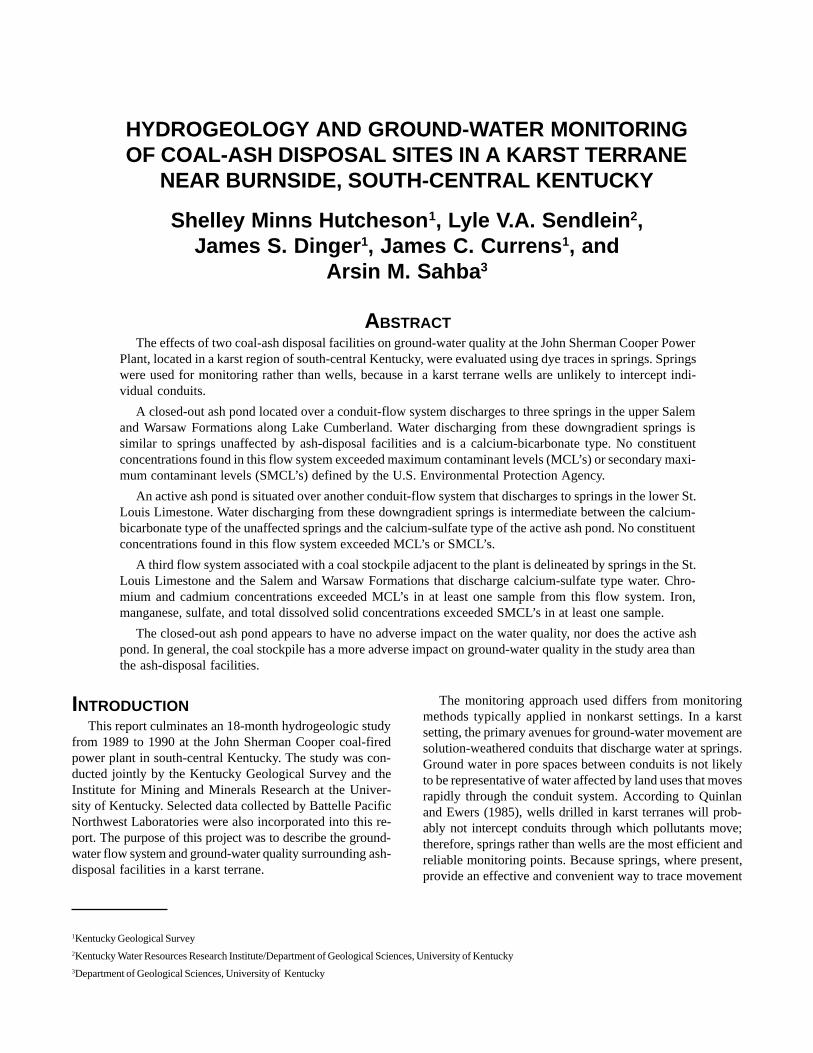
1. Map showing location of John Sherman Cooper Power Plant and ash-disposal facilities and relationship tophysiographic provinces ................................................................................................................................................ 2
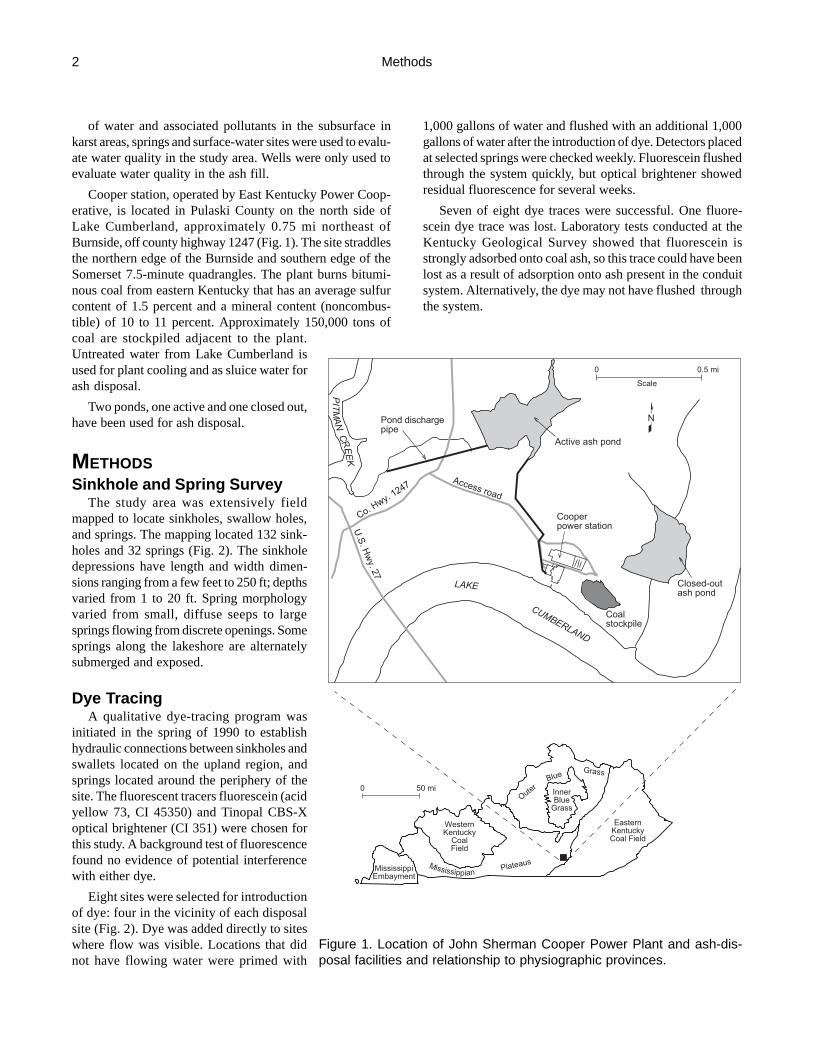
2. Map showing locations of sinkholes, springs, dye injection points, and wells ............................................................ 33. Geologic map of the study area and locations of cross sections A–A� (Fig. 4) and B–B� (Fig. 5) .............................. 44. Geologic cross section A–A� through the closed-out ash pond .................................................................................... 55. Geologic cross section B–B� through the active ash pond ............................................................................................ 66. Diagram showing stratigraphic relationship of springs to Salem and Warsaw Formations, and the proximity of
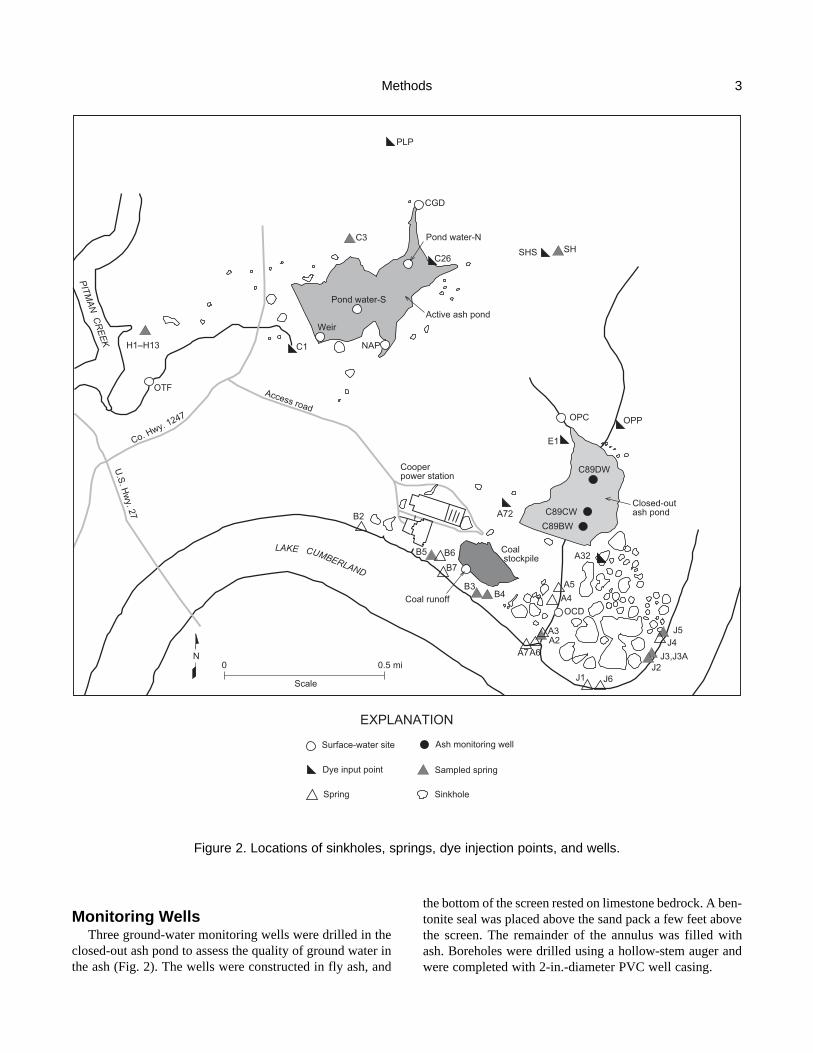
the springs to Lake Cumberland.................................................................................................................................... 67. Map showing locations of positive dye traces ............................................................................................................... 88. Diagram showing comparison of mean values for major ions at background sites and values for sites associated with
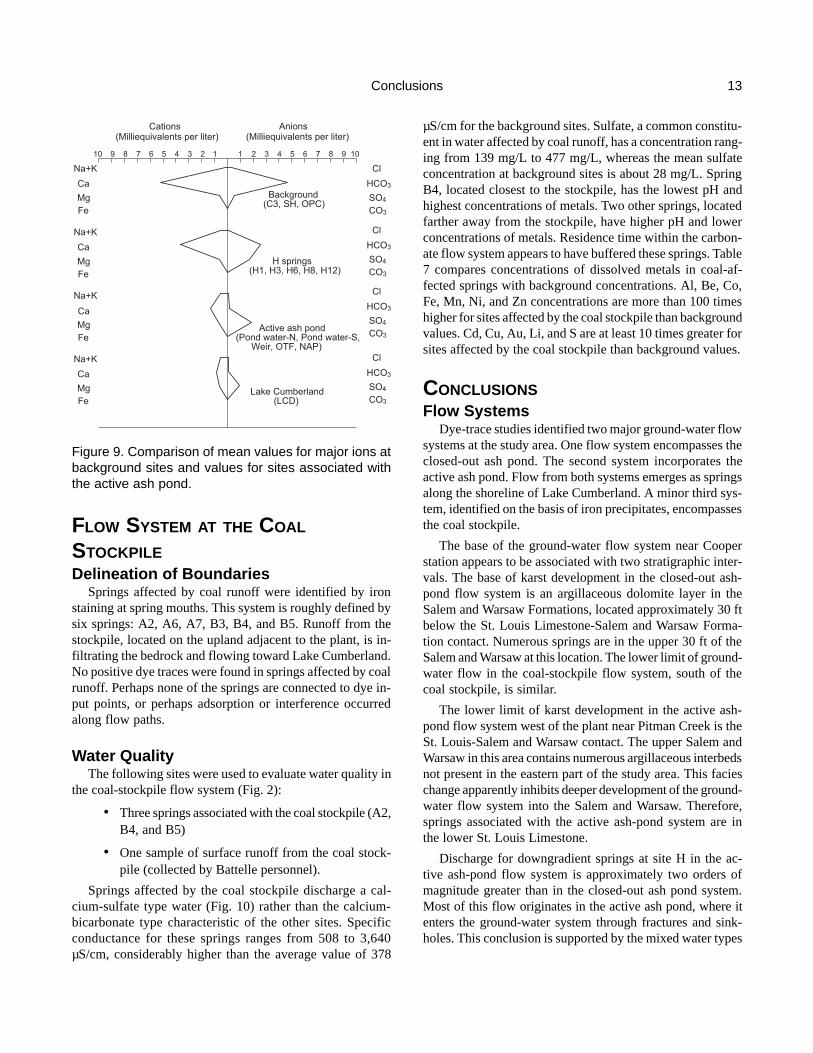
the closed-out ash pond................................................................................................................................................... 99. Diagram showing comparison of mean values for major ions at background sites and values for sites associated
with the active ash pond .............................................................................................................................................. 1310. Diagram showing comparison of mean values for major ions at background sites and values for sites
associated with the coal stockpile ................................................................................................................................ 17
iii

TABLESPage
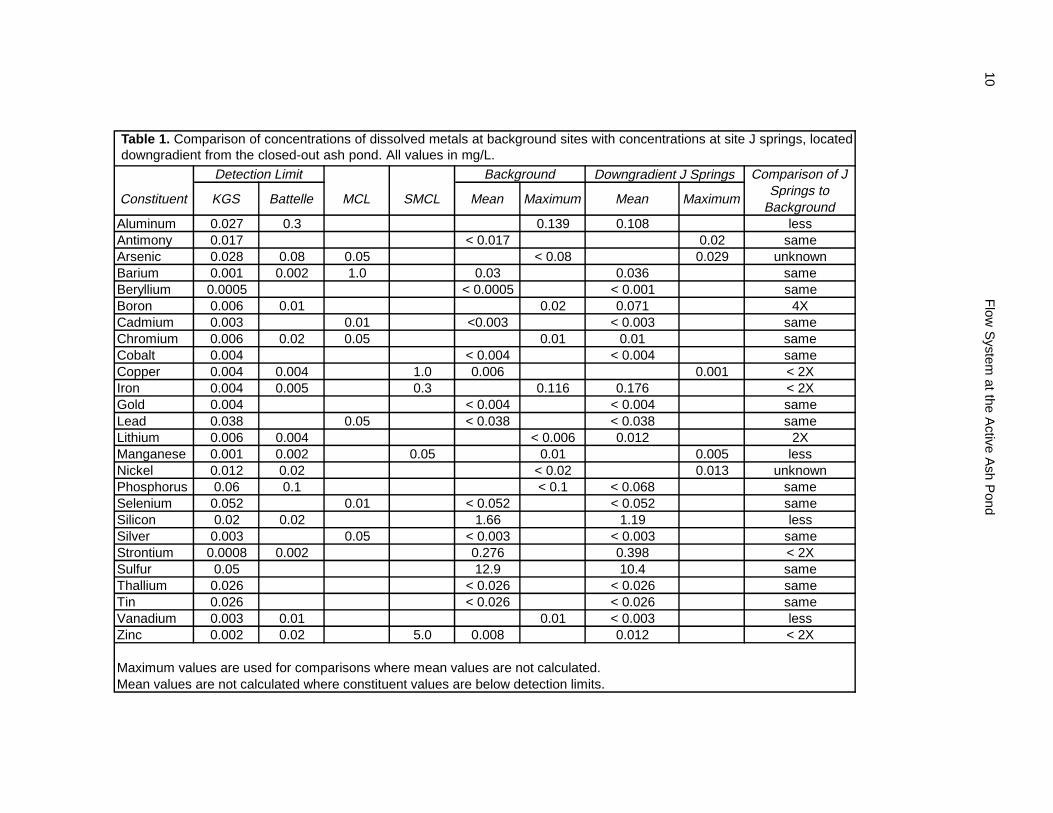
1. Comparison of concentrations of dissolved metals at background sites with concentrations at site J springs,located downgradient from the closed-out ash pond ................................................................................................... 10
2. Comparison of concentrations of dissolved metals at background sites with concentrations in monitoringwells in the closed-out ash pond .................................................................................................................................. 11
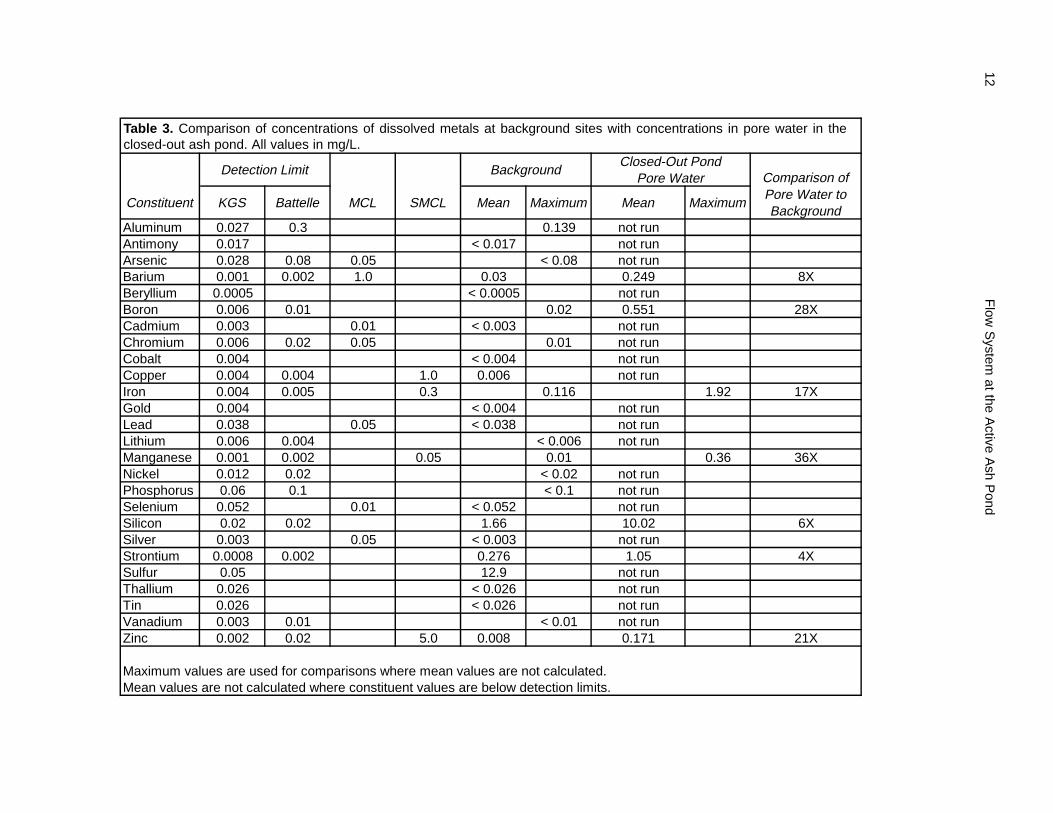
3. Comparison of concentrations of dissolved metals at background sites with concentrations in pore water in theclosed-out ash pond ..................................................................................................................................................... 12
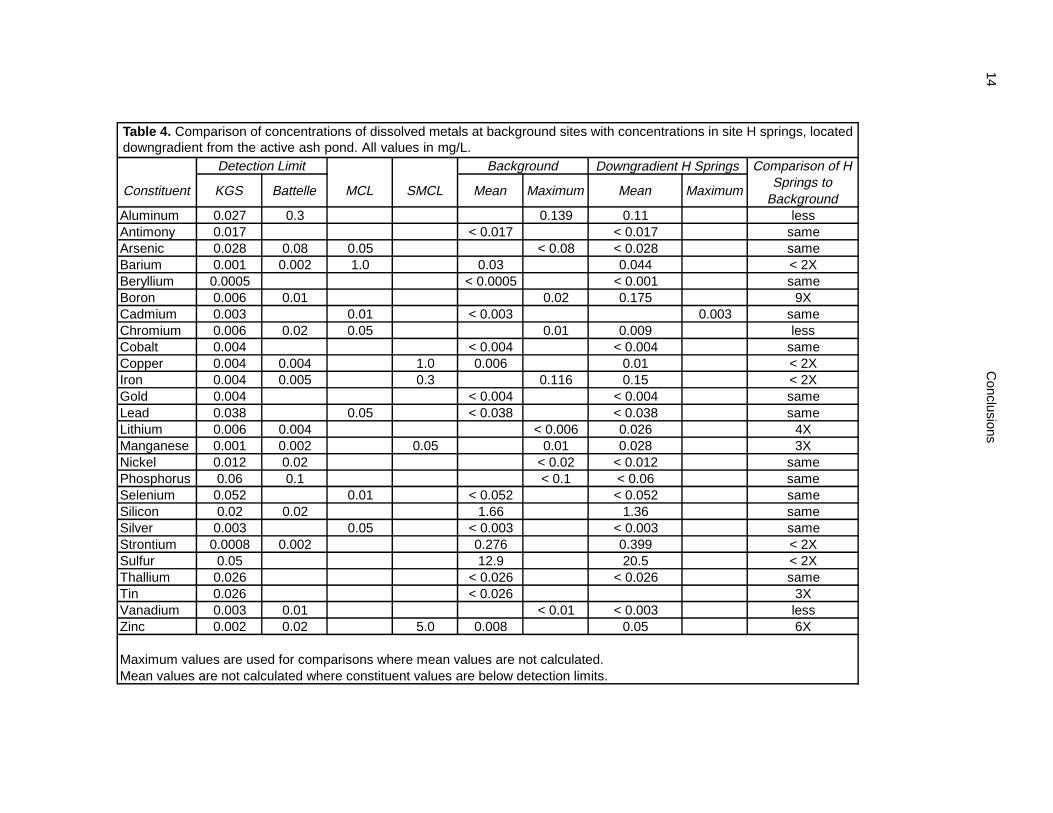
4. Comparison of concentrations of dissolved metals at background sites with concentrations in site H springs,located downgradient from the active ash pond .......................................................................................................... 14
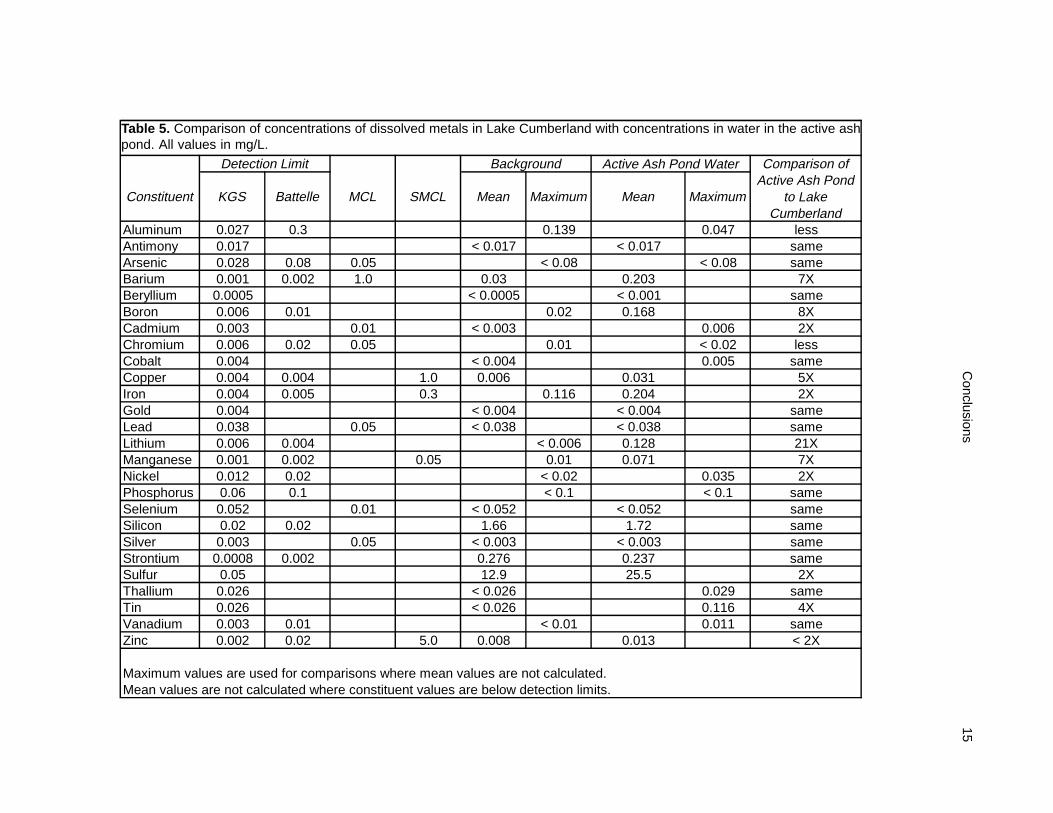
5. Comparison of concentrations of dissolved metals in Lake Cumberland with concentrations in water in the activeash pond ....................................................................................................................................................................... 15
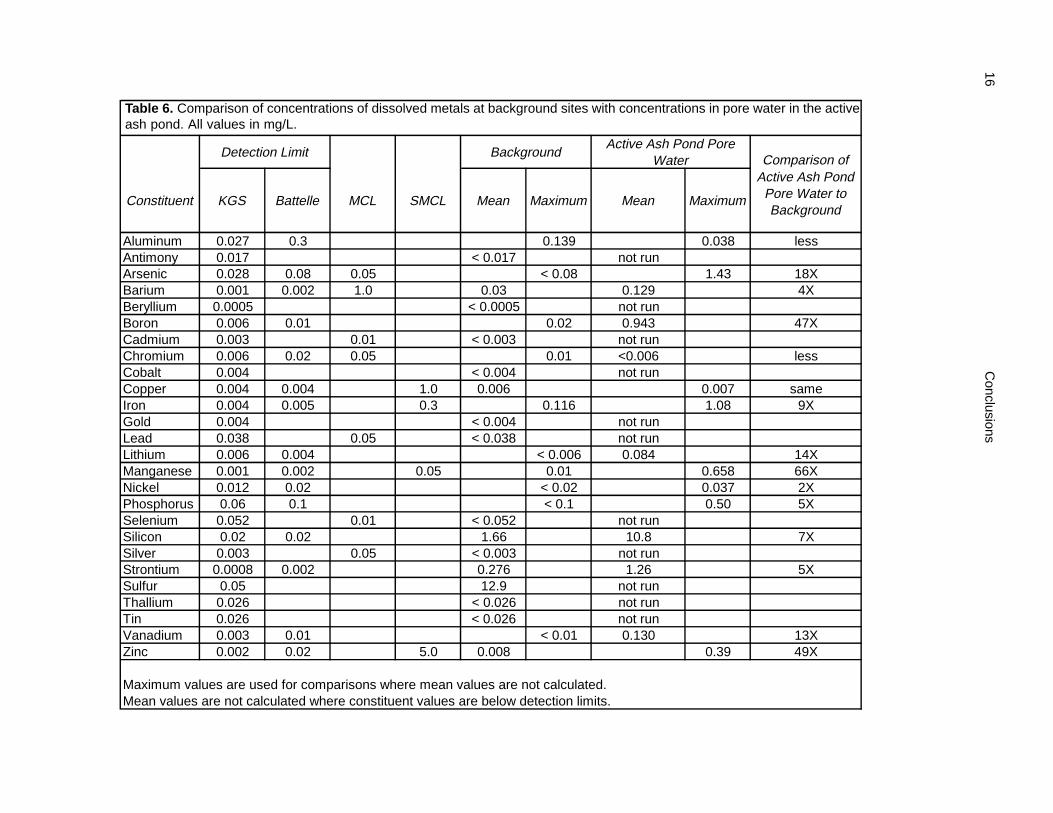
6. Comparison of concentrations of dissolved metals at background sites with concentrations in pore water in theactive ash pond............................................................................................................................................................. 16
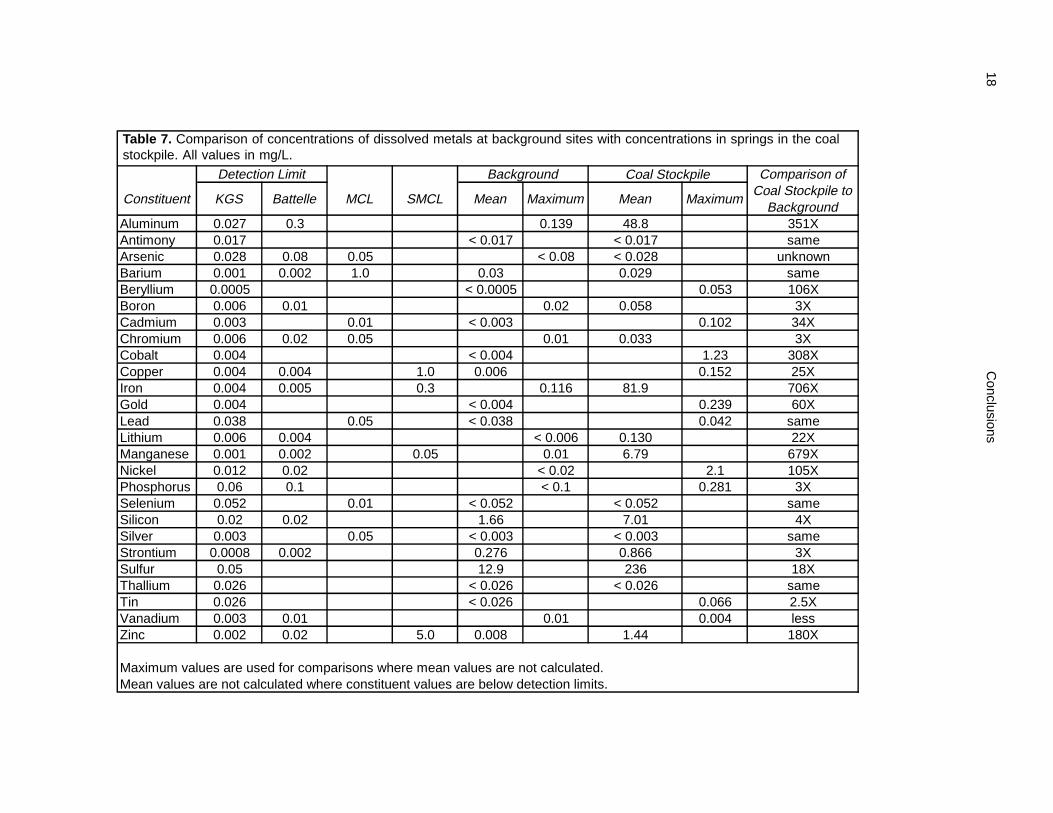
7. Comparison of concentrations of dissolved metals at background sites with concentrations in springs in thecoal stockpile ................................................................................................................................................................ 18
8. Summary of monitored locations associated with the closed-out ash pond with constituents that exceed MCL’sor SMCL’s .................................................................................................................................................................... 19
9. Summary of monitored locations associated with the active ash pond with constituents that exceed MCL’s orSMCL’s ......................................................................................................................................................................... 19
10. Summary of coal-stockpile springs with constituents that exceed MCL’s or SMCL’s ............................................... 20
iv

MISSION STATEMENTThe Kentucky Geological Survey at the University of Kentucky is a
State-mandated organization whose mission is the collection, preservation,and dissemination of information about mineral and water resources andthe geology of the Commonwealth. KGS has conducted research on thegeology and mineral resources of Kentucky for more than 150 years, andhas developed extensive public databases for oil and natural gas, coal,water, and industrial minerals that are used by thousands of citizens eachyear. The Survey’s efforts have resulted in topographic and geologic mapcoverage for Kentucky that has not been matched by any other state in theNation.
One of the major goals of the Kentucky Geological Survey is to makethe results of basic and applied research easily accessible to the public. Thisis accomplished through the publication of both technical and nontechnicalreports and maps, as well as providing information through open-filereports and public databases.
v
INTRODUCTIONThis report culminates an 18-month hydrogeologic study
from 1989 to 1990 at the John Sherman Cooper coal-firedpower plant in south-central Kentucky. The study was con-ducted jointly by the Kentucky Geological Survey and theInstitute for Mining and Minerals Research at the Univer-sity of Kentucky. Selected data collected by Battelle PacificNorthwest Laboratories were also incorporated into this re-port. The purpose of this project was to describe the ground-water flow system and ground-water quality surrounding ash-disposal facilities in a karst terrane.
The monitoring approach used differs from monitoringmethods typically applied in nonkarst settings. In a karstsetting, the primary avenues for ground-water movement aresolution-weathered conduits that discharge water at springs.Ground water in pore spaces between conduits is not likelyto be representative of water affected by land uses that movesrapidly through the conduit system. According to Quinlanand Ewers (1985), wells drilled in karst terranes will prob-ably not intercept conduits through which pollutants move;therefore, springs rather than wells are the most efficient andreliable monitoring points. Because springs, where present,provide an effective and convenient way to trace movement
1Kentucky Geological Survey2Kentucky Water Resources Research Institute/Department of Geological Sciences, University of Kentucky3Department of Geological Sciences, University of Kentucky
HYDROGEOLOGY AND GROUND-WATER MONITORINGOF COAL-ASH DISPOSAL SITES IN A KARST TERRANE
NEAR BURNSIDE, SOUTH-CENTRAL KENTUCKY
Shelley Minns Hutcheson 1, Lyle V.A. Sendlein 2,James S. Dinger 1, James C. Currens 1, and
Arsin M. Sahba 3
ABSTRACTThe effects of two coal-ash disposal facilities on ground-water quality at the John Sherman Cooper Power
Plant, located in a karst region of south-central Kentucky, were evaluated using dye traces in springs. Springswere used for monitoring rather than wells, because in a karst terrane wells are unlikely to intercept indi-vidual conduits.
A closed-out ash pond located over a conduit-flow system discharges to three springs in the upper Salemand Warsaw Formations along Lake Cumberland. Water discharging from these downgradient springs issimilar to springs unaffected by ash-disposal facilities and is a calcium-bicarbonate type. No constituentconcentrations found in this flow system exceeded maximum contaminant levels (MCL’s) or secondary maxi-mum contaminant levels (SMCL’s) defined by the U.S. Environmental Protection Agency.
An active ash pond is situated over another conduit-flow system that discharges to springs in the lower St.Louis Limestone. Water discharging from these downgradient springs is intermediate between the calcium-bicarbonate type of the unaffected springs and the calcium-sulfate type of the active ash pond. No constituentconcentrations found in this flow system exceeded MCL’s or SMCL’s.
A third flow system associated with a coal stockpile adjacent to the plant is delineated by springs in the St.Louis Limestone and the Salem and Warsaw Formations that discharge calcium-sulfate type water. Chro-mium and cadmium concentrations exceeded MCL’s in at least one sample from this flow system. Iron,manganese, sulfate, and total dissolved solid concentrations exceeded SMCL’s in at least one sample.
The closed-out ash pond appears to have no adverse impact on the water quality, nor does the active ashpond. In general, the coal stockpile has a more adverse impact on ground-water quality in the study area thanthe ash-disposal facilities.
Methods
of water and associated pollutants in the subsurface inkarst areas, springs and surface-water sites were used to evalu-ate water quality in the study area. Wells were only used toevaluate water quality in the ash fill.
Cooper station, operated by East Kentucky Power Coop-erative, is located in Pulaski County on the north side ofLake Cumberland, approximately 0.75 mi northeast ofBurnside, off county highway 1247 (Fig. 1). The site straddlesthe northern edge of the Burnside and southern edge of theSomerset 7.5-minute quadrangles. The plant burns bitumi-nous coal from eastern Kentucky that has an average sulfurcontent of 1.5 percent and a mineral content (noncombus-tible) of 10 to 11 percent. Approximately 150,000 tons ofcoal are stockpiled adjacent to the plant.Untreated water from Lake Cumberland isused for plant cooling and as sluice water forash disposal.
Two ponds, one active and one closed out,have been used for ash disposal.
METHODSSinkhole and Spring Survey
The study area was extensively fieldmapped to locate sinkholes, swallow holes,and springs. The mapping located 132 sink-holes and 32 springs (Fig. 2). The sinkholedepressions have length and width dimen-sions ranging from a few feet to 250 ft; depthsvaried from 1 to 20 ft. Spring morphologyvaried from small, diffuse seeps to largesprings flowing from discrete openings. Somesprings along the lakeshore are alternatelysubmerged and exposed.
Dye TracingA qualitative dye-tracing program was
initiated in the spring of 1990 to establishhydraulic connections between sinkholes andswallets located on the upland region, andsprings located around the periphery of thesite. The fluorescent tracers fluorescein (acidyellow 73, CI 45350) and Tinopal CBS-Xoptical brightener (CI 351) were chosen forthis study. A background test of fluorescencefound no evidence of potential interferencewith either dye.
Eight sites were selected for introductionof dye: four in the vicinity of each disposalsite (Fig. 2). Dye was added directly to siteswhere flow was visible. Locations that didnot have flowing water were primed with
1,000 gallons of water and flushed with an additional 1,000gallons of water after the introduction of dye. Detectors placedat selected springs were checked weekly. Fluorescein flushedthrough the system quickly, but optical brightener showedresidual fluorescence for several weeks.
Seven of eight dye traces were successful. One fluore-scein dye trace was lost. Laboratory tests conducted at theKentucky Geological Survey showed that fluorescein isstrongly adsorbed onto coal ash, so this trace could have beenlost as a result of adsorption onto ash present in the conduitsystem. Alternatively, the dye may not have flushed throughthe system.
0 0.5 mi
Cooperpower station
Closed-outash pond
Active ash pond
Coalstockpile
0 50 mi
U.S
. Hw
y. 27
Co. Hwy. 1247
Access road
WesternKentucky
CoalField
EasternKentuckyCoal Field
MississippiEmbayment
InnerBlue
Grass
Plateaus
OuterBlue
Grass
Scale
N
LAKE
CUMBERLAND
Mississippian
PIT
MA
NC
RE
EK
Pond dischargepipe
Figure 1. Location of John Sherman Cooper Power Plant and ash-dis-posal facilities and relationship to physiographic provinces.
2
Monitoring WellsThree ground-water monitoring wells were drilled in the
closed-out ash pond to assess the quality of ground water inthe ash (Fig. 2). The wells were constructed in fly ash, and
the bottom of the screen rested on limestone bedrock. A ben-tonite seal was placed above the sand pack a few feet abovethe screen. The remainder of the annulus was filled withash. Boreholes were drilled using a hollow-stem auger andwere completed with 2-in.-diameter PVC well casing.
Methods
Access road
N0 0.5 mi
Cooperpower station
Closed-outash pond
Active ash pond
EXPLANATIONP
ITMA
N C
RE
EK
H1�H13
OTF
C1
Weir
Pond water-S
PLP
C3
CGD
Pond water-N
C26SHS
B2 A72
E1
B6B5
SH
OPPOPC
C89DW
C89CW
C89BW
A32
A5
A4B4
B7
Coal runoffB3
A7A6A2A3
OCD
J5J4
J3,J3AJ2
J6J1
NAP
Coal stockpile
Sinkhole
Ash monitoring well
Sampled springDye input point
Spring
Surface-water site
U.S
. Hw
y. 27
Co. Hwy. 1247
Scale
LAKE CUMBERLAND
Figure 2. Locations of sinkholes, springs, dye injection points, and wells.
3
Water-Quality Sampling and AnalysisWater samples were obtained from springs, surface wa-
ter, and monitoring wells by personnel from both the Univer-sity of Kentucky and Battelle Pacific Northwest Laboratories.Pore-water samples were collected from the active and closed-out ash ponds by Battelle personnel. Water samples wereanalyzed for a wide range of chemical constituents in orderto characterize the surface- and ground-water qualityupgradient and downgradient from the ash-disposal sites, inthe closed-out ash pond, and in the active ash pond.
ASH DISPOSALCoal ash is an aluminosilicate glass composed primarily
of silicon, aluminum, iron, and calcium oxides and lesseramounts of sodium, magnesium, potassium, and sulfur(Cherkauer, 1980; Elseewi and others, 1980). Trace metalsare also common. The composition of coal ash is highly de-pendent on the composition of the precombusted coal. Ele-ments associated with ash may be incorporated into the alu-minosilicate matrix of individual particles or may accumu-late on the outer surface of the particles. Leaching of metalsand other constituents into ground and surface waters is theprimary concern with disposal of coal ash.
Beginning in 1964, ash was sluiced to what is now re-ferred to as the closed-out ash pond, an un-lined disposal pond that was dewatered afterstorage capacity was reached in 1978 (Fig.1). The closed-out ash pond has a surface areaof 40 acres and an ash thickness of 35 ft. Plantpersonnel indicate that sinkholes have occa-sionally opened up and drained ash-ladenwater into the subsurface along the easternedge of and within the pond. These sinkholeswere periodically plugged with rock andgravel.
Since 1978, ash has been disposed of inan unlined disposal pond, termed the activeash pond, located 4,100 ft northeast of theplant (Fig. 1). The active pond has a totalsurface area of 50 acres. Ash from the plantis sluiced 3,550 ft via pipeline to the pond,which also receives runoff from the watershedabove it and piped storm runoff from the plant.Pond water discharges to a small, unnamedtributary of Pitman Creek.
SITE HYDROGEOLOGYThe plant lies along the eastern edge of
the Mississippian Plateaus physiographicprovince, adjacent to the Eastern KentuckyCoal Field (Fig. 1). Surficial geology in the
Mississippian Plateaus consists of Mississippian carbonates.Topography is a rolling, upland karst plain with subsurfacedrainage, except for major rivers. In the Burnside area, how-ever, topography is noticeably dissected by small, V-shapedvalleys, although sinkholes and subsurface drainage are thedominant drainage. Knobs capped with Pennsylvanian sand-stone and shale typical of the Eastern Kentucky Coal Fieldare located northeast of the site. The lower, moderately steepslopes of these knobs are Mississippian limestones and shales.
The power plant is adjacent to Lake Cumberland. Thelake level generally drops throughout late spring, summer,and fall, and briefly increases during periods of heavy pre-cipitation. Levels are normally lower during early winter, toprovide adequate storage for winter and spring precipita-tion.
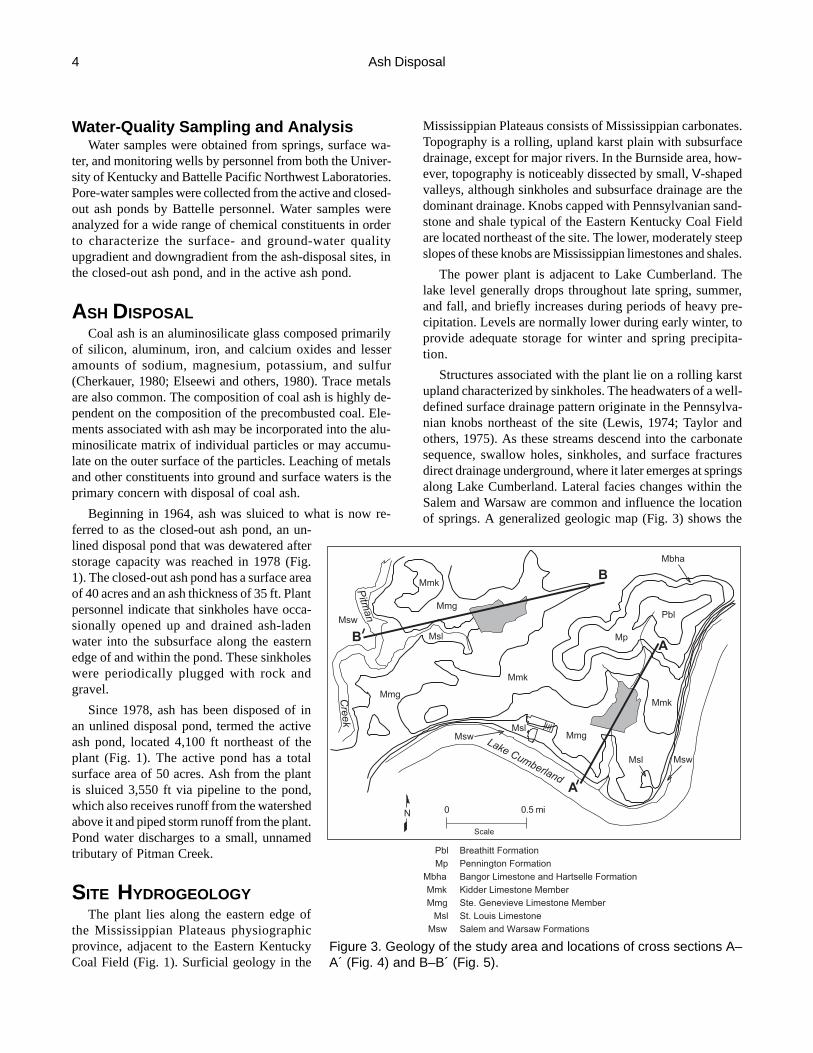
Structures associated with the plant lie on a rolling karstupland characterized by sinkholes. The headwaters of a well-defined surface drainage pattern originate in the Pennsylva-nian knobs northeast of the site (Lewis, 1974; Taylor andothers, 1975). As these streams descend into the carbonatesequence, swallow holes, sinkholes, and surface fracturesdirect drainage underground, where it later emerges at springsalong Lake Cumberland. Lateral facies changes within theSalem and Warsaw are common and influence the locationof springs. A generalized geologic map (Fig. 3) shows the
Mmk
Msl
Msl
MmkMmg
Msw
MmgMswMsl
Mp
Pbl
Mbha
Mmk
Msw
Mmg
N 0 0.5 mi
Lake Cumberland
Pitm
an
Creek
PblMp
MbhaMmkMmg
MslMsw
Breathitt FormationPennington FormationBangor Limestone and Hartselle FormationKidder Limestone MemberSte. Genevieve Limestone MemberSt. Louis LimestoneSalem and Warsaw Formations
Scale
A
A
B
B
Figure 3. Geology of the study area and locations of cross sections A–A´ (Fig. 4) and B–B´ (Fig. 5).
4 Ash Disposal

location of disposal facilities relative to the geologic forma-tions. Geologic cross sections constructed through both ash-disposal facilities are shown in Figures 4 and 5.
Kidder LimestoneThe Kidder Limestone, comprising the upper member of
the Monteagle Limestone, crops out around the flank of thehigh knobs northeast of the plant. The member is composedprimarily of limestone that contains minor amounts of silt-stone and shale distributed as thin beds throughout. Lam-bert and Brown (1963), in the hydrologic atlas for PulaskiCounty, indicated that springs from solution openings in theKidder Limestone may discharge up to 7,200 gallons perday (gal/d). Some springs, however, barely produce enoughfor a domestic supply. Spring SH, which occurs in the Kid-der Limestone (Fig. 2), was previously used as a domesticwater source. This is a high-capacity spring that consistentlyflows at an estimated rate of 21,000 gal/d.
Ste. Genevieve LimestoneThe Ste. Genevieve Limestone, the youngest formation
that directly underlies plant facilities, forms the lower mem-ber of the Monteagle Limestone and is predominantly lime-stone with minor amounts of chert. Lambert and Brown(1963) reported that wells intercepting large conduits in theSte. Genevieve may yield as much as 72,000 gal/d, althoughmost wells intercepting small conduits yield only enoughwater for a domestic supply. Large-capacity springs gener-
ally occur at or near stream level or at the Ste. Genevieve-St.Louis contact. Three springs (A4, A5, and C3) occur in theSte. Genevieve on the rolling upland (Fig. 2). Springs A4and A5 are diffuse seeps along an outcrop, whereas springC3 emerges from a distinct opening and flows at an esti-mated rate of 14,000 gal/d year-round.
St. Louis LimestoneThe St. Louis Limestone lies directly below the Ste.
Genevieve Limestone and is a predominantly cherty, argilla-ceous, fossiliferous limestone with interbeds of claystone andsiltstone. Siltstone is more common in the lower 20 ft. TheSt. Louis Limestone crops out in the valley wall above LakeCumberland and in places forms a prominent escarpment.According to Lambert and Brown (1963), wells interceptinglarge conduits in the St. Louis yield more than 72,000 gal/d.Most wells penetrate some conduits, but wells penetratingonly small conduits are generally inadequate for domesticsupplies. The lower 20 ft of the St. Louis usually producesinadequate yields for domestic use.
In the study area, 22 springs occur in the St. Louis Lime-stone. All except for spring C1 are located along the valleywall. The stratigraphic relationship of these springs to theunderlying Salem and Warsaw Formations, and the proxim-ity of the springs to Lake Cumberland are shown in Figure6.
Two springs (A2 and A3) are in a dolomite bed in the St.Louis Limestone south of the plant (Fig. 2). Spring A2 rests
on an argillaceous layer and flows at a rateof about 11,000 gal/d year-round. SpringA3 is a diffuse seep that is present through-out the year. Water from spring A2 was vis-ibly iron stained, indicating a likely shal-low flow connection with the nearby coalstockpile.
Five springs (B2, B3, B4, B5, and B6)(Fig. 2), situated downslope of the coalstockpile area and plant, are located in theSt. Louis Limestone. Flows from thesesprings range from diffuse drips up to asteady rate of 14,000 gal/d. Flows duringboth wet and dry weather are similar. Thefour springs located directly below the coalstockpile are visibly iron stained, indicat-ing connection with the coal stockpile.
Spring C1 is located on the upland,downgradient from the active ash pond.Discharge from this spring is approxi-mately 7,000 gal/d.
Site H consists of 13 springs located overa 500-ft-wide zone in an unnamed tribu-tary of Pitman Creek west of the active ash
0 500 1000 1500 2000 2500 3000 3500 4000 4500 5000
650
700
750
800
850
900
950
1000
Salem & Warsaw Formations (argillaceous dolomite zone)
Salem & Warsaw Formations (limestone)
St. Louis Limestone (dolomite)
St. Louis Limestone (limestone)
Ste. Genevieve
KidderLimestone
Closed-out ash pond
Lake level
Bangor Limestone andHartselle Formation (shale)
Limestone
Ste. GenevieveLimestone
Sinkhole
Springs
A A
Vertical exaggeration 10X
Elevation (ft)
Figure 4. Geologic cross section A–A´ through the closed-out ash pond.
Site Hydrogeology 5
0 500 1000 1500 2000 2500 3000 3500 4000 4500 5000 5500 6000 6500 7000 7500 8000
650
700
750
800
850
900
950
1000
Vertical exaggeration 10X
Elevation (ft)
Salem & Warsaw Formations (argillaceous dolomite zone)
Salem & Warsaw Formations (limestone)
St. Louis Limestone (dolomite)
St. Louis Limestone (limestone)
Ste. Genevieve Limestone
KidderLimestone
Active ash pond
Lake level
Bangor Limestone andHartselle Formation (shale)
Springs
B B
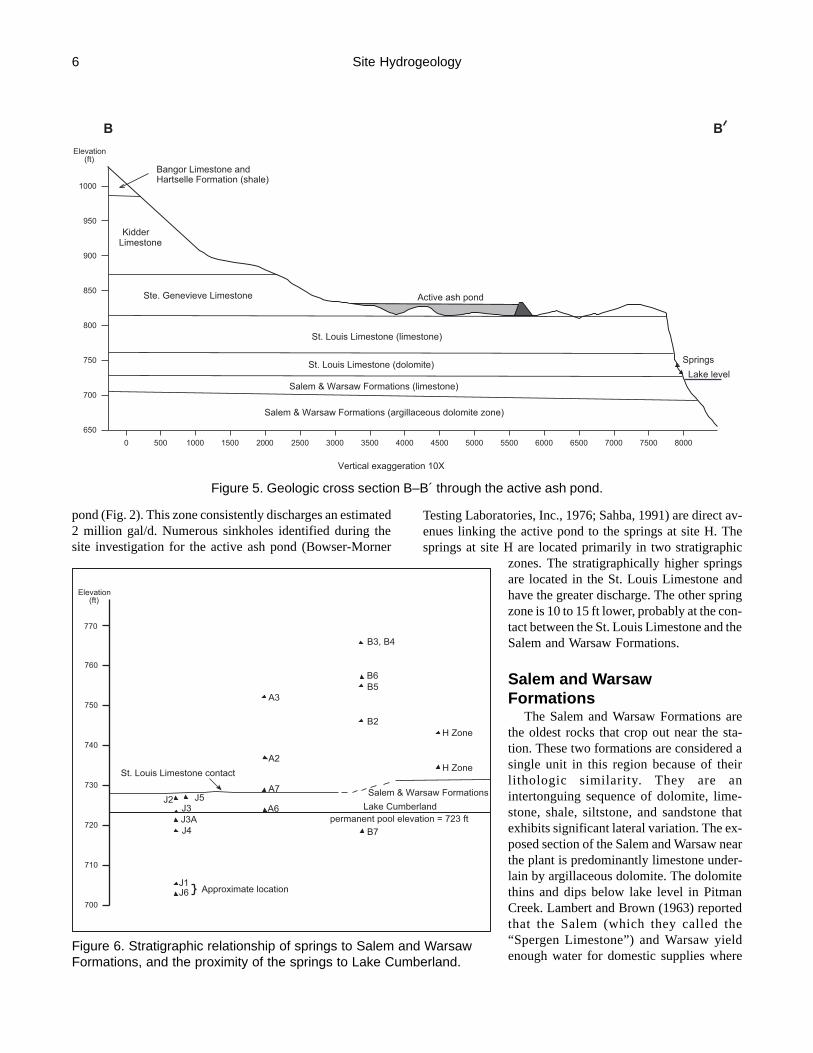
pond (Fig. 2). This zone consistently discharges an estimated2 million gal/d. Numerous sinkholes identified during thesite investigation for the active ash pond (Bowser-Morner
Testing Laboratories, Inc., 1976; Sahba, 1991) are direct av-enues linking the active pond to the springs at site H. Thesprings at site H are located primarily in two stratigraphic
zones. The stratigraphically higher springsare located in the St. Louis Limestone andhave the greater discharge. The other springzone is 10 to 15 ft lower, probably at the con-tact between the St. Louis Limestone and theSalem and Warsaw Formations.
Salem and WarsawFormations
The Salem and Warsaw Formations arethe oldest rocks that crop out near the sta-tion. These two formations are considered asingle unit in this region because of theirlithologic similarity. They are anintertonguing sequence of dolomite, lime-stone, shale, siltstone, and sandstone thatexhibits significant lateral variation. The ex-posed section of the Salem and Warsaw nearthe plant is predominantly limestone under-lain by argillaceous dolomite. The dolomitethins and dips below lake level in PitmanCreek. Lambert and Brown (1963) reportedthat the Salem (which they called the“Spergen Limestone”) and Warsaw yieldenough water for domestic supplies where
6 Site Hydrogeology
Figure 6. Stratigraphic relationship of springs to Salem and WarsawFormations, and the proximity of the springs to Lake Cumberland.
700
710
720
730
740
750
760
770
Elevation (ft)
A3
A2
A7
A6J2 J5
J3AJ4
J1J6
B3, B4
B6B5
B2
B7
H Zone
J3
H Zone
Approximate location
St. Louis Limestone contact
Salem & Warsaw Formations
Lake Cumberlandpermanent pool elevation = 723 ft
Figure 5. Geologic cross section B–B´ through the active ash pond.
the formations are predominantly limestone, but have pooryield in argillaceous zones. A minor stratigraphic horizonthat commonly contains springs is often present where lime-stone is in contact with underlying argillaceous strata. An-other spring horizon is at the base of the Salem and Warsaw(below lake level at this site).
Ten springs occur in the Salem and Warsaw Formations.Approximate stratigraphic positions are shown in Figure 6.Seven springs, referred to as J springs, are located along theshoreline of Lake Cumberland, south-southeast of the closed-out ash pond (Fig. 2). The locations of five of the springs(J2, J3, J3A, J4, and J5), near the upper part of these forma-tions, appear to be controlled by an argillaceous bed belowspring J4. Flow from these springs was estimated to rangefrom 1,440 to 14,000 gal/d during the winter and spring.Observed discharge decreased or ceased altogether duringthe summer and fall.
Springs J1 and J6, located on top of the aforementionedargillaceous dolomite bed, are stratigraphically lower in theSalem and Warsaw than the other J springs and are belowthe normal pool elevation of Lake Cumberland. Large vol-umes of water are reported to have commonly dischargedfrom spring J6 during low lake stages when the closed-outash pond was an active facility. This was most likely theresult of direct conduit connection of this spring to the once-active pond.
Springs designated with an “A” prefix (Fig. 2) are lo-cated along a drainage way south of the closed-out pond.Springs A6 and A7 are iron-stained diffuse seeps. One smallspring (B7) at site B is located in the Salem and WarsawFormations. All these springs are associated with argilla-ceous zones in the Salem and Warsaw Formations.
West of the active ash pond (near site H), at least 25 to 30ft of interbedded limestone and argillaceous dolomite is ex-posed in the Salem and Warsaw immediately below the St.Louis Limestone. No observable springs flow from the Sa-lem and Warsaw at this site; all springs are in the St. LouisLimestone. The interval containing the argillaceous dolo-mite that is exposed at sites J, A, and B is either sub-merged by the lake or absent at site H. The apparent lack ofspring development in any part of the Salem and Warsaw atthis location suggests that an argillaceous zone near the topof the Salem and Warsaw may impede downward ground-water flow.
Background Spring and Well DataBackground data (from sites not affected by the ash-dis-
posal facilities) were compared with other water-quality datato assess the impact of facilities on ground-water quality.The following sites were used to establish background waterquality at the study area:
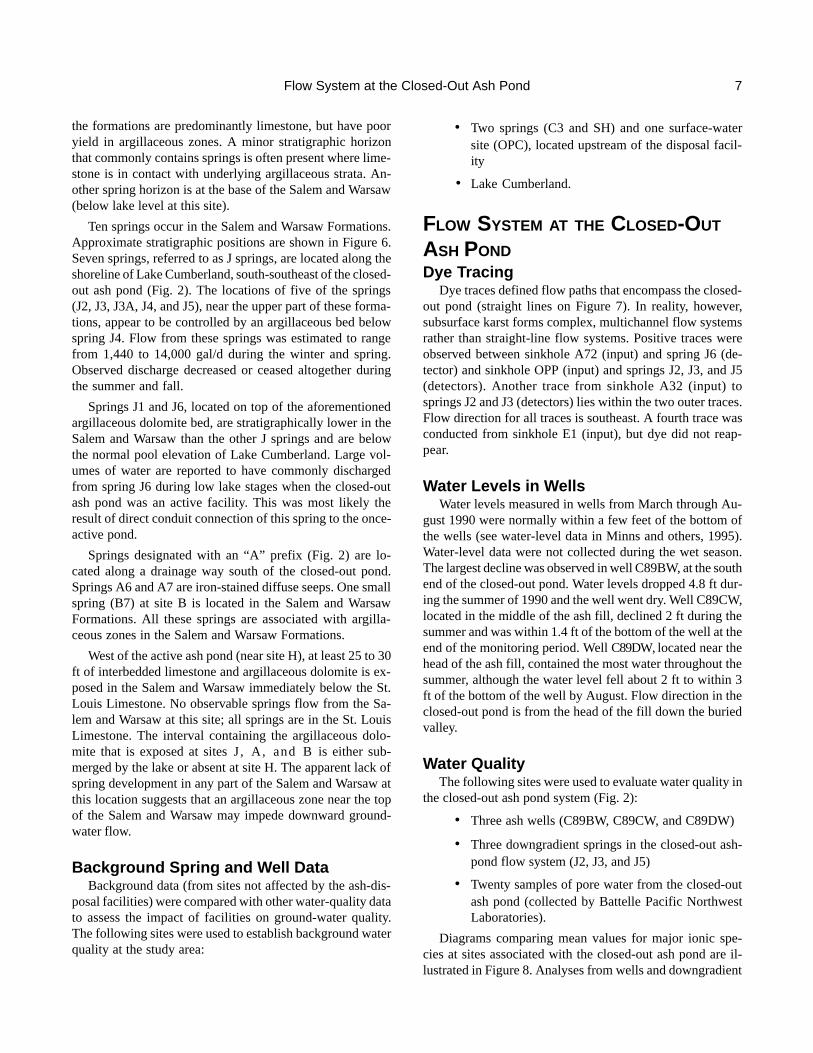
• Two springs (C3 and SH) and one surface-watersite (OPC), located upstream of the disposal facil-ity
• Lake Cumberland.
FLOW SYSTEM AT THE CLOSED-OUT
ASH PONDDye Tracing
Dye traces defined flow paths that encompass the closed-out pond (straight lines on Figure 7). In reality, however,subsurface karst forms complex, multichannel flow systemsrather than straight-line flow systems. Positive traces wereobserved between sinkhole A72 (input) and spring J6 (de-tector) and sinkhole OPP (input) and springs J2, J3, and J5(detectors). Another trace from sinkhole A32 (input) tosprings J2 and J3 (detectors) lies within the two outer traces.Flow direction for all traces is southeast. A fourth trace wasconducted from sinkhole E1 (input), but dye did not reap-pear.
Water Levels in WellsWater levels measured in wells from March through Au-
gust 1990 were normally within a few feet of the bottom ofthe wells (see water-level data in Minns and others, 1995).Water-level data were not collected during the wet season.The largest decline was observed in well C89BW, at the southend of the closed-out pond. Water levels dropped 4.8 ft dur-ing the summer of 1990 and the well went dry. Well C89CW,located in the middle of the ash fill, declined 2 ft during thesummer and was within 1.4 ft of the bottom of the well at theend of the monitoring period. Well C89DW, located near thehead of the ash fill, contained the most water throughout thesummer, although the water level fell about 2 ft to within 3ft of the bottom of the well by August. Flow direction in theclosed-out pond is from the head of the fill down the buriedvalley.
Water QualityThe following sites were used to evaluate water quality in
the closed-out ash pond system (Fig. 2):
• Three ash wells (C89BW, C89CW, and C89DW)
• Three downgradient springs in the closed-out ash-pond flow system (J2, J3, and J5)
• Twenty samples of pore water from the closed-outash pond (collected by Battelle Pacific NorthwestLaboratories).
Diagrams comparing mean values for major ionic spe-cies at sites associated with the closed-out ash pond are il-lustrated in Figure 8. Analyses from wells and downgradient
7Flow System at the Closed-Out Ash Pond
springs, as well as from background sites, indicate that thewater type for all sites is calcium bicarbonate. Ash wells areslightly deficient in calcium compared to springs. Mean spe-cific conductance for these three sites is similar, however,
ranging from 270 microSiemens per cm (µS/cm) for wells to378 µS/cm for background sites. Pore-water data were notincluded in the comparison because bicarbonate values werenot available.
Coal stockpile
U.S
. Hw
y. 27
Co. Hwy. 1247
Access road
0 0.5 mi
LAKE CUMBERLAND
Cooperpower station
Closed-outash pond
Active ash pond
PITM
AN
CR
EE
K
C89CW
C89BW
C89DW
OTF
Weir
NAP
OPC
OCD
CGD
Pond water-S
Pond water-N
A3
B3B4
J5
J3, J3AJ2
SH
B5
C3
H1�H13
PLP
C26
C1
OPPE1
A72
A32
SHS
B2
B6
B7A5
A4
A7 A6
A2 J4
J6J1
Coal runoff
Dye trace
EXPLANATION
Sinkhole
Ash monitoring well
Sampled springDye input point
Spring
Surface-water site
ScaleN
Figure 7. Locations of positive dye traces.
8 Flow System at the Closed-Out Ash Pond

Table 1, comparing dissolved metal concentrations in thedowngradient springs at site J to background values, showsthat values at site J are very similar to background values.Table 2, comparing dissolved metal concentrations in theash wells to background concentrations, shows that onlylithium and manganese concentrations are at least one order ofmagnitude greater in the ash wells than at the background sites.Strontium and boron concentrations in ash wells are seven andeight times greater than background concentrations, respec-tively.
Table 3 compares pore water from the closed-out ash pondwith water from background sites. Boron, iron, manganese,and zinc concentrations for pore waters are an order of mag-nitude greater than at background sites. Barium values forpore water are approximately eight times greater than back-ground values.
FLOW SYSTEM AT THE ACTIVE ASH
PONDDye Tracing
Dye traces defined flow paths that encompass the activeash pond (straight lines on Figure 7). In reality, however,subsurface karst forms complex, multichannel flow systemsthat cannot be defined by straight lines. Dye movement wastraced from sinkhole PLP (input) to the springs at site H alongPitman Creek (detectors). The trace from swallet C1 (input)to the springs at site H (detectors) was also successful. Addi-
tional traces lie between sinkhole C26 (input), swallet SHS(input), sinkhole C26 (input), and the H springs (detectors).Flow direction is to the southwest.
Water QualityThe following sites were used to evaluate water quality in
the active ash-pond flow system (Fig. 2):
• Five surface-water sites in the active ash-pond flowsystem (pond water-N, pond water-S, and weir, col-lected by Battelle personnel; OTF and NAP, col-lected by University of Kentucky personnel)
• Six downgradient springs in the active ash-pondflow system (H1, H3, H6, H8, H9, and H12)
• Fifteen pore-water samples from the active ash-pond
flow system (collected by Battelle personnel).
Diagrams comparing mean values for major ionic spe-cies at sites associated with the active ash-pond flow systemare illustrated in Figure 9. Sluice water from Lake Cumber-land is a mixed water type containing approximately equalpercentages of calcium, magnesium, sodium, bicarbonate,and sulfate. Sluice water mixed with ash in the active ashpond is primarily calcium-sulfate type. Discharge from thegroup of downgradient springs at site H is primarily cal-cium-bicarbonate water that has a sulfate content greater thanat background sites, indicating mixing of ash-pond waterand natural spring flow. Specific conductances range from alow of 156 µS/cm for one lake sample to a mean high of319 µS/cm in the downgradient springs.
Table 4 compares dissolved metal concentrations in thedowngradient springs at site H with background values. Dis-solved metal concentrations in the downgradient springs aresimilar to background concentrations; Ba, B, Cu, Fe, Li, Mn,Sr, and S range between approximately two and nine timesgreater than background. Only the concentration of boronexceeds background concentrations by nearly an order ofmagnitude.
Table 5 compares dissolved metal concentrations in theactive ash-pond water with water collected from LakeCumberland that is used for sluicing. Concentrations of Ba,B, Cd, Cu, Fe, Li, Mn, Ni, S, and Sn in the ash pond are 2 to21 times greater than in the lake water.
Table 6 compares dissolved metal concentrations at back-ground sites with concentrations in pore water from the ac-tive ash-pond flow system. Concentrations of boron, manga-nese, and zinc in the pore water range from 47 to 66 timeshigher than background levels. Concentrations of arsenic,lithium, and vanadium in the pore water are 13 to 18 timesgreater than background values.
Figure 8. Comparison of mean values for major ions atbackground sites and values for sites associated withthe closed-out ash pond.
1 2 3 4 5 6 7 8 9 10123456710 89
Cl
HCO3
SO4
CO3
Cl
HCO3
SO4
CO3
Cl
HCO3
SO4
CO3
Na+K
Ca
MgFe
Cations(Milliequivalents per liter)
Anions(Milliequivalents per liter)
Background
J springs
Ash monitoring wells
(C3, SH, OPC)
(J2, J3, J5)
(C89BW, C89CD, C89DW)
Ca
Na+K
MgFe
Ca
Na+K
MgFe
9Flow System at the Active Ash Pond
10F
low S
ystem at the A
ctive Ash P
ond
Table 1. Comparison of concentrations of dissolved metals at background sites with concentrations at site J springs, locateddowngradient from the closed-out ash pond. All values in mg/L.
Detection Limit Background Downgradient J Springs Comparison of J
Constituent KGS Battelle MCL SMCL Mean Maximum Mean MaximumSprings to
BackgroundAluminum 0.027 0.3 0.139 0.108 lessAntimony 0.017 < 0.017 0.02 sameArsenic 0.028 0.08 0.05 < 0.08 0.029 unknownBarium 0.001 0.002 1.0 0.03 0.036 sameBeryllium 0.0005 < 0.0005 < 0.001 sameBoron 0.006 0.01 0.02 0.071 4XCadmium 0.003 0.01 <0.003 < 0.003 sameChromium 0.006 0.02 0.05 0.01 0.01 sameCobalt 0.004 < 0.004 < 0.004 sameCopper 0.004 0.004 1.0 0.006 0.001 < 2XIron 0.004 0.005 0.3 0.116 0.176 < 2XGold 0.004 < 0.004 < 0.004 sameLead 0.038 0.05 < 0.038 < 0.038 sameLithium 0.006 0.004 < 0.006 0.012 2XManganese 0.001 0.002 0.05 0.01 0.005 lessNickel 0.012 0.02 < 0.02 0.013 unknownPhosphorus 0.06 0.1 < 0.1 < 0.068 sameSelenium 0.052 0.01 < 0.052 < 0.052 sameSilicon 0.02 0.02 1.66 1.19 lessSilver 0.003 0.05 < 0.003 < 0.003 sameStrontium 0.0008 0.002 0.276 0.398 < 2XSulfur 0.05 12.9 10.4 sameThallium 0.026 < 0.026 < 0.026 sameTin 0.026 < 0.026 < 0.026 sameVanadium 0.003 0.01 0.01 < 0.003 lessZinc 0.002 0.02 5.0 0.008 0.012 < 2X
Maximum values are used for comparisons where mean values are not calculated.Mean values are not calculated where constituent values are below detection limits.

Flow
System
at the Active A
sh Pond
11
Table 2. Comparison of concentrations of dissolved metals at background sites with concentrations in monitoring wells in theclosed-out ash pond. All values in mg/L.
Detection Limit Background Ash Wells Comparison of
Constituent KGS Battelle MCL SMCL Mean Maximum Mean MaximumAsh Wells to Background
Aluminum 0.027 0.3 0.139 0.057 lessAntimony 0.017 < 0.017 < 0.017 sameArsenic 0.028 0.08 0.05 < 0.08 0.071 unknownBarium 0.001 0.002 1.0 0.03 0.104 3XBeryllium 0.0005 < 0.0005 < 0.001 sameBoron 0.006 0.01 0.02 0.168 8XCadmium 0.003 0.01 <0.003 < 0.003 sameChromium 0.006 0.02 0.05 0.01 < 0.006 sameCobalt 0.004 < 0.004 < 0.004 sameCopper 0.004 0.004 1.0 0.006 0.005 sameIron 0.004 0.005 0.3 0.116 0.204 < 2XGold 0.004 < 0.004 0.006 sameLead 0.038 0.05 < 0.038 < 0.038 sameLithium 0.006 0.004 < 0.006 0.114 19XManganese 0.001 0.002 0.05 0.01 0.407 41XNickel 0.012 0.02 < 0.02 < 0.012 samePhosphorus 0.06 0.1 < 0.1 0.463 5XSelenium 0.052 0.01 0.01 < 0.052 < 0.052 sameSilicon 0.02 0.02 1.66 7.56 5XSilver 0.003 0.05 < 0.003 < 0.003 sameStrontium 0.0008 0.002 0.276 2.00 7XSulfur 0.05 12.9 25.5 2XThallium 0.026 < 0.026 < 0.026 sameTin 0.026 < 0.026 < 0.026 sameVanadium 0.003 0.01 < 0.01 0.031 3XZinc 0.002 0.02 5.0 0.008 0.009 same
Maximum values are used for comparisons where mean values are not calculated.Mean values are not calculated where constituent values are below detection limits.
12F
low S
ystem at the A
ctive Ash P
ond
Table 3. Comparison of concentrations of dissolved metals at background sites with concentrations in pore water in theclosed-out ash pond. All values in mg/L.
Detection Limit BackgroundClosed-Out Pond
Pore Water Comparison of
Constituent KGS Battelle MCL SMCL Mean Maximum Mean MaximumPore Water to Background
Aluminum 0.027 0.3 0.139 not runAntimony 0.017 < 0.017 not runArsenic 0.028 0.08 0.05 < 0.08 not runBarium 0.001 0.002 1.0 0.03 0.249 8XBeryllium 0.0005 < 0.0005 not runBoron 0.006 0.01 0.02 0.551 28XCadmium 0.003 0.01 < 0.003 not runChromium 0.006 0.02 0.05 0.01 not runCobalt 0.004 < 0.004 not runCopper 0.004 0.004 1.0 0.006 not runIron 0.004 0.005 0.3 0.116 1.92 17XGold 0.004 < 0.004 not runLead 0.038 0.05 < 0.038 not runLithium 0.006 0.004 < 0.006 not runManganese 0.001 0.002 0.05 0.01 0.36 36XNickel 0.012 0.02 < 0.02 not runPhosphorus 0.06 0.1 < 0.1 not runSelenium 0.052 0.01 < 0.052 not runSilicon 0.02 0.02 1.66 10.02 6XSilver 0.003 0.05 < 0.003 not runStrontium 0.0008 0.002 0.276 1.05 4XSulfur 0.05 12.9 not runThallium 0.026 < 0.026 not runTin 0.026 < 0.026 not runVanadium 0.003 0.01 < 0.01 not runZinc 0.002 0.02 5.0 0.008 0.171 21X
Maximum values are used for comparisons where mean values are not calculated.Mean values are not calculated where constituent values are below detection limits.
FLOW SYSTEM AT THE COAL
STOCKPILEDelineation of Boundaries
Springs affected by coal runoff were identified by ironstaining at spring mouths. This system is roughly defined bysix springs: A2, A6, A7, B3, B4, and B5. Runoff from thestockpile, located on the upland adjacent to the plant, is in-filtrating the bedrock and flowing toward Lake Cumberland.No positive dye traces were found in springs affected by coalrunoff. Perhaps none of the springs are connected to dye in-put points, or perhaps adsorption or interference occurredalong flow paths.
Water QualityThe following sites were used to evaluate water quality in
the coal-stockpile flow system (Fig. 2):
• Three springs associated with the coal stockpile (A2,B4, and B5)
• One sample of surface runoff from the coal stock-pile (collected by Battelle personnel).
Springs affected by the coal stockpile discharge a cal-cium-sulfate type water (Fig. 10) rather than the calcium-bicarbonate type characteristic of the other sites. Specificconductance for these springs ranges from 508 to 3,640µS/cm, considerably higher than the average value of 378
µS/cm for the background sites. Sulfate, a common constitu-ent in water affected by coal runoff, has a concentration rang-ing from 139 mg/L to 477 mg/L, whereas the mean sulfateconcentration at background sites is about 28 mg/L. SpringB4, located closest to the stockpile, has the lowest pH andhighest concentrations of metals. Two other springs, locatedfarther away from the stockpile, have higher pH and lowerconcentrations of metals. Residence time within the carbon-ate flow system appears to have buffered these springs. Table7 compares concentrations of dissolved metals in coal-af-fected springs with background concentrations. Al, Be, Co,Fe, Mn, Ni, and Zn concentrations are more than 100 timeshigher for sites affected by the coal stockpile than backgroundvalues. Cd, Cu, Au, Li, and S are at least 10 times greater forsites affected by the coal stockpile than background values.
CONCLUSIONSFlow Systems
Dye-trace studies identified two major ground-water flowsystems at the study area. One flow system encompasses theclosed-out ash pond. The second system incorporates theactive ash pond. Flow from both systems emerges as springsalong the shoreline of Lake Cumberland. A minor third sys-tem, identified on the basis of iron precipitates, encompassesthe coal stockpile.
The base of the ground-water flow system near Cooperstation appears to be associated with two stratigraphic inter-vals. The base of karst development in the closed-out ash-pond flow system is an argillaceous dolomite layer in theSalem and Warsaw Formations, located approximately 30 ftbelow the St. Louis Limestone-Salem and Warsaw Forma-tion contact. Numerous springs are in the upper 30 ft of theSalem and Warsaw at this location. The lower limit of ground-water flow in the coal-stockpile flow system, south of thecoal stockpile, is similar.
The lower limit of karst development in the active ash-pond flow system west of the plant near Pitman Creek is theSt. Louis-Salem and Warsaw contact. The upper Salem andWarsaw in this area contains numerous argillaceous interbedsnot present in the eastern part of the study area. This facieschange apparently inhibits deeper development of the ground-water flow system into the Salem and Warsaw. Therefore,springs associated with the active ash-pond system are inthe lower St. Louis Limestone.
Discharge for downgradient springs at site H in the ac-tive ash-pond flow system is approximately two orders ofmagnitude greater than in the closed-out ash pond system.Most of this flow originates in the active ash pond, where itenters the ground-water system through fractures and sink-holes. This conclusion is supported by the mixed water types
1 2 3 4 5 6 7 8 9 10123456710 89
Na+K
Ca
MgFe
Cl
HCO3
SO4
CO3
FeMg
Ca
Na+K
FeMgCa
Na+K
Fe
Na+K
Ca
Mg
Cl
HCO3
SO4
CO3
Cl
HCO3
SO4
CO3
Cl
HCO3
SO4
CO3
Cations(Milliequivalents per liter)
Anions(Milliequivalents per liter)
Background(C3, SH, OPC)
H springs(H1, H3, H6, H8, H12)
Active ash pond(Pond water-N, Pond water-S, Weir, OTF, NAP)
Lake Cumberland (LCD)
Figure 9. Comparison of mean values for major ions atbackground sites and values for sites associated withthe active ash pond.
13Conclusions
Conclusions
14
Table 4. Comparison of concentrations of dissolved metals at background sites with concentrations in site H springs, locateddowngradient from the active ash pond. All values in mg/L.
Detection Limit Background Downgradient H Springs Comparison of H
Constituent KGS Battelle MCL SMCL Mean Maximum Mean MaximumSprings to
BackgroundAluminum 0.027 0.3 0.139 0.11 lessAntimony 0.017 < 0.017 < 0.017 sameArsenic 0.028 0.08 0.05 < 0.08 < 0.028 sameBarium 0.001 0.002 1.0 0.03 0.044 < 2XBeryllium 0.0005 < 0.0005 < 0.001 sameBoron 0.006 0.01 0.02 0.175 9XCadmium 0.003 0.01 < 0.003 0.003 sameChromium 0.006 0.02 0.05 0.01 0.009 lessCobalt 0.004 < 0.004 < 0.004 sameCopper 0.004 0.004 1.0 0.006 0.01 < 2XIron 0.004 0.005 0.3 0.116 0.15 < 2XGold 0.004 < 0.004 < 0.004 sameLead 0.038 0.05 < 0.038 < 0.038 sameLithium 0.006 0.004 < 0.006 0.026 4XManganese 0.001 0.002 0.05 0.01 0.028 3XNickel 0.012 0.02 < 0.02 < 0.012 samePhosphorus 0.06 0.1 < 0.1 < 0.06 sameSelenium 0.052 0.01 < 0.052 < 0.052 sameSilicon 0.02 0.02 1.66 1.36 sameSilver 0.003 0.05 < 0.003 < 0.003 sameStrontium 0.0008 0.002 0.276 0.399 < 2XSulfur 0.05 12.9 20.5 < 2XThallium 0.026 < 0.026 < 0.026 sameTin 0.026 < 0.026 3XVanadium 0.003 0.01 < 0.01 < 0.003 lessZinc 0.002 0.02 5.0 0.008 0.05 6X
Maximum values are used for comparisons where mean values are not calculated.Mean values are not calculated where constituent values are below detection limits.
Conclusions
15
Table 5. Comparison of concentrations of dissolved metals in Lake Cumberland with concentrations in water in the active ashpond. All values in mg/L.
Detection Limit Background Active Ash Pond Water Comparison of
Constituent KGS Battelle MCL SMCL Mean Maximum Mean MaximumActive Ash Pond
to Lake Cumberland
Aluminum 0.027 0.3 0.139 0.047 lessAntimony 0.017 < 0.017 < 0.017 sameArsenic 0.028 0.08 0.05 < 0.08 < 0.08 sameBarium 0.001 0.002 1.0 0.03 0.203 7XBeryllium 0.0005 < 0.0005 < 0.001 sameBoron 0.006 0.01 0.02 0.168 8XCadmium 0.003 0.01 < 0.003 0.006 2XChromium 0.006 0.02 0.05 0.01 < 0.02 lessCobalt 0.004 < 0.004 0.005 sameCopper 0.004 0.004 1.0 0.006 0.031 5XIron 0.004 0.005 0.3 0.116 0.204 2XGold 0.004 < 0.004 < 0.004 sameLead 0.038 0.05 < 0.038 < 0.038 sameLithium 0.006 0.004 < 0.006 0.128 21XManganese 0.001 0.002 0.05 0.01 0.071 7XNickel 0.012 0.02 < 0.02 0.035 2XPhosphorus 0.06 0.1 < 0.1 < 0.1 sameSelenium 0.052 0.01 < 0.052 < 0.052 sameSilicon 0.02 0.02 1.66 1.72 sameSilver 0.003 0.05 < 0.003 < 0.003 sameStrontium 0.0008 0.002 0.276 0.237 sameSulfur 0.05 12.9 25.5 2XThallium 0.026 < 0.026 0.029 sameTin 0.026 < 0.026 0.116 4XVanadium 0.003 0.01 < 0.01 0.011 sameZinc 0.002 0.02 5.0 0.008 0.013 < 2X
Maximum values are used for comparisons where mean values are not calculated.Mean values are not calculated where constituent values are below detection limits.
16C
onclusions
Table 6. Comparison of concentrations of dissolved metals at background sites with concentrations in pore water in the activeash pond. All values in mg/L.
Detection Limit BackgroundActive Ash Pond Pore
Water Comparison of
Constituent KGS Battelle MCL SMCL Mean Maximum Mean Maximum
Active Ash Pond Pore Water to Background
Aluminum 0.027 0.3 0.139 0.038 lessAntimony 0.017 < 0.017 not runArsenic 0.028 0.08 0.05 < 0.08 1.43 18XBarium 0.001 0.002 1.0 0.03 0.129 4XBeryllium 0.0005 < 0.0005 not runBoron 0.006 0.01 0.02 0.943 47XCadmium 0.003 0.01 < 0.003 not runChromium 0.006 0.02 0.05 0.01 <0.006 lessCobalt 0.004 < 0.004 not runCopper 0.004 0.004 1.0 0.006 0.007 sameIron 0.004 0.005 0.3 0.116 1.08 9XGold 0.004 < 0.004 not runLead 0.038 0.05 < 0.038 not runLithium 0.006 0.004 < 0.006 0.084 14XManganese 0.001 0.002 0.05 0.01 0.658 66XNickel 0.012 0.02 < 0.02 0.037 2XPhosphorus 0.06 0.1 < 0.1 0.50 5XSelenium 0.052 0.01 < 0.052 not runSilicon 0.02 0.02 1.66 10.8 7XSilver 0.003 0.05 < 0.003 not runStrontium 0.0008 0.002 0.276 1.26 5XSulfur 0.05 12.9 not runThallium 0.026 < 0.026 not runTin 0.026 < 0.026 not runVanadium 0.003 0.01 < 0.01 0.130 13XZinc 0.002 0.02 5.0 0.008 0.39 49X
Maximum values are used for comparisons where mean values are not calculated.Mean values are not calculated where constituent values are below detection limits.

encountered in the system and verified by ash that has beentransported from the active ash pond, through the karstground-water flow system, and deposited near spring outfalls.
Water QualityClosed-Out Ash-Pond Flow System. Wells completed in
the closed-out ash pond, downgradient from springs at siteJ, and background sites all have similar water-quality char-acteristics. Major-ion composition for all sites associated withthe closed-out ash pond is similar; all water is a calcium-bicarbonate type with average specific conductances of 270µS/cm for wells and 371 µS/cm for springs at site J. Theaverage specific conductance for background sites is 378 µS/cm.
There are some differences in trace-element concentra-tions. Wells in the ash have mean concentrations for lithiumand manganese that are at least one order of magnitude aboveaverage background values (Table 2). Pore water, analyzedby Battelle Pacific Northwest Laboratories, was at least oneorder of magnitude greater than background values for bo-ron, iron, manganese, and zinc (Table 3). Downgradientsprings at site J show no elevated metal concentrations (Table1).
Table 8 summarizes constituents for which concentrationsexceeded maximum contaminant levels (MCL’s) or second-ary maximum contaminant levels (SMCL’s) established bythe U.S. Environmental Protection Agency in at least onesample. Arsenic concentration exceeded the MCL for one ofthe samples that was collected in well D. Iron and manga-nese concentrations exceeded SMCL’s in some pore-water
samples. No constituents from the downgradient springs atsite J exceeded established MCL’s or SMCL’s. The closed-out ash pond appears to have no adverse impact on waterleaving downgradient springs.
Active Ash-Pond Flow System. Water in the active ashpond is similar in major-ion composition to Lake Cumber-land. Specific conductance values are 156 µS/cm in LakeCumberland and 219 µS/cm in the active ash pond. Waterdischarging from the downgradient springs at site H is inter-mediate in composition between lake water and backgroundwater, indicating mixing of water along the flow path. Themean specific conductance in the downgradient springs(319 µS/cm) is slightly lower than background values(378 µS/cm) because of the mixing effect in the system.
Ash-pond water has concentrations of barium, boron,manganese, and lithium (Table 5) that are approximatelyone order of magnitude greater than lake-water concentra-tions. Pore waters, analyzed by Battelle Pacific NorthwestLaboratories, have concentrations of As, B, Fe, Li, Mn, V,and Zn (Table 6) that are approximately one to two orders ofmagnitude greater than background ground-water concentra-tions. Water-quality analyses indicate that springs at site Hcontain similar concentrations of dissolved metals as back-ground sites (Table 4).
Table 9 summarizes concentrations of constituents thatexceeded established MCL’s and SMCL’s in at least onesample. The mean value for manganese in the active pondslightly exceeded the SMCL. Most pore-water samples ex-ceeded the MCL for arsenic. Iron and manganese exceededSMCL’s for some pore-water samples. No constituents inthe springs at site H exceeded established MCL’s or SMCL’s.Although near an active ash-disposal facility, thedowngradient springs at site H have good water quality.
Coal-Stockpile Flow System. Springs that have been af-fected by runoff from the coal stockpile have much differentwater quality than at background sites. Springs affected bycoal have a calcium-sulfate type water with a high specificconductance (mean=1,472 µS/cm), whereas backgroundwater is a calcium-bicarbonate type. The pH of the coal-stock-pile springs ranges from 2.93 to 7.43, with an average spe-cific conductance of 378 µS/cm.
Concentrations of seven metals (Al, Be, Co, Fe, Mn, Ni,Zn) (Table 7) exceeded background concentrations by at leasttwo orders of magnitude. Concentrations of five metals (Cd,Cu, Au, Li, and S) (Table 7) exceeded background concen-trations by at least one order of magnitude.
Table 10 summarizes concentrations of constituents thatexceeded established MCL’s and SMCL’s in at least onesample. Concentrations for cadmium and chromium exceededMCL’s at spring B4. The concentration of iron exceeds the
Figure 10. Comparison of mean values for major ionsat background sites and values for sites associated withthe coal stockpile.
Cations Anions(Milliequivalents per liter)(Milliequivalents per liter)
Cl
HCO3
SO4
CO3
Cl
HCO3
SO4
CO3
Cl
HCO3
SO4
CO3
CO3
SO4
HCO3
Cl
Background
J springs
(C3, SH, OPC)
(H1, H3, H6, H8, H9, H12)H springs
Coal runoff(A2, B4, B5)
1 2 3 4 5 6 7 8 9 10123456710 89
Na+K
Ca
MgFe
Na+K
FeMg
Ca
Na+K
Fe
Na+K
Ca
MgFe
Mg
Ca
(J2, J3, J5)
Conclusions 17
Conclusions
18
Table 7. Comparison of concentrations of dissolved metals at background sites with concentrations in springs in the coalstockpile. All values in mg/L.
Detection Limit Background Coal Stockpile Comparison of
Constituent KGS Battelle MCL SMCL Mean Maximum Mean MaximumCoal Stockpile to
BackgroundAluminum 0.027 0.3 0.139 48.8 351XAntimony 0.017 < 0.017 < 0.017 sameArsenic 0.028 0.08 0.05 < 0.08 < 0.028 unknownBarium 0.001 0.002 1.0 0.03 0.029 sameBeryllium 0.0005 < 0.0005 0.053 106XBoron 0.006 0.01 0.02 0.058 3XCadmium 0.003 0.01 < 0.003 0.102 34XChromium 0.006 0.02 0.05 0.01 0.033 3XCobalt 0.004 < 0.004 1.23 308XCopper 0.004 0.004 1.0 0.006 0.152 25XIron 0.004 0.005 0.3 0.116 81.9 706XGold 0.004 < 0.004 0.239 60XLead 0.038 0.05 < 0.038 0.042 sameLithium 0.006 0.004 < 0.006 0.130 22XManganese 0.001 0.002 0.05 0.01 6.79 679XNickel 0.012 0.02 < 0.02 2.1 105XPhosphorus 0.06 0.1 < 0.1 0.281 3XSelenium 0.052 0.01 < 0.052 < 0.052 sameSilicon 0.02 0.02 1.66 7.01 4XSilver 0.003 0.05 < 0.003 < 0.003 sameStrontium 0.0008 0.002 0.276 0.866 3XSulfur 0.05 12.9 236 18XThallium 0.026 < 0.026 < 0.026 sameTin 0.026 < 0.026 0.066 2.5XVanadium 0.003 0.01 0.01 0.004 lessZinc 0.002 0.02 5.0 0.008 1.44 180X
Maximum values are used for comparisons where mean values are not calculated.Mean values are not calculated where constituent values are below detection limits.

Conclusions 19
Table 8. Summary of monitored locations associated with the closed-out ash pond with constituents that exceed MCL's orSMCL's.
ConstituentMCL or SMCL
(mg/L)Downgradient J Springs
(J2, J3, J5)Closed-Out Pond
Pore WaterAsh Wells (C89BW, C89CW, C89DW)
arsenic 0.05 1 of 2 samples (C89DW )barium 1.0cadmium 0.01
Exceed chromium 0.05MCL lead 0.05
selenium 0.01silver 0.05fluoride 2.2
copper 1.0iron 0.3 2 of 20 samples
Exceed manganese 0.05 10 of 20 samples 2 of 2 samplesSMCL zinc 5.0
total dissolved solids 500sulfate 250chloride 250
Table 9. Summary of monitored locations associated with the active ash pond with constituents that exceed MCL's or SMCL's.
ConstituentMCL or SMCL
(mg/L)
Ash Pond Water (Pond water-N, Pond water-S,
Weir, OTF, NAP)
Active Ash Pond Pore Water
Downgradient H Springs(H1, H3, H6, H8, H9, H12)
arsenic 0.05 11 of 15 samplesbarium 1.0cadmium 0.01
Exceed chromium 0.05MCL lead 0.05
selenium 0.01silver 0.05fluoride 2.2
copper 1.0iron 0.3 5 of 15 samples
Exceed manganese 0.05 3 of 5 samples 10 of 15 samplesSMCL zinc 5.0
total dissolved solids 500sulfate 250chloride 250

Epilogue
SMCL at spring B4. Concentrations of total dissolved sol-ids, sulfate, and manganese exceeded SMCL’s at springs A2and B4.
In general, the coal stockpile has a more adverse impacton ground-water quality in the study area than the ash-dis-posal facilities.
Monitoring Strategy in Karst SystemsSprings and other karst-related features provide effective
ground-water monitoring locations. Because flow may oc-cur along discrete paths rather than as diffuse flow throughporous media, springs are more effective monitoring sitesthan wells. The complexity of conduit systems may result inconduits that do not interconnect, even within a relativelysmall area. Because the exact flow path between the dye in-put and dye detection point is unknown, a well may or maynot intercept the appropriate conduit network. Drilling a se-ries of wells to monitor ground-water flow paths could befinancially burdensome and may not result in monitoringground water emanating from the potential source of con-tamination.
EPILOGUESince this study was completed, several changes have oc-
curred at the site. The waste ash is no longer sluiced to apond, but collected in a dry state and stored in a dry landfill,which is located over the site of the closed-out ash pond.The active ash pond has been closed, and no water is dis-charged from that location. The coal stockpile has been com-pletely changed. An asphalt pad has been constructed, andall runoff from the pad is directed to a holding pond andpumped to an adjacent treatment facility, where the pH isadjusted and the water clarified before being discharged withthe cooling water into Lake Cumberland.
ACKNOWLEDGMENTSWe would like to thank the Electric Power Research In-
stitute, the National Rural Electric Cooperative Association,and East Kentucky Power Cooperative for their monetarysupport of this project; Meg Smath for editing the report;and Mike Murphy for drafting the illustrations.
20
Table 10. Summary of coal-stockpile springs with constituents that exceed MCL's orSMCL's.
ConstituentMCL or SMCL
(mg/L)Coal Stockpile Springs
(A2, B4, B5)arsenic 0.05barium 1.0cadmium 0.01 1 of 3 samples (B4)
Exceed chromium 0.05 1 of 3 samples (B4)MCL lead 0.05
selenium 0.01silver 0.05fluoride 2.2
copper 1.0iron 0.3 1 of 3 samples (B4)
Exceed manganese 0.05 2 of 3 samples (A2, B4)SMCL zinc 5.0
total dissolved solids 500 3 of 4 samples (A2, B4)*sulfate 250 2 of 3 samples (A2, B4)†chloride 250
*Total dissolved solids not available for B4, but specific conductance is 3,640 µS/cm.†Sulfate value is not available for B4, but sulfur is 167 mg/L.
REFERENCES CITED
Bowser-Morner Testing Laboratories, Inc., 1976, Soil androck investigation for proposed fly ash dam, East Ken-tucky Power Cooperative, Cooper station power plant,Burnside, Kentucky: Unpublished engineering report.
Cherkauer, D.A., 1980, The effect of fly ash disposal on ashallow ground water system: Ground Water, v. 18, no.6, p. 544–550.
Elseewi, A.A., Page, A.L., and Grimm, S.R., 1980, Chemi-cal characterization of fly ash aqueous systems: Journalof Environmental Quality, v. 9, no. 3, p. 424–428.
Lambert, T.W., and Brown, R.F., 1963, Hydrologic atlas ofAdair, Casey, Clinton, Cumberland, Pulaski, Russell,Taylor, and Wayne Counties: U.S. Geological SurveyHydrologic Atlas HA-35, 3 sheets.
Lewis, R.Q., Sr., 1974, Geologic map of the Somerset quad-rangle, Pulaski County, Kentucky: U.S. Geological Sur-vey Geologic Quadrangle Map GQ-1196, scale 1:24,000.
Minns, S.A., Sendlein, L.V.A., Dinger, J.S., Currens, J.S.,and Sahba, A.M., 1995, Hydrogeology and ground-watermonitoring of coal-ash disposal sites in a karst terrane,Burnside, south-central Kentucky: Data report: KentuckyGeological Survey, Open-File Report OF-95-03, 42 p.
Quinlan, J.F., and Ewers R.O., 1985, Ground water flow inlimestone terranes: Rationale for a reliable strategy forefficient monitoring of ground water quality in karst areas:Proceedings of the 5th National Symposium on AquiferRestoration and Ground Water Monitoring, p. 197–234.
Sahba, A.M., 1991, The effects of coal-fired power plant ashdisposal upon the groundwater quality of an alluvial sys-tem: Lexington, University of Kentucky, M.S. Thesis, 399p.
Taylor, A.R., Lewis, R.Q., Sr., and Smith, J.H., 1975, Geo-logic map of the Burnside quadrangle, south-central Ken-tucky: U.S. Geological Survey Geologic Quadrangle MapGQ-1253, scale 1:24,000.
References Cited 21

For information on obtaining copies of this publication and other Kentucky Geological Survey maps and publications,call:Publication Sales Office(606) 257-3896View the KGS World Wide Web site at <http://www.uky.edu/KGS/home.htm>
SELECTED WATER RESOURCES PUBLICATIONS AVAILABLE FROM THE
KENTUCKY GEOLOGICAL SURVEYKGS Information Circular 5: Quality of surface water in Bell County, Kentucky, by R.B. Cook, Jr., and R.E.
Mallette, 1981, 11 p. $3.00
KGS Information Circular 37: Water quality in the Kentucky River Basin, by D.I. Carey, 1992, 56 p. $4.00
KGS Map and Chart Series 10: Mapped karst ground-water basins in the Lexington 30 x 60 minute quad-rangle, by J.C. Currens and J.A. Ray, 1996, scale 1:100,000. $5.00
KGS Report of Investigations 9: Effects of longwall mining on hydrogeology, Leslie County, Kentucky; part1: Pre-mining conditions, by S.A. Minns and others, 1995, 37 p. $7.50
KGS Report of Investigations 10: Hydrogeology, hydrogeochemistry, and spoil settlement at a large mine-spoil area in eastern Kentucky: Star Fire tract, by D.R. Wunsch and others, 1997, 49 p. $7.50
KGS Reprint 29: Ordinance for the control of urban development in sinkhole areas in the Blue Grass karstregion, Lexington, Kentucky, by J.S. Dinger and J.R. Rebmann, 1991, 14 p. $2.50
KGS Reprint 30: Stress-relief fracture control of ground-water movement in the Appalachian Plateaus, byJ.A. Kipp and J.S. Dinger, 1991, 11 p. $2.50
KGS Reprint 31: High barium concentrations in ground water in eastern Kentucky, by D.R. Wunsch, 1991,14 p. $2.50
KGS Special Publication 1: Bibliography of karst geology in Kentucky, by J.C. Currens and Preston McGrain,1979, 59 p. $5.00
KGS Special Publication 12: Caves and karst of Kentucky, ed. by P.H. Dougherty, 1985, 196 p. $12.50
KGS Thesis Series 5: Ground-water geochemistry and its relationship to the flow system at an unmined sitein the Eastern Kentucky Coal Field, by D.R. Wunsch, 1993, 128 p. $10.00
U.S. Geological Survey Open-File Report 80-685: A compilation of ground water quality data for Kentucky,by R.J. Faust, G.R. Banfield, and G.R. Willingers, 1980, 963 p. $12.00
U.S. Geological Survey Hydrologic Atlases. Consult KGS “List of Publications” for specific locationsand prices.
U.S. Geological Survey Water-Supply Paper 2202: Chloroform contamination in part of the alluvial aquifer,southwest Louisville, Kentucky, by R.W. Davis and E.W. Matthews, 1994, 25 p. $4.00
U.S. Geological Survey Water-Supply Paper 2254: Groundwater sensitivity regions of Kentucky, Study andinterpretation of the chemical characteristics of natural water, by J.D. Hem, 1994, 263 p., 3 plates $15.00
Kentucky Department for Environmental Protection, Division of Water, Groundwater Branch, map: Ground-water sensitivity regions of Kentucky, 1994, Scale 1:500,000. $7.00