Embed Size (px)
Citation preview

2001, in LaCombe, P.J. and Herman, G.C., Eds. Geology in Service to Public Health, 18th Annual Meetingof the Geological Association of New Jersey, South Brunswick, New Jersey, p. 6-45.
HYDROGEOLOGICAL FRAMEWORK OF BEDROCK AQUIFERS IN THE NEWARKBASIN, NEW JERSEY
Gregory C. Herman, New Jersey Geological Survey
ABSTRACT
Bedrock aquifers of the Newark Basin underlie the most densely populated part of NewJersey and provide critical ground-water resources for commercial, industrial, and domestic uses.Protecting the integrity of these aquifers from ground-water pollution and depletion from over-pumping requires understanding their hydrogeological properties. This paper summarizeshydrogeological research conducted on sedimentary bedrock aquifers in the central part of theNewark Basin in New Jersey. The Brunswick aquifer is redefined based on a systematic analysisand description of the physical characteristics of the rocks comprising the aquifer and themechanisms controlling the occurrence and movement of ground water within them. Previoussedimentalogical, structural, geochemical, and geophysical observations in the scientific literatureare combined with new data to explain some of the physical relationships observed between thegeological framework and ground water hydrology. New visualization tools developed for usewith Geographic Information Systems (GIS) are used to illustrate characteristics of the aquifer atdifferent sites.
INTRODUCTION
New Jersey is blessed with diverse geology that complicates our ability to understand thehydrology of each aquifer system. Environmental-protection efforts focused on the availabilityand quality of ground water often require estimates of the volume, velocity, and direction ofground water moving through geological materials. These parameters are available for aquifersand confining units of the New Jersey Coastal Plain province where bedrock sand, silt, and claylayers are structurally uncomplicated, relatively homogenous and isotropic. However, thenorthern half of the State is underlain by bedrock that has been folded, faulted, and fracturedduring multiple tectonic events spanning hundreds of millions of years. Ground-water flow inthese aquifers typically shows directional unevenness or anisotropic behavior because primarysedimentary, metamorphic, and igneous features and secondary geological structures impart localheterogeneity to the aquifer framework. Our understanding of how groundwater is stored andtravels in these fractured-bedrock aquifers is often limited by our ability to define complex spatialvariations occurring in the aquifer framework. It is necessary to understand the morphology andgeometry of primary and secondary bedrock structures in order to understand how theyinterconnect to store and channel groundwater.
This paper summarizes recent advances stemming from hydrogeological researchconducted in the Newark Basin with a focus on Triassic mudstone and siltstone of the Brunswickaquifer. It attempts to address how geology controls the observed hydrologic response of theaquifer. The focus of the study is in the west-central part of basin where red mudstone andsiltstone of the Passaic Formation underlie a significant part of the province and composes a largepart of the Brunswick aquifer (Fig.1). The topic is developed by first reviewing the geologicalsetting and tectonic framework of the basin. This provides the basis for further examining thelocal hydrogeologic framework from both a sedimentalogical and structural viewpoint. Theaquifer hydrogeology is then further defined using rock core and geophysical logs from wellfields. Together, these data provide the basis for portraying some two- and three-dimensionalhydrogeological aspects of the Brunswick aquifer.

2
GEOLOGICAL SETTING
The Newark basin is a tectonic rift basin covering about 7500 km2 extending fromsouthern New York across New Jersey and into southeastern Pennsylvania (Fig. 1). The basin isfilled with Triassic-Jurassic sedimentary and igneous rocks that are tilted, faulted, and locally
folded (see summaries in Schlische, 1992; and Olsen and others, 1996). It is the largest, best-exposed, and most studied Mesozoic-aged basin in a series of such basins extending fromNewfoundland, Canada, to the southeast U.S.A (Schlische, 1992). Most tectonic deformationoccurred during the Late Triassic to Middle Jurassic (Lucas and others, 1988; de Boer andClifford, 1988). Multiple tectonic phases are thought to have affected the basin based onstratigraphic, paleomagnetic, and radiometric data. As summarized by Schlische (1992), theNewark basin probably evolved from a series of smaller, isolated sub-basins occurring alongseveral normal fault segments early in the Late Triassic. As continental extension continued the
Figure 1. Generalized bedrock geology map of the Newark Basin with location of faults,Jurassic dikes, and sedimentary facies correlated to aquifer zones. Map compiled fromgeographic information system coverage for New Jersey (1:100,000 scale, NJ GeologicalSurvey, 2000), New York (1:250,000 scale, www.nysm.nysed.gov/data/lhud_bedr1a.zip)and Pennsylvania (1:250,000 scale, Pennsylvania Geological Survey written communication,February 2000). SC – sandstone and conglomerate facies, SS – sandstone and siltstonefacies, NBF – New Brunswick fault system, HF – Hopewell fault system, FF – Flemington-fault system. Index map of Mesozoic basins on the East Coast adapted from Schlische(1993).

3
basin grew in width and length and the sub-basins merged to form the Newark basin. LateTriassic sediments record a transition from braided and meandering stream deposits (StocktonFormation) into lakebed and associated mudflat deposits (Lockatong and Passaic Formations).The variation in thickness of Triassic sediment in the basin reflects syndepositional fault activityand along-strike variation in displacements along both intra-basin and basin-bounding faultsystems. Tectonism probably intensified during the latest Triassic into the Newark Basin asburied valleys, till plains, upland surfaces, and fluvial terraces and scarps (Stanford, 2000;Stanford and others, 2001).
Two dominant structural trends occur in the central part of the Newark Basin (Herman,1997). The first is subparallel with the basin’s northwest, faulted margin and the second issubparallel with the trend of the intra-basin faults and diabase dike swarms (Fig. 1). The threemajor intra-basin fault systems, the Flemington, Hopewell, and New Brunswick, are complexarrangements of isolated, interconnecting- and spay-fault segments (Schlische, 1992; Houghtonand others, 1992; Drake and others, 1996). Gently plunging bedding folds trending normal tofault strike occur at varying scales along these fault systems, and reflect variations in dip slipmovements along the length of individual and coalesced fault segments (Schlische, 1992).
HYDROGEOLOGIC UNITS
Herman and others (1999) divided Triassic-Jurassic bedrock in the Newark Basin part ofthe Piedmont physiographic province of New Jersey into five primary aquifers including theStockton Formation, Lockatong Formation, the Brunswick aquifer, basalt, and diabase. However,these are informal aquifer designations lacking the defined hydrogeological framework suggestedby the U.S. Geological Survey guidelines for naming aquifers (Hansen, 1991). Since then,LaCombe (2000) introduced the Stockton and Lockatong aquifers from mapping detailedhydrogeological units underlying the Naval Air Warfare Center in West Trenton, New Jersey.The Brunswick aquifer is formally defined here with a detailed description of its hydrogeologicframework.
Numerous geologic, mineral resource, and ground water studies conducted in the NewarkBasin over the past century have resulted in a variety of rock-stratigraphic and hydrogeologic unitdesignations for the Late Triassic and Early Jurassic clastic sedimentary rocks overlying weaklymetamorphosed argillites of the Lockatong Formation. Most reports published during the latterpart of the 20th century relied on some form of the ‘Brunswick’ prefix, stemming from Kummel’s(1898) report on the Newark System of New Jersey. In this report, Kummel variously refers tothe series of shale, sandstone, and conglomerate beds overlying of the Lockatong series as the‘Brunswick beds’, ‘Brunswick shales’, and ‘Brunswick series’. Subsequent usage includes theBrunswick Formation (Bascom and others, 1931; Herpers and Barksdale, 1951) and theBrunswick Shale (Vecchioli and Palmer, 1962;Vecchioli, 1965; 1967, and Vecchioli and others;1969). Olsen (1980) redefined the Newark System as the Newark Supergroup, reassigning rocksof the former Brunswick series into the Passaic, Feltville, Towaco, and Boonton Formations (Fig.2). Lyttle and Epstein (1987) include all rock-stratigraphic units overlying the LockatongFormation in the Brunswick Group on the Newark 1o x 2 o geologic map. This designation wasalso used on the 1 to 1:00,000 scale geological map of New Jersey (Drake and others, 1996;Owens and others, 1998). However, a formal revision of lithostratigraphic groups within theNewark Supergroup by Weems and Olsen (1997) supercedes the usage of ‘Brunswick Group’ anddivides rocks of the Newark basin into three new groups based on a regional stratigraphiccorrelation (Fig. 2). Spayd (1985) introduced the term ‘Brunswick aquifer’ with inference to theBrunswick Formation. Herman and others (1999) included all sedimentary rock formationsoverlying the Lockatong Formation in the Brunswick aquifer. A standard nomenclature for theBrunswick aquifer is therefore needed to help reduce confusion arising from various usage of the

4
Figure 2 Correlation of time, rock-stratigraphic, and hydrostratigraphic units in the NewarkBasin, New Jersey. Location of stratigraphic details shown in Figs. 4 and 6 indicated next tothe left of the hydrogeological-units column.

5
‘Brunswick’ prefix, and to set a standardized frame of reference for mapping aquifer zones andcompiling hydraulic parameters in the study of ground-water resources.
The Brunswick aquifer is here defined as the hydro-stratigraphic equivalent of the rock-stratigraphic Brunswick Group as defined by Lyttle and Epstein (1987, Fig. 2). This departs fromprevious designations that exclude the Orange Mt. Basalt, Preakness Basalt, and Hook Mt. Basalt.The Brunswick is a regional aquifer that can be characterized on a local level. Water-bearing andconfining units identified in local investigation lack the regional continuity to map the Brunswickas a regional aquifer system. The U.S. Geological Survey guidelines for naming aquifersaddresses instances when a rock-stratigraphic sequence behaves hydraulically as a single aquiferand not an aquifer system, even though thin continuous “confining units” are part of the aquifer(Hansen, 1991). This approach is employed here in proposing a standardized nomenclature forthe Brunswick aquifer.
Eight zones are proposed for the Brunswick aquifer to facilitate aquifer mapping andcataloguing of aquifer parameters for the New Jersey part of the basin. These include four zonesin the central part of the basin underlain by fine-grained clastic rocks (Fig. 2), three zones in the northeastand northwest parts of the basin underlain by coarse-grained clastic rocks (Fig. 1), and a zone comprised ofinterlayered Jurassic basalt and clastic rocks (Figs. 2). The four zones in the central part of the basininclude, in ascending order, a lower gray, lower red, middle gray, and middle red zones (Fig. 2). Strata inthese zones show a pronounced cyclicity that facilitates aquifer subdivision (Olsen and others, 1996). Thelower gray zone contains cycles of red, gray, and black mudstone and siltstone beds that correlate with thelowermost Passaic Formation from the contact with the Lockatong Formation to the top of the NeshanicMember. The lower red zone mostly contains red mudstone and siltstone that correlates to part of thePassaic Formation from the top of the Neshanic Member to the base of the Kilmer Member. The middlegray zone contains cycles of red, gray, and black mudstone and siltstone and correlates to part of thePassaic Formation from the base of the Kilmer Member to the top of the Ukrainian Member. This sequenceforms a distinct set of bed-strike parallel topographic ridges resulting from differential erosion of the red,gray, and black beds (Fig. 3). The middle red unit is mostly composed of red mudstone and micaceoussiltstone, with minor gray beds. It correlates with the upper part of the Passaic Formation from the top ofthe Ukrainian Member to the base of the Orange Mt. Basalt. The igneous and sedimentary rocks overlyingthe Passaic Formation are included in the Watchung zone. This zone is mostly restricted to the area nearthe Watchung Mountains but also crops out as small outliers along the Flemington fault system (Houghtonand others, 1992). Basalt in the Watchung zone can serve either as local water-bearing units for domesticwater supplies, or as confining units for adjacent mudstone and siltstone water-bearing units.
Three zones composed of coarse-grained sedimentary rocks occur in the northeast andnorthwest parts of the basin (Fig. 1) and correlate with mapped lithostratigraphic facies of theBoonton, Passaic Formation, Lockatong, and Stockton Formations (Drake and others, 1991).Diabase intrudes the Brunswick and Lockatong aquifers at various places in the basin (Fig. 1).Diabase can act as a localized water-bearing unit for domestic water supplies, or as confiningunits for adjacent mudstone and siltstone water-bearing units when intruded as igneous sills.Diabase dikes can act as lateral ground-water flow boundaries. The nomenclatures for waterbearing and confining units in sedimentary rocks of the Brunswick aquifer should use acombination of lithology and color adjectives (Table 1).
Bedrock maps show many lateral and vertical facies changes for sedimentary rockscomprising the Brunswick aquifer (Drake and others, 1996;Olsen and others, 1998). Five primarylithologies include shale, mudstone, siltstone, sandstone, and conglomerate. Adjectives used todescribe water-bearing zones and confining units should reflect these primary lithologies. Theterm ‘shale’ is defined as a laminated, indurated rock with >67% clay-sized minerals (Jackson,1997). Its use should be restricted to rocks showing a pronounced bedding fissility. Van Houten(1965) and Smoot and Olsen (1988) have shown that a significant fraction of the rock stratacomposing the Brunswick aquifer is massive mudstone and siltstone rather than shale. Accordingto Smoot and Olsen (1988), the term ‘massive’ is used “… in a broad sense, encompassing rocksthat tend to have a blocky or hackly appearance on a weathered outcrop and that show little

6
obvious internal structure on superficial examination”. Shale-like bed partings often develop inthese massive rocks from prolonged weathering near the surface. Although shale is embedded inthe literature and existing databases, ‘mudstone and siltstone’ should be used in its place.
Table 1. Descriptive modifiers for designating water-bearing zones and confining units insedimentary rocks of the Brunswick aquifer
Color ModifiersRed Gray Black
Textural ModifiersShale X X XMudstone X XSiltstone X XSandstone X XConglomerate X X
Color adjectives should be restricted to ‘red’, ‘gray’, and/or ‘black’. Gray and black‘beds’ mapped in the basin are typically sedimentary sequences of gray, dark gray, and blacklaminated to thin-bedded mudstone seldom exceeding a couple meters in stratigraphic thickness.Other colors of mudstone, siltstone, and sandstone are reported in drilling records and mapdescriptions (such as brown, yellow and green shale) but are included in the ‘gray’ unitdesignation as they represent weathered variations of the gray and black beds. Black beds areusually mapped as part of the gray beds on geologic maps but it is important to note themseparately. For example, unusually high concentrations of naturally occurring radioactivity andarsenic have been reported from black beds in the Newark Basin (Szabo and others, 1997; Serfesand others, 2000). Black mudstone may also locally confine adjacent red and gray water-bearingunits based on outcrop observations and unpublished hydrogeological reports. Therefore, notingblack mudstone units in the Brunswick aquifer facilitates ground-water-quality studies and mayprove useful for compiling and screening aquifer parameters. After excluding a few improbablecombinations, about a dozen likely combinations of descriptive modifiers can be expected fromusing these three colors and four textures when categorizing water-bearing and confining units insedimentary bedrock of the Brunswick aquifer. For example, if drilling records report water-bearing intervals associated with red and gray mudstone and siltstone, then the unit designation is‘red and gray mudstone and siltstone water-bearing unit of the Brunswick aquifer’. Similarly, if aconfining unit is reportedly composed of gray and black mudstone, then the unit is recorded as a‘gray and black mudstone confining unit in the Brunswick aquifer’.
HYDROGEOLOGICAL FRAMEWORK OF MUDSTONE AND SILTSTONE UNITS
Fracture systems have been suggested to dominantly control ground water flow insedimentary-rock aquifers of the Newark Basin because ground water preferentially flows alongbedding strike (Vecchioli and others 1969, Spayd, 1985; Boyle, 1993; Michalski and Britton,1997). Michalski and colleagues published a series of manuscripts over the past decade definingthe Leaky Multi-Layer Aquifer System (LMAS) model for Triassic mudstone and siltstone of thePassaic Formation. This model is used for outlining useful approaches when conductinghydrogeological investigations at ground-water pollution sites (Michalski, 1990; Michalski andKlepp, 1990; Michalski and Gerber, 1992; Michalski and others, 1992; Michalski and Britton,1997). Their work is widely regarded as the standard reference for framework characterizationand hydrogeological investigations throughout the basin. The LMAS applies to unweathered

7
bedrock where gently inclined bedding ‘partings’ with the greatest hydraulic apertures act asmajor, discrete aquifer units. These transmissive intervals are reported as being non-uniformlydistributed over vertical distances ranging from about 9 m to more than 45 m and separated by
thick, leaky intervals. Overburden and weathered bedrock provide storage and pathways forground waters recharging the underlying LMAS. Important revisions and refinement to thishydrogeological model are introduced here based on borehole geophysics and the geologicalanalyses of bedrock outcrops, excavations, and rock core.It is tempting to infer a direct correlation between repetitively spaced water-bearing intervals inthe Brunswick aquifer and sedimentary cycles identified in these same rocks. However, thiscorrelation is not easily made. Spatial variations in the hydrogeologic framework reflect varyingstratigraphic, structural, and chemical controls occurring in three dimensions. Some of thesefactors are discussed below along with specific examples of the local hydrogeologic framework.
Figure 3. Shadedrelief map of the areabetween RoundValley reservoir andSourland Mountainin the central part ofthe Newark Basin,New Jersey. Theregionalhydrostratigraphicunits of theBrunswick aquifercorrelate withpronouncedtopographic ridgesand illustrate howthe distribution ofbedrock influencestopographic relief.db –diabase, sf –Stockton Formation,lf – LockatongFormation, ba-Brunswick aquifer,cg – conglomerate,rv – Round Valleyreservoir.Location of mapshown in Figure 1.

8
Cylostratigraphy of Lacustrine Mudstone and Siltstone
The succession of lacustrine sedimentary rocks within the Lockatong and Brunswick aquifersreflects a gradual climatic change over a 30 million-year period from arid conditions in a narrowbasin to sub-humid conditions in an broad basin (Smoot and Olsen, 1994). Sediments depositedin deep lakes with dry, saline mudflats are gradually succeeded upwards by sediments depositedin shallow lakes with wetter, vegetated mudflats (Fig. 2). Superimposed on this succession are aseries of graduated sedimentary cycles that reflect the rise and fall of lake level, largely inresponse to periodic climatic changes occurring over tens of thousands to millions of years (VanHouten, 1962; Olsen, 1986; 1988). The basic rock-stratigraphic cycle is the ‘Van Houten’ or‘precession’ cycle (Olsen, 1986; Schlische, 1992). It marks the successive, gradationalaccumulation of mudstone and siltstone during transgressive, high-stand, and regressive lakestages controlled by a 21,000-year precession cycle of the earth’s axis (Van Houten, 1962).Precession cycles are arranged in a series of larger-order compound sedimentation cyclesresulting from orbital variations occurring over 109,000, 413,000, and ~2,000,000 year periods.Some of the characteristics of the precession cycle are briefly recounted here to illustrate howmassive mudstone is distributed within parts of the Brunswick aquifer.
A typical precession cycle (~21,000 years) in the Lockatong Formation and lower part ofthe Passaic Formation includes three recognized sequences:
1) a lower thin-bedded calcareous mudstone and siltstone deposited in shallow,transgressive waters,2) a middle finely-laminated to thin-bedded, organic-rich black and gray mudstone,siltstone, or limestone deposited in deep, high-stand waters, and3) an upper thin-bedded to massive mudstone, siltstone, and sandstone deposited inshallow, regressive waters during low-stand periods where the lake was at leastoccasionally dry with incipient soil development in a subaerial environment.
Average thickness of a precession cycle generally increases upward in the basin, reflecting agradual upward increase in sediment-accumulation rates over time. However, cycle thickness atthe same stratigraphic level varies in the basin, probably in response to a combination of tectonicand climatic controls (Schlische and Olsen, 1990; Schlische, 1992). Cycle thickness increasefrom the hinged and lateral basin margins inward toward the center (Schlische, 1992). Generally,the Lockatong precession cycles are about 2 to 7 m thick. The Passaic cycles vary from about 3to 10 m thick. The Jurassic lacustrine cycles are thickest in the basin, from about 11 to 25 m(Schlische, 1992). Identifying precession cycles in the lower and middle red zones of theBrunswick aquifer is complicated by the abundance of red beds with few gray and black markerbeds (Fig. 2). These zones are thick successions of red beds deposited during prolonged aridconditions arising from the larger-order climate cycles.
Massive mudstone beds make up a large portion of the sedimentary formations in theBrunswick aquifer (Smoot and Olsen, 1985; 1994). Their geological and geophysical propertiesare therefore important when addressing the aquifer framework. Four types of massive mudstoneinclude mud-cracked, burrowed, root-disrupted, and sand-patch varieties (Smoot and Olsen,1988). They represent end members having dominant, distinctive fabrics that relate to specificdepositional cycles (Smoot and Olsen, 1994). A detailed discussion of these varieties, sub-varieties, and related depositional cycles is beyond the scope of this paper but it is important toreport some fundamental concepts and provide a basis for further examining the hydrogeology.
Mud-cracked and burrowed mudstone is mostly restricted to the Lockatong aquifer andlower gray part of the Brunswick aquifer and represents deposition on dry or occasionally wettedmudflats (Smoot and Olsen, 1994). Root-disrupted mudstone becomes progressively more

9
abundant upwards through the Brunswick aquifer (Fig. 4) and represents deposition on wetmudflats having periodic, fresh, ground-water tables (Smoot and Olsen, 1994). Sand-patch
Figure 4. Details of twostratigraphic sequences in
the middle gray (a)and middle red (b) zones ofthe Brunswick aquifershowing key lithologies andthe distribution of massive,root-disrupted mudstone inVan Houten cycles. Adaptedfrom Smoot and Olsen(1994). Location of thestratigraphic interval coveredby the sections shown in Fig.2.

10
mudstone represents deposition on saline, salt-encrusted mudflats and is relatively scarce in theBrunswick aquifer. All varieties of mudstone locally contain assemblages of millimeter tocentimeter scale crystal casts, and linear to ovate syndepositional sedimentary features filled withsecondary, sparry cements locally including calcite, gypsum, analcime, albite, potassium feldspar,and dolomite (Van Houten, 1965; Smoot and Olsen, 1994). Calcite and gypsum are mostabundant in the Brunswick aquifer and commonly form nodules and fill vesicles, evaporite-crystal casts, desiccation cracks, root structures, and tectonic veins. Examples of these features inthe Brunswick, Lockatong, and Stockton aquifers are reported below from outcrop mapping anddifferent hydrogeologic investigations in the central part of the basin.
Hopewell Borough Well No. 6 Hydrogeologic Investigation
Hopewell Borough sited a new public-community water supply well in 1993. Boroughsupply well No. 6 was drilled in 1995 with two monitoring wells located about 17 m alongbedding strike to the northeast (Obs-1) and about 88 m down-dip to the northwest (Obs-2, Fig. 5).Ground-water-quality testing and analyses for well No. 6 indicated levels of dissolved arsenic atjust below the current ground-water quality criteria for drinking water. The NJ Geological Surveyobtained a 400 foot continuous rock core (HBCH-1) alongside well Obs-1 during the summer of1999 to investigate the source, mobilization, and transport of naturally occurring arsenic as part ofa regional study (Serfes and others, 2000). A 3m section of the rock core was scribed andoriented during drilling so that the strike and dip of bedding and fractures logged in the corecould be determined. An important ground-water transport mechanism within massive mudstoneand siltstone became immediately apparent from this work.
Core HBCH-1shows multiple high-porosity intervals occurring within red, root-disruptedmudstone from the dissolution and removal of secondary, soluble minerals that once filled relict
Figure 5a. Location of the Hopewell Boroughhydrogeological investigation of water supplyWell No. 6. Well No. 6 is shown in relation tonearby observation wells and stratigraphicbedding orientations on a 7-1/2’ topographic base.
Figure 5b. Figure 5b shows thedrilling of core HBCH-1 in betweenwells No.6 and Obs-1.

11
root structures (Figs. 6, 7, and 8). Mineral-dissolution cavities form open, tubular conduits forfluid moving within gently dipping beds. Ground water flow was directly correlated todissolution zones mapped in the core and well Obs-1 through the use of fluid-temperature logsand optical borehole imaging (Figs. 8,9, and 10). It is unclear why some root-disrupted intervalsare prone to dissolution while others are not. However, fluid-temperature logs from well Obs-1under both static and pumping conditions show that the hydraulic continuity of these dissolutionzones varies over distances of less than 20 meters (Fig. 10). Ground-water flow zones were notedin the open interval of Obs-1 where sharp, positive fluid-temperature anomalies of about 1o Cwere induced by flushing water upward from the bottom of the core hole while logging Obs-1(Fig. 10). Other fluid-temperature disturbances in Obs-1 were noted from pumping well No. 6 atabout 125 gpm, but many times these anomalies occurred at different depths and produced sharp,
negative temperature anomalies (Fig. 10). About half of all of these flow zones directly correlateto intervals of conspicuous mineral dissolution noted in the nearby core. The remainder eithercorrelate to bed-parallel root zones logged in the core or stratigraphic contacts between mudstoneand siltstone units. A flow zone in Obs-1 at a 73m corresponds with a stratigraphic boundarybetween massive siltstone and mudstone units (Fig. 10). A decreasing step of ~4 Ohm-m fluidresistivity also corresponds to this boundary when pumping well No. 6 (Fig. 10). This indicatesthat flow zones related to mechanical layering locally carry elevated concentrations of dissolvedsolids that are separate and different from adjacent water-bearing zones. It is also interesting thatlarge spans of highly fractured rock show no fluid-temperature or fluid-resistivity anomalies (Fig.10). This aspect is elaborated below.
Mineral-dissolution zones in well No. 6 occur as linear conduits aligned in stratigraphicplanes. Although the 3-dimensional geometry of these conduits is unknown, they may resemblestream and karst systems, with hierarchies of branching and coalescing segments reflectingstructural control (Ackermann, 1997). The flow volume into or out of well bore would thenreflect the hierarchical order of dissolution zone intercepted by drilling. This also helps account
Figure 6. Detailed geological log of core holeHBCH-1 near Hopewell Borough Well No. 6.Location of the stratigraphic interval covered by the core hole shown in Fig. 2. sz – shear zone,T.D. – total depth

12
for variations in aquifer parameters and contaminant concentrations reported and observed in theNewark Basin. For example, typical transmissivity values for mudstone and siltstone units in theBrunswick aquifer range between 5 to 180 m2/day (Michalski, 1990; Spayd, 1998; Carleton andothers, 1999; Lewis Brown and dePaul, 2000). Transmissivity values of individual water-bearingunits can locally range over three orders of magnitude (Lewis Brown and dePaul, 2000) withmaximum reported values over 900 m2/day (Michalski and Britton, 1997. Targeting astratigraphic horizon that is known to locally produce water nearby can therefore result in drillinga unproductive well when the borehole fails to encounter significant branches of these linear flowsystems.
Figure 7. Images of core HBCH-1 from the Hopewell hydrogeological investigationshowing linear- to ovate mineralized (light-colored) root structures, bed-parallel root zones,and associated dissolution cavities (dark pores in Fig. 7a, 7b, and 7d) at different depths.Grayish red (5R4/2 to 10R4/2) mudstone is commonly bleached from reduction to yellowishgray (5Y7/2) near root structures (7c and 7d). Features shown in the images correspond tofeatures profiled in Figure 6.
Figure 7aHBCH-1 @
Figure 7cHBCH-1 @ 77m
Figure 7dHBCH-1 @ 40m
Bed-parallel “lattice”root zones withbleached matrix
Downward-tapering root
structures
Bed-parallel
mineralized
Root zoneswith
dissolutionporosity
Figure 7bHBCH-1 @ 99
Root zoneswith
dissolutionporosity
13
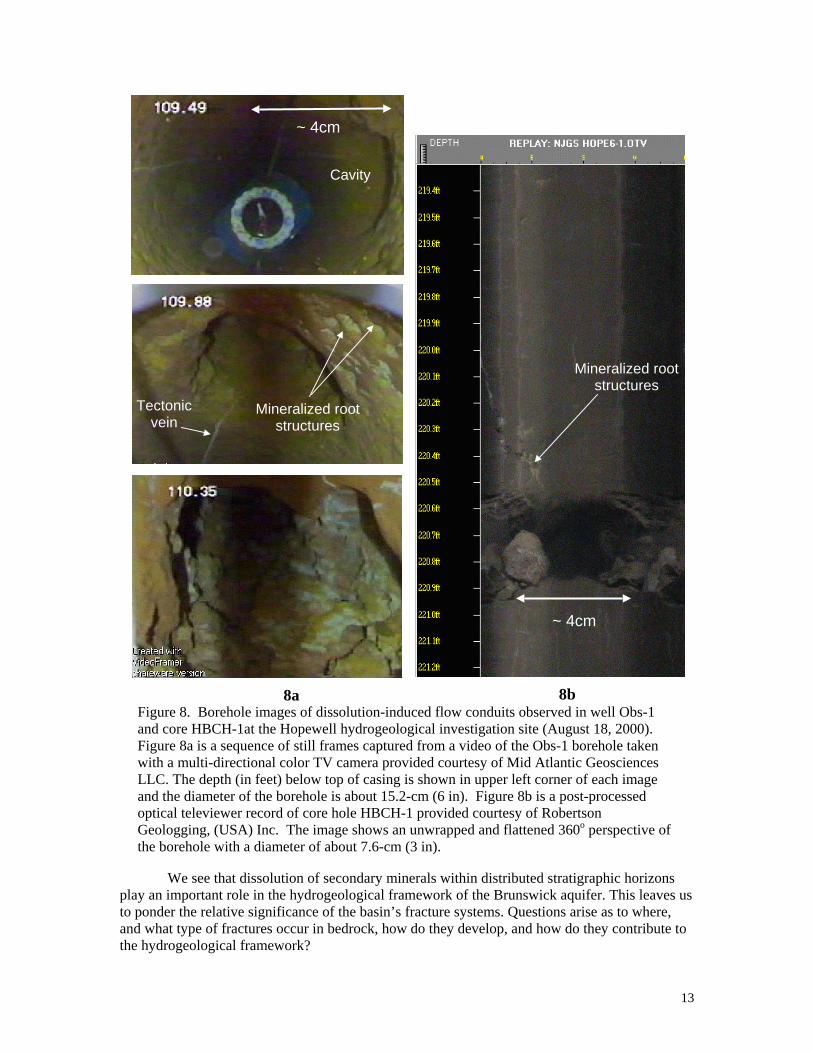
We see that dissolution of secondary minerals within distributed stratigraphic horizonsplay an important role in the hydrogeological framework of the Brunswick aquifer. This leaves usto ponder the relative significance of the basin’s fracture systems. Questions arise as to where,and what type of fractures occur in bedrock, how do they develop, and how do they contribute tothe hydrogeological framework?
Figure 8. Borehole images of dissolution-induced flow conduits observed in well Obs-1and core HBCH-1at the Hopewell hydrogeological investigation site (August 18, 2000).Figure 8a is a sequence of still frames captured from a video of the Obs-1 borehole takenwith a multi-directional color TV camera provided courtesy of Mid Atlantic GeosciencesLLC. The depth (in feet) below top of casing is shown in upper left corner of each imageand the diameter of the borehole is about 15.2-cm (6 in). Figure 8b is a post-processedoptical televiewer record of core hole HBCH-1 provided courtesy of RobertsonGeologging, (USA) Inc. The image shows an unwrapped and flattened 360o perspective ofthe borehole with a diameter of about 7.6-cm (3 in).
Bed-parallelmineralizedroot zone
Figure 8a
Mineralized rootstructures
~ 4cm
~ 4cm
Mineralized rootstructures
Cavity
Tectonicvein
8b8a

14
Obs-1 Geophysical Logs HBCH-1 Geophysical andStratigraphic Logs
Figure 9. Correlation of geophysical logs for Obs-1and corehole HBCH-1 with stratigraphiccolumn for core HBCH-1. Discrepancy in depth correlation starting about 40m attributed tosub-vertical drift of the core hole and localized dip-slip faulting along small shear zone (sz).Note the correlation between enlarged borehole intervals in the caliper log and the location ofmineral dissolution zones (dz) mapped in the core. Stratigraphic details and key to symbols arethe same as for Figure 6.

15
HBCH-1 Stratigraphic logand 3D-fracture display
Obs-1 Geophysical Logs
Figure 10. Comparison of fluid temperature and fluid resistivity logs for well Obs-1during static and pumping conditions with stratigraphic and fracture logs for core HBCH-1. Fluid temperature anomalies recorded in Obs-1 stem from flushing water in the nearbycore hole and pumping well No. 6. A good correlation exists between fluid temperatureanomalies in Obs-1 and mineral-dissolution zones logged in the core. Positive fluidtemperature anomalies result from flushing the core hole whereas negative anomalies areproduced from pumping well No. 6. About half of all fluid-temperature anomaliesdirectly correlate with stratigraphic intervals showing dissolution-enhanced porosity in thecore located about 15 m along bedding strike. The remainder correlate with mechanicallayering between mudstone and siltstone units or mineralized root zones not showingevidence of dissolution in the core. Stratigraphic details and key to symbols same as forfigure 6. dz – dissolution induced flow zone, ml – mechanical layering boundary,lrz – lattice root zone

16
FRACTURE SYSTEMS
Most hydrogeologic reports focus on the bed-parallel fractures and tectonic ‘joints’occurring in the basin. However, these features comprise only part of the diverse set fractures inthe basin resulting from a variety of low-temperatures tectonic processes, erosion, andweathering. Detailed aspects of the tectonic fracture systems are reported below. How fracturesresulting from erosion and weathering contribute to the hydrogeologic framework remainssketchy but is conceptualized in the following section. Three tectonic fracture orientations mostoften reported in the basin include a low-angle set of bed-parallel partings and two steeplyinclined, systematic joint sets striking sub-parallel to and sub-normal to bedding strike (Vecchioli,1965; Houghton, 1990). Detailed structural mapping in the central part of the basin shows that aminimum of four steeply dipping, systematic fracture sets occurs here (Fig. 11).
The two most frequent sets strike subparallel to border faults along the basin's northwestmargin (about N35oE to N50o E, Fig. 1) and to intra-basin faults and regional dike swarms (aboutN15o to N30 o E, Fig. 1). Other subordinate sets of curviplanar cross-joints strike atcomplimentary angles to the fault-parallel sets so that at least four different orientations of steeplyinclined fractures commonly crop out in the basin, many times at a single location. Other sets ofless-frequent fractures occur near intrusive igneous bodies and in gently folded rocks (Herman,1997). The morphology and geometry of the primary fracture sets display both tensional and
Figure 11. Index map (above) shows thelocation of a detailed fracture study (shadedarea), major faults, 7.5-minute quadrangles, andcounties. Quadrangle abbreviations include PT(Pittstown), FG (Flemington), ST (Stockton),HW (Hopewell), LB (Lambertville), and PN(Pennington). County abbreviations include H(Hunterdon), S (Somerset), and M (Mercer).Standard histogram plots (right) compare trendfrequencies for fault traces, non-beddingfractures, bed-parallel fractures, and fold tracesin the study area. Gray lines bracket twodominant sets of non-bedding fractures tofacilitate comparisons. Adapted from Herman(1997).

17
shear strains (Figs. 12, 13, and 14). They classify as joints when the two sides of the fractureshow no differential displacement (relative to the naked eye), as healed joints when the fracturewalls are completely or partially joined together by secondary crystalline minerals, or as tectonicveins when a considerable thickness (> 1mm) of secondary minerals fill the space betweenfracture walls (Ramsay and Huber, 1987).
Secondary crystalline minerals including calcite, gypsum, chlorite (Szabo and others,1997) and quartz precipitated from saturated fluids moving through matrix pores into openingvoids between fracture walls. Calcite and gypsum commonly occur as mineral fibers alignedperpendicular to the fracture plane (Fig. 12). Remnant splinters of the host rock are encased asinclusion bands within the mineral filling. This indicates that small veins can repeatedly coalesceinto larger ones reflecting progressive, incremental strain. Two parallel sets of mineral fiberstypically meet along a central suture line (Fig. 12a) and therefore display syntaxial morphology(Durney and Ramsay, 1973). This results from mid-point fracturing and secondary crystal
~3 mm
Inclusionband
12a
Suture
Suture
12b
enecheloncracks
Bedding
Bridge
Figure 12. Morphology of diltatant en echelon cracks (DECs). DECs are mostly filled withcalcite fibers having centralized suture lines indicating mineral-fiber growth accompanyingdilation (Fig. 12a). Remnant splinters from the host rock are locally preserved as ‘inclusionbands’ (Fig. 12a) within mineral fibers or as bridges (Fig. 12b between adjacent veinsoccurring in en echelon alignment (Fig. 12b). These features indicate that many individualcracks have coalesced through growth, and document a progressive strain history with thebasin rocks subjected to simultaneous tension and shear strains.

18
growth from the wall toward the vein center; minerals grow outward from the fracture walls andheal the cracks as they form. Individual veins display a stepped geometry with overlapping,subparallel rows, having en echelon alignment (Fig. 12 and 13). Sets of stepped veins arethemselves arranged in conjugate arrays (Figs. 13 and 14) having the geometry of shear zones(Ramsay and Huber, 1983; Groshong, 1988). The dominant systematic sets of fractures thereforeoriginated as hybrid shear fractures (Engelder, 1999) rather than simple extension fractures(Groshong, 1988). The two sets of systematic tectonic veins are referred to as dilatant en echeloncracks (DEC) in the remainder of this manuscript to facilitate discussion.
A detailed orientation study of DECs striking between N15oE to N30oE was conducted ina ~50km2 area in the Flemington fault hanging-wall (Fig. 15) to test a hypothesis that DECs
Figure 13. Samples of DECs in rock core. Figure. 13a shows a DEC set oriented 170/86Ethat crosscut two earlier sets oriented 045/66S and 075/62S. Figure 13b shows partiallyvacated vein in red mudstone of the Brunswick aquifer at a depth of about 84 m. Figure 13cshows DECs in the Stockton Fm. at a depth of about 60 m where the secondary vein fill hasbeen completely removed by dissolution. The surrounding matrix also shows chemicalalteration. Figure 13d shows syntaxial mineral growth in DECs in gray mudstone of theBrunswick aquifer.
13a 13b 13c 13d

19
formed in horizontal strata prior to regional tilting of strata. A ‘pre-tilt’ orientation was calculatedfor 63 DECs mapped throughout the gently dipping homocline (Fig. 16). Each pre-tilt DECorientation was determined by passively rotated it to a pre-tilt alignment by restoring itsassociated bedding reading to horizontal (analytical solution provided by Ragan, 1985, equations5.5 to 5.8). The inclination of the average direction of the restored DECs (71 o) directly agreeswith the angle of inclined-shear failure (~70o) reported for material moving in a faulted, extendedhangingwall (Xiao and Suppe, 1992; Dula, 1991, Withjack and others, 1995). DECs arepervasive throughout the basin. They reflect penetrative tectonic strain in Triassic sedimentaryrocks that were stretching and sagging during development of the primary fault blocks (Fig. 17).
Although most DECs display simple syntaxial fiber growths, exceptions occur. Forexample, DECs can be entirely or partially filled with mosaic quartz and therefore showantitaxial or composite morphologies. These vein types can reflect many different causes
Figure 14. Dilatant Echelon Cracks (DECs) occur in conjugate arrays that dip at steepangles normal to bedding (14a). Figure 14b shows that the acute angle between theconjugate arrays corresponds to the local, maximum principal stress direction, and is normalto the least principal stress direction. Alignment of these cracks at high angles to beddingresults in both extension sub-parallel to bedding (normal to the DEC walls) and simpleshear sub-normal to bedding. Figure 14b adapted from Ramsay and Huber (1983, Fig. 3.21).
14a 14b
conjugate sets of vein arrays (DECs)
sedimentarybedding
sedimentarybedding

20
Figure 15a shows field stations and structural domains for a six-quadrangle area in thecentral part of the Newark Basin (Herman, 1997). Area corresponds to that shown figure 11.Figure 15b is a circular histogram summary of bed-parallel and non-bedding fracturesmapped in the ffhws structural domain. Note the consistent strike of bedding in the domain.Frequency percentages indicated for bin maximums. Figures 15c and 15d show thedistribution of the 2 sets of systematic extension fractures mapped in the study area. cmb -Cushetunk Mt. block, fffwn - Flemington fault footwall north, fffws - Flemington faultfootwall south, ffhwn - Flemington fault hangingwall north, ffhws - Flemington faulthangingwall south, ffz – Flemington fault zone, hfz – Hopewell fault zone, hfhw – Hopewellfault hangingwall. Quadrangle abbreviations same as those in figure 11.
15b
BeddingAverage dip = 18 o
184 readings from 176 stations
Non-bedding fracturesAverage dip = 77 o
376 readings from 150stations
34%
11%15a
15c. DECsstriking
15o to 30o
15d. DECsstriking
35 o to 50o

21
16b. Current Bedding Orientation
16 a. Current DEC orientations 16c. Pre-tilt DEC Orientations
16d. Profile view of pre-tiltDEC orientations
hangingwall
preferreddirection
vectormean
8571
NW SE
footwall
Figure 16. A geometric exercise conducted on the systematic set of DECs striking 15 o to 30o
shows that the orientation of DECs in horizontal strata directly corresponds to the angle ofinclined shear failure predicted for collapse of a hanging wall in an extensional tectonicenvironment. Stereographic projection diagrams are lower hemisphere, equal area plotsusing GEOrient software (v. 7.2, by Dr. R.J. Holcombe). DECs mostly dip southeast in theircurrent orientation (Fig. 16a) and bedding dips northwest in the ffhws structural domain (Fig15). Pre-tilt DEC orientations (Fig. 16c) are derived by restoring bedding to horizontal usingmethods described in the text. The preferred direction for the pre-tilt DECs is 85 o W with avector mean (average direction) of 71o W (Fig. 16d).

22
including complex vein-growth related to episodic fracturing, mineral growth that didn’t keep upwith the rate of fracture extension, or secondary minerals that refilled voids left by the removal ofearlier minerals. In some instances, mineral fibers measured in DECs of the border-fault orientation are orientated parallel to fibers found in theDECs of the intra-basin fault orientation (Fig. 18). This indicates counter-clockwise rotation ofthe progressive strain field of about 20 o during the Triassic, assuming that DECs oriented sub-parallel to the border faults preceded those formed parallel to the intra-basin faults. Crosscuttingand abutting fracture relationships observed at many locations in the basin lend support this strainrelationship (Fig. 18).
Figure 17. Profile diagrams illustrating some theoretical aspects of DECs occurring in theNewark Basin. Figure 17a shows that DECs occur in spaced sets of varying density in thebasin (Herman, 1997) and their inter-fracture spacing is commonly influenced by thethickness of the mechanical or ‘fractured’ layer. Figure 17b illustrates that inter-fracturespacing generally decreases near the trace of mapped faults (Herman, 1997), and that apreferred direction of inclination toward the west would result in a progressive sagging ofthe rock pile in that direction. Figure 17c illustrates that DECs are rotated in the hanging wallof faults from their pre-tilt orientation.
17a
17b
17c

23
047o
017o
067/77SS
021/59S
18a
18c
18d04718c107
107o
18e
045o
~1 cmRemnant
mineralization
Figure 18. DEC walls commonly appear as ordinary ‘joints’ in outcrop because secondaryminerals that once filled DECs are usually dissolved from weathering. Figure 8a showsDECs within an outcrop of gray mudstone of the Passaic Formation; the set strikingsubparallel to the intra-basin faults are locally found butting into the set striking subparallelto the basins’ northwest margin. Figure 8b shows an outcrop of gray mudstone of theLockatong Fm. with DECs having a 1 to 3m trace length and variable inter-fracture spacing(rock hammer in the center of the view for scale). DECs seen in shallow excavations oftenshow only partial removal of secondary minerals from weathering. Figure 18c shows the tworegional DEC sets in a massive red mudstone of the Passaic Fm exposed in a railroad gradeexcavation. Figures 18b and 18c shows that calcite mineral fibers within the earlier DEC set(047o) locally grew normal to the later (017o) set, further illustrating that DECs of the borderfault trend predate the intra-basin fracture trend.

24
Structural features commonly found on the walls of DECs, including plumose patterns,rib marks and hackles further substantiate their extensional origin. In contrast, the two sets ofsubordinate cross-joints commonly extend between, and are approximately normal to thesystematic DEC sets. Cross-joints are not usually mineralized, are much less abundant than theDECs, have rough, curviplanar surfaces that commonly terminate on bedding partings or againstDECs (Herman, 1997). These fractures probably originate as complimentary structures thataccommodate bulk strain in a stretched and saggy pile of heterogeneous, layered rocks. Anotherstructural relationship worth noting is that inter-fracture spacing and the geometrical aspect (tracelength vs. height) of DECs reflect the thickness of the fractured layer. The literature recordsmany instances where joint spacing scales with the thickness of the fractured layer in sedimentaryrocks (Pollard and Adyin, 1988; Huang and Angelier, 1989; Narr and Suppe, 1991; Gross, 1993).Generally, thin layers show closer fracture spacing than thick layers. However, parallel fracturesets in the basin show a systematic increase in inter-fracture spacing approaching the map trace ofintra-basin faults (Herman, 1997). It is unclear whether this reflects progressive penetrative strainaccompanying regional faulting or if the regional spacing existed prior to large-scale faulting. Inthe latter case, variably spaced swarms of extensional fractures could have developed in the basinat regular intervals that would ultimately influence where large faults subsequently developed(Fig. 17).
Most tectonic fractures mapped in outcrop appear as open and potentially conductivestructures. However, they are often healed with calcite and gypsum in many bedrock excavationsand most rock cores (Figs. 13). Core samples of the Lockatong and Brunswick aquifers showminimal dissolution of vein-fill minerals below near-surface depths of less than 6 to 15 meters.In contrast, arkosic sandstone in the Stockton aquifer locally displays deep weathering profileswith vacated DECs observed to depths below 60 meters (Fig. 13c). This contrast probably occursbecause sandstone has higher matrix porosity and matrix compositions that are less effective inbuffering recharged, acidic ground water than the carbonate- and sulfate-laden lacustrine rocks ofthe Lockatong Formation and Brunswick aquifer.
MODIFICATIONS TO THE LMAS
The hydrogeologic framework of fine-grained sedimentary bedrock the Newark Basinwhere unconsolidated sediment is generally thin (< 5m) includes shallow, intermediate, and deepintervals having variable hydraulic properties (Fig. 19). The shallow interval correlates to‘overburden’ and includes unconsolidated alluvium, colluvium, artificial fill, and bedrock regolith(Michalski and Britton, 1997). Regolith in the Lockatong and Brunswick aquifers includes red,brown, orange, yellow, and gray silty clay to clayey silt residuum containing angular bedrockfragments near competent bedrock. The shallow interval extends to depth of 1 to 5m and oftenhas a perched water table near its base. The underlying, intermediate or ‘weathered’ intervalreflects prolonged weathering of bedrock during a wide range of climatic conditions, includingpermafrost developed during glacial epochs. Hydraulic gradients mapped at shallow- tointermediate levels commonly mimic topographic slope and display hydraulic responsesequivalent to porous media. Conductive features at intermediate depths include partially-dissolved systematic tectonic fractures, stratigraphic zones of mineral dissolution, bed-parallelmechanical layering, and other fractures resulting from erosion and weathering. These probablyinclude release joints oriented sub-parallel to the ground surface and stemming from glacial andstratigraphic unloading, and fractures stemming form freeze-thaw cracking. These combinedfeatures provide ample pathways for groundwater flowing under water-table conditions and helpexplain why workers often cite a ‘regional water table’ occurring at depth of about 10 to 15 m (30to 50 ft). Ground-water flow at intermediate depths abruptly decreases about 20m below groundsurface in the Lockatong Formation and Brunswick aquifer based on fluid-temperature logs

25
(Figs. 20 and 21) and the depth of well yields reported in bedrock wells (Morin and others, 1997;2000).
The hydraulic connection between the open borehole and overlying parts of the aquifertherefore becomes an important consideration when dealing with near-surface ground-waterpollution because the intermediate interval can extend below the 50-ft casing depth required forpotable wells. The hydrogeological literature often states that the infiltration of precipitationthrough fractures is impeded at shallow levels, and that permeability is less than deeper levelsbecause clay and silt derived from weathered bedrock partially fill open fractures (Kasabach,1966; Lewis-Brown and dePaul, 2000). However, vertical conductivity values reported in theweathered interval are cited as exceeding those in the deep zone by two-orders of magnitude inthese same rocks (Lewis-Brown and Jacobsen, 1995). More hydrogeological research is clearlyneeded to better understand the hydrogeology of this critical recharge and fluid-transport zone.
Ground-water flow in the deep bedrock aquifer generally reflects confined-flowconditions, principally related to stratigraphic control. Deep flow zones become recharged withground water when they reach intermediate and shallow depths (Michalski and Britton, 1997).Although the deep-level flow zones display anisotropic hydraulic responses under pumpingconditions, with maximum horizontal conductivity oriented along bedding strike, the areacontributing to their recharge is probably more isotropic at intermediate levels. More research isneeded to evaluate this probability. More work is also needed in evaluating aquifercharacteristics in areas of intense tectonic fracturing near large-scale faults. These areas typicallyhave multiple sets of tightly spaced fractures having surface coatings of iridescent-bluemanganese minerals. Archaic ground-water systems probably developed in these areas from thetectonic mobilization of fluids associated with pervasive hydraulic fracturing accompanyingfaulting. These areas may display anomalous ground water chemistry and pose exceptions to theLMAS ground-water flow model elsewhere in the basin.
In summary, ground water exhibits complex flow behavior in bedrock aquifers of theNewark Basin. Complexities arise from sedimentalogical and structural variations in the aquiferframework that affect both water table and confined-flow conditions. Ground water is reportedlystored and transmitted along fractures, but the Brunswick aquifer and Lockatong aquifers includestratified intervals with abundant calcium sulfate and calcium carbonate mineralization that isprone to dissolution of secondary, authegenic minerals producing conduits of significant confinedflow. The stratified orientation of these dissolution zones helps explain why maximum hydraulicconductivity is commonly aligned along bedding strike (Vecchioli and others, 1969; Michalskiand Britton, 1997; Carlton and others, 1999). Transmissivity values reported for these intervalsvary significantly because of the variable thickness of the producing interval over which valuesare calculated. Regional analysis of ambient ground-water quality from bedrock wells shows thatcalcium-bicarbonate and calcium-sulfate waters dominate (Serfes, 1994). Regional variations inthe distribution of carbonate and sulfate in ground water (Michalski and others, 1997) probablyreflect regional sedimentalogical trends of authigenic mineralization and related dissolutionprocesses. Dissolution-induced flow in stratigraphic horizons must be a primary considerationwhen characterizing the aquifer framework of fine-grained sedimentary rocks of the NewarkBasin.

26
SB1 SB`6SB5
SB14SB4 SB3
+0.08
-0.01
-0.03
+0.03
TD ~45 m20c
SB8
Figure 20c shows details of the 3D profile for thecentral part of the well field. Fluid-temperaturevariations decrease in frequency of occurrence to18m (60 ft) near the base of the weathered zone.Occasional temperature anomalies below this depthprobably correspond to isolated flow zones in deepbedrock. Well data and fluid-temperature logsprovided courtesy of Glen Carleton, U.S. GeologicalSurvey
SB4SB1 SB2SB13 SB11 SB9
SB1SB6
SB5 SB8SB14 SB7 SB12SB3
20b+0.27 +0.05
+0.16
Figure 20a shows the bedrockorientation and well locations at theStonybrook-Millstone WatershedAssociation (SMWA) preserve nearPennington, New Jersey.
Figure 20b. A three-dimensional (3D)profile looking northwest through thewell field shows fluid-temperaturedifferentials (oF) below casing undernon-pumping conditions. Differentialsare calculated by subtracting successivefluid-temperature log readings every2.1-cm (0.1-ft). The vertical distributionof temperature changes provides insightinto the depth of the weathered zone formudstone and siltstone of theBrunswick aquifer in unglaciated areas.The depth of each well is about 45 m(150 ft) with 6 m (20 ft) of casing.20a

27
Obs-1Non-
pumping
Obs-1 WellNo. 6
Pumping
CoreHBCH-1
+0.02
-0.375
Figure 21. Comparison offluid-temperature differentials(oF) in Obs-1 under pumpingand non-pumping conditionsin relation to the nearby corelog. Differential readingsunder non-pumpingconditions are two orders ofmagnitude lower than for thepumping conditions. Notethe correlation betweentemperature anomalies anddissolution zones logged inthe core and the pronouncedanomaly directly belowcasing under pumpingconditions. Location of wellsand key to lithologic symbolsshown in Figs. 5a and 6respectively.

28
ACKNOWLEDGMENTS
Bedrock geology of the Newark Basin has been extensively studied and reported on bymany workers over the past century. Detailed geological studies spearheaded by Paul E. Olsen ofthe Lamont-Doherty Earth Observatory of Columbia University and Roy W. Schlische of RutgersUniversity over the past decade has provided unprecedented, detailed insights into thestratigraphy, structure, and geochronology of the basin. Refinement of the geological frameworkfor the Brunswick aquifer draws heavily from their work.
The NJ Geological Survey has been mapping the bedrock geology of the New Jersey partof the Newark Basin at 1:100,00 to 1:24,000 scales over the past fifteen years. This workincludes cooperative mapping efforts with the U.S. Geological Survey (Drake and others, 1996;Owens and others, 2000) and other 7-1/2-minute quadrangle mapping conducted under the U.S.Geological Survey STATEMAP program. I especially acknowledge Don Monteverde, BobCanace, Jim Boyle, Mike Serfes, and Steve Spayd of the NJ Geological Survey for contributingfield data, valuable insights, useful methodologies, and manuscript reviews. Hugh Houghton andJim Mitchell provided structural data from prior bedrock mapping. Seth Fankhauser mapped andcompiled digital data in the Princeton 7-1/2’ quadrangle during a summer internship with theNJGS.
This work also benefited from interaction and the exchange of data with hydrogeologistsfrom the U.S Geological Survey including Glen Carleton, Pierre Lacombe, Jean Lewis-Brown,Zoltan Szabo, Mark Ayers, and Roger Morin. I also thank Paul Olsen and Mark Zdepski for theirenlightening discussions on the geology and hydrogeology of the basin.
REFERENCES
Ackermann, R. V., 1997, Spatial Distribution of Rift-Related Fractures: Field Observations,Experimental Modeling, and Influence on Drainage Networks: Ph.D. Dissertation,Rutgers University, New Brunswick, NJ, 136 pp.
Boyle, J. T., 1993, Well interference and evidence of fracture flow in the Passaic Formation nearPennington, Mercer County, New Jersey: NJ Geological Survey Open File Report OFR93-1, 16 p.
Brown, J. C., and dePaul, V. T., 2000, Ground-water flow and distribution of volatile organiccompounds, Rutgers University Busch Campus and vicinity, Piscataway township, NewJersey: U.S. Geological Survey Water-Resources Investigations Report 99-4256, 72 p.
Carlton, G. B., Welty, Claire, and Buxton, H.T., 1999, Design and analysis of tracer tests todetermine effective porosity and dispersivity in fractured sedimentary rocks, NewarkBasin, New Jersey: U.S. Geological Survey Water-Resources Investigations Report 98-4126, 80 p.
de Boer, J. Z., and Clifford, A. E., 1988, Mesozoic tectogenesis: Development and deformationof 'Newark' rift zones in the Appalachian (with special emphasis on the Hartford basin,Connecticut), in Manspeizer, Warren, ed., Triassic-Jurassic Rifting, ContinentalBreakup, and the Origin of the Atlantic Ocean and Passive Margin: Elsiever, New York,p. 275-306.
Drake, A. A., Jr., Volkert, R. A., Monteverde, D. H., Herman, G. C., Houghton, H. H., andParker, R. A., 1996, Bedrock geologic map of northern New Jersey: U. S. GeologicalSurvey Miscellaneous Investigation Series Map I-2540-A, 1:100,000 scale, 2 sheets.
Dula, W. F., 1991, Geometric models of listric normal faults and rollover folds: AmericanAssociation of Petroleum Geologists Bulletin, V. 75, No. 10, p. 1609-1625.

29
Durney, D. W., and Ramsay, J. G., 1973, Incremental strains measured by syntectonic crystalgrowths, in DeJong, K. A. and Scholten, R., eds., Gravity and Tectonics: New York,Wiley-Interscience, p. 67-96.
Engelder, 1999,Transitional-tensile fracture propagation: a status report: Journal of StructuralGeology, vol. 21, p.1049-1055.
Gross, M. R., 1993, The origin and spacing of cross joints: examples from the MontereyFormation, Santa Barbara Coastline, California: Journal of Structural Geology, v. 15, p.737-751
Groshong, R. H., 1988, Low-temperature deformation mechanisms and their interpretation:Geological Society of America Bulletin, vol. 100, p. 1329-1360.
Hansen, W. R., 1991, Suggestion to authors of the reports of the United States Geological Survey:U.S. Government Printing Office, Washington, D.C., Seventh Edition, 289 p.
Herman, G.C., 1997, Digital mapping of fractures in the Mesozoic Newark basin, New Jersey:Developing a geological framework for interpreting movement of groundwatercontaminants: Environmental Geosciences, v. 4, no. 2, p. 68-84.
Herman, G.C., Monteverde, D. H., Volkert, R.A., Drake, A. A., Jr., and Dalton, R.F., 1994,Environmental map of Warren County, N. J.; Bedrock fracture map: NJ GeologicalSurvey Open-File Map 15B, scale 1:48,000, 2 sheets.
Houghton, H. F., 1990, Hydrogeology of the early Mesozoic rocks of the Newark Basin, NewJersey, in Brown, J.O., and Kroll, R. L., eds., Field guide and proceedings: AnnualMeeting of the Geological Association of New Jersey, 7th, Kean College of New Jersey,Union, NJ, p. E1-E36.
Houghton, H. F., Herman, G. C., and Volkert, R. a., 1992, Igneous rocks of the Flemington faultzone, central Newark basin, New Jersey: Geochemistry, structure, and stratigraphy, inPuffer, J. H., and Ragland, P. C., eds., Eastern North America Mesozoic Magmatism:Geological Society of America Special Paper 268, p. 219-232
Huang, Q., and Angelier, J., 1989, Fracture spacing and its relation to bed thickness: GeologicalMagazine, v. 126, p. 355-362
Jackson, J.J., 1997, Glossary of Geology, 4th Edition, American Geological Institute, Alexandria,Virginia, 769. p
Kasabach, H. F., 1966, Geology and Ground Water Resources of Hunterdon County, New Jersey,NJ Geological Survey Special report No. 24, 128 p.
Kummel, H. B., 1898, The Newark System or red sandstone belt: New Jersey Geological SurveyAnnual Report of the State Geologist for the Year of 1897, p. 23-159.
Lacombe, P.J., 2000, Hydrogeologic framework, water levels, and trichloroethylenecontamination, Naval Air Warfare Center, West Trenton, New Jersey: U.S. GeologicalSurvey Water-Resources Investigations Report 98-4167, 139 p.
Lewis-Brown, J. C., and dePaul, V. T., 2000, Ground-water flow and distribution of volatileorganic compounds, Rutgers University Busch campus and vicinity, PiscatawayTownship, New Jersey: U.S. Geological Survey Water-Resources Investigations Report99-4256, 72 p.
Lewis-Brown, J. C., and Jacobsen, Eric, 1995, Hydrogeology and ground-water flow, fracturedMesozoic structural-basin rocks, Stony Brook, Beden Brook, and Jacobs Creek drainagebasins, west-central New Jersey: U.S. Geological Survey Water-Resources InvestigationsReport 94-4147, 83 p.
Lucas, M., Hull, Joseph, Manspeizer, Warren, 1988, A foreland-type fold and related structuresof the Newark rift basin, in Manspeizer, Warren, ed., Triassic-Jurassic Rifting,Continental Breakup, and the Origin of the Atlantic Ocean and Passive Margin: Elsevier,New York, ed. p. 307-332

30
Michalski, Andrew, 1990, Hydrogeology of the Brunswick (Passaic) formation and implicationsfor ground water monitoring practice: Ground Water Monitoring Review, v. X, no. 4,pp.134-143.
Michalski, Andrew, and Britton, Richard, 1997, The role of sedimentary bedding in thehydrogeology of sedimentary bedrock - Evidence from the Newark Basin, New Jersey:Ground Water, Vol. 35, No. 2., p. 318-327.
Michalski, Andrew, and Gerber, T., 1992, Fracture flow velocities in the Passaic Formation inlight of interwell tracer tests: in Field Guide and Proceedings of the Ninth AnnualMeeting of the Geological Association of New Jersey, G. M. Ashley and S. D. Halsey,Eds. p. 1-7.
Michalski, Andrew, and Klepp, G. M., 1990, Characterization of transmissive fractures by simpletracing of in-well flow: Ground Water, Vol. 28, No. 2., p. 191-198.
Michalski, Andrew, Britton, R., and Uminski, A. H., 1992, Integrated Use of MultipleTechniques for Contaminant Investigations in Fractured Aquifers: A Case Study from theNewark Basin, New Jersey: Proceedings Focus Conference on Eastern Region GroundWater Issues: Oct. 13-15, Boston, Mass. Publ. NGWA, Dublin, OH. p. 809-826.
Morin, R. H., Senior, L. A., and Decker, E. R., 2000, Fractured-aquifer hydrogeology fromgeophysical logs: Brunswick Group and Lockatong Formation, Pennsylvania: GroundWater, Vol. 38, No. 2, p. 182-192.
Morin, R. H., Carleton, G. B., and Poirier, Stéphane, 1997, Fractured-aquifer hydrogeology fromgeophysical logs; the Passaic Formation, New Jersey: Ground Water, Vol. 35, No. 2, p.328-338.
Narr, W., and Suppe, John, 1991, Joint spacing in sedimentary rocks: Journal of StructuralGeology, v. 13, p. 1037-1048
New Jersey Geological Survey, 2000, Bedrock geology (1 to 100,000-scale) and topographic basemaps (1 to 24,000- and 1 to 100,000-scales) of New Jersey: New Jersey GeologicalSurvey CD Series CD00-1, 1 Compact Disk.
Olsen, P. E., 1980, The latest Triassic and early Jurassic Formations of the Newark Basin(Eastern North America, Newark Supergroup): Stratigraphy, structure, and correlation:New Jersey Academy of Sciences, vol. 25, no. 2, p. 25-51.
Olsen, P. E., 1988, Continuity of strata in the Newark and Hartford Basins, in Froelich, A. J., andRobinson, G. P., Jr., eds., Studies of the Early Mesozoic Basins of the Eastern UnitedStares: U.S. Geological Survey Bulletin 1776, p. 6 – 18.
Olsen, P. E., Kent, D. V., Cornet, Bruce, Witte, W. K., and Schlische, R. W., 1996, High-resolution stratigraphy of the Newark rift basin (early Mesozoic, eastern North America):Geological Society of America Bulletin, v. 108, no. 1, p. 40-77.
Olsen, P. E., Withjack, M. O., and Schlische, R. W., 1992: Inversion as an integral part of rifting:An outcrop perspective from the Fundy basin, eastern North America: Eos--AmericanGeophysical Union Transactions, v. 73, n. 43, p. 562.
Owens, J. P., Sugarman, P. J., Sohl, N. F., Parker, R. A., Houghton, H. F., Volkert, R. A., Drake,A. A. , Jr., and Orndorff, R. C., 1998, Bedrock geologic map of central and southern NewJersey: U. S. Geological Survey Miscellaneous Investigation Series Map I-2540-B,1:100,000 scale, 3 sheets.
Owens, J. P., and Sohl, N. F., 1969, Shelf and deltaic paleoenvironments in the Cretaceous-Tertiary Formations of the New Jersey Coastal Plain, in Subitzky, Seymour, ed., Geologyof selected areas in New Jersey and Eastern Pennsylvania and guide book: RutgersUniversity Press, New Brunswick, N.J., p. 235-278.
Ragan, D. M., 1985, Structural Geology; an Introduction to Geometric Techniques, 3rd Edition:John Wiley & Sons, Inc., New York, 393 p.
Ramsay, J. G., and Huber, M. I., 1983, The techniques of modern structural geology, Volume 1:Strain analysis: London, England, Academic Press, 307 p.
31
Ramsay, J. G., and Huber, M. I., 1987, The techniques of modern structural geology, Volume 2:Folds and fractures: London, England, Academic Press, 700 p.
Pollard, David, P., and Aydin, Atilla, 1988, Progress in understanding jointing over the pastcentury: Geological Society of America Bulletin, v. 100, p. 1181-1024.
Serfes, M. E., 1994, Natural ground-water quality in bedrock of the Newark Basin: NJ GeologicalSurvey Geological Series Report GSR 35, 32 p.
Serfes, M. E., Spayd, S. E., Herman, G.C., and Monteverde, D. H., 2000, Arsenic Occurrence,Source and Possible Mobilization Mechanisms in Ground Water of the PiedmontPhysiographic Province in New Jersey: EOS, Transactions of the American GeophysicalUnion Fall Meeting, v. 81, no. 48, November 28, 2000, p. F525-H210-08.
Schlische, R. W., 1993, Anatomy and evolution of the Triassic-Jurassic continental rift system,eastern North America: Tectonics, v. 12, p. 1026-1042.
Schlische, R. W., 1992, Structural and stratigraphic development of the Newark extensionalbasin, eastern North America: Evidence for the growth of the basin and its boundingstructures: Geological Society of America Bulletin, v. 104, p. 1246-1263.
Schlische, R. W., and Olsen, P. E., 1990, Quantitative filling model for continental extensionalbasins with with application to the early Mesozoic rifts of eastern North America: Journalof Geology, vol. 98, p. 135-155.
Schlische, R. W., and Olsen, P. E., 1988, Structural evolution of the Newark Basin, in Husch, J.M., and Hozik, M. J., eds., Geology of the central Newark Basin, field guide andproceedings: Annual Meeting of the Geological Association of New Jersey, 5th, RiderCollege, Lawrencville, N.J., p. 43-65.
Smoot, J. P., and Olsen, P. E., 1994, Climatic cycles as sedimentary controls of refit-basinlacustrine deposits in the early Mesozoic Newark Basin based on continuous core, inLomando, T., and Harris, M., eds., Lacustrine depositional systems: Society ofSedimentary Geology (SEPM) Core Workshop Notes, v. 19, p. 201-237.
Smoot, J. P., and Olsen, P. E., 1985, Massive mudstones in basin analysis and paleoclimaticinterpretation of the Newark Supergroup, in Robsinson, G. R., and Froelich, A. J., eds.Proceedings of the second U.S. Geological Survey workshop on the Early Mesozoicbasins of the Eastern United States: U. S. Geological Survey Circular 946, p. 29-33.
Smoot, J. P., and Olsen, P. E., 1988, Massive mudstones in basin analysis and paleoclimaticinterpretations, in Manspeizer, W., ed., Triassic-Jurassic rifting, continental breakup, andthe origin of the Atlantic Ocean and passive margins, Part A: Amsterdam, Netherlands,Elsevier, p. 249-274.
Spayd, S. E., 1985, Movement of volatile organics through a fractured rock aquifer: GroundWater, Vol. 23, No. 4., p. 496-502
Spayd, S.E., 1998, Draft guidance for wellhead protection area delineations in New Jersey: N.J.Geological Survey Draft Technical Guidance,http://www.state.nj.us/dep/dsr/wellhead.pdf.
Stanford, S.D., 2000, Overview of the glacial geology of New Jersey, in Harper, D. P. andGoldstein, F. R., eds., Glacial Geology of New Jersey: Field Guide and Proceedings forthe Seventeenth Annual Meeting of the Geological Association of New Jersey, p. II-1 toII-24.
Stanford, S.D., Ashley, G. M., and Brenner, G. J., 2001, Late Cenozoic fluvial stratigraphy of theNew Jersey Piedmont: A record of glacioeustacy, planation, and incision on a low-reliefpassive margin: Journal of Geology, v. 109, p. 265-276.
Szabo, Zoltan, Taylor, T. A., Payne, D. F., and Ivanchenko, Tamara, 1997, Relation ofhydrogeologic characteristics to distribution of radioactivity in ground water, NewarkBasin, New Jersey: U.S. Geological Survey Water-Resources Investigations Report 95-4136,134 p.

32
Tollo, R. P. and Gottfried, D., 1992, Petrochemistry of Jurassic basalt from eight drill cores,Newark basin, New Jersey: Implications for the volcanic petrogenesis of the NewarkSupergroup: in Puffer, J. H. and Ragland, P. C., eds., Eastern North American MesozoicMagmatism: Geological Society of America Special Paper 268, p. 233-259.
Van Houten, F. B., 1962, Cyclic sedimentation, Upper Triassic Lockatong Formation, centralNew Jersey and adjacent Pennsylvania: American Journal of Science, v. 260, p. 561-576.
Van Houten, F. B., 1965, Composition of Triassic Lockatong and associated formations ofNewark Group, central New Jersey and adjacent Pennsylvania: American Journal ofScience, vol. 263, p. 825-863
Vecchioli, John, Palmer, and Mark M., 1962, Ground-water resources of Mercer County, NJ:U.S. Geological Survey Special Report No. 19, 71 p.
Vecchioli, John, Carswell, L. D., and Kasabach, H. F., 1969, Occurrence and movement ofground water in the Brunswick Shale at a site near Trenton, New Jersey: U.S. GeologicalSurvey Professional Paper 650-B, p. B154-B157.
Weems, R. E., and Olsen, P. E., 1997, Synthesis and revision of groups within the NewarkSupergroup, eastern North America: Geological Society of America Bulletin, v. 109, no.2, p. 195-209.
Withjack, M. O., Islam, Q. T., and La Pointe, P. R., 1995, Normal faults and their hanging-walldeformation: An experimental study: American Association of Petroleum GeologistsBulletin, V.79, No. 1, p. 1-18.
Xiao, Hongbin, and Suppe, John, 1992, Origin of rollover: American Association of PetroleumGeologists Bulletin, V. 76, No. 4, p. 509-529.