Embed Size (px)
Citation preview

+ H2
Hydrogen Storage Tech Team Roadmap July 2017

H2 Storage TT Roadmap Page 2
This roadmap is a document of the U.S. DRIVE Partnership. U.S. DRIVE (Driving Research and Innovation for Vehicle efficiency and Energy sustainability) is a voluntary, non-binding, and nonlegal partnership among the U.S. Department of Energy; USCAR, representing FCA US LLC, Ford Motor Company, and General Motors; five energy companies – BP America, Chevron Corporation, Phillips 66 Company, ExxonMobil Corporation, and Shell Oil Products US; two utilities – Southern California Edison and DTE Energy; and the Electric Power Research Institute (EPRI). The Hydrogen Storage Tech Team is one of 13 U.S. DRIVE technical teams that work to accelerate the development of pre-competitive and innovative technologies to enable a full range of efficient and clean advanced light-duty vehicles, as well as related energy infrastructure. For more information about U.S. DRIVE, please see the U.S. DRIVE Partnership Plan, at www.vehicles.energy.gov/about/partnerships/usdrive.html or www.uscar.org.

H2 Storage TT Roadmap Page 3
Acknowledgments
Hydrogen Storage Technical Team Organizational Members Argonne National Laboratory
FCA US LLC Ford Motor Company
General Motors Los Alamos National Laboratory Oak Ridge National Laboratory
University of Dayton Research Institute University of Michigan
U.S. Department of Energy, Fuel Cell Technologies Office
Special Thanks to Hydrogen Storage Roadmap Contributors
Contributor Affiliation Tarek Abdel-Baset Jesse Adams*
FCA US LLC U.S. Department of Energy, Fuel Cell Technologies Office
Mathew Beckner Bob Bowman Amgad Elgowainy John Gangloff Zeric Hulvey Michael Luckham Mark Mehall Shaun Onorato Kevin Ott Justin Purewal Brian Rice Don Siegel Ned Stetson Mike Veenstra* Max Zou
General Motors Oak Ridge National Laboratory Argonne National Laboratory U.S. Department of Energy, Fuel Cell Technologies Office (Fellow) U.S. Department of Energy, Fuel Cell Technologies Office (Fellow) General Motors Ford Motor Company Allegheny Science & Technology, Contractor, U.S. Department of Energy Los Alamos National Laboratory Ford Motor Company University of Dayton Research Institute University of Michigan U.S. Department of Energy, Fuel Cell Technologies Office Ford Motor Company FCA US LLC
* Co-Chairs

H2 Storage TT Roadmap Page 4
TABLE OF CONTENTS 1 MISSION AND SCOPE ............................................................................................ 6 2 KEY ISSUES AND CHALLENGES ........................................................................... 7 3 TECHNICAL TARGETS AND CURRENT STATUS ................................................. 11 4 GAPS AND TECHNICAL BARRIERS ..................................................................... 20 5 R&D STRATEGY TO OVERCOME BARRIERS AND ACHIEVE TECHNICAL TARGETS .................................................................................................................. 25 APPENDIX A EXAMPLE STRATEGIES TO OVERCOME EXISTING BARRIERS ....... 31 REFERENCES ............................................................................................................ 34 APPENDIX B TARGET EXPLANATION DOCUMENT: ONBOARD HYDROGEN STORAGE SYSTEMS FOR LIGHT-DUTY VEHICLES .................................................. 38

H2 Storage TT Roadmap Page 5
List of Tables Table 1 Technical System Targets: Onboard Hydrogen Storage for Light-Duty Vehicles .......12 Table 2 Projected Performance of Hydrogen Storage Systems .................................................17 Table 3 Summary of Demonstrations of Materials-based Hydrogen Storage Systems .............18 Table 4 Current Status of Onboard Hydrogen Storage Systems ...............................................19 Table 5 Existing Barriers for Potential Hydrogen Storage System ...........................................21 Table 6a Example Strategies to Overcome Existing Barriers for Physical Hydrogen Storage Systems ...........................................................................................................31 Table 6b Example Strategies to Overcome Existing Barriers for Material-Based Hydrogen
Storage Systems .........................................................................................................32 List of Figures Figure 1 Comparison of the Volumetric and Gravimetric Densities of Various Fuels ................7 Figure 2 2015 U.S. Light-duty Vehicle Sales by Driving Range .................................................8 Figure 3 Potential Hydrogen Storage Technologies ...................................................................14 Figure 4 Percent Cost Breakdown of a 700 bar Type IV Hydrogen Storage System .................26 Figure 5 Cost Reduction Based on DOE Hydrogen Storage Program Support R&D
Compared to 2013 Bassline for 700 bar Type IV Hydrogen Storage Systems ...........27 Figure 6 Single Variable Sensitivity Analysis of 700 bar Type IV Hydrogen Storage
Systems ........................................................................................................................28

H2 Storage TT Roadmap Page 6
U.S. DRIVE Hydrogen Storage Technologies Roadmap
1. Mission and Scope: Mission: Accelerate research and innovation that will lead to commercially viable hydrogen-storage technologies that meet the U.S. DRIVE Partnership goals. Scope: Review and evaluate the potential, and limitations, of novel approaches, materials, early-stage research and development (R&D), and systems for hydrogen storage onboard light-duty fuel cell vehicles, and provide feedback to the U.S. Department of Energy (DOE) and Partnership stakeholders. Generate system goals and performance targets, and establish test methods for hydrogen storage systems onboard vehicles. Collaborate with other technical teams and assist the Partnership in matters relating to hydrogen storage.
H2 Storage TT Roadmap Page 7
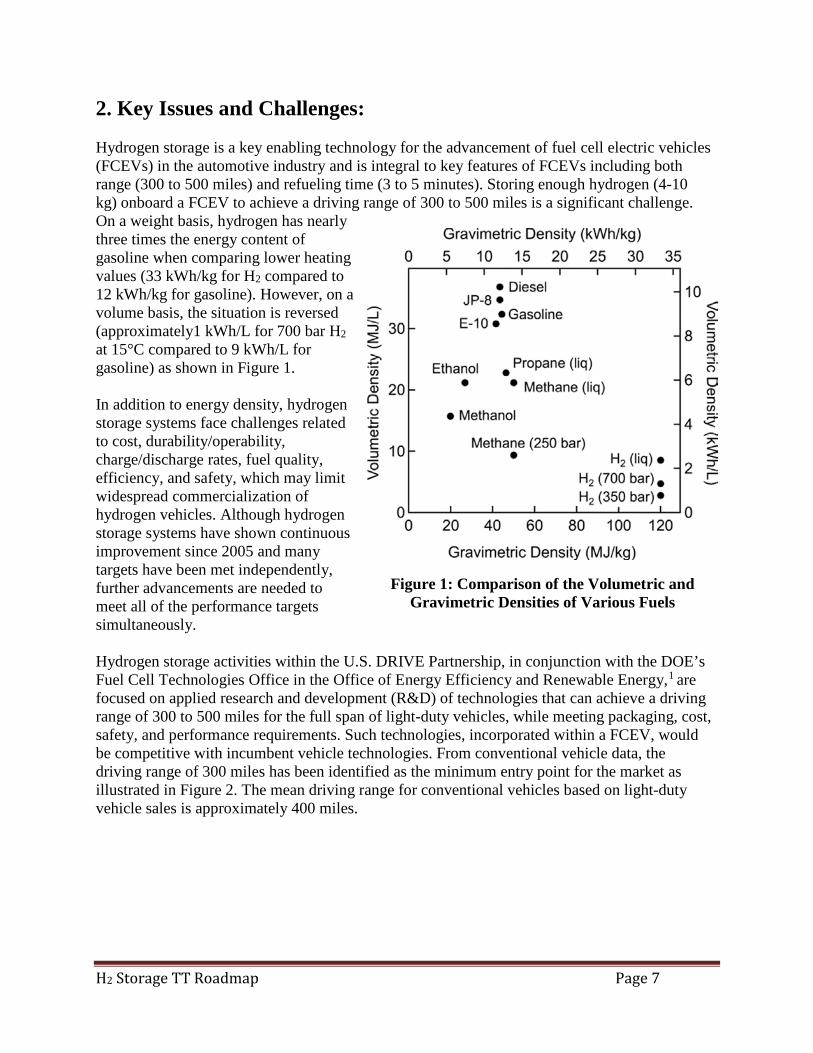
2. Key Issues and Challenges: Hydrogen storage is a key enabling technology for the advancement of fuel cell electric vehicles (FCEVs) in the automotive industry and is integral to key features of FCEVs including both range (300 to 500 miles) and refueling time (3 to 5 minutes). Storing enough hydrogen (4-10 kg) onboard a FCEV to achieve a driving range of 300 to 500 miles is a significant challenge. On a weight basis, hydrogen has nearly three times the energy content of gasoline when comparing lower heating values (33 kWh/kg for H2 compared to 12 kWh/kg for gasoline). However, on a volume basis, the situation is reversed (approximately1 kWh/L for 700 bar H2 at 15°C compared to 9 kWh/L for gasoline) as shown in Figure 1. In addition to energy density, hydrogen storage systems face challenges related to cost, durability/operability, charge/discharge rates, fuel quality, efficiency, and safety, which may limit widespread commercialization of hydrogen vehicles. Although hydrogen storage systems have shown continuous improvement since 2005 and many targets have been met independently, further advancements are needed to meet all of the performance targets simultaneously. Hydrogen storage activities within the U.S. DRIVE Partnership, in conjunction with the DOE’s Fuel Cell Technologies Office in the Office of Energy Efficiency and Renewable Energy,1 are focused on applied research and development (R&D) of technologies that can achieve a driving range of 300 to 500 miles for the full span of light-duty vehicles, while meeting packaging, cost, safety, and performance requirements. Such technologies, incorporated within a FCEV, would be competitive with incumbent vehicle technologies. From conventional vehicle data, the driving range of 300 miles has been identified as the minimum entry point for the market as illustrated in Figure 2. The mean driving range for conventional vehicles based on light-duty vehicle sales is approximately 400 miles.
Figure 1: Comparison of the Volumetric and Gravimetric Densities of Various Fuels

H2 Storage TT Roadmap Page 8
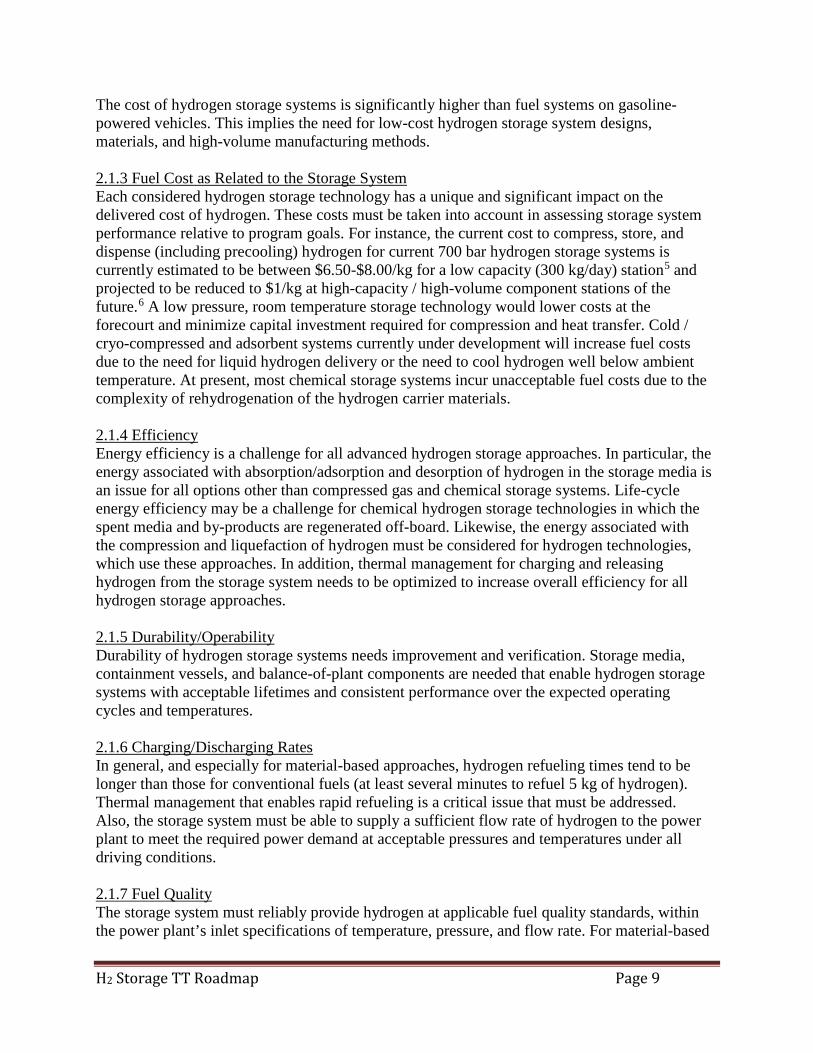
Figure 2: Distribution of 2015 Light-duty Vehicle Sales in the U.S. Market by Driving Range (based on the product of the EPA combined fuel economy and rated fuel tank capacity)2 In comparison, hydrogen vehicles in DOE’s Controlled Hydrogen Fleet and Infrastructure Demonstration and Validation Project had an Environmental Protection Agency (EPA) adjusted driving range from 100 miles (Generation 1 observed minimum) to 250 miles (Generation 2 observed maximum).3 More recently, two separate commercial FCEVs (Toyota Mirai and Honda Clarity) have been released with ranges of 312 and 366 miles respectively.4 However, even though FCEVs are beginning to meet the minimum driving range target of 300 miles, significant effort still remains regarding cost and packaging to achieve commercial viability across various vehicle classes and push the range closer to 500 miles. In addition, the burden placed on the hydrogen fueling station, with respect to the cost of compression and pre-cooling necessary for existing 700 bar hydrogen storage systems, must be taken into account. Thus, it is clear that hydrogen storage systems must be improved in order to provide the customer with the expected performance, cost, and driving range across all light-duty vehicle platforms. 2.1 Hydrogen Storage Technical Barriers: 2.1.1 System Weight and Volume The weight and volume of hydrogen storage systems are presently too high, resulting in inadequate driving ranges on a single fill across all vehicle platforms when compared to incumbent technologies. Storage media, containment vessels, and balance-of-plant components are needed that allow compact, lightweight, hydrogen storage systems. 2.1.2 System Cost
0
500,000
1,000,000
1,500,000
2,000,000
2,500,000
3,000,000
250 300 350 400 450 500 550 600 650
2015
Lig
ht-d
uty
Sale
s
Range (Miles)
EPA Label Range
Source: Polk Data, 2015
H2 Storage TT Roadmap Page 9
The cost of hydrogen storage systems is significantly higher than fuel systems on gasoline-powered vehicles. This implies the need for low-cost hydrogen storage system designs, materials, and high-volume manufacturing methods. 2.1.3 Fuel Cost as Related to the Storage System Each considered hydrogen storage technology has a unique and significant impact on the delivered cost of hydrogen. These costs must be taken into account in assessing storage system performance relative to program goals. For instance, the current cost to compress, store, and dispense (including precooling) hydrogen for current 700 bar hydrogen storage systems is currently estimated to be between $6.50-$8.00/kg for a low capacity (300 kg/day) station5 and projected to be reduced to $1/kg at high-capacity / high-volume component stations of the future.6 A low pressure, room temperature storage technology would lower costs at the forecourt and minimize capital investment required for compression and heat transfer. Cold / cryo-compressed and adsorbent systems currently under development will increase fuel costs due to the need for liquid hydrogen delivery or the need to cool hydrogen well below ambient temperature. At present, most chemical storage systems incur unacceptable fuel costs due to the complexity of rehydrogenation of the hydrogen carrier materials. 2.1.4 Efficiency Energy efficiency is a challenge for all advanced hydrogen storage approaches. In particular, the energy associated with absorption/adsorption and desorption of hydrogen in the storage media is an issue for all options other than compressed gas and chemical storage systems. Life-cycle energy efficiency may be a challenge for chemical hydrogen storage technologies in which the spent media and by-products are regenerated off-board. Likewise, the energy associated with the compression and liquefaction of hydrogen must be considered for hydrogen technologies, which use these approaches. In addition, thermal management for charging and releasing hydrogen from the storage system needs to be optimized to increase overall efficiency for all hydrogen storage approaches. 2.1.5 Durability/Operability Durability of hydrogen storage systems needs improvement and verification. Storage media, containment vessels, and balance-of-plant components are needed that enable hydrogen storage systems with acceptable lifetimes and consistent performance over the expected operating cycles and temperatures. 2.1.6 Charging/Discharging Rates In general, and especially for material-based approaches, hydrogen refueling times tend to be longer than those for conventional fuels (at least several minutes to refuel 5 kg of hydrogen). Thermal management that enables rapid refueling is a critical issue that must be addressed. Also, the storage system must be able to supply a sufficient flow rate of hydrogen to the power plant to meet the required power demand at acceptable pressures and temperatures under all driving conditions. 2.1.7 Fuel Quality The storage system must reliably provide hydrogen at applicable fuel quality standards, within the power plant’s inlet specifications of temperature, pressure, and flow rate. For material-based

H2 Storage TT Roadmap Page 10
storage approaches, the storage system must be able to be charged with and deliver contaminant-free hydrogen that also meets the applicable fuel quality standards. 2.1.8 Dormancy Dormancy is a challenge for storage systems that operate at temperatures less than ambient (cold/cryo-compressed and adsorbents) and is critical to protect against of loss of driving range after extended periods of parking. As the temperature in the tank increases, the hydrogen pressure increases to the point that it needs to be released due to exceeding the maximum pressure rating of the tank. The period of time prior to this release (or boil-off point) is defined as the dormancy time. 2.1.9 Environmental, Health & Safety Applicable codes and standards for hydrogen storage systems and interface technologies, which will facilitate implementation/commercialization and assure safety and public acceptance, are being established for automotive applications. Standardized certification and regulation test methods are required for all hydrogen storage technologies.
H2 Storage TT Roadmap Page 11
3. Technical Targets and Current Status:
3.1 Technical Targets: Table 1 shows the 2020, 2025, and “Ultimate Full Fleet” technical targets for onboard hydrogen storage systems. The “Ultimate Full Fleet” or Ultimate set of targets are intended to make hydrogen-fueled vehicle platforms competitive across the majority of the vehicle classes (from small cars to light-duty trucks) and enable driving ranges approaching 500 miles, which would allow FCEVs to achieve significant market penetration. Early-stage R&D is critical to enable meeting these targets and to enable national leadership in emerging hydrogen and fuel cell technologies. The majority of these targets were originally established in 2003 through the FreedomCAR Partnership between DOE and the U.S. Council for Automotive Research (USCAR). Since then, and most recently in 2017, they have been periodically reviewed and updated based on technology assessments to ensure continued alignment with market driven requirements. The targets also include 2020 and 2025 hydrogen storage system targets of $10/kWh and $9/kWh respectively, which are consistent with the U.S. DRIVE Partner Level targets. All of the targets are subject to change as more is learned about system level requirements, as tradeoffs between targets are explored, and as fuel cell and hydrogen storage technologies progress. An explanation and justification for each target is provided in great detail in Appendix B - Target Explanation Document: Onboard Hydrogen Storage Systems for Light-Duty Vehicles.

H2 Storage TT Roadmap Page 12
Table 1. Technical System Targets: Onboard Hydrogen Storage for Light-Duty Fuel Cell Vehicles a (updated May 2017)
Storage Parameter Units 2020 2025 Ultimate
System Gravimetric Capacity: kWh/kg 1.5 1.8 2.2 Usable, specific-energy from H2 (net useful energy/max system mass) b
(kg H2/kg system) (0.045) (0.055) (0.065)
System Volumetric Capacity: kWh/L 1.0 1.3 1.7 Usable energy density from H2 (net useful energy/max system volume) b
(kg H2/L system) (0.030) (0.040) (0.050)
Storage System Cost : $/kWh net 10 9 8
($/kg H2) 333 300 266 • Fuel cost c $/gge at pump 4 4 4
Durability/Operability: • Operating ambient temperature d °C -40/60 (sun) -40/60 (sun) -40/60 (sun) • Min/max delivery temperature °C -40/85 -40/85 -40/85 • Operational cycle life (1/4 tank to full) Cycles 1500 1500 1500 • Min delivery pressure from storage system bar (abs) 5 5 5 • Max delivery pressure from storage system bar (abs) 12 12 12 • Onboard Efficiency e % 90 90 90 • “Well” to Powerplant Efficiency f % 60 60 60
Charging / Discharging Rates:
• System fill time g Min 3-5 3-5 3-5 • Minimum full flow rate (e.g., 1.6 g/s target for
80kW rated fuel cell power) (g/s)/kW 0.02 0.02 0.02
• Average flow rate (g/s)/kW 0.004 0.004 0.004 • Start time to full flow (20°C) S 5 5 5 • Start time to full flow (-20°C) S 15 15 15 • Transient response at operating temperature
10%–90% and 90%–0% (based on full flow rate) S 0.75 0.75 0.75
Fuel Quality (H2 from storage) h: % H2 Meet or exceed SAE J2719
Dormancy: I • Dormancy time target (minimum until first
release from initial 95% usable capacity) • Boil-off loss target (max reduction from initial
95% usable capacity after 30 days)
Days
%
7
10
10
10
14
10
Environmental Health & Safety: • Permeation & leakage j
-
• Meet or exceed SAE J2579 for system safety • Meet or exceed applicable standards • Conduct and evaluate failure analysis
• Toxicity - • Safety -
Useful constants: 0.2778 kWh/MJ; Lower heating value for H2 is 33.3 kWh/kg H2; 1 kg H2 ≈ 1 gal gasoline equivalent (gge) on energy basis

H2 Storage TT Roadmap Page 13
Footnotes to Target Table: a For a normalized comparison of system performance to the targets, a usable H2 storage capacity of 5.6 kg H2
should be used at the lower heating value of hydrogen (33.3 kWh/kg H2). Targets are for a complete system, including tank, material, valves, regulators, piping, mounting brackets, insulation, added cooling capacity, and all other balance-of-plant components. All capacities are defined as usable capacities that could be delivered to the fuel cell system. All targets must be met at the end of service life.
b Capacities are defined as the usable quantity of hydrogen deliverable to the fuel cell system divided by the total mass/volume of the complete storage system, including all stored hydrogen, media, reactants (e.g., water for hydrolysis-based systems), and system components. Capacities must be met at end of service life. Tank designs that are conformable and have the ability to be efficiently package onboard vehicles may be beneficial even if they do not meet the full volumetric capacity targets.
c Hydrogen threshold fuel cost is calculated to be competitive with a gasoline hybrid vehicle, and thus is independent of pathway. It is defined as the untaxed cost of hydrogen produced, delivered, and dispensed to the vehicle [http://hydrogen.energy.gov/pdfs/11007_h2_threshold_costs.pdf]. For material-based storage technologies, the impact of the technology on the hydrogen threshold fuel cost (e.g., off-board cooling, off-board regeneration of chemical hydrogen storage materials, etc.) must be taken into account.
d Stated ambient temperature plus full solar load (i.e., full exposure to direct sunlight). No allowable performance degradation from -20°C to 40°C. Allowable degradation outside these limits is to be determined.
e Onboard efficiency is the energy efficiency for delivering hydrogen from the storage system to the fuel cell powerplant, i.e., accounting for any energy required operating pumps, blowers, compressors, heating, etc. required for hydrogen release.
f Well-to-powerplant efficiency includes onboard efficiency plus off-board efficiency, i.e., accounting for the energy efficiency of hydrogen production, delivery, liquefaction, compression, dispensing, regeneration of chemical hydrogen storage materials, etc. as appropriate. H2A and HDSAM analyses should be used for projecting off-board efficiencies. Efficiencies less than the target may be acceptable if evidence can be given that well-to-powerplant carbon intensity (including delivery and dispensing of H2) can achieve less than 5 kg CO2e/kg H2. Argonne National Laboratory’s GREET model (https://greet.es.anl.gov/) should be used to calculate the carbon intensity of well-to-powerplant energy use.
g When applicable, the fill time should comply with SAE J2601, the Fueling Protocol for Light-Duty Gaseous Hydrogen Surface Vehicles.
h Hydrogen storage systems must be able to deliver hydrogen that meets acceptable hydrogen quality standards for fuel cell vehicles (see SAE J2719 and ISO/PDTS 14687-2). Note that some storage technologies may produce contaminants for which effects are unknown and not addressed by the published standards; these will be addressed by system engineering design on a case-by-case basis as more information becomes available.
i Dormancy targets assume vehicle is parked in 35°C ambient temperature and dormancy performance is maintained over the 15 year life of the vehicle.
j Total hydrogen lost into the environment as H2; relates to hydrogen accumulation in enclosed spaces. Storage systems must comply with applicable standards for vehicular fuel systems including but not limited to SAE J2579 and the United Nations Global Technical Regulation No. 13 (hydrogen and fuel cell vehicles). This includes any coating or enclosure that incorporates the envelope of the storage system.

H2 Storage TT Roadmap Page 14
3.2 Current Status:
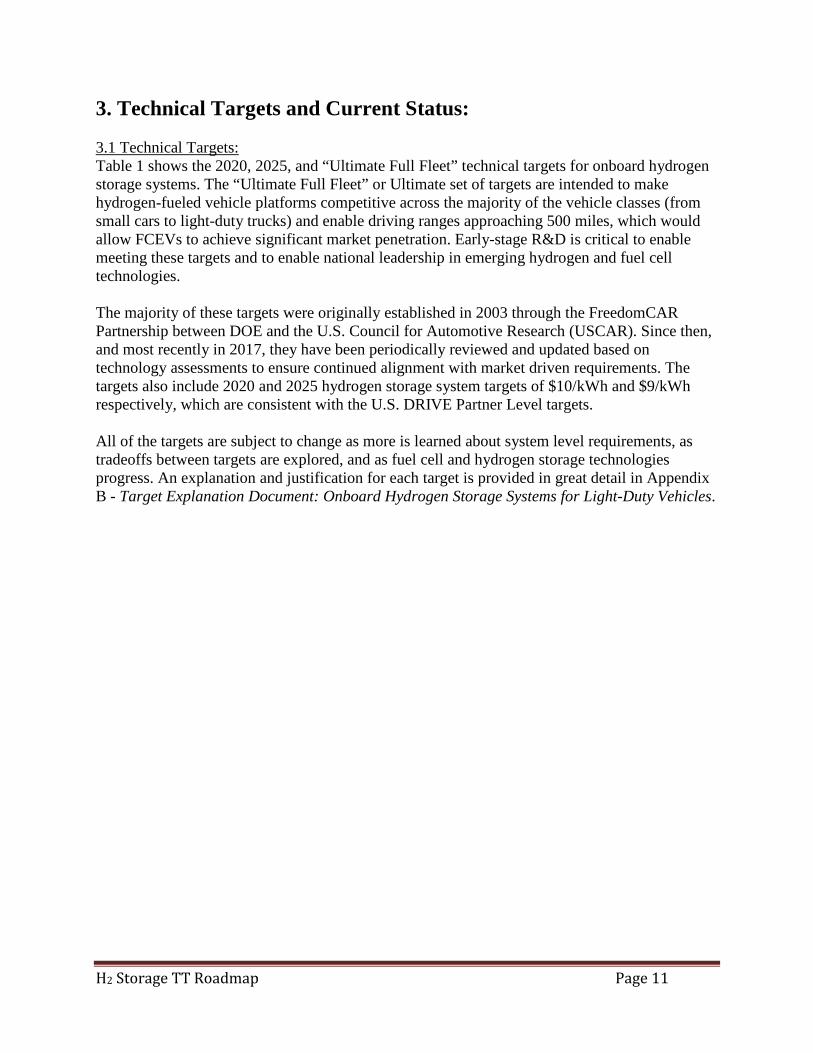
Figure 3. Potential Hydrogen Storage Technologies 3.2.1 Physical-based Storage The current near-term technology for onboard automotive hydrogen storage is 700 bar (10,000 psi) nominal working-pressure compressed vessels (i.e. “tanks”). Compressed gas storage systems have been demonstrated in hundreds of prototype fuel cell vehicles and are commercially available at low production volumes. The tanks within these systems have been certified worldwide according to ISO 11439 (Europe), ANSI/AGA HGV2 (U.S.), and Reijikijun Betten (Iceland) standards, and approved by TUV (Germany) and KHK (Japan). The United Nations is in the process of releasing a Global Technical Regulation that will unify the regulation requirements for the entire hydrogen storage system based on the guidance from SAE J2579. These standards include the minimum level of testing to determine the robustness of these hydrogen storage systems including hydraulic/pneumatic durability, burst, pressure cycle life, bonfire, chemical resistance, drop, penetration, environmental, and vehicle crash impact testing. SAE J2578, J2600, J2601, J2719, and J2799 (http://standards.sae.org/) provide the necessary references for vehicle and fueling interface standards. CSA and ISO also provide additional standards for component certification and qualification (e.g. CSA ANSI HGV 3.1). While compressed hydrogen storage is typically at ambient temperatures, cold and cryogenic compressed hydrogen storage is also being investigated for light-duty vehicles due to the higher hydrogen gas densities. These systems also offer potential advantages for heavy-duty vehicles and fleet applications that utilize consistent drive cycles and require long driving ranges. The broad delineation between cold and cryo is that a cold-compressed hydrogen storage system
Hydrogen Storage
Physical-based
Compressed Gas
Cryo-Compressed Liquid
Material-based
Reversible
Metal Hydride Adsorbent
Non-Reversible
Chemical Hydrogen Reforming
Ex. IsooctaneEx. NH3BH3Ex. MOF-5Ex. NaAlH4
H2 Storage TT Roadmap Page 15
could potentially utilize hydrogen gas delivered to the fueling station, which could be cooled, whereas cryo-compressed hydrogen storage will require liquid hydrogen to be delivered to the station. Another physical-based hydrogen storage approach is the cryogenic liquid hydrogen system that has also been demonstrated on vehicles in lower numbers. While these systems exhibit higher hydrogen densities, their overall system densities are reduced due to the need for insulation as well as the boil-off and venting that occurs from extended dormancy. As a result, this technology is not currently being pursued for light-duty vehicles. 3.2.2 Material-based Storage Material-based storage technologies include metal hydrides, sorbent-based materials, and chemical hydrogen storage materials (e.g., liquid carriers). Complex and conventional metal hydrides store hydrogen in solid form where hydrogen atoms are chemically bonded to other metal or semimetal atoms through ionic, covalent, or metallic-type bonds. All sorbents, such as micro-porous activated carbons or metal-organic frameworks (MOF), generally share a common mechanism of utilizing the weak van der Waals bonding between molecular hydrogen and the sorbent (on the order of 1 to 10 kJ/mol H2 for most sorbents), which results in the need for significantly colder storage temperatures to achieve the desired capacity. A third class of hydrogen storage materials are chemical hydrogen storage materials, which are covalent molecular materials. These materials have the potential to contain large quantities of hydrogen by mass and volume on a material basis and can be prepared in either a solid or liquid form. They can be heated directly, passed through a catalyst-containing reactor, or combined with water (i.e., hydrolysis) or other reactants to produce hydrogen. From 2005 to 2010, the DOE’s Fuel Cell Technologies Office funded three material Centers of Excellence7,8,9 that focused on developing advanced hydrogen storage materials capable of meeting the DOE hydrogen storage system-level performance targets. While significant progress was made across each material-based technology, no materials were identified that satisfied all of the stringent performance requirements for light-duty vehicles. From 2009 to 2016, the Hydrogen Storage Engineering Center of Excellence (HSECoE)10 was funded by DOE to advance the development of material-based hydrogen storage systems for hydrogen-fueled light-duty vehicles. The focus of the HSECoE was to develop complete, integrated system concepts that utilize condensed-phase materials as the primary hydrogen storage media (i.e., reversible metal hydrides, chemical hydrogen storage materials, and sorbents) and advanced engineering concepts and designs necessary to simultaneously meet or exceed all the DOE targets. Through their analysis and reverse engineering, the HSECoE was able to develop the material requirements necessary to meet the DOE 2025 targets.17,21
In late 2015, DOE initiated the Hydrogen Materials - Advanced Research Consortium (HyMARC)11 as part of the Energy Materials Network in order to accelerate materials discovery efforts. Through a highly coordinated combination of experimental and theoretical studies, HyMARC’s goal is to elucidate fundamental understanding of key phenomena governing the thermodynamics and kinetics that have been impeding the development of hydrogen storage materials for transportation applications. HyMARC will offer a conduit to provide this
H2 Storage TT Roadmap Page 16
foundational knowledge and key national laboratory resources to the hydrogen storage research community. The HyMARC core team will provide guidance and resources to other DOE hydrogen storage projects in the future to accelerate research. These separate material discovery projects, selected through periodic Funding Opportunity Announcements, will benefit from close collaboration and access to unique capabilities within HyMARC. The coordinated effort will also draw upon existing characterization and validation capabilities the DOE Hydrogen Storage Program has provided its projects access to in the past. Some of these include adsorption data validation for adsorbents, neutron characterization methods, unique spectroscopic capabilities, and novel synthetic development to validate various material-based storage concepts and mechanisms. As a whole, the consortium's integrated and focused efforts will enhance development of all classes of advanced hydrogen storage materials, including sorbents, metal hydrides, and liquid carriers. DOE has also identified several material-based approaches that were deemed unlikely to achieve the performance targets, including onboard reforming,12 hydrogen storage via hydrolysis of sodium borohydride,13 hydrolysis of aluminum metal and alloys,14 and adsorption by undoped single-wall carbon nanotubes,15 and the spillover mechanism. Further research in these areas was suspended or not initiated. The technical assessments of these technologies as made by DOE are publicly available via the sources noted above. 3.2.3 Projected Systems The projected performance and cost status of hydrogen storage systems currently in development are shown in Table 2. Although the gravimetric and volumetric capacities, along with cost, are used to demonstrate the performance status, there are 23 specific onboard storage targets (see Table 1 for specific list of targets) that must be met simultaneously in order to make hydrogen storage systems competitive with incumbent technologies. The current projected performance estimates, provided by Argonne National Laboratory, Strategic Analysis, and the HSECoE, assume a storage capacity of 5.6 kg of usable hydrogen. Because it is challenging to estimate system-level weights and volumes when research is still at the material development stage, the current status for each type of system will be revisited and updated periodically. A recently published DOE record16 documents that neither the 350 bar nor 700 bar compressed gas tanks can meet both the 2020 gravimetric and volumetric capacity targets. Only cryo-compressed storage is predicted to meet the gravimetric and volumetric targets for 2020, yet this technology still cannot meet all 23 targets, such as the dormancy and the well to powerplant efficiency targets. In addition, no physical hydrogen storage systems are currently projected to meet the cost targets presented in Table 1. Overall, there are significant gaps between the performance of current systems and the Ultimate gravimetric, volumetric, and system cost targets. For instance, while progress has been made developing and demonstrating numerous materials with gravimetric capacities exceeding 4.5 wt.%, the 2020, 2025, and Ultimate targets are system-level targets that include the material, tank, and all balance-of-plant components of the storage system. As a result, analyses and engineering efforts have shown that in order to meet the system-level targets, the gravimetric capacity of the material may need to be as much as twice that of the system-level target.17 It should also be noted that the system-level data includes the contributions of hydrogen or hydrogen media in both the cost and mass projections.

H2 Storage TT Roadmap Page 17
Table 2. Projected Performance of Hydrogen Storage Systems a
Hydrogen Storage System Gravimetric (kWh/kg sys)
Volumetric (kWh/L sys)
Cost ($/kWh; projected to
500,000 units/yr)
Year Published
700 bar compressed (Type IV) b 1.4 0.8 15 2015 300 bar compressed (Type IV) b 1.8 0.6 13 2013 Cryo-compressed (500 bar) c 2.3 1.4 18 2017 Metal Hydride (NaAlH4/Ti) d 0.4 0.4 43 2016 Sorbent (MOF-5, 100 bar, HexCell, LN2 cooling) d 1.3 0.7 15 2016
Chemical Hydrogen Storage (AB-liquid) d 1.5 1.3 17 2016
2020 Target Values 1.5 1.0 10 N/A 2025 Target Values 1.8 1.3 9 N/A Ultimate Target Values 2.2 1.7 8 N/A
Footnotes to Status Table: a Assumes a storage capacity of 5.6 kg of usable H2 b Based on Argonne National Laboratory performance and Strategic Analysis cost projections16,18
c Based on Argonne National Laboratory performance and Strategic Analysis cost projections19,20
d Based on Hydrogen Storage Engineering Center of Excellence performance projections21
The onboard hydrogen storage system can also have implications off-board the vehicle that are not typically reflected in the onboard cost and performance analyses. For instance, in order for a 700 bar compressed onboard hydrogen storage system to achieve the target refill time of 3 to 5 minutes, pre-cooling of the hydrogen down to a range of -20 to -40°C at the forecourt will be required to mitigate the heat of compression.22 In the case of reversible metal hydrides and sorbent systems, hydrogen refueling involves an exothermic reaction of hydrogen with the solid phase material. The evolved heat will have to be removed, typically involving off-board cooling equipment. In the case of chemical hydrogen storage materials, the spent dehydrogenated material will need to be removed from the vehicle for transport to a facility for regeneration back to hydrogenated fuel. When assessing onboard storage technologies, delivery and forecourt implications, including associated costs and technical challenges, will need to be addressed as well.
3.2.4 Demonstrated Systems Several material-based hydrogen storage systems have also been demonstrated in the laboratory or on prototype vehicles. These first-of-a-kind demonstrations help feed back to the program to guide further early-stage R&D and determine remaining technology gaps versus where technologies can be transitioned to the private sector. Examples of these systems that have been published within the recent past are given in Table 3. The quantity of hydrogen stored in laboratory tests was usually less than required for most light-duty passenger vehicles and not all operational parameters were evaluated.

H2 Storage TT Roadmap Page 18
Table 3. Summary of Demonstrations of Materials-based Hydrogen Storage Systems
Research Organization
Mass of H2 (kg) Storage Technology Demonstration
Platform Country Year Reported Reference
Millennium Cell & Chrysler 10.60 Hydrolysis (NaBH4) Passenger car USA 2002 23
Ovonic 3.00 Metal Hydride (AB2) & 100 bar H2 gas
Laboratory & prototype
passenger cars USA 2004 24
Ergenics 14.00 Metal Hydride (AB2) & 15 bar H2 gas
Laboratory & Mine Loader USA 2006 25
United Technologies Research Center 0.45 Metal Hydride
(NaAlH4) Laboratory USA 2007 26
Toyota 1.25 Metal Hydride (bcc-AB) & 350 bar H2 gas Laboratory Japan 2010 27
TU Munchen & UTR 0.70 Cryo-adsorption activated carbon Laboratory Germany /
Canada 2010 28
CNRS 0.10 Metal Hydride (MgH2) Laboratory France 2011 29 Sandia National Lab & General Motors 3.00 Metal Hydride
(NaAlH4) Laboratory USA 2011 30
U. Birmingham & EMPA 4.00 Metal Hydride (AB2) Canal Boat England &
Switzerland 2011 31
HZG 0.30 Metal Hydride (NaAlH4) Laboratory Germany 2012 32
Sandia National Lab, Ovonics, et al. 12 Metal Hydride (AB2) Portable Light Cart USA 2014 33
HySA Systems 0.20 Metal Hydride (AB2) Laboratory South Africa 2015 34 Helmholtz-ZG & TU Munchen 0.18 Metal Hydride
(NaAlH4) Laboratory Germany 2015 35
Hawaii Hydrogen Carrier 2.72 Metal Hydride
(MmNi4.5Al0.5) Forklift USA 2015 36
HSECoE ~0.05 Cryo-adsorption
(MOF-5); 100 bar; MATI
Laboratory USA 2016 21
Table 4 lists several makes and models of fuel cell vehicles, along with select associated hydrogen storage system metrics, that have been developed for either limited public use, a concept demonstration vehicle, or for retail sale / lease. The table was filtered based on three criteria including functioning vehicles (not concepts), relevance (post 2005), and those vehicles with viable references directly through an original equipment manufacturer (OEM) source. Table 4 highlights the hydrogen storage and range challenge as the chassis type reduces in size from a SUV to a subcompact car. Such data is periodically updated as vehicles are publically disclosed and certified by OEMs. Although the power plants of the vehicles are different, it should be noted that vehicle fuel economy is expected to increase with advancements in fuel cell performance, battery technology, and vehicle architecture including mass reduction.

H2 Storage TT Roadmap Page 19
Table 4. Examples of Onboard Hydrogen Storage Systems
Fuel Cell Vehicle
Storage Technology
Chassis Style
Curb Weight
(kg)
Useable a Mass of
H2 Stored (kg)
FE in miles / kg H2 (City /
Hwy) b
Driving Range (miles)
Latest Ref. Year
Vehicle & Storage
Reference (Source)
FE / Driving Range
Reference (Source)
Design Level: Retail (offered as a lease or purchase through dealer network) Hyundai Tucson 700 bar Small
SUV 4101 5.3 48/50 265 2014 OEM 37 EPA 4
Toyota Mirai 700 bar Subcom
pact Car 4079 4.7 66/66 312 2015 OEM 38 EPA 4
Honda Clarity 700 bar Midsize
Car 4134 5.4 68/66 366 2016 OEM 39 EPA 4
Mercedes-Benz GLC F-
Cell* 700 bar Compact
SUV no ref 4 63-66 c 300 2017 OEM 40 OEM 40
Design Level: Publically Operated (multiple vehicles built and certified units provided to customers)
Ford Focus 350 bar Compact Car 1600 4.0 48/53 200 2006 OEM 41 EPA
Chevrolet Equinox 700 bar Compact
SUV 2010 4.2 47 c 199 2007 OEM 42 Est./OEM 42
Nissan X-trail 350 bar Compact
SUV 1790 no ref no ref 229 2006 OEM 43 OEM 43
Kia Borrego 700 bar Full-size SUV 2300 7.8 60 c 470 2010 OEM 44 Est./OEM 44
Toyota Highlander FCHV-adv
700 bar Full-size SUV 1880 6.0 58 c 350 2011 OEM 45 Est./OEM 45
Design Level: Concept Demonstration (at least a single functional vehicle representative of a future product)
Ford Focus 700 bar Compact Car 1600 5.0 48/53 250 2010 OEM 41 EPA
VW Tiguan HyMotion 700 bar Compact
SUV 1870 3.2 44 c 142 2007 OEM 46 OEM
Chevrolet Sequel 700 bar Full-size
SUV 2170 7.7 39 c 300 2007 OEM 42 Est./OEM 42
Ford Explorer 700 bar Full-size
SUV 2560 9.5 40 380 d 2011 OEM 47 OEM 47/Est.
Footnotes to Status Table: SUV - sport utility vehicle, FE - Fuel Economy a Useable capacity was calculated if the total volume or capacity was indicated b Fuel economy can vary based on test method and real-world conditions
c Fuel economy was estimated based on range reference and useable capacity d Driving range was estimated based on fuel economy reference and useable capacity * Expected to be released as a retail vehicle in 2017
H2 Storage TT Roadmap Page 20
4. Gaps and Technical Barriers: 4.1 Physical Hydrogen Storage Systems (Including Compressed, Cold/Cryo-compressed, and Liquid) Hydrogen storage systems based on the physical containment of hydrogen as a compressed gas or as a liquid have been demonstrated that can meet many of the 2020 and 2025 targets, such as the operating temperature range, cycle life, delivery pressure, and refill rates. However, neither liquid based nor compressed systems (including cold/cryo-compressed tanks) currently meet the system cost targets, which is a crucial gap for the automotive industry. In addition, most of these systems do not meet the system level gravimetric and volumetric hydrogen capacity targets. These gaps are small, but they are still a significant challenge since further reductions in mass or volume will not be easily attained. For cryogenic systems, the loss of usable hydrogen during dormancy is also a key challenge. Finally, liquefying or compressing hydrogen requires a significant amount of energy, resulting in a gap to meeting the energy efficiency targets.48 4.2 Metal Hydride Hydrogen Storage Systems For many metal hydrides, the system mass and volume are excessive. Hydrogen containment and release are typically accompanied by temperature changes due to the enthalpy changes associated with the hydrogenation/dehydrogenation reactions. Since hydrides are often electrical and thermal insulators, a heat transfer system, material modification, or both are required to achieve sufficient hydrogen uptake, resulting in an increase in the system’s cost, mass, and volume. Additionally, hydrides can also undergo significant changes in volume upon hydrogenation/dehydrogenation. This results in densely packed powders in the discharged state and in turn, causing excessive force on walls as the hydride is re-formed during charging, in addition to potential mechanical attrition of the hydride particulates. These systems undergo chemical reactions and/or phase transitions during hydride formation, so the rate of hydrogen uptake will be slower relative to filling a compressed gas tank. Finally, if the enthalpy of dehydrogenation is high, then not only will the system operating temperature be high, but a significant amount of hydrogen will have to be burned to provide the heat necessary to release hydrogen. Likewise, materials having large enthalpies of hydrogen absorption will liberate large quantities of heat during refueling. The removal of this extraneous heat will require connecting the vehicle’s storage system to external, high-capacity heat exchangers at the refueling station to complete a hydrogen refill within the desired fueling time. 4.3 Sorbent-based Hydrogen Storage Systems As a result of the low binding energy, most sorbent materials must operate near cryogenic temperatures and consequently, most sorbent-based systems are configured in a similar manner as cryo-compressed systems, although typically at lower operating pressures. Generally, the sorbent material is contained within a pressurized tank surrounded by a multi-layer vacuum insulation. The hydrogen is typically released by reducing pressure and applying heat for the endothermic desorption. High surface area materials that have been studied for onboard hydrogen storage have shown favorable results for hydrogen uptake at moderate pressures, kinetics, purity, and reversibility at 77 K. Despite these promising characteristics, sorbent-based hydrogen storage has barriers similar to cryo-compressed tanks, such as system cost, volumetric capacity, and loss of useable hydrogen during dormancy. Cooling requirements will also lead to efficiency losses and higher hydrogen costs.

H2 Storage TT Roadmap Page 21
4.4 Chemical Hydrogen Storage Systems Unlike the other hydrogen storage methods, chemical hydrogen storage systems explored to date must be regenerated off-board the vehicle. In liquid form, these systems can be designed to operate like a conventional gasoline fuel system using low pressure liquid tanks and pumps. The challenge for these systems is the additional complexity of managing the dehydrogenation reactors (i.e., exothermic or endothermic materials), removing impurities from the hydrogen supply, and the transport of material (i.e., viscosity and flocculation) throughout the system. In addition, the off-board regeneration of the hydrogen carrier material leads to efficiency losses and higher overall cost of hydrogen utilization. Table 5 shows the major barriers for each type of storage system currently envisioned and additional details regarding each barrier follows. In addition, Appendix A contains examples of strategies that will be pursued to overcome each of the barriers outlined below.
Table 5. Existing Barriers for Potential Hydrogen Storage Systems
Physical-Based Storage Systems Material-Based Storage Systems
Barrier Compressed Cold / Cryo-Compressed
Metal Hydride Storage Systems
Sorbent-based
Storage Systems
Chemical Hydrogen Storage Systems
A) Materials of Construction B) Balance-of-Plant Cost C) Thermal Management D) Tank Cost E) Tank Mass F) Off-board Energy Efficiency G) Heat Transfer Systems H) Material Gravimetric Capacity I) Material Volumetric Capacity J) Reaction Thermodynamics K) Cryogenic Tank Operation L) High Temperature Tank
Operation M) Carbon Fiber Cost N) Material Thermal Conductivity O) Fuel Purity P) Kinetics Q) Reactor Design R) Material Handling
In more detail, the barriers for all types of hydrogen storage systems are:
A) Materials of Construction: The weight, volume, performance, operating temperature, and cost constraints limit the choice of construction materials and fabrication techniques for

H2 Storage TT Roadmap Page 22
high-pressure containment of compressed hydrogen and other hydrogen storage approaches. In addition, the materials of construction must be resistant to hydrogen embrittlement, permeation, and corrosion for all approaches. Research into new materials such as improved resins, engineered carbon fibers, and metallic, ceramic, and/or polymer composites are needed to meet cost targets without compromising performance. These materials also should be compatible with joining and sealing processing without impacting either manufacturing cost or system reliability.
B) Balance-of-Plant Cost: The balance-of-plant cost is often underestimated. The cost for valves, piping, and safety equipment is often a significant contributor to the system cost, even at high volumes, due to the specialized materials needed to manage moderate or high pressures of hydrogen. Hydrogen embrittlement is a concern for many metals, and those metals that are less susceptible (e.g., high alloy steel) are typically more expensive. The sheer part count in the balance-of-plant also adds to the assembly cost and raises reliability and durability issues.
C) Thermal Management: For most hydrogen storage options, including compressed, cryogenic, and materials-based systems, thermal management within the system is a key issue. In general, the main technical challenge for compressed gas and onboard reversible material systems is efficient heat removal during refueling to allow a complete hydrogen refill within the desired fueling time. For instance, -40°C precooling of the hydrogen gas is required for 700 bar compressed storage systems to offset the heat of compression that occurs during refuel (to avoid heating the storage vessel over 85°C and potentially damaging the liner and/or other components). Onboard reversible material systems also typically require heat to release hydrogen. In this case, heat (preferably using waste heat from the fuel cell) must be provided to the storage media at reasonable temperatures to meet the flow rates needed by the power plant. Finally, chemical hydrogen storage systems, depending upon the chemistry, are often exothermic upon release of hydrogen, or optimally thermoneutral. Thus, exothermic systems will also require heat rejection during operation.
D) Tank Cost: The manufacturing cost of high pressure tanks is significant. The cost is typically driven by high material costs (e.g., carbon fiber for Type II, III and IV tanks), complex manufacturing processes with specialized equipment, low volume techniques, and regulatory compliance.
E) Tank Mass: For current designs, the mass of the tank required to withstand the pressure and temperature of normal operation, fueling, and environmental stresses is too high to allow the total system to meet the gravimetric capacity target.
F) Off-board Energy Efficiency: The energy efficiency of the entire system is often strongly influenced by the energy required to produce and deliver the hydrogen. For example, precooling and compression of hydrogen is 10%–15% of the total energy in compressed hydrogen.48 Energy for liquefaction of hydrogen can require 25% of the energy in the liquefied hydrogen itself. 48,49 Off-board regeneration of certain chemical hydrogen storage materials may require significant energy in both heat and electricity.
G) Heat Transfer Systems: Heat transfer systems needed to add or remove heat from storage systems add cost due to materials and manufacturing complexity. The heat transfer systems must be efficient and meet the strict onboard energy efficiency targets for the storage system. For example, sorbents and metal hydride materials typically have low

H2 Storage TT Roadmap Page 23
thermal conductivity, so these systems require effective approaches to manage the heat of adsorption/absorption during fueling and desorption.
H) Material Gravimetric Capacity: The gravimetric capacity of hydrogen storage materials is critical. The material capacity must exceed the gravimetric system targets in order to meet the total hydrogen storage system target. If the target is not met, additional vehicle reinforcements could be required, further increasing the overall weight of the vehicle.
I) Material Volumetric Capacity: Due to low material densities, sorbent-based materials generally have lower hydrogen volumetric capacities. While the volumetric capacity can be improved through compaction of the sorbent material, compaction can lead to increases in manufacturing costs, and reductions in the surface area and gravimetric capacity of the material. Although the hydrogen volumetric densities can be high for metal hydrides,50 practical issues related to volume expansion/compression can reduce effective densities up to 40%–60% of theoretical values. Approaches to maintain hydride particle size or enhance kinetics using porous scaffolds also reduce the effective hydrogen density. Using chemical hydrogen storage materials as solutions or slurries will reduce volumetric densities in a similar fashion.
J) Reaction Thermodynamics: The enthalpy of reaction is the change in energy between the initial and final states. It therefore relates to the amount of heat that needs to be added or removed during hydrogen release or charging of a material. The release of hydrogen from most sorbents and reversible metal hydrides is endothermic (i.e., requires an input of energy), while for chemical hydrogen storage materials, hydrogen release might be endothermic (e.g., alane) or exothermic (e.g., ammonia borane). High reaction enthalpies for materials with endothermic hydrogen release are deleterious since they require greater heat rejection during charging and may require consumption of some of the stored hydrogen to provide the energy for release. This reduces the onboard efficiency and also requires more effective thermal management structures within the system. For current hydrogen sorbents, the reaction enthalpy (commonly referred to as binding energy or heat of adsorption), is too low, thus requiring cryogenic temperatures to achieve significant adsorbed capacities. Sorbent materials with higher heat of hydrogen adsorption are required to avoid cryogenic operation.
K) Cryogenic Tank Operation: Cryogenic tanks must withstand extremely cold temperatures, allow only trivial heat transfer, and tolerate occasional large pressure and temperature swings from relatively warm to extreme cold. These tanks must maintain these properties for the life of the tank, which can be a challenge for tanks insulated with vacuum jackets where the vacuum and thus insulation properties can degrade over time. In addition, these systems typically require instrumentation and other potential sources of heat conduction that penetrate the layers of the tank. To achieve low heat transfer, the system designs must have few penetrations and still perform all required functions.
L) High-Temperature Tank Operation: Tanks must be able to tolerate moderate to high temperatures based on the reaction temperature needed to release the hydrogen from a given hydrogen storage material. The tank components and materials must be inert to hydrogen at elevated operating temperatures and pressure.
M) Carbon Fiber Cost: High strength carbon fiber is expensive. Recent calculations show that carbon fiber is the most expensive component in high pressure compressed gas systems, accounting for up to 75% of the cost at high manufacturing volume. 18 New feedstock and processing techniques are needed to reduce the cost of the carbon precursors by

H2 Storage TT Roadmap Page 24
minimizing the capital cost and reducing the required processing energy. Reductions in the cost of carbon fiber may also benefit metal hydride and sorbent based material systems depending upon their system pressure.
N) Material Thermal Conductivity: The need for heat transfer within the tanks of metal hydride or sorbent based systems can require the addition of material with high thermal conductivity or other heat transfer enhancement, such as metal fins. This adds mass, volume, and cost to the system, but can result in increased hydrogen uptake and refilling rates. These tradeoffs must be examined and balanced to find the optimal system.
O) Fuel Purity: For chemical hydrogen storage materials and some metal hydrides (e.g., amides and borohydrides), the presence of constituents that poison the fuel cell (e.g., ammonia or diborane) will require additional purification elements within the system if released with the hydrogen. Such loss of constituents from the storage material also negatively impact the long term durability of the material.
P) Kinetics: The rate at which hydrogen is stored or released is determined by the kinetics of absorption and desorption. The reactions in metal hydride materials are complex solid phase transformations, which may not be inherently fast and are difficult to catalyze effectively in the solid state.
Q) Reactor Design: Chemical hydrogen storage systems require reactor designs that control the temperature to avoid run away conditions (i.e., exothermic material) or to optimize the hydrogen release (i.e., endothermic material).
R) Material Handling: The handling of the bulk chemical hydrogen storage material within the system is important to achieve the required fueling rates and ensure the continuous transport of hydrogen storage material throughout the system at temperature extremes. Material handling issues include segmentation, flocculation, and stability for both the hydrogenated and dehydrogenated material.
H2 Storage TT Roadmap Page 25
5. R&D Strategy to Overcome Barriers and Achieve Technical Targets: Future hydrogen storage efforts will focus primarily on early-stage R&D of onboard vehicular hydrogen storage approaches that will allow for a commercially viable system that provides a driving range of at least 300 miles across vehicle platforms. There are specific 2020, 2025, and Ultimate Full-Fleet technical targets for a commercially viable system including: gravimetric, volumetric, and cost targets as indicated in Table 1. Storage approaches that will be pursued to achieve commercial viability with acceptable driving range include compressed hydrogen tanks for near-term vehicles, and cold and cryo-compressed hydrogen, material-based storage, and other advanced concepts for longer-term vehicle applications (2020 and beyond). The near- and long-term strategies are explained in greater detail below. In addition, Appendix A contains examples of specific strategies that will be pursued to overcome each of the barriers outlined in Section 4. 5.1 Near-Term Strategy: Ambient temperature compressed gas storage is currently the most mature storage technology for use onboard vehicles. At ambient temperatures, the density of hydrogen gas itself at 700 bar is approximately 40 g/L. Therefore, after factoring in the additional volume of the system, a 700 bar compressed ambient storage system is unable to meet either the 2020, 2025, or Ultimate system level storage targets of 30, 40, or 50 g/L, respectively. However, the technology has been used on most of the hydrogen fuel cell vehicles demonstrated to date, including 179 (51 at 700 bar and 128 at 350 bar) of the 183 vehicles that participated in DOE’s Controlled Hydrogen Fleet and Infrastructure Demonstration and Validation Project, and the first three FCEVs released commercially in the U.S., the Hyundai Tucson Fuel Cell, the Toyota Mirai and the Honda Clarity. According to fueleconomy.gov, the 2017 models of these vehicles have projected driving ranges of 265, 312 and 366 miles respectively.4 Since this technology has the potential to achieve the driving range target, it is considered a promising near-term commercialization pathway. While limited improvements in these systems can be expected by reducing the weight and volume of balance-of-system components, the main strategy to advance this technology is to reduce the cost of high-pressure compressed gas vessels. Early-stage R&D could provide significant advances to help reduce cost, while also enabling storage systems to simultaneously meet the other challenging targets. In 2013 Strategic Analysis Inc., working with Argonne National Laboratory, did a thorough Design for Manufacture and Assembly analysis to project the cost of complete state-of-the-art 700 bar, Type IV composite overwrapped pressure vessel systems for onboard vehicle hydrogen storage. For single tanks systems with 5.6 kg H2 capacity, the projections ranged from a cost of about $33/kWh at 10,000 system per year to $17/kWh at 500,000 systems per year. While the balance-of-plant (BOP) is the major cost contributor (approximately 57%/~$19/kWh) at low annual volumes, the BOP represents only about 30% of the total system costs at high annual volumes and the cost is dominated by carbon fiber composite (Figure 4).18 Therefore, the program will emphasize efforts to address the major cost elements of compressed gas systems. These efforts may include development of low-cost precursors for the production of high-strength carbon fiber, lower cost carbon fiber production processes, carbon fiber/resin modifications to increase overall composite strength, and

H2 Storage TT Roadmap Page 26
identification of alternatives to carbon fiber. Research and analyses on improved and alternative tank designs will be pursued to reduce the amount of carbon fiber composite required to meet performance specifications. Additional cost reductions are expected to be achieved through advancements in tank liners, end bosses, and balance-of-plant components. As an example of how focus on the key cost drivers can reduce cost, in 2015 Strategic Analysis updated their cost analysis accounting for results obtained for R&D activities carried out with DOE Hydrogen Storage Program support.16 Through use of a lower-cost carbon fiber precursor, an alternative resin to epoxy and integration of several BOP components, the analysis projected the potential for a 25% cost reduction over the 2013 baseline. However, over the same time period, it was determined that a design feature included in the baseline system would not likely be adopted by manufacturers and that manufacturers applied a wider coefficient of variation for material properties in their designs, resulting in approximately a 13% increase in cost. The 2015 update therefore indicated an overall potential for a 12% cost reduction over the 2013 baseline, as shown in Figure 5. The sensitivity of the system costs to various component and processing costs was also analyzed. Figure 6 shows the key parameters determined to effect system cost through a single variable sensitivity analysis. The carbon fiber base price was found to be the dominant factor, followed by BOP cost, composite mass (i.e., the amount of composite required), resin cost, and filament winding capital cost.
Figure 4. Percent Cost Breakdown of a 700 bar Type IV Hydrogen Storage System at 500k Units per Year18
CompositeMaterials & Processing
67%
BOP & Assembly
30%

H2 Storage TT Roadmap Page 27
Figure 5. Cost Reduction based on DOE Hydrogen Storage Program supported R&D compared to the 2013 baseline for 700 bar, Type IV Hydrogen Storage Systems16
Figure 6. Single Variable Sensitivity Analysis of 700 bar Type IV Hydrogen Storage Systems16
H2 Storage TT Roadmap Page 28
5.2 Long-Term Strategies: Early-stage R&D is critical to maintain momentum and enable U.S. leadership in hydrogen storage technologies. In addition to vehicular applications, such R&D can also support national needs in grid resiliency, stationary and portable power applications, and a range of defense related applications. When the storage temperature of hydrogen is lowered, higher gas densities can be obtained. Therefore, the concept of storing hydrogen at sub-ambient temperatures will be explored as a long-term strategy to better meet DOE onboard storage targets. Work at Lawrence Livermore National Laboratory, with further analyses by Argonne National Laboratory and Strategic Analysis Inc., have indicated that cryo-compressed hydrogen storage systems have potential to meet the 2020 and 2025 gravimetric and volumetric storage targets.19,20 Cold-compressed hydrogen gas storage systems operating at temperatures that are sub-ambient, but not as low as cryogenic, may also provide advantages over ambient temperature compressed gas storage without requiring either liquid hydrogen delivery or vacuum jacketed insulated vessels. Therefore, the potential of sub-ambient gas storage will be investigated over a range of storage temperatures, along with consideration of the impact that the storage temperature will have on the infrastructure requirements. Advanced materials-based hydrogen storage technologies with potential to meet all DOE onboard vehicle hydrogen storage targets will be pursued for longer term application. From 2005 through 2010, the DOE funded three Centers of Excellence (CoE) to develop advanced materials—one center for each of reversible metal hydrides, hydrogen sorbents, and off-board regenerable chemical hydrogen storage materials. Over the five-year life of the three CoEs,7,8,9 millions of distinct material compositions and structures were investigated computationally, and hundreds of new materials were synthesized and their hydrogen storage properties characterized. These efforts significantly increased the knowledge base of potential hydrogen storage materials. One identified need was to better understand the correlation between prospective material properties and complete system performance. From 2009 to 2016 a fourth CoE, the Hydrogen Storage Engineering Center of Excellence (HSECoE),10 was supported to carry out engineering-focused research and development of complete materials-based hydrogen storage systems for onboard automotive applications. The HSECoE developed complete integrated system models that couple various hydrogen storage system modules with a Proton Exchange Membrane (PEM) fuel cell model and vehicle model that allowed system performance be evaluated as a function of vehicle drive cycles. Results from the HSECoE have been used to identify both materials and system engineering gaps between the state-of-the-art technology and the onboard storage targets. These efforts allowed for determination of material-level properties required for a system to meet the performance targets,17,21 which will be used to guide material development efforts. The integrated models have been made available to the research community and will be used to project system performance for hydrogen storage materials as they are developed.51

H2 Storage TT Roadmap Page 29
R&D strategies to advance longer term materials-based technologies to overcome the technical barriers and meet DOE onboard vehicle performance targets will also be pursued. Current projections for reversible metal hydrides indicate that a material with an enthalpy sufficiently low to allow use of PEM fuel cell waste heat to provide the energy of desorption (i.e., approximately 25-30 kJ/mole of H2) will need to have a gravimetric capacity of about 11 wt.% and much faster kinetics below 100°C than existing materials.17 Therefore, reversible metal hydride efforts will focus on identifying high capacity materials with low enthalpy and improving the sorption and desorption kinetics within relevant temperature ranges. Current cryogenic sorbents cannot meet volumetric targets; thus, efforts will be focused on improving the hydrogen volumetric storage density of these materials. Also, increasing their operational temperature closer to ambient would improve overall system performance. Chemical hydrogen storage materials that require off-board regeneration need to be maintained in a liquid phase throughout the hydrogenation/dehydrogenation cycle over the complete operating and ambient temperature range. Consequently, efforts on these materials will include focus on liquid-phase materials with high hydrogen densities. Also, the regeneration costs and efficiencies need to be significantly improved over current state-of-the-art materials and processes. The Hydrogen Storage Tech Team will also work closely with the Hydrogen Delivery Tech Team as chemical hydrogen storage materials or liquid carriers can also be used as a carry to delivery hydrogen at the station. To accelerate development of hydrogen storage materials with the requisite properties to meet the onboard storage targets, the DOE Hydrogen Storage Program launched the Hydrogen Materials – Advanced Research Consortium (HyMARC) in 2016.11 HyMARC is part of the Energy Materials Network (EMN)52 established by EERE to accelerate development and implementation of advanced materials in energy applications through facilitating access to world-class resources within the DOE National Laboratories. HyMARC’s goal is to enable the development of hydrogen storage materials capable of doubling the energy density of current onboard storage systems, i.e., achieving at least 50 grams hydrogen per liter system volume. The core national laboratory team consists of Sandia, Lawrence Livermore and Lawrence Berkeley National Laboratories. The effort is further supported by the National Renewable Energy and Pacific Northwest National Laboratories and the NIST Center for Neutron Research that provide extensive characterization and validation capabilities. The core national laboratory team is charged with carrying out foundational research on the interaction phenomena of hydrogen with storage materials to develop computational tools for the design of materials with targeted properties. The team also develops synthetic methodologies to produce materials with specific morphologies and characteristics and characterization protocols to analyze the materials. Individual materials development projects will be selected through competitive Funding Opportunity Announcements (FOAs) from industry, universities and national laboratories, to interact with the HyMARC team. 5.3 Leveraging U.S. DRIVE Efforts: Whenever possible, the program will coordinate with other DOE offices (e.g., Vehicles Technologies Office, Advanced Manufacturing Office, Office of Science, and Advanced Research Project Agency – Energy [ARPA-E]), the Defense Advanced Research Project Agency (DARPA), and the National Aeronautics and Space Administration (NASA), to identify and leverage related activities. In addition, research and development activities are being carried out

H2 Storage TT Roadmap Page 30
on hydrogen storage technologies for light-duty vehicles around the world. These efforts will continue to be leveraged to advance the U.S. DRIVE partnership efforts. The Institute for Advanced Composites Manufacturing Innovation (IACMI), an institute of the Manufacturing USA network, managed by the DOE Advanced Manufacturing Office, will be leveraged for cost reduction and performance improvements for compressed hydrogen storage systems. Consortia of the Energy Materials Network, such as LightMAT, managed by the DOE Vehicle Technologies Office, will be leveraged appropriately. Participation at key conferences and establishment of formal and informal collaborations that are expected to benefit the U.S. DRIVE efforts are also encouraged. Finally, within the U.S. DRIVE Partnership, the Hydrogen Storage Technical Team interacts with several other technical teams where hydrogen storage targets and technology pathways are impacted by their analyses. These technical teams include Fuel Cells, Fuel Pathway Integration, Hydrogen Delivery, Hydrogen Production, Materials, and Hydrogen Codes and Standards Technical Teams.

H2 Storage TT Roadmap Page 31
Appendix A: Example Strategies to Overcome Existing Barriers (Barriers Provided in Table 5)
Table 6a. Example Strategies to Overcome Existing Barriers for Physical Hydrogen Storage Systems
Barrier Compressed Cold & Cryo-Compressed
A) Materials of Construction
1) Metallic embrittlement qualification 1) Metallic embrittlement qualification
2) Polymer permeation standardization 2) Qualification methods for cold or cryogenic high pressure hydrogen
3) Advancement in sealing robustness 3) Advancement in sealing robustness 4) Compatible joining technology 4) Compatible joining technology
B) Balance-of-Plant Cost
1) Low-cost metallic options 1) Low-cost metallic options 2) Polymer replacement of metals 2) Polymer replacement of metals 3) Component reduction / integration 3) Component reduction / integration 4) Standardization of components 4) Standardization of components
C) Thermal Management 1) Alternative, heat dissipating liners 2) Alternative fueling protocols
1) Tank / BOP insulation 2) Heat exchanger 3) Tank conditioning during refuel
D) Tank Cost
1) Optimize carbon fiber/resin utilization 1) Type III optimization of metal liner/carbon fiber/resin utilization
2) Alternative fibers / precursors 2) Insulation 3) Enhance filament winding process 3) Enhance filament winding process 4) Liner alternatives 4) Liner alternatives/manufacturing 5) Boss design/interface considerations 6) Regulatory compliance screening / optimization
E) Tank Mass
1) Optimize carbon fiber / resin utilization 1) Type III optimization of metal liner, carbon fiber, & resin utilization
2) Polymer replacement of metals 2) Insulation 3) Liner alternatives 3) Liner alternatives 4) Boss design / interface considerations
F) Off-board Energy Efficiency 1) Hydrogen Delivery TT working on more efficient compressors / compression schemes 2) Alternative fueling protocols
1) Hydrogen Delivery TT working on liquefaction / compression energy optimization
G) Heat Transfer Systems H) Material Gravimetric Capacity I) Material Volumetric Capacity J) Reaction Thermodynamics
K) Cryogenic Tank Operation 1) Tank / BOP Insulation (vacuum jacketed tank) 2) Metal liner / carbon fiber thermal expansion cycling
L) High Temp. Tank Operation
M) Carbon Fiber Cost
1) New precursor feedstock 1) New precursor feedstock 2) Revise precursor material / processing 2) Revise precursor material / processing 3) Decrease carbon fiber capital cost 3) Decrease carbon fiber capital cost 4) Optimize carbon fiber processing energy 4) Optimize carbon fiber processing energy 5) Evaluate alternative fiber qualification methods 5) Evaluate alternative fiber qualification methods
N) Material Thermal Conductivity O) Fuel Purity P) Kinetics Q) Reactor Design R) Material Handling

H2 Storage TT Roadmap Page 32
Table 6b. Example Strategies to Overcome Existing Barriers for Material-Based Hydrogen Storage Systems
Barrier Metal Hydride Storage Systems Sorbent-based Storage Systems Chemical Hydrogen Storage Systems
A) Materials of Construction
1) Metallic embrittlement qualification
1) Metallic embrittlement qualification 1) Corrosion resistant liners
2) Compatible joining technology 2) Qualification methods for cold or cryogenic high pressure hydrogen
2) Dual liquid containers with bladder isolation between source and spent fuel
3) Advancement in sealing robustness 3) Advancement in sealing robustness 3) Robustness to slurry residual
4) Compatible joining technology 4) Compatible joining technology
B) Balance-of-Plant Cost
1) Low-cost metallic options 1) Low-cost metallic options 1) Low-cost metallic options 2) Polymer replacement of metals 2) Polymer replacement of metals 2) Polymer replacement of metals 3) Component reduction / integration 3) Component reduction / integration 3) Component reduction / integration
4) Standardization of components 4) Standardization of components 4) Standardization of components
C) Thermal Management 1) Heat rejection during refueling 1) Heat rejection during refueling 1) Heat rejection during operation 2) Fuel cell waste heat utilization 2) Fuel cell waste heat utilization 2) Fuel cell waste heat utilization 3) Internal cooling / heat tubes 3) Internal cooling/heating tubes
D) Tank Cost
1) Optimize carbon fiber/resin utilization
1) Move to lower pressure Type I tanks
2) Alternative fibers 2) H2 volumetric density improvement
3) Enhance filament winding process
4) Liner alternatives 5) Boss design/interface considerations
6) H2 gravimetric density improvement
E) Tank Mass 1) Type I to Type IV migration
1) Optimize carbon fiber / resin utilization
2) Polymer replacement of metals 3) Liner alternatives 4) Boss design/interface considerations 5) H2 storage density improvement
F) Off-board Energy Efficiency
1) Lower pressure operation to reduce compression requirements 1) Single step fuel regeneration of
spent fuel 2) Increase material / system operating temperature
G) Heat Transfer Systems 1) Internal integrated heat exchanger 1) Internal integrated heat exchanger 1) Internal integrated heat exchanger
H) Material Gravimetric Capacity
1) Lighter Z metal hydride alloy development
1) High specific surface area adsorbents
1) Increase the solids loading of the carrier liquid
I) Material Volumetric Capacity
1) Optimize packing density of powders while accommodating volumetric changes between absorption / desorption without restricting H2 gas permeation in beds
1) Increase in adsorbent packing density without restricting H2 gas permeation in beds 2) Optimize micro-pore volume
1) Increase the solids loading of the carrier liquid

H2 Storage TT Roadmap Page 33
J) Reaction Thermodynamics
1) Reduce enthalpy to reduce operating temperature
1) Metal addition to increase isosteric enthalpy
1) Safety mechanisms to prevent thermal run-away for exothermic materials 2) Burning H2 for endothermic materials
K) Cryogenic Tank Operation
1) Electron back-donation to insure constant isosteric enthalpy
2) Efficient cooling to low temperature during refueling 3) Tank / BOP Insulation (vacuum jacketed tank)
L) High Temperature Tank Operation
1) Elevated temperature inert tank component evaluation
1) Maintaining fuel & reaction products in liquid / slurry phases using higher temp
M) Carbon Fiber Cost
N) Material Thermal Conductivity
1) Novel heat exchangers 2) Heat transfer fluid
1) Exfoliated graphite additives 2) High conductivity metal foam /tube encasement
O) Fuel Purity
1) Regenerable impurity (ammonia / borane) filters
1) Regenerable impurity (ammonia / borane) filters
2) Containment of volatile liquid organic compounds or solvents
2) Containment of volatile liquid organic compounds or solvents
3) Filters to prevent migration of particulates 3) Gas liquid separator
P) Kinetics 1) Catalyst additions
1) Catalyst additions
2) Shorten diffusion path 2) Integration of ballast tank in system
Q) Reactor Design 1) Design to accommodate pumping viscous slurries 2) Improved catalyst lifetimes
R) Material Handling 1) Develop stable slurries / ionic liquids 2) Robust low temperature operation and freeze start performance
H2 Storage TT Roadmap Page 34
References
1 Office of Energy Efficiency and Renewable Energy, “Fuel Cell Technologies Office,” U.S. Department of Energy, https://energy.gov/eere/fuelcells/fuel-cell-technologies-office. 2 Distribution of 2015 Light-duty Vehicle Sales in the U.S. Market by Driving Range, Courtesy of Marc Melaina / Eleftheria Kontou (NREL) and David Greene (ANL) 3 National Renewable Energy Laboratory, “Innovation for Our Energy Future,” http://www.nrel.gov/hydrogen/docs/cdp/cdp_2.ppt. 4 http://www.fueleconomy.gov/feg/fcv_sbs.shtml 5 https://www.hydrogen.energy.gov/pdfs/15011_low_volume_production_delivery_cost.pdf 6 http://www.nrel.gov/docs/fy14osti/58564.pdf 7 Lennie Klebanoff and Jay Keller, Final Report for the DOE Metal Hydride Center of Excellence, Sandia National Laboratory, https://energy.gov/eere/fuelcells/downloads/final-report-doe-metal-hydride-center-excellence. 8 Kevin Ott, Final Report for the DOE Chemical Hydrogen Storage Center of Excellence, Los Alamos National Laboratory, https://energy.gov/eere/fuelcells/downloads/final-report-doe-chemical-hydrogen-storage-center-excellence. 9 Lin Simpson, Final Report for Hydrogen Sorption Center, U.S. Department of Energy, prepared by Sandia National Laboratory (Golden, CO: Sandia National Laboratory, 2010), https://energy.gov/eere/fuelcells/downloads/hydrogen-sorption-center-excellence-hscoe-final-report. 10 U.S. Department of Energy, “Hydrogen Storage Engineering Center of Excellence,” http://hsecoe.org/. 11 Hydrogen Materials – Advanced Research Consortium: https://hymarc.org/ 12 Office of Energy Efficiency and Renewable Energy, On-board Fuel Processing Go/No-go Decision, U.S. Department of Energy, (Washington, D.C.: U.S. Department of Energy, 2004), http://www1.eere.energy.gov/hydrogenandfuelcells/pdfs/committee_report.pdf. 13 U.S. Department of Energy Hydrogen Program, Go/No-Go Recommendation for Sodium Borohydride for Onboard Vehicular Hydrogen Storage, prepared by Sandia National Laboratory (Golden, CO: Sandia National Laboratory, 2007), http://www1.eere.energy.gov/hydrogenandfuelcells/pdfs/42220.pdf. 14 J. Petrovic and G. Thomas, Reaction of Aluminum with Water to Produce Hydrogen, U.S. Department of Energy (Washington, D.C.: U.S. Department of Energy, 2010), http://www1.eere.energy.gov/hydrogenandfuelcells/pdfs/aluminum_water_hydrogen.pdf. 15 United States Department of Energy Hydrogen Program, Go/No-Go Decision: Pure, Undoped Single Wall Carbon Nanotubes for Vehicular Hydrogen Storage (Washington, D.C.: U.S. Department of Energy, 2006), http://www.hydrogen.energy.gov/pdfs/go_no_go_nanotubes.pdf. 16 DOE Hydrogen and Fuel Cells Program Record #15013 “Onboard Type IV Compressed Hydrogen Storage System – Cost and Performance Status 2015” (9/30/15) https://www.hydrogen.energy.gov/pdfs/15013_onboard_storage_performance_cost.pdf

H2 Storage TT Roadmap Page 35
17 J. M. Pasini, C. Corgnale, B. A. van Hassel, T. Motyka, S. Kumar, K. L. Simmons, “Metal hydride material requirements for automotive hydrogen storage systems,” Int. J. Hydrogen Energy. 38 (2013) 9755-9765 18 DOE Hydrogen and Fuel Cells Program Record #13010 “Onboard Type IV Compressed Hydrogen Storage System – Cost and Performance Status 2015” (7/17/13) https://www.hydrogen.energy.gov/pdfs/13010_onboard_storage_performance_cost.pdf 19 2017 Annual Merit Review Presentation – ANL (Rajesh) – “System Level Analysis of Hydrogen Storage Options” https://www.hydrogen.energy.gov/pdfs/review17/st001_ahluwalia_2017_o.pdf 20 Based on 2017 preliminary cost projections from Strategic Analysis (James) 21 2016 Annual Merit Review Presentation - SRNL (Anton) – “Hydrogen Storage Engineering Center of Excellence” https://www.hydrogen.energy.gov/pdfs/review16/st004_anton_2016_o.pdf 22 Jessie Schneider, SAE J2601- Worldwide Hydrogen Fueling Protocol: Status, Standardization & Implementation (presentation, California Energy Commission workshop, Diamond Bar, California, July 10, 2012), http://www.energy.ca.gov/contracts/notices/2012-07-10_workshop/presentations/SAE_Jesse_Schneider_Fueling_Protocol.pdf. 23 2004 Annual Merit Review Presentation - Millennium Cell Inc. (Wu), “Development of Advanced Chemical Hydrogen Storage and Generation System” http://www.hydrogen.energy.gov/pdfs/review05/stp_10_wu.pdf. 24 B. S. Chao, R.C.Young, V. Myasnikov, Y. Li, B. Huang, F. Gingl, P.D. Ferro, V. Sobolev, and S.R. Ovshinsky, “Recent Advances in Solid Hydrogen Storage Systems,” Mat. Res. Soc. Symp. Proc. 801 (2004): BB1.4.1. 25 A. R. Miller, D. H. DaCosta, M. Golben, “Reversible Metal-hydride Storage for a Fuel Cell Mine Loader” (presentation, Intertech’s Hydrogen Production & Storage Forum, Vancouver, Canada, September 11–13, 2006). 26 D.A. Mosher, S. Arsenault, X. Tang, D.L. Anton, “Design, fabrication and testing of NaAlH4 based hydrogen storage systems,” J. Alloys Compounds 446–447 (2007): 707. 27 K. Komiya, et al., “High-Pressure Hydrogen-Absorbing Alloy Tank for Fuel Cell Vehicles,” SAE International Publication 2010-01-0851, 2010, doi:10.4271/2010-01-0851. 28 R. Paggiaro, F. Michl, P. Benard, W. Polifke, “Cryo-adsorptive hydrogen storage on activated carbon. II: Investigation of the thermal effects during filling at cryogenic temperatures,” Int. J. Hydrogen Energy 35 (2010): 648–659. 29 S. Garrier, A. Chaise, P. de Rango, P. Marty, B. Delhomme, D. Fruchart, S. Miragli, “MgH2 intermediate scale tank tests under various experimental conditions,” Int. J. Hydrogen Energy, 36 (2011): 9719. 30 T. Johnson, S. Jorgensen, D. Dedrick, “Performance of a Full-Scale Hydrogen-Storage Tank Based on Complex Hydrides,” Faraday Discuss. 151 (2011): 327–352. 31 A. I. Bevan, A. Zuettel, D. Book, I. R. Harris, “Performance of a metal hydride store on the ‘‘Ross Barlow’’ hydrogen powered canal boat,” Faraday Discuss. 151 (2011): 353–367. 32 J. M. Bellosta von Colbe, et al., “Behavior of scaled-up sodium alanate hydrogen storage tanks during sorption,” Int. J. Hydrogen Energy 37 (2012): 2807. 33 C. Song, L.E. Klebanoff, T.A. Johnson, B.S. Chao, A.F. Socha, J.M. Oros, C.J. Radley, S. Wingert, J.S. Breit, “Using metal hydride H2 storage in mobile fuel cell equipment: Design and predicted performance of a metal hydride fuel cell mobile light,” Int. J. Hydrogen Energy 39 (2014) 14896.

H2 Storage TT Roadmap Page 36
34 M. Lototskyy, I. Tolj, M.W. Davids, P. Bujlo, F. Smith, B.G. Pollet, ‘‘Distributed hybrid’’ MH–CGH2 system for hydrogen storage and its supply to LT PEMFC power modules,” J. Alloys Compounds 645 (2015): S329. 35 J. M. Bellosta von Colbe, G. Lozano, O. Metz, T. Bucher, R. Bormann, T. Klassen, M. Dornheim, “Design, sorption behaviour and energy management in a sodium alanate-based lightweight hydrogen storage tank,” Int. J. Hydrogen Energy 40 (2015) 2984. 36 C. M Jensen & A. Narvaez, “Low Cost, Metal Hydride Based Hydrogen Storage System for Forklift Applications”, Proceedings, SSAWG meeting (April 30, 2015). 37 http://www.hyundainews.com/us/en/models/tucson-fuel-cell/2015/specifications 38 http://pressroom.toyota.com/releases/2016+toyota+mirai+fuel+cell+product.download 39 http://news.honda.com/newsandviews/article.aspx?id=9432-en 40 http://www.greencarreports.com/news/1104440_mercedes-benz-glc-to-offer-worlds-first-plug-in-fuel-cell-powertrain 41 2010 Annual Merit Review Presentation – Ford Motor Company (Veenstra), “Controlled Hydrogen Fleet and Infrastructure Demonstration and Validation Project” http://www.hydrogen.energy.gov/pdfs/review10/tv003_veenstra_2010_o_web.pdf. 42 U. Eberle and R. von Helmolt, “Sustainable transportation based on electric vehicle concepts: a brief overview,” Energy Environ. Sci. 3 (2010): 689–699. 43 Nissan Motor Co., Ltd., “Fuel Cell Vehicle X-TRAIL FCV,” http://www.nissan-global.com/EN/DOCUMENT/PDF/ENVIRONMENT/TECHNOLOGY/en_xtail_fcv.pdf. 44 Kia Motor Corporation, “Hydrogen Fuel Cell Cars,” http://www.kia.com/worldwide/about_kia/eco_dynamics/hydrogen_fuel_cell_cars.do 45 Toyota Motor Corporation, “News Release: TOYOTA FCHV Makes Osaka-Tokyo Trip without Refueling,” September 28, 2007, http://www.toyota-global.com/company/history_of_toyota/75years/data/automotive_business/products_technology/technology_development/hv-fc/index.html. 46 Volkswagen, “Hy-Motion-Touran/Tiguan,” http://www.volkswagenag.com/content/vwcorp/content/en/innovation/research_vehicles/HyMotion.html. 47 Veenstra, M. and Hobein, B., “On-Board Physical Based 70 MPa Hydrogen Storage Systems,” SAE Int. J. Engines 4, no. 1 (2011):1862–1871, doi:10.4271/2011-01-1343. 48 M. Gardiner, “Energy requirements for hydrogen gas compression and liquefaction as related to vehicle storage needs,” DOE Hydrogen and Fuel Cells Program Record, U.S. Department of Energy (Washington, DC: U.S. department of Energy, 2009), http://www.hydrogen.energy.gov/pdfs/9013_energy_requirements_for_hydrogen_gas_compression.pdf. 49 R.K. Ahluwalia, T.Q. Hua, J.-K. Peng, S. Lasher, K. McKenney, J. Sinha, M. Gardiner, “Technical assessment of cryo-compressed hydrogen storage tank systems for automotive applications,” Int. J. Hydrogen Energy 35 (2010): 4171–4184. 50 D. P. Broom, “Hydrogen Storage Materials The Characterisation of Their Storage Properties” (Springer, London UK, 2011), 48–49.

H2 Storage TT Roadmap Page 37
51 http://hsecoe.org/models.php Hydrogen Storage Engineering Center of Excellence – Material-based Hydrogen Storage System Models integrated with fuel cell and vehicle models 52 U.S. Department of Energy’s - Energy Materials Network: https://energy.gov/eere/energy-materials-network/energy-materials-network

Appendix B: Target Explanation Document: Onboard Hydrogen Storage for Light-Duty Fuel Cell
Vehicles
2017

This target explanation document is a document of the U.S. DRIVE Partnership. U.S. DRIVE (Driving Research and Innovation for Vehicle efficiency and Energy sustainability) is a voluntary, non-binding, and non-legal partnership among the U.S. Department of Energy; USCAR, representing FCA US LLC, Ford Motor Company, and General Motors; five energy companies – BP America, Chevron Corporation, Phillips 66 Company, ExxonMobil Corporation, and Shell Oil Products US; two utilities – Southern California Edison and DTE Energy; and the Electric Power Research Institute (EPRI). The Hydrogen Storage Tech Team is one of 13 U.S. DRIVE technical teams that work to accelerate the development of pre-competitive and innovative technologies to enable a full range of efficient and clean advanced light-duty vehicles, as well as related energy infrastructure. For more information about U.S. DRIVE, please see the U.S. DRIVE Partnership Plan, www.vehicles.energy.gov/about/partnerships/usdrive.html or www.uscar.org

Table of Contents
1.0 Background.………………………………………………………………………………………………….…. 1
2.0 Target Table………………………………………………………………………………………………….…. 3
3.0 Summary of New / Revised Targets….....……………………...………………………………….…. 5
4.0 Assumptions..………………………….…………………………………………………………………….…. 7
5.0 Detailed Breakdown of Targets..…………………………………………………………………….…. 9

1
1.0 Background: Hydrogen (H2) storage is a key enabling technology for the advancement of hydrogen vehicles in the automotive industry. Storing enough hydrogen (4-10 kg) onboard a light-duty vehicle to achieve a 300 to 500 mile driving range is a significant challenge. On a weight basis, hydrogen has nearly three times the energy content of gasoline when comparing lower heating values (33 kWh/kg for H2 compared to 12 kWh/kg for gasoline). However, on a volume basis, the situation is reversed (approximately 1.3 kWh/L for 700 bar H2 at 15°C compared to 8.8 kWh/L for gasoline). In addition to energy density, hydrogen storage systems face challenges related to cost, durability/operability, charge/discharge rates, fuel quality, efficiency, and safety, which may limit widespread commercialization of hydrogen vehicles. Hydrogen storage activities within the U.S. DRIVE Partnership,1 in conjunction with the DOE’s Fuel Cell Technologies Office (FCTO) in the Office of Energy Efficiency and Renewable Energy,2 are focused on applied research and development (R&D) of technologies that can achieve a 300 to 500 mile driving range for the full span of light-duty vehicles, while meeting packaging, cost, safety, and performance requirements. Such technologies, incorporated within a fuel cell vehicle, would be competitive with incumbent vehicle technologies as illustrated in Figure 1.
Figure 1: Distribution of 2015 Light-duty Vehicle Sales in the U.S. Market by Driving Range (EPA Label Range)3 From conventional vehicle data, the driving range of 300 miles has been identified as the minimum entry point for the market. In comparison, hydrogen vehicles in DOE’s Controlled Hydrogen Fleet and Infrastructure Demonstration and Validation Project had an Environmental Protection Agency (EPA) adjusted driving range from 100 miles (Generation 1 observed minimum) to 250 miles (Generation 2
1 http://www.uscar.org/guest/partnership/1/us-drive 2 http://energy.gov/eere/fuelcells/fuel-cell-technologies-office 3 Courtesy of Marc Melaina / Eleftheria Kontou (NREL) and David Greene (ANL)
0
500,000
1,000,000
1,500,000
2,000,000
2,500,000
3,000,000
250 300 350 400 450 500 550 600 650
2015
Lig
ht-d
uty
Sale
s
Range (Miles)
EPA Label Range
Source: Polk Data, 2015

2
observed maximum).4 Since this demonstration fleet, there have been examples of fuel cell vehicles that have approached or exceeded the minimum driving range target of 300 miles, even though significant effort regarding cost and packaging is still required to achieve commercial viability across various vehicle classes. Thus, it is clear that hydrogen storage systems must be improved in order to provide the customer with the expected driving range across all vehicle platforms. To address all of these various challenges, hydrogen storage system performance targets for light-duty vehicles were developed through the U.S. DRIVE as shown below in Table 1. The targets apply to system-level properties and are customer and application driven. It is intended that U.S. DRIVE will review and update the hydrogen storage system targets approximately every 5 years to assess technology improvements and to ensure continued alignment with market driven requirements. Additional information on the U.S. DRIVE Partnership can be found in the Hydrogen Storage Technical Team Roadmap.5 In addition, further information on FCTO’s Hydrogen Storage Program can be found in the Multi-Year Research, Development, and Demonstration Plan.6 The original targets were set in 2003 based on attempting to be competitive with conventional gasoline fuel systems and revised in 2009 to enable greater than 300-mile range within the allocated package space and weight for hydrogen storage systems in representative fuel cell vehicles. Although hydrogen storage systems have shown continuous improvement since 2003 and many targets have been met in isolation, further advancements are still needed to meet all of the performance targets simultaneously. The automotive original equipment manufacturers (OEMs) have introduced many fuel cell electric vehicles (FCEVs) to a wide range of prospective customers since the original targets were formulated. Valuable information has been and continues to be gathered with regard to vehicle performance and customer requirements and expectations. From the experience gained with FCEV fleets and continued hydrogen storage system development, the targets have been further refined to align with these current advancements and implementation. Almost all FCEVs demonstrated to date have employed some degree of hybridization. Speculation on the effects of heavily hybridized vehicles (e.g. plug-ins, range extended etc.) was minimized in the development of these targets. If included in the future for consideration in the target calculation assessments, significant hybridization can both positively and negatively impact the suggested hydrogen storage system requirements and performance. For example, a 50-mile all electric range extended vehicle would reduce the hydrogen storage system range requirement by approximately 10 percent and potentially relax start-up time and system response, however it would also compete for packaging volume, weight, and cost. This document presents the Onboard Hydrogen Storage for Light-Duty Fuel Cell Vehicles Technical Targets, describes the relevant changes since the last major target revision was completed in 2009, and describes in length the details behind each target.
4 National Renewable Energy Laboratory, “Innovation for Our Energy Future,” http://www.nrel.gov/hydrogen/docs/cdp/cdp_2.ppt. 5 http://www1.eere.energy.gov/vehiclesandfuels/pdfs/program/hstt_roadmap_june2013.pdf 6 http://energy.gov/sites/prod/files/2015/05/f22/fcto_myrdd_storage.pdf
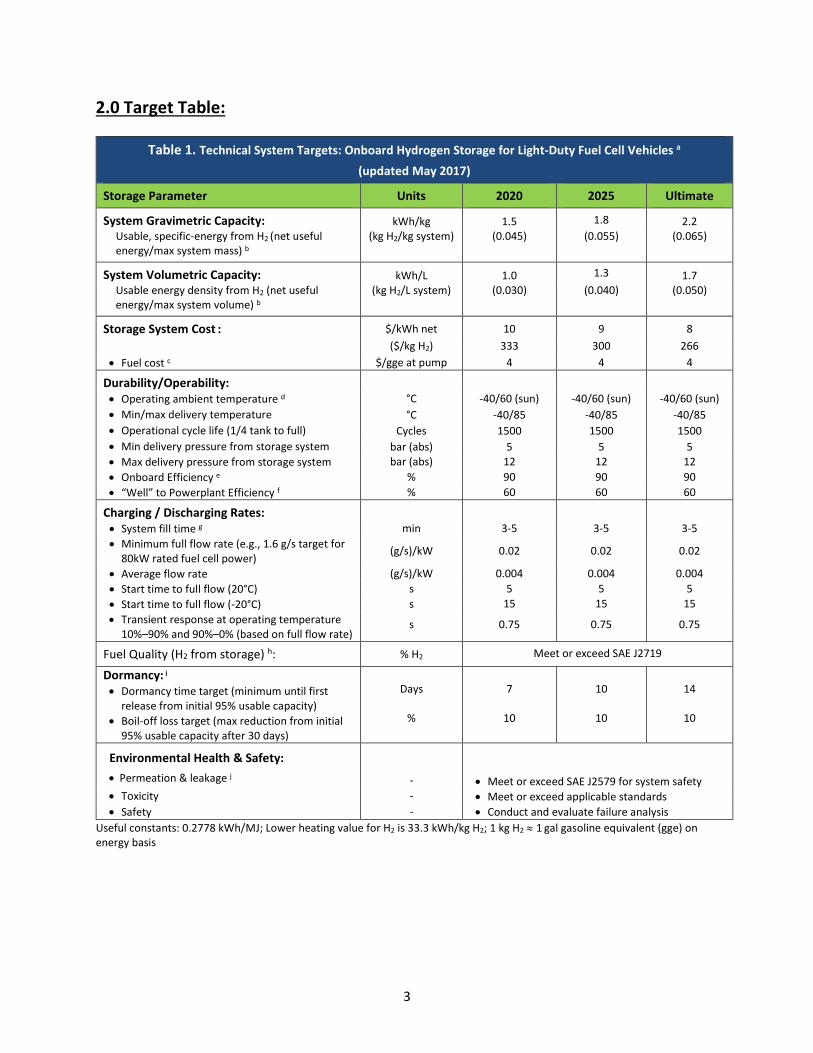
3
2.0 Target Table: Table 1. Technical System Targets: Onboard Hydrogen Storage for Light-Duty Fuel Cell Vehicles a
(updated May 2017)
Storage Parameter Units 2020 2025 Ultimate
System Gravimetric Capacity: kWh/kg 1.5 1.8 2.2 Usable, specific-energy from H2 (net useful energy/max system mass) b
(kg H2/kg system) (0.045) (0.055) (0.065)
System Volumetric Capacity: kWh/L 1.0 1.3 1.7 Usable energy density from H2 (net useful energy/max system volume) b
(kg H2/L system) (0.030) (0.040) (0.050)
Storage System Cost : $/kWh net 10 9 8 ($/kg H2) 333 300 266 • Fuel cost c $/gge at pump 4 4 4
Durability/Operability: • Operating ambient temperature d °C -40/60 (sun) -40/60 (sun) -40/60 (sun) • Min/max delivery temperature °C -40/85 -40/85 -40/85 • Operational cycle life (1/4 tank to full) Cycles 1500 1500 1500 • Min delivery pressure from storage system bar (abs) 5 5 5 • Max delivery pressure from storage system bar (abs) 12 12 12 • Onboard Efficiency e % 90 90 90 • “Well” to Powerplant Efficiency f % 60 60 60
Charging / Discharging Rates:
• System fill time g min 3-5 3-5 3-5 • Minimum full flow rate (e.g., 1.6 g/s target for
80kW rated fuel cell power) (g/s)/kW 0.02 0.02 0.02
• Average flow rate (g/s)/kW 0.004 0.004 0.004 • Start time to full flow (20°C) s 5 5 5 • Start time to full flow (-20°C) s 15 15 15 • Transient response at operating temperature
10%–90% and 90%–0% (based on full flow rate) s 0.75 0.75 0.75
Fuel Quality (H2 from storage) h: % H2 Meet or exceed SAE J2719
Dormancy: i • Dormancy time target (minimum until first
release from initial 95% usable capacity) • Boil-off loss target (max reduction from initial
95% usable capacity after 30 days)
Days
%
7
10
10
10
14
10
Environmental Health & Safety: • Permeation & leakage j
-
• Meet or exceed SAE J2579 for system safety • Meet or exceed applicable standards • Conduct and evaluate failure analysis
• Toxicity - • Safety -
Useful constants: 0.2778 kWh/MJ; Lower heating value for H2 is 33.3 kWh/kg H2; 1 kg H2 ≈ 1 gal gasoline equivalent (gge) on energy basis

4
Footnotes to Target Table: a For a normalized comparison of system performance to the targets, a usable H2 storage capacity of 5.6 kg H2
should be used at the lower heating value of hydrogen (33.3 kWh/kg H2). Targets are for a complete system, including tank, material, valves, regulators, piping, mounting brackets, insulation, added cooling capacity, and all other balance-of-plant components. All capacities are defined as usable capacities that could be delivered to the fuel cell system. All targets must be met at the end of service life.
b Capacities are defined as the usable quantity of hydrogen deliverable to the fuel cell system divided by the total mass/volume of the complete storage system, including all stored hydrogen, media, reactants (e.g., water for hydrolysis-based systems), and system components. Capacities must be met at end of service life. Tank designs that are conformable and have the ability to be efficiently package onboard vehicles may be beneficial even if they do not meet the full volumetric capacity targets.
c Hydrogen threshold fuel cost is calculated to be competitive with a gasoline hybrid vehicle, and thus is independent of pathway. It is defined as the untaxed cost of hydrogen produced, delivered, and dispensed to the vehicle [http://hydrogen.energy.gov/pdfs/11007_h2_threshold_costs.pdf]. For material-based storage technologies, the impact of the technology on the hydrogen threshold fuel cost (e.g., off-board cooling, off-board regeneration of chemical hydrogen storage materials, etc.) must be taken into account.
d Stated ambient temperature plus full solar load (i.e., full exposure to direct sunlight). No allowable performance degradation from -20 °C to 40 °C. Allowable degradation outside these limits is to be determined.
e Onboard efficiency is the energy efficiency for delivering hydrogen from the storage system to the fuel cell powerplant, i.e., accounting for any energy required operating pumps, blowers, compressors, heating, etc. required for hydrogen release.
f Well-to-powerplant efficiency includes onboard efficiency plus off-board efficiency, i.e., accounting for the energy efficiency of hydrogen production, delivery, liquefaction, compression, dispensing, regeneration of chemical hydrogen storage materials, etc. as appropriate. H2A and HDSAM analyses should be used for projecting off-board efficiencies. Efficiencies less than the target may be acceptable if evidence can be given that well-to-powerplant carbon intensity (including delivery and dispensing of H2) can achieve less than 5 kg CO2e/kg H2. Argonne National Laboratory’s GREET model (https://greet.es.anl.gov/) should be used to calculate the carbon intensity of well-to-powerplant energy use.
g When applicable, the fill time should comply with SAE J2601, the Fueling Protocol for Light-Duty Gaseous Hydrogen Surface Vehicles.
h Hydrogen storage systems must be able to deliver hydrogen that meets acceptable hydrogen quality standards for fuel cell vehicles (see SAE J2719 and ISO/PDTS 14687-2). Note that some storage technologies may produce contaminants for which effects are unknown and not addressed by the published standards; these will be addressed by system engineering design on a case-by-case basis as more information becomes available.
i Dormancy targets assume vehicle is parked in 35°C ambient temperature and dormancy performance is maintained over the 15 year life of the vehicle.
j Total hydrogen lost into the environment as H2; relates to hydrogen accumulation in enclosed spaces. Storage systems must comply with applicable standards for vehicular fuel systems including but not limited to SAE J2579 and the United Nations Global Technical Regulation No. 13 (hydrogen and fuel cell vehicles). This includes any coating or enclosure that incorporates the envelope of the storage system.

5
3.0 Summary of New / Revised Targets: Since the last major target revision in 2009, significant progress has been made on the development and implementation of FCEVs thus necessitating the need to add and revise several targets. Tables 2 and 3 below provide a summary of the various targets that have been revised and added since the last major target update in 2009. Note that in 2009, the targets were developed for 2015 and “Ultimate Full Fleet” targets were added to capture virtually all light-duty vehicle platforms (“significant market penetration”). The original 2015 targets were developed based on an assumption that the DOE funding for hydrogen storage research and development would remain fairly constant. Since 2009, funding for the DOE Hydrogen Storage Program has been at reduced levels as shown by the DOE Hydrogen and Fuel Cells Program Record #16010 (https://www.hydrogen.energy.gov/pdfs/16010_historical_fuel_cell_h2_budgets.pdf), thus impacting the ability to meet the 2015 targets and shifting these targets to 2025, which were added to Table 1.
Table 2. Revised Technical System Targets: Onboard Hydrogen Storage for Light-Duty Fuel Cell Vehicles
Storage Parameter Units 2020 (previous)
2020 (new)
2025 (new)
Ultimate (previous)
Ultimate (new) Notes
System Gravimetric Capacity: kWh/kg 1.8 1.5 1.8 2.5 2.2 Previous 2020 target shifted to
2025 target Usable, specific-energy from H2 (net useful energy/max system mass) b
(kg H2/kg system) (0.055) (0.045) (0.055) (0.075) (0.065)
System Volumetric Capacity: kWh/L 1.3 1.0 1.3 2.3 1.7 Previous 2020 target shifted to
2025 target Usable energy density from H2 (net useful energy/max system volume) b
(kg H2/L system) (0.040) (0.030) (0.040) (0.070) (0.050)
Storage System Cost : $/kWh net TBD 10 9 TBD 8 Cost target provided in
2009 was TBD ($/kg H2) TBD 333 300 TBD 266
• Fuel cost c $/gge at pump 2-4 4
4
2-4 4
Both 2020 and Ultimate targets were revised to
be consistent with HPTT goal
Durability/Operability: 2020 unchanged; only Ultimate target
was revised • Min delivery pressure from storage
system bar (abs)
5 3 5
Charging / Discharging Rates: Both 2020 and Ultimate targets
were revised • System fill time min 3.3 3-5 3-5 2.5 3-5

6
Table 3. New Technical System Targets: Onboard Hydrogen Storage for Light-Duty Fuel Cell Vehicles
Storage Parameter Units 2020 (new)
2025 (new)
Ultimate (new) Notes
Charging / Discharging Rates: New Target to Differentiate between Average flow rate &
Minimum full flow rate • Average flow rate (g/s)/kW 0.004 0.004 0.004
Dormancy: • Dormancy time target (minimum until first
release from initial 95% usable capacity) • Boil-off loss target (max reduction from
initial 95% usable capacity after 30 days)
Days
%
7
10
10
10
14
10
New Targets to Address Dormancy (challenge for system operating at
less than ambient temperate)
In addition to the changes noted above, the target for release of hydrogen was removed for clarity as this system metric is now more specifically covered by the targets for dormancy as well as permeation and leakage. Also, targets relating to internal combustion engine were removed. At one time, hydrogen powered internal combustion engines (ICE) were seen as a logical evolution step to fuel cell vehicles powered by hydrogen. Focus has shifted entirely to FCEVs and thus there is no longer a need to include specific targets as related to ICEs. As a result all hydrogen storage system targets related to ICEs have been removed. Further explanation of the new and modified targets are included in Section 5.0 which provides a detailed breakdown of the individual targets.

7
4.0 Assumptions:
1. All targets must be met simultaneously on a total system level. The performance targets apply to a complete storage system, including the tank, storage media, safety system, valves, regulators, piping, mounting brackets, insulation, added cooling capacity, and any other necessary balance-of-plant components (see Figure 1 below for example system diagrams showing single-tank and dual-tank configurations with necessary balance-of-plant components).
2. Targets are based on what is required to meet the application requirements and customer expectations; not on what the state-of-the-art technology can achieve.
3. The targets should enable greater than 300-mile range across the majority of the current light-duty vehicle fleet (i.e. many makes and models).
4. The targets are based on providing a sufficient amount of net available hydrogen onboard the vehicle to satisfy driving range.
5. These targets must be maintained until the end of the vehicle’s service life. 6. Depending on progress in other areas related to FCEV development, these targets may have to be
altered and will be periodically revisited approximately every 5 years. 7. A wide variety of vehicle types from small subcompact cars to light-duty trucks were considered
in the target calculations; the fuel storage requirement varied between approximately 4 to 10 kg of hydrogen, based on the corresponding vehicle type (class) and expected driving range.
8. The targets include the "Ultimate Full Fleet” targets. The “Ultimate Full Fleet” targets are meant to capture virtually all light-duty vehicle platforms (“significant market penetration”). The “Ultimate Full Fleet” target is intended to facilitate the introduction of hydrogen-fueled propulsion systems across the majority of vehicle classes and models.
9. Some volumetric allowance can be adopted in the targets for conformable (geometrically speaking) storage systems. The volumetric and gravimetric targets (revised approach in 2009) utilized the packaging and design space allotted for compressed hydrogen storage in the actual fuel cell demonstration fleet vehicles. That is, the majority of vehicles in the fleet have demonstrated the OEMs’ abilities to design and modify vehicle architecture around the hydrogen systems. Two examples of such modifications include the redesign of floor pan to accommodate larger hydrogen storage systems and the alteration in vehicle architecture to accommodate fuel cell/electronic systems components. Varying degrees of increased mass and volume acceptance (due to the fuel cell and H2 storage systems) have been demonstrated in these vehicles. Experience has shown that it is generally easier to accommodate extra weight compared to extra volume (i.e., accommodating additional packaging volume is more challenging). Importantly, all vehicle modifications must be performed without making compromises to customer expectations for cargo/passenger space, performance, or safety.
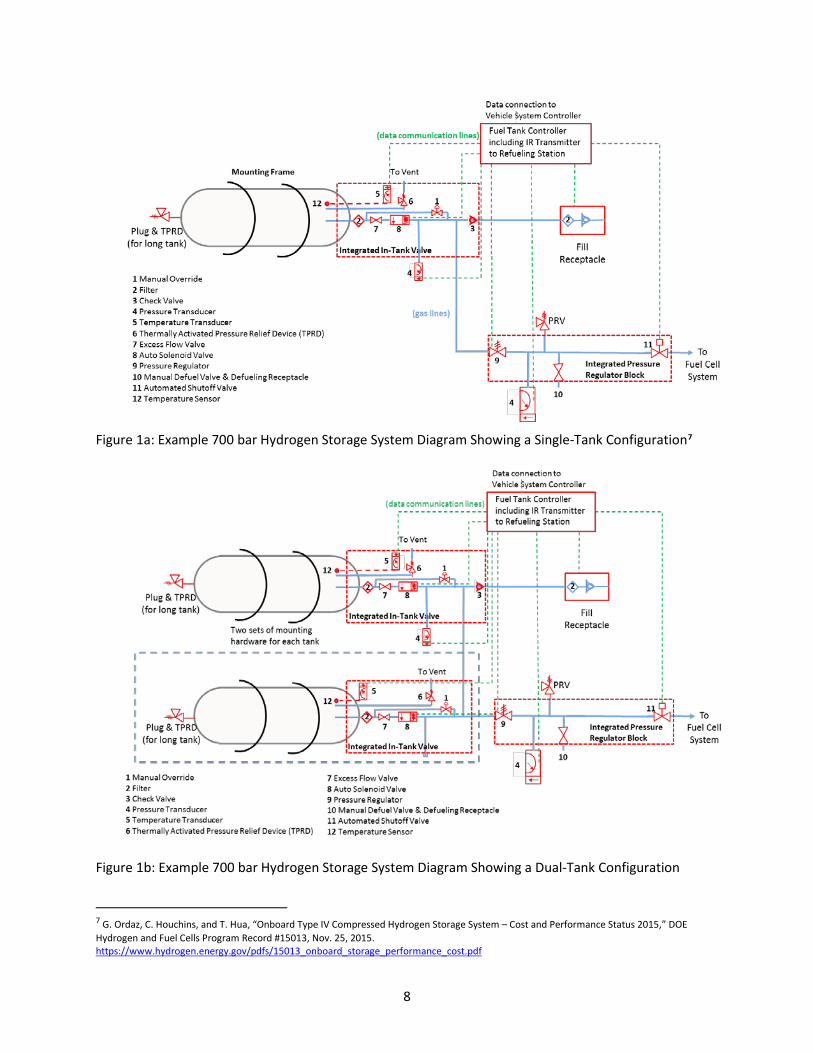
8
Figure 1a: Example 700 bar Hydrogen Storage System Diagram Showing a Single-Tank Configuration7
Figure 1b: Example 700 bar Hydrogen Storage System Diagram Showing a Dual-Tank Configuration
7 G. Ordaz, C. Houchins, and T. Hua, “Onboard Type IV Compressed Hydrogen Storage System – Cost and Performance Status 2015,” DOE Hydrogen and Fuel Cells Program Record #15013, Nov. 25, 2015. https://www.hydrogen.energy.gov/pdfs/15013_onboard_storage_performance_cost.pdf

9
5.0 Detailed Breakdown of the Individual Targets: The following section provides the detailed background and explanation for each target in Table 1. For a normalized comparison to these targets, a usable hydrogen storage capacity of 5.6 kg hydrogen should be used at lower heating value of hydrogen (33.3 kWh/kg hydrogen). In addition, the targets are for a complete system, including tank, material, valves, regulators, piping, mounting brackets, insulation, added cooling capacity, and all other balance-of-plant components. All capacities are defined as usable capacities that could be delivered to the fuel cell system and all targets must be met at the end of service life. While certain targets are expressed in terms of kWh/kg, kWh/L and $/kWh, it should be acknowledged that the hydrogen system is not exactly scalable by the useable capacity since the balance-of-plant components will be fixed regardless of the capacity. Based on this understanding that hydrogen systems have a scalable and fixed element, a target comparison based on the absolute weight, volume, and cost can also be performed to allow for the practical application of onboard efficiency advancements and acceptable limits for actual storage systems.
Storage Parameter Units 2020 2025 Ultimate
System Gravimetric Capacity: kWh/kg 1.5 1.8 2.2 Usable, specific-energy from H2 (net useful energy/max system mass)
(kg H2/kg system)
(0.045) (0.055) (0.065)
System Gravimetric Capacity: This is a measure of the specific energy from the system standpoint of net useful energy per total onboard storage system mass, not just the storage medium. The term specific energy is used interchangeably with the term gravimetric capacity. “Net useful energy” excludes unusable energy (i.e. hydrogen left in a tank below minimum fuel cell system pressure, flow, and temperature requirements) and energy used to extract the hydrogen from the storage medium (e.g. fuel used to heat a hydride or material to initiate or sustain hydrogen release). The system gravimetric capacity refers to end of life net available capacity. The storage system is all encompassing meaning it includes everything necessary for the storage system. This includes, but is not limited to: interfaces with the refueling infrastructure, safety features, storage vessel, storage media, insulation or shielding, temperature/humidity management equipment, regulators, electronic controllers, sensors, all onboard conditioning equipment necessary to store the hydrogen (compressors, pumps, filters, etc.), and the mounting hardware and delivery piping. The target is in units of net useful energy in kWh per maximum system mass in kg. “Maximum system mass” implies that all of the equipment enumerated above plus the maximum charge of hydrogen are included in the calculation. Reactive systems may increase in mass as they discharge hydrogen; in such systems the post hydrogen discharged mass must be used.

10
Table 4: Second Generation
Lower "Gen 2"* Upper "Gen 2"*2017 Commerical
Example8
Fuel Economy mi/kg H2 43 58 66Range mi 196 254 312H2 Capacity kg H2 4.6 4.4 4.7Gravimetric Capacity wt% H2 2.5 4.4 4.4Volumetric Capacity kg H2/L 0.018 0.025 0.025Storage System Mass kg 182 100 108Storage System Volume L 253 175 185*Old 2009 data based on DOE's National Hydrogen Learning Demonstration
Range of ValuesFCEV Data Units
Vehicle Data from the DOE “National Hydrogen Learning Demonstration” Project
To determine the capacity targets developed back in 2009, data from operational fuel cell fleet vehicles associated with the DOE “National Hydrogen Learning Demonstration” were used, including small, compact, mid-size and crossover light-duty vehicles. The vehicles had a varied degree of hybridization. As shown in Table 4, these vehicles were unable to achieve the expected driving range, which in North American is 300 miles (at a minimum) up to nearly 500 miles for the light-duty vehicle market. Based on the allocated weight for hydrogen storage systems, the targets were determined by calculating the increased capacity required to allow these fuel cell vehicles to meet the desired driving range within the current vehicle using the fixed allocation for system weight. From these initial fleet examples, recent fuel cell vehicles have demonstrated improvements in fuel economy (e.g. Toyota Mirai8) with the capability of achieving over a 300 mile range. Therefore, the upper range vehicle example in Table 4 can be replaced with these recent vehicle data (e.g. 66 miles/gge) along with the respective hydrogen storage allocations (e.g. 4.7 kg useable capacity, 108 kg). The target values were modified based on these recent fuel cell vehicles. The 2020 gravimetric targets aligned directly with these current storage system examples capable of achieving the minimum of 300 miles. The 2025 target was based on achieving a 400 mile driving range using the current fuel cell electric vehicle example in the Table 4 for the upper values, which results in a hydrogen capacity of 6.1 kg to 9.3 kg. Using this capacity and the weight allocation (108 kg to 182 kg), the resulting average gravimetric capacity target is 5.5 wt%. The same approach was used for the ultimate target based on a 500 mile driving range resulting in a target value of 6.5 wt%.
Storage Parameter Units 2020 2025 Ultimate
System Volumetric Capacity: kWh/L 1.0 1.3 1.7 Usable energy density from H2 (net useful energy/max system volume)
(kg H2/L system) (0.030) (0.040) (0.050)
System Volumetric Capacity: This is a measure of energy density from a system standpoint of net useful energy per onboard storage system volume, rather than from a storage media standpoint. The term energy density is used interchangeably with the term volumetric capacity. As noted above, the onboard hydrogen storage system includes every component required to safely accept hydrogen from the delivery infrastructure,
8 Estimates based on data from http://www.fueleconomy.gov/feg/fcv_sbs.shtml and other available information

11
store it onboard, and release conditioned hydrogen to the fuel cell system. Also, as before, any unusable fuel must be taken into account and storage system volumetric capacity refers to end of life net available capacity. Today’s gasoline tanks are considered conformable. For conformable tank concepts, the required volumetric energy density may be reduced because space not allocated for fuel storage may be used without a penalty. The system volumetric capacity refers to end of life net available capacity. The volume should be considered as the external water displacement volume of the entire system. The targets are in units of net usable energy in kWh per system volume in liters. As discussed for gravimetric capacity, data from operational fuel cell fleet vehicles associated with the DOE “National Hydrogen Learning Demonstration” was used to determine the volumetric capacity targets developed back in 2009. In the same manner, the targets were determined by calculating the increased capacity required to allow these fuel cell vehicles to meet the desired driving range within the current vehicle using the fixed allocation for system volume. As recognized in the gravimetric target explanation, the fuel economy of recent fuel cell vehicles (e.g. Toyota Mirai) have improved since the demonstration vehicles noted in Table 4 with the capability of achieving just over 300 miles driving. This improvement allows for the upper range vehicle in Table 4 to be replaced with these recent vehicle data (e.g. 66 miles/gge) along with the respective hydrogen storage allocations (e.g. 4.7 kg useable capacity). The target values were modified based on these recent fuel cell vehicles. The 2020 gravimetric targets aligned directly with these current storage system examples capable of achieving the minimum of 300 miles with a 15% correction factor. The correction factor adjustment is motivated by two key points. First, as the volumes quoted in Table 4 refer to exact or water volumes, they represent the minimum volume required by the storage vessel. The practical enclosure volume available onboard the vehicle is typically less. In fact, the examples in the fleet fuel cell vehicles had notable intrusion into the customer or cargo space. The correction factor to estimate the packaging inefficiency may vary significantly based on the type of vehicle platform and design requirements of each OEM. Second, vehicles in the DOE demonstration dataset along with recent vehicles are SUV-type or large sedan vehicles. Packaging of hydrogen storage systems in these larger vehicles will generally be easier than in smaller ones. Taking these two points into account, a target value slightly higher than the represented volumes was adopted based on these correction factors. Similar to the gravimetric target explanation, the 2025 target was based on achieving a 400 mile driving range requiring between 6.1 kg to 9.3 kg useable hydrogen based on the fuel cell electric vehicle examples in the Table 4 with the replacement of the recent fuel vehicle attributes for the upper values. Using this capacity and the volume allocation (185 L to 253 L) along with the correction factor, the resulting average volumetric target is 0.040 kg/L. The same approach was used for the ultimate target based on a 500 mile driving range resulting in a target value of 0.050 kg/L.
Storage Parameter Units 2020 2025 Ultimate
Storage System Cost : $/kWh net 10 9 8 ($/kg H2) 333 300 266 • Fuel cost $/gge at pump 4 4 4
Storage System Cost: This is the cost of the entire hydrogen storage system including the initial charge hydrogen. As noted above, the onboard hydrogen storage system includes every component required to safely accept hydrogen from the delivery infrastructure, store it onboard, and release conditioned hydrogen to the fuel cell system.

12
U.S. DRIVE performed extensive modeling to evaluate the targets for advanced vehicle technologies, including FCEVs. The purpose of the analysis was to provide guidance for the U.S. DRIVE targets, such that vehicles using the advanced technologies being developed through the U.S. DRIVE partnership would be comparable on a cost (initial + operational) and performance basis to incumbent technology by 2020. The effort considered three levels of technology advancement, 10%, 50% and 90% confidence levels with 10% being the most aggressive within the 2020 timeframe based on a high volume assumption of 500,000 units produced per year. The levelized cost of driving for the analysis was developed based on midsize vehicle using 2011 Annual Energy Outlook (AEO11) High Oil Scenario for gasoline in 2020 ($5.05/gallon of gasoline), 14,000 miles per year, 3-year payback period, and 7% discount rate. Figure 2 provides the levelized cost results at the 50% confidence level for the FCEV compared to an advanced spark ignition (Adv SI) and hybrid electric (SI HEV) vehicle. From this analysis, the fuel cell vehicle at the 2020 baseline would require cost reductions to be competitive on a levelized cost of driving. The U.S. DRIVE analysis for the 2020 FC HEV baseline assumed a hydrogen fuel cost of $3.50 per gallon gasoline equivalent (1 kg H2 is approximately 1gge); fuel cell system costs of $46/kW; and onboard hydrogen storage system costs of $15/kWh ($500/kg H2). After adjusting the FC HEV assumptions to the Department of Energy’s 2020 fuel cell system target of $40/kW, a hydrogen storage system cost target of $10/kWh would enable an FCEV to approach the levelized cost of the SI HEV at the 50% confidence level and Adv SI at the 90% confidence level. For a competitive levelized cost to a Adv SI, the fuel cell system would need to achieve their ultimate target of $30/kW and the onboard hydrogen storage system would require a cost target of $8/kWh, which is also shown in Figure 2 as a comparison to the baseline gasoline vehicle levelized cost. Therefore onboard hydrogen storage cost targets of $10/kWh as an intermediate target in 2020, $9/kWh in 2025, and $8/kWh as a long-term ultimate target are appropriate.
Figure 2: Levelized Cost of Driving Analysis for a FC HEV with baseline, 2020 targets, and Ultimate Target Assumptions in Comparison to Adv SI and SI HEV to establish the Onboard Hydrogen Storage System Cost Targets
0.000.100.200.300.400.500.600.700.80
Adv SI SI HEV FC HEVBASELINE
FC HEV2020
TARGETS
FC HEVULTIMATETARGETS
Leve
lized
Cos
t of D
rivin
g (N
PV 2
010
$/m
i)
U.S. DRIVE levelized cost of driving analysis for 2020 midsize vehicle
Fuel Cost (NPV)
Drive, Wheels, Tires, etc.
Transmission
Motor
Energy Storage
Fuel Tank
Fuel Cell
Emission Control
ICE
Glider

13
• Fuel cost: This target includes costs for producing, compressing, liquefying, transporting and distributing, dispensing, chemical recovery, etc., as applicable for the fuel.9 For material-based storage, if the fuel / storage system utilized, requires additional processing such as off-board cooling or off-board regenerated of spent fuel (e.g., chemical hydrogen storage material), then those extra costs (e.g., regeneration) must be included within the fuel cost. The storage system cost also includes the first charge of fuel as mentioned above. The unit of $/gallon gasoline equivalent (gge) is approximately equivalent to $/kg of hydrogen.
Storage Parameter Units 2020 2025 Ultimate
Durability/Operability: • Operating ambient temperature °C -40/60 (sun) -40/60 (sun) -40/60 (sun) • Min/max delivery temperature °C -40/85 -40/85 -40/85 • Operational cycle life (1/4 tank to full) Cycles 1500 1500 1500 • Min delivery pressure from storage system bar (abs) 5 5 5 • Max delivery pressure from storage system bar (abs) 12 12 12 • Onboard Efficiency % 90 90 90 • “Well” to Powerplant Efficiency % 60 60 60
Durability / Operability:
• Operating ambient temperature: The storage system must dependably store and deliver hydrogen to the fuel cell system at all expected ambient conditions. The temperature units are degrees Celsius (°C). The notation (sun) indicates that the upper temperature is a hot soak condition in full direct sun, including radiant heat from the pavement. Note that storage operating temperatures in excess of 60°C can be achieved with solar loading. Thus the hydrogen storage system design should include a shield from this radiant heat or be designed to accommodate temperatures greater than 60°C. Also note that there is no allowable performance degradation between –20°C and 40°C. Allowable degradation outside these limits is to be determined.
• Min/max delivery temperature: This target refers to the inlet temperature of hydrogen to the
fuel cell system. Fuel cells currently operate at approximately 80°C. Any hydrogen entering above the fuel cell operating temperature would add to the already significant water management and heat rejection requirements of the fuel cell system. Thus, an upper limit on temperature is desirable. The value of 85°C is selected based on today’s proton exchange membrane (PEM) fuel cell technology. As the fleet size is increased, it will also become increasingly important that the storage system comply more closely with the fuel cell preferred operating range. The lower limits reflect both wider acceptance of fuel cells in varying climates and fuel cell improvements for lower temperature operation. The temperature units are degrees Celsius (°C).
• Operational cycle life: This target refers to the minimum cycle life for the performance of the
storage material/media. The number of operational cycles is calculated as the design lifetime mileage of the vehicle divided by the effective range of the vehicle. Customers expect the fuel system to last the life of the vehicle and typically 150,000 miles represents the minimum lifetime. Assuming a 300-mile range, this amounts to 500 full fill cycles as a minimum. However, many customers fill at partial capacity rather than at empty and extend the vehicle mileage
9 https://energy.gov/sites/prod/files/2015/08/f25/fcto_myrdd_delivery.pdf

14
beyond the minimum lifetime, requiring more fill cycles. The Sierra Research Report No. SR2004-09-04 for the California Air Resource Board (2004) on vehicle lifetime mileage indicated all scrapped vehicles had mileage below 350,000 miles (6-sigma value was 366,000 miles). Using this maximum lifetime mileage and the partial cycle definition from a quarter full to full tank, the effective range is reduced to 225 miles resulting in the 1,500 cycle life target. This target is not equivalent to the durability test cycles, which require significantly more cycles to ensure safe performance. The safety critical components (i.e. cylinder, relief valves, etc.) involved in managing pressure and temperature conditions need additional durability cycle life as specified in the applicable codes and standards (i.e. SAE J2579 and the United Nations Global Technical Regulation ECE/TRANS/180/Add.13).
• Minimum delivery pressure from storage system: This target acknowledges that the onboard hydrogen storage system is responsible for delivering hydrogen in a condition that the fuel cell system can use. Since there can be no flow without a pressure differential, a minimum supply pressure is required just to move the hydrogen from the bulk storage to the fuel cell system. If the hydrogen were merely available at the entrance to a fuel cell system (i.e., less than 5 bar), then any pumps necessary to push or draw that fuel through the stack would be considered part of the fuel storage system. The pressure units are in gauge bar (bar).
The Ultimate Target for the minimum delivery pressure from the storage system was updated from 3 bar to 5 bar. It should be recognized the delivery pressure is at the interface between the hydrogen storage system and the fuel cell system rather than directly to the fuel cell stack. The delivery pressure to the fuel cell system requires higher pressure than the operating conditions of the stack for pressure drop and passive recirculation within the fuel cell system balance of plant. In some fuel cell system designs, the desire is to increase this minimum delivery pressure even greater than 5 bar in order to further optimize the performance. Therefore, the Ultimate Target was updated to 5 bar to acknowledge the current direction for fuel cell system requirements and provide a consistent minimum delivery pressure throughout the target table.
• Maximum delivery pressure from storage system: This target is for the pressure delivered from
the onboard hydrogen storage system to the fuel cell system. This target ensures that the onboard hydrogen storage system regulates the pressure before fuel is supplied to the fuel cell system.
• Onboard Efficiency: Hydrogen storage systems must be energy efficient. To ensure this, a target
has been set for the efficiency of the storage system onboard the light-duty vehicle. It is defined as the ratio of the total amount of energy delivered to the fuel cell system (lower heating value) compared to the total energy contained in the tank (based on the tank rating). For onboard reversible storage systems, the target is greater than 90% energy efficiency for the energy delivered to the fuel cell system from the onboard storage system. For example, if a storage tank is rated as holding 5.6 kg usable hydrogen, the total amount of energy in the rated tank would be 5.6 kg multiplied by (33.3 kWh/kg) or approximately 186.5 kWh. For the target to be achieved, at least 90% of 186.5 kWh or 168 kWh needs to be delivered to the fuel cell system.
• “Well” to Powerplant Efficiency: Well-to-powerplant efficiency includes onboard efficiency plus
off-board efficiency, i.e., accounting for the energy efficiency of hydrogen production, delivery, liquefaction, compression, dispensing, regeneration of chemical hydrogen storage materials, etc. as appropriate. The energy content of the hydrogen delivered to the automotive

15
powerplant should be greater than 60% of the total energy input to the process. H2A and HDSAM analyses should be used for projecting off-board efficiencies.
Efficiencies less than the target may be acceptable if evidence can be given that the carbon intensity (including delivery and dispensing of hydrogen) can achieve less than 5 kg CO2e/kg H2 (i.e., conceivable that a system is inefficient, but still allows for reduced greenhouse gas emissions). Argonne National Laboratory’s GREET model (https://greet.es.anl.gov/) should be used to calculate the carbon intensity of energy use for hydrogen delivery and dispensing (from 20 bar, and ambient temperature of produced hydrogen). Default 2025 energy shares and efficiency values in GREET, when applicable, should be used for calculating carbon intensity. To liquefy and dispense hydrogen, about 11-15 kWh of electricity are needed for liquefaction and pumping (depending on the scale and technology of liquefaction). Using the current (2015) carbon intensity of the U.S. electricity grid mix of about 550 g CO2e/kWh, the carbon intensity of delivering and dispensing liquid hydrogen is 6-8 kg CO2/kg H2. This is true whether liquid pumping was used for 350 bar cryo-compressed dispensing, or in conjunction with a heat exchanger for 700 bar gaseous dispensing. The corresponding electricity consumption for tube-trailer delivery and 700 bar gaseous dispensing is in the range of 3-5 kWh/ kg H2, which results in 2-3 kg CO2/kg H2 with the current U.S. electricity grid mix. Depending on the truck transportation and distribution (T&D) distance, and the truck payload of hydrogen, the GHG emissions associated with trucking hydrogen results in additional 1 kg CO2/kg H2 for each 100 miles T&D of 500 kg payload of hydrogen.
Storage Parameter Units 2020 2025 Ultimate
Charging / Discharging Rates:
• System fill time Min 3-5 3-5 3-5 • Minimum full flow rate (e.g., 1.6 g/s target for
80kW rated fuel cell power) (g/s)/kW 0.02 0.02 0.02
• Average flow rate (g/s)/kW 0.004 0.004 0.004 • Start time to full flow (20°C) S 5 5 5 • Start time to full flow (-20°C) S 15 15 15 • Transient response at operating temperature
10%–90% and 90%–0% (based on full flow rate) S 0.75 0.75 0.75
Charging / Discharging Rates:
• System fill time: Consumers expect to refuel a vehicle quickly and conveniently, especially on extended trips. The filling target is designed to parallel current customer experience. Currently, gasoline vehicles are filled in approximately 3 to 5 minutes, with small vehicles taking less time than large ones. Based on the expected efficiency of FCEVs, approximately 4 to 10 kg of hydrogen will be needed for light-duty vehicles. This target will achieve near parity with current gasoline filling times. For a comprehensive comparison of fill time, the storage system should comply with the performance in SAE J2601, the Fueling Protocol for Light-Duty Gaseous Hydrogen Surface Vehicles (http://standards.sae.org/j2601_201003/). The units are minutes. Note: the fill time involves not only delivery of the hydrogen to the storage system, but also any potential heat/mass transfer and/or kinetic factors associated with a particular storage system design. Thus all factors must be considered especially when scaling small prototype systems to determine fill time.

16
• Minimum full flow rate: This target is a measure of the maximum flow rate of hydrogen required by the fuel cell system to achieve the desired vehicle performance. It is based on an average midsize light duty fuel cell vehicle, which typically has a power plant of about 80 kW and maximum fuel flow from the EPA US06 aggressive drive cycle. This is not a continuous flow target since the vehicle would not accelerate through an entire tank of fuel although it might be called upon to tow a large, heavy trailer up an 18-mile grade, such as is found on Interstate 5 near Baker, California. However, because fuel cell efficiency is poorest at full load, while ICEs are at or near their highest efficiency at full load, FCEVs may require higher full flow rates than this minimum to be competitive with ICEs. Finally, this target is intended to indicate the potential for scalability for the hydrogen storage technology and thus the target is in units of mass/time normalized to fuel cell system rated power.
• Average flow rate: While the minimum full flow rate noted above defines the requirements for the storage system to supply hydrogen to the fuel cell system at peak load, it is also understood that an FCEV will not be operated at peak load through an entire tank of fuel. As described for the minimum full flow, an average midsize light duty fuel cell vehicle with a typically power plant of about 80 kW rated power was assumed for this target. This target is based on the average flow rate of hydrogen required by the fuel cell system for the EPA US06 aggressive drive cycle although it is still not expected that the flow demand will be continuous at this average flow rate value. For potential for scalability for the hydrogen storage technology, the target is in units of mass/time normalized to fuel cell system rated power.
• Start time to full-flow (20°C): The vehicle may be able to start based on hydrogen in the lines,
but to maintain adequate function without the need for a second energy storage medium (e.g. batteries), full flow must be available almost instantly. Customers are currently accustomed to sub-second start times and full power available on demand, any time after the key is released. The target cold start-up time to achieve 50% rated power for the complete fuel cell system at 20°C ambient temperature is 5 seconds. The storage system targets for start time to full-flow are set to meet the overall fuel cell system needs. In addition, the storage system must provide some flow to the fuel cell system within 25% of the time target for full-flow. The units for this target are seconds after start.
Note: this doesn’t mean that the entire storage system must start in 5 seconds; only that it is capable of delivering fuel at maximum flow if requested. A moderate pressure buffer could serve to lengthen the true start up time. In that case, the mass and volume of the buffer would then need to be included within the system mass and volume.
• Start time to full-flow (-20°C): See Start time at 20°C for background explanation. The longer
times reflect current customer expectation that in cold weather starting is more difficult. It is important to note that batteries are at their worst power capabilities at very low temperature. If a battery assist were contemplated, the battery system would likely have to be sized based on this starting condition, and thus would be rather large. This is why it has been desirable to avoid batteries for cold start if possible, unless sizing issues can be resolved. The target cold start-up time to achieve 50% rated power for the complete fuel cell system at -20°C is 15 seconds. Consistent with the above target, some flow will be required to the fuel cell system within 25% of the full-flow target time. Given the possibility that some hydrogen may be used to assist with cold start of the fuel cell system, the storage system is set to achieve full-flow within 50% of the start time for the fuel cell system. Units are in seconds.

17
• Transient response 10%-90% and 90%-0% based on full flow rate: Transient response is one of the greatest challenges a vehicle powertrain faces. The storage system must provide fuel to meet the needs of the fuel cell system to deliver adequate power and a suitable driving experience. Therefore, the transient response must meet the fuel cell system requirement of 0.75 second (2010 and 2015 targets). The transient response is not necessarily symmetric. The 10 to 90% transient target is to meet the demand of the fuel cell during acceleration. The 90 to 0% transient reflects that the vehicle may need to stop using hydrogen almost instantly (e.g. safety shut-off) and the fuel supply must stop quickly enough to avoid over-pressuring any part of the system. This parameter impacts performance, fuel cell durability, and vehicle control. The units are seconds to change between 10% flow and 90% flow, or 90% flow and no flow.
Storage Parameter Units 2020 2025 Ultimate
Fuel Quality (H2 from storage): % H2 Meet or exceed SAE J2719
• Fuel Quality: Hydrogen must be relatively pure going to the fuel cell system or else vehicle
efficiency and performance will be degraded. The fuel quality from the hydrogen storage system must maintain or exceed the levels specified in SAE J2719 (http://standards.sae.org/j2719_201511/). The levels of constituents in SAE J2719 were determined by experimental testing representative fuel cells with impurities. As indicated in SAE J2719, even inert impurities can degrade performance by progressively diluting the hydrogen in the fuel cell system, resulting in a higher necessitating of venting from the fuel cell anode. Other impurities react directly with the fuel cell catalyst resulting in immediate or long-term damage. The SAE J2719 fuel quality standard is the same requirement for the hydrogen delivered from the fueling station into the storage system. In other words, the hydrogen output from the storage system should not add significant contaminants beyond the fuel cell quality targets in SAE J2719 and ISO specification ISO/PDTS 14687-2. It is also assumed that impurities from the hydrogen source do not degrade storage system performance.
Storage Parameter Units 2020 2025 Ultimate Dormancy: • Dormancy time target (minimum until first
release from initial 95% usable capacity) • Boil-off loss target (max reduction from
initial 95% usable capacity after 30 days)
Days
%
7
10
10
10
14
10
Dormancy:
• Dormancy time target: This target protects against loss of driving range after extended periods of vehicle at rest (e.g., parking during a vacation). The dormancy period is especially relevant for hydrogen systems that operate at low temperatures. As the temperature in the tank increases, the pressure increases to the point that it needs to be released due to exceeding the maximum pressure rating of the tank. The period of time prior to this release (or boil-off point) is defined as the dormancy time. Fuel cell vehicles purchased by typical consumers expect to have the same amount of fuel in their tank after extended parking, similar to gasoline vehicles today. For 2020, the dormancy time target of 7 days from initial 95% usable capacity was selected based on a typical period of time that a vehicle would be parked at the airport for a vacation. The 95% usable capacity qualifier was based on the consideration that the vehicle is unlikely to be parked immediately after a fueling event. The dormancy time target was extended for 14 days at the

18
same peak capacity to accommodate a two week vacation that a vehicle would be parked. The evaluation of the dormancy time should be conducted at the high ambient soak temperature which is assumed to be 35ºC for this target assessment. It should be noted that this is not the maximum ambient temperature although diurnal cycles reduce the average exposure temperature over a period of days. For most low temperature storage systems, the peak capacity condition will be the worst case for dormancy although lower states of charges should also be considered. The units for this target are in days.
• Boil-off loss target: This target is based on the desire to have minimal perceptible loss of driving
range after the dormancy time is exceeded. As stated above, hydrogen systems with low storage temperatures experience heat loss that increases pressure and eventually requires hydrogen release or boil-off to avoid exceeding the maximum rated tank pressure. If the hydrogen released is not vented to the atmosphere, but used for other purposes (e.g., converted via a catalytic reactor or other uses) instead, then this additional balance of plant must be included as part of the storage system. The target is indicated as a 10% maximum capacity loss from the initial state of the tank over a 30 day period of time. It is assumed that this capacity loss would not be notable to the average consumer and the 30 days assumes a maximum time a vehicle would be at rest in normal operation. This target protects all storage system capacities equally and at all state of charge conditions. As specified for dormancy, the initial capacity condition is 95% of the rated usable capacity and the ambient soak temperature should be 35º C for this target assessment. For most low temperature storage systems, the peak capacity condition will be the worst case for boil-off loss although lower states of charges should be considered.
Storage Parameter Units 2020 2025 Ultimate
Environmental Health & Safety: • Permeation & leakage
-
• Meet or exceed SAE J2579 for system safety • Meet or exceed applicable standards • Conduct and evaluate failure analysis
• Toxicity - • Safety -
Environmental, Health & Safety:
• Permeation & leakage: These targets are of great importance because they deal with protecting the health and well-being of individuals in contact with the storage system. The permeation and leak target are defined in SAE J2579 for the entire storage system, rather than per component or storage material. A system integrator or OEM could cascade the system leakage targets to various elements with the system as necessary. Permeation and leakage are differentiated from hydrogen release and boil-off loss in that hydrogen leakage leaves the storage system in an unintended manner while boil-off should be controlled and transformed into another species (e.g. water, via catalytic oxidation in a vent line). Permeation and leakage thus pertains to the possibility of generating a combustible hydrogen-air mixture outside the storage tank.
• Toxicity: Toxicity covers the possibility of consumer exposure to the storage material in normal, or abnormal conditions, plus worker exposure during manufacture and assembly. These types of toxicity criteria are generally regulated by applicable government standards. Materials with a known hazardous risk potential shall be avoided. For example, the EPA’s Toxic Substances Control Act Chemical Substance Inventory (TSCA Inventory) and U.S. Department of Labor Occupational Safety and Health Administration (OHSHA) can be used as references.

19
• Safety: Safety covers all the typical safety statutes including certification and operation of vehicles, manufacture, transport, dispensing of fuel, and end of life issues. In each of these categories, compliance with federal standards and potentially state and local standards will be required. The onboard storage systems must comply with applicable standards for vehicular fuel systems including but not limited to SAE J2579 and the United Nations Global Technical Regulation No.13 (Hydrogen and fuel cell vehicles). These standards include the minimum level of testing to determine the robustness of these hydrogen storage systems including hydraulic/pneumatic durability, burst, pressure cycle life, bonfire, chemical resistance, drop, penetration, environmental, and vehicle crash impact testing. The hydrogen storage system design must account for the requirements in these standards along with the applicable international standards in the nations that the vehicle will be deployed. For certain countries, the storage system and high pressure components require certification by a specified regulatory organization prior to on-road usage. SAE J2578, J2600, J2601, J2719, and J2799 (http://standards.sae.org/) provide the necessary references for vehicle and fueling interface standards. CSA and ISO also provide standards for safety guidance along with component certification standards. For storage system technologies (e.g. material-based) not specifically addressed in these standards, the intent of these safety requirements still must be applied to the design with appropriate engineering rationale and documentation until the incorporation into the standards. Beyond regulated standards, hydrogen storage system developers should utilize automotive failure analysis tools such as Failure Mode and Effects Analysis (per SAE J1739) to identify and evaluate unique potential safety failure modes associated with their system. For example, metal hydrides are known to expand with absorption and can add strains to the storage tank, which should be included in the durability and safety testing as a potential failure mode in addition to the industry codes and standards.