Embed Size (px)
Citation preview

1
HYDROGEN RELEASES IGNITED IN A SIMULATED VEHICLE REFUELLING ENVIRONMENT
Shirvill, L.C.1, Royle, M.2 and Roberts, T.A.3
1 Shell Global Solutions, P.O. Box 1, Chester, Cheshire, CH1 3SH, United Kingdom,
[email protected] 2 Health and Safety Laboratory, Buxton, Derbyshire, SK17 9JN, United Kingdom,
[email protected] 3 Health and Safety Laboratory, Buxton, Derbyshire, SK17 9JN, United Kingdom,
ABSTRACT If the general public is to use hydrogen as a vehicle fuel, customers must be able to handle hydrogen with the same degree of confidence, and with comparable risk, as conventional liquid and gaseous fuels. The hazards associated with jet releases from leaks in a vehicle-refuelling environment must be considered if hydrogen is stored and used as a high-pressure gas since a jet release in a confined or congested area could result in an explosion. As there was insufficient knowledge of the explosion hazards, a study was initiated to gain a better understanding of the potential explosion hazard consequences associated with high-pressure leaks from refuelling systems. This paper describes two experiments with a dummy vehicle and dispenser units to represent refuelling station congestion. The first represents a ‘worst-case’ scenario where the vehicle and dispensers are enveloped by a 5.4 m x 6.0 m x 2.5 m high, pre-mixed, hydrogen-air cloud. The second is an actual high-pressure leak from storage at 40 MPa (400 bar), representing an uncontrolled, full-bore, failure of a vehicle refuelling hose. In both cases an electric spark ignited the flammable cloud. Measurements were made of the explosion overpressure generated, its evolution with time, and its decay with distance. The results reported provide a direct demonstration of the explosion hazard from an uncontrolled leak; they will also be valuable for validating explosion models that will be needed to assess configurations and conditions beyond those studied experimentally.
1.0 INTRODUCTION
In the last few years there has been an upsurge of interest in safety issues (see ISO/TR 15916 [1]) related to the use of hydrogen. In Europe this has spawned the EU funded Safety of Hydrogen as an Energy Carrier (HySafe) Network of Excellence and a number of EU funded research projects containing some aspects of hydrogen safety. In the US, there is ongoing hydrogen safety research funded by the DOE, and in Japan research funded by NEDO. The 2005 International Conference on Hydrogen Safety provided a good overview of the status of hydrogen safety research worldwide.
In order to gain a better understanding of the potential explosion hazard consequences associated with high-pressure leaks from hydrogen vehicle refuelling systems, Shell Hydrogen Projects B.V. initiated an industry funded hydrogen safety study [2]. The objectives were to quantify the explosion hazard consequences in a refuelling station environment for the ‘worst-case’ condition of a premixed gas cloud as well as simulations of actual high-pressure leaks.
This paper provides a detailed comparison of the results from a 400 bar jet release experiment with those from a pre-mixed cloud experiment, in the same simulated refuelling station environment. The set-up and release conditions for these experiments were provided for modelling studies within HySafe and HyApproval (an EU project developing a handbook for the approval of hydrogen refuelling stations). This paper is intended to allow detailed comparison of the experimental results with those derived from modelling.
2.0 REFUELLING STATION CONGESTION
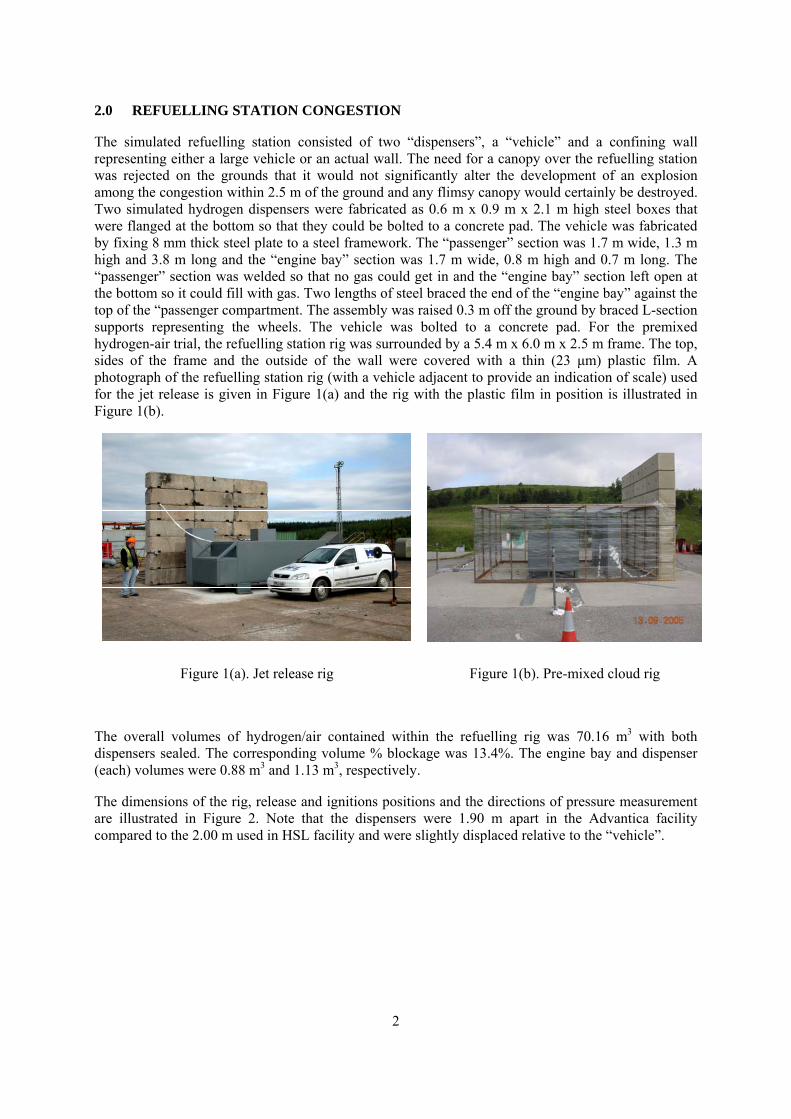
The simulated refuelling station consisted of two “dispensers”, a “vehicle” and a confining wall representing either a large vehicle or an actual wall. The need for a canopy over the refuelling station was rejected on the grounds that it would not significantly alter the development of an explosion among the congestion within 2.5 m of the ground and any flimsy canopy would certainly be destroyed. Two simulated hydrogen dispensers were fabricated as 0.6 m x 0.9 m x 2.1 m high steel boxes that were flanged at the bottom so that they could be bolted to a concrete pad. The vehicle was fabricated by fixing 8 mm thick steel plate to a steel framework. The “passenger” section was 1.7 m wide, 1.3 m high and 3.8 m long and the “engine bay” section was 1.7 m wide, 0.8 m high and 0.7 m long. The “passenger” section was welded so that no gas could get in and the “engine bay” section left open at the bottom so it could fill with gas. Two lengths of steel braced the end of the “engine bay” against the top of the “passenger compartment. The assembly was raised 0.3 m off the ground by braced L-section supports representing the wheels. The vehicle was bolted to a concrete pad. For the premixed hydrogen-air trial, the refuelling station rig was surrounded by a 5.4 m x 6.0 m x 2.5 m frame. The top, sides of the frame and the outside of the wall were covered with a thin (23 μm) plastic film. A photograph of the refuelling station rig (with a vehicle adjacent to provide an indication of scale) used for the jet release is given in Figure 1(a) and the rig with the plastic film in position is illustrated in Figure 1(b).
Figure 1(a). Jet release rig Figure 1(b). Pre-mixed cloud rig
The overall volumes of hydrogen/air contained within the refuelling rig was 70.16 m3 with both dispensers sealed. The corresponding volume % blockage was 13.4%. The engine bay and dispenser (each) volumes were 0.88 m3 and 1.13 m3, respectively.
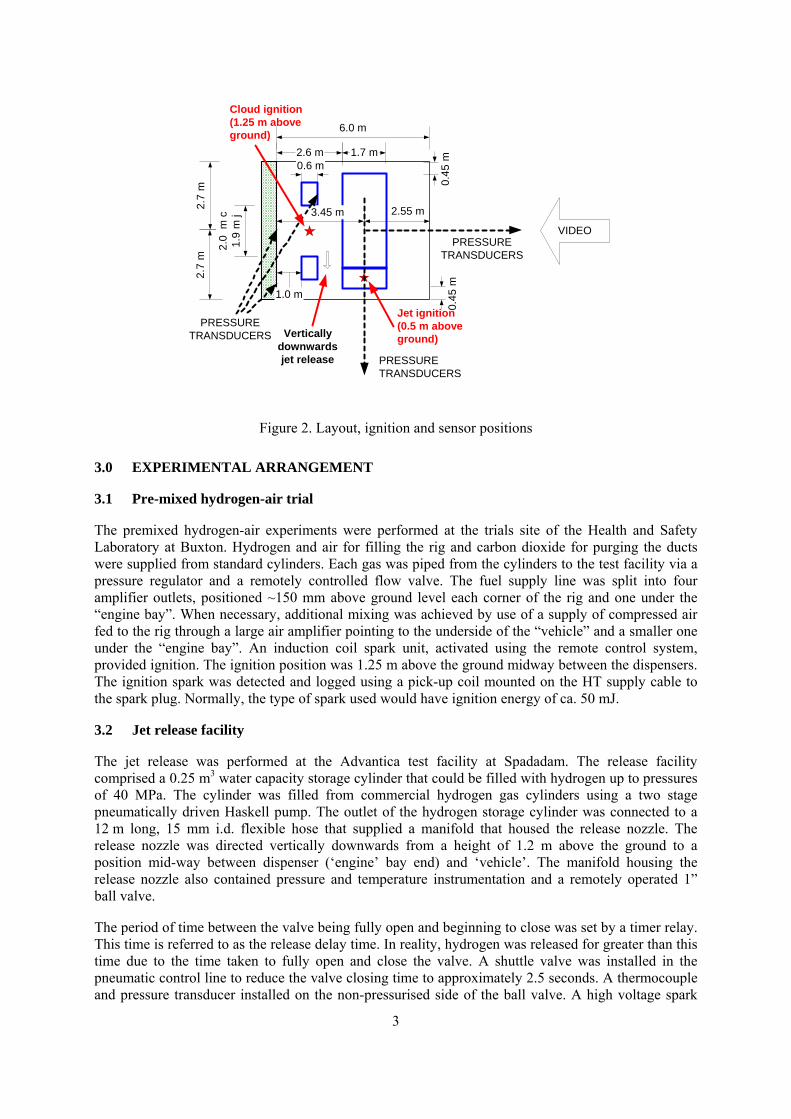
The dimensions of the rig, release and ignitions positions and the directions of pressure measurement are illustrated in Figure 2. Note that the dispensers were 1.90 m apart in the Advantica facility compared to the 2.00 m used in HSL facility and were slightly displaced relative to the “vehicle”.
2
PRESSURETRANSDUCERS
3.45 m2.7
m2.
7 m
2.55 m
VIDEO
6.0 m
Cloud ignition(1.25 m aboveground)
Jet ignition(0.5 m aboveground)
3
Verticallydownwardsjet release
PRESSURETRANSDUCERS
PRESSURETRANSDUCERS
2.6 m 1.7 m
0.45
m0.6 m
2.0
m c
1.9
m j
0.45
m
1.0 m
Figure 2. Layout, ignition and sensor positions
3.0 EXPERIMENTAL ARRANGEMENT
3.1 Pre-mixed hydrogen-air trial
The premixed hydrogen-air experiments were performed at the trials site of the Health and Safety Laboratory at Buxton. Hydrogen and air for filling the rig and carbon dioxide for purging the ducts were supplied from standard cylinders. Each gas was piped from the cylinders to the test facility via a pressure regulator and a remotely controlled flow valve. The fuel supply line was split into four amplifier outlets, positioned ~150 mm above ground level each corner of the rig and one under the “engine bay”. When necessary, additional mixing was achieved by use of a supply of compressed air fed to the rig through a large air amplifier pointing to the underside of the “vehicle” and a smaller one under the “engine bay”. An induction coil spark unit, activated using the remote control system, provided ignition. The ignition position was 1.25 m above the ground midway between the dispensers. The ignition spark was detected and logged using a pick-up coil mounted on the HT supply cable to the spark plug. Normally, the type of spark used would have ignition energy of ca. 50 mJ.
3.2 Jet release facility
The jet release was performed at the Advantica test facility at Spadadam. The release facility comprised a 0.25 m3 water capacity storage cylinder that could be filled with hydrogen up to pressures of 40 MPa. The cylinder was filled from commercial hydrogen gas cylinders using a two stage pneumatically driven Haskell pump. The outlet of the hydrogen storage cylinder was connected to a 12 m long, 15 mm i.d. flexible hose that supplied a manifold that housed the release nozzle. The release nozzle was directed vertically downwards from a height of 1.2 m above the ground to a position mid-way between dispenser (‘engine’ bay end) and ‘vehicle’. The manifold housing the release nozzle also contained pressure and temperature instrumentation and a remotely operated 1” ball valve.
The period of time between the valve being fully open and beginning to close was set by a timer relay. This time is referred to as the release delay time. In reality, hydrogen was released for greater than this time due to the time taken to fully open and close the valve. A shuttle valve was installed in the pneumatic control line to reduce the valve closing time to approximately 2.5 seconds. A thermocouple and pressure transducer installed on the non-pressurised side of the ball valve. A high voltage spark
probe connected to a step-up transformer supplied by a 240V supply provided the ignition source. The ignition position was in the centre of the ‘engine’ bay. The time input to the relay unit was synchronised with a proximity switch on the valve used to initiate the releases. The relay then operated once the valve was fully open and initiated the spark at a set time after this time input pulse. Using this system, the spark was initiated at a specific time after the initiation of the hydrogen release.
4.0 RELEASE CHARACTERISATION
4.1 Pre-mixed cloud
The concentration of fuel gas in the congestion rig was derived from measurements of the oxygen concentration using AO2 Oxygen CiTicel or International Technologies Automotive Oxygen sensors distributed throughout the rig. It was assumed (confirmed by calibration trials) that any decrease in the concentration of oxygen was caused by displacement of air by hydrogen gas. The sample standard deviation of the mean oxygen concentration was usually about + 0.3 %. The temperature inside the rig was measured using a 3 mm stainless steel sheathed RTD mounted at about half-height on a dispenser and the relative humidity (RH) was measured using a calibrated Honeywell HIH 3610 series sensor, located adjacent to it.
4.2 Jet release
The wind speed was measured at heights of 3.00 m, 4.85 m and 8.40 m above local ground level by lightweight cup anemometers (Vector Instruments type A100) mounted on a weather mast located approximately 95 m from the test rigs. The pressure of the hydrogen in the hydrogen storage vessel and close to the release nozzle were measured using Druck type PTX 510 series pressure transmitters with a range of 0 -60 MPa with a quoted accuracy of ± 0.15% of full scale range and a response time of 0.3 s. The temperature of the hydrogen in the hydrogen storage vessel and close to the release nozzle were measured using type T thermocouples connected to temperature transmitters with an accuracy of ± 0.5 oC. The response time of these thermocouples was ca. 1 s.
5.0 DERIVATION OF QUANTITY OF HYDROGEN RELEASED
5.1 Pre-mixed cloud
The partial pressure of hydrogen (Phydrogen) is given by:
)(1 vapourwateretcnitrogenoxygenhydrogen PPPP ++−= (1)
The oxygen partial pressure (Poxygen) was taken as the measured percentage concentration divided by 100. The partial pressure of nitrogen, argon and other inert atmospheric gases (Pnitrogen etc) was derived from the ratio of oxygen to inert gases in dry air and the partial pressure of water vapour (Pwater vapour) was derived from the saturated vapour pressure for the temperature and relative humidity measured inside the refuelling rig. To simplify the calculations, the saturated vapour pressure of water in the air and hydrogen gas mixture was assumed to be the same as that for air alone. The hydrogen/oxygen ratio for complete combustion of hydrogen is 2 and hence the stoichiometric ratio (S), was given by:
oxygen
hydrogen
PP
S2
= (2)
The mass ( , kg) of hydrogen in the rig was calculated as follows: gM
4
)15.273(15.273
325.101022414.0 TP
mV
pM catmospheriwt
freehydrogeng +
= (3)
Where Vfree is free volume inside the rig (70.16 m3), mwt is the molecular weight of hydrogen (0.002016 kg), Patmospheric is the atmospheric pressure (kPa) and T is the gas temperature (oC).
5.2 Jet release
The basic data available for each trial was the nozzle pressure, the vessel pressure, the synchronisation pulse, the hydrogen release temperature and hydrogen storage temperature. Cheng et al. [3] give the compressibility (Z) of hydrogen as:
TRdPZ
HH .22
1+= (4)
where: P is the pressure (Pa), dH2 is the hydrogen co-density (129 kg m-3), RH2 is the gas constant for hydrogen (4124 J kg-1 K-1) and T is the temperature (K). Using this compressibility, the mass per unit volume ( ρ , kg m-3) is given by:
TZRP
H 2
=ρ (5)
The mass of hydrogen released ( ρ V kg) was calculated from the reservoir and pipe work volume (0.252 m3) and the pressure and temperature of the gas in the reservoir. Calculations were performed using the starting pressure and temperature to derive the initial amount of hydrogen; pressure and temperature at the start of the spark ignition to derive the amount of hydrogen available at ignition; and final pressure and minimum temperature to derive the total amount of hydrogen released. A semi-independent (the compressibility was calculated in the same way) method was used to give an approximate crosscheck. The single-phase relief valve equation (see Etchells and Wilday, [4]) was used to calculate the gas flow rate per unit area ( , kgm-2s-1): gG
Bupstream
WSVupstreamDg F
TZM
CPCG = (6)
where CD is the discharge coefficient (0.9 estimated), Pupstream is the upstream pressure (Pa), CSV is a constant based on isentropic coefficient (k) (0.00752 for k=1.41), MW is the hydrogen molecular weight (2.016 kg kmole-1), Tupstream is the upstream temperature (K) and FB is the back pressure correction factor (1 for this trial.). The flow rate was calculated for the initial pressure and temperature and the pressure and temperature at the start of sparking and the mean flow rate (Gm, kgm-2s-1) taken as the average. The mean flow rate, nozzle area (A, m2) and time (t, s) between the start of pressure drop and the initiation of the ignition spark was used to calculate the mass (m, kg) released on sparking:
AtGm m= (7)
6.0 OVERPRESSURE MEASUREMENTS
For the pre-mixed cloud trial, Brüel & Kjær 8103 hydrophones were used to record the lower overpressures measured at distance and Kulite Series ETL-345F-375M 4 MPa piezo-resistive transducers were used to measure the close in overpressures. The hydrophones had a measurement error of + 0.5 kPa and were fitted with shields. The Kulite sensors had a measurement error of
5
6
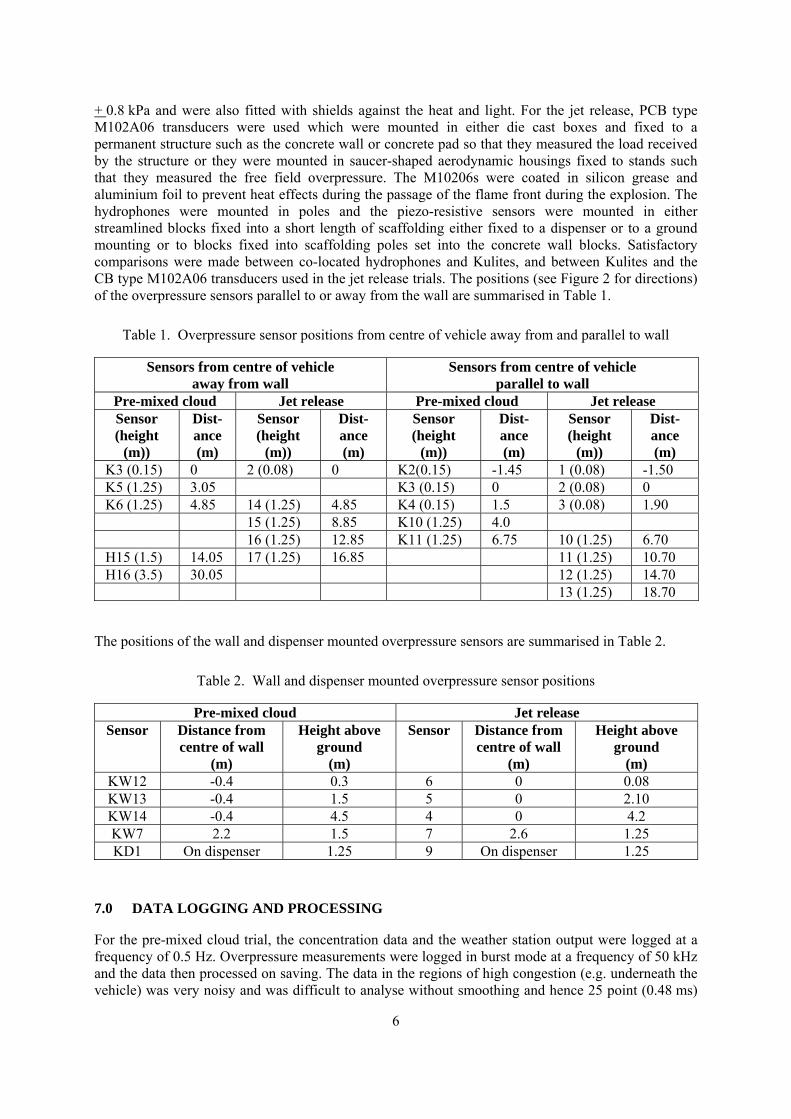
+ 0.8 kPa and were also fitted with shields against the heat and light. For the jet release, PCB type M102A06 transducers were used which were mounted in either die cast boxes and fixed to a permanent structure such as the concrete wall or concrete pad so that they measured the load received by the structure or they were mounted in saucer-shaped aerodynamic housings fixed to stands such that they measured the free field overpressure. The M10206s were coated in silicon grease and aluminium foil to prevent heat effects during the passage of the flame front during the explosion. The hydrophones were mounted in poles and the piezo-resistive sensors were mounted in either streamlined blocks fixed into a short length of scaffolding either fixed to a dispenser or to a ground mounting or to blocks fixed into scaffolding poles set into the concrete wall blocks. Satisfactory comparisons were made between co-located hydrophones and Kulites, and between Kulites and the CB type M102A06 transducers used in the jet release trials. The positions (see Figure 2 for directions) of the overpressure sensors parallel to or away from the wall are summarised in Table 1.
Table 1. Overpressure sensor positions from centre of vehicle away from and parallel to wall
Sensors from centre of vehicle away from wall
Sensors from centre of vehicle parallel to wall
Pre-mixed cloud Jet release Pre-mixed cloud Jet release Sensor (height
(m))
Dist-ance (m)
Sensor (height
(m))
Dist-ance (m)
Sensor (height
(m))
Dist-ance (m)
Sensor (height
(m))
Dist-ance (m)
K3 (0.15) 0 2 (0.08) 0 K2(0.15) -1.45 1 (0.08) -1.50 K5 (1.25) 3.05 K3 (0.15) 0 2 (0.08) 0 K6 (1.25) 4.85 14 (1.25) 4.85 K4 (0.15) 1.5 3 (0.08) 1.90 15 (1.25) 8.85 K10 (1.25) 4.0 16 (1.25) 12.85 K11 (1.25) 6.75 10 (1.25) 6.70 H15 (1.5) 14.05 17 (1.25) 16.85 11 (1.25) 10.70 H16 (3.5) 30.05 12 (1.25) 14.70 13 (1.25) 18.70
The positions of the wall and dispenser mounted overpressure sensors are summarised in Table 2.
Table 2. Wall and dispenser mounted overpressure sensor positions
Pre-mixed cloud Jet release Sensor Distance from
centre of wall (m)
Height above ground
(m)
Sensor Distance from centre of wall
(m)
Height above ground
(m) KW12 -0.4 0.3 6 0 0.08 KW13 -0.4 1.5 5 0 2.10 KW14 -0.4 4.5 4 0 4.2 KW7 2.2 1.5 7 2.6 1.25 KD1 On dispenser 1.25 9 On dispenser 1.25
7.0 DATA LOGGING AND PROCESSING
For the pre-mixed cloud trial, the concentration data and the weather station output were logged at a frequency of 0.5 Hz. Overpressure measurements were logged in burst mode at a frequency of 50 kHz and the data then processed on saving. The data in the regions of high congestion (e.g. underneath the vehicle) was very noisy and was difficult to analyse without smoothing and hence 25 point (0.48 ms)

7
moving average smoothing was used. Average smoothing the data has the effect of reducing the peak height by 20% to 40%.
The hydrogen pressure, temperature and the wind speed and direction data from the jet release were logged at a rate of 10 Hz. Each recorded data point was the average of ten readings taken within the 10 Hz-logging period. The overpressure data from the pressure transducers was recorded at a rate of 25 kHz. The overpressure data was recorded on the transient logger with time zero corresponding to the spark firing. Consequently, the zero time for each experiment on each of the logging systems is not synchronised. However, the initiation of the spark is recorded on the logger in the form of a voltage pulse. The duration of this pulse does not reflect the duration of the spark. The spark was fired continuously for 10 s for all tests to give best possible chance of ignition. Time of ignition is recorded on the transient logger as an increase in overpressure measured by the pressure transducers.
As with the pre-mixed cloud trial, the data in the regions of high congestion (e.g. underneath the vehicle) was noisy and was difficult to analyse without smoothing and hence 13 point (0.48 ms) moving average smoothing was used. Average smoothing the data has the effect of reducing the peak height by about 30%. The peaks were much sharper and of much shorter duration than the corresponding pre-mixed cloud trial.
During each experiment normal speed video footage was recorded.
8.0 OPERATING PROCEDURES
For the pre-mixed cloud trial, hydrogen was used to charge the congestion rig to an initial concentration of flammable gas. An iterative process (involving monitoring of the gas temperature, humidity and concentration, calculating the stoichiometry and adding further hydrogen or air) was used until the required stoichiometry was achieved and the ignition system was activated.
In the jet release trial, a remotely operated valve was opened pressurising the hose up to the release valve and the vessel and hose then pressurised to the required pressure. The release and spark ignition were activated remotely through a PC.
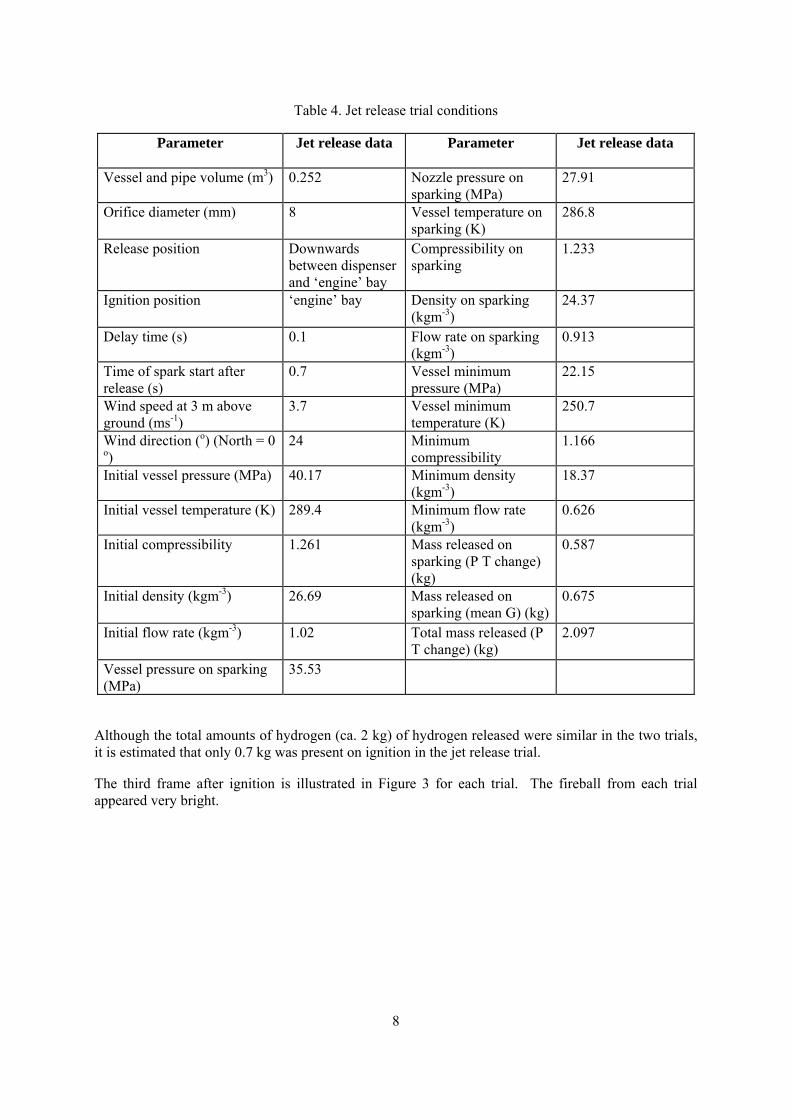
9.0 RELEASE CONDITIONS AND OBSERVATIONS
The conditions on ignition for the pre-mixed cloud trial are summarised in Table 3 and for the jet release in Table 4.
Table 3. Pre-mixed trial conditions
Parameter
Pre-mixed cloud data
Parameter
Pre-mixed cloud data
Free volume (m3) 70.16 Partial nitrogen etc pressure
0.5336
Gas mixture temperature (oC) 28.9 Partial water vapour pressure
0.0162
Ignition position Between dispensers
Partial fuel gas pressure
0.3088
Relative humidity (%) 42.1 Ratio of hydrogen to oxygen
2.183
Mean oxygen concentration (%)
14.14 Stoichiometric ratio of mixture on ignition
1.09
Partial oxygen pressure 0.1414 Mass of hydrogen ignited (kg)
1.847
8
Table 4. Jet release trial conditions
Parameter
Jet release data Parameter
Jet release data
Vessel and pipe volume (m3) 0.252 Nozzle pressure on sparking (MPa)
27.91
Orifice diameter (mm) 8 Vessel temperature on sparking (K)
286.8
Release position Downwards between dispenser and ‘engine’ bay
Compressibility on sparking
1.233
Ignition position ‘engine’ bay Density on sparking (kgm-3)
24.37
Delay time (s) 0.1 Flow rate on sparking (kgm-3)
0.913
Time of spark start after release (s)
0.7 Vessel minimum pressure (MPa)
22.15
Wind speed at 3 m above ground (ms-1)
3.7 Vessel minimum temperature (K)
250.7
Wind direction (o) (North = 0 o)
24 Minimum compressibility
1.166
Initial vessel pressure (MPa) 40.17 Minimum density (kgm-3)
18.37
Initial vessel temperature (K) 289.4 Minimum flow rate (kgm-3)
0.626
Initial compressibility 1.261 Mass released on sparking (P T change) (kg)
0.587
Initial density (kgm-3) 26.69 Mass released on sparking (mean G) (kg)
0.675
Initial flow rate (kgm-3) 1.02 Total mass released (P T change) (kg)
2.097
Vessel pressure on sparking (MPa)
35.53
Although the total amounts of hydrogen (ca. 2 kg) of hydrogen released were similar in the two trials, it is estimated that only 0.7 kg was present on ignition in the jet release trial.
The third frame after ignition is illustrated in Figure 3 for each trial. The fireball from each trial appeared very bright.
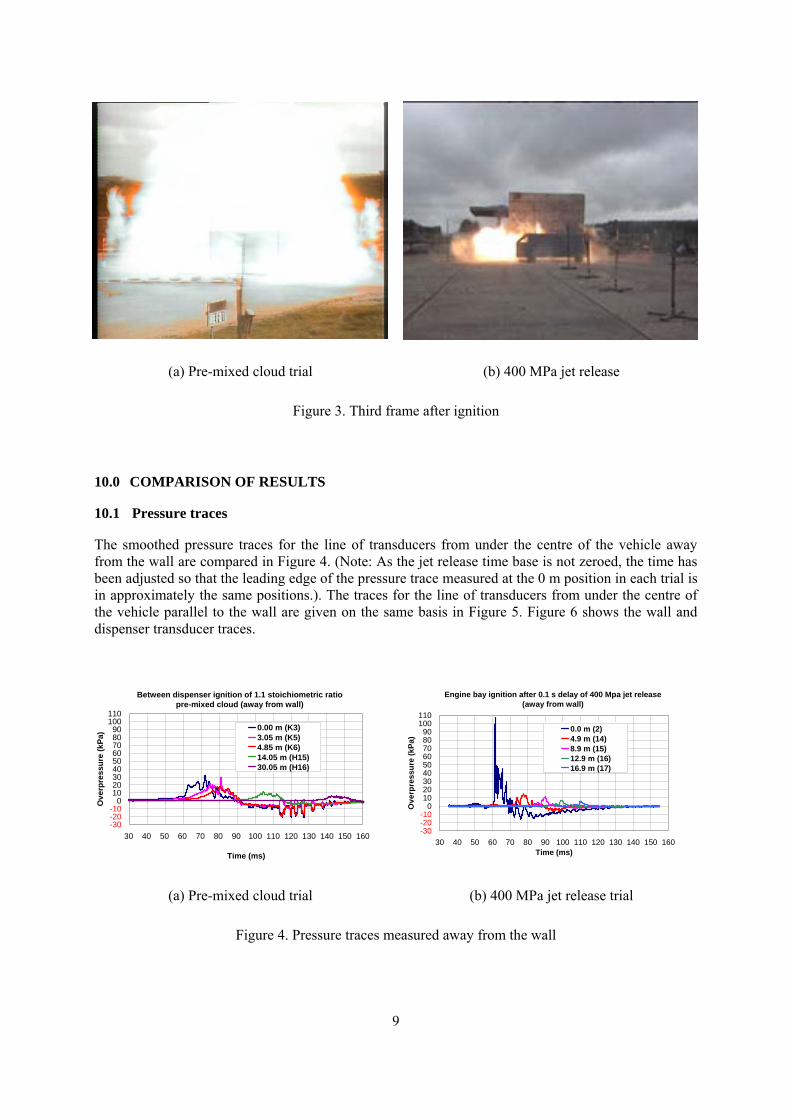
(a) Pre-mixed cloud trial (b) 400 MPa jet release
Figure 3. Third frame after ignition
10.0 COMPARISON OF RESULTS
10.1 Pressure traces
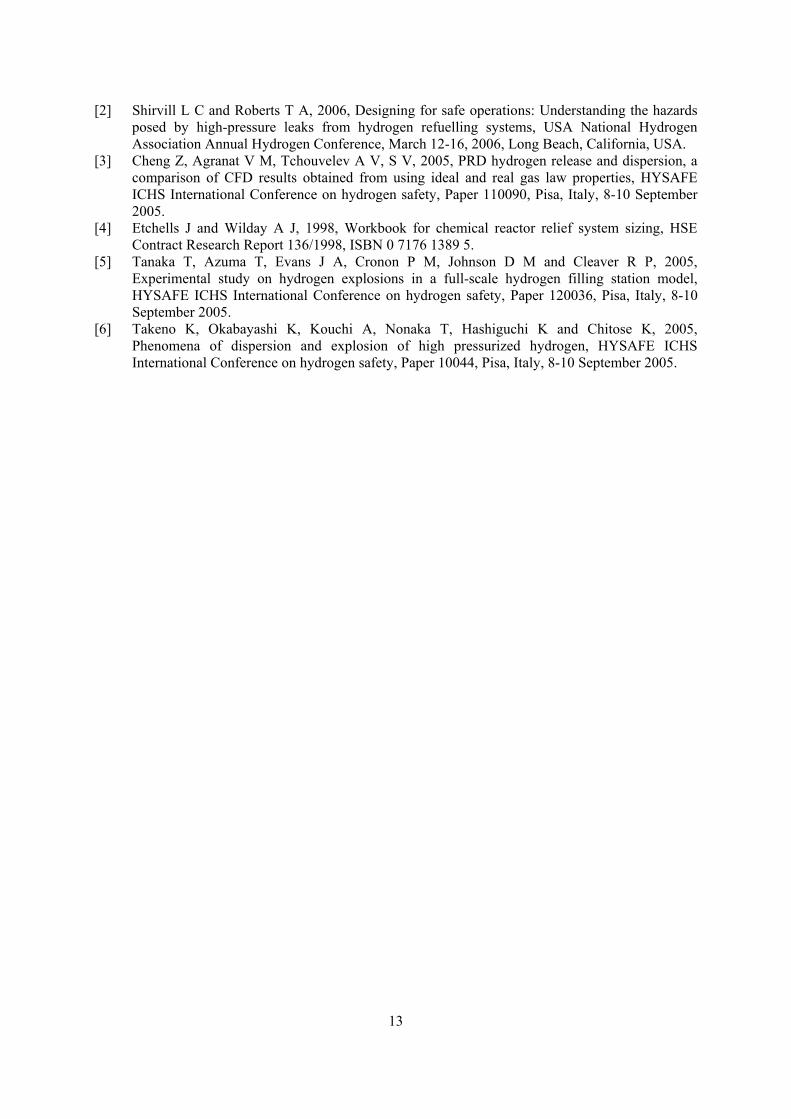
The smoothed pressure traces for the line of transducers from under the centre of the vehicle away from the wall are compared in Figure 4. (Note: As the jet release time base is not zeroed, the time has been adjusted so that the leading edge of the pressure trace measured at the 0 m position in each trial is in approximately the same positions.). The traces for the line of transducers from under the centre of the vehicle parallel to the wall are given on the same basis in Figure 5. Figure 6 shows the wall and dispenser transducer traces.
Engine bay ignition after 0.1 s delay of 400 Mpa jet release (away from wall)
Between dispenser ignition of 1.1 stoichiometric ratio pre-mixed cloud (away from wall)
9
-30 -20 -10
0102030405060708090
100110
30 40 50 60 70 80 90 100 110 120 130 140 150 160
Time (ms)
Ove
rpre
ssur
e (k
Pa) 0.00 m (K3)
3.05 m (K5)4.85 m (K6)14.05 m (H15)30.05 m (H16)
-30 -20 -10
0102030405060708090
100110
30 40 50 60 70 80 90 100 110 120 130 140 150 160Time (ms)
Ove
rpre
ssur
e (k
Pa)
0.0 m (2)4.9 m (14)8.9 m (15)12.9 m (16)16.9 m (17)
(a) Pre-mixed cloud trial (b) 400 MPa jet release trial
Figure 4. Pressure traces measured away from the wall

Between dispenser ignition of 1.1 stoichiometric ratio pre-mixed cloud (parallel to wall)
Engine bay ignition after 0.1 s delay of 400 MPa jet release (parallel to wall)
10
-40 -20
020406080
100120140160180200
30 40 50 60 70 80 90 100 110 120 130 140 150 160Time (ms)
Ove
rpre
ssur
e (k
Pa)
-1.45 m (K2)0.00 m (K3)1.50 m (K4)4.00 m (K10)6.75 m (K11)
-40 -20
020406080
100120140160180200
30 40 50 60 70 80 90 100 110 120 130 140 150 160Time (ms)
Ove
rpre
ssur
e (k
Pa)
-1.5 m (1)0.0 m (2)1.9 m (3)6.7 m (10)10.7 m (11)14.7 (12)18.7 (13)
(a) Pre-mixed cloud trial (b) 400 MPa jet release trial
Figure 5. Pressure traces measured parallel to wall
The pressure traces measured underneath the ‘vehicle’ were higher on ignition of the jet release than for the pre-mixed cloud. However, away from the underside of the ‘vehicle’, they were slightly lower.
Between dispenser ignition of 1.1 stoichiometric ratio pre-mixed cloud (on wall and dispenser)
Engine bay ignition after 0.1 s delay of 400 MPa jet release (wall and dispenser)
-40
-20
0
20
40
60
80
100
30 40 50 60 70 80 90 100 110 120 130 140 150 160Time (ms)
Ove
rpre
ssur
e (k
Pa)
1.3 m up dispenser (KD1)1.5 m up wall end (KW7)0.3 m up wall centre (KW12)1.5 m up wall centre (KW13)4.5 m up wall centre (KW14)
-40
-20
0
20
40
60
80
100
30 40 50 60 70 80 90 100 110 120 130 140 150 160Time (ms)
Ove
rpre
ssur
e (k
Pa)
4.2 m up wall centre (4)2.1 m up wall centre (5)0.1 m up wall centre (6)1.3 m up wall end (7)1.3 m up dispenser (9)
(a) Pre-mixed cloud trial (b) 400 MPa jet release trial
Figure 6. Pressure traces measured on wall and dispenser
In both cases, pressures measured on the wall and dispenser were highest at the bottom centre of the wall. The peak from the jet release trial was higher and narrower than from the pre-mixed cloud trial.
10.2 Maximum overpressures
The maximum overpressures measured in the directions from the centre of the vehicle away from the wall and parallel to the wall are plotted in Figure 7. The maximum overpressures measured on the wall and on the dispenser are summarised in Table 5.

11
0 2 4 6 8 10 12 14 16 18 20 22 24 26 28 30 320
20
40
60
80
100
120
Pre-mixed cloud
Max
imum
ove
rpre
ssur
es (k
Pa)
Distance from centre of vehicle away from wall (m)
Jet release
-2 0 2 4 6 8 10 12 14 16 18 200
20
40
60
80
100
120
140
160
180
200
Pre-mixed cloud
Max
imum
ove
rpre
ssur
es (k
Pa)
Distance from vehicle centre parallel to wall (m)
Jet release
(a) Away from wall (b) Parallel to wall
Figure 7. Maximum overpressures away from centre of vehicle
In general, the maximum overpressures measured underneath the ‘vehicle’ were much higher in the jet release trial than in the premixed-cloud trial. However, in the open, the overpressures from the pre-mixed cloud trial were slightly higher. There was some evidence of flame acceleration (higher overpressures) in the ‘engine bay’ for the pre-mixed cloud trial and underneath the rear of the ‘vehicle’ in the jet release trial.
Table 5. Maximum overpressures measured on the wall and dispenser
Pre-mixed cloud Jet release Sensor Distance
from centre of
wall (m)
Height above
ground
(m)
Maximum over-
pressure
(kPa)
Sensor Distance from
centre of wall (m)
Height above
ground
(m)
Maximum over-
pressure
(kPa) KW12 -0.4 0.3 29.3 6 0 0.08 86.8 KW13 -0.4 1.5 21.5 5 0 2.10 52.0 KW14 -0.4 4.5 18.2 4 0 4.2 37.0 KW7 2.2 1.5 66.2 7 2.6 1.25 26.4 KD1 On
dispenser 1.25 22.4 9 On
dispenser 1.25 54.4
The maximum overpressure on the wall was measured at the bottom centre in the jet release trial. However, slightly lower but still high overpressures were measured at the end of the wall in the pre-mixed cloud trial.
10.3 Impulses
The positive and negative impulses, at distances from the side of the 6.0 m x 5.4 m zone away from the wall, from the premixed and jet-release trials are compared in Table 6.
AWAY FROM WALLDISTANCES
PARALLEL TO WALLDISTANCES+
-
+

12
Table 6. Comparison of positive and negative impulses
Positive impulse Negative impulse Dist-ance
(m)
Hydr-ogen
(kg)
Trial Maximum pressure
(kPa)
Duration
(s)
Impulse
(kPa.s)
Minimum pressure
(kPa)
Duration
(s)
Impulse
(kPa.s) 2.3 1.85 Cloud 18.7 0.049 0.26 -7.9 0.086 -0.36 2.3 0.59 Jet 14.8 0.037 0.09 -6.0 0.039 -0.06
11.5 1.85 Cloud 11.3 0.046 0.14 -5.3 0.068 -0.16 10.3 0.59 Jet 6.6 0.036 0.04 -2.2 0.027 -0.02
Both the positive and negative impulses were much higher from the premixed trial than for the jet-release trial at the corresponding distances.
11.0 COMPARISON WITH RESULTS FROM OTHER RECENT STUDIES
Tanaka et al. [5] has investigated the ignition of the jet from a refuelling dispenser in an open environment. The largest overpressure was for a 1.2 s ignition delay. Similar results were obtained by Takeno et al. [6]. The results all indicate that, for a jet release, the turbulence on ignition has a greater effect on explosiveness than does the total amount of fuel released. Hence, the implication is that it is not necessary to release large quantities of hydrogen to obtain high overpressures on ignition. A release of relatively small quantities with rapid ignition may give a significant event.
12.0 CONCLUSIONS
The overall conclusions from these refuelling station trials are:
(a) Locally high overpressures (up to 180 kPa underneath the ‘vehicle’ and 87 kPa on a nearby wall) occurred within the refuelling station.
(b) The highest overpressures in the far field were from ignition of premixed hydrogen-air; (c) The highest local overpressures were observed in the jet release trial with a relatively short
ignition time i.e. the highest pressure on ignition; and (d) Both the positive and the negative impulses were much higher for premixed ignition than for jet
ignition. The results obtained from both premixed clouds and jet releases are conservative because in practice the safeguarding systems should limit the quantity of hydrogen that can be released accidentally to less than that used in these experiments.
13.0 ACKNOWLEDGEMENTS
The authors gratefully acknowledge the contribution made be John Evans, Michael Stobbart and supporting staff at Advantica, Spadeadam where the jet release trial was carried out, and by Deborah Willoughby and supporting staff at HSL Buxton where the premixed trial was carried out. The authors thank Shell Hydrogen B.V., BP Gas Marketing Limited, ExxonMobil Research and Engineering Company, and the U.K. Health and Safety Executive, for permission to publish this paper.
14.0 REFERENCES
[1] ISO/TR 15916, 2004, Basic considerations for the safety of hydrogen systems, International Standards Organisation.
13
[2] Shirvill L C and Roberts T A, 2006, Designing for safe operations: Understanding the hazards posed by high-pressure leaks from hydrogen refuelling systems, USA National Hydrogen Association Annual Hydrogen Conference, March 12-16, 2006, Long Beach, California, USA.
[3] Cheng Z, Agranat V M, Tchouvelev A V, S V, 2005, PRD hydrogen release and dispersion, a comparison of CFD results obtained from using ideal and real gas law properties, HYSAFE ICHS International Conference on hydrogen safety, Paper 110090, Pisa, Italy, 8-10 September 2005.
[4] Etchells J and Wilday A J, 1998, Workbook for chemical reactor relief system sizing, HSE Contract Research Report 136/1998, ISBN 0 7176 1389 5.
[5] Tanaka T, Azuma T, Evans J A, Cronon P M, Johnson D M and Cleaver R P, 2005, Experimental study on hydrogen explosions in a full-scale hydrogen filling station model, HYSAFE ICHS International Conference on hydrogen safety, Paper 120036, Pisa, Italy, 8-10 September 2005.
[6] Takeno K, Okabayashi K, Kouchi A, Nonaka T, Hashiguchi K and Chitose K, 2005, Phenomena of dispersion and explosion of high pressurized hydrogen, HYSAFE ICHS International Conference on hydrogen safety, Paper 10044, Pisa, Italy, 8-10 September 2005.