Embed Size (px)
Citation preview
Hydrogen production from ethanol through steamreforming, partial oxidation and autothermal reforming in a
short contact time Ni/Al2O3 reactor
João Pedro Almeida Durão
Thesis to obtain the Master of Science Degree in
Mechanical Engineering
Supervisors: Prof. Mário Manuel Gonçalves da CostaProf. Rafael de Camargo Catapan
Examination Committee
Chairperson: Prof. Edgar Caetano FernandesSupervisor: Prof. Mário Manuel Gonçalves da Costa
Member of the Committee: Prof. Cláudia Sofia Séneca da Luz Casaca
June 2017

ii

Acknowledgments
First and foremost, I wish to thank my supervisors, Professor Mario Costa and Professor Rafael
Catapan for their support and orientation throughout the course of this project and for the opportunity of
performing this thesis in Brazil.
I wish to thank Maıra, Lucas and Cezar for their support and help during the experiments.
I would also like to thank everyone that helped me with everything in Brazil, specially Simon.
To all my friends, with special mention to Catarina, Luıs and Pedro but without forgetting everyone
else that helped me throughout my life.
Finally, I wish to express my deepest gratitude to my mother for all her support and guidance.
iii

iv
Resumo
Este estudo investiga as tres principais reaccoes catalıticas para produzir H2 a partir de etanol,
isto e, reforma a vapor, oxidacao parcial e reforma auto-termica, num reactor de Ni/Al2O3 de baixo
tempo de residencia. Tempos de contacto (∼22 ms) e temperatura (325 oC a 800 oC) semelhantes
foram aplicados em todos os testes realizados de forma a poder comparar directamente os resultados.
A reforma a vapor apresenta a melhor selectividade para H2 quando comparada com as reaccoes de
oxidacao parcial e de reforma auto-termica. Porem, a reforma a vapor requer a temperatura de reaccao
mais elevada (∼700-800 oC). A oxidacao parcial tem a selectividade para H2 mais baixa, mas alcanca
o seu maximo a 575 oC, acima da qual e independente da temperatura. A oxidacao parcial seria
muito mais simples de implementar num veıculo automovel uma vez que nao requer um fornecimento
constante de calor e o unico reagente e o ar.
Palavras-chave: etanol, reforma a vapor, oxidacao parcial, reforma auto-termica, reactor de
pequeno tempo de contacto, catalisador de Ni.
v

vi

Abstract
This study investigates the three main catalytic reactions to produce H2 from ethanol, i.e., steam
reforming, partial oxidation and autothermal reforming, in a short contact time Ni/Al2O3 reactor. Similar
contact time (∼22 ms) and temperature range (325 oC to 800 oC) were applied in the experiments so that
comparisons between results are straightforward. Steam reforming presents the best selectivity towards
H2 compared with the partial oxidation and autothermal reforming reactions. However, steam reforming
requires the higher reaction temperature (∼700-800 oC). Partial oxidation has a lower selectivity towards
H2, but it reaches its maximum at 575 oC, above which is temperature independent. Partial oxidation
would be much simpler to implement in an automobile vehicle since it does not require a constant heat
supply and the only reactant is air.
Keywords: ethanol, steam reforming, partial oxidation, autothermal reforming, short contact
time reactor, Ni catalyst.
vii

viii
Contents
Acknowledgments . . . . . . . . . . . . . . . . . . . . . . . . . . . . . . . . . . . . . . . . . . . iii
Resumo . . . . . . . . . . . . . . . . . . . . . . . . . . . . . . . . . . . . . . . . . . . . . . . . . v
Abstract . . . . . . . . . . . . . . . . . . . . . . . . . . . . . . . . . . . . . . . . . . . . . . . . . vii
List of Tables . . . . . . . . . . . . . . . . . . . . . . . . . . . . . . . . . . . . . . . . . . . . . . xi
List of Figures . . . . . . . . . . . . . . . . . . . . . . . . . . . . . . . . . . . . . . . . . . . . . xiii
Nomenclature . . . . . . . . . . . . . . . . . . . . . . . . . . . . . . . . . . . . . . . . . . . . . . xvii
1 Introduction 1
1.1 Motivation . . . . . . . . . . . . . . . . . . . . . . . . . . . . . . . . . . . . . . . . . . . . . 1
1.2 Literature review . . . . . . . . . . . . . . . . . . . . . . . . . . . . . . . . . . . . . . . . . 3
1.3 Objectives . . . . . . . . . . . . . . . . . . . . . . . . . . . . . . . . . . . . . . . . . . . . . 9
1.4 Thesis outline . . . . . . . . . . . . . . . . . . . . . . . . . . . . . . . . . . . . . . . . . . . 9
2 Experimental setup, procedures and validation 10
2.1 Experimental apparatus . . . . . . . . . . . . . . . . . . . . . . . . . . . . . . . . . . . . . 10
2.2 Short contact time reactor . . . . . . . . . . . . . . . . . . . . . . . . . . . . . . . . . . . . 13
2.3 Gas chromatograph . . . . . . . . . . . . . . . . . . . . . . . . . . . . . . . . . . . . . . . 14
2.4 Experimental procedures . . . . . . . . . . . . . . . . . . . . . . . . . . . . . . . . . . . . 17
2.5 Procedures validation . . . . . . . . . . . . . . . . . . . . . . . . . . . . . . . . . . . . . . 18
3 Results and discussion 23
3.1 Steam reforming . . . . . . . . . . . . . . . . . . . . . . . . . . . . . . . . . . . . . . . . . 23
3.2 Partial oxidation . . . . . . . . . . . . . . . . . . . . . . . . . . . . . . . . . . . . . . . . . . 26
3.2.1 Effect of the ethanol to oxygen ratio . . . . . . . . . . . . . . . . . . . . . . . . . . 28
3.2.2 Effect of the residence time . . . . . . . . . . . . . . . . . . . . . . . . . . . . . . . 29
3.3 Autothermal reforming . . . . . . . . . . . . . . . . . . . . . . . . . . . . . . . . . . . . . . 31
3.4 Global results . . . . . . . . . . . . . . . . . . . . . . . . . . . . . . . . . . . . . . . . . . . 32
4 Closure 34
4.1 Conclusions . . . . . . . . . . . . . . . . . . . . . . . . . . . . . . . . . . . . . . . . . . . . 34
4.2 Future work . . . . . . . . . . . . . . . . . . . . . . . . . . . . . . . . . . . . . . . . . . . . 35
References 35
ix

x
List of Tables
2.1 Description of the equipments used in the present work identified in figure 2.1 . . . . . . . 12
2.2 Gas chromatography capillary columns used in the present work . . . . . . . . . . . . . . 14
2.3 Gases and liquids used for GC calibration and to run experiments . . . . . . . . . . . . . 16
2.4 Element detected on the GC with the respective retention time . . . . . . . . . . . . . . . 16
2.5 Mean and standard deviation for ethanol conversion and H selectivity. Ethanol/O2 molar
ratio = 2, dilution flow rate: 4 L/min, T= 500 oC . . . . . . . . . . . . . . . . . . . . . . . . 20
xi

xii
List of Figures
1.1 Consumption of fuel ethanol worldwide in thousand of barrels per day. . . . . . . . . . . . 2
1.2 Activation energy with and without a catalyst . . . . . . . . . . . . . . . . . . . . . . . . . 4
1.3 Images of (a) Pellets for a packed bed reactor, (b) Honeycomb monoliths and (c) Foam
monoliths . . . . . . . . . . . . . . . . . . . . . . . . . . . . . . . . . . . . . . . . . . . . . 5
2.1 Schematic of the experimental apparatus. Blue represents nitrogen flow; Black represents
air flow; Red represents ethanol flow; Brown represents products flow; Green represents
hydrogen flow that exits by the same place as air. . . . . . . . . . . . . . . . . . . . . . . . 11
2.2 Photographs of (a) Oven and (b) Control box . . . . . . . . . . . . . . . . . . . . . . . . . 11
2.3 Schematic of the quartz tube used as reactor bed with the position of the monolith repre-
sented in red . . . . . . . . . . . . . . . . . . . . . . . . . . . . . . . . . . . . . . . . . . . 11
2.4 Inlet chamber . . . . . . . . . . . . . . . . . . . . . . . . . . . . . . . . . . . . . . . . . . . 13
2.5 Alumina monolith . . . . . . . . . . . . . . . . . . . . . . . . . . . . . . . . . . . . . . . . . 13
2.6 GC used . . . . . . . . . . . . . . . . . . . . . . . . . . . . . . . . . . . . . . . . . . . . . . 14
2.7 System of valves inside the GC . . . . . . . . . . . . . . . . . . . . . . . . . . . . . . . . . 15
2.8 Programmed temperature ramp of the GC analysis . . . . . . . . . . . . . . . . . . . . . . 15
2.9 Example of the results obtained by the GC. (a) results from the FID and (b) results from
the TCD . . . . . . . . . . . . . . . . . . . . . . . . . . . . . . . . . . . . . . . . . . . . . . 17
2.10 Ethanol conversion (Xethanol) and hydrogen selectivity (SH2) against time on stream.
Ethanol/O2 molar ratio = 2, dilution flow rate: 4 L/min, T= 600 oC, residence time =
22 ms . . . . . . . . . . . . . . . . . . . . . . . . . . . . . . . . . . . . . . . . . . . . . . . 18
2.11 Photographs of the foam (a) before being on stream and (b) after being on stream for 2.5 h 19
2.12 SEM images of (a) the Ni impregnated foam and (b) the foam after being on stream for
2.5 h both with an amplification of 100x . . . . . . . . . . . . . . . . . . . . . . . . . . . . 19
2.13 SEM images of (a) alumina foam and (b) alumina foam covered with Ni particles (8.25% wt) 20
2.14 (a) a SEM images of a regenerated foam with an amplification of 100x and (b) the EDS
analysis of the regenerated foam in the region marked with 1 in panel (a) . . . . . . . . . 20
2.15 Conversion of ethanol in an empty quartz tube, over alumina and over a foam impregnated
with Ni as a function of the temperature. Ethanol/O2 molar ratio = 2, dilution flow rate =
4 L/min, residence time = 22 ms . . . . . . . . . . . . . . . . . . . . . . . . . . . . . . . . 21
xiii

2.16 Selectivity to Hydrogen in an empty reactor, over alumina and over a foam impregnated
with Ni as a function of the temperature. Ethanol/O2 molar ratio = 2, dilution flow rate =
4 L/min, residence time = 22 ms . . . . . . . . . . . . . . . . . . . . . . . . . . . . . . . . 22
3.1 H-based selectivity of the main species in the products of the SR of ethanol over Ni/Al2O3
as a function of the temperature. H2O/ethanol molar ratio = 3, dilution flow rate = 4 L/min,
residence time = 22 ms . . . . . . . . . . . . . . . . . . . . . . . . . . . . . . . . . . . . . 24
3.2 C-based selectivity of the main species in the products of the SR of ethanol over Ni/Al2O3
as a function of the temperature. H2O/ethanol molar ratio = 3, dilution flow rate = 4 L/min,
residence time = 22 ms . . . . . . . . . . . . . . . . . . . . . . . . . . . . . . . . . . . . . 24
3.3 H-based selectivity of the main species in the products of the SR of ethanol over Al2O3 as
a function of the temperature. H2O/ethanol molar ratio = 3, dilution flow rate = 4 L/min,
residence time = 22 ms . . . . . . . . . . . . . . . . . . . . . . . . . . . . . . . . . . . . . 25
3.4 C-based selectivity of the main species in the products of the SR of ethanol over Al2O3 as
a function of the temperature. H2O/ethanol molar ratio = 3, dilution flow rate = 4 L/min,
residence time = 22 ms . . . . . . . . . . . . . . . . . . . . . . . . . . . . . . . . . . . . . 25
3.5 H-based selectivity of the main species in the products of the POX of ethanol over Ni/Al2O3
as a function of the temperature. Ethanol/O2 molar ratio = 2, dilution flow rate = 4 L/min,
residence time = 22 ms . . . . . . . . . . . . . . . . . . . . . . . . . . . . . . . . . . . . . 27
3.6 C-based selectivity of the main species in the products of the POX of ethanol over Ni/Al2O3
as a function of the temperature. Ethanol/O2 molar ratio = 2, dilution flow rate = 4 L/min,
residence time = 22 ms . . . . . . . . . . . . . . . . . . . . . . . . . . . . . . . . . . . . . 27
3.7 Effect of the ethanol/oxygen ratio in the H2 selectivity for the POX of ethanol over Ni/Al2O3
as a function of the temperature. Symbols: experiments; dashed line: equilibrium condi-
tions calculated with GASEQ. Dilution flow rate = 4 L/min, residence time = 22 ms. . . . . 29
3.8 Effect of the ethanol/oxygen ratio in the ethanol conversion for the POX of ethanol over
Ni/Al2O3 as a function of the temperature. Dilution flow rate = 4 L/min, residence time =
22 ms . . . . . . . . . . . . . . . . . . . . . . . . . . . . . . . . . . . . . . . . . . . . . . . 29
3.9 Effect of the residence time in the ethanol conversion for the POX of ethanol over Ni/Al2O3
as a function of the temperature. Ethanol/O2 molar ratio = 2, dilution flow rate: 4 L/min . 30
3.10 Effect of the residence time in the H2 selectivity for the POX of ethanol over Ni/Al2O3 as a
function of the temperature. Ethanol/O2 molar ratio = 2, dilution flow rate: 4 L/min . . . . 30
3.11 H-based selectivity of the main species in the products of the ATR of ethanol over Ni/Al2O3
as a function of the temperature. Ethanol/O2 molar ratio = 2.79, H2O/ethanol molar ratio
= 2.28, dilution flow rate = 4 L/min, residence time = 22 ms . . . . . . . . . . . . . . . . . 31
3.12 C-based selectivity of the main species in the products of the ATR of ethanol over Ni/Al2O3
as a function of the temperature. Ethanol/O2 molar ratio = 2.79, H2O/ethanol molar ratio
= 2.28, dilution flow rate = 4 L/min, residence time = 22 ms . . . . . . . . . . . . . . . . . 32
xiv

3.13 Comparison between H2 selectivities for the SR, POX and ATR of ethanol over Ni/Al2O3 as
a function of the temperature. Symbols: experiments; dashed line: equilibrium conditions
calculated with GASEQ . . . . . . . . . . . . . . . . . . . . . . . . . . . . . . . . . . . . . 33
xv

xvi
Nomenclature
ATR Autothermal reforming
EDS Energy-dispersive X-ray spectroscopy
EGR Exhaust gas recirculation
EU European Union
FID Flame ionization detector
GC Gas chromatograph
GHSV Gas hourly space velocity
POX Partial oxidation
SEM Scanning electron microscopy
SR Steam reforming
TCD Thermal conductivity detector
xvii

xviii

Chapter 1
Introduction
1.1 Motivation
Since 1979, when the first world climate conference was held, there has been an increasing con-
cern about greenhouse-gas emissions worldwide. Nowadays, since the influence of human habits on
the climate changes is generally accepted, governments are trying to establish goals on greenhouse
gases reduction. However, between 2000 and 2014, worldwide CO2 emissions increased by 2.3% per
year [1]. The energy sector is responsible for around two thirds of all the greenhouse-gas emissions
and over 90% of these are CO2 from fossil-fuel combustion [1]. Recently a historic event took place
where 175 parties signed the Paris Agreement turning it into the most signed international agreement in
a single day. This shows how important this subject is and how crucial the development or improvement
of technologies based on renewable energy sources is.
Between 1990 and 2004 the European Union (EU) reduced the greenhouse-gas emissions by 5%
although CO2 emissions from road transportation increased by 26% [2]. More recently, due to high oil
prices, increased efficiency and slower growth in mobility, CO2 emissions decreased between 2007 and
2011 [3]. Despite such favorable scenario, road transport still relies mostly on fossil fuels, consuming
60% of all the oil consumed in the EU [2]. In this context, changing human habits and improving public
transportation are important strategies. However, stricter fuel efficiency requirements and improvements
of new vehicles through development and introduction of better technologies are of great importance.
Hydrogen is the most abundant element on earth and has the highest energy content per unit of
weight. It is most stable in gas phase (H2) and also burns cleanly without emitting pollutants [4], being
water the only product. Main concerns about the large use of H2 is that it is hard to store, handle and
transport [5] and it is not available as H2 in nature. Nowadays, the most common chemical process to
produce H2 is from methane steam reforming [6] that comes from natural gas, which does not solve the
problem of fuel fossil dependency.
Ethanol is a renewable energy source being nearly CO2 neutral when derived from biomass. This
happens because the carbon dioxide released from its combustion is consumed in the biomass growth
[7]. Ethanol is liquid at ambient conditions and easier to transport and store than other alternative
1
fuels like hydrogen. It is also free of toxic elements like sulphur present in gasoline and natural gas.
Considering that ethanol has this advantages when comparing with the most common fuels, it is natural
that so many studies using ethanol steam reforming (SR) for hydrogen production have been made
[4, 5, 6] with the aim of developing an efficient way of producing hydrogen in a more environmental
friendly way.
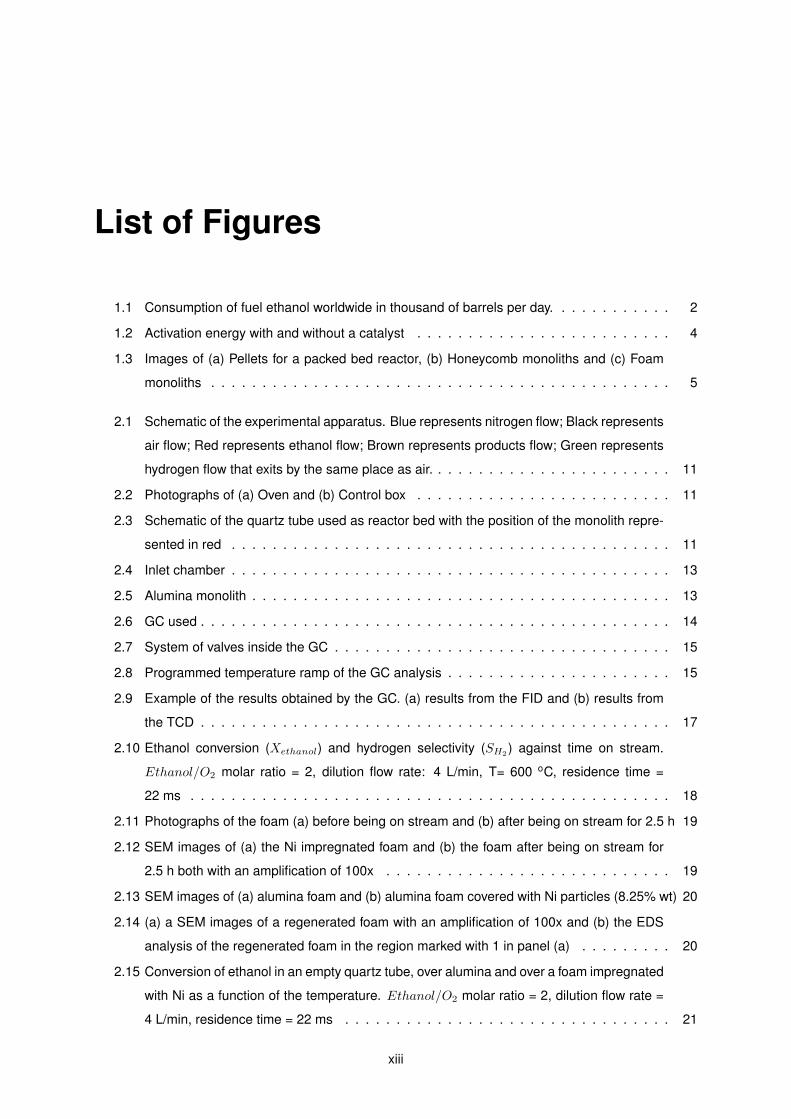
Ethanol is the most widely biofuel produced in the world, and it is largely used in the United States
and Brazil as an automotive fuel, displacing gasoline, where it makes use of a well established structure
for its production, storage and transportation. In particular, in Brazil many cars are nowadays equipped
with engines that accept as fuel either pure ethanol or ethanol and gasoline blends. It is not surprising
that the ethanol consumption worldwide has increased strongly between 2002 and 2010 as it can be
seen in figure 1.1.
Figure 1.1: Consumption of fuel ethanol worldwide in thousand of barrels per day. [8]
H2 has a higher flame speed than ethanol [9] or gasoline, which improves the thermal efficiency
and operating limits of an engine [10]. H2 also has a higher diffusion coefficient, which improves the fuel-
air mixture. On the other hand, as H2/air flames have higher adiabatic flame temperature than gasoline
or ethanol flames this favours NOx emissions via the thermal mechanism. Lean combustion is usually
applied to diminish this effect as the addition of H2 enables a better stability under lean conditions [10].
Since H2 is hard to store and transport, it is straightforward the development of strategies for its
on-board generation following the vehicle demand. One strategy that recovers energy while improving
engine efficiency is by using exhaust gas recirculation (EGR) coupled to on-board reforming of automo-
tive fuels [9]. The H2-rich syngas produced is reinjected into the combustion chamber with the fuel to
get the advantages of using ethanol and H2 combined.
2
1.2 Literature review
The three well-known routes for H2 production from ethanol are steam reforming (SR), partial oxi-
dation (POX) and autothermal reforming (ATR). The most studied reaction is the ethanol steam reforming
[4, 5]
C2H5OH + 3H2O→ 2CO2 + 6H2 (∆Ho298 = 173 kJ/mol). (1.1)
This technology also allows the extraction of H2 from water, which results in a high H2/CO ratio [6].
As SR is highly endothermic, an external energy source is necessary. Additionally, water is one of the
reactants, which adds more complexity to an on-board system.
Another route of producing H2 from ethanol is the POX reaction [11, 12]
C2H5OH + 0.5O2 → 2CO + 3H2 (∆Ho298 = 14 kJ/mol). (1.2)
The POX reaction is usually approached as exothermic since only a small excess of oxygen is
needed in order to generate the heat to promote the reaction without an external heat supply [13].
Mixing water, oxygen and ethanol produces an autothermic reaction [14]
C2H5OH + 0.36O2 + 2.28H2O→ 2CO2 + 5.28H2 (∆Ho298 ' 0 kJ/mol). (1.3)
The main advantage of the ATR is that it doesn’t need an external energy source. However, the
system is still more complex than the utilized in the POX reaction as it needs addition of oxygen and
water to operate. It is very important to minimize the weight and complexity of the system of an on-board
device so the POX is a promising reaction for this purpose because the only additional reactant needed
is oxygen.
The reactions above (1.1, 1.2 and 1.3) describe ideal processes, which are only an approximation
of the real processes. Since the first step of the reaction is to decompose the ethanol molecule into
other species, the first aspect to have in consideration is its conversion that is defined as
Xethanol =Fet,in − Fet,out
Fet,in
, (1.4)
where Fet,in and Fet,out are the molar flow rates of ethanol at reactor inlet and outlet, respectively.
Using a stoichiometric mixture, complete combustion is not achieved [15]. Depending on the
predominant reactions under a certain temperature and pressure conditions, different feed compositions
can give a result closer to what is required. A real combustion process is usually operated under excess
air conditions to achieve a complete combustion [15] but, in this case, it can also be undesired as excess
oxygen can lead to water formation, consuming the hydrogen.
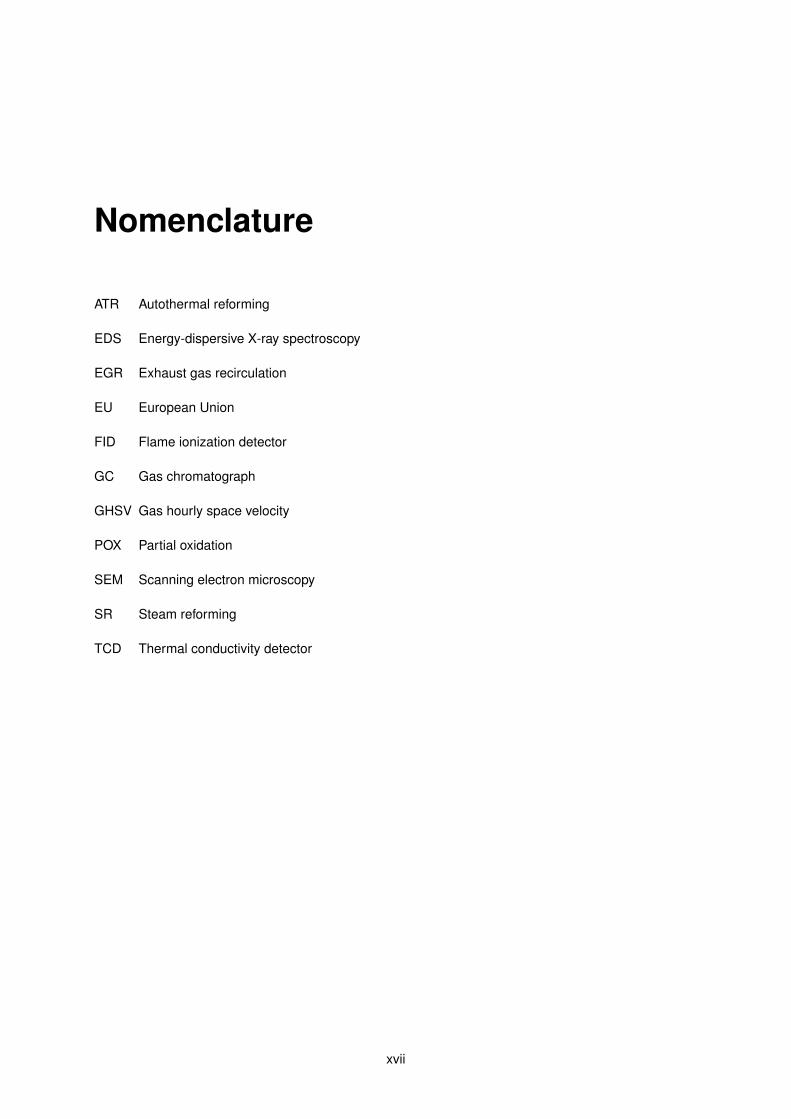
An activation energy is needed in order to start any reaction [15] so temperature is a crucial as-
pect. An increase in temperature favours endothermic reactions such as SR, as opposite to a decrease
in temperature that favours exothermic reactions like acetaldehyde decomposition [16]. As the opti-
mum temperature to start POX or to run SR reactions is higher than the typical engine exhaust gas
3
temperature [17] and they exit the engine with a high velocity, it would be good to change the reaction
temperature or the reaction path to conditions closer to the ones inside a car. By using a catalyst this
is possible. The catalyst is a substance that, remaining unchanged, alters the reaction rate, normally
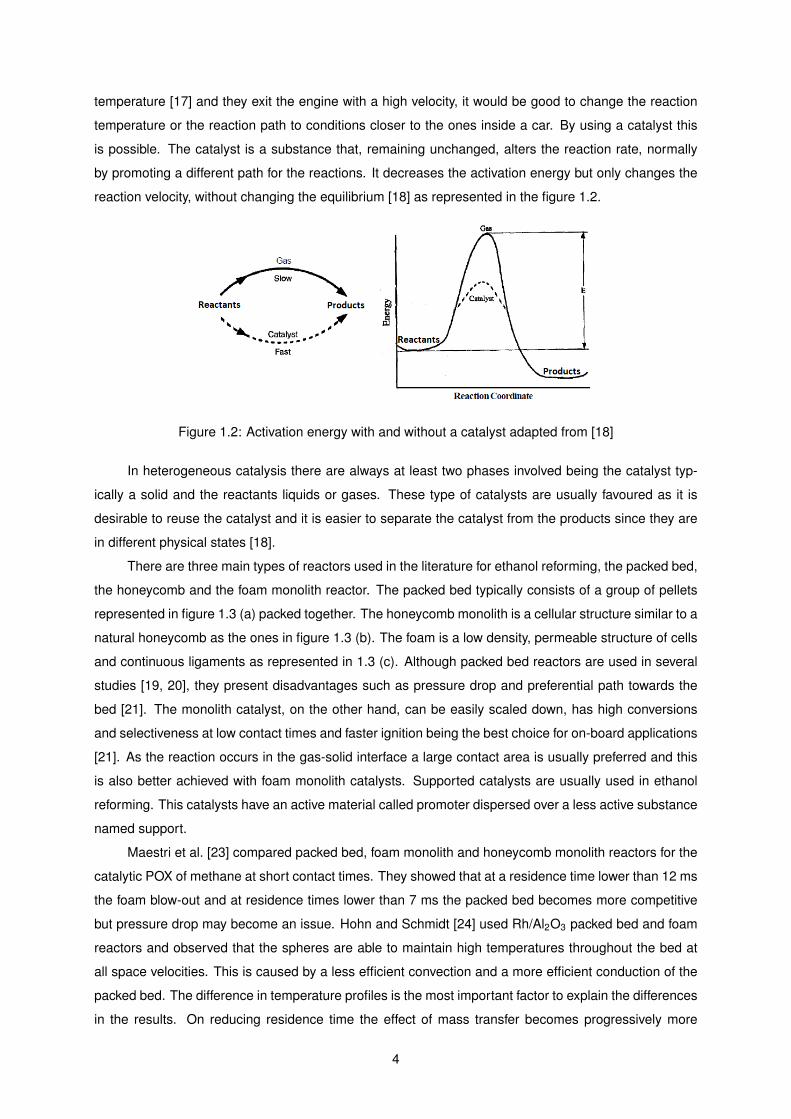
by promoting a different path for the reactions. It decreases the activation energy but only changes the
reaction velocity, without changing the equilibrium [18] as represented in the figure 1.2.
Figure 1.2: Activation energy with and without a catalyst adapted from [18]
In heterogeneous catalysis there are always at least two phases involved being the catalyst typ-
ically a solid and the reactants liquids or gases. These type of catalysts are usually favoured as it is
desirable to reuse the catalyst and it is easier to separate the catalyst from the products since they are
in different physical states [18].
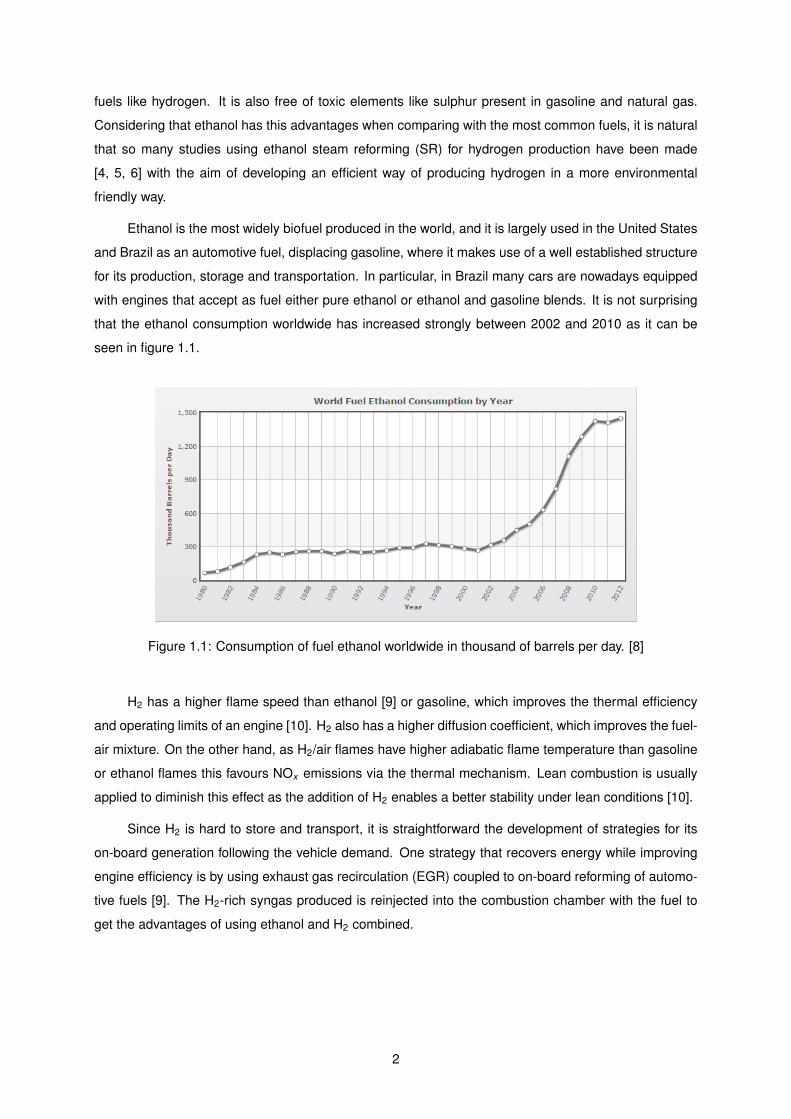
There are three main types of reactors used in the literature for ethanol reforming, the packed bed,
the honeycomb and the foam monolith reactor. The packed bed typically consists of a group of pellets
represented in figure 1.3 (a) packed together. The honeycomb monolith is a cellular structure similar to a
natural honeycomb as the ones in figure 1.3 (b). The foam is a low density, permeable structure of cells
and continuous ligaments as represented in 1.3 (c). Although packed bed reactors are used in several
studies [19, 20], they present disadvantages such as pressure drop and preferential path towards the
bed [21]. The monolith catalyst, on the other hand, can be easily scaled down, has high conversions
and selectiveness at low contact times and faster ignition being the best choice for on-board applications
[21]. As the reaction occurs in the gas-solid interface a large contact area is usually preferred and this
is also better achieved with foam monolith catalysts. Supported catalysts are usually used in ethanol
reforming. This catalysts have an active material called promoter dispersed over a less active substance
named support.
Maestri et al. [23] compared packed bed, foam monolith and honeycomb monolith reactors for the
catalytic POX of methane at short contact times. They showed that at a residence time lower than 12 ms
the foam blow-out and at residence times lower than 7 ms the packed bed becomes more competitive
but pressure drop may become an issue. Hohn and Schmidt [24] used Rh/Al2O3 packed bed and foam
reactors and observed that the spheres are able to maintain high temperatures throughout the bed at
all space velocities. This is caused by a less efficient convection and a more efficient conduction of the
packed bed. The difference in temperature profiles is the most important factor to explain the differences
in the results. On reducing residence time the effect of mass transfer becomes progressively more
4
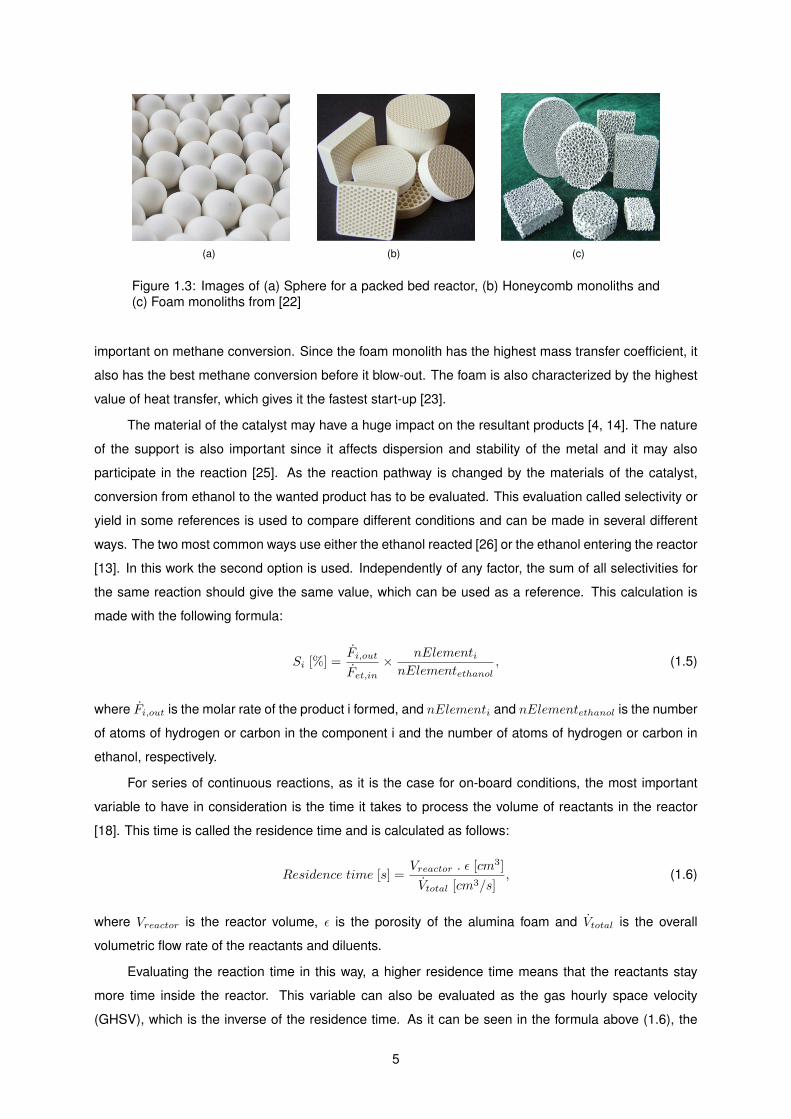
(a) (b) (c)
Figure 1.3: Images of (a) Sphere for a packed bed reactor, (b) Honeycomb monoliths and(c) Foam monoliths from [22]
important on methane conversion. Since the foam monolith has the highest mass transfer coefficient, it
also has the best methane conversion before it blow-out. The foam is also characterized by the highest
value of heat transfer, which gives it the fastest start-up [23].
The material of the catalyst may have a huge impact on the resultant products [4, 14]. The nature
of the support is also important since it affects dispersion and stability of the metal and it may also
participate in the reaction [25]. As the reaction pathway is changed by the materials of the catalyst,
conversion from ethanol to the wanted product has to be evaluated. This evaluation called selectivity or
yield in some references is used to compare different conditions and can be made in several different
ways. The two most common ways use either the ethanol reacted [26] or the ethanol entering the reactor
[13]. In this work the second option is used. Independently of any factor, the sum of all selectivities for
the same reaction should give the same value, which can be used as a reference. This calculation is
made with the following formula:
Si [%] =Fi,out
Fet,in
× nElementinElementethanol
, (1.5)
where Fi,out is the molar rate of the product i formed, and nElementi and nElementethanol is the number
of atoms of hydrogen or carbon in the component i and the number of atoms of hydrogen or carbon in
ethanol, respectively.
For series of continuous reactions, as it is the case for on-board conditions, the most important
variable to have in consideration is the time it takes to process the volume of reactants in the reactor
[18]. This time is called the residence time and is calculated as follows:
Residence time [s] =Vreactor . ε [cm3]
Vtotal [cm3/s], (1.6)
where Vreactor is the reactor volume, ε is the porosity of the alumina foam and Vtotal is the overall
volumetric flow rate of the reactants and diluents.
Evaluating the reaction time in this way, a higher residence time means that the reactants stay
more time inside the reactor. This variable can also be evaluated as the gas hourly space velocity
(GHSV), which is the inverse of the residence time. As it can be seen in the formula above (1.6), the
5

reaction time can either be altered by changing the reactor volume or the volumetric flow rate.
Even after choosing the best material and reactants concentration, there are still improvements
that can increase the H2 production. As the reaction favoured by the catalyst occurs on the surface
of the metal, decreasing the particle size and increasing the surface area of the catalyst increases the
conversion to the wanted products [27]. The metal loading can also affect conversion and selectivity
[24] and Witt and Schmidt [28] also noticed differences between foams with different diameters, even
keeping the GHSV constant.
The catalytic reactor may suffer deactivation along time on stream. This process can occur in
three different ways: sintering, fouling or poisoning. Sintering, also referred to as aging, is the loss of
activity due to the loss of active surface area resulting from agglomeration of catalytic particles as they
are exposed to high temperatures. Fouling, also referred to as coking, results from the accumulation of
deposits on the surface of the catalyst, being carbon (coke) the most common one. Poisoning occurs
when a molecule is irreversible chemisorbed to active sites, reducing the number of available sites for
the main reaction. In ethanol reforming the most common deactivation process is coking [29] but the
catalyst can usually be regenerated by burning the carbon [18].
In the past ten years, a large number of works concentrated on the study of the catalytic SR, POX
and ATR reactions and useful reviews can be found elsewhere [5, 30]. Ni et al. [30] reviewed stud-
ies that applied noble metal catalysts and concluded that Rh is the most active for ethanol conversion
producing the higher H2 selectivity. Liguras et al. [31] showed that the activity for SR of ethanol fol-
lows the sequence: Rh>Pt>Pd>Ru. Although highly active, the high cost and low availability of noble
metals, e.g., platinum and rhodium, justified the development of better technological, economical and
environmental alternatives. Several different materials were already studied for both SR and POX but
only the transition metals have shown considerable ethanol conversion and H2 selectivity [32]. Nickel is
highly active for reforming reaction and, as it is cheap, it is one of the most studied materials. Ni-based
catalysts have been used industrially over the past 50 years in SR of natural gas [33] and methana-
tion [34, 35]. Its activity is lower than that of the noble metals [30], but promising results in terms of
ethanol conversion and selectivity towards H2 were reported for SR, POX and ATR by a number of au-
thors [13, 14, 36, 37, 38, 39, 40, 41] The price can be of particular importance for on-board applications
as they are usually used in large scales. For support, alumina (Al2O3) is one of the most common in
reforming catalysts due to its mechanical and chemical resistance under reaction conditions [25]. How-
ever, Al2O3 is widely known for the promotion of dehydration of ethanol to ethylene, which in turn forms
coke on the catalyst surface [5]. Ni/Al2O3 is, consequently, one of the most studied catalysts which
already has industrial applications for hydrogen production so, it is a clear candidate for a study under
the conditions in the present work.
Methane SR is the most energy-efficient technology available to produce H2 industrially [4]. As
CH4 doesn’t have the C-C bond and the oxygen atom, it has a simpler pathway and a smaller number of
potential by-products than ethanol. From the three options (POX, ATR and SR), POX has faster start up
and response times [42] so it is the most studied reaction at smaller residence times. These reactions
are extremely exothermic so, all experiments where performed autothermally. This means that all the
6

researchers ignited the mixture at a certain temperature and then stopped supplying heat to the reactor.
Torniainen et al. [43] compared several metals over an alumina foam for the direct oxidation of methane
to syngas with a 10 ms residence time but only Ni, Rh, Pt and Ir where sufficiently stable to attain a
steady state catalytic reaction. Their results show large differences between metals which indicates
that the product distribution are controlled by kinetics on the catalyst surfaces. Ni required the most
preheat to ignite but it was also the metal that attained the best methane conversion and H2 selectivity.
Contrary to what would be expected, Witt and Schmidt [28] showed that, with a foam monolith, methane
conversion and H2 selectivity increases with a decrease in residence time. CO, on the other hand,
decreased and CO2 increased. This increase is only observed down to a residence time of 10 ms.
With further reduction both methane conversion and H2 selectivity decrease rapidly. Bizzi et al. [44]
and Specchia et al. [45] also reported a slight increase in methane conversion and H2 selectivity with a
decrease in residence time for a packed bed reactor. In these experiments a residence time as low as 7
ms was used and there was no sigh of methane conversion decreasing. These higher conversions can
be explained by the higher mass flow rate, which improves mass and heat transfer counter-balancing
the residence time reduction. With a better heat transfer within the catalyst there is also an increase
in temperature. This explains the higher H2 yield as its production is kinetically and thermodynamically
favoured at high temperature [45].
Some studies have been preformed for higher hydrocarbons as well. Huff and Schmidt [46] used
Pt, Rh and Pd over alumina foams to study POX of ethane. They found out that at a 10 ms residence
time ethylene has a selectivity of 70% over Pt. With Rh, the main by-product was syngas with no carbon
formation. Pd, on the other hand, rapidly deactivates because of carbon formation. This shows that for
these higher molecules the catalyst can even be more important than for methane as the reaction path
can lead to more different by-products. They tested residence times between 40 and 7 ms and similarly
to what happened with methane, conversion increases with higher flow rates. Silberova et al. [47] used
a Rh/Al2O3 foam with a residence time of 105 ms to study the effect of the furnace temperature on
POX and ATR of propane. Ignition was observed at a temperature between 300 and 400 oC and was
accompanied by a strong heat generation that increased the reactor temperature to 830 oC for the
POX reaction while the furnace was at 400 oC. This point of maximum temperature inside the reactor
was located in the middle of the active monolith at furnace temperatures less than 700 oC. Above that
temperature the hot-spot moved towards the inlet of the monolith and, at 800 oC this point of maximum
temperature was located before the foam. For the ATR the temperature profile is almost the same but
with lower maximum temperatures, only reaching 700 oC when the furnace was at 400 oC. Propane
conversion increased with the temperature of the furnace reaching 100% at 700 oC for POX and at 800oC for ATR. H2 selectivity also changed with the furnace temperature reaching its maximum yield at 700oC and then decreasing for both POX and ATR.
Mitra et al. [48] preformed a thermodynamic analysis of the SR reaction. His results indicate that
independently of the temperature, more water always means more hydrogen. This analysis also shows
that this highly endothermic reaction is not always favoured by increasing temperature. With water to
ethanol ratios of 10:1 and 20:1, after reaching a maximum H2 production at around 900 K, H2 yield
7
starts decreasing [48]. Considering pressure, another thermodynamic analysis shows that atmospheric
pressure gives the best H2 yield [49]. For partial oxidation the optimal operating conditions that give
maximum H2 with complete ethanol conversion are obtained with temperatures between 1070 K and
1200 K, atmospheric pressure and oxygen/ethanol ratio of 0.6 to 0.8. Under this conditions the main
products are H2 with a maximum selectivity of 95% and CO with some CH4 [50].
Rodrigues and Schmal [21] tested ethanol POX over a Ni/Al2O3 honeycomb between 370 and
670 oC. They used a rather big residence time of 200 ms. Although there are studies of residence
times bellow 10 ms, when compared with industrial processes that take some seconds, this is already a
small residence time that can be taken into account. Ethanol conversion under these conditions doubled
between 370 and 420 oC and it was attributed to catalyst activation but H2 selectivity doubled only
between 470 and 520 oC. When the furnace reached a temperature of 570 oC H2 selectivity stabilized.
Hebben et al. [42] used a Rh/Al2O3 honeycomb with a residence time between 11 and 21 ms and a
dilution of 80% N2 to observe that ethanol conversion and H2 selectivity is better for richer mixtures
down to a C/O ratio of 0.67 which was the minimum tested. Another study performed by Salge et al. [13]
with a constant furnace temperature of 700 oC and a residence time of 7 ms reached the conclusion
that for all the noble metals tested, a C/O ratio of 1 gives the worst ethanol conversion. This study was
made using an Al2O3 and SiO2 foam with C/O ratios between 0.6 and 1.5. For Rh this point of worst
conversion is also coincident with the worst H2 selectivity but for both Pd and Pt this selectivity increased
with the increasing C/O. Once again, the temperature profiles of POX and ATR are similar. The reactor
temperature is higher at lower C/O ratios and decreases with an increasing ratio. For the POX reaction
the temperature inside the reactor is always higher than the temperature of the furnace for C/O<1. With
the Rh catalysts, for ratios above 1 this temperature falls bellow the 700 oC. Using the ATR reaction the
temperature of the reactor decreases with an increase in the amount of water and it is only above 700oC ate really small C/O ratios.
To examine the effect of temperature on ethanol POX over a Rh-Ce/Al2O3 foam, Deluga et al. [51]
diluted the reactants with 75% He and heated the reactor to maintain the catalyst nearly isothermal at
C/O = 1. They used a residence time of 100 ms and the conversion of ethanol at 400 oC is only 40% but
it rises to above 95% at 650 oC. At 400 oC acetaldehyde has a selectivity of 16% but it falls to a negligible
level by 650 oC. H2 selectivity on the other hand, was always above 80%, increasing with temperature.
This study indicates that for optimum performance are needed catalyst temperatures above 700 oC.
A great challenge for ethanol reforming is the catalyst as it has to be efficient and stable for long
periods of time [21]. That is why, even though it can never be completely separated, so many studies
have been more focused on the catalyst and less on the reactions themselves. There have been several
studies concerning steam reforming and some regarding partial oxidation but since the main goal was
to produce hydrogen, they were almost all preformed with high residence times which is not the desired
operation conditions for an on board reaction [4, 5, 6, 7, 14, 25, 26, 52]. With steam reforming conditions,
as it is expected, independently of the catalyst, the highest hydrogen yields are achieved for higher
temperatures [52]. It was also observed that the product distribution depends not only on the catalyst
but also on the support, specially at low temperatures [52].
8
Freni et al. [53] utilized a wider spectrum of gas hourly space velocities and under steam reforming
conditions, it was observed that at a GHSV over 80000 h– 1 conversion of ethanol started to diminish.
The products also changed, increasing the acetaldehyde and methane in the products and producing
less carbon monoxide and carbon dioxide. With slower GHSV, between 3620 and 9055 h– 1 and under
a mixture of water and oxygen, Liguras et al. [7] observed that with an increase in space velocity with a
Ru catalyst there is a small drop in ethanol conversion staying, nonetheless, close to 100%. With a Ni
catalyst conversion remains complete over all residence times at 600 oC [14] . Interestingly, hydrogen
selectivity increases slightly in both cases.
Either under SR or POX conditions, specially at lower temperatures, Ni/Al2O3 has always showed
high carbon deposition which leads to deactivation of the catalyst and eventually disintegration of the
structural rigidity of the catalyst [54] but, if done early, complete regenerability of the catalyst is possible
without any apparent effect on the conversion or the selectivity [14].
The studies with ethanol at low residence times evaluate mostly the best ethanol to air ratio or the
best catalyst for partial oxidation [13, 42]. The effect of temperature has also been studied however, this
was always preformed at residence times one order of magnitude higher than the utilized in this work
[21, 51]. Some have also studied the effect of residence time in autothermal reforming [14] and steam
reforming [53] but always with higher residence times.
This study investigates the SR, POX and ATR of ethanol in a short contact time Ni/Al2O3 reactor.
Similar contact time (∼22 ms) and temperature range (325 oC to 800 oC) were applied in the experiments
to allow for comparisons between the data. The effect of the support on the products composition and
on the catalytic ignition is also discussed.
1.3 Objectives
The overall objective of this work is to evaluate ethanol SR, POX and ATR in a short contact time
catalytic reactor. In order to achieve this, the following tasks were undertaken:
1. Setup the experimental apparatus and procedures, including the gas chromatography method;
2. Impregnate Ni over an Al2O3 foam using the incipient wetness method;
3. Perform morphological analysis of the monolith;
4. Evaluate selectivity and ethanol conversion using different co-reactants, namelly, water and air.
1.4 Thesis outline
This thesis is divided in four chapters, of which this constitutes Chapter 1. Chapter 2 presents
the material and the experimental apparatus used in this work, describes the methodology applied and
discusses the validation of the results. In Chapter 3, the main results are presented and discussed.
Finally, in Chapter 4, conclusions obtained from the results are presented followed by suggestions for
future work.
9

Chapter 2
Experimental setup, procedures and
validation
The experiments of this thesis were performed in the Laboratory of Applied Combustion and Catal-
ysis of Universidade Federal de Santa Catarina (UFSC) in Joinville, Brazil. The present chapter is a
description of the experimental setup, techniques and procedures. Preliminary tests for apparatus vali-
dation are also presented.
2.1 Experimental apparatus
Figure 2.1 shows a schematic of the experimental apparatus used in this work. Table 2.1 describes
the equipment used as indicated in figure 2.1. All the gases (N2, Air and H2/N2 mixture) enter a control
box in figure 2.2 (b) from where they are directed to the respective volumetric flow meter and use. The
fuel, either ethanol or ethanol mixed with water is dragged by N2 from a saturator. From the control
box the fuel can be rejected, go to the reactor placed inside the oven in figure 2.2 (a) or to the gas
chromatograph in figure 2.6. Nitrogen can either go to the reactor or to the saturator, air can go to
the oven or to the gas chromatograph (GC) and H2/N2 only goes to the reactor. When the gases are
directed to the reactor they enter through the inlet chamber in figure 2.4 that enables a better mixture of
the reactants.
10

Figure 2.1: Schematic of the experimental apparatus. Blue represents nitrogen flow; Black representsair flow; Red represents ethanol flow; Brown represents products flow; Green represents hydrogen flowthat exits by the same place as air.
(a) (b)
Figure 2.2: Photographs of (a) Oven (no 5 in figure 2.1) and (b) Control box (no 1 in figure 2.1)
Figure 2.3: Schematic of the quartz tube used as reactor bed with the position of the monolith repre-sented in red (no 6 in figure 2.1)
11
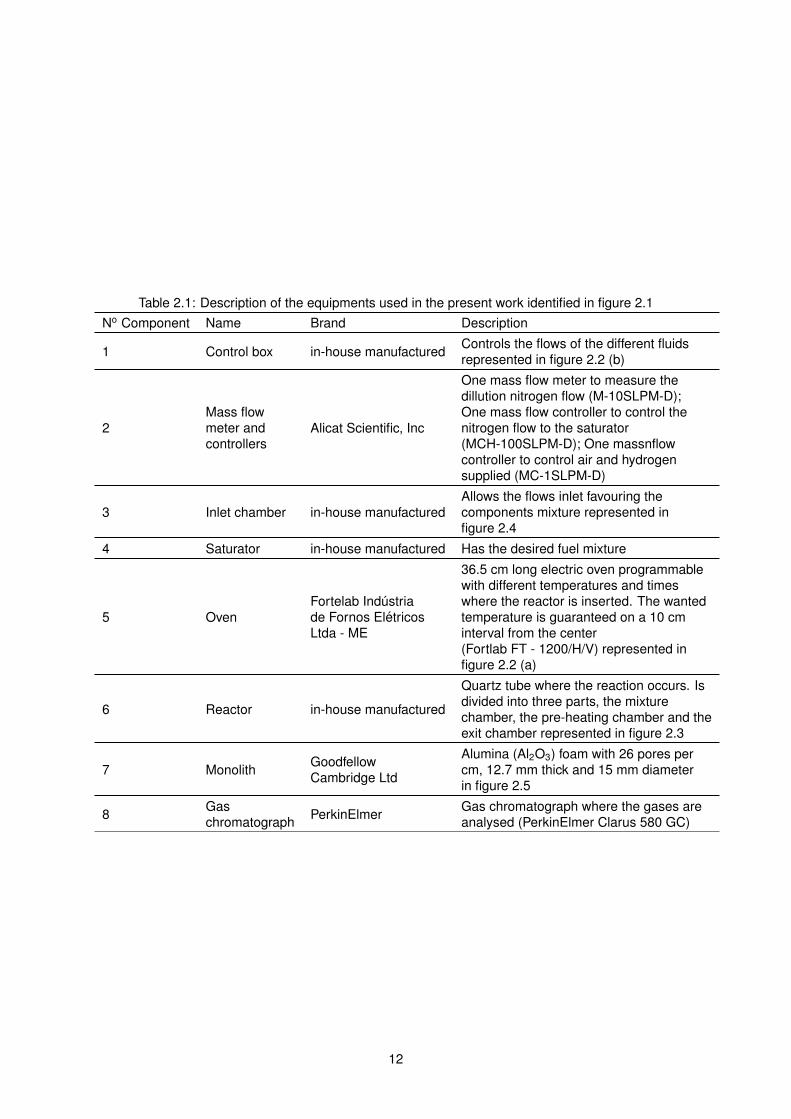
Table 2.1: Description of the equipments used in the present work identified in figure 2.1No Component Name Brand Description
1 Control box in-house manufactured Controls the flows of the different fluidsrepresented in figure 2.2 (b)
2Mass flowmeter andcontrollers
Alicat Scientific, Inc
One mass flow meter to measure thedillution nitrogen flow (M-10SLPM-D);One mass flow controller to control thenitrogen flow to the saturator(MCH-100SLPM-D); One massnflowcontroller to control air and hydrogensupplied (MC-1SLPM-D)
3 Inlet chamber in-house manufacturedAllows the flows inlet favouring thecomponents mixture represented infigure 2.4
4 Saturator in-house manufactured Has the desired fuel mixture
5 OvenFortelab Industriade Fornos EletricosLtda - ME
36.5 cm long electric oven programmablewith different temperatures and timeswhere the reactor is inserted. The wantedtemperature is guaranteed on a 10 cminterval from the center(Fortlab FT - 1200/H/V) represented infigure 2.2 (a)
6 Reactor in-house manufactured
Quartz tube where the reaction occurs. Isdivided into three parts, the mixturechamber, the pre-heating chamber and theexit chamber represented in figure 2.3
7 Monolith GoodfellowCambridge Ltd
Alumina (Al2O3) foam with 26 pores percm, 12.7 mm thick and 15 mm diameterin figure 2.5
8 Gaschromatograph PerkinElmer Gas chromatograph where the gases are
analysed (PerkinElmer Clarus 580 GC)
12
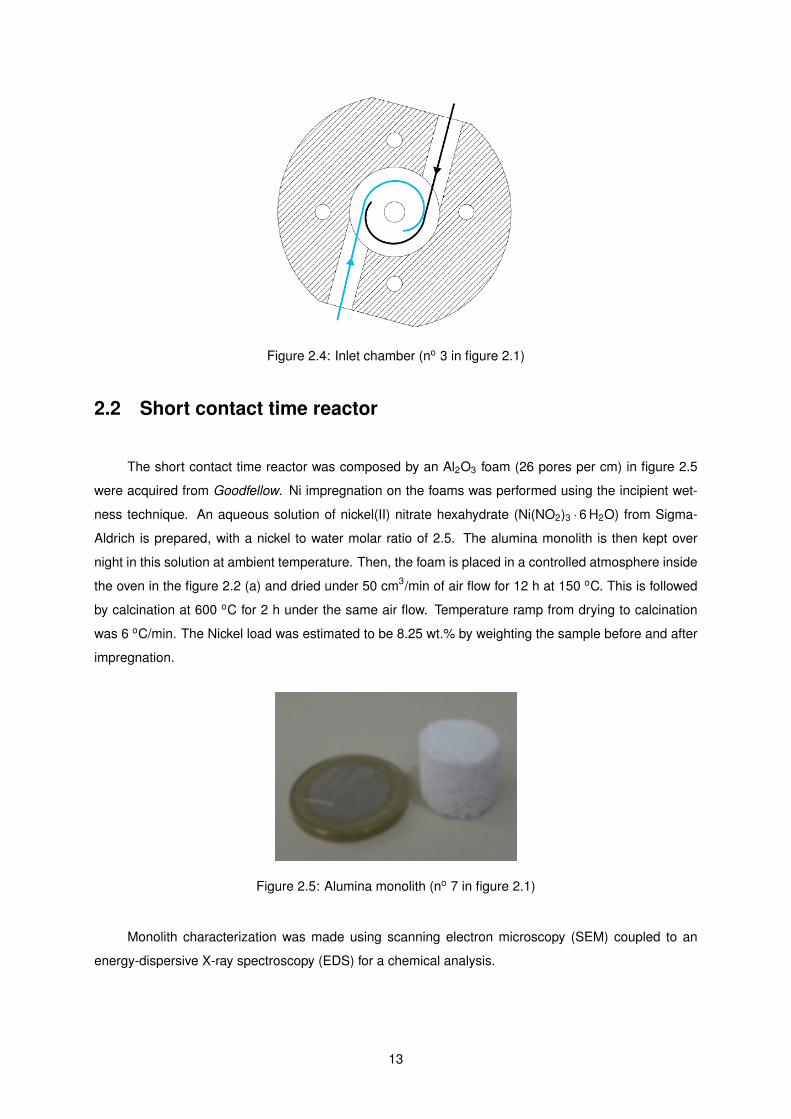
Figure 2.4: Inlet chamber (no 3 in figure 2.1)
2.2 Short contact time reactor
The short contact time reactor was composed by an Al2O3 foam (26 pores per cm) in figure 2.5
were acquired from Goodfellow. Ni impregnation on the foams was performed using the incipient wet-
ness technique. An aqueous solution of nickel(II) nitrate hexahydrate (Ni(NO2)3 ·6 H2O) from Sigma-
Aldrich is prepared, with a nickel to water molar ratio of 2.5. The alumina monolith is then kept over
night in this solution at ambient temperature. Then, the foam is placed in a controlled atmosphere inside
the oven in the figure 2.2 (a) and dried under 50 cm3/min of air flow for 12 h at 150 oC. This is followed
by calcination at 600 oC for 2 h under the same air flow. Temperature ramp from drying to calcination
was 6 oC/min. The Nickel load was estimated to be 8.25 wt.% by weighting the sample before and after
impregnation.
Figure 2.5: Alumina monolith (no 7 in figure 2.1)
Monolith characterization was made using scanning electron microscopy (SEM) coupled to an
energy-dispersive X-ray spectroscopy (EDS) for a chemical analysis.
13
2.3 Gas chromatograph
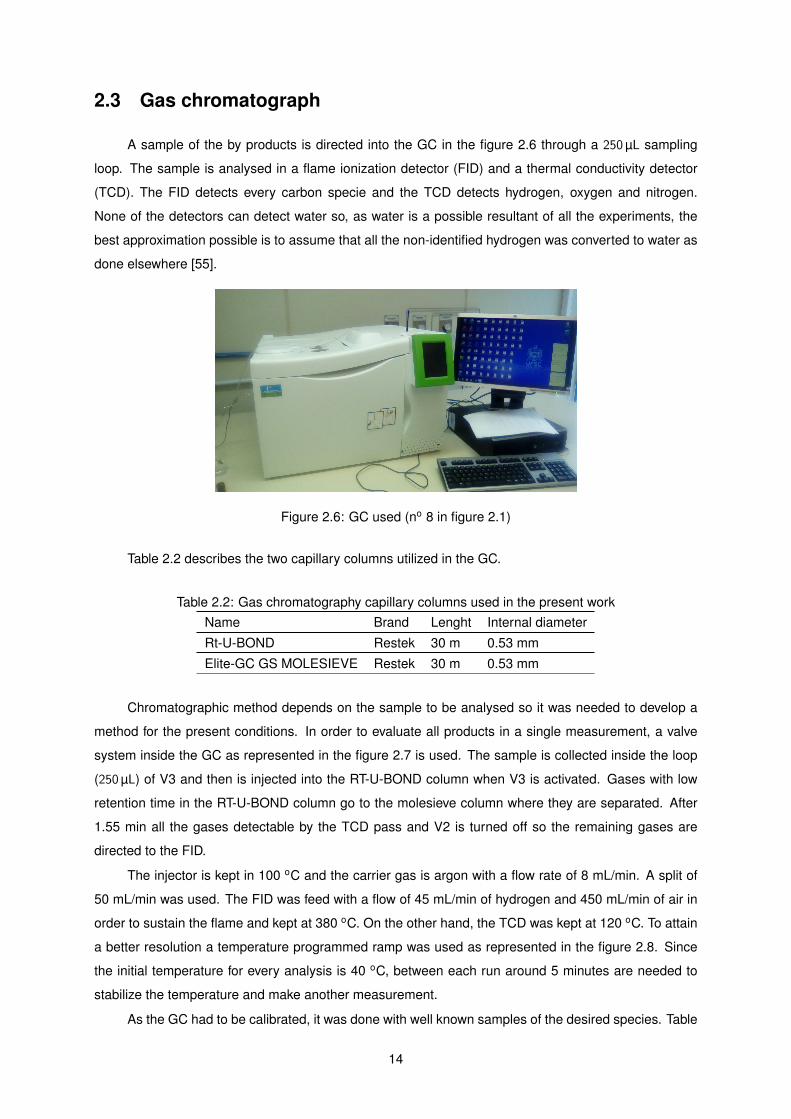
A sample of the by products is directed into the GC in the figure 2.6 through a 250µL sampling
loop. The sample is analysed in a flame ionization detector (FID) and a thermal conductivity detector
(TCD). The FID detects every carbon specie and the TCD detects hydrogen, oxygen and nitrogen.
None of the detectors can detect water so, as water is a possible resultant of all the experiments, the
best approximation possible is to assume that all the non-identified hydrogen was converted to water as
done elsewhere [55].
Figure 2.6: GC used (no 8 in figure 2.1)
Table 2.2 describes the two capillary columns utilized in the GC.
Table 2.2: Gas chromatography capillary columns used in the present workName Brand Lenght Internal diameter
Rt-U-BOND Restek 30 m 0.53 mm
Elite-GC GS MOLESIEVE Restek 30 m 0.53 mm
Chromatographic method depends on the sample to be analysed so it was needed to develop a
method for the present conditions. In order to evaluate all products in a single measurement, a valve
system inside the GC as represented in the figure 2.7 is used. The sample is collected inside the loop
(250µL) of V3 and then is injected into the RT-U-BOND column when V3 is activated. Gases with low
retention time in the RT-U-BOND column go to the molesieve column where they are separated. After
1.55 min all the gases detectable by the TCD pass and V2 is turned off so the remaining gases are
directed to the FID.
The injector is kept in 100 oC and the carrier gas is argon with a flow rate of 8 mL/min. A split of
50 mL/min was used. The FID was feed with a flow of 45 mL/min of hydrogen and 450 mL/min of air in
order to sustain the flame and kept at 380 oC. On the other hand, the TCD was kept at 120 oC. To attain
a better resolution a temperature programmed ramp was used as represented in the figure 2.8. Since
the initial temperature for every analysis is 40 oC, between each run around 5 minutes are needed to
stabilize the temperature and make another measurement.
As the GC had to be calibrated, it was done with well known samples of the desired species. Table
14
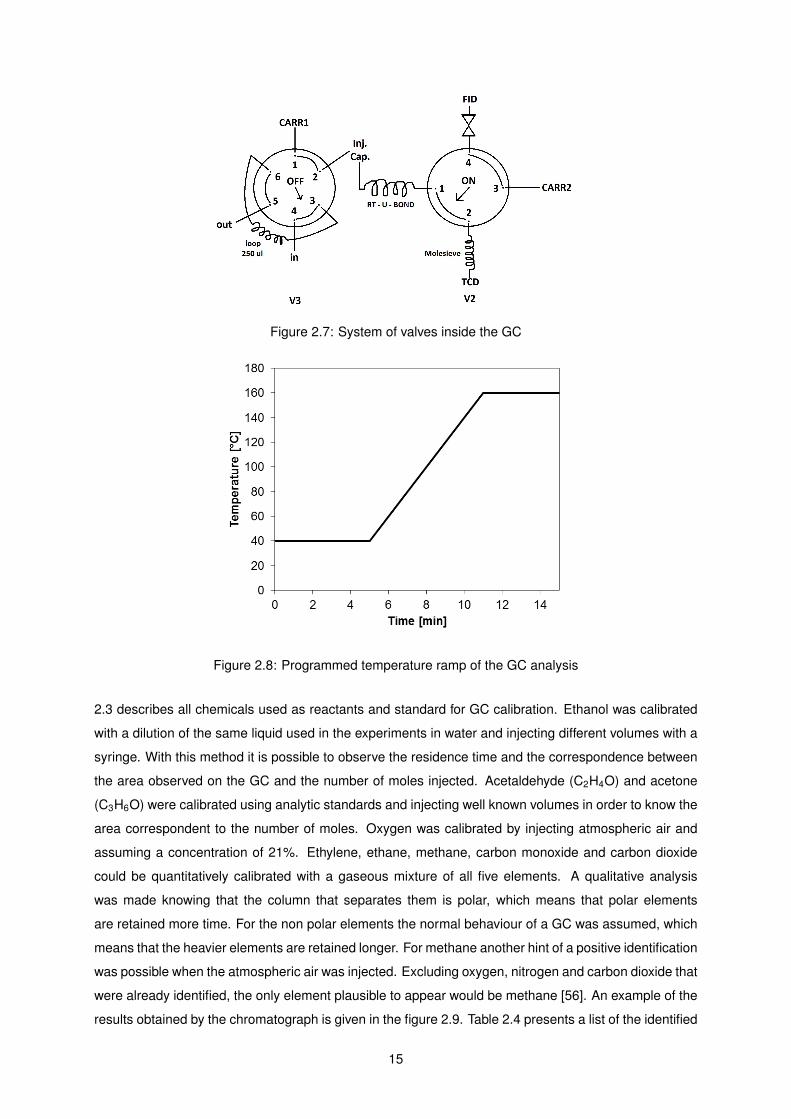
Figure 2.7: System of valves inside the GC
Figure 2.8: Programmed temperature ramp of the GC analysis
2.3 describes all chemicals used as reactants and standard for GC calibration. Ethanol was calibrated
with a dilution of the same liquid used in the experiments in water and injecting different volumes with a
syringe. With this method it is possible to observe the residence time and the correspondence between
the area observed on the GC and the number of moles injected. Acetaldehyde (C2H4O) and acetone
(C3H6O) were calibrated using analytic standards and injecting well known volumes in order to know the
area correspondent to the number of moles. Oxygen was calibrated by injecting atmospheric air and
assuming a concentration of 21%. Ethylene, ethane, methane, carbon monoxide and carbon dioxide
could be quantitatively calibrated with a gaseous mixture of all five elements. A qualitative analysis
was made knowing that the column that separates them is polar, which means that polar elements
are retained more time. For the non polar elements the normal behaviour of a GC was assumed, which
means that the heavier elements are retained longer. For methane another hint of a positive identification
was possible when the atmospheric air was injected. Excluding oxygen, nitrogen and carbon dioxide that
were already identified, the only element plausible to appear would be methane [56]. An example of the
results obtained by the chromatograph is given in the figure 2.9. Table 2.4 presents a list of the identified
15
species with respective retention time.
Table 2.3: Gases and liquids used for GC calibration and to run experimentsComposition State Brand Utilization
Hydrogen 5.03%mol/molNitrogen Q.S Gas Air Liquide Reduction of the catalyst.
Ethane 503µmol/molEthylene 499µmol/molCarbon monoxide 509µmol/molCarbon dioxide 507µmol/molMethane 506µmol/molHydrogen 485µmol/molNitrogen Q.S
Gas Air Liquide Calibration of the GC.
Nitrogen Gas Air Liquide Drag ethanol;Run the experiment.
Sintetic Air 5.0 Gas Air Liquide Air supplied to the FID.
Argon 5.0 Gas Air Liquide Carrier gas of the GC.
Hydrogen ONU 1049 Gas Air Liquide Hydrogen supplied to the FID.
Ethanol (Min. 99.3% wt.) Liquid Quimidrol Run the experiment;Calibration of the GC.
Acetaldehyde 1000µg/ml in water Liquid Calibration of the GC.
Acetone 2000µg/ml in methanoland water (90:10) Liquid Supelco Calibration of the GC.
Table 2.4: Element detected on the GC with the respective retention timeNumber Element Retention time [min] Detector
1 Methane (CH4) 1.631 FID2 Ethylene (C2H4) 1.703 FID3 Carbon dioxide (CO2) 2.281 FID4 Carbon monoxide (CO) 2.462 FID5 Ethane (C2H6) 2.688 FID6 Acetaldehyde (C2H4O) 10.215 FID7 Ethanol (C2H6O) 11.430 FID8 Acetone (C3H6O) 12.414 FID9 Hydrogen (H2) 2.685 TCD10 Oxygen (O2) 3.085 TCD11 Nitrogen (N2) 3.757 TCD
16

(a)
(b)
Figure 2.9: Example of the results obtained by the GC. (a) results from the FID and (b)results from the TCD
2.4 Experimental procedures
All experiments were preformed using the quartz tube described in the Chapter 2, section 2.1. In
order to have repeatability, some procedures were adopted.
After having the impregnated monolith positioned in the right position, the furnace temperature
is increased up to 300 oC where nickel was reduced under a hydrogen flow of 50 cm3/min during 1h
as described elsewhere [57]. This reduction is needed because the oxidation of Ni to NiO reduces the
reforming activity of the catalyst [58]. Following reduction, as the temperature is increased to the desired
value, a N2 flow of 50 cm3/min is maintained to remove all the H2 and avoid any contaminant into the
reactor. In order to keep conditions among different tests as constant as possible, this flow is maintained
for 20 minutes whenever the temperature change takes less time. Then, the N2 flow is changed to the
dilution flow (usually 4 L/min) during 10 minutes to stabilize the catalyst temperature under a flow similar
to the one used in the experiment. The dilution is added to decrease the residence time and also to
reduce the temperature gradients as the heat removal from the reaction zone increased [59]. Fuel is
directed into the reactor inlet as well as air, when it is the case. To stabilize the reaction without much
carbon accumulation, after 3 min of reaction, a 250µL gas sample was sent to the GC with the aid of a
17
sampling loop. Finally, all the flows are switched off until the furnace reaches 500 oC and then it is kept
for 1 h 30 min under an air flow of 100 cm3/min to regenerate the catalytic particle via coke oxidation. All
the increases in temperature are done at a rate of 20 oC/min and the decreases are preformed just by
letting it cool down at ambient temperature. Performance of the saturator strongly depends on the room
conditions, changing the saturation point with temperature, thirty minutes before every experiment the
nitrogen flow is turned on in order to stabilize the saturator and to measure the amount of fuel exiting it.
2.5 Procedures validation
To validate the setup several tests were made to analyse the monolith and the catalyst in order to
know its behavior. Nickel catalysts are well known to have carbon accumulation [14] which leads to loss
of catalytic activity. As the results have to be taken always in the same conditions, a test was preformed
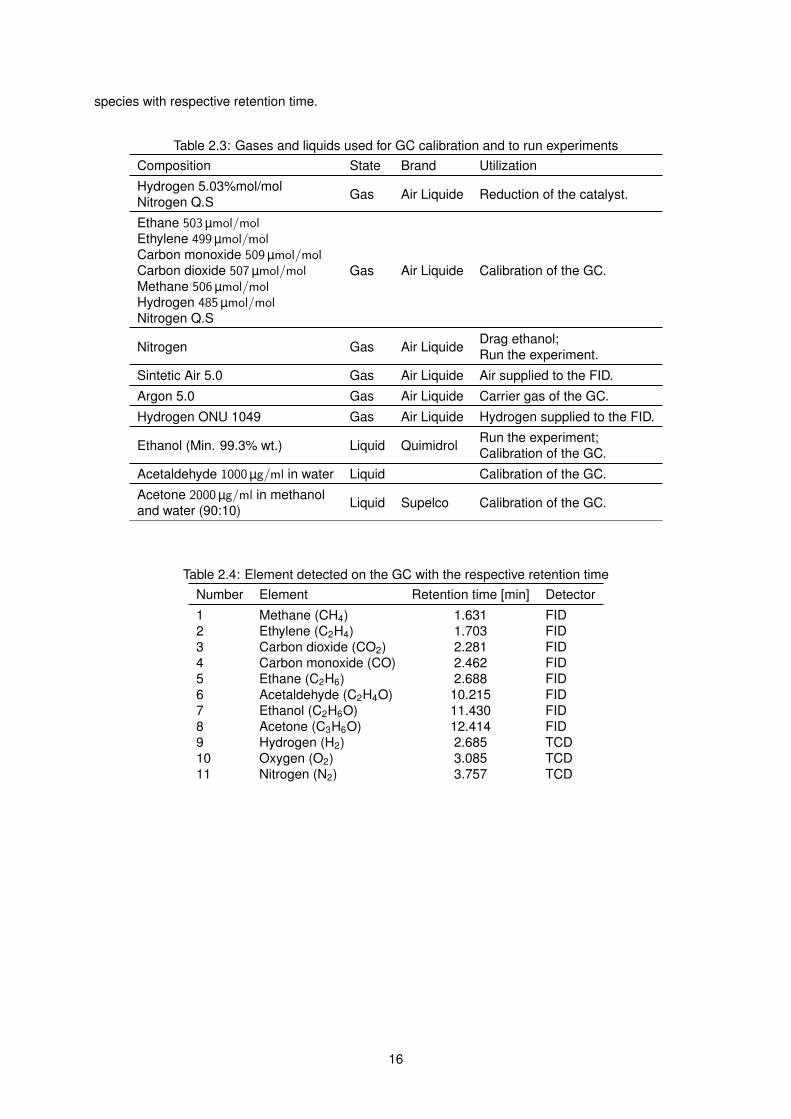
to check if carbon is staying deposited on the monolith. The figure 2.10 shows ethanol conversion and
H2 selectivity in function of the time under continuous stream of ethanol, oxygen and nitrogen.
Figure 2.10: Ethanol conversion (Xethanol) and hydrogen selectivity (SH2) against time on stream.
Ethanol/O2 molar ratio = 2, dilution flow rate: 4 L/min, T= 600 oC, residence time = 22 ms
It can be seen a decrease in H2 selectivity during these 2.5 hours which is a clear sign of deactiva-
tion. Just by looking at the foam after it is removed from the reactor in the figure 2.11 b), it is plausible to
assume carbon accumulation since it turned in black colour, as opposed to the grey colour it had before
the reaction in the figure 2.11 a). In order to confirm that the change is indeed due to deposited carbon
a SEM coupled to an EDS was again used and, in the figure 2.12 b), it can be seen carbon deposition
as well as carbon filaments. This is completely different from the figure 2.12 (a) where it is visible the
nickel impregnated in the alumina. The chemical analysis also revealed almost no nickel which could be
under the carbon deposits. This foam also became fragile which is consistent with the observed in the
literature [54].
18
(a) (b)
Figure 2.11: Photographs of the foam (a) before being on stream and (b) after being onstream for 2.5 h
(a) (b)
Figure 2.12: SEM images of (a) the Ni impregnated foam and (b) the foam after being onstream for 2.5 h both with an amplification of 100x
In the figure 2.13 a) it is possible to observe the alumina grains and when we change to the
impregnated foam in the figure 2.13 b) the distinction of the grains almost disappears since the monolith
is covered with small nickel particles. This test was also done inside the foam proving a homogeneous
impregnation.
As deactivation is observed, a method to regenerate the catalytic foam is needed to allow the
use of the same foam several times. In table 2.5 it is possible to see the effect of the regeneration
procedure as described in the previous section of this thesis on ethanol conversion and H2 selectivity. It
is possible to see both hydrogen selectivity and ethanol conversion remaining approximately constant.
In the same table it is also possible to see the standard deviations of the results that can be explained
by the experimental errors.
Figure 2.14 (a) shows the SEM of a regenerated foam where it is possible to see similarities
with figure 2.12 (a). The EDS analysis in figure 2.14 (b) confirms that on point 1 of the figure 2.14
(a) regeneration was successful with only residual carbon present. It is also possible to that Ni is still
19
(a) (b)
Figure 2.13: SEM images of (a) alumina foam and (b) alumina foam covered with Ni parti-cles (8.25% wt)
present.
Table 2.5: Mean and standard deviation for ethanol conversion and H selectivity. Ethanol/O2 molar ratio= 2, dilution flow rate: 4 L/min, T= 500 oC
Test Conversion [%] H2 Selectivity [%]
1 59.0 0.72 36.8 0.93 41.5 0.74 53.1 0.85 35.4 2.76 44.4 1.07 35.9 1.28 39.0 1.09 37.8 2.3
Mean 42.5 1.3SD 8.3 0.7
(a) (b)
Figure 2.14: (a) a SEM images of a regenerated foam with an amplification of 100x and (b)the EDS analysis of the regenerated foam in the region marked with 1 in panel (a)
Since gas phase reaction can occur in high temperatures and the support material (Al2O3) can
be active in the reaction, it is crucial to check the influence of both effects on ethanol conversion and
20
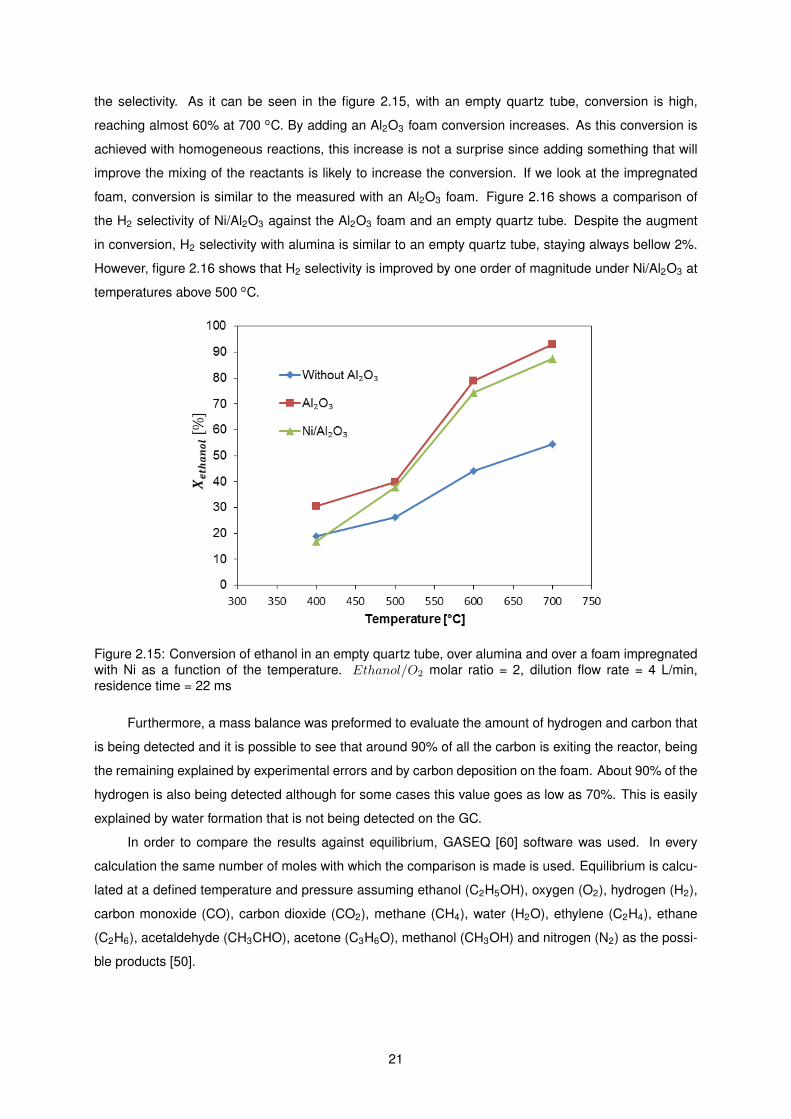
the selectivity. As it can be seen in the figure 2.15, with an empty quartz tube, conversion is high,
reaching almost 60% at 700 oC. By adding an Al2O3 foam conversion increases. As this conversion is
achieved with homogeneous reactions, this increase is not a surprise since adding something that will
improve the mixing of the reactants is likely to increase the conversion. If we look at the impregnated
foam, conversion is similar to the measured with an Al2O3 foam. Figure 2.16 shows a comparison of
the H2 selectivity of Ni/Al2O3 against the Al2O3 foam and an empty quartz tube. Despite the augment
in conversion, H2 selectivity with alumina is similar to an empty quartz tube, staying always bellow 2%.
However, figure 2.16 shows that H2 selectivity is improved by one order of magnitude under Ni/Al2O3 at
temperatures above 500 oC.
Figure 2.15: Conversion of ethanol in an empty quartz tube, over alumina and over a foam impregnatedwith Ni as a function of the temperature. Ethanol/O2 molar ratio = 2, dilution flow rate = 4 L/min,residence time = 22 ms
Furthermore, a mass balance was preformed to evaluate the amount of hydrogen and carbon that
is being detected and it is possible to see that around 90% of all the carbon is exiting the reactor, being
the remaining explained by experimental errors and by carbon deposition on the foam. About 90% of the
hydrogen is also being detected although for some cases this value goes as low as 70%. This is easily
explained by water formation that is not being detected on the GC.
In order to compare the results against equilibrium, GASEQ [60] software was used. In every
calculation the same number of moles with which the comparison is made is used. Equilibrium is calcu-
lated at a defined temperature and pressure assuming ethanol (C2H5OH), oxygen (O2), hydrogen (H2),
carbon monoxide (CO), carbon dioxide (CO2), methane (CH4), water (H2O), ethylene (C2H4), ethane
(C2H6), acetaldehyde (CH3CHO), acetone (C3H6O), methanol (CH3OH) and nitrogen (N2) as the possi-
ble products [50].
21
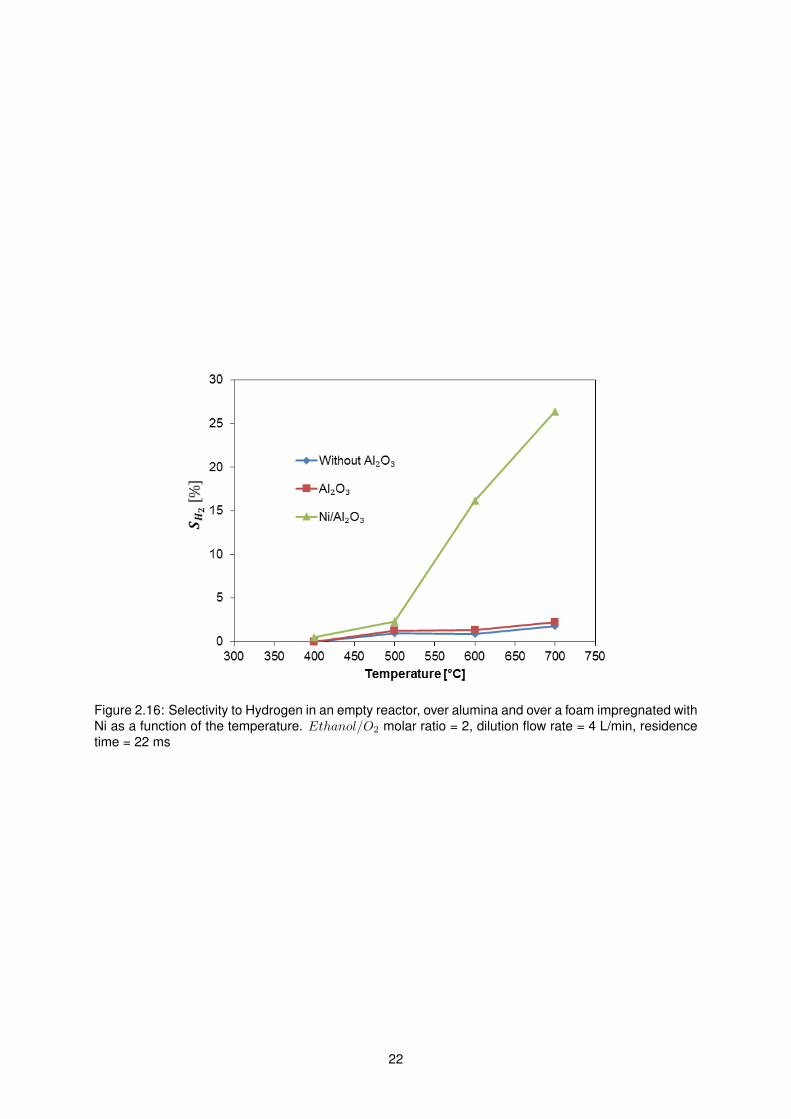
Figure 2.16: Selectivity to Hydrogen in an empty reactor, over alumina and over a foam impregnated withNi as a function of the temperature. Ethanol/O2 molar ratio = 2, dilution flow rate = 4 L/min, residencetime = 22 ms
22
Chapter 3
Results and discussion
This chapter is divided in three main sections namely, steam reforming, partial oxidation and autother-
mal reforming. Since partial oxidation is more attractive for on-board applications from a theoretical point
of view, it is the one studied in more detail but the other results are also of importance in order to know
the behavior of the catalyst and its operation conditions.
3.1 Steam reforming
Figure 3.1 shows the H-based selectivity for SR as a function of the temperature of the furnace.
Based on the definition used here (Eq. 1.5), the sum of all H-based selectivities should be 200% max-
imum but due water not being measured and experimental errors, this sum varies. For temperatures
above 750 oC the results suggest that water is being completely converted. Figure 3.2 shows the C-
based selectivity as a function of the temperature of the furnace. All selectivities towards carbon should
sum 100% maximum since the only carbon source is ethanol. However, it varies due to deposited carbon
and experimental errors. Even with this variations it is possible to observe an higher carbon deposition
at lower temperatures which is consistent with the literature [49].
In the figures 3.1 and 3.2 it can be distinguished two regimes, one for low temperature, below
∼500 oC and the other for high temperature above that value. Figures 3.3 and 3.4 show the H-based
and C-based selectivity, respectively, of the main species in the products of the SR of ethanol over Al2O3
as a function of temperature. In these two figures it is possible to see that alumina promotes less ethanol
conversion than SR and the only by-product is acetaldehyde from ethanol dehydrogenation,
C2H5OH→ C2H4O + H2 (∆Ho298 = 182 kJ/mol). (3.1)
Comparing the two regimes observed for the Ni/Al2O3 foam with the results over a non impregnated
alumina foam it is clear that the lower temperatures regime is the alumina acting alone as the pattern is
almost the same.
At the lower temperatures where only alumina is active, dehydrogenation of ethanol to acetalde-
hyde is the most probable reaction following the equation 3.1. This is often described in the literature as
23

Figure 3.1: H-based selectivity of the main species in the products of the SR of ethanol over Ni/Al2O3 asa function of the temperature. H2O/ethanol molar ratio = 3, dilution flow rate = 4 L/min, residence time= 22 ms
Figure 3.2: C-based selectivity of the main species in the products of the SR of ethanol over Ni/Al2O3 asa function of the temperature. H2O/ethanol molar ratio = 3, dilution flow rate = 4 L/min, residence time= 22 ms
the primary pathway for ethanol conversion [5, 21, 61].
When higher temperatures are present and the catalytic activity of nickel starts, a more complex
mechanism appears to occur. Ethanol decomposition as depict in equation 3.2 seems to be the domi-
nant reaction above 725 oC. As ethanol dehydrogenation (reaction 3.1) is still the most important reaction
24

Figure 3.3: H-based selectivity of the main species in the products of the SR of ethanol over Al2O3 as afunction of the temperature. H2O/ethanol molar ratio = 3, dilution flow rate = 4 L/min, residence time =22 ms
Figure 3.4: C-based selectivity of the main species in the products of the SR of ethanol over Al2O3 as afunction of the temperature. H2O/ethanol molar ratio = 3, dilution flow rate = 4 L/min, residence time =22 ms
between 500 and 725 oC, it can be occurring even at higher temperatures followed by acetaldehyde de-
composition presented in equation 3.3 [54, 62]. Either way, both reactions are followed by water gas shift
in reaction 3.4 converting all CO into CO2 and H2. Both selectivity profiles suggest a strong temperature
dependence for these conditions. Higher temperatures would certainly change the selectivities even
25

further as methane conversion is usually preformed at temperatures above 700 oC even at higher resi-
dence times [63]. This option was not explored because for on-board applications a lower temperature
is usually desired.
C2H5OH→ CO + CH4 + H2 (∆Ho298 = 50 kJ/mol) (3.2)
C2H4O→ CO + CH4 (∆Ho298 = −132 kJ/mol) (3.3)
CO + H2O→ CO2 + H2 (∆Ho298 = −41 kJ/mol) (3.4)
3.2 Partial oxidation
Since stoichiometric partial oxidation gives less hydrogen per mol of ethanol than steam reforming,
there are just a few studies concerning this topic [16, 21, 42]. The results presented here try to give an
answer to this gap in our knowledge.
Figure 3.5 shows the H-based selectivity on the right axis and the unconverted oxygen on the
left for a POX reaction. The results obtained suggest a minimum selectivity towards ethanol of ∼15%
for temperatures above 575 oC, which means a conversion of ∼85%. Although it is not for the same
catalyst, it has been reported in the literature similar conversions at 700 oC [13]. Wanat et al. [64] used
a Rh-Ce/Al2O3 foam and reached a conversion of 90% running the reaction autothermally. Even though
a high conversion is wanted, the products into which ethanol is converted have greater importance,
specially the ones with hydrogen since it is the desired product. As it can be seen in the figure 3.5,
the same distinction as in steam reforming can be noticed. Until 500 oC the only relevant product is
acetaldehyde, indicating that reaction 3.1 is also predominant.
Above 500 oC catalytic ignition occurs followed by a fast increase in methane and hydrogen selec-
tivity. Under these conditions, ethylene is also produced via ethanol dehydration,
C2H5OH→ C2H4 + H2O (∆Ho298 = 46 kJ/mol). (3.5)
In addition to this and dehydrogenation of ethanol (reaction 3.1), acetaldehyde is also decomposing
according to the reaction 3.3. Due to the oxygen in the feed, two additional reactions appear to take
place. CO combustion and H2 oxidation according to reactions 3.6 and 3.7, respectively.
CO + 0.5O2 → CO2 (∆Ho298 = −283 kJ/mol) (3.6)
H2 + 0.5O2 → H2O (∆Ho298 = −242 kJ/mol) (3.7)
These are two highly exothermic reactions that allow the process to occur under much higher
26

Figure 3.5: H-based selectivity of the main species in the products of the POX of ethanol over Ni/Al2O3as a function of the temperature. Ethanol/O2 molar ratio = 2, dilution flow rate = 4 L/min, residence time= 22 ms
temperatures than those programmed in the furnace. Hebben et al. [42] observed that with a Rh/Al2O3
honeycomb and 80% N2 dilution the temperature at the exit of the catalyst was ∼750 oC with no heat
supplied to the reactor. In figures 3.5 and 3.6 it is possible to see that above 575 oC the temperature
of the furnace has almost no influence on product distribution. Ethanol conversion as well as all the
by-products selectivities are approximately constant.
Figure 3.6: C-based selectivity of the main species in the products of the POX of ethanol over Ni/Al2O3as a function of the temperature. Ethanol/O2 molar ratio = 2, dilution flow rate = 4 L/min, residence time= 22 ms
When the selectivity is calculated by the carbon conservation, the presence of acetaldehyde is
even more visible as∼40% of the carbon entering the reactor stays as acetaldehyde. It is also possible to
27
see that ethylene is always present at temperatures above 525 oC following the reaction 3.5 in agreement
with the reported by Rodrigues and Schmal [21], reaching a selectivity towards carbon of ∼9%. This is
not a desired route since ethylene is known as a coke precursor [38] and should be avoided.
Acetone and carbon monoxide were also measured but their selectivities were low. Acetone was
formed above 475oC but its selectivity never reached 1%. Carbon monoxide that was expected to be
one of the main products only appeared at temperatures above 675 oC and got its maximum of 2%
selectivity at 800 oC. As it was already explained in the Chapter 2, the values below 100% in the figure
3.5 are probably due to water that is not detected. Having this in consideration, it is possible to observe
a maximum formation of water at around 500oC and almost none at the higher temperatures. For the
figure 3.6 the values below 100% are a sign of carbon deposition that, as it was already stated. With
these two figures for POX selectivities it is also possible to observe the stability of the experiment as all
the values above 600 oC appear to be stable around the expected 100%.
3.2.1 Effect of the ethanol to oxygen ratio
In figure 3.7 it is possible to observe the effect of the ethanol/oxygen ratio in the H2 selectivity for the
POX of the ethanol over Ni/Al2O3 as a function of the temperature for both experimental and equilibrium
conditions. The equilibrium conditions were calculated with the aid of the GASEQ [60] at a defined
temperature and at a constant pressure of 1 atm. In both cases, i.e. experiments and calculations, the
highest selectivity of hydrogen occurs under POX stoichiometric conditions. Conversely, Hebben et al.
[42] concluded that the H2 selectivity is enhanced for an ethanol/O2 ratio of 0.67. In some cases it even
has the lowest selectivity observed [13]. This result might be a consequence of the furnace being heated
only up to 250 oC and turned off after the occurrence of the reaction light-off, and also of the usage of a
Rh/Al2O3 catalyst.
Figure 3.8 shows the effect of the ethanol/oxygen ratio on ethanol conversion. As equilibrium
conditions always have a conversion of 100% it is not presented here. This figure also indicates a small
improvement in conversion for the stoichiometric ratio, specially at 800 oC.
28

Figure 3.7: Effect of the ethanol/oxygen ratio in the H2 selectivity for the POX of ethanol over Ni/Al2O3as a function of the temperature. Symbols: experiments; dashed line: equilibrium conditions calculatedwith GASEQ. Dilution flow rate = 4 L/min, residence time = 22 ms.
Figure 3.8: Effect of the ethanol/oxygen ratio in the ethanol conversion for the POX of ethanol overNi/Al2O3 as a function of the temperature. Dilution flow rate = 4 L/min, residence time = 22 ms
3.2.2 Effect of the residence time
The effect of residence time on the selectivity towards H2 was investigated. This attempt was made by
adding another impregnated foam to the reactor, increasing the residence time. Although two foams still
give a small residence time of 45 ms a difference should be noticeable as in other cases of the literature
[13]. Figures 3.9 and 3.10 show the the comparison of ethanol conversion and H2 selectivity for the two
residence times, respectively. Neither conversion nor selectivity had any significant change. This result
29

can be explained by the lack of resolution due to the dilution and errors associated with the results that
can attenuate any small difference that could exist.
Figure 3.9: Effect of the residence time in the ethanol conversion for the POX of ethanol over Ni/Al2O3as a function of the temperature. Ethanol/O2 molar ratio = 2, dilution flow rate: 4 L/min
Figure 3.10: Effect of the residence time in the H2 selectivity for the POX of ethanol over Ni/Al2O3 as afunction of the temperature. Ethanol/O2 molar ratio = 2, dilution flow rate: 4 L/min
30
3.3 Autothermal reforming
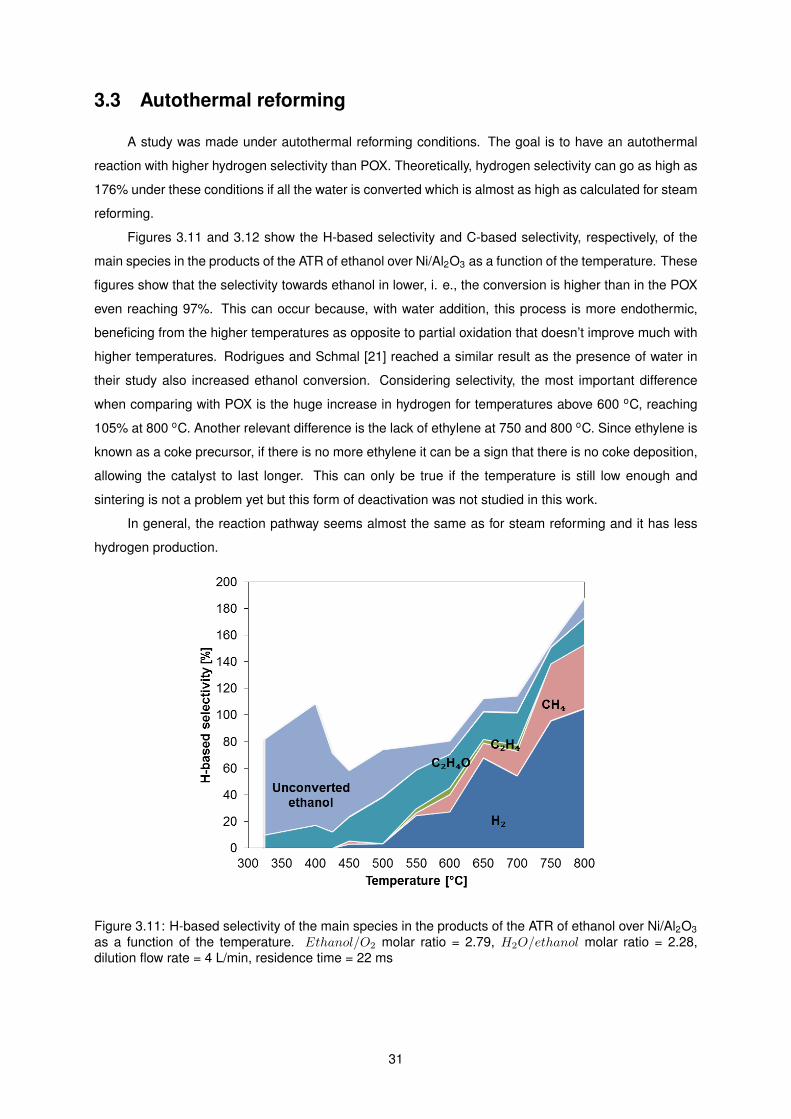
A study was made under autothermal reforming conditions. The goal is to have an autothermal
reaction with higher hydrogen selectivity than POX. Theoretically, hydrogen selectivity can go as high as
176% under these conditions if all the water is converted which is almost as high as calculated for steam
reforming.
Figures 3.11 and 3.12 show the H-based selectivity and C-based selectivity, respectively, of the
main species in the products of the ATR of ethanol over Ni/Al2O3 as a function of the temperature. These
figures show that the selectivity towards ethanol in lower, i. e., the conversion is higher than in the POX
even reaching 97%. This can occur because, with water addition, this process is more endothermic,
beneficing from the higher temperatures as opposite to partial oxidation that doesn’t improve much with
higher temperatures. Rodrigues and Schmal [21] reached a similar result as the presence of water in
their study also increased ethanol conversion. Considering selectivity, the most important difference
when comparing with POX is the huge increase in hydrogen for temperatures above 600 oC, reaching
105% at 800 oC. Another relevant difference is the lack of ethylene at 750 and 800 oC. Since ethylene is
known as a coke precursor, if there is no more ethylene it can be a sign that there is no coke deposition,
allowing the catalyst to last longer. This can only be true if the temperature is still low enough and
sintering is not a problem yet but this form of deactivation was not studied in this work.
In general, the reaction pathway seems almost the same as for steam reforming and it has less
hydrogen production.
Figure 3.11: H-based selectivity of the main species in the products of the ATR of ethanol over Ni/Al2O3as a function of the temperature. Ethanol/O2 molar ratio = 2.79, H2O/ethanol molar ratio = 2.28,dilution flow rate = 4 L/min, residence time = 22 ms
31

Figure 3.12: C-based selectivity of the main species in the products of the ATR of ethanol over Ni/Al2O3as a function of the temperature. Ethanol/O2 molar ratio = 2.79, H2O/ethanol molar ratio = 2.28,dilution flow rate = 4 L/min, residence time = 22 ms
3.4 Global results
Figure 3.13 shows a comparison between H2 selectivities obtained for the three reactions and its
respective equilibriums over Ni/Al2O3 as a function of the temperature. Being the most important feature
of this work, hydrogen selectivity deserves to be addressed on his own.
None of the three processes ever reaches equilibrium but the SR and ATR processes come fairly
close. Until ∼600 oC the three reactions have the same H2 selectivity. When the temperature is further
increased, the SR and ATR processes still have a similar behaviour, but about 725 oC water is completely
consumed, giving the SR of ethanol the best H2 selectivity. It is possible to see that if there is no
limitation to the heat supplied, SR is the best option when the only variable is hydrogen selectivity, at
high temperatures.
32
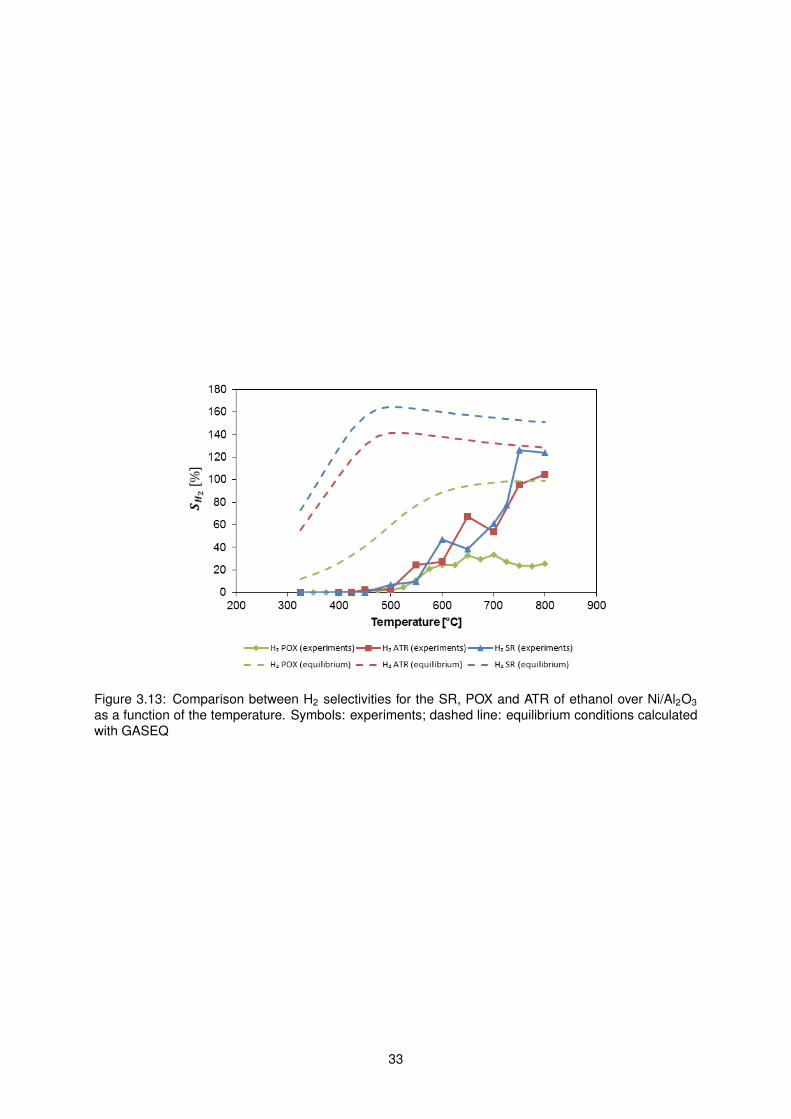
Figure 3.13: Comparison between H2 selectivities for the SR, POX and ATR of ethanol over Ni/Al2O3as a function of the temperature. Symbols: experiments; dashed line: equilibrium conditions calculatedwith GASEQ
33

Chapter 4
Closure
4.1 Conclusions
The main conclusions from this work are as follows:
• It was possible to observe that the main products under these conditions, for the three reactions,
acetaldehyde, methane, hydrogen and carbon dioxide. For partial oxidation ethylene is also an
important product;
• Steam reforming is the reaction with the best hydrogen selectivity reaching values close to equilib-
rium at high temperatures;
• For temperatures above 575 oC and under the conditions operated in this work, partial oxidation
stays approximately constant;
• With the autothermal reaction tested the result is very similar to the one obtained with steam
reforming conditions;
• For on-board applications, which is the main goal of this work, it is still hard to decide on which
condition would be the best. The optimum operation temperature of the Ni/Al2O3 monolith studied
here is higher than the one typically obtained at the exhaust of a car so energy supply would be
needed. Even a small hydrogen quantity is able to improve the combustion inside the engine so, if
the hydrogen yield obtained from POX is enough for improvements in the engine performance, this
would be the best choice. It would need to be ignited, but would run without the need of external
energy supply or water, which would simplify its implementation and would make the process much
more efficient.
34
4.2 Future work
Several questions remained unanswered and some experimental parameters can still be improved.
• The first improvement in the experimental setud would be to change the saturator for syringe
pumps as it would give much more freedom on the experimental conditions and would be even
more reliable without the need to test the conditions before every experiment.
• Measure the temperature inside the reactor would be important to prove the assumptions made
for partial oxidation.
• Improve the catalytic activity of nickel with washcoating or changing the support material to ceria,
for example, could give higher hydrogen yield.
• Test new catalyst materials, e.g. Pt, Pd and Rh that would become active at lower temperatures
and break the acetaldehyde would also be important.
• In order to fasten the development process, it would be good to utilize this results as a basis
to develop a theoretical mechanism that would enable faster tests without the need to such an
extensive experimental work.
• Finally, in order to really develop this technology enough to commercialize it for on-board applica-
tions, tests with real conditions would have to be done. This would imply the use of the real exhaust
temperatures, the real exhaust velocities and the same composition of gases that would exit the
engine. With this conditions different reactants injected to the stream could be tested. Different
materials and even the length of the catalyst could be changed.
35
References
[1] International Energy Agency. Energy and Climate Change. 2015.
[2] Commission of the European communities. Commission staff working document - Accompanying
document to the Communication from the Commission to the Council and the European Parliament
- Results of the review of the Community Strategy to reduce CO2 emissions from passenger cars
and light-commercial vehicles - Impact Assessment COM(2007) 19 final SEC(2007) 61. 2007.
[3] Commission of the European communities. Commission staff working impact assessment Accom-
panying the document Strategy for Reducing Heavy-Duty Vehicles Fuel Consumption and CO2
Emissions. 2014.
[4] A. Haryanto, S. Fernando, N. Murali, and S. Adhikari. Current status of hydrogen production tech-
niques by steam reforming of ethanol: A review. Energy & Fuels, 19(11):2098–2106, 2005.
[5] P. D. Vaidya and A. E. Rodrigues. Insight into steam reforming of ethanol to produce hydrogen for
fuel cells. Chemical Engineering Journal, 117(1):39–49, 2006.
[6] J. D. Holladay, J. Hu, D. L. King, and Y. Wang. An overview of hydrogen production technologies.
Catalysis Today, 139(4):244–260, 2009.
[7] D. K. Liguras, K. Goundani, and X. E. Verykios. Production of hydrogen for fuel cells by catalytic
partial oxidation of ethanol over structured Ru catalysts. International Journal of Hydrogen Energy,
29(4):419–427, 2004.
[8] EIA. URL http://www.eia.gov/beta/international/rankings/.
[9] P. Leung, A. Tsolakis, J. Rodrıguez-Fernandez, and S. Golunski. Raising the fuel heating value and
recovering exhaust heat by on-board oxidative reforming of bioethanol. Energy & Environmental
Science, 3(6):780–788, 2010.
[10] C. Ji and S. Wang. Effect of hydrogen addition on combustion and emissions performance of a
spark ignition gasoline engine at lean conditions. International Journal of Hydrogen Energy, 34
(18):7823–7834, 2009.
[11] Z. Al-Hamamre and M. A. Hararah. Hydrogen production by thermal partial oxidation of ethanol:
Thermodynamics and kinetics study. International Journal of Hydrogen Energy, 35(11):5367–5377,
2010.
36

[12] K. Loganathan and C. A. Leclerc. Partial oxidation of ethanol over platinum and platinum-tin cata-
lysts at millisecond contact times for hydrogen production. Fuel, 96:434–439, 2012.
[13] J. R. Salge, G. A. Deluga, and L. D. Schmidt. Catalytic partial oxidation of ethanol over noble metal
catalysts. Journal of Catalysis, 235(1):69–78, 2005.
[14] D. K. Liguras, K. Goundani, and X. E. Verykios. Production of hydrogen for fuel cells by catalytic
partial oxidation of ethanol over structured Ni catalysts. Journal of Power Sources, 130(1-2):30–37,
2004.
[15] P. Coelho and M. Costa. Combustao. Edicoes Orion, 1st edition, 2007.
[16] D. Livio, C. Diehm, A. Donazzi, A. Beretta, and O. Deutschmann. Catalytic partial oxidation of
ethanol over Rh/Al2O3: Spatially resolved temperature and concentration profiles. Applied Cataly-
sis A: General, 467:530–541, 2013.
[17] Y. Jamal, T. Wagner, and M. L. Wyszynski. Exhaust gas reforming of gasoline at moderate temper-
atures. International Journal of Hydrogen Energy, 21(6):507–519, 1996.
[18] H. S. Fogler. Elements of Chemical Reaction Engineering. Pearson Education, Inc, 4th edition,
2006.
[19] A. Aboudheir, A. Akande, R. Idem, and A. Dalai. Experimental studies and comprehensive reactor
modeling of hydrogen production by the catalytic reforming of crude ethanol in a packed bed tubular
reactor over a Ni/Al 2O 3 catalyst. International Journal of Hydrogen Energy, 31(6):752–761, 2006.
[20] C. Deng, W. Yang, J. Zhou, Z. Liu, Y. Wang, and K. Cen. Catalytic combustion of methane,
methanol, and ethanol in microscale combustors with Pt/ZSM-5 packed beds. Fuel, 150:339–346,
2015.
[21] C. P. Rodrigues and M. Schmal. Nickel-alumina washcoating on monoliths for the partial oxidation
of ethanol to hydrogen production. International Journal of Hydrogen Energy, 36(17):10709–10718,
2011.
[22] PINGXIANG ZHONGTIAN CHEMICAL PACKING CO. LTD. URL http://www.henchchem.com/.
[23] M. Maestri, A. Beretta, G. Groppi, E. Tronconi, and P. Forzatti. Comparison among structured and
packed-bed reactors for the catalytic partial oxidation of CH4 at short contact times. Catalysis
Today, 105(3-4):709–717, 2005.
[24] K. L. Hohn and L. D. Schmidt. Partial oxidation of methane to syngas at high space velocities over
Rh-coated spheres. Applied Catalysis A: General, 211(1):53–68, 2001.
[25] M. C. Sanchez-Sanchez, R. M. Navarro, and J. L. G. Fierro. Ethanol steam reforming over Ni/La-
Al2O3 catalysts: Influence of lanthanum loading. Catalysis Today, 129(3-4):336–345, 2007.
[26] N. R. Peela, A. Mubayi, and D. Kunzru. Steam reforming of ethanol in a microchannel reactor:
kinetic study and reactor simulation. Chemical Engineering Journal, 167(2-3):12881–12894, 2011.
37

[27] A. S. Bodke, S. S. Bharadwaj, and L. D. Schmidt. The effect of ceramic supports on partial oxidation
of hydrocarbons over noble metal coated monoliths. Fuel and Energy Abstracts, 179(4):138–149,
1998.
[28] P. M. Witt and L. D. Schmidt. Effect of flow rate on the partial oxidation of methane and ethane.
Journal of Catalysis, 163(2):465–475, 1996.
[29] J. A. Moulijn, A. E. Van Diepen, and F. Kapteijn. Catalyst deactivation: Is it predictable? What to
do? 212(1-2):3–16, 2001.
[30] M. Ni, D. Y. Leung, and M. K. Leung. A review on reforming bio-ethanol for hydrogen production.
International Journal of Hydrogen Energy, 32(15):3238–2477, 2007.
[31] D. K. Liguras, D. I. Kondarides, and X. E. Verykios. Production of hydrogen for fuel cells by steam
reforming of ethanol over supported noble metal catalysts. Applied Catalysis B: Environmental, 43
(4):345–354, 2003.
[32] S. Duan and S. Senkan. Catalytic conversion of ethanol to hydrogen using combinatorial methods.
Industrial and Engineering Chemistry Research, 44(16):6381–6386, 2005.
[33] S. J. Four challenges for nickel steam-reforming catalysts. Catalysis Today, 111(1-2):103–110,
2006.
[34] D. W. Goodman, R. D. Kelley, T. E. Madey, and J. T. Yates. Kinetics of the hydrogenation of CO over
a single crystal nickel catalist. Journal of Catalysis, 63(1):226–234, 1980.
[35] J. Sehested, S. Dahl, J. Jacobsen, and J. R. Rostrup-Nielsen. Methanation of CO over nickel:
Mechanism and kinetics at high H2/CO ratios. Journal of physical Chemistry B, 109(6):2432–2438,
2005.
[36] J. Sun, X. P. Qiu, and W. T. Zhu. H2 from steam reforming of ethanol at low temperature over
Ni/Y2O3, Ni/La2O3 and Ni/Al2O3 catalysts for fuel-cell application. International Journal of Hydro-
gen Energy, 30(4):437–445, 2005.
[37] J. Liberatori, R. Ribeiro, D. Zanchet, F. Noronha, and J. Bueno. Steam reforming of ethanol on
supported nickel catalysts. Applied Catalysis A: General, 327(2):197–204, 2007.
[38] V. Mas, M. L. Bergamini, G. Baronetti, N. Amadeo, and M. Laborde. A kinetic study of ethanol
steam reforming using a nickel based catalyst. Topics in Catalysis, 51(1-4):39–48, 2008.
[39] J. Comas, F. Marino, M. Laborde, and N. Amadeo. Bio-ethanol steam reforming on Ni/Al2O3 cata-
lyst. Chemical Engineering Journal, 98(1-2):61–68, 2004.
[40] A. Akande, A. Aboudheir, R. Idem, and A. Dalai. Kinetic modelling of hydrogen production by the
catalytic reforming of crude ethanol over a co-precipitated catalyst in a packed bed tubular reactor.
International Journal of Hydrogen Energy, 31(12):1707–1715, 2006.
38

[41] S. M. de Lima, A. M. da Silva, L. O. da Costa, J. M. Assaf, G. Jacobs, B. H. Davis, L. V. Mattos,
and F. B. Noronha. Evaluation of the performance of Ni/La2O3 catalyst prepared from LaNiO3
perovskite-type oxides for the production of hydrogen through steam reforming and oxidative steam
reforming of ethanol. Applied Catalysis A: General, 377(1-2):181–190, 2010.
[42] N. Hebben, C. Diehm, and O. Deutschmann. Catalytic partial oxidation of ethanol on alumina-
supported rhodium catalysts: An experimental study. Applied Catalysis A: General, 388(1-2):225–
231, 2010.
[43] P. M. Torniainen, X. Chu, and Schmidt L. D. Comparison of Monolith-Supported Metals for the
Direct Oxidation of Methane to Syngas. Journal of Catalysis, 10(146):1–10, 1994.
[44] M. Bizzi, L. Basini, G. Saracco, and V. Specchia. Short contact time catalytic partial oxidation of
methane : analysis of transport phenomena effects. Chemical Engineering Journal, 90:97–106,
2002.
[45] S. Specchia, G. Negro, G. Saracco, and V. Specchia. Fuel processor based on syngas production
via short contact time catalytic partial oxidation reactors. Applied Catalysis B: Environmental, 70
(1-4):525–531, 2007.
[46] M. Huff and L. D. Schmidt. Ethylene formation by oxidative dehydrogenation of ethane over mono-
liths at very short contact times. Journal of Physical Chemistry, 97:11815–11822, 1993.
[47] B. Silberova, H. J. Venvik, and A. Holmen. Production of hydrogen by short contact time partial
oxidation and oxidative steam reforming of propane. Catalysis Today, 99(1-2):69–76, 2005.
[48] N. Mitra, P. Umasankar, K. Vasudeva, and S. C. Dhingra. Steam Reforming of Ethanol for Hydrogen
Production: Thermodynamic Analysis. International Journal of Hydrogen Energy, 21(I):13–18,
1996.
[49] E. Garcia and M. Laborde. Hydrogen production by the steam reforming of ethanol: thermodynamic
analysis. International Journal of Hydrogen Energy, 16(5):307–312, 1991.
[50] W. Wang and Y. Wang. Thermodynamic analysis of hydrogen production via partial oxidation of
ethanol. International Journal of Hydrogen Energy, 33(19):5035–5044, 2008.
[51] G. A. Deluga, J. R. Salge, L. D. Schmidt, and X. E. Verykios. Renewable hydrogen from ethanol by
autothermal reforming. Science, 303:993–997, 2004.
[52] P. Bichon, G. Haugom, H. J. Venvik, A. Holmen, and E. A. Blekkan. Steam reforming of ethanol
over supported Co and Ni catalysts. Topics in Catalysis, 49(1-2):38–45, 2008.
[53] S. Freni, S. Cavallaro, N. Mondello, L. Spadaro, and F. Frusteri. Steam reforming of ethanol on
Ni/MgO catalysts: H2 production for MCFC. Journal of Power Sources, 108(1-2):53–57, 2002.
[54] A. N. Fatsikostas and X. E. Verykios. Reaction network of steam reforming of ethanol over Ni-based
catalysts. Journal of Catalysis, 225(2):439–452, 2004.
39
[55] T. Norton and F. Dryer. Experimental and modeling study of ethanol oxidation kinetics in an atmo-
spheric pressure flow reactor. International Journal of Chemical Kinetics, 24(4):319–344, 1992.
[56] D. R. Lide. CRC Handbook of Chemistry and Physics. CRC Press, 84th edition, 2004.
[57] G. Carotenuto, A. Kumar, J. Miller, A. Mukasyan, E. Santacesaria, and E. E. Wolf. Hydrogen produc-
tion by ethanol decomposition and partial oxidation over copper/copper-chromite based catalysts
prepared by combustion synthesis. Catalysis Today, 203:163–175, 2013.
[58] N. Laosiripojana, S. Assabumrungrat, and S. Charojrochkul. Steam reforming of ethanol with co-
fed oxygen and hydrogen over Ni on high surface area ceria support. Applied Catalysis A: General,
327(2):180–188, 2007.
[59] C. Perego. Experimental methods in catalytic kinetics. Catalysis Today, 52(2-3):133–145, 1999.
[60] Chris Morley. URL http://www.gaseq.co.uk/.
[61] N. M. Marinov. A Detailed Chemical Kinetic Model for High Temperature Ethanol Oxidation. Inter-
national Journal of Chemical Kinetics, 31(3):183–220, 1999.
[62] S. Cavallaro, V. Chiodo, S. Freni, N. Mondello, and F. Frusteri. Performance of Rh / Al 2 O 3 catalyst
in the steam reforming of ethanol : H 2 production for MCFC. 249:119–128, 2003.
[63] D. Dissanayake, M. P. Rosynek, K. C. C. Kharas, and J. H. Lunsford. Partial Oxidation of Methane
to Carbon Monoxide and Hydrogen over a Ni/Al203 Catalyst. Journal of Catalysis, 132(1):117–127,
1991.
[64] E. C. Wanat, B. Suman, and L. D. Schmidt. Partial oxidation of alcohols to produce hydrogen and
chemicals in millisecond-contact time reactors. Journal of Catalysis, 235(1):18–27, 2005.
40


![Oxidative Steam Reforming of Bioethanol over …...as a support in the ethanol steam-reforming reactions [17]. Rh, Ru and Abstract Oxidative steam reforming of ethanol for hydrogen](https://img.pdfslide.us/doc/110x75/5e780744e9502758d52e3186/oxidative-steam-reforming-of-bioethanol-over-as-a-support-in-the-ethanol-steam-reforming.jpg)