Embed Size (px)
Citation preview
Hydrogen - Opportunities for Sustainable Mobility
WEC 2001
Don Huberts, CEO Shell HydrogenMay 18th, 2001

Shell Hydrogen’s position in the RD/Shell Group
CUSTOMERS
Operating Companies
Exploration and
Production Oil Products ChemicalsGas
and Power Renewables Hydrogen
Business Organisations
CORPORATE CENTRE
CMD
ProfessIonal
servIces
Global business of the Royal Dutch/Shell Group of companies
Head quarters in Amsterdam and regional bases in Houston, Hamburg and Tokyo
Set up in 1999 to pursue and develop business opportunities related to hydrogen and fuel cells

400
300
200
1001900 2000
CO Concentrations2
Drivers behind the hydrogen economy
Air Quality Local Emissions - HC’s,
NOx, CO, Particulates, SOx, Aromatics
Global Warming Fuel Economy / Energy
Efficiency
Import Dependency Security of supply, use
of local resources, balance of trade, local jobs ...

The transition is uncertain...
Internal Combustion Engine
led to the Oil Age
THE PAST THE FUTURETHE TRANSITION ISUNCERTAIN
Pro
du
ct P
erfo
rma
nce
Time
Coal Oil Gas Hydrogen
1.5 : 1 1 : 2 1 : 4 0: 1
Underlying Decarbonisation
Better satisfy customer needs
The Fuel Cell can lead to the Hydrogen Age
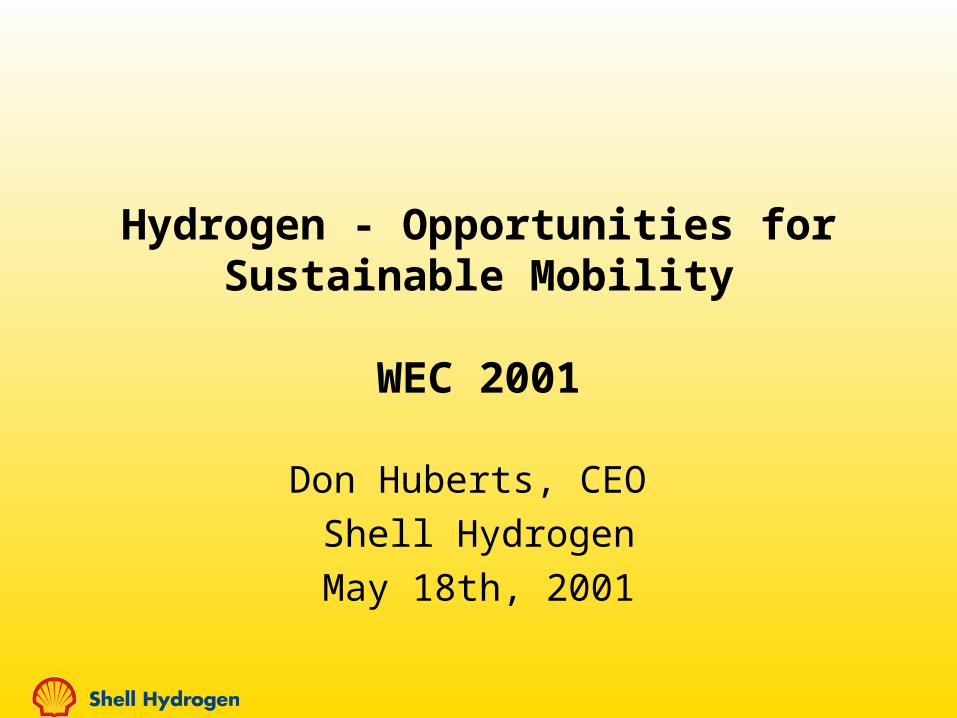
Shell Hydrogen’s interests and activities Transportation
world-wide hydrogen retail infrastructure fuel processors hydrogen storage solutions
Stationary power fuel cell power plants and energy services (e.g. zero emission
power plants) fuel processors hydrogen storage solutions
Hydrogen production from renewable sources
Contribution to development of safety, codes, standards and regulations
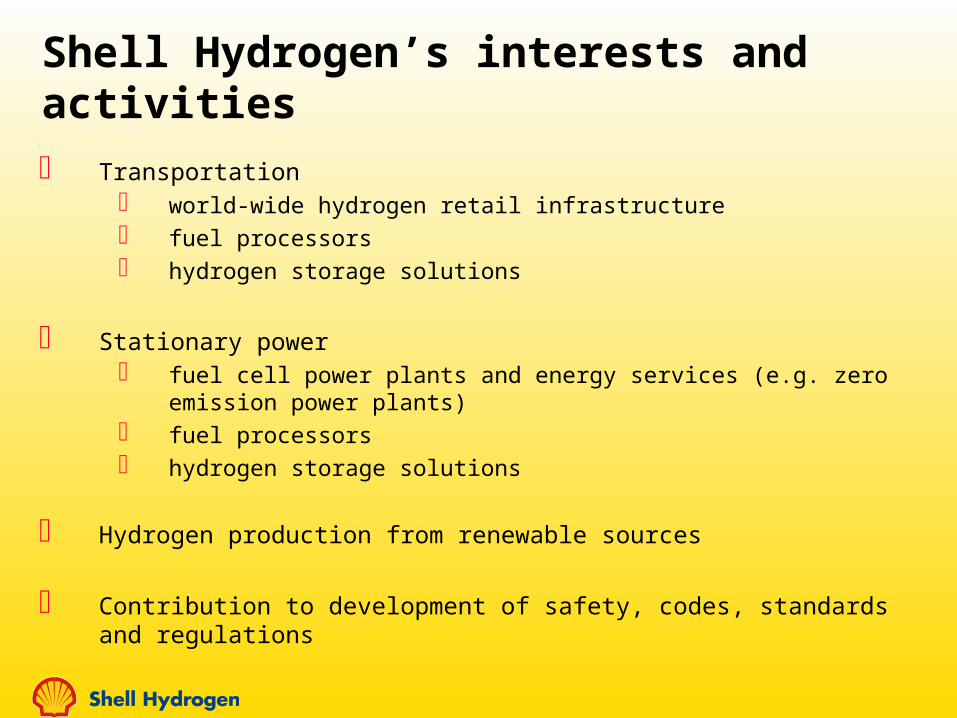
Infrastructure technology staircase
2000 2004 2008 2012 2016 2020
Impactor size
MethanolFuel Cells
Pure HydrogenBuses
Pure HydrogenFuel Cell Cars
Direct Methanol Fuel Cell ?
HydrocarbonFuelled
Fuel Cells
Hybrids
Fleet & nichemarkets
Competitive in passengercar market
MainstreamProduct
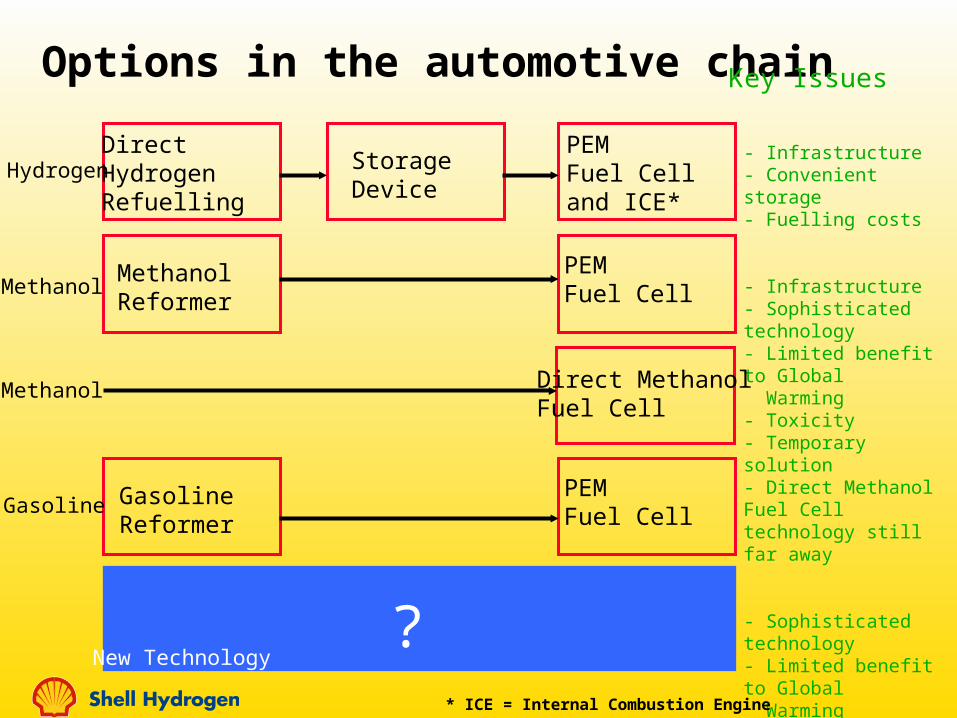
Options in the automotive chain
Hydrogen
Methanol
Gasoline
New Technology?
Direct HydrogenRefuelling
Methanol Reformer
GasolineReformer
StorageDevice
PEMFuel Celland ICE*
PEMFuel Cell
PEMFuel Cell
Key Issues
- Infrastructure- Convenient storage- Fuelling costs
- Infrastructure- Sophisticated technology- Limited benefit to Global Warming- Toxicity- Temporary solution- Direct Methanol Fuel Cell technology still far away
- Sophisticated technology- Limited benefit to Global Warming
- Not available short-term
* ICE = Internal Combustion Engine
Methanol Direct MethanolFuel Cell
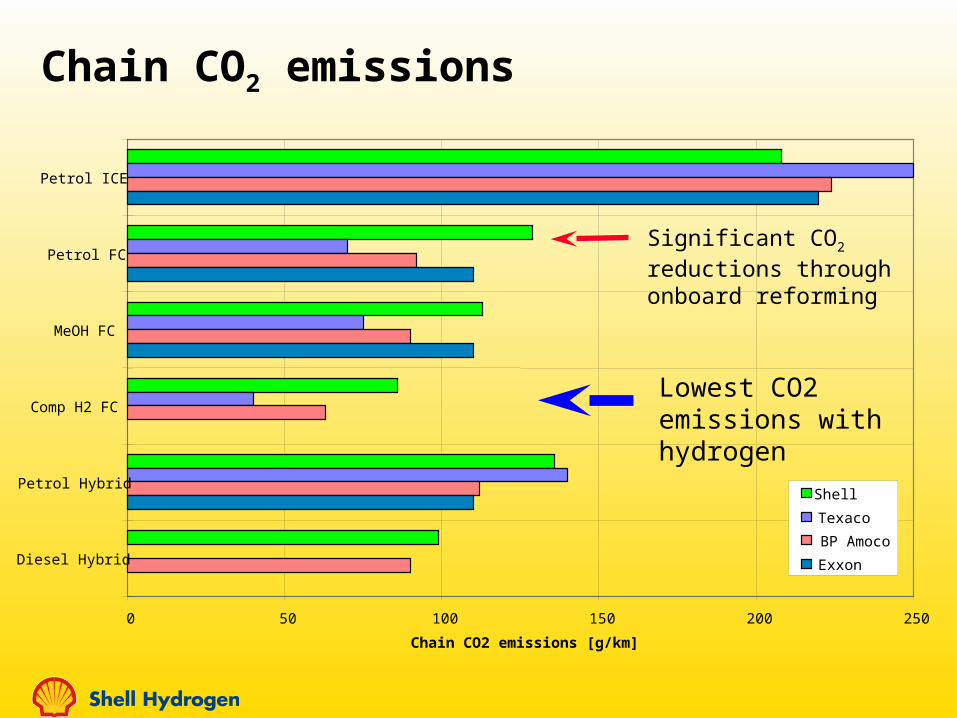
Chain CO2 emissions
0 50 100 150 200 250
Petrol ICE
Petrol FC
MeOH FC
Comp H2 FC
Petrol Hybrid
Diesel Hybrid
Chain CO2 emissions [g/km]
Shell
Texaco
BP Amoco
Exxon
Significant CO2 reductions through onboard reforming
Lowest CO2 emissions with hydrogen

AUTOMOTIVEHyundai SUV
PPT01394011
CA0862Source: IFC

HYUNDAI FUEL CELL VEHICLE
PPT011487012504
Source: IFC

Single refuelling site
Multiple refuelling sites innarrow geographical region
National coverage
Service vehicles (e.g road sweepers, dustcarts etc.)
(local) Delivery vehiclesBuses
No.
of
reta
il st
ati
on
sTim
e(regional) Delivery vehicles
Taxis
Fleets of company vehicles
Cars used mainly for commuting
Pan-national coverage(e.g W. Europe)
Main family car
Fleet Market
Mass Market
Hydrogen fuelAn evolution from fleet markets to a mass market
Increasing economies of scaleIncreasingproportion of renewable hydrogen.

For given throughput cheapest option depends on• Electricity Price• Ex-works cost of centrally produced H2
• Gas (liquid HC) price.• Delivery distance for liquid or gaseous H2.
*assumes 80% load factor and no tax
Indicative delivered hydrogen cost per kgIncreasing capital cost
0.00
2.00
4.00
6.00
8.00
10.00
12.00
14.00
1 10 100 1000 10000 100000Throughput (kg/day)
Hyd
rog
en
Cost
(US
D/k
g)*
Liquid Trucks (c)Gaseous Trucks (c)or Electrolysis (onsite)
OnsitePartial Oxidation
OnsiteSteam Reforming
Pipelines (c)
Retail Gasoline US(1kg H2 ~1 USG)
Retail Gasoline UK
25 cars per day
2500 cars per day
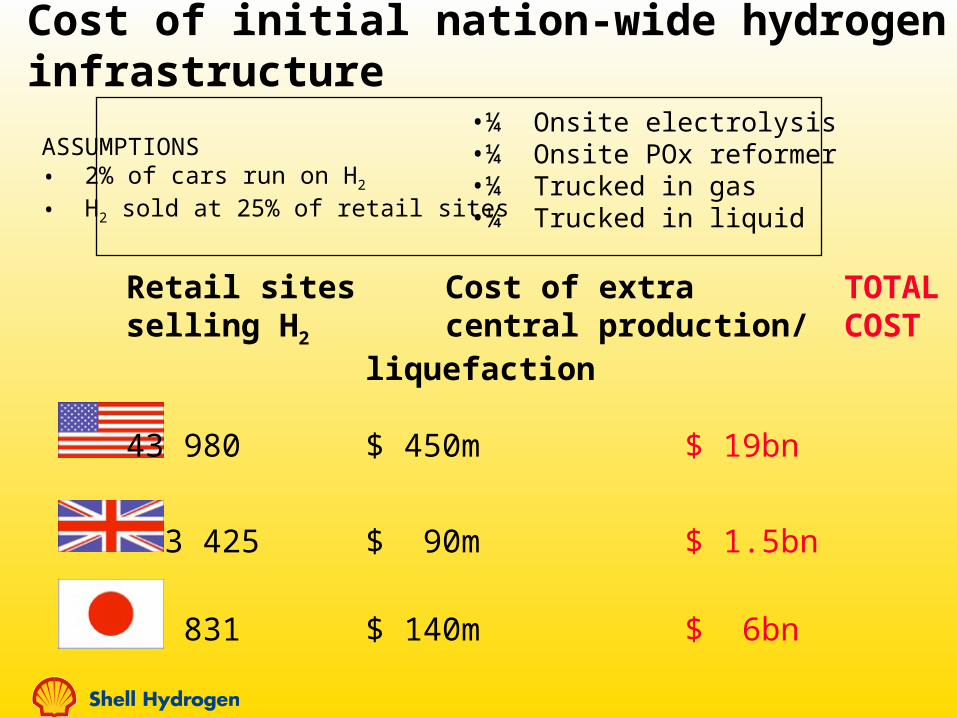
Cost of initial nation-wide hydrogen infrastructure
Retail sites Cost of extra TOTALselling H2 central production/ COST
liquefaction
43 980 $ 450m $ 19bn
3 425 $ 90m $ 1.5bn
13 831 $ 140m $ 6bn
ASSUMPTIONS• 2% of cars run on H2 • H2 sold at 25% of retail sites
•¼ Onsite electrolysis•¼ Onsite POx reformer•¼ Trucked in gas•¼ Trucked in liquid

Shell Hydrogen - positioned for successActivities
Hydrogen Infrastructure- California Fuel Cell Partnership
Hydrogen Refuelling- Iceland Hydrogen Economy- Amsterdam Bus
Hydrogen Generation- in car- stationary power
Hydrogen Storage/Handling
Zero Emission Power
Technology/approach
Multi-fuel demonstrationPublic education
Project approachRenewable hydrogen
Patented reforming technology (CPO)
Metal hydride storageSafety R&D
Solid oxide fuel cell + CO2 recovery
Partners
- government- fuel partners- all major car OEMs- IFC, Ballard
- DaimlerChrysler- Norske Hydro - Vistorka- EU
International Fuel Cells (IFC/UTC)
Hydro Quebec and GfEin-house
Siemens-Westinghouse(SWPC)

Our Vision for Sustainable Mobility
Fleet vehicles on hydrogen - 2005Experience of hydrogen FCVs. Familiarise public with safe hydrogen
refuelling
Transition via onboard hydrocarbon reforming - 2010Familiar fuel. No new infrastructure required. Hazards understood.Significant CO2 reduction. Enables commercialisation of FC vehicles
Mass market hydrogen fuel cell vehicles - 2020Full infrastructure develops by incremental steps. Major CO2 emission benefits
Carbon-free hydrogen fuel cell Vehicles - 2050Increasing proportion of H2 generation from renewables.
Geological CO2 sequestration. Carbon free mobility

-> Back up

Fuel processor
Fuel cell Inverter
fuel cleanhydrogen
DC power AC power
Fuel cell system
balance of the plant
Fuel cells history
Old technology (since 1839), always too expensive; NASA first to recognise its commercial potential (1960’s)
Since 1990, technology revival
Currently FC power not price-competitive with power from central generators
In the automotive area different lifetime requirements, and different cost targets
Most natural fuels:
Stationary: natural gas
Transportation: clean gasoline, hydrogen
Portable: LPG, methanol, hydrogen
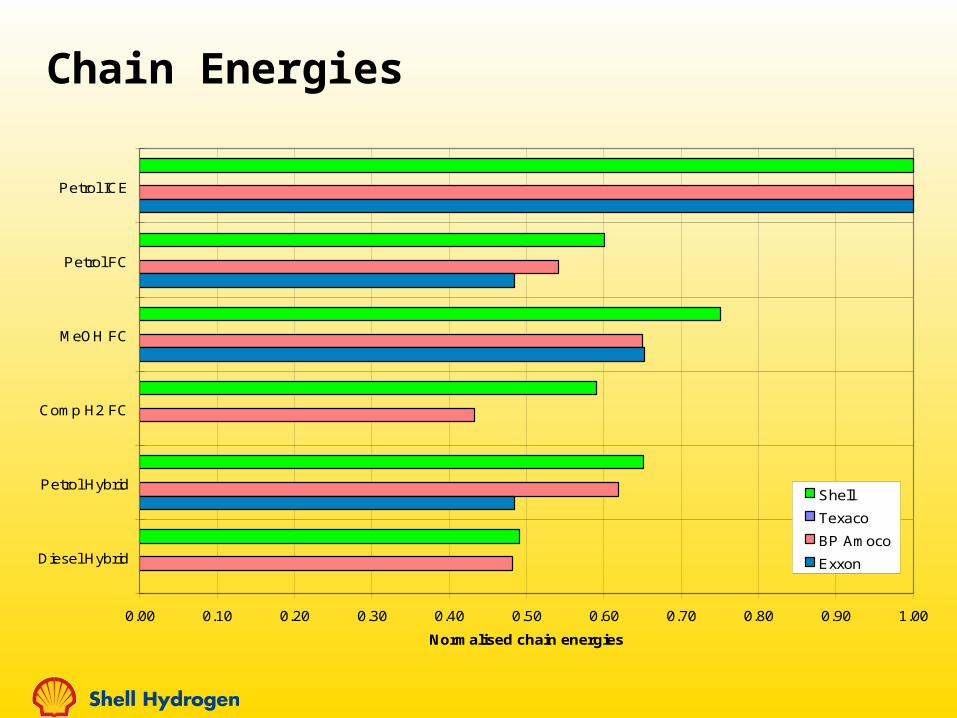
Chain Energies
0.00 0.10 0.20 0.30 0.40 0.50 0.60 0.70 0.80 0.90 1.00
Petrol ICE
Petrol FC
MeOH FC
Comp H2 FC
Petrol Hybrid
Diesel Hybrid
Normalised chain energies
Shell
Texaco
BP Amoco
Exxon
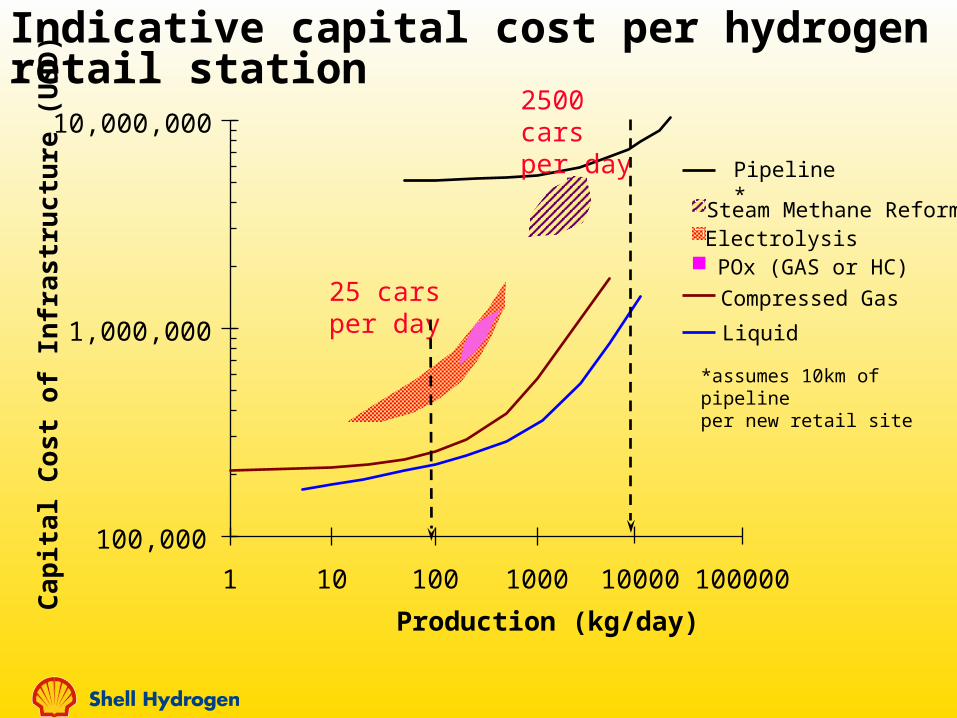
Production (kg/day)
Ca
pit
al C
ost
of
Infr
astr
uc
ture
(U
SD
)Indicative capital cost per hydrogen retail station
Liquid
Pipeline*
ElectrolysisSteam Methane Reformer
Compressed Gas
POx (GAS or HC)25 cars per day
100,000
1,000,000
10,000,000
1 10 100 1000 10000 100000
*assumes 10km of pipeline per new retail site
2500 cars per day

Renewables and Hydrogen will meet in the future
0
5
10
15
20
25
1990 1995 2000 2005 2010 2015 2020
¢/k
Wh
Photovoltaic
Biomass
Wind
Grid
Wholesale Gasoline Price (1999)


![Photoelectrochemical Production of Hydrogen · stainless steel), for solar hydrogen production [Miller & Rocheleau, 2001]. In the illustration of a generic hydrogen photoelectrode](https://img.pdfslide.us/doc/110x75/5ea93ce75a148409cd011fb5/photoelectrochemical-production-of-hydrogen-stainless-steel-for-solar-hydrogen.jpg)