Embed Size (px)
Citation preview

University of Southern Queensland
Faculty of Engineering and Surveying
Hydroelectric Generators for Third World Countries
A Dissertation submitted by
Mr Nicholas Burton-Ree
In fulfilment of the requirements of
Mechanical Engineering
November 2013
Bachelor of Mechanical Engineering

Hydroelectric Generators for Third World Countries 2
Mr Nicholas Burton Ree
Abstract Today‟s society is becoming more pressured to produce renewable energy,as some of
the world‟s resources are becoming scarcer and the population is increasing. The
push to find a new reliable eco-friendly energy source is becoming ever so relevant.
Due to the high demand of electricity, the cost of power is expensive and the ability
to access the resource is difficult for many poorer areas in the world. These third
world areas are in desperate need of power to allow food and medical supplies to be
stored, and as a result, distributed in the needed areas.
Papua New Guinea which is located just north of Australia has some of the toughest
terrain in the world and is rated high in the top 50 third world nations. It is the perfect
location for a hydroelectric system. Micro hydroelectric generators are becoming
more and more common in remote locations. The disadvantage to these systems is
that specifically designed turbines are expensive and time consuming to design for
the location. A solution to this problem is to implement an already designed
centrifugal pump as a turbine. At the small cost of efficiency the use of a pump can
produce a low cost and reliable energy source.
This unconventional solution has the ability to be applied to poorly developing
countries such as Papua New Guinea to help achieve self-sufficient energy
production. As a result, it would also have an impact upon improving the health and
well-being of all of the local inhabitants.

Hydroelectric Generators for Third World Countries 3
Mr Nicholas Burton Ree
Disclaimer Page
University of Southern Queensland
Faculty of Engineering and Surveying
Limitations of Use
The Council of the University of Queensland, its faculty of Engineering and
Surveying, and the staff of the University of Queensland, do not accept any
responsibility for the truth, accuracy or completeness of the material within or
associated with this dissertation.
Persons using this material do at their own risk and not of The Council of the
University of Queensland, its staff of The University of Southern Queensland and the
faculty of Engineering and Surveying.
This dissertation is an educational designed critique only to satisfy the scope of this
exercise and has no validity beyond what is required. This project is to satisfy the
pair courses “Research Project” and is to contribute to the completion to the
educational requirement of the student‟s degree. This Dissertation, the drawings,
mechanical components and any other material are set in the appendices and should
not be used for any other purpose. If so, they do at their own risk.
ENG 8411 & ENG8412 Research Project

Hydroelectric Generators for Third World Countries 4
Mr Nicholas Burton Ree
Candidates Certification
I certify that the ideas, designs and experimental work, results, analysis and
conclusions set out in the dissertation are entirely my own efforts, except where
otherwise indicated and acknowledged.
I further certify that the work is original and has not been previously submitted for
assessment in any other course or institution, except where specifically stated.
Student Name: Nicholas Burton-Ree
Student Number: 0050101614
Signature
Date

Hydroelectric Generators for Third World Countries 5
Mr Nicholas Burton Ree
Acknowledgements
It is with great pleasure to have the opportunity to thank everyone who helped and
supported me throughout the year of working on my project.
I would firstly like to sincerely thank my co-supervisors Les Bowtell and Malcom
Gillies. I would not have been able to complete such work without their guidance,
knowledge and support throughout this project. They were always there when I had a
question or needed help and they were always willing to take the time for me.
On a personal note I would like to thank all of my family and friends who gave me
the confidence and strong support to complete the thesis.
Nicholas Burton-Ree
University of Southern Queensland
2013

Hydroelectric Generators for Third World Countries 6
Mr Nicholas Burton Ree
Contents
Hydroelectric Generators for Third World Countries .................................................. 1
Abstract ........................................................................................................................ 2
Disclaimer Page ........................................................................................................ 3
Limitations of Use .................................................................................................... 3
Candidates Certification ........................................................................................... 4
Acknowledgements .................................................................................................. 5
Contents .................................................................................................................... 6
List of Tables .......................................................................................................... 12
List of figures ......................................................................................................... 12
Abbreviations ......................................................................................................... 14
Overview of the Dissertation .................................................................................. 16
Risk Assessments ................................................................................................... 17
Chapter 1 .................................................................................................................... 18
1.1 Introduction ................................................................................................. 18
1.2 Project Aim .................................................................................................. 20
1.3 Assessment of Consequential effects .......................................................... 21
1.3.1 Consequential effects and Responsibility ............................................ 22
1.4 Background ................................................................................................. 22
1.5 Target Area .................................................................................................. 23
Chapter 2 .................................................................................................................... 25
2.1 Introduction ................................................................................................. 25
2.2 Third World Countries ................................................................................ 25
2.3 Papua New Guinea ...................................................................................... 26
2.4 Small Hydroelectric Generation .................................................................. 27
2.5 Basic hydraulic power concepts .................................................................. 29
2.5.1 Capacity factor ..................................................................................... 31
Hydroelectric Generators for Third World Countries 7
Mr Nicholas Burton Ree
2.5.2 Energy Output ...................................................................................... 31
2.5.3 Turbines................................................................................................ 31
2.5.4 Efficiencies ........................................................................................... 33
2.5.5 Economics ............................................................................................ 34
2.5.6 Sustainability and Ecological Impacts ................................................. 34
2.5.7 Social Benefits ..................................................................................... 35
2.5.8 Environmental Benefits ........................................................................ 36
2.6 Pump as a Turbine (PAT) ............................................................................ 36
2.6.1 How Does a PAT Operate .................................................................... 38
2.6.2 Cavitation ............................................................................................. 40
2.6.3 Who has done this before ..................................................................... 40
2.7 Mathematical Relationship .......................................................................... 41
2.7.1 Understanding pump performance curves ........................................... 41
2.7.2 Pumps as Turbines performance Curves .............................................. 43
2.7.3 Generator Selection .............................................................................. 44
2.7.4 Experimental Setup .............................................................................. 48
Chapter 3 .................................................................................................................... 50
3.1 Methodologies, Timelines and Resources ................................................... 50
3.1.1 Methodology ........................................................................................ 50
3.1.2 Research ................................................................................................... 50
3.1.3 Analysed Approach.................................................................................... 51
3.1.4 Resources ............................................................................................ 52
3.1.4.1 High Volume Centrifugal Pump ......................................................... 52
3.1.4.2 1kW Single phase generator (Prototype) ............................................ 52
3.1.4.3 Access to the Hydraulic Labs .............................................................. 53
3.1.4.4 Piping and connections (Flanges) ....................................................... 53
Hydroelectric Generators for Third World Countries 8
Mr Nicholas Burton Ree
3.1.4.5 Flow and Torque Meters ..................................................................... 53
3.1.5 Prerequisite Model Analysis ................................................................ 53
3.1.5.1 Theoretical Relationship ...................................................................... 53
3.1.5.2 Experimental Validation ...................................................................... 53
3.1.6 Third World Application ...................................................................... 54
3.1.6.1 Location............................................................................................... 54
3.1.6.2 Power Required ................................................................................... 54
3.1.6.3 Pump and Generator Selection ............................................................ 54
3.1.6.4 Power Storage ..................................................................................... 54
3.1.6.5 Flow Control ....................................................................................... 55
3.1.6.6 Other .................................................................................................... 55
3.2 Analytical and Experimental Analysis ........................................................ 56
3.2.1 Selecting the PAT ................................................................................ 56
Chapter 4 .................................................................................................................... 57
4.1 Prerequisite Modal Analysis ....................................................................... 57
4.2 Theoretical Relationship .............................................................................. 57
4.2.1 Power Generation ................................................................................. 58
4.2.2 Calculations at 15m .............................................................................. 59
4.3 First Test ........................................................................................................... 59
4.4 Pump as a Turbine Prototype ...................................................................... 61
4.5 Previous Prototypes and Experiments ......................................................... 61
4.6 Resources Available .................................................................................... 62
4.7 Prototype ..................................................................................................... 62
4.7.1 Load Simulation ................................................................................... 64
4.7.2 Testing procedure ................................................................................. 65
4.8 Test One ...................................................................................................... 66
Hydroelectric Generators for Third World Countries 9
Mr Nicholas Burton Ree
4.8.1 Results .................................................................................................. 66
4.9 Testing Validation Results and Discussion ................................................. 67
4.9.1 Test One ............................................................................................... 67
Chapter 5 .................................................................................................................... 69
5.1 Location ............................................................................................................ 69
5.1.1 General Geographical analysis ............................................................. 70
5.1.2 Area ...................................................................................................... 71
5.1.3 Runoff Coefficient ............................................................................... 72
5.1.4 Rainfall Intensity .................................................................................. 72
5.2 Peak Discharge ............................................................................................ 73
5.3 Power Required ........................................................................................... 74
5.3.1 Type of Generator ................................................................................ 74
5.3.2 DC power source .................................................................................. 76
5.3.3 DC appliances ...................................................................................... 77
5.3.4 Refrigerator .......................................................................................... 77
5.3.5 Lighting ................................................................................................ 78
5.3.6 Ceiling fan ............................................................................................ 78
5.4 Total power .................................................................................................. 79
5.5 Battery Sizing and Selection ....................................................................... 79
5.5.1 Battery Charging and Selection ........................................................... 82
5.5.2 Regulator Sizing and Selection ............................................................ 82
5.5.3 Fuse Control ......................................................................................... 82
5.6 Schematics ................................................................................................... 83
5.7 Transmission Lines ...................................................................................... 83
5.8 Efficiency Losses ........................................................................................ 84
5.9 Generator Selection ..................................................................................... 85
Hydroelectric Generators for Third World Countries 10
Mr Nicholas Burton Ree
5.10 System Analysis .......................................................................................... 86
5.10.1 Weir and intake .................................................................................... 86
5.10.2 Pipe inlet .............................................................................................. 88
5.10.3 Piping ................................................................................................... 89
5.10.4 Pipe Materials....................................................................................... 89
5.10.5 Flow Control ........................................................................................ 91
5.10.5 Flow control valves .............................................................................. 92
5.11 Pump as a Turbine Selection ....................................................................... 96
5.11.1 Matlab Analysis ................................................................................... 96
5.12 Results ......................................................................................................... 99
Efficiencies of PAT performance ..................................................................... 102
Characteristics of the selected PAT .................................................................. 103
5.12.1 Cost .................................................................................................... 104
Chapter 6 .................................................................................................................. 105
6.1 Conclusion and further work .......................................................................... 105
6.2 Further Work .................................................................................................. 107
6.2.1 PAT performance prediction ................................................................... 107
6.2.2 Torque available as a PAT ....................................................................... 108
6.2.3 Pump as a Turbine information readily available .................................... 108
Appendix A .............................................................................................................. 109
Project Specification ......................................................................................... 109
Appendix B .............................................................................................................. 112
Pump Performance Sheets ................................................................................ 112
Appendix C .............................................................................................................. 120
Matlab Code for Simulations ............................................................................ 120
Appendix D .............................................................................................................. 130

Hydroelectric Generators for Third World Countries 11
Mr Nicholas Burton Ree
Risk Assessment ............................................................................................... 130
Appendix E .............................................................................................................. 144
Tables ................................................................................................................ 144
Appendix F ............................................................................................................... 150
Stormwater Runoff ........................................................................................... 150
Appendix G .............................................................................................................. 155
Battery Requirements ....................................................................................... 155
References ................................................................................................................ 157
Hydroelectric Generators for Third World Countries 12
Mr Nicholas Burton Ree
List of Tables
Table 1 Test one results ............................................................................................. 66
Table 2 Error between theoretical and experiment .................................................. 68
Table 3Advantages and disadvantages of AC ............................................................ 74
Table 4Advantages and disadvantages of DC ............................................................ 75
Table 5 DC Storage system advantage and disadvantages ........................................ 76
Table 6Real power required (W) ................................................................................ 79
Table 7 Pipe Materials ................................................................................................ 90
Table 8 Weighted Pipe Selection process .................................................................. 91
Table 9 Valve Analysis ................................................................................................ 93
Table 10 Percentage Head Loss ................................................................................. 94
Table 11 Valve Decision Matrix .................................................................................. 95
Table 12 Head Required for Pump Model ................................................................. 99
Table 13 Required Flow Rate ................................................................................... 101
Table 15 Pump Analysis............................................................................................ 103
Table 16 Gantt Chart ................................................................................................ 145
Table 17 - Deadlines ................................................................................................. 146
Table 18 Average Ceiling fan consumption.............................................................. 147
Table 19 Average Refrigerator consumption ........................................................... 147
Table 20 Pump Model BEP's..................................................................................... 148
Table 21 Recommended Manning's Value .............................................................. 152
Table 22 Surface Description ................................................................................... 153
Table 23 Channel Flow Pattern ................................................................................ 154
Table 24 Australian Standards - Autonomy ............................................................. 156
Table 25 Battery Specification Guide ....................................................................... 156
List of figures
Figure 2: Targeted Site Location (Google Maps, Papua New Guinea 2013) ............ 24
Figure 3 Flow Rate and Head (Google Images 2013)................................................ 29
Figure 4Turbine Efficiencies...................................................................................... 33
Figure 5Finding the Balance between Objectives ...................................................... 35
Figure 6Cost vs. Efficiency ........................................................................................ 37
Figure 7PAT Operation .............................................................................................. 39
Figure 8Forces within a PAT ..................................................................................... 39
Figure 9Performance for Specific Speeds .................................................................. 41
Figure 10Pump Head vs. Flow and Efficiency Curve ................................................ 42
Figure 11Pump Data Sheet......................................................................................... 43
Hydroelectric Generators for Third World Countries 13
Mr Nicholas Burton Ree
Figure 12PAT Head and flow and Site and Turbine Curve ....................................... 44
Figure 13Test Experiment (Derakhshan, Anourbakhsh, 2007) ................................. 48
Figure 14Dimensionless BEP of tested PATs (Derakhshan, Anourbakhsh, 2007) ... 49
Figure 15Analysis Approach ..................................................................................... 51
Figure 1 Hydroelectric Generator Prototype .............................................................. 52
Figure 16 50-32-160 performance data ...................................................................... 59
Figure 17Simulation Code for Prototype Pump ......................................................... 60
Figure 18Matlab Output ............................................................................................. 60
Figure 19Prototype Schematics.................................................................................. 63
Figure 20Prototype PAT Generator ........................................................................... 64
Figure 21Simulation Setup ......................................................................................... 65
Figure 22Test vs. Theoretical ..................................................................................... 67
Figure 23Site Location ............................................................................................... 69
Figure 24Catchment Area .......................................................................................... 72
Figure 25Average power required ............................................................................. 76
Figure 26Starting behaviour of electric motors ......................................................... 77
Figure 27Available Battery arrangements ................................................................. 81
Figure 28Battery Schematics ..................................................................................... 83
Figure 29Transmission line ........................................................................................ 84
Figure 30Weir Design ................................................................................................ 87
Figure 31Weir Concept .............................................................................................. 87
Figure 32Suction Filter .............................................................................................. 88
Figure 33 Matlab Process ........................................................................................... 98
Figure 34 Head Required for Pump Models ............................................................ 100
Figure 35 PAT efficiencies ...................................................................................... 102
Figure 36 PAT Efficiency ........................................................................................ 103
Figure 12 Rain Intensity Duration............................................................................ 151

Hydroelectric Generators for Third World Countries 14
Mr Nicholas Burton Ree
Abbreviations
PAT Pump as a Turbine
BEP Best Efficiency Point
HEC Hydroelectricity
η Efficiency
H Head, m
N Rotational Speed, rpm
g Gravitational acceleration, 𝑚/𝑠2
P Power, W, kW
Q Volumetric Flow Rate, 𝑚3/𝑠
𝑄𝑡 The flow rate of the turbine at best efficiency point
𝑁𝑡 The turbine running speed
𝑁𝑝 The rated pump speed
𝑄𝑏𝑒𝑝 The pumps flow rate at the best efficiency point
𝜂𝑚𝑎𝑥 The pumps maximum efficiency
𝐻𝑡 The head of the turbine at best efficiency point
𝑁𝑡 The turbine running speed
𝐻𝑏𝑒𝑝 The pumps Head at the best efficiency point
AC Alternating Current
DC Direct Current
W Watts
𝐶𝑥 Battery capacity, specified for an appropriate discharge rate x, (AH)
𝐸𝑡𝑜𝑡 Total design daily energy demand from the d.c, in watt hours (WH)
𝑉𝑑𝑐 Nominal Voltage of the d.c (battery voltage), in vaults (V)
𝑇𝑎𝑢𝑡 Number of days of autonomy

Hydroelectric Generators for Third World Countries 15
Mr Nicholas Burton Ree
𝐷𝑂𝐷𝑚𝑎𝑥 Design maximum depth of discharge of the battery, expressed as a
percentage.

Hydroelectric Generators for Third World Countries 16
Mr Nicholas Burton Ree
Overview of the Dissertation
This dissertation is as organised:
Chapter 1 defines the purpose of the proposed idea of a Small Hydroelectric
generator and explains in detail of where the system will be installed. This chapter
also investigates the capacity of the generator and briefly outlines the dissertation
content.
Chapter 2 is the review of literature relevant to the project. This chapter discusses in
detail the information found on topics required for this dissertation and how the
information will prove to be beneficial to the design and application of a small
hydroelectric generator.
Chapter 3 defines the suitable methodologies for the research and development in
designing the hydroelectric generator. This chapter also examines the risks involved
with operating the generator. The resources required for this project are also
identified.
Chapter 4 details the design of the hydroelectric system. It shows the justification
and functions of each component. This chapter contains the theoretical calculations
obtained from the literature review and summarises the finalised chosen design. This
includes validating the theoretical calculations with the prototype.
Chapter 5 isthe summation of the results found from the test and theoretical
calculations. The outcomes of the results are used to finalise the design.
Chapter 6 identifies the work performed and discusses any further research and
development that may be required.

Hydroelectric Generators for Third World Countries 17
Mr Nicholas Burton Ree
Risk Assessments
All of the risks involved in the project were evaluated and taken into serious
consideration. To comply with the standards of the University of Southern
Queensland, risk assessments were completed for both the physical and theoretical
risks. A physical risk was defined as the ability to cause physical harm or damage to
a body or object. Theoretical risks were defined as the risks that could damage the
dissertation or work produced.
The tables were inserted when the thesis was completed, both lab and project
completion assessment were carried out. The outline based on the Risk assessment
for the lab operation was used for both.

Hydroelectric Generators for Third World Countries 18
Mr Nicholas Burton Ree
Chapter 1
1.1 Introduction
Renewable energy is becoming more prominent in society and the understanding for
how important it will be in the future is becoming common knowledge. Nowadays,
there are many different types of renewable energy available to the public, but are
restricted to certain locations because of price and accessibility. The ever so
changing climate is making it more difficult to harness the available green energy.
However, in particular locations, due to erratic weather, it is has also had the reverse
affect and has increased the resources in some countries. As much as droughts are
becoming more predominant in countries such as Australia, the wet seasons have
become more severe in locations such as North eastern India and Papua New Guinea.
Papua New Guinea is susceptible to climate change. Its inhabitants are spread
sparsely throughout the country and it is known to have some of the roughest terrain
in the world. It has more than 17,000kms of coastline and 600 islands (Chalapan,
Kaluwin, 2000), therefore, making it difficult to supply electricity to many of its
inhabitants owing to the severity of the terrain and the separation of the villages. In
countries such as Australia, power is distributed across the country as a consequence
of several large power stations connected to a national grid. In 2012 Australia's
consumption rate was 225 billion kWh (Index mundi - Australian statistics 2013).
Due to Australia's relatively flat topography, it is relatively easy and inexpensive to
transmit the power to remote locations. However, unlike Australia, in Papua New
Guinea it has proven to be impractical to have one major power station and then
attempt to transmit the power across the rugged terrain to each individual village. As
a result, only the larger villages have reticulated mains power.
Hydroelectric Generators for Third World Countries 19
Mr Nicholas Burton Ree
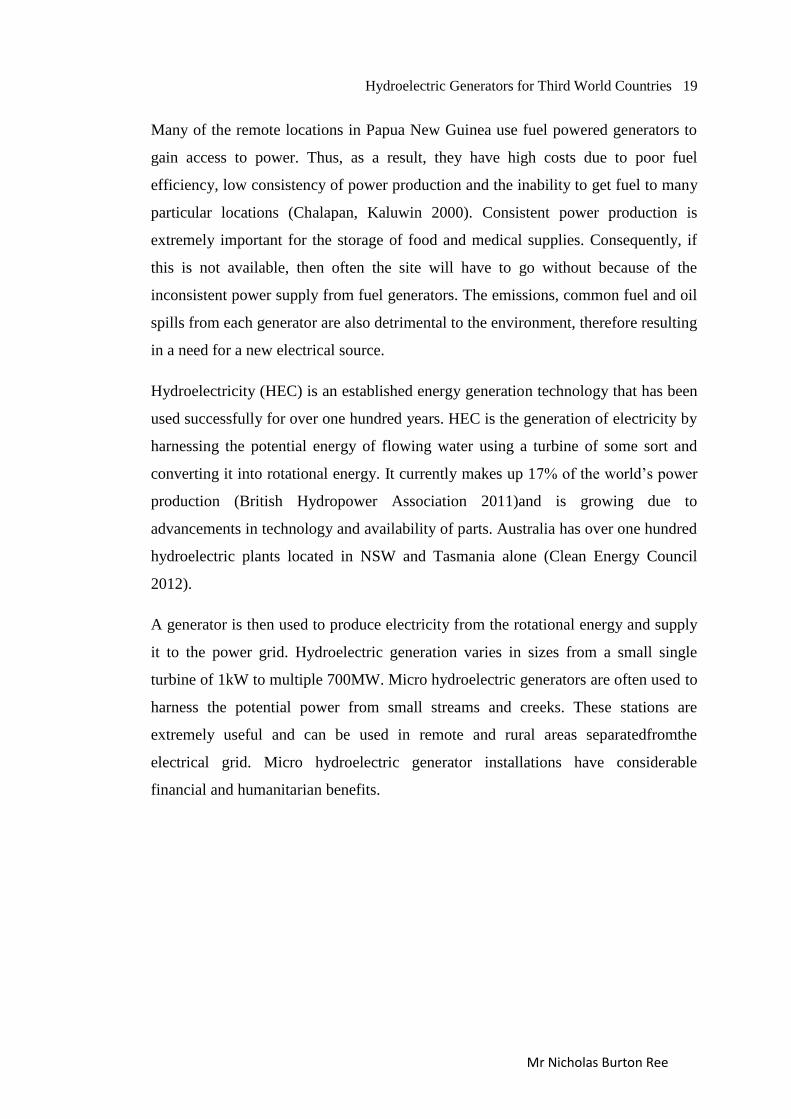
Many of the remote locations in Papua New Guinea use fuel powered generators to
gain access to power. Thus, as a result, they have high costs due to poor fuel
efficiency, low consistency of power production and the inability to get fuel to many
particular locations (Chalapan, Kaluwin 2000). Consistent power production is
extremely important for the storage of food and medical supplies. Consequently, if
this is not available, then often the site will have to go without because of the
inconsistent power supply from fuel generators. The emissions, common fuel and oil
spills from each generator are also detrimental to the environment, therefore resulting
in a need for a new electrical source.
Hydroelectricity (HEC) is an established energy generation technology that has been
used successfully for over one hundred years. HEC is the generation of electricity by
harnessing the potential energy of flowing water using a turbine of some sort and
converting it into rotational energy. It currently makes up 17% of the world‟s power
production (British Hydropower Association 2011)and is growing due to
advancements in technology and availability of parts. Australia has over one hundred
hydroelectric plants located in NSW and Tasmania alone (Clean Energy Council
2012).
A generator is then used to produce electricity from the rotational energy and supply
it to the power grid. Hydroelectric generation varies in sizes from a small single
turbine of 1kW to multiple 700MW. Micro hydroelectric generators are often used to
harness the potential power from small streams and creeks. These stations are
extremely useful and can be used in remote and rural areas separatedfromthe
electrical grid. Micro hydroelectric generator installations have considerable
financial and humanitarian benefits.
Hydroelectric Generators for Third World Countries 20
Mr Nicholas Burton Ree
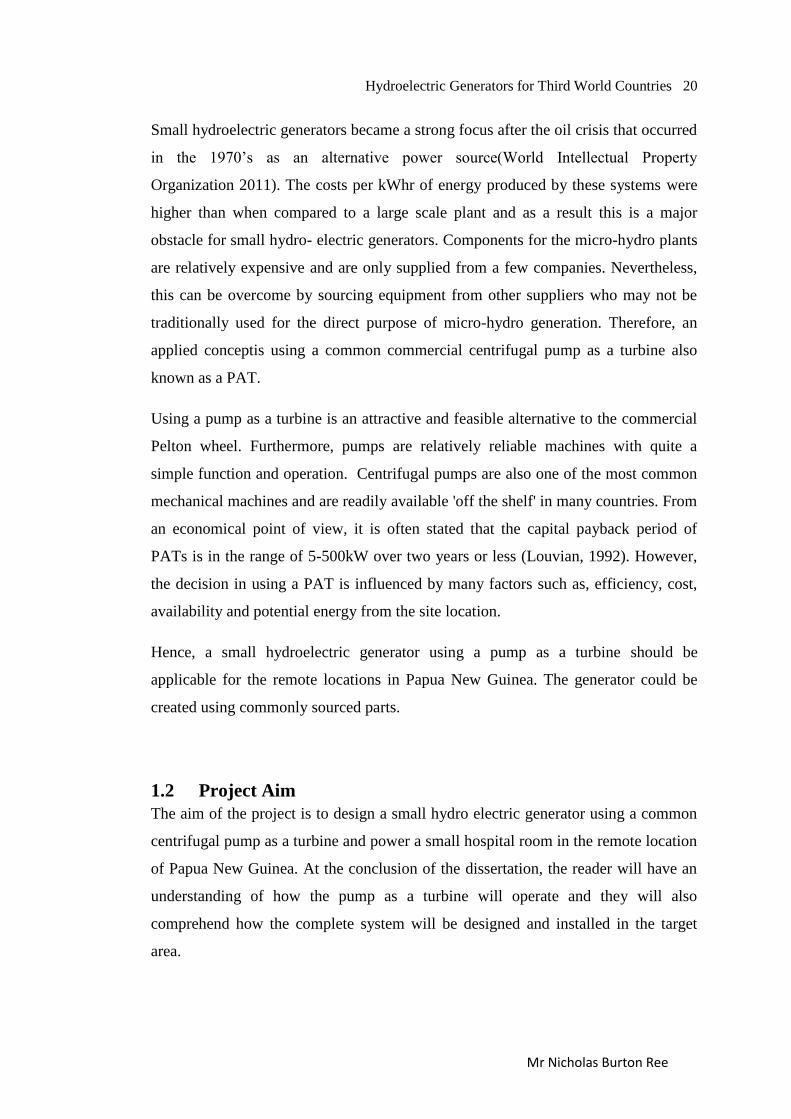
Small hydroelectric generators became a strong focus after the oil crisis that occurred
in the 1970‟s as an alternative power source(World Intellectual Property
Organization 2011). The costs per kWhr of energy produced by these systems were
higher than when compared to a large scale plant and as a result this is a major
obstacle for small hydro- electric generators. Components for the micro-hydro plants
are relatively expensive and are only supplied from a few companies. Nevertheless,
this can be overcome by sourcing equipment from other suppliers who may not be
traditionally used for the direct purpose of micro-hydro generation. Therefore, an
applied conceptis using a common commercial centrifugal pump as a turbine also
known as a PAT.
Using a pump as a turbine is an attractive and feasible alternative to the commercial
Pelton wheel. Furthermore, pumps are relatively reliable machines with quite a
simple function and operation. Centrifugal pumps are also one of the most common
mechanical machines and are readily available 'off the shelf' in many countries. From
an economical point of view, it is often stated that the capital payback period of
PATs is in the range of 5-500kW over two years or less (Louvian, 1992). However,
the decision in using a PAT is influenced by many factors such as, efficiency, cost,
availability and potential energy from the site location.
Hence, a small hydroelectric generator using a pump as a turbine should be
applicable for the remote locations in Papua New Guinea. The generator could be
created using commonly sourced parts.
1.2 Project Aim
The aim of the project is to design a small hydro electric generator using a common
centrifugal pump as a turbine and power a small hospital room in the remote location
of Papua New Guinea. At the conclusion of the dissertation, the reader will have an
understanding of how the pump as a turbine will operate and they will also
comprehend how the complete system will be designed and installed in the target
area.
Hydroelectric Generators for Third World Countries 21
Mr Nicholas Burton Ree
The dissertation will highlight the cost effective aspect of using a PAT instead of a
purposely designed turbine. The reader should also be able to use the material in this
dissertation to gain an understanding of how to select an appropriate pump for
varying head and flow rates.
This project involved theoretically testing the use of a centrifugal pump as a turbine
and compared the findings to actual testing on the application. The system was
designed as a whole and each component was researched in order to justify its use.
The dissertation clearly and accurately demonstrates how and why each component
was chosen.
The Small hydroelectric generator was to power a small hospital room in a remote
location consisting of:
1 Medicines Refrigerator
5 Lights
1 Ceiling Fan
The generator should be able to produce approximately around 6-10kW.hr per day
depending on the specific equipment selection. It was expected that the appliances
used in the area were not efficient and they had a high power draw.
The hypothesis was firstly, that the use of a pump as a turbine must be proven to be
an appropriate application in both cost and power generation.
1.3 Assessment of Consequential effects
Actions taken in the design and testing of this dissertation were completed
professionally to ensure the credibility of this project and work ethic was maintained.
To do so all aspects were designed to adhere to the code of ethics 2011. The codes of
ethics are produced by Engineers Australia to help define the values and principles
that shape the decisions made in engineering practice. As a member, it is important
to adhere to the code and be accountable for the decisions and actions taken.
Hydroelectric Generators for Third World Countries 22
Mr Nicholas Burton Ree
1.3.1 Consequential effects and Responsibility
During the design process and analysis of the dissertation, the engineer‟s code of
ethics must always be followed. This section contains the basic practices of the code
that were applied to the completion of this work.
The Institution of Engineers Australia has a strong practice of the four following
practices.
1. Demonstrate Integrity
2. Practise Competently
3. Exercise Leadership
4. Promote Sustainability
By following the guidelines on professional conduct as set by engineers Australia
2013, they were not intended by engineers Australia to be interoperated as a full or
exhaustive list of the situations and circumstances which may compromise
compliance and noncompliance of the code of ethics. The dissertation was completed
using judgement, interpretation and balanced decision-making in content.
1.4 Background
Papua New Guinea (PNG) is located north of Australia occupying the eastern half of
the island of New Guinea. PNG has some of the roughest terrain in the world and
some of the peaks in the central lands reach up to 4,350m (Papua New Guinea Initial
National Communication 2000). Many of the smaller islands located near the
mainland have high volcanic mountains.

Hydroelectric Generators for Third World Countries 23
Mr Nicholas Burton Ree
A survey taken in 2010 showed that Papua New Guinea had a population of around
6.7 million in habitants(Australian Department Of Foreign Affairs 013). 87.5% of the
population were located in rural areas while the other 12.5% were urban.
Studies have also shown that the annual growth in population for rural areas in PNG
is 2.4%, which is .2% greater than the urban growth and was expected to double
every 30yrs (Health Service Delivery Profile Papua New Guinea 2012). As a result,
demand for power would increase in remote locations as time progresses due to
higher population growth.
Although the population is growing at a remarkable rate, the technological
advancements and medical supplies struggle to keep up with the ever so increasing
population. Medical supplies are only able to be given to villagers in the remote
locations on very few occasions and must be used immediately as there are few
electric fridges. Consequently, the lack of power throughout the highlands has had
many detrimental effects on the country.
PNG has an average rainfall of around 2700mm in the wet season. This had varied
by only 15% since 1973 and has had a higher consistency in the highland's central
location. Thus fortunately, the rural locations have access to fresh flowing water all
year round (Papua New Guinea Initial National Communication 2000).
1.5 Target Area
Papua New Guinea (PNG) has a rough terrain, and a high rainfall throughout the
year. There is a lack in power supply across the country, hence making it an
appropriate targeted area to design the small hydroelectric generator for operation.
The particular location in the highlands was chosen because of its remote positioning
and its similarity to other sites around the world, for example parts of Asia and South
America. Furthermore, by designing the generator for the highland country in PNG,
it allows this project to cover a larger location scope.
Hydroelectric Generators for Third World Countries 24
Mr Nicholas Burton Ree
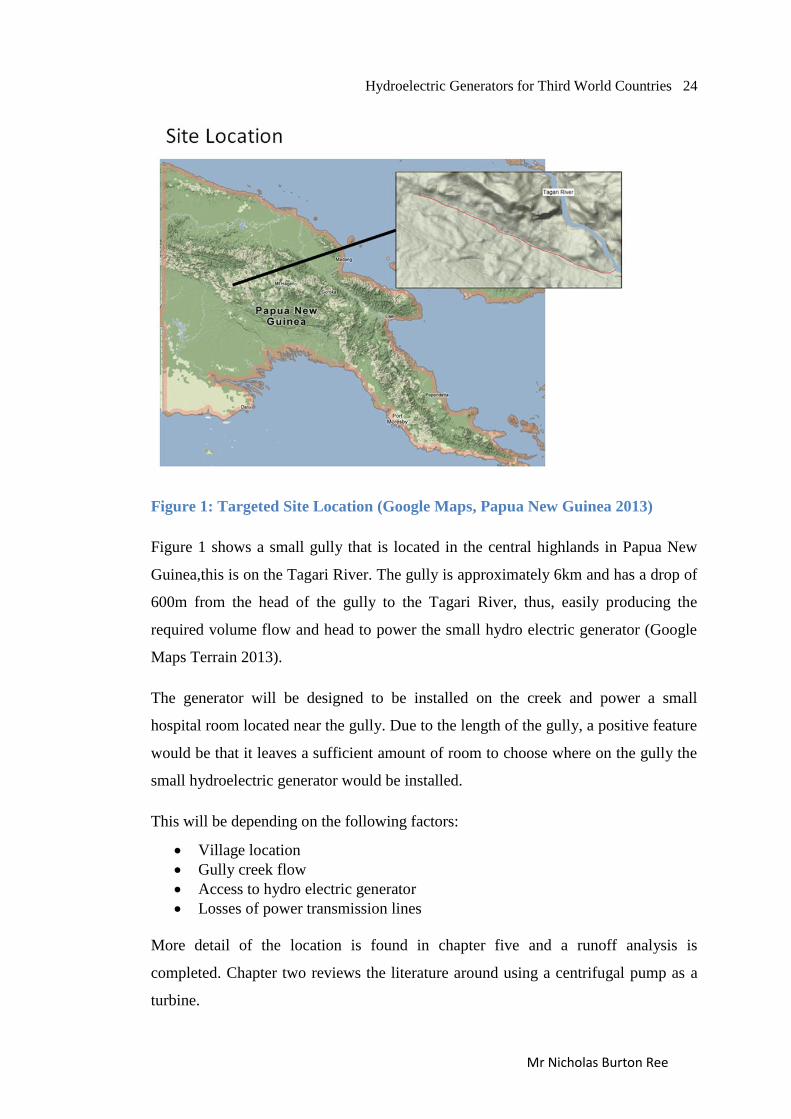
Figure 1: Targeted Site Location (Google Maps, Papua New Guinea 2013)
Figure 1 shows a small gully that is located in the central highlands in Papua New
Guinea,this is on the Tagari River. The gully is approximately 6km and has a drop of
600m from the head of the gully to the Tagari River, thus, easily producing the
required volume flow and head to power the small hydro electric generator (Google
Maps Terrain 2013).
The generator will be designed to be installed on the creek and power a small
hospital room located near the gully. Due to the length of the gully, a positive feature
would be that it leaves a sufficient amount of room to choose where on the gully the
small hydroelectric generator would be installed.
This will be depending on the following factors:
Village location
Gully creek flow
Access to hydro electric generator
Losses of power transmission lines
More detail of the location is found in chapter five and a runoff analysis is
completed. Chapter two reviews the literature around using a centrifugal pump as a
turbine.

Hydroelectric Generators for Third World Countries 25
Mr Nicholas Burton Ree
Chapter 2
2.1 Introduction
The concept of using a centrifugal pump as a turbine is not an original idea. It has
been attempted in the past as an alternative application for a turbine. The concept has
been deemed successful and under the correct condition, proving to be effective.
The global energy demand is rapidly increasing, particularly in developing countries
over the world due to both an increase in population and industrialisation. In order to
meet the ever growing demand in power production, new energy sources are required
and quickly (Alexandratos,2005), (Bradshaw, 2013),(Fischer, Schrattenholzer, 2001),
(Hans-Holger, Popescu, 2000). The purpose of this chapter is to review the
literature relating to small scale hydroelectric power and pumps as turbines.
2.2 Third World Countries
Third world is a terminology that arose during the cold war to help define countries
that both sided with America and allied states or with the communist bloc (for
example the Soviet Union)(Gaddis, 1992),(Haass, 1997). This terminology was then
recognised as a way to categorize nations based on three groups:
Social
Political
Economical
Nations that are labelled under the title of third world countries, each have a poor
level from at least one of these groups. Within each section, the conditions of being
part of a third world country broaden. It is estimated that around 79% of people in
the 50 poorest nations have no access to electricity, despite years of industrial
developments. In 2012 a study published by scientific America showed the total
number of individual people without power is expected to be around 1.5billion
people or a quarter of the world‟s population (Scientific America, 2013) .

Hydroelectric Generators for Third World Countries 26
Mr Nicholas Burton Ree
The 1.5 billion is seen as an improvement over the years, but this is not due to the
improvement of power supply to people. The improvement is due to the urbanization
of areas based at power supply locations. No improvements have been made to
develop the infrastructure of power transmission to remote locations, and hence
many have moved to the power source. Therefore, the density in specific targeted
areas has increased rapidly (Papua New Guinea, Initial National
Communication,2000).
This dilemma has two detrimental impacts on the nations affected by this
phenomenon:
1. The over-population of the area results in damage to the eco-system. This is due to
both pollution and using up the resource available for that specific location. Erosion
is also a large problem that causes damage to land, structures and can result in heavy
costs. Often erosion occurs when the soil is overloaded or as a consequence of
flowing water. Furthermore, poor urbanization frequently results in deficient water
control which can be attributed to lack of funding, thus causing the ground to become
unstable (Blaikie,1985).
2. The rest of the county is not being used to its possible potential. The resources and
space available for society are not used because of the lack of access to electrical
power at the location. Subsequently, using the land and space allows less strain on
the environmental eco system due to the inhabitants and density of man
(Loffler,1977).
2.3 Papua New Guinea
Papua New Guinea is currently showing signs of falling into economical paralysis.
This is similar to other locations such as the Solomon Islands. Ever since the nation
became independent in 1975, the living conditions have scarcely improved
(Australian Geographic 2013). The countries poor finances and unproductive
spending have led to the nation having little money, and consequently this has
resulted in poor roads, education and health section. Furthermore, roads in rural areas
are so poor that access has been denied.
Hydroelectric Generators for Third World Countries 27
Mr Nicholas Burton Ree
At the same time, population growth in the country is increasing but economic
growth is negligible, and hence the country is stagnating as a nation. (Windybank,
Manning, 2003). However, the only growth seen by the nation has been in the mining
and petroleum sectors due to their large export of their resources.
The greatest concern for Papua New Guinea is the imbalance of the economy, and
this has been in existence since independence. The condition of Papua New Guinea
has been the result of several different factors. Policies which were implemented
were not all beneficial and the governments had failed to correct them. The rural
sectors of the country have been restricted, thus this was largely due to the lack of
infrastructure and low availability of resources. Consequently, as far as rural
villagers were concerned, anecdotal evidence suggested that many believed that their
quality of life was now worse than it was 20 years ago (Windybank, Manning, 2003).
It is apparent that funding will go into other sectors before the electrical
infrastructure is addressed. Therefore, with the lack of government budgets and the
continuous action of urbanisation, the country will continue to struggle. Accordingly,
the living conditions of individuals will need to improve instead of declining.
2.4 Small Hydroelectric Generation
Micro Hydroelectric generators allow the production of electricity. This is due to the
potential power from flowing water. The systems allow generation to occur in remote
and distant locations where often it is too expensive or the country is too rugged for
the construction of power transmissions lines (The University of Chicago Press).
“Mini hydro” is a term that can apply to sites ranging from small size schemes that
have the ability to power one appliance, up to supplying electricity for a house. Small
scale hydroelectric generation is one of the most cost effective and reliable energy
technologies available. Hence, small individual hydroelectric generators are
becoming quite common. There are multiple companies that provide service in hydro
generation and this can vary from 1kW up to 200kW depending on cost and location
(D Henderson, 1998).
Hydroelectric Generators for Third World Countries 28
Mr Nicholas Burton Ree
There are a number of advantages and disadvantages of small scale hydroelectric
generation systems.
2.4.1 Advantages
Efficient energy source. It only takes a small amount of flowing water to
acquire generation from a correctly installed hydro system.
Reliable. The supply of energy continues compared to other remote power
generation systems such as a fuel generator. The greatest draw (peak) is in the
winter months when large amounts of energy are being used.
Reservoir is not required. If the system is small enough, the flowing water
can be directed into the turbine without any reservoir required. This improves
overall cost and results in less impact to the environment.
Cost effective. Once the initial cost of installation is completed, maintenance
is relatively cheap and easy. The overall cost will depend on the size and
material.
Generation into the power grid. If applicable the generation of power can
be transmitted into the power grid. Large power generation companies will
buy back the power. This is governed by how much power is generated from
the system, what power is being used and on the location in relation to the
grid.
Power for Third World Countries. Due to the system being a low cost
power generation it is applicable to developing countries where access to
power is impractical or impossible (U.S Department of Energy 2001).
2.4.2 Disadvantages
Location limitations. For the small hydroelectric generator to work it must
be installed in a site which meets all of the requirements and factors for
successful generation. These requirements and factors are: Small distance
from generator to where the power is required (transmission distance), flow
rate of the targeted stream, head that can be extracted and the system
components of the generator (power storage, generation regulation, piping
and possible power inverters).
Hydroelectric Generators for Third World Countries 29
Mr Nicholas Burton Ree
Poor generation in the dry season. The system relies on water flow for
generation. During the dry periods of the year, power generation will be more
difficult. Planning and research into the location beforehand is extremely
important.
Size limitation. The generator cannot be expanded in the future due to the
restrictions of the creek size. Although the water system might be able to be
dammed, it is still limited with the floe rate and the incline of the creek.
Environmental impact. Although ecological damage will be minimal due to
the small scale of the generator, it still must be considered. Factors such as
where and how much of the water will be diverted are important. The
smallest possible environmental impact must be taken into account each time
(Baxter,1977).
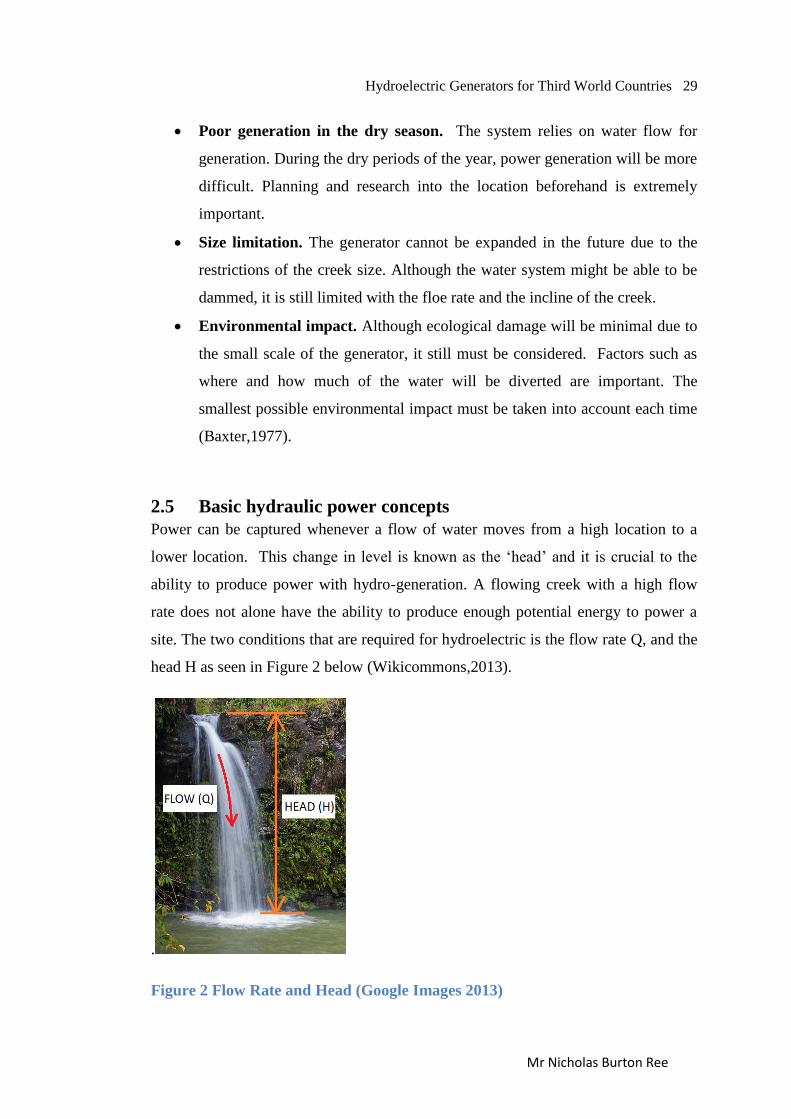
2.5 Basic hydraulic power concepts
Power can be captured whenever a flow of water moves from a high location to a
lower location. This change in level is known as the „head‟ and it is crucial to the
ability to produce power with hydro-generation. A flowing creek with a high flow
rate does not alone have the ability to produce enough potential energy to power a
site. The two conditions that are required for hydroelectric is the flow rate Q, and the
head H as seen in Figure 2 below (Wikicommons,2013).
.
Figure 2 Flow Rate and Head (Google Images 2013)
Hydroelectric Generators for Third World Countries 30
Mr Nicholas Burton Ree
Head represents the total energy available to the turbine. In hydrology it can be
defined as the maximum available fall in the vertical direction from upstream to
downstream. When a system is installed it is often defined as the distance from the
inlet of the system to the turbine. The actual head seen by the turbine will always be
less than the maximum head of the site due to losses in the system. This lower
measure of head is known as the net head (Hamil,2011). The turbine may also be
unable to extract the entire head and therefore a residual head may remain after the
water leaves the turbine.
Flow rate (Q)is defined as the volume of water passing per unit of time. The unit
may vary from litres per second to 1𝑚2/𝑠𝑒𝑐 (Engineering Fundamentals, 2011).
Power is defined as the amount of energy consumed per unit of time which is
measured in watts (W) (Engineering Fundamentals, 2011).
Hydro generation is the process of turning potential energy into electricity. Through
this process it converts the potential energy of water to an equivalent amount of
kinetic energy. The water‟s height which is measure in potential energy is partly
converted into kinetic energy which is the speed of the flowing water (Hamil,2011).
By balancing the amount of potential and kinetic energy an efficient power
generation is plausible. Potential and Kinetic energy are given by:
Kinetic energy (joules) = 1
2𝑚𝑣2
Potential energy (joules) = mgh
Where:
m is the mass of the water (kg)
g is acceleration due to gravity (9.81m/𝑠2)
H is the effective head available (m)
v is the velocity of the water at the intake of the turbine (m/s)
The intake velocity can be found by 𝑣 = (2𝑔𝐻)
Turbines convert the energy from the water (Kinetic and Potential) to mechanical
shaft power which rotates the generator. The available power is proportional to the
Hydroelectric Generators for Third World Countries 31
Mr Nicholas Burton Ree
product of the head and flow rate (Hamil,2011). Therefore, the power output of
hydroelectric systems can be estimated from:
𝑃 = ƞ𝜌𝑔𝑄
Where:
P is the mechanical power in watts (W) produced at the turbines shaft
Ƞ is the hydraulic efficiency of the turbine
ρ is the density of the water (1000kg/𝑚3)
g is acceleration due to gravity (9.81m/𝑠2)
Q is the volume flow rate passing through the turbine (𝑚3/𝑠)
H is the effective head available
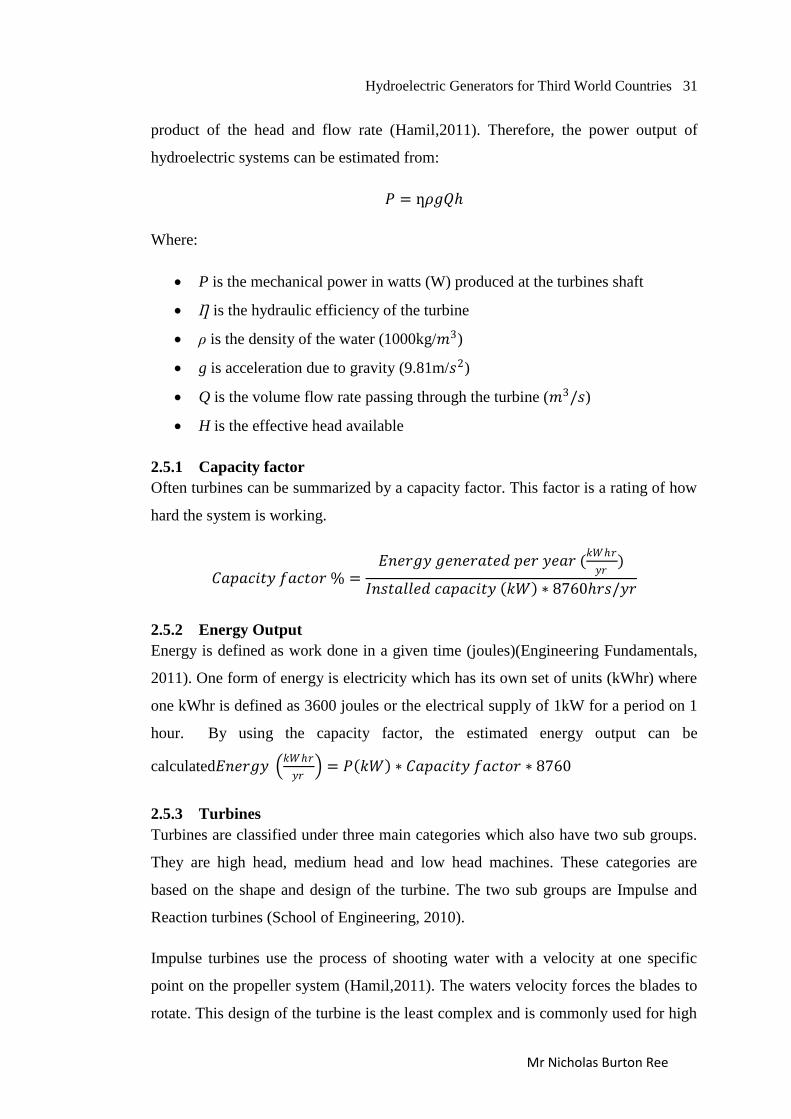
2.5.1 Capacity factor
Often turbines can be summarized by a capacity factor. This factor is a rating of how
hard the system is working.
𝐶𝑎𝑝𝑎𝑐𝑖𝑡𝑦 𝑓𝑎𝑐𝑡𝑜𝑟 % =𝐸𝑛𝑒𝑟𝑔𝑦 𝑔𝑒𝑛𝑒𝑟𝑎𝑡𝑒𝑑 𝑝𝑒𝑟 𝑦𝑒𝑎𝑟 (
𝑘𝑊𝑟
𝑦𝑟)
𝐼𝑛𝑠𝑡𝑎𝑙𝑙𝑒𝑑 𝑐𝑎𝑝𝑎𝑐𝑖𝑡𝑦 𝑘𝑊 ∗ 8760𝑟𝑠/𝑦𝑟
2.5.2 Energy Output
Energy is defined as work done in a given time (joules)(Engineering Fundamentals,
2011). One form of energy is electricity which has its own set of units (kWhr) where
one kWhr is defined as 3600 joules or the electrical supply of 1kW for a period on 1
hour. By using the capacity factor, the estimated energy output can be
calculated𝐸𝑛𝑒𝑟𝑔𝑦 𝑘𝑊𝑟
𝑦𝑟 = 𝑃 𝑘𝑊 ∗ 𝐶𝑎𝑝𝑎𝑐𝑖𝑡𝑦 𝑓𝑎𝑐𝑡𝑜𝑟 ∗ 8760
2.5.3 Turbines
Turbines are classified under three main categories which also have two sub groups.
They are high head, medium head and low head machines. These categories are
based on the shape and design of the turbine. The two sub groups are Impulse and
Reaction turbines (School of Engineering, 2010).
Impulse turbines use the process of shooting water with a velocity at one specific
point on the propeller system (Hamil,2011). The waters velocity forces the blades to
rotate. This design of the turbine is the least complex and is commonly used for high
Hydroelectric Generators for Third World Countries 32
Mr Nicholas Burton Ree
head micro hydro-generation systems (U.S Department of Energy,2001). Types of
impulse turbines are:
Pelton Turbine consists of a wheel with split buckets around its rim to catch
the water jet.
Turgo Turbine which is similar to a Pelton wheel but the water is aimed at the
blades on an angle to help improve the minimum water needed to run the
system.
Cross flow turbine uses direction blades to ensure that the flow is efficiently
directed at the blades. The direction aids also allow the turbine to be hit twice
with water jets (U.S Department of Energy,2001).
Reaction Turbines use the oncoming water to generate hydraulic lift forces to create
rotation. Reaction turbines are highly efficient and rely greatly on pressure. Often
reaction turbines are used for large power generation sites. The distinguishable
difference between the reaction and the impulse is that the reaction encases the entire
propeller system in water. All reaction turbines also have a draft tube which is the
tube where the water is discharged. The draft tube also causes a pressure drop at the
discharge area resulting in an improved head and overall efficiency(U.S Department
of Energy,2001).
Types of Reaction turbines are:
Propeller based turbine which is similar to a ship‟s drive propeller but under
operation in reverse. This style of turbine varies and the design is known to
need a high flow rate to ensure the entire propeller is submerged.
Snail shell turbine directs the flow around the propellers and forces the water
to pass through the system. This design is also quite similar to the Kaplan
turbine.
Francis turbine forces the water to flow radially inwards to the centre of the
turbine and forcing the turbine to rotate to let the water discharge. Francis
turbines are mainly designed for low head situations (U.S Department of
Energy,2001).
Hydroelectric Generators for Third World Countries 33
Mr Nicholas Burton Ree
Small hydroelectric generators have certain advantages and disadvantages that
govern the practicality of the hydro system.
2.5.4 Efficiencies
The most significant way to compare turbines is by their relative efficiency. The
efficiency is the rating of what power is predicted to get out of a system
(Castronuovo, Peas Lopes,). In turbines the value of efficiency is effected by:
The flow rate
Head of the water
Size and design of the turbine
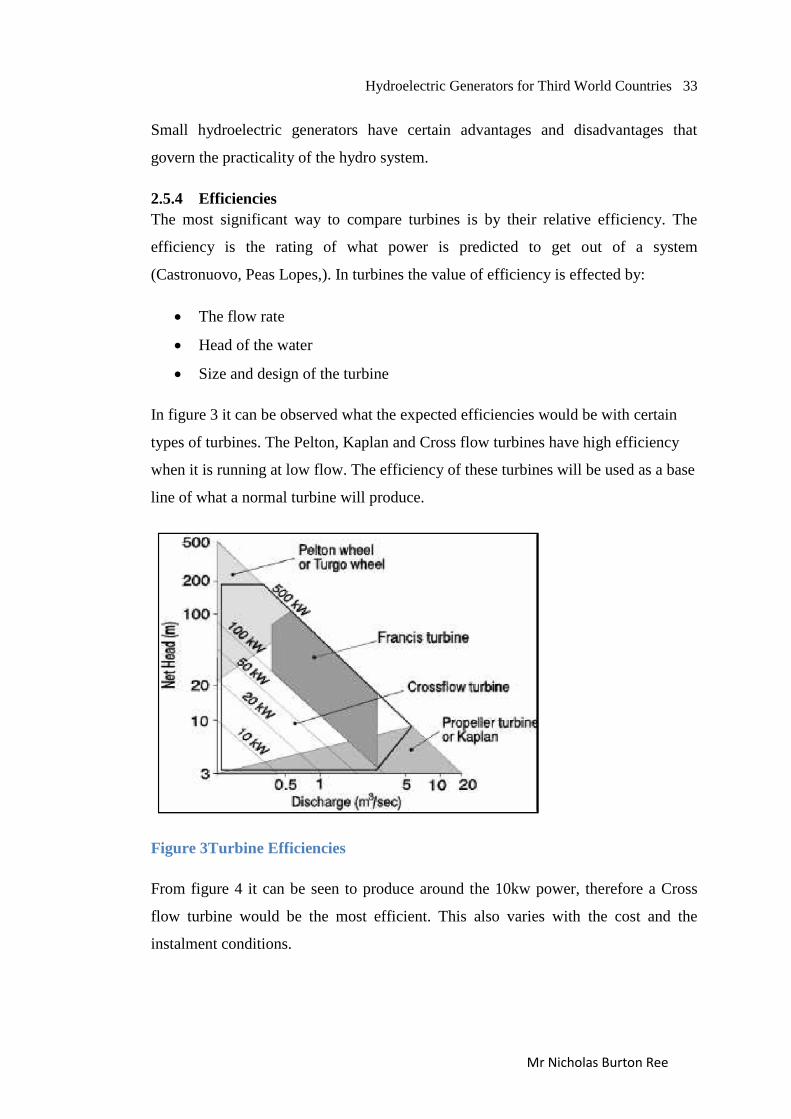
In figure 3 it can be observed what the expected efficiencies would be with certain
types of turbines. The Pelton, Kaplan and Cross flow turbines have high efficiency
when it is running at low flow. The efficiency of these turbines will be used as a base
line of what a normal turbine will produce.
Figure 3Turbine Efficiencies
From figure 4 it can be seen to produce around the 10kw power, therefore a Cross
flow turbine would be the most efficient. This also varies with the cost and the
instalment conditions.
Hydroelectric Generators for Third World Countries 34
Mr Nicholas Burton Ree
2.5.5 Economics
With small hydroelectric generation, high head is the most cost effective for projects.
High head means that a smaller volume of water is required to produce the given
power. It also means that a smaller turbine and overall equipment will be used
resulting in a lower cost. These conditions are often found where mountain ranges
and steep gullies are good locations to produce high head (U.S Department of
Energy,2001).
Due to the high capital costs of the generation system in today‟s economic system
(University of Moratuwa, 2002) a new hydro electric generator system can seem
expensive as it can take up to 15yrs before the capital costs can be written off. A
system that can last around 50yrs without reinstalment or much maintenance is quite
cost effective. However, with the short term quality and product life it is difficult to
ensure that the hydroelectric system will have a long running life.
Small hydroelectric generators are often close to the consumer and have more of an
effect on the consumer than a coal plant which could be located 200km‟s away
(Schwaiger,K. Pfaundler, M, 2011). As a result, the „local‟ benefits are influential to
the design and also the losses due to transmission lines are relatively low.
2.5.6 Sustainability and Ecological Impacts
It is important that the hydroelectric generation system when installed fits in with the
location and is not detrimental to the community of the environment. This is very
important as the most successful designs always look at the areas it will affect and
are created to suit the particular environment. Although producing and installing the
hydroelectric system can easily be carried out, the proper authorities must look at the
proposed project and deem it acceptable. In order to ensure this is done the
guidelines from previous hydropower projects have been reviewed.
The „Situation Report on Hydropower Generation in the Alpine Region Focusing on
Small Hydropower‟ (Schwaiger,K. Pfaundler, 2011) discussed the process of
proposing the idea to a society and ensuring the highest success rate for being
deemed acceptable by the authorities and community. The highlighted points in the
report were:
Hydroelectric Generators for Third World Countries 35
Mr Nicholas Burton Ree
Help Develop a common understanding on the topic hydropower.
Contribute to increase the efficiencies of the facilities and lessen their impact
on the aquatic environment and the landscape.
Support the competent authorities to help accelerate the approval time.
Help preserve river stretch.
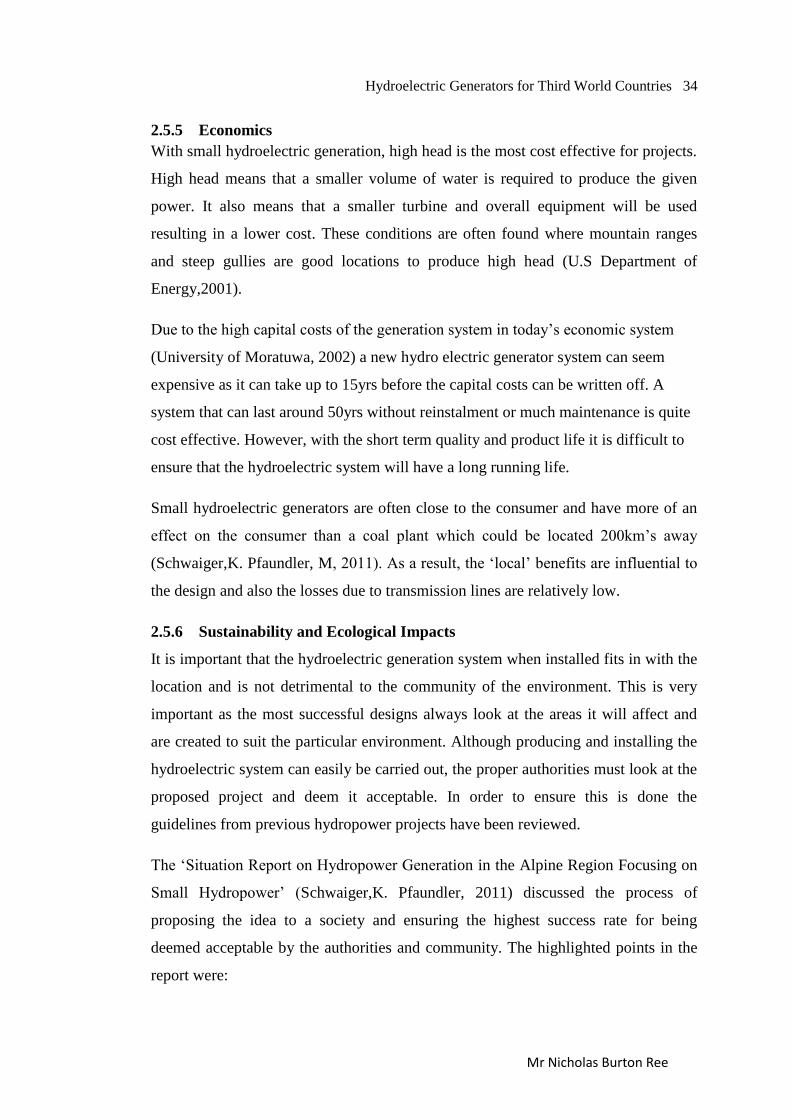
Strike a strong balance between economic requirements and ecological and
landscape needs whilst taking into accounts the social terms.
Figure 4Finding the Balance between Objectives
Figure 4 above (Situation Report on Hydropower Generation in the Alpine Region
Focusing on Small Hydropower, 2011) demonstrations the area where balance must
be found.
2.5.7 Social Benefits
Small hydro power stations have a large impact on the local region. Depending on
the location it may disrupt everyday life in installation and operation. In the chosen
location (PNG highlands) installation and operation would not affect the everyday
life as much as suburban areas, this would be due to the vast low populate rate
location. The system must also not contaminate water from the stream. The water
must still be usable for drinking, irrigation and for other uses (Schwaiger,K.
Pfaundler, 2011).

Hydroelectric Generators for Third World Countries 36
Mr Nicholas Burton Ree
2.5.8 Environmental Benefits
The most known benefit to the environment is the positive contribution to climate
change. The system produces renewable energy and has virtually no emissions. The
system must also not affect the landscape and wildlife. Papua New Guinea has a high
flooding rate and the system must be designed appropriately. The inlet catchment
area for the system must ensure that no downstream damage occurs (Schwaiger,K.
Pfaundler, 2011).
Although looking into the ecological and economic effects is not the ultimate goal
within the scope of this project, it must be noted that the design must abide by these
conditions to be deemed successful. The impact on the environment must always be
minimal. Once a system is installed the location must be in a better condition than
before the Hydro power was installed (Schwaiger,K. Pfaundler, 2011).
2.6 Pump as a Turbine (PAT)
PAT is the operation of a centrifugal pump being used as a turbine. A small pump as
a turbine can be more economical than traditional systems and therefore, when
operated in reverse, can have many advantages over the traditional turbine power
generation. By using a pump as a turbine costs can be decreased but at the same time,
there is the downfall of efficiency. For this concept to prove viable the advantages
must out way the losses (Williams, 1995).
Figure 5 illustrates a general visual of the differences with cost and efficiencies with
hydro turbines and a PAT.

Hydroelectric Generators for Third World Countries 37
Mr Nicholas Burton Ree
Figure 5Cost vs. Efficiency (Burton-Ree, 2013)
The change in the cost of the hydroelectric generation system must make the project
worthwhile. There are more factors that affect the overall analysis of the project.
These variables are discussed in more detail in chapter three.
The main focus of cost is on the pump as a turbine compared to a conventional
turbine because regardless of what system is chosen, the same piping, weir and pipe
inlet will be used.
Some of the advantages of PAT are:
A wide range of flows and heads available
Available standards and sizes
Easy Installation
Spare parts easy to source
Fast delivery time
One of the benefits of using a pump as a turbine is the direct drive instead of
a pulley system or gearing.
As a result further advantages are:
Lower Friction losses
Less material required
Increased bearing life
Low maintenance (no need to tighten belts etc.)
Hydroelectric Generators for Third World Countries 38
Mr Nicholas Burton Ree
A turbine that is designed for the specific location is fitted with a vane that allows the
machine to operate with a large variation of flow rates at a high efficiency. However,
when a centrifugal pump is used and run backwards, it is only suitable within a very
small range. The pump must be appropriately selected to ensure that it is operating
within its optimal efficiency rate. The mathematical relationship used in this
dissertation shows how to correctly select the right size pump to ensure it operates in
its best efficiency point (BEP) and as a result produces power efficiently (William,
1995).
Pumps have been used for many different operations for many years, but the first use
as a turbine is not known. It was not until Thoma and Kittredge (1931) were in the
process of evaluating the characteristics of pumps, did they accidentally learn that
pumps could very well be used as turbines. From this important discovery, it became
a strong interest to many manufacturers. The characteristics of how the pumps
operated had been under investigation.
Many different researches investigated the characteristics and predicted the
behaviour but only a few examined in detail what would occur. Some of the papers
that had been written on the research of pumps, as turbine operations include those,
written by Williams (1995), Alatrorre-Frank (1994), Chors(1997) and Paish(2002).
Although all of these papers proved to be very informative, they were showing an
inconsistency of results when they were compared to each other. One theory is the
difference is due to different pump designs tested. This was due mainly to the fact
that each test was completed on a different type and size of pump. To ensure the
validity of the papers, tests were conducted on a specific prototype. This is covered
in more detail in chapter four.
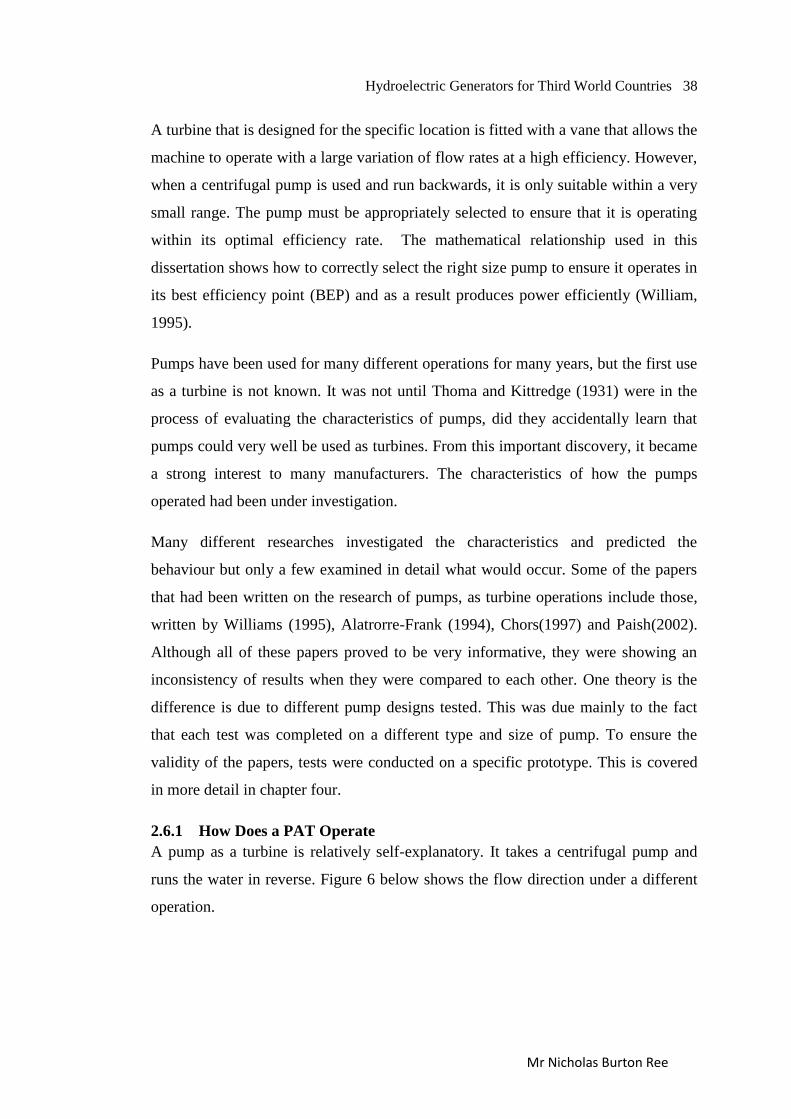
2.6.1 How Does a PAT Operate
A pump as a turbine is relatively self-explanatory. It takes a centrifugal pump and
runs the water in reverse. Figure 6 below shows the flow direction under a different
operation.
Hydroelectric Generators for Third World Countries 39
Mr Nicholas Burton Ree
Figure 6 PAT Operation (Burton-Ree, 2013)
The two different operations both rely on two different actions to cause rotation and
transferral of energy. When under normal operating conditions, the pumps use its
velocity to push the water to the outer casing using the centrifugal force. It then
allows the water to exit the casing via the outlet. During PAT operation, however it is
quite different. The water is shot in at the outlet and uses its kinetic energy to force
the impellor in a rotational manner. The centrifugal force actually disadvantages its
operation as a PAT. Furthermore, the water entering with a velocity, in fact wants to
stay on the outer casing due to the centrifugal phenomena. Only the increase in
pressure makes the water force its way to the centre.
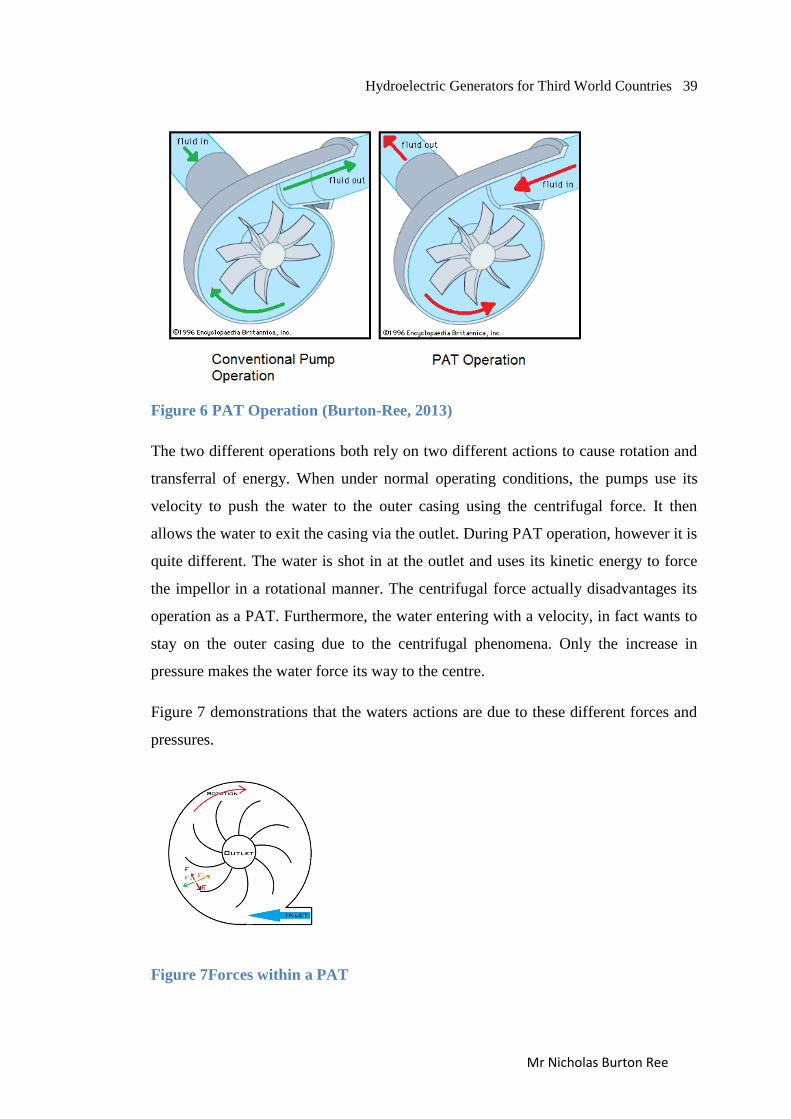
Figure 7 demonstrations that the waters actions are due to these different forces and
pressures.
Figure 7Forces within a PAT
Hydroelectric Generators for Third World Countries 40
Mr Nicholas Burton Ree
It can be seen in figure 7 that in order for the system to work and rotate the impellor,
the following statement must be satisfied.
Equation 1
𝐹1 + 𝐹𝑃 > 𝐹𝑐 + 𝐹2
Equation one states that the forces caused by the pressure build up on the edge of the
casing, must be greater that the centrifugal force and the force caused by the mass of
water flowing into the pump must cause 𝐹1 to be greater than𝐹2 . This is only the very
basic concept of what occurs is a centrifugal pump as a turbine. Turbulence within
the pump causes many more in balances.
2.6.2 Cavitation
Cavitation is the process of the formation of water vapours forming in the liquid due
to the change of pressures (Hamil, 2011). These phenomena results in small bubbles
of vapour forming that gradually get bigger in the system. The problem is when these
large air bubbles are introduced to an increased pressure and as a result the bubbles
implode under the pressures. The implosion results in extremely high velocities of
water trying to fill the void that had been created by the implosion. These velocities
and pressure changes can result in damage to the pump casing and impellor (Hamil,
2011).
To minimise cavitation:
A generously sized inlet pipe is to be used to minimise velocity.
Minimise turbulence at the inlet of the pump.
Use an impellor material that is resistant to cavitation.
2.6.3 Who has done this before
There are currently no documented PAT systems that have available data about them.
However, there has been testing and research completed on the characteristics.
Pumps as turbines have been tested and analysed by multiple manufacturers and
engineers over the years and as a result, it was noticeable that the pumps quality and
performance had increased greatly. It was found that the practicality in using a pump
as a turbine in 2013,is much greater than 20 years ago (Rawal and Kshirsager,
Hydroelectric Generators for Third World Countries 41
Mr Nicholas Burton Ree
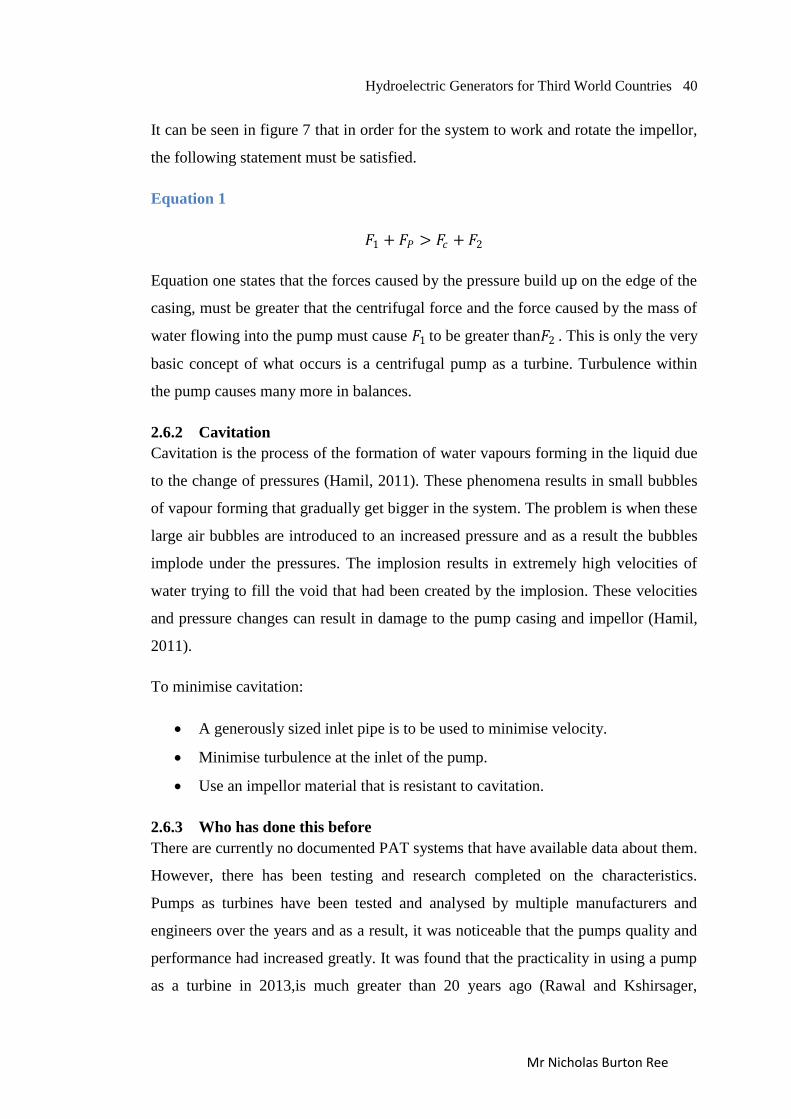
2007).The higher the operating speed the better the pump will operate as a turbine.
Figure 9 displays the PAT‟s performance for specific speeds.
Figure 8Performance for Specific Speeds
It can be seen from figure 8 that it if the head remains the same, it takes a large
increase in discharge to reach the increased rpm and vice versa. Currently pumps are
built extremely well and have less mechanical resistance, thus allowing a high rpm to
be reached. This means that the latest pumps can be acquired and the PAT generation
will operate at its best possible efficiency (Rawal and Kshirsager, 2007).
2.7 Mathematical Relationship
2.7.1 Understanding pump performance curves
Before analysing a pump as a turbine, an understanding must first be gained of a
pump‟s normal performance. When examining a pump, as the flow is increased the
head produced decreases (Cotton CRC Water Team, 2008). This phenomena means
that a relationship can be found between flow rate and head produced. With this
relationship a best efficiency point can be found where the greatest flow delivery at
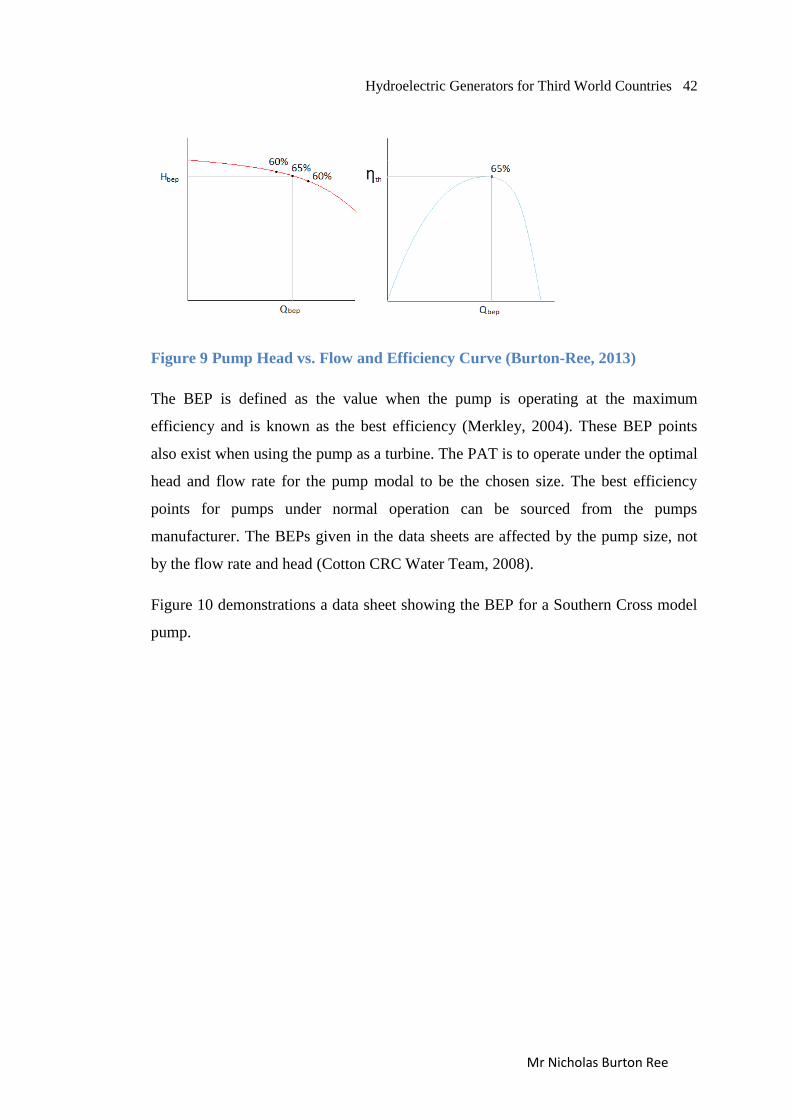
the greatest head can be found (Merkley, 2004).
Below figure 9 shows the plotted relationship between flow and head and also how
efficiency is shown.
Hydroelectric Generators for Third World Countries 42
Mr Nicholas Burton Ree
Figure 9 Pump Head vs. Flow and Efficiency Curve (Burton-Ree, 2013)
The BEP is defined as the value when the pump is operating at the maximum
efficiency and is known as the best efficiency (Merkley, 2004). These BEP points
also exist when using the pump as a turbine. The PAT is to operate under the optimal
head and flow rate for the pump modal to be the chosen size. The best efficiency
points for pumps under normal operation can be sourced from the pumps
manufacturer. The BEPs given in the data sheets are affected by the pump size, not
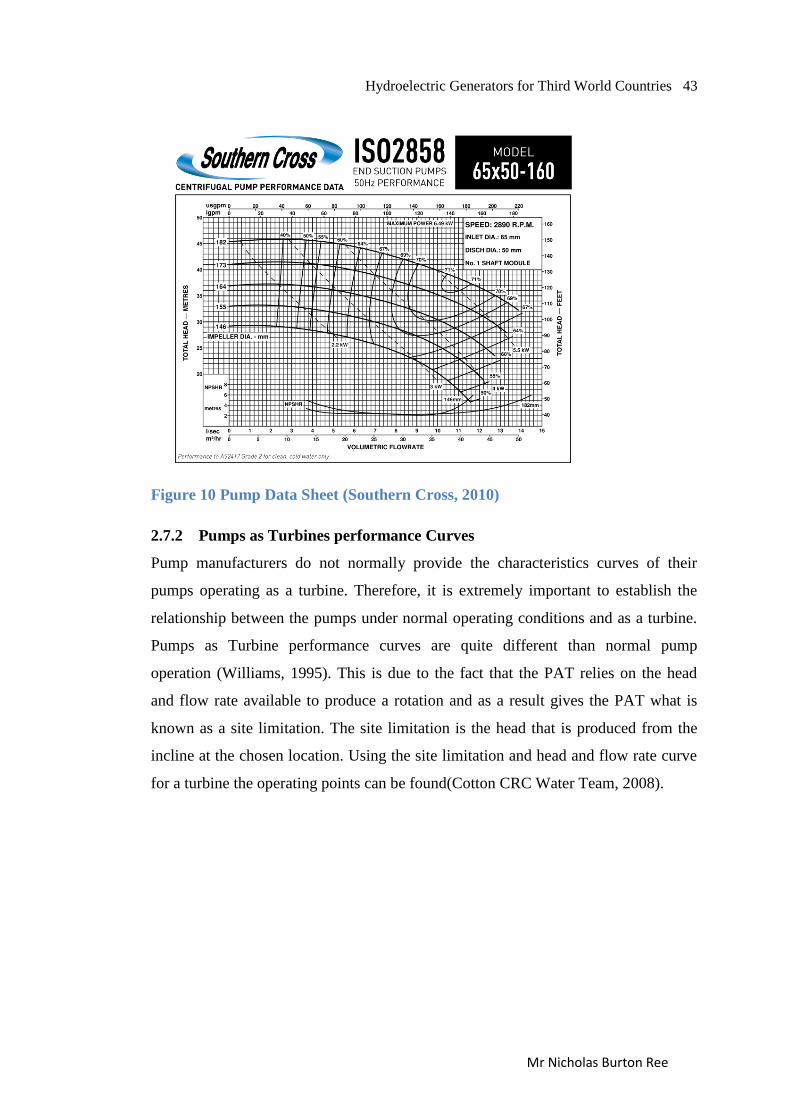
by the flow rate and head (Cotton CRC Water Team, 2008).
Figure 10 demonstrations a data sheet showing the BEP for a Southern Cross model
pump.
Hydroelectric Generators for Third World Countries 43
Mr Nicholas Burton Ree
Figure 10 Pump Data Sheet (Southern Cross, 2010)
2.7.2 Pumps as Turbines performance Curves
Pump manufacturers do not normally provide the characteristics curves of their
pumps operating as a turbine. Therefore, it is extremely important to establish the
relationship between the pumps under normal operating conditions and as a turbine.
Pumps as Turbine performance curves are quite different than normal pump
operation (Williams, 1995). This is due to the fact that the PAT relies on the head
and flow rate available to produce a rotation and as a result gives the PAT what is
known as a site limitation. The site limitation is the head that is produced from the
incline at the chosen location. Using the site limitation and head and flow rate curve
for a turbine the operating points can be found(Cotton CRC Water Team, 2008).
Hydroelectric Generators for Third World Countries 44
Mr Nicholas Burton Ree
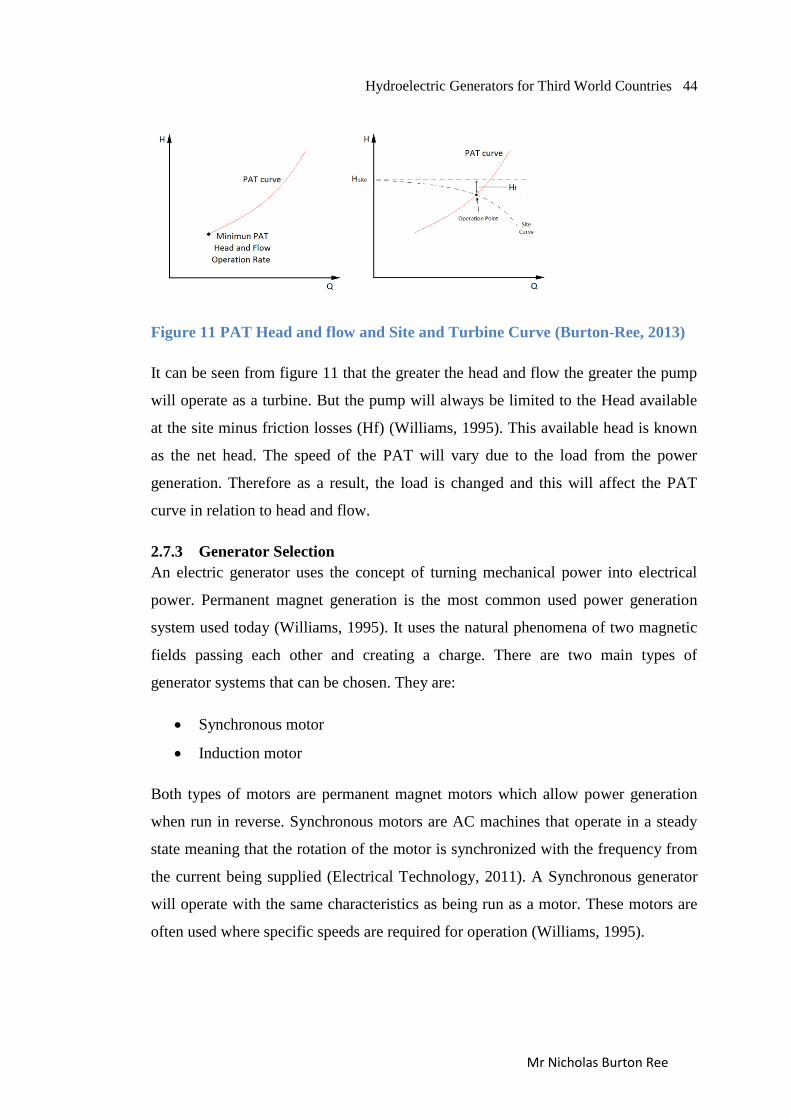
Figure 11 PAT Head and flow and Site and Turbine Curve (Burton-Ree, 2013)
It can be seen from figure 11 that the greater the head and flow the greater the pump
will operate as a turbine. But the pump will always be limited to the Head available
at the site minus friction losses (Hf) (Williams, 1995). This available head is known
as the net head. The speed of the PAT will vary due to the load from the power
generation. Therefore as a result, the load is changed and this will affect the PAT
curve in relation to head and flow.
2.7.3 Generator Selection
An electric generator uses the concept of turning mechanical power into electrical
power. Permanent magnet generation is the most common used power generation
system used today (Williams, 1995). It uses the natural phenomena of two magnetic
fields passing each other and creating a charge. There are two main types of
generator systems that can be chosen. They are:
Synchronous motor
Induction motor
Both types of motors are permanent magnet motors which allow power generation
when run in reverse. Synchronous motors are AC machines that operate in a steady
state meaning that the rotation of the motor is synchronized with the frequency from
the current being supplied (Electrical Technology, 2011). A Synchronous generator
will operate with the same characteristics as being run as a motor. These motors are
often used where specific speeds are required for operation (Williams, 1995).
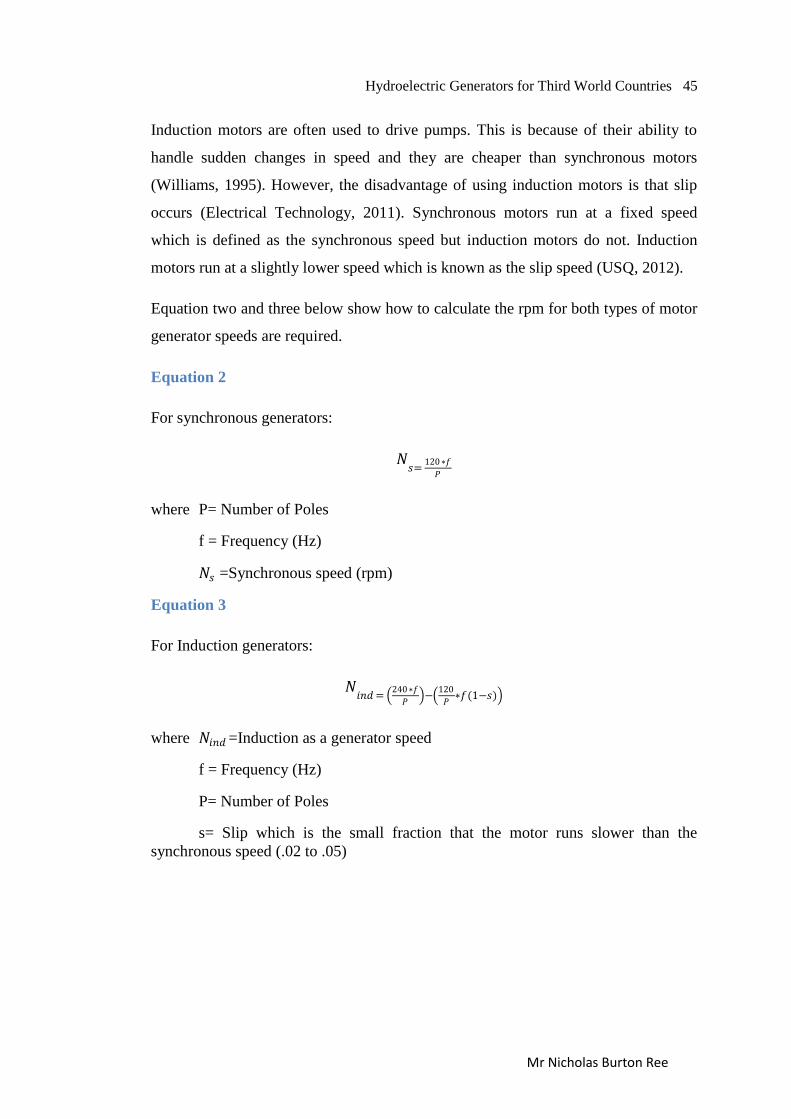
Hydroelectric Generators for Third World Countries 45
Mr Nicholas Burton Ree
Induction motors are often used to drive pumps. This is because of their ability to
handle sudden changes in speed and they are cheaper than synchronous motors
(Williams, 1995). However, the disadvantage of using induction motors is that slip
occurs (Electrical Technology, 2011). Synchronous motors run at a fixed speed
which is defined as the synchronous speed but induction motors do not. Induction
motors run at a slightly lower speed which is known as the slip speed (USQ, 2012).
Equation two and three below show how to calculate the rpm for both types of motor
generator speeds are required.
Equation 2
For synchronous generators:
𝑁𝑠=
120∗𝑓
𝑃
where P= Number of Poles
f = Frequency (Hz)
𝑁𝑠 =Synchronous speed (rpm)
Equation 3
For Induction generators:
𝑁𝑖𝑛𝑑=
240∗𝑓
𝑃 −
120
𝑃∗𝑓(1−𝑠)
where 𝑁𝑖𝑛𝑑 =Induction as a generator speed
f = Frequency (Hz)
P= Number of Poles
s= Slip which is the small fraction that the motor runs slower than the
synchronous speed (.02 to .05)
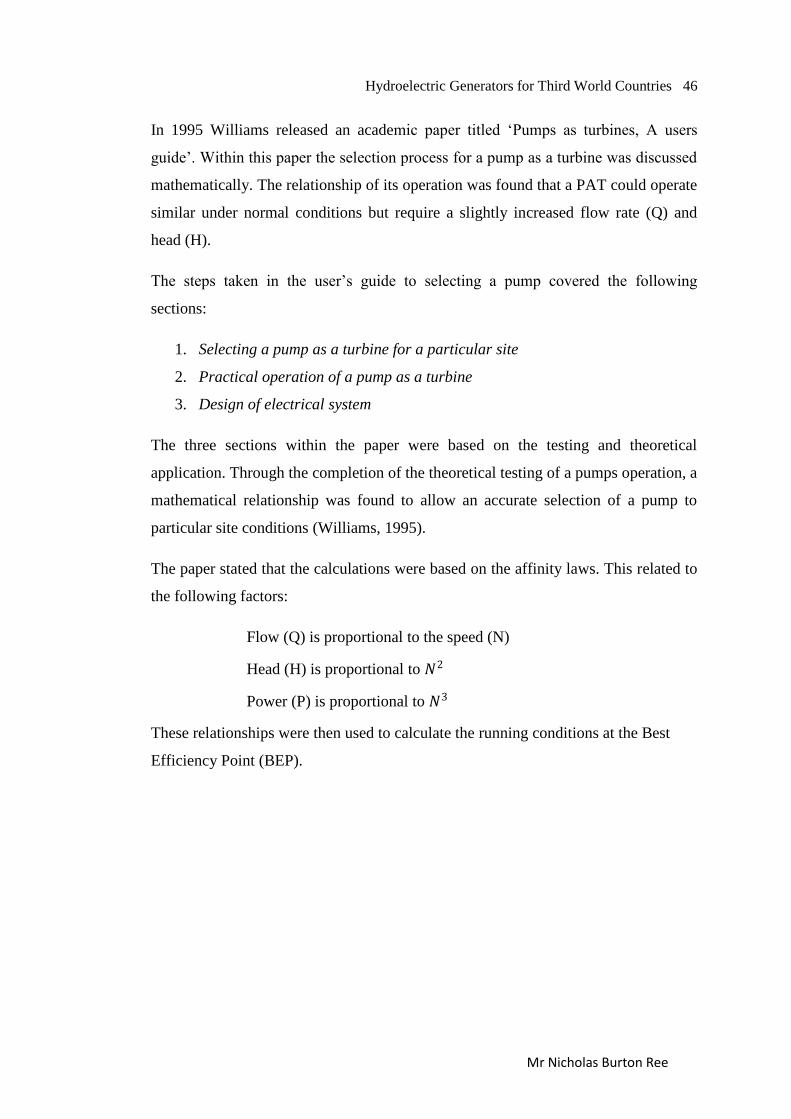
Hydroelectric Generators for Third World Countries 46
Mr Nicholas Burton Ree
In 1995 Williams released an academic paper titled „Pumps as turbines, A users
guide‟. Within this paper the selection process for a pump as a turbine was discussed
mathematically. The relationship of its operation was found that a PAT could operate
similar under normal conditions but require a slightly increased flow rate (Q) and
head (H).
The steps taken in the user‟s guide to selecting a pump covered the following
sections:
1. Selecting a pump as a turbine for a particular site
2. Practical operation of a pump as a turbine
3. Design of electrical system
The three sections within the paper were based on the testing and theoretical
application. Through the completion of the theoretical testing of a pumps operation, a
mathematical relationship was found to allow an accurate selection of a pump to
particular site conditions (Williams, 1995).
The paper stated that the calculations were based on the affinity laws. This related to
the following factors:
Flow (Q) is proportional to the speed (N)
Head (H) is proportional to 𝑁2
Power (P) is proportional to 𝑁3
These relationships were then used to calculate the running conditions at the Best
Efficiency Point (BEP).
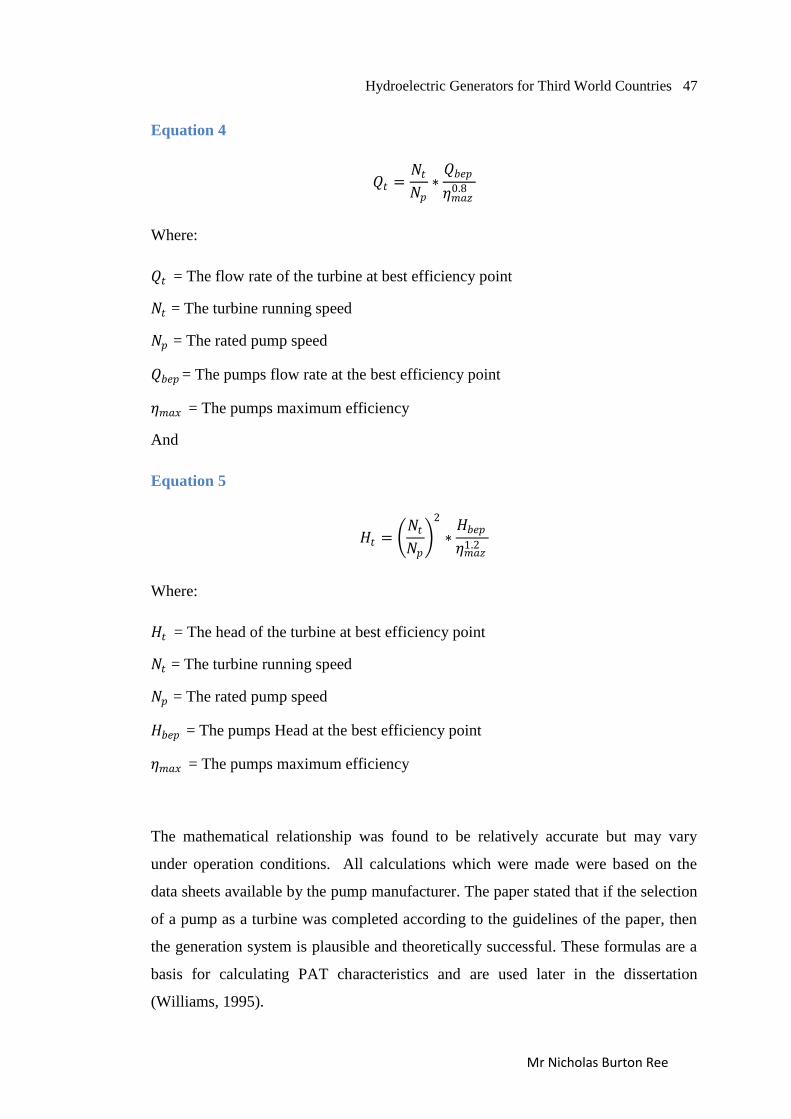
Hydroelectric Generators for Third World Countries 47
Mr Nicholas Burton Ree
Equation 4
𝑄𝑡 =𝑁𝑡𝑁𝑝
∗𝑄𝑏𝑒𝑝
𝜂𝑚𝑎𝑧0.8
Where:
𝑄𝑡 = The flow rate of the turbine at best efficiency point
𝑁𝑡 = The turbine running speed
𝑁𝑝 = The rated pump speed
𝑄𝑏𝑒𝑝 = The pumps flow rate at the best efficiency point
𝜂𝑚𝑎𝑥 = The pumps maximum efficiency
And
Equation 5
𝐻𝑡 = 𝑁𝑡𝑁𝑝
2
∗𝐻𝑏𝑒𝑝
𝜂𝑚𝑎𝑧1.2
Where:
𝐻𝑡 = The head of the turbine at best efficiency point
𝑁𝑡 = The turbine running speed
𝑁𝑝 = The rated pump speed
𝐻𝑏𝑒𝑝 = The pumps Head at the best efficiency point
𝜂𝑚𝑎𝑥 = The pumps maximum efficiency
The mathematical relationship was found to be relatively accurate but may vary
under operation conditions. All calculations which were made were based on the
data sheets available by the pump manufacturer. The paper stated that if the selection
of a pump as a turbine was completed according to the guidelines of the paper, then
the generation system is plausible and theoretically successful. These formulas are a
basis for calculating PAT characteristics and are used later in the dissertation
(Williams, 1995).
Hydroelectric Generators for Third World Countries 48
Mr Nicholas Burton Ree
When ensuring accuracy of mathematical relationships within papers it was noted
that each source had completed an experimental verification. To ensure accurate
results were maintained within this dissertation an experimental test was completed.
2.7.4 Experimental Setup
An accurate experimental setup of a centrifugal pump as a turbine test was completed
in 2007 by Derakhshan and Nourbakhsh. Their test procedure as seen in Figure 12
was to simulate a flow rate and head by using a normal operational pump and
circulating water through a centrifugal pump in reverse and collecting data.
Figure 12Test Experiment (Derakhshan, Anourbakhsh, 2007)
The experiment was completed at multiple speeds (750, 1000, 1500, 3000 rpm) and
many dimensionless data points were plotted with the recorded data. The experiment
proved successful and showed that low specific speed centrifugal pumps operated at
different rpm without any mechanical problems. This meant that smaller size pumps
could operate with a large variety of head and flow rates (Derakhshan, Anourbakhsh,
2007).

Hydroelectric Generators for Third World Countries 49
Mr Nicholas Burton Ree
Figure 13Dimensionless BEP of tested PATs (Derakhshan, Anourbakhsh, 2007)
Figure 13 shows the dimensionless results plotted variables with the specific speed.
The results confirm that the application of a PAT is possible and that there are many
varying conditions that affect the Best efficiency point of a turbine (Derakhshan,
Anourbakhsh, 2007). To verify the finding of this dissertation and to support the
mathematics used for the results an experiment has been conducted with a prototype
centrifugal pump. More detail of the prototype is in chapter four.
Chapter three explains the methodologies, timelines and resources for the
dissertation. Two major components were followed: appropriate project research and
theoretical analysis, together with physical testing and practical implementation.
Hydroelectric Generators for Third World Countries 50
Mr Nicholas Burton Ree
Chapter 3
3.1 Methodologies, Timelines and Resources
To complete this dissertation to an appropriate professional level, resources,
deadlines and ways of methodology must be defined. By doing so, it will ensure that
each component within this dissertation is completed with appropriate time and
attention. It will also ensure that no time was wasted on topics that could be seen as
irrelevant or outside of the required scope of this project. Important components or
milestones of the topic will be analysed and time restrictions was set accordingly.
Hence, a plan of action must always be devised in case of tasks not being completed
on time due to unforseen conditions that could hinder the progress. Refer to chapter
one and appendix E to review resources required and deadlines set.
3.1.1 Methodology
Methodology is the way in which the project is be undertaken and what steps will be
required. By understanding methodology and strategy a plan of action can be created
and executed. This allows progress to be taken in the project and still be able to see if
the required work is remaining within the scope that was set out in the project aim.
Within this project there are two major components:
1. Appropriate project research and theoretical analysis.
2. Physical testing and practical implementation.
Hence, by following the two major components, it minimises the risk of a lack of
understanding within the dissertation and as a result improves the quality of the
dissertation. The following outlines the method for the project
3.1.2 Research
Previous literature and methods that have been sourced must be researched and
analysed. By doing so, this will help ensure that any future progress has not already
been completed or is irrelevant. Research also will give a better understanding of the
project and as a result will improve the analysed approach and will result in a better
dissertation. Broad and specific researching must be used. This approach of research
into the topic will make the dissertation more accurate and professional. The
research and literature review can be found in chapter two.
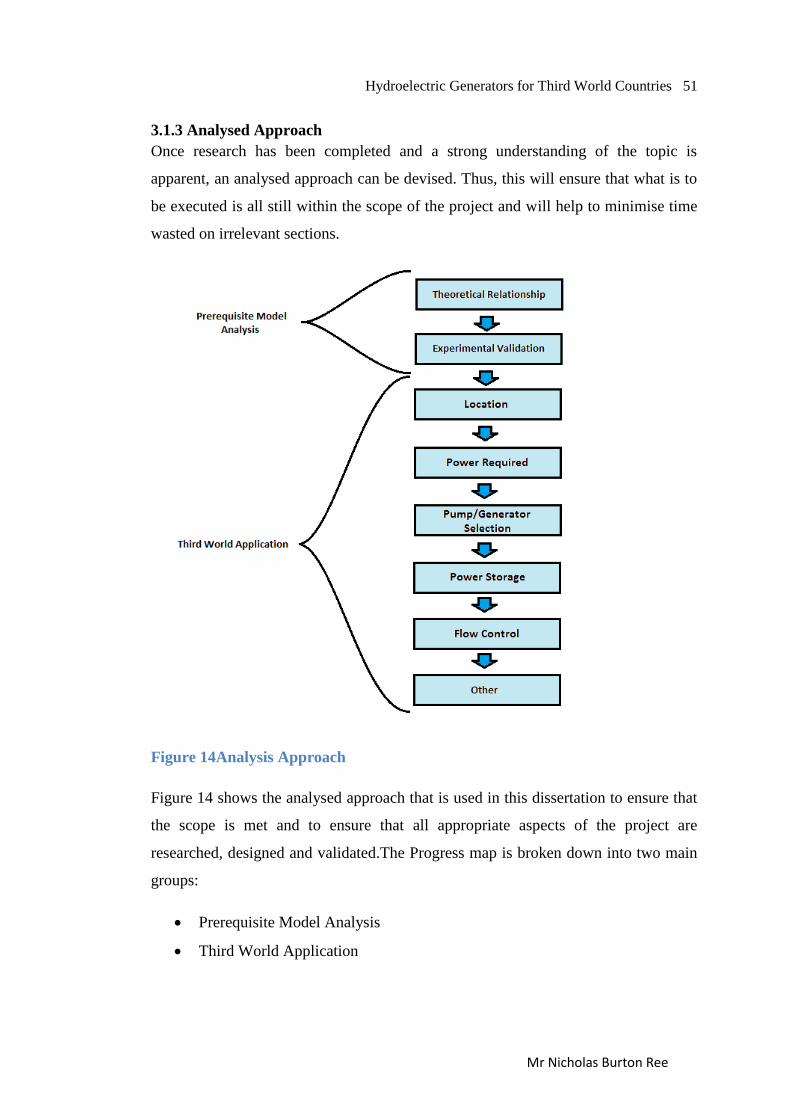
Hydroelectric Generators for Third World Countries 51
Mr Nicholas Burton Ree
3.1.3 Analysed Approach
Once research has been completed and a strong understanding of the topic is
apparent, an analysed approach can be devised. Thus, this will ensure that what is to
be executed is all still within the scope of the project and will help to minimise time
wasted on irrelevant sections.
Figure 14Analysis Approach
Figure 14 shows the analysed approach that is used in this dissertation to ensure that
the scope is met and to ensure that all appropriate aspects of the project are
researched, designed and validated.The Progress map is broken down into two main
groups:
Prerequisite Model Analysis
Third World Application
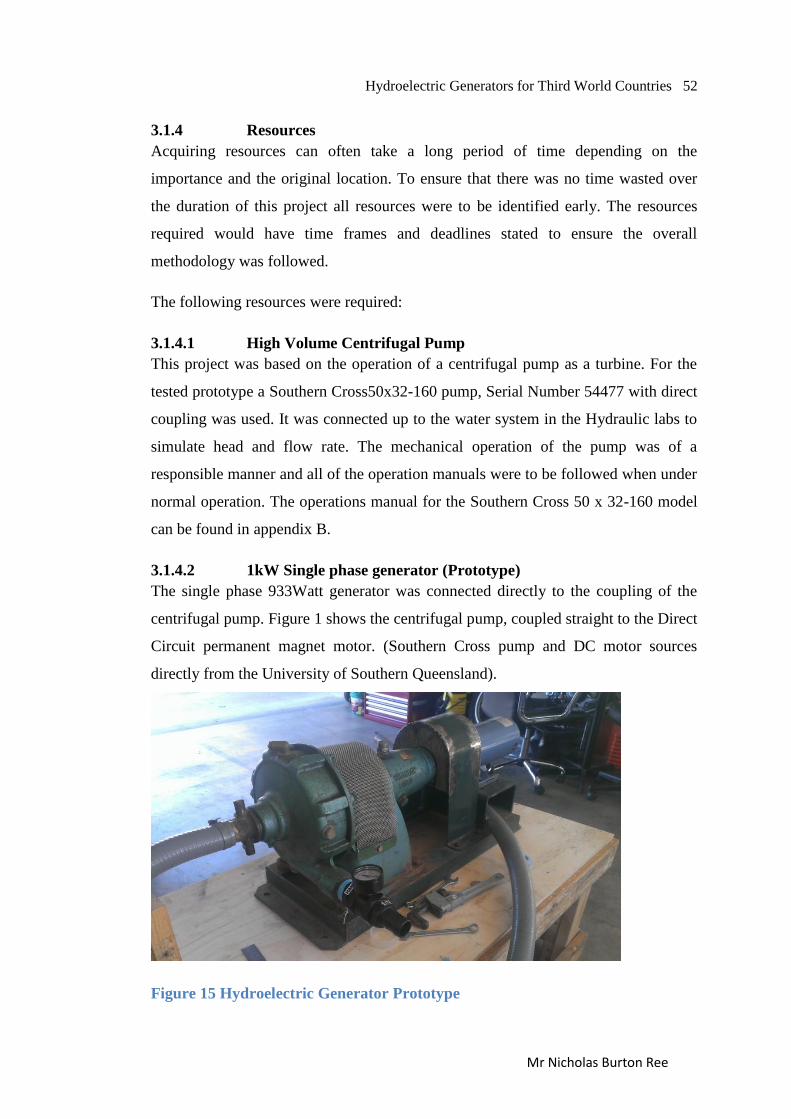
Hydroelectric Generators for Third World Countries 52
Mr Nicholas Burton Ree
3.1.4 Resources
Acquiring resources can often take a long period of time depending on the
importance and the original location. To ensure that there was no time wasted over
the duration of this project all resources were to be identified early. The resources
required would have time frames and deadlines stated to ensure the overall
methodology was followed.
The following resources were required:
3.1.4.1 High Volume Centrifugal Pump
This project was based on the operation of a centrifugal pump as a turbine. For the
tested prototype a Southern Cross50x32-160 pump, Serial Number 54477 with direct
coupling was used. It was connected up to the water system in the Hydraulic labs to
simulate head and flow rate. The mechanical operation of the pump was of a
responsible manner and all of the operation manuals were to be followed when under
normal operation. The operations manual for the Southern Cross 50 x 32-160 model
can be found in appendix B.
3.1.4.2 1kW Single phase generator (Prototype)
The single phase 933Watt generator was connected directly to the coupling of the
centrifugal pump. Figure 1 shows the centrifugal pump, coupled straight to the Direct
Circuit permanent magnet motor. (Southern Cross pump and DC motor sources
directly from the University of Southern Queensland).
Figure 15 Hydroelectric Generator Prototype
Hydroelectric Generators for Third World Countries 53
Mr Nicholas Burton Ree
3.1.4.3 Access to the Hydraulic Labs
The Hydraulic labs located on the NE end of z Block at USQ Toowoomba, was
needed to complete testing of the PAT generator system. Access to this resource also
included operation of the 15m head tanks and equipment contained in the lab.
Appropriate risk assessments for the laboratory use were completed and they can be
found in appendix D.
3.1.4.4 Piping and connections (Flanges)
To connect the PAT to the pumping system located in the lab the correct connection
was required. The centrifugal pump should have been able to be connected up to the
lab system and have sufficient flow. All plumbing were sourced externally to ensure
quality under operation.
3.1.4.5 Flow and Torque Meters
To record all findings in detail, the flow of the water at all times should have been
able to be recorded. To measure the rotational energy of the centrifugal pumps a
torque meter may have been required. It is possible to calculate the torque using
calculation but to avoid human error a meter is preferred.
3.1.5 Prerequisite Model Analysis
Prerequisite Model Analysis contains the theoretical relationship and the
experimental validation. This section of the dissertation is to be completed before
any application to the site could be made. Consequently, this ensures that applied
analysis of the site is based on validate mathematical relationships.
3.1.5.1 Theoretical Relationship
The modified mathematical relationships from chapter two must be analysed and
applied to the PAT application. Any modifications made to the calculations are noted
and justified.
3.1.5.2 Experimental Validation
Before the mathematics could be applied to the site in Papua New Guinea, it must
first be validated and the errors must be plotted. This ensures that the results of the
project are based on validated evidence. As a result, this improves the accuracy and
overall quality of the dissertation.
Hydroelectric Generators for Third World Countries 54
Mr Nicholas Burton Ree
3.1.6 Third World Application
Once the mathematical background is deemed acceptable, it then can be applied to
the site in Papua New Guinea. By following the structure, it ensures that the work
applied is completed efficiently and that no sections of the hydroelectric system are
missed.
3.1.6.1 Location
This section looks into the specifics of the particular location. The available
resources, terrain, population and environmental conditions are looked at in great
depth.All environmental conditions must be analysed for the particular location and
the hydro electric generator must be designed accordingly. This gives the design of
the PAT a base condition and a limitation to operate under. The pump as a turbine
must always meet the requirement of the location.
3.1.6.2 Power Required
The power requirement for the small hospital room must be specified. The equipment
to be powered and its use must be justified. All equipment must be up to date and be
expected to be found in such locations. This section also takes into consideration the
transport of the power to specific locations and its losses.
3.1.6.3 Pump and Generator Selection
This section is of extreme importance for the dissertation. If the mathematical
relationship is not accurate and not completed in a professional manner, then the
whole basis of the dissertation will be incorrect. In order to produce to specific power
requirements, an appropriate generator and pump must be used. A cost effective and
efficient relationship between the two components must be found. In this section,
three main components will be analysed and a justified relationship will be found.
1. Pump as a turbine relationship (PAT)
2. Power Generation and power produced from the flowing water
3. Cost/power production efficiency
3.1.6.4 Power Storage
This section of the design examines whether the power produced needs to be stored
to meet peak power use or if it can operate under the maximum load at all times. It
also investigates if the power produced needs to be converted from AC to DC. This

Hydroelectric Generators for Third World Countries 55
Mr Nicholas Burton Ree
will be based on generator selection which is also covered in this section. An
automatic voltage regulator system will also be studied in more detail. The power
storage and output must allow operation of regular appliances. Furthermore, an
automated power regulation component will also accommodate for operation error.
3.1.6.5 Flow Control
In order to control the power generation the simplest way is to control the flow.
Where the control system is put in place and how it is controlled will be discussed in
more detail. All head losses must be accounted for.
3.1.6.6 Other
This section allows room for any unexpected areas of interest. By doing so the
methodology does not limit the project to one specific analysis. It also contains the
piping analysis for the project.
Hydroelectric Generators for Third World Countries 56
Mr Nicholas Burton Ree
3.2 Analytical and Experimental Analysis
Before the system can be designed, the mathematical relationship between a
centrifugal pump operating under normal conditions and as a turbine must be found
and analysed. When a centrifugal pump is run backwards it operates at a lower
efficiency and as a result lowers the power production capability. This percentage is
to be calculated and applied mathematically to the specific pumps chosen.
Therefore, the mathematical relationship must be validated to prove accurate in order
to be used for the project‟s scope.
To validate the theoretical calculations made, an experiment was conducted on a
hydroelectric generator using a centrifugal pump as a turbine. The generator system
was built specifically for the purpose of this experiment only. The power production
under the head and flow rate was not the specific scope of the experiment but the
rpm, torque, flow rate and head were closely monitored and compared to the
theoretical calculations. This is discussed in great detail in chapter four.
3.2.1 Selecting the PAT
As an understanding of the performance curves for pumps as turbines is
comprehended, the mathematical relationship can now be analysed showing how to
select the appropriate pump model to operate as a turbine.
When selecting the site, it is limited to a particular head and flow rate and often the
minimal value would be selected, for example, the minimal flow rate throughout the
entire year. By doing so, the designed hydro electric generator would operate at its
maximum efficiency annually. This section examines the calculations required to
select the best pump to operate under the particular conditions
The calculations can give the running conditions in terms of head and flow. They
also show how to plot the efficiency of a PAT when the running conditions change
and how the torque from the load can affect the operating capabilities of the
generator. Thus, all of these factors must be taken into consideration when selecting
the appropriate pump model.
Chapter four investigates the mathematical and experimental aspects of using a
centrifugal pump as a turbine.
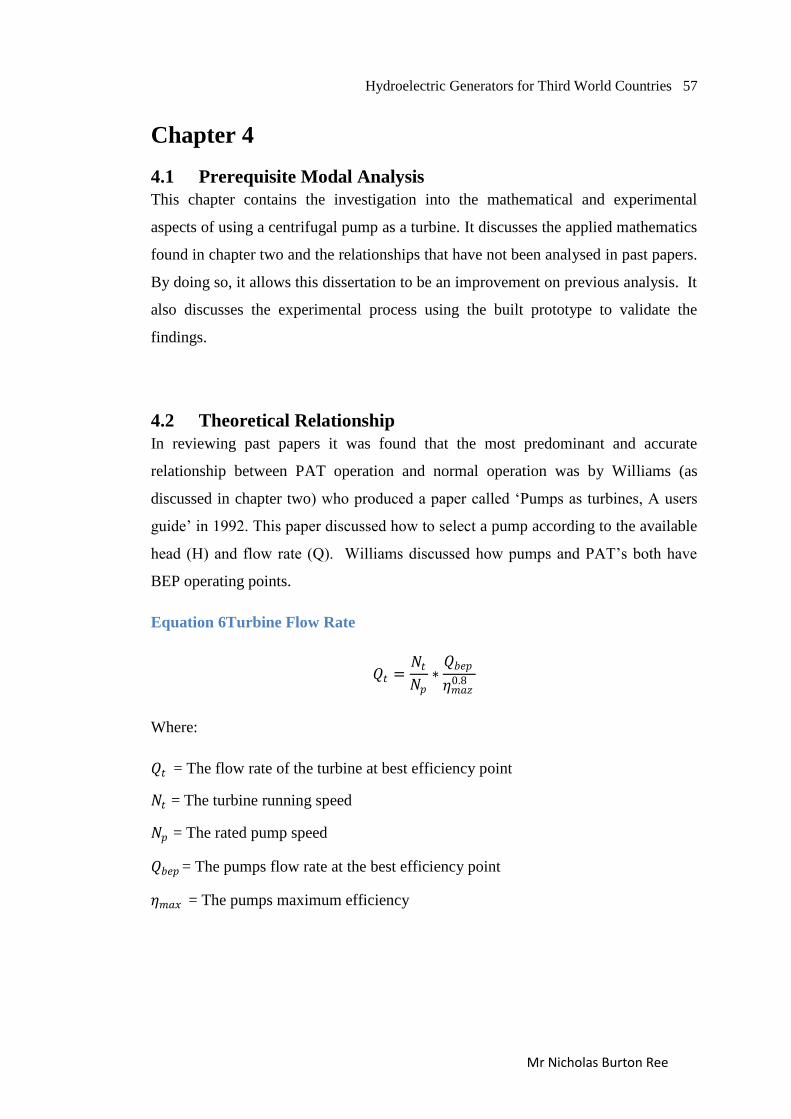
Hydroelectric Generators for Third World Countries 57
Mr Nicholas Burton Ree
Chapter 4
4.1 Prerequisite Modal Analysis
This chapter contains the investigation into the mathematical and experimental
aspects of using a centrifugal pump as a turbine. It discusses the applied mathematics
found in chapter two and the relationships that have not been analysed in past papers.
By doing so, it allows this dissertation to be an improvement on previous analysis. It
also discusses the experimental process using the built prototype to validate the
findings.
4.2 Theoretical Relationship
In reviewing past papers it was found that the most predominant and accurate
relationship between PAT operation and normal operation was by Williams (as
discussed in chapter two) who produced a paper called „Pumps as turbines, A users
guide‟ in 1992. This paper discussed how to select a pump according to the available
head (H) and flow rate (Q). Williams discussed how pumps and PAT‟s both have
BEP operating points.
Equation 6Turbine Flow Rate
𝑄𝑡 =𝑁𝑡𝑁𝑝
∗𝑄𝑏𝑒𝑝
𝜂𝑚𝑎𝑧0.8
Where:
𝑄𝑡 = The flow rate of the turbine at best efficiency point
𝑁𝑡 = The turbine running speed
𝑁𝑝 = The rated pump speed
𝑄𝑏𝑒𝑝 = The pumps flow rate at the best efficiency point
𝜂𝑚𝑎𝑥 = The pumps maximum efficiency
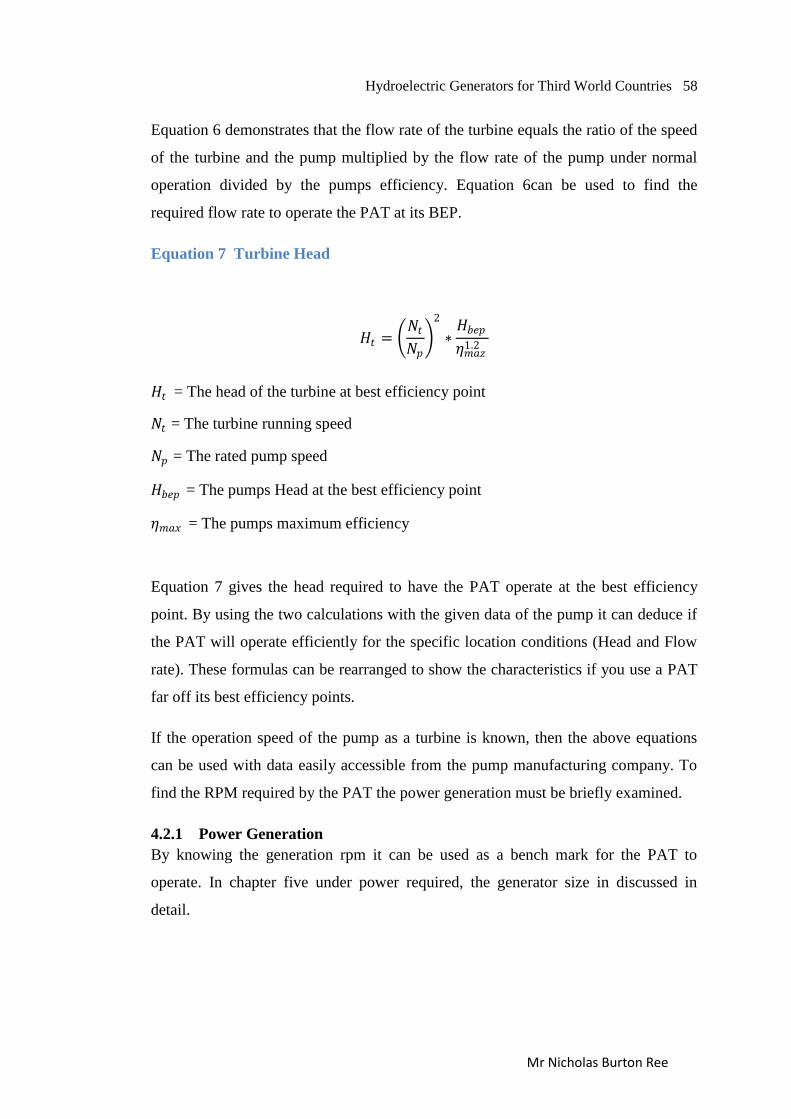
Hydroelectric Generators for Third World Countries 58
Mr Nicholas Burton Ree
Equation 6 demonstrates that the flow rate of the turbine equals the ratio of the speed
of the turbine and the pump multiplied by the flow rate of the pump under normal
operation divided by the pumps efficiency. Equation 6can be used to find the
required flow rate to operate the PAT at its BEP.
Equation 7 Turbine Head
𝐻𝑡 = 𝑁𝑡𝑁𝑝
2
∗𝐻𝑏𝑒𝑝
𝜂𝑚𝑎𝑧1.2
𝐻𝑡 = The head of the turbine at best efficiency point
𝑁𝑡 = The turbine running speed
𝑁𝑝 = The rated pump speed
𝐻𝑏𝑒𝑝 = The pumps Head at the best efficiency point
𝜂𝑚𝑎𝑥 = The pumps maximum efficiency
Equation 7 gives the head required to have the PAT operate at the best efficiency
point. By using the two calculations with the given data of the pump it can deduce if
the PAT will operate efficiently for the specific location conditions (Head and Flow
rate). These formulas can be rearranged to show the characteristics if you use a PAT
far off its best efficiency points.
If the operation speed of the pump as a turbine is known, then the above equations
can be used with data easily accessible from the pump manufacturing company. To
find the RPM required by the PAT the power generation must be briefly examined.
4.2.1 Power Generation
By knowing the generation rpm it can be used as a bench mark for the PAT to
operate. In chapter five under power required, the generator size in discussed in
detail.
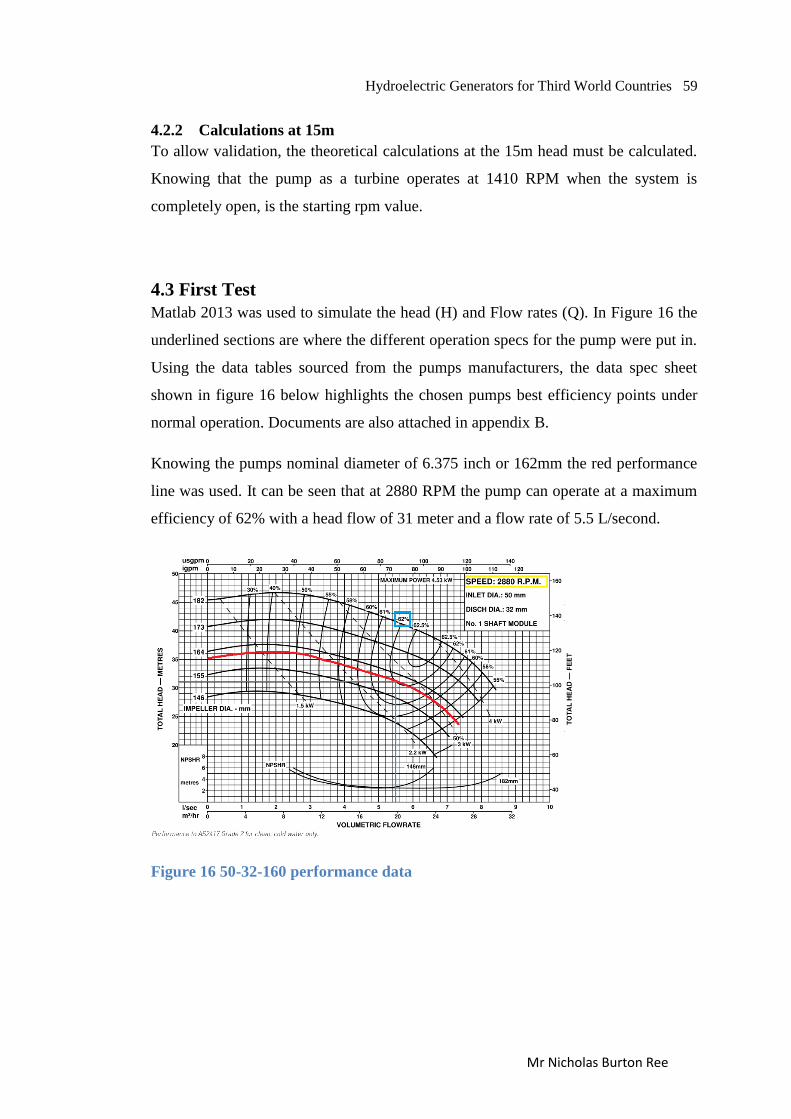
Hydroelectric Generators for Third World Countries 59
Mr Nicholas Burton Ree
4.2.2 Calculations at 15m
To allow validation, the theoretical calculations at the 15m head must be calculated.
Knowing that the pump as a turbine operates at 1410 RPM when the system is
completely open, is the starting rpm value.
4.3 First Test
Matlab 2013 was used to simulate the head (H) and Flow rates (Q). In Figure 16 the
underlined sections are where the different operation specs for the pump were put in.
Using the data tables sourced from the pumps manufacturers, the data spec sheet
shown in figure 16 below highlights the chosen pumps best efficiency points under
normal operation. Documents are also attached in appendix B.
Knowing the pumps nominal diameter of 6.375 inch or 162mm the red performance
line was used. It can be seen that at 2880 RPM the pump can operate at a maximum
efficiency of 62% with a head flow of 31 meter and a flow rate of 5.5 L/second.
Figure 16 50-32-160 performance data

Hydroelectric Generators for Third World Countries 60
Mr Nicholas Burton Ree
To compare to the experimental prototype, the maximum RPM gained from the
experiment was plugged into the Matlab program. This RPM is the speed that the
turbine operated at in the experiment. More detail on the experiment is further in this
chapter. By doing so, the code then calculates what flow and head is required to
reach that speed. If the mathematical relationship is correct then the head and flow
rate for both the experiment and code should be similar. The head and flow rate to
reach the 62% maximum efficiency was used.
Figure 17Simulation Code for Prototype Pump
The code shown in figure 17 output for the following conditions in figure 18:
Figure 18Matlab Output
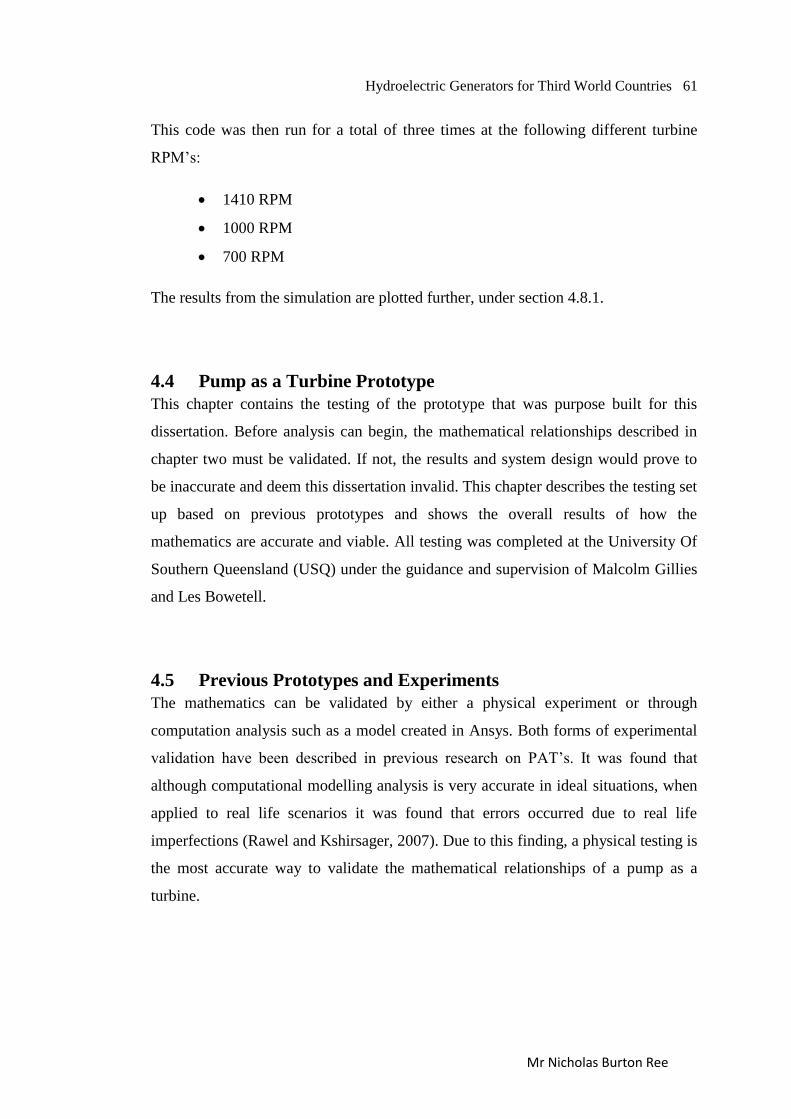
Hydroelectric Generators for Third World Countries 61
Mr Nicholas Burton Ree
This code was then run for a total of three times at the following different turbine
RPM‟s:
1410 RPM
1000 RPM
700 RPM
The results from the simulation are plotted further, under section 4.8.1.
4.4 Pump as a Turbine Prototype
This chapter contains the testing of the prototype that was purpose built for this
dissertation. Before analysis can begin, the mathematical relationships described in
chapter two must be validated. If not, the results and system design would prove to
be inaccurate and deem this dissertation invalid. This chapter describes the testing set
up based on previous prototypes and shows the overall results of how the
mathematics are accurate and viable. All testing was completed at the University Of
Southern Queensland (USQ) under the guidance and supervision of Malcolm Gillies
and Les Bowetell.
4.5 Previous Prototypes and Experiments
The mathematics can be validated by either a physical experiment or through
computation analysis such as a model created in Ansys. Both forms of experimental
validation have been described in previous research on PAT‟s. It was found that
although computational modelling analysis is very accurate in ideal situations, when
applied to real life scenarios it was found that errors occurred due to real life
imperfections (Rawel and Kshirsager, 2007). Due to this finding, a physical testing is
the most accurate way to validate the mathematical relationships of a pump as a
turbine.
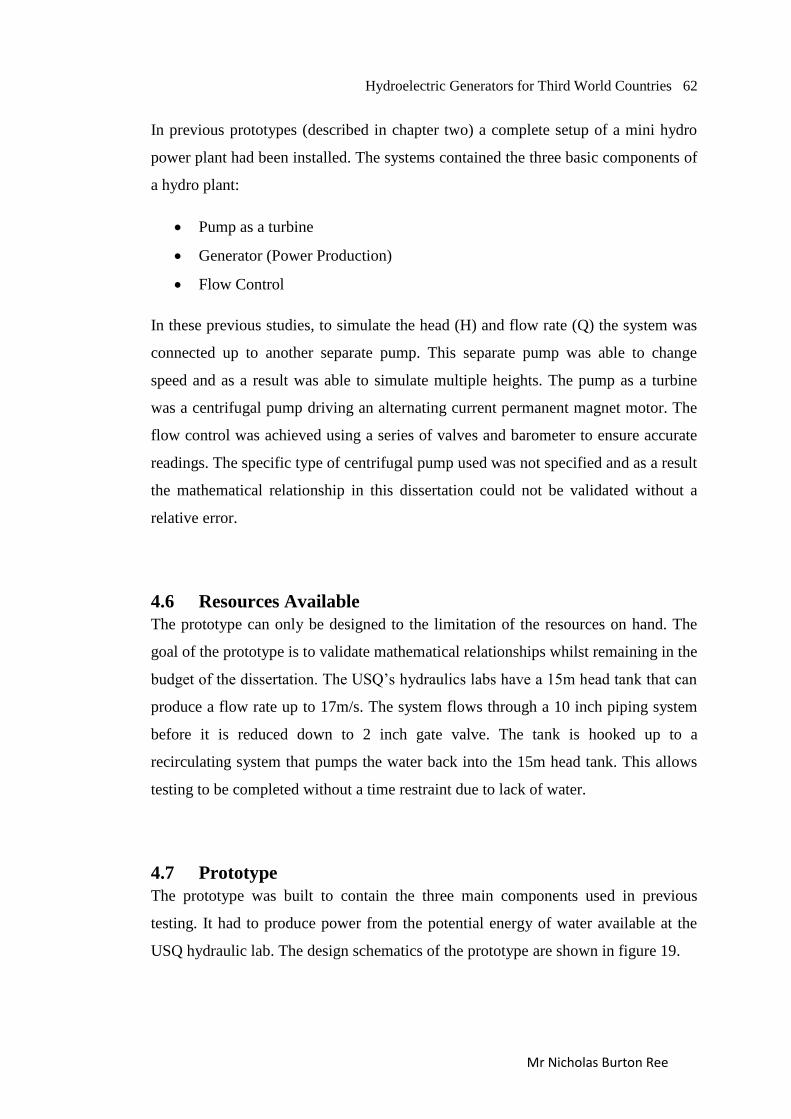
Hydroelectric Generators for Third World Countries 62
Mr Nicholas Burton Ree
In previous prototypes (described in chapter two) a complete setup of a mini hydro
power plant had been installed. The systems contained the three basic components of
a hydro plant:
Pump as a turbine
Generator (Power Production)
Flow Control
In these previous studies, to simulate the head (H) and flow rate (Q) the system was
connected up to another separate pump. This separate pump was able to change
speed and as a result was able to simulate multiple heights. The pump as a turbine
was a centrifugal pump driving an alternating current permanent magnet motor. The
flow control was achieved using a series of valves and barometer to ensure accurate
readings. The specific type of centrifugal pump used was not specified and as a result
the mathematical relationship in this dissertation could not be validated without a
relative error.
4.6 Resources Available
The prototype can only be designed to the limitation of the resources on hand. The
goal of the prototype is to validate mathematical relationships whilst remaining in the
budget of the dissertation. The USQ‟s hydraulics labs have a 15m head tank that can
produce a flow rate up to 17m/s. The system flows through a 10 inch piping system
before it is reduced down to 2 inch gate valve. The tank is hooked up to a
recirculating system that pumps the water back into the 15m head tank. This allows
testing to be completed without a time restraint due to lack of water.
4.7 Prototype
The prototype was built to contain the three main components used in previous
testing. It had to produce power from the potential energy of water available at the
USQ hydraulic lab. The design schematics of the prototype are shown in figure 19.
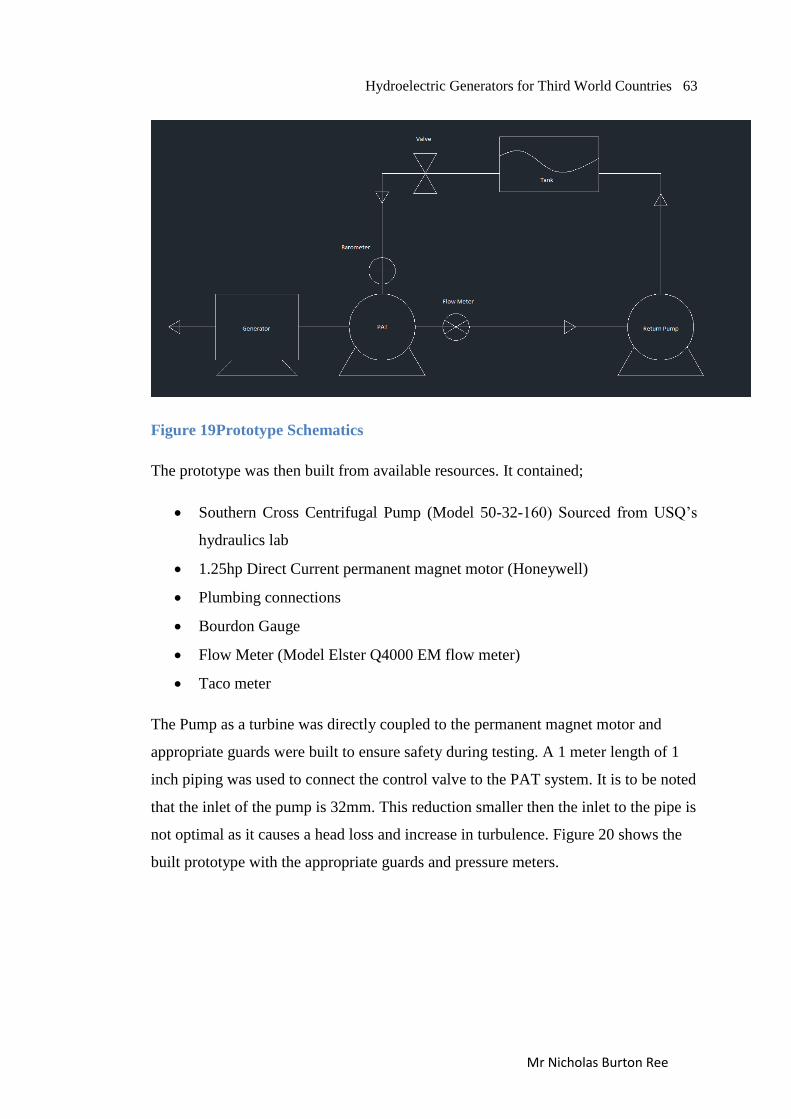
Hydroelectric Generators for Third World Countries 63
Mr Nicholas Burton Ree
Figure 19Prototype Schematics
The prototype was then built from available resources. It contained;
Southern Cross Centrifugal Pump (Model 50-32-160) Sourced from USQ‟s
hydraulics lab
1.25hp Direct Current permanent magnet motor (Honeywell)
Plumbing connections
Bourdon Gauge
Flow Meter (Model Elster Q4000 EM flow meter)
Taco meter
The Pump as a turbine was directly coupled to the permanent magnet motor and
appropriate guards were built to ensure safety during testing. A 1 meter length of 1
inch piping was used to connect the control valve to the PAT system. It is to be noted
that the inlet of the pump is 32mm. This reduction smaller then the inlet to the pipe is
not optimal as it causes a head loss and increase in turbulence. Figure 20 shows the
built prototype with the appropriate guards and pressure meters.
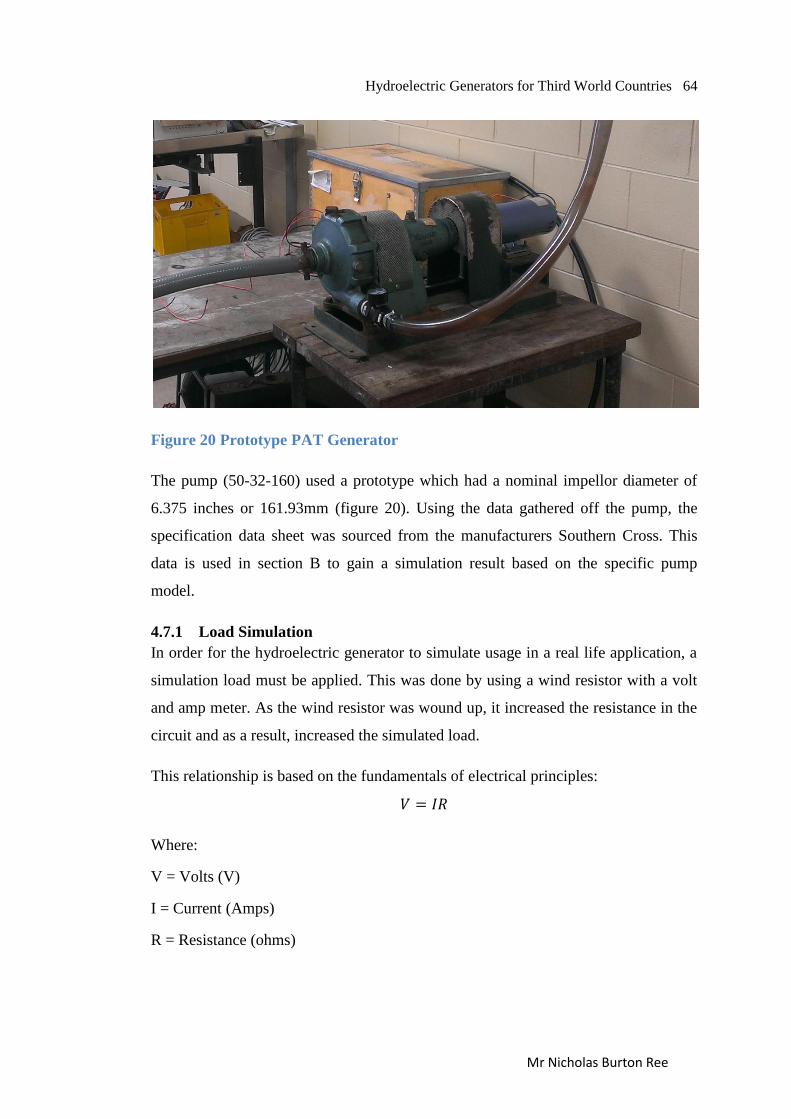
Hydroelectric Generators for Third World Countries 64
Mr Nicholas Burton Ree
Figure 20 Prototype PAT Generator
The pump (50-32-160) used a prototype which had a nominal impellor diameter of
6.375 inches or 161.93mm (figure 20). Using the data gathered off the pump, the
specification data sheet was sourced from the manufacturers Southern Cross. This
data is used in section B to gain a simulation result based on the specific pump
model.
4.7.1 Load Simulation
In order for the hydroelectric generator to simulate usage in a real life application, a
simulation load must be applied. This was done by using a wind resistor with a volt
and amp meter. As the wind resistor was wound up, it increased the resistance in the
circuit and as a result, increased the simulated load.
This relationship is based on the fundamentals of electrical principles:
𝑉 = 𝐼𝑅
Where:
V = Volts (V)
I = Current (Amps)
R = Resistance (ohms)
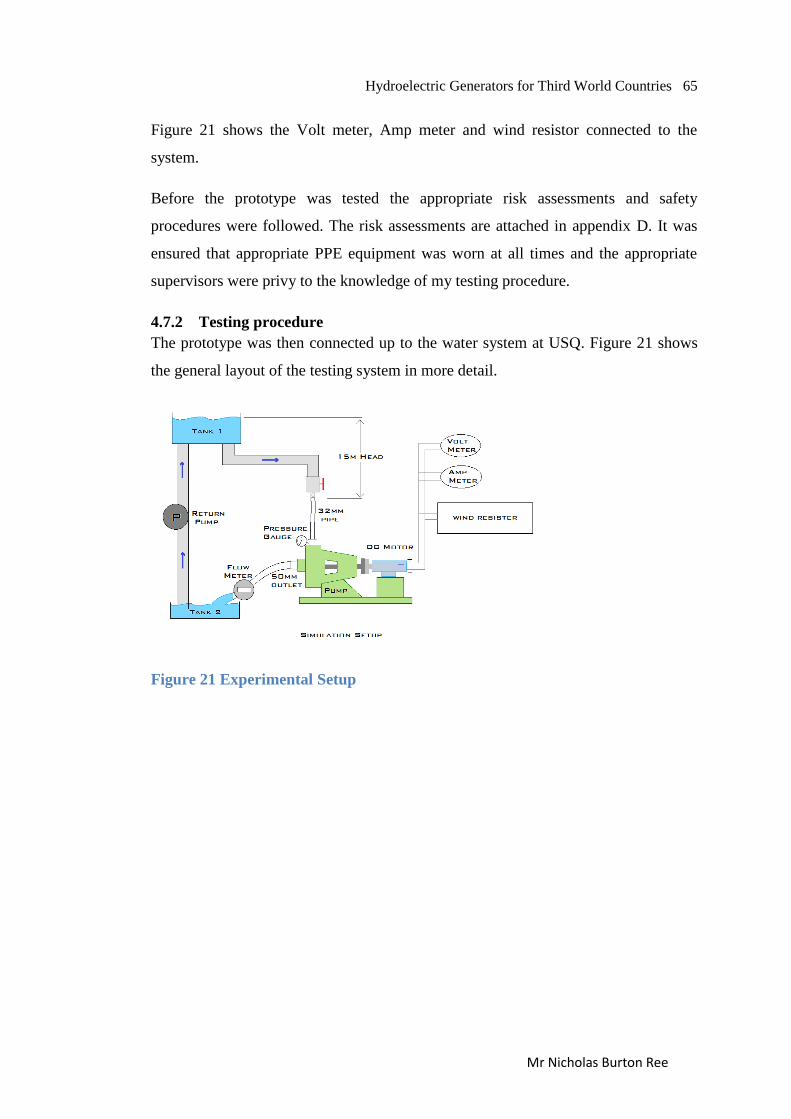
Hydroelectric Generators for Third World Countries 65
Mr Nicholas Burton Ree
Figure 21 shows the Volt meter, Amp meter and wind resistor connected to the
system.
Before the prototype was tested the appropriate risk assessments and safety
procedures were followed. The risk assessments are attached in appendix D. It was
ensured that appropriate PPE equipment was worn at all times and the appropriate
supervisors were privy to the knowledge of my testing procedure.
4.7.2 Testing procedure
The prototype was then connected up to the water system at USQ. Figure 21 shows
the general layout of the testing system in more detail.
Figure 21 Experimental Setup
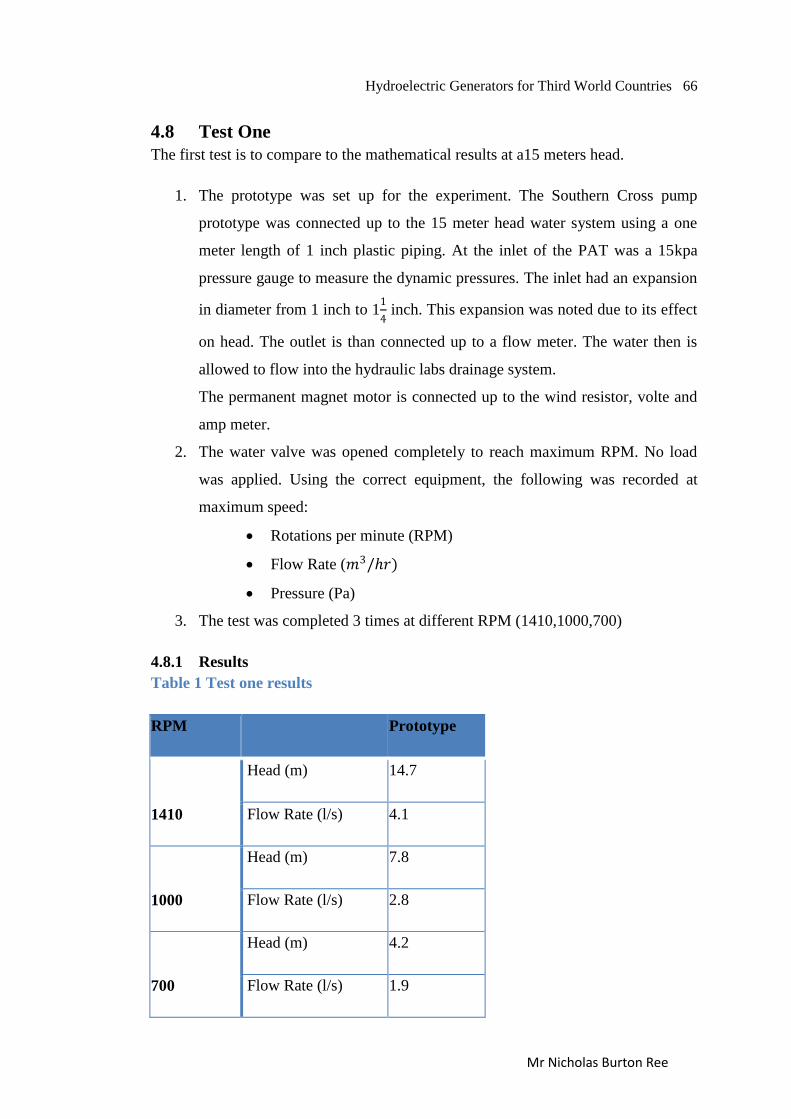
Hydroelectric Generators for Third World Countries 66
Mr Nicholas Burton Ree
4.8 Test One
The first test is to compare to the mathematical results at a15 meters head.
1. The prototype was set up for the experiment. The Southern Cross pump
prototype was connected up to the 15 meter head water system using a one
meter length of 1 inch plastic piping. At the inlet of the PAT was a 15kpa
pressure gauge to measure the dynamic pressures. The inlet had an expansion
in diameter from 1 inch to 11
4 inch. This expansion was noted due to its effect
on head. The outlet is than connected up to a flow meter. The water then is
allowed to flow into the hydraulic labs drainage system.
The permanent magnet motor is connected up to the wind resistor, volte and
amp meter.
2. The water valve was opened completely to reach maximum RPM. No load
was applied. Using the correct equipment, the following was recorded at
maximum speed:
Rotations per minute (RPM)
Flow Rate (𝑚3/𝑟)
Pressure (Pa)
3. The test was completed 3 times at different RPM (1410,1000,700)
4.8.1 Results
Table 1 Test one results
RPM
Prototype
1410
Head (m) 14.7
Flow Rate (l/s) 4.1
1000
Head (m) 7.8
Flow Rate (l/s) 2.8
700
Head (m) 4.2
Flow Rate (l/s) 1.9
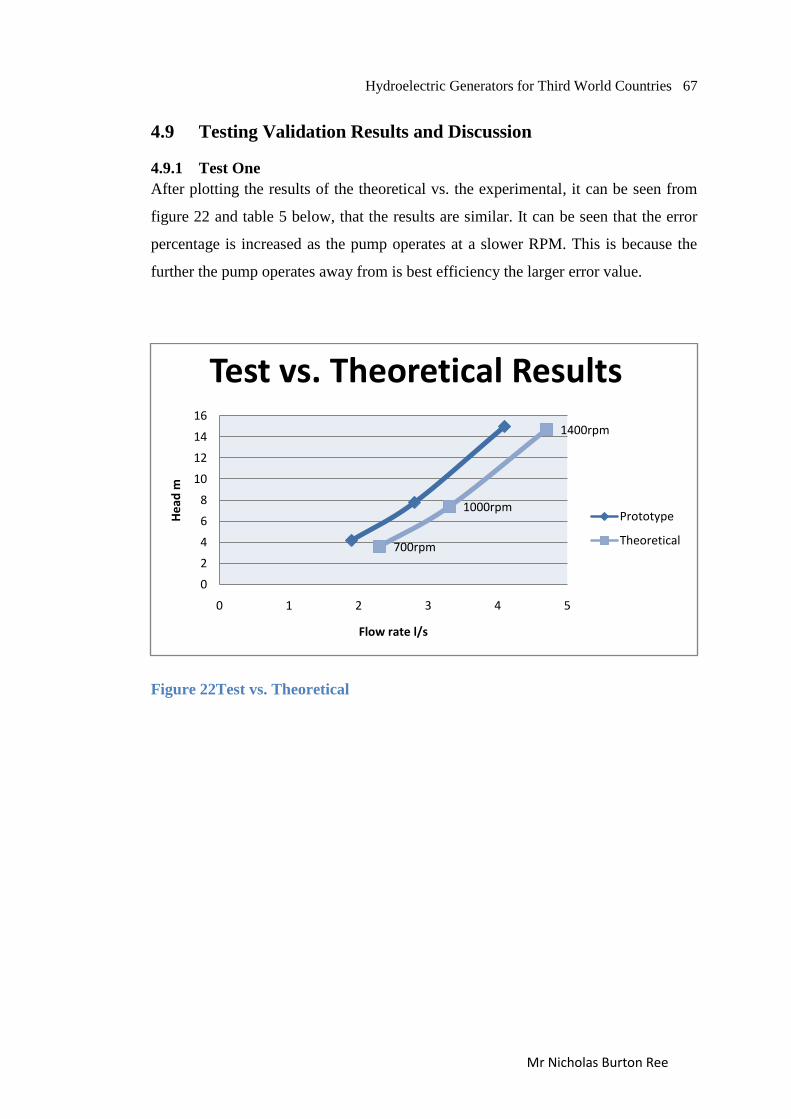
Hydroelectric Generators for Third World Countries 67
Mr Nicholas Burton Ree
4.9 Testing Validation Results and Discussion
4.9.1 Test One
After plotting the results of the theoretical vs. the experimental, it can be seen from
figure 22 and table 5 below, that the results are similar. It can be seen that the error
percentage is increased as the pump operates at a slower RPM. This is because the
further the pump operates away from is best efficiency the larger error value.
Figure 22Test vs. Theoretical
1400rpm
1000rpm
700rpm
0
2
4
6
8
10
12
14
16
0 1 2 3 4 5
He
ad m
Flow rate l/s
Test vs. Theoretical Results
Prototype
Theoretical
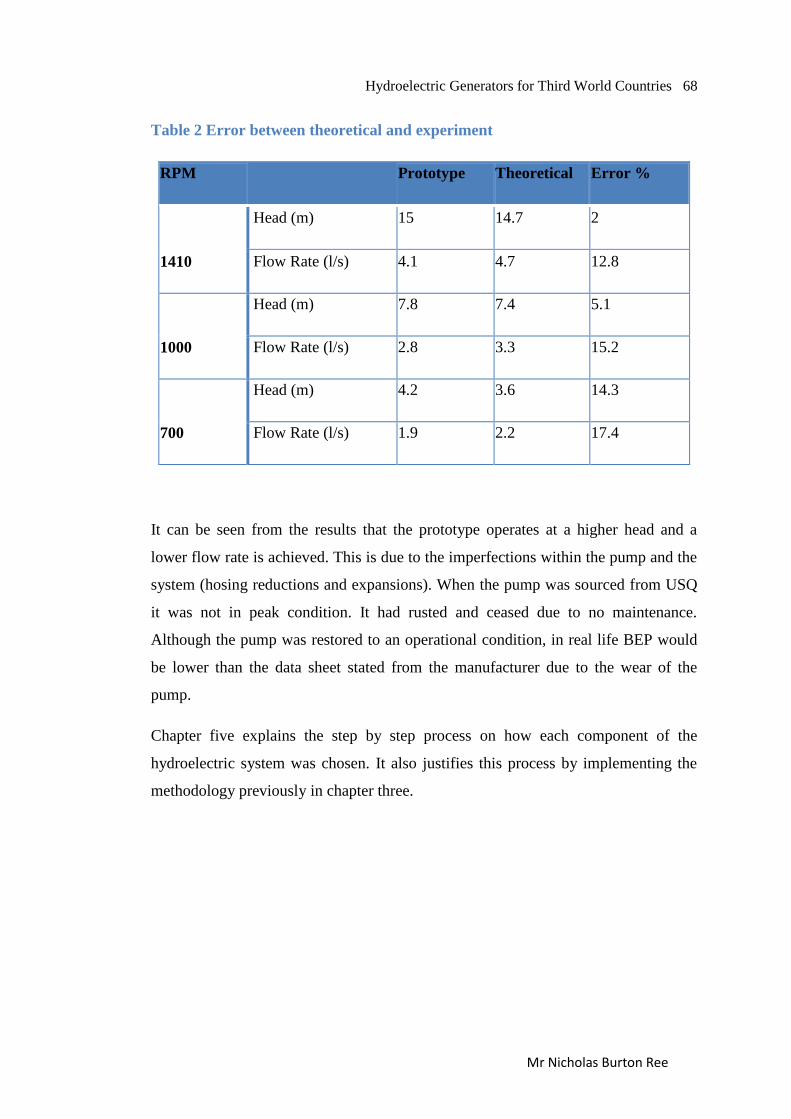
Hydroelectric Generators for Third World Countries 68
Mr Nicholas Burton Ree
Table 2 Error between theoretical and experiment
RPM
Prototype Theoretical Error %
1410
Head (m) 15 14.7 2
Flow Rate (l/s) 4.1 4.7 12.8
1000
Head (m) 7.8 7.4 5.1
Flow Rate (l/s) 2.8 3.3 15.2
700
Head (m) 4.2 3.6 14.3
Flow Rate (l/s) 1.9 2.2 17.4
It can be seen from the results that the prototype operates at a higher head and a
lower flow rate is achieved. This is due to the imperfections within the pump and the
system (hosing reductions and expansions). When the pump was sourced from USQ
it was not in peak condition. It had rusted and ceased due to no maintenance.
Although the pump was restored to an operational condition, in real life BEP would
be lower than the data sheet stated from the manufacturer due to the wear of the
pump.
Chapter five explains the step by step process on how each component of the
hydroelectric system was chosen. It also justifies this process by implementing the
methodology previously in chapter three.
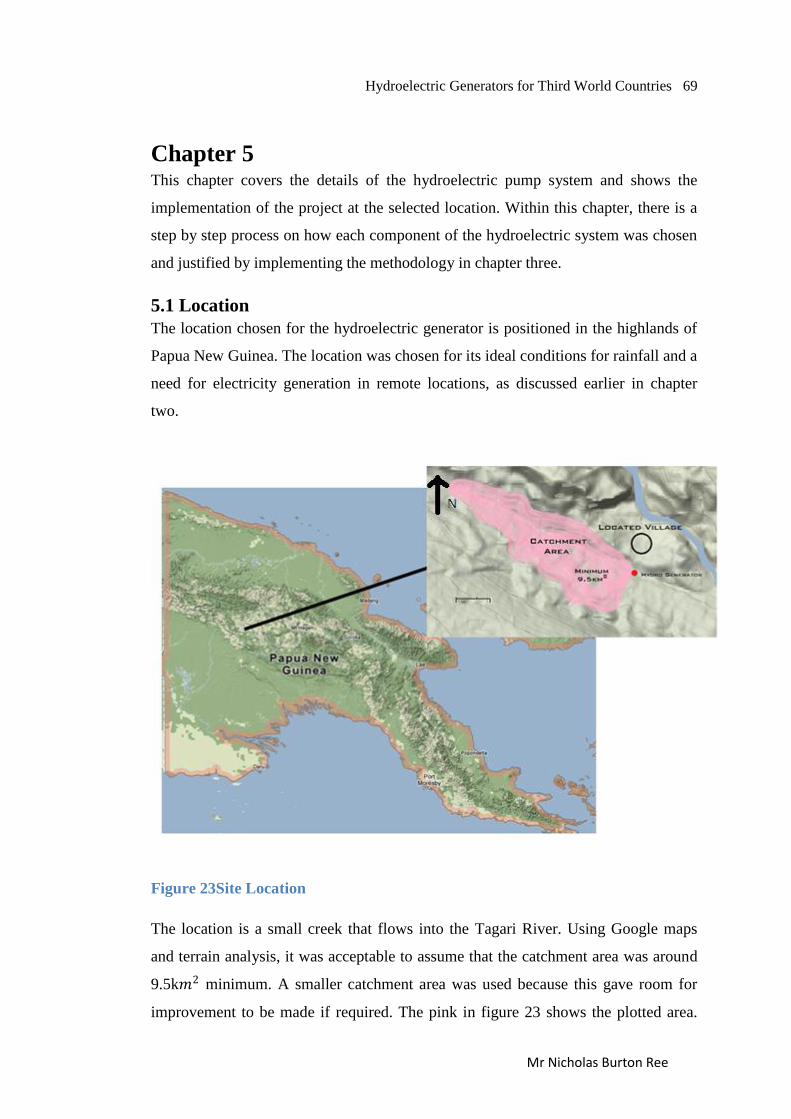
Hydroelectric Generators for Third World Countries 69
Mr Nicholas Burton Ree
Chapter 5 This chapter covers the details of the hydroelectric pump system and shows the
implementation of the project at the selected location. Within this chapter, there is a
step by step process on how each component of the hydroelectric system was chosen
and justified by implementing the methodology in chapter three.
5.1 Location
The location chosen for the hydroelectric generator is positioned in the highlands of
Papua New Guinea. The location was chosen for its ideal conditions for rainfall and a
need for electricity generation in remote locations, as discussed earlier in chapter
two.
Figure 23Site Location
The location is a small creek that flows into the Tagari River. Using Google maps
and terrain analysis, it was acceptable to assume that the catchment area was around
9.5k𝑚2 minimum. A smaller catchment area was used because this gave room for
improvement to be made if required. The pink in figure 23 shows the plotted area.
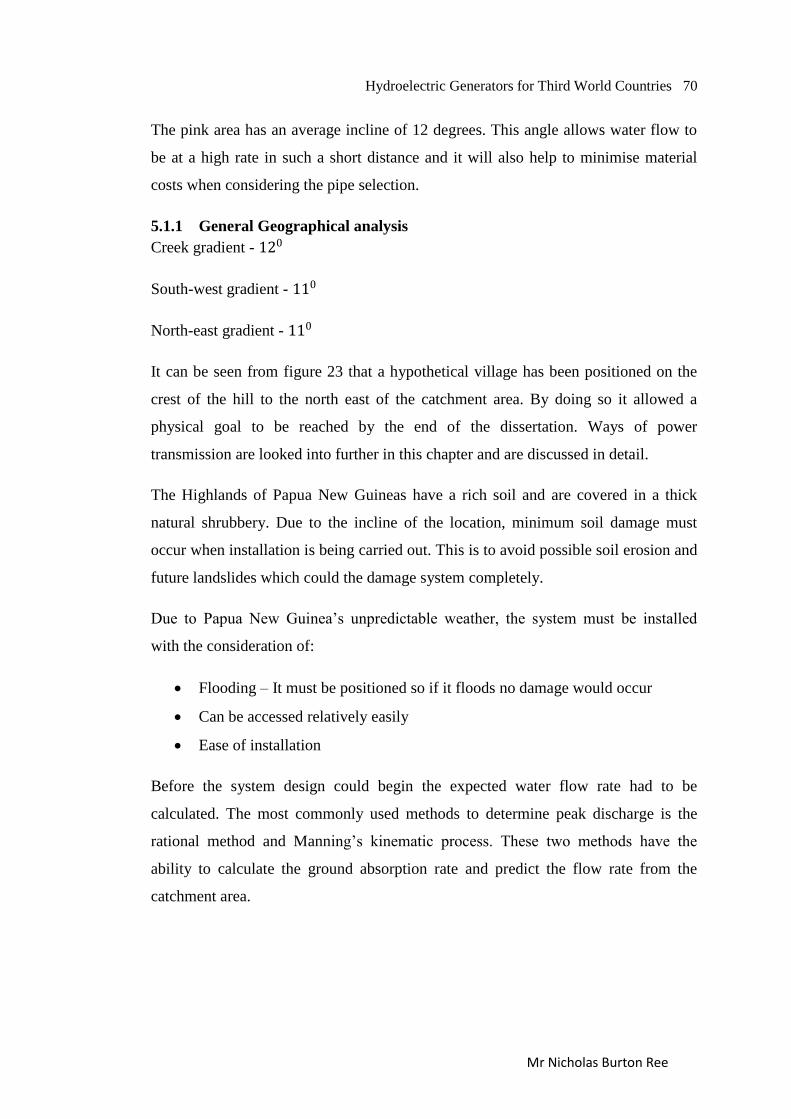
Hydroelectric Generators for Third World Countries 70
Mr Nicholas Burton Ree
The pink area has an average incline of 12 degrees. This angle allows water flow to
be at a high rate in such a short distance and it will also help to minimise material
costs when considering the pipe selection.
5.1.1 General Geographical analysis
Creek gradient - 120
South-west gradient - 110
North-east gradient - 110
It can be seen from figure 23 that a hypothetical village has been positioned on the
crest of the hill to the north east of the catchment area. By doing so it allowed a
physical goal to be reached by the end of the dissertation. Ways of power
transmission are looked into further in this chapter and are discussed in detail.
The Highlands of Papua New Guineas have a rich soil and are covered in a thick
natural shrubbery. Due to the incline of the location, minimum soil damage must
occur when installation is being carried out. This is to avoid possible soil erosion and
future landslides which could the damage system completely.
Due to Papua New Guinea‟s unpredictable weather, the system must be installed
with the consideration of:
Flooding – It must be positioned so if it floods no damage would occur
Can be accessed relatively easily
Ease of installation
Before the system design could begin the expected water flow rate had to be
calculated. The most commonly used methods to determine peak discharge is the
rational method and Manning‟s kinematic process. These two methods have the
ability to calculate the ground absorption rate and predict the flow rate from the
catchment area.
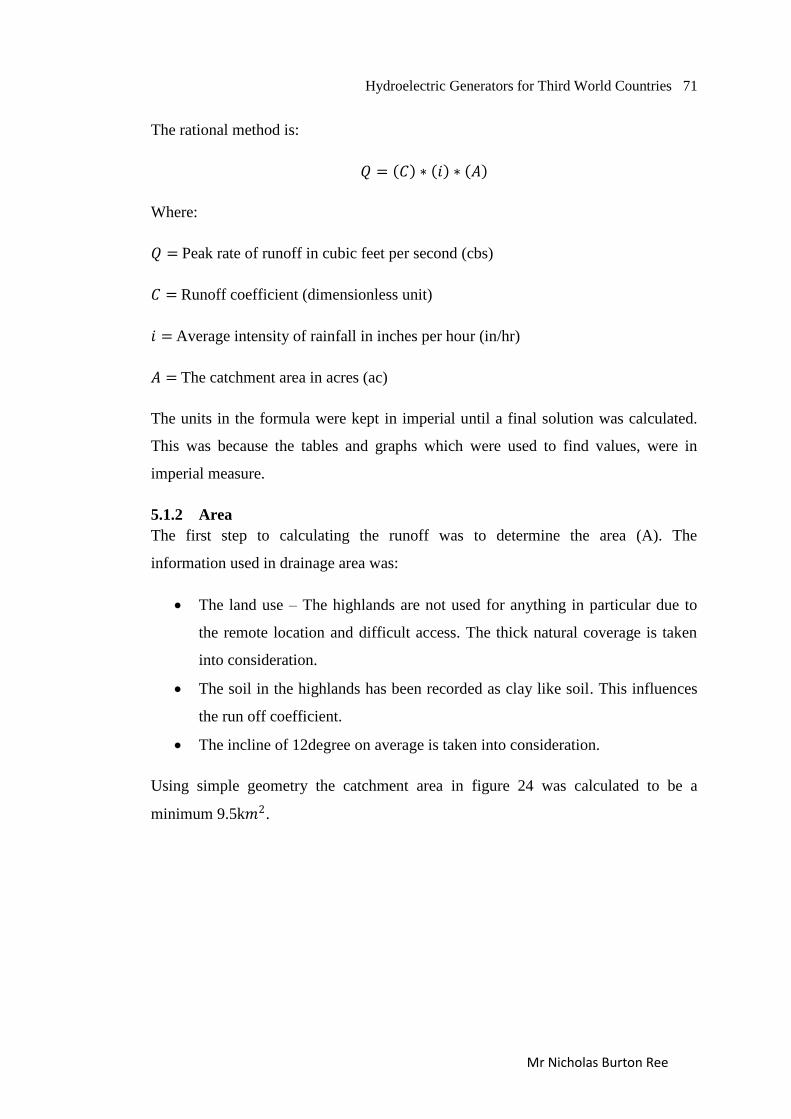
Hydroelectric Generators for Third World Countries 71
Mr Nicholas Burton Ree
The rational method is:
𝑄 = 𝐶 ∗ 𝑖 ∗ 𝐴
Where:
𝑄 = Peak rate of runoff in cubic feet per second (cbs)
𝐶 = Runoff coefficient (dimensionless unit)
𝑖 = Average intensity of rainfall in inches per hour (in/hr)
𝐴 = The catchment area in acres (ac)
The units in the formula were kept in imperial until a final solution was calculated.
This was because the tables and graphs which were used to find values, were in
imperial measure.
5.1.2 Area
The first step to calculating the runoff was to determine the area (A). The
information used in drainage area was:
The land use – The highlands are not used for anything in particular due to
the remote location and difficult access. The thick natural coverage is taken
into consideration.
The soil in the highlands has been recorded as clay like soil. This influences
the run off coefficient.
The incline of 12degree on average is taken into consideration.
Using simple geometry the catchment area in figure 24 was calculated to be a
minimum 9.5k𝑚2.
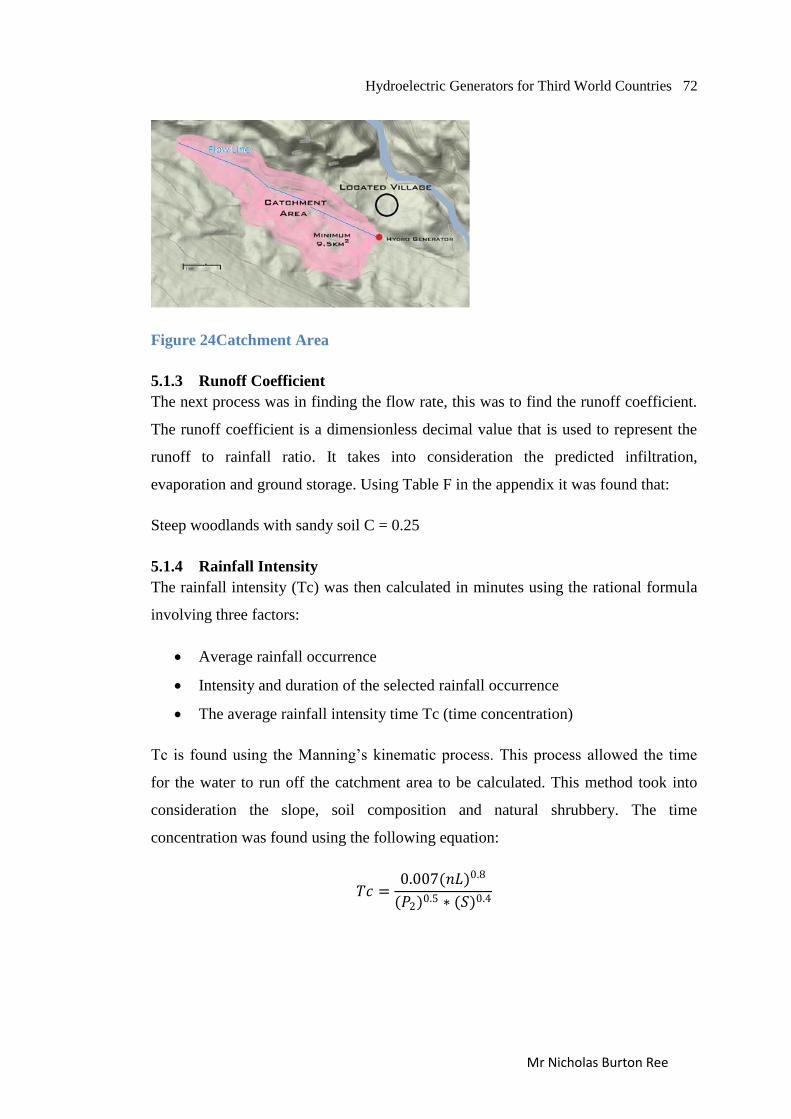
Hydroelectric Generators for Third World Countries 72
Mr Nicholas Burton Ree
Figure 24Catchment Area
5.1.3 Runoff Coefficient
The next process was in finding the flow rate, this was to find the runoff coefficient.
The runoff coefficient is a dimensionless decimal value that is used to represent the
runoff to rainfall ratio. It takes into consideration the predicted infiltration,
evaporation and ground storage. Using Table F in the appendix it was found that:
Steep woodlands with sandy soil C = 0.25
5.1.4 Rainfall Intensity
The rainfall intensity (Tc) was then calculated in minutes using the rational formula
involving three factors:
Average rainfall occurrence
Intensity and duration of the selected rainfall occurrence
The average rainfall intensity time Tc (time concentration)
Tc is found using the Manning‟s kinematic process. This process allowed the time
for the water to run off the catchment area to be calculated. This method took into
consideration the slope, soil composition and natural shrubbery. The time
concentration was found using the following equation:
𝑇𝑐 =0.007(𝑛𝐿)0.8
(𝑃2)0.5 ∗ (𝑆)0.4
Hydroelectric Generators for Third World Countries 73
Mr Nicholas Burton Ree
Where:
𝑛 =Mannings roughness coefficient
𝐿 =Length of flow line (Ft)
𝑆 = Given Slope (decimal value)
𝑃2 = 24hr Rainfall average (inches)
The calculated Tc (30hrs) value was then used with „Rainfall Intensity Factor –
Frequency duration chart‟ in appendix F. Using the table was 0.25 inches per hour
every 24hrs. 𝑃2was found using the Papua New Guinea Initial Communication –
Under the united Nations Framework Convention on Climate Change report (2000).
5.2 Peak Discharge
With the found values, the peak discharge was then calculated using the rational
method.
𝑄 = 𝐶 ∗ 𝑖 ∗ 𝐴
𝑄 = 0.25 ∗ 0.1 ∗ 2347.5
𝑄 = 58.68𝑐𝑏𝑠 = 1.67𝑚3/𝑠
Therefore, using the rational method it was found that the average peak discharge
would be approximately 1.67 𝑚3/𝑠. This flow rate is expected under the weather
conditions of Papua New Guinea and considering the size of such a large catchment
area.
With such a large flow rate it allows more room in the pump selection process. The
available head is quite large but due to observation of the location it is seen that the
incline of the catchment area drastically climbs approximately at the 50m head point.
Due to this geographical limit the head available will only be 40m. If 40m did not
prove to be a sufficient head then the hydroelectric system could have been moved
down stream, but by doing so, it increases the flooding and moves the system further
away from the village.
Hydroelectric Generators for Third World Countries 74
Mr Nicholas Burton Ree
5.3 Power Required
As stated earlier in the dissertation (chapter one) the PAT hydroelectric generator is
required to power a small hospital room that was position in the centre of the local
Papua New Guinea village discussed in 5.1 Location. The hospital room consist of:
1 Bar Refrigerator to be used for medical storage
5 lights
1 Ceiling Fan
To approximate the power required to run each appliance, an average of six across
each appliance is taken. Due to the remote location of the site it is viable to assume
that the appliance is not top of the line and the equipment could have a high power
draw.
5.3.1 Type of Generator
The type of generation system greatly affects the performance of the hydroelectric
generation capability. There are two types of generator:
Alternating Current (AC)
Direct Current (DC)
Alternating current generators are more commonly used when an electrical grid fails.
Nearly all everyday appliances are powered by AC. AC generators must be able to
operate at a constant speed to produce a stable AC. If they are overloaded the system
will shut down. An automatic frequency regulator is used to ensure that the current
does not become unstable.
Direct Current generators produce a smooth supply directly into batteries or inverters
where they can then be turned into AC. DC generators are not reliant on speed
regulation. As most appliances operate on AC, DC generators require conversion.
This can be avoided by using DC powered appliances.
Table 3Advantages and disadvantages of AC
Advantage Disadvantage
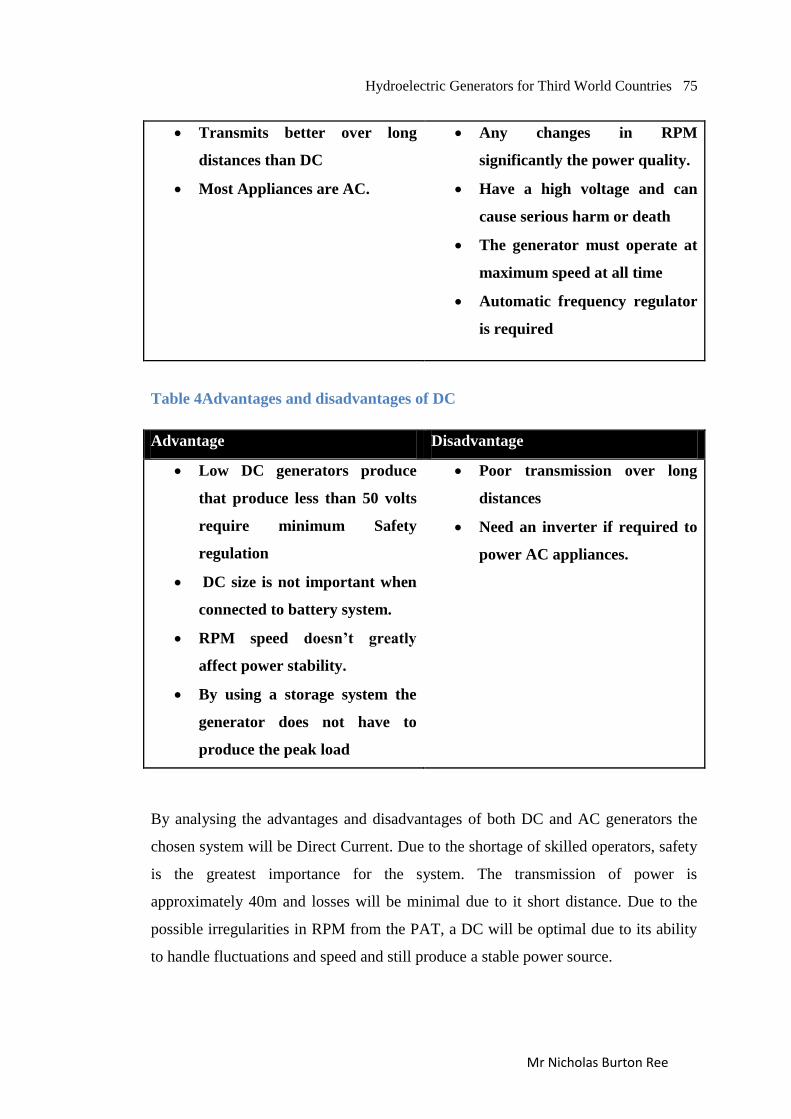
Hydroelectric Generators for Third World Countries 75
Mr Nicholas Burton Ree
Transmits better over long
distances than DC
Most Appliances are AC.
Any changes in RPM
significantly the power quality.
Have a high voltage and can
cause serious harm or death
The generator must operate at
maximum speed at all time
Automatic frequency regulator
is required
Table 4Advantages and disadvantages of DC
Advantage Disadvantage
Low DC generators produce
that produce less than 50 volts
require minimum Safety
regulation
DC size is not important when
connected to battery system.
RPM speed doesn’t greatly
affect power stability.
By using a storage system the
generator does not have to
produce the peak load
Poor transmission over long
distances
Need an inverter if required to
power AC appliances.
By analysing the advantages and disadvantages of both DC and AC generators the
chosen system will be Direct Current. Due to the shortage of skilled operators, safety
is the greatest importance for the system. The transmission of power is
approximately 40m and losses will be minimal due to it short distance. Due to the
possible irregularities in RPM from the PAT, a DC will be optimal due to its ability
to handle fluctuations and speed and still produce a stable power source.
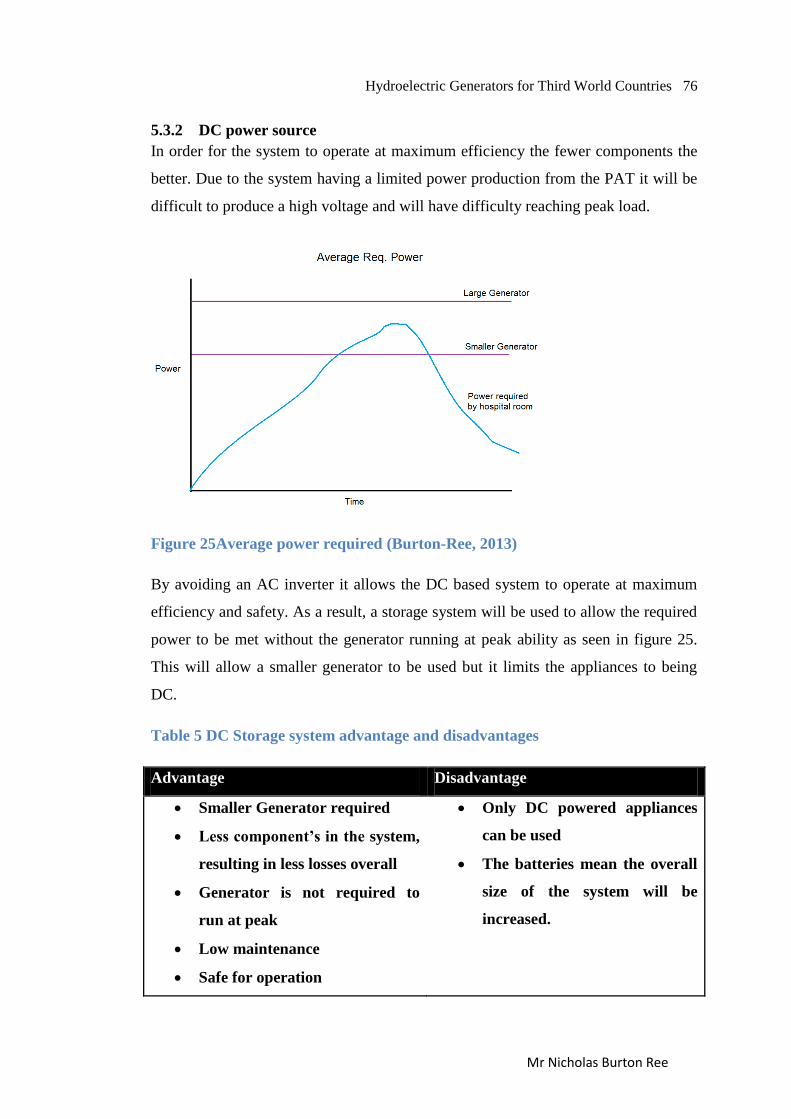
Hydroelectric Generators for Third World Countries 76
Mr Nicholas Burton Ree
5.3.2 DC power source
In order for the system to operate at maximum efficiency the fewer components the
better. Due to the system having a limited power production from the PAT it will be
difficult to produce a high voltage and will have difficulty reaching peak load.
Figure 25Average power required (Burton-Ree, 2013)
By avoiding an AC inverter it allows the DC based system to operate at maximum
efficiency and safety. As a result, a storage system will be used to allow the required
power to be met without the generator running at peak ability as seen in figure 25.
This will allow a smaller generator to be used but it limits the appliances to being
DC.
Table 5 DC Storage system advantage and disadvantages
Advantage Disadvantage
Smaller Generator required
Less component’s in the system,
resulting in less losses overall
Generator is not required to
run at peak
Low maintenance
Safe for operation
Only DC powered appliances
can be used
The batteries mean the overall
size of the system will be
increased.
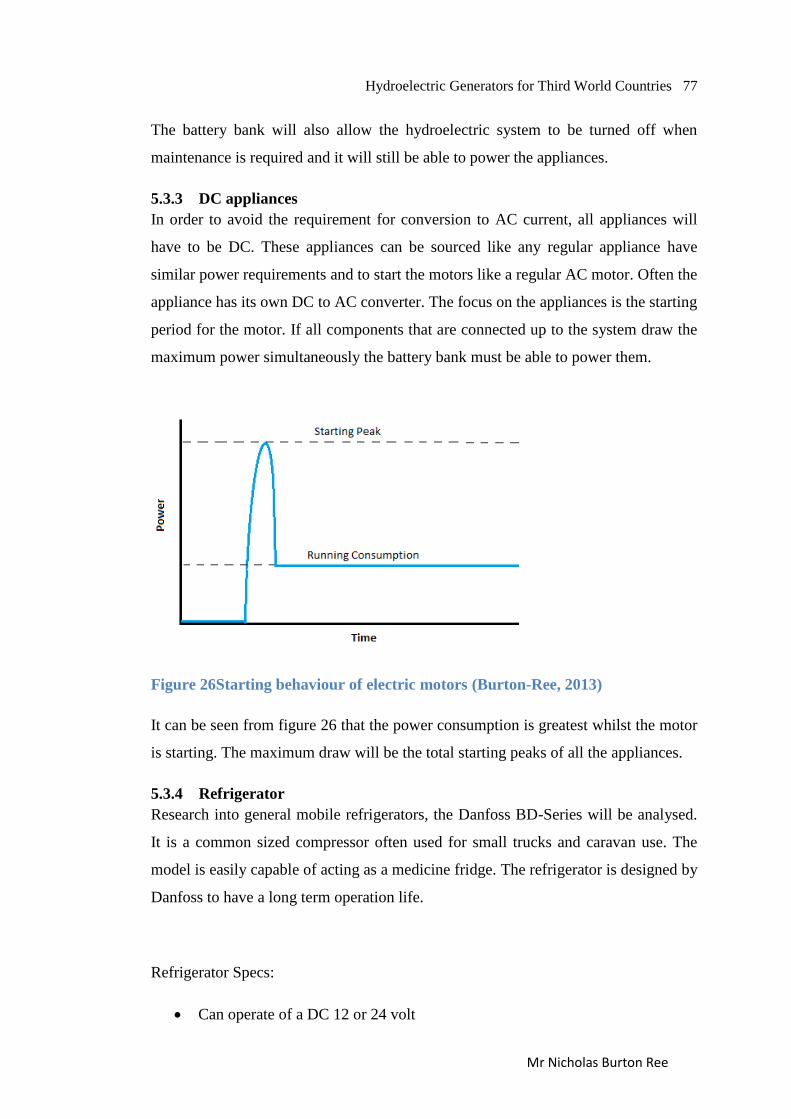
Hydroelectric Generators for Third World Countries 77
Mr Nicholas Burton Ree
The battery bank will also allow the hydroelectric system to be turned off when
maintenance is required and it will still be able to power the appliances.
5.3.3 DC appliances
In order to avoid the requirement for conversion to AC current, all appliances will
have to be DC. These appliances can be sourced like any regular appliance have
similar power requirements and to start the motors like a regular AC motor. Often the
appliance has its own DC to AC converter. The focus on the appliances is the starting
period for the motor. If all components that are connected up to the system draw the
maximum power simultaneously the battery bank must be able to power them.
Figure 26Starting behaviour of electric motors (Burton-Ree, 2013)
It can be seen from figure 26 that the power consumption is greatest whilst the motor
is starting. The maximum draw will be the total starting peaks of all the appliances.
5.3.4 Refrigerator
Research into general mobile refrigerators, the Danfoss BD-Series will be analysed.
It is a common sized compressor often used for small trucks and caravan use. The
model is easily capable of acting as a medicine fridge. The refrigerator is designed by
Danfoss to have a long term operation life.
Refrigerator Specs:
Can operate of a DC 12 or 24 volt

Hydroelectric Generators for Third World Countries 78
Mr Nicholas Burton Ree
Operates with a permanent magnet motor
Cut in current of 6 Amps
Resistance of 3 windings of 14.0 Ohms
Has a peak start of 144 W
To ensure no under calculations are made, the daily energy demand is calculated
using the peak. It is also assumed that the fridge operates at 24hs. The refrigerator
uses 144W.
5.3.5 Lighting
Incandescent light bulbs are becoming fewer and harder to acquire. Today what can
be found on the shelf is the new energy efficient fluorescent lighting. The hospital
room lighting will be assumed to contain five 30w fluorescent lights. This lighting
wattage is higher than what could be bought in the store but ensures room for a
variety of light bulbs to be used.
The peak start up for lighting is not required as it is minimal. The lighting uses
150W.
5.3.6 Ceiling fan
One ceiling fan would be required for the room. Research into Direct Current power
ceiling fans found that an average wattage of 40 watts would be required. A Regent
DC motor ceiling fan will be used. The model has a 40 watt fan motor. According to
AS/NZS 4509.2.2010 the surge factor for ceiling fans are rated 2.5 times the average
watt rating.
Therefore the ceiling fan uses 100W.
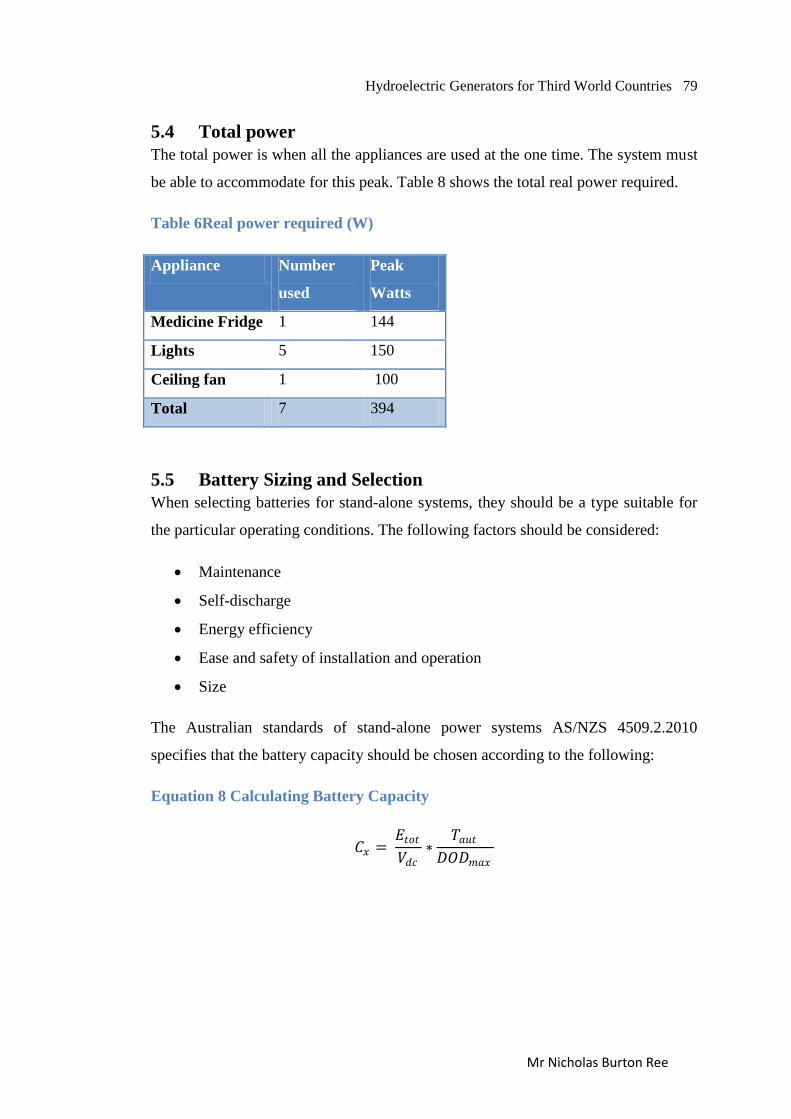
Hydroelectric Generators for Third World Countries 79
Mr Nicholas Burton Ree
5.4 Total power
The total power is when all the appliances are used at the one time. The system must
be able to accommodate for this peak. Table 8 shows the total real power required.
Table 6Real power required (W)
Appliance Number
used
Peak
Watts
Medicine Fridge 1 144
Lights 5 150
Ceiling fan 1 100
Total 7 394
5.5 Battery Sizing and Selection
When selecting batteries for stand-alone systems, they should be a type suitable for
the particular operating conditions. The following factors should be considered:
Maintenance
Self-discharge
Energy efficiency
Ease and safety of installation and operation
Size
The Australian standards of stand-alone power systems AS/NZS 4509.2.2010
specifies that the battery capacity should be chosen according to the following:
Equation 8 Calculating Battery Capacity
𝐶𝑥 = 𝐸𝑡𝑜𝑡𝑉𝑑𝑐
∗𝑇𝑎𝑢𝑡
𝐷𝑂𝐷𝑚𝑎𝑥
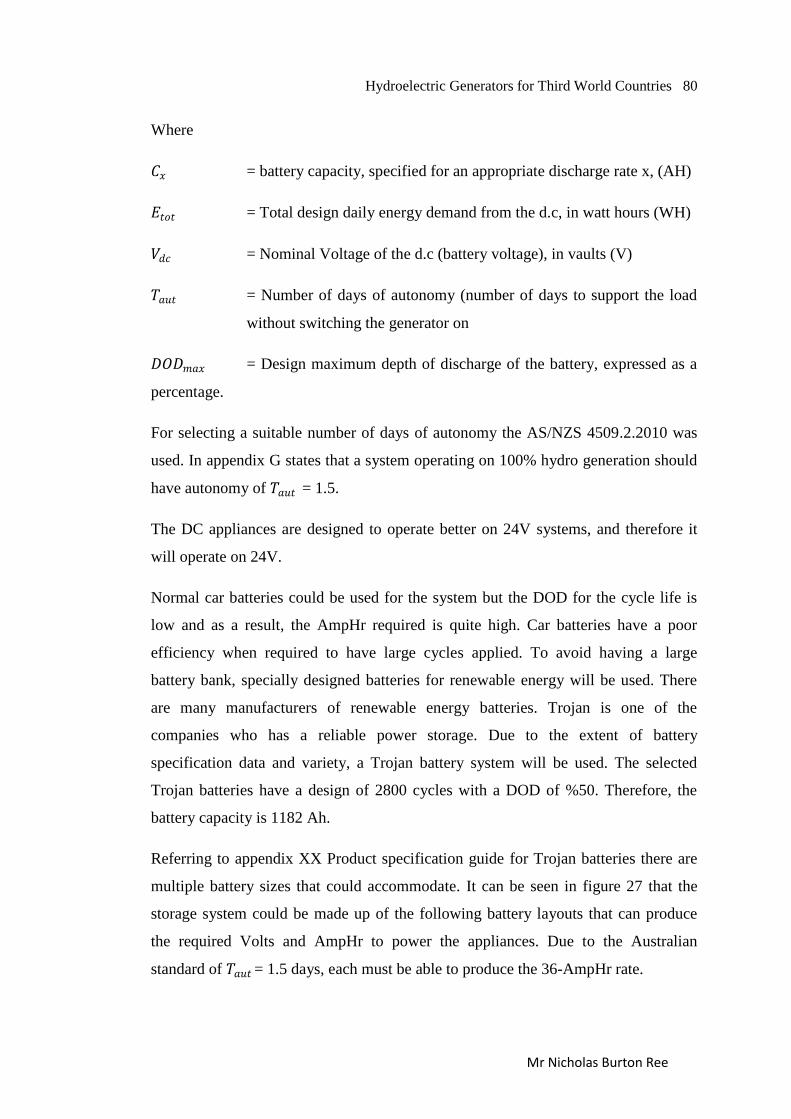
Hydroelectric Generators for Third World Countries 80
Mr Nicholas Burton Ree
Where
𝐶𝑥 = battery capacity, specified for an appropriate discharge rate x, (AH)
𝐸𝑡𝑜𝑡 = Total design daily energy demand from the d.c, in watt hours (WH)
𝑉𝑑𝑐 = Nominal Voltage of the d.c (battery voltage), in vaults (V)
𝑇𝑎𝑢𝑡 = Number of days of autonomy (number of days to support the load
without switching the generator on
𝐷𝑂𝐷𝑚𝑎𝑥 = Design maximum depth of discharge of the battery, expressed as a
percentage.
For selecting a suitable number of days of autonomy the AS/NZS 4509.2.2010 was
used. In appendix G states that a system operating on 100% hydro generation should
have autonomy of 𝑇𝑎𝑢𝑡 = 1.5.
The DC appliances are designed to operate better on 24V systems, and therefore it
will operate on 24V.
Normal car batteries could be used for the system but the DOD for the cycle life is
low and as a result, the AmpHr required is quite high. Car batteries have a poor
efficiency when required to have large cycles applied. To avoid having a large
battery bank, specially designed batteries for renewable energy will be used. There
are many manufacturers of renewable energy batteries. Trojan is one of the
companies who has a reliable power storage. Due to the extent of battery
specification data and variety, a Trojan battery system will be used. The selected
Trojan batteries have a design of 2800 cycles with a DOD of %50. Therefore, the
battery capacity is 1182 Ah.
Referring to appendix XX Product specification guide for Trojan batteries there are
multiple battery sizes that could accommodate. It can be seen in figure 27 that the
storage system could be made up of the following battery layouts that can produce
the required Volts and AmpHr to power the appliances. Due to the Australian
standard of 𝑇𝑎𝑢𝑡 = 1.5 days, each must be able to produce the 36-AmpHr rate.
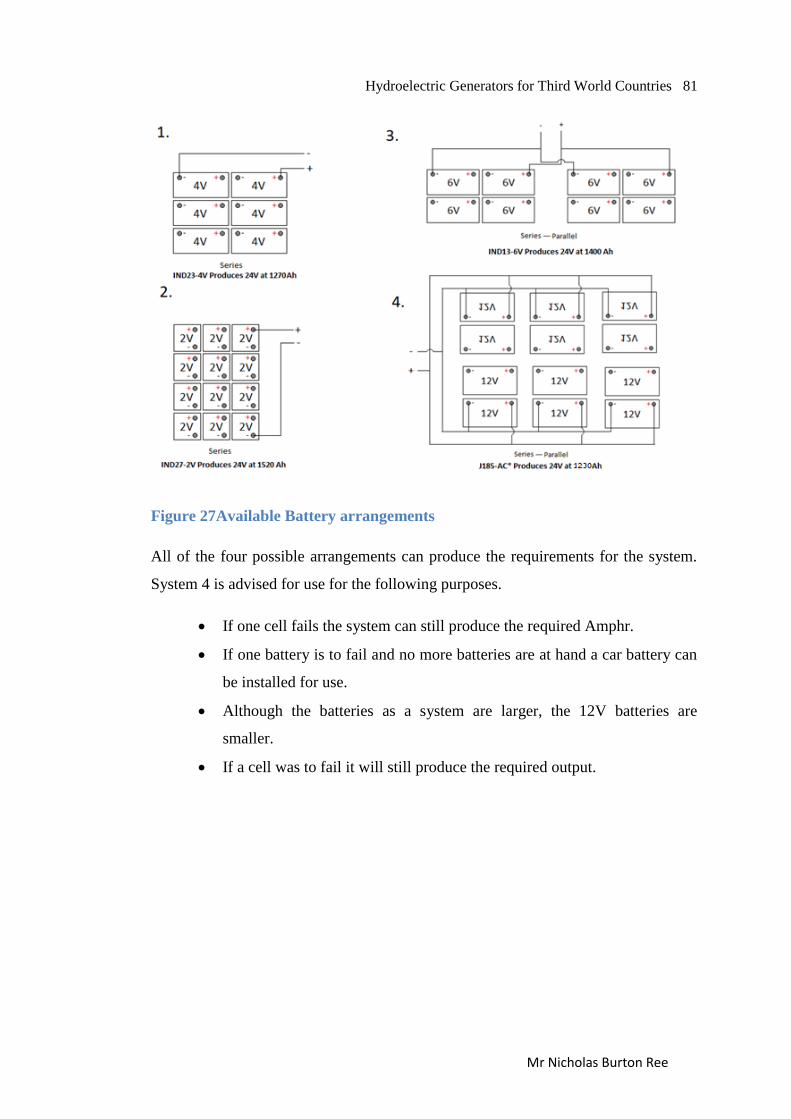
Hydroelectric Generators for Third World Countries 81
Mr Nicholas Burton Ree
Figure 27Available Battery arrangements
All of the four possible arrangements can produce the requirements for the system.
System 4 is advised for use for the following purposes.
If one cell fails the system can still produce the required Amphr.
If one battery is to fail and no more batteries are at hand a car battery can
be installed for use.
Although the batteries as a system are larger, the 12V batteries are
smaller.
If a cell was to fail it will still produce the required output.
Hydroelectric Generators for Third World Countries 82
Mr Nicholas Burton Ree
5.5.1 Battery Charging and Selection
The Australian standards AS/NZS 4509.2.2010 state that the battery should be
charged at the following rate:
𝐼𝑏𝑐 = 0.1 ∗ 𝐶10
Where:
𝐼𝑏𝑐 = Maximum charge current of the battery charger, in Amperes (A)
𝐶10 = 10hr rate capacity of the battery, in Ampere hours (AH)
By using the 𝐶10given in the product specification guide in appendix G the maximum
charging rate for the selected D.C battery bank is 1129 Ah.
5.5.2 Regulator Sizing and Selection
To ensure that the generators voltage does not go over this limit a regulator is used.
The function of a regulator is to control the flow of current from the generator into
the batteries. Due to the deep cycle design of the Trojan batteries, a regulator with
the Low Voltage feature will be used. This feature monitors the battery level and will
disconnect if the voltage is so low it could cause long term damage to the batteries.
This will help to ensure that the batteries have a long service life. Regulators do not
require much maintenance and will only often have to be checked that corrosion has
not occurred.
5.5.3 Fuse Control
The system needs to have an over current protection to ensure that damage does not
occur to either the batteries or the appliances running off the system. Over current
often occurs because of two main issues:
Lightning strike
Incorrect connections
Over current from the generator is not an issue as the regulator should stop too much
current from passing. Due to the batteries floating (batteries not earthed) in the
system, circuit breaker fuses will be installed at the positive and negative terminals.
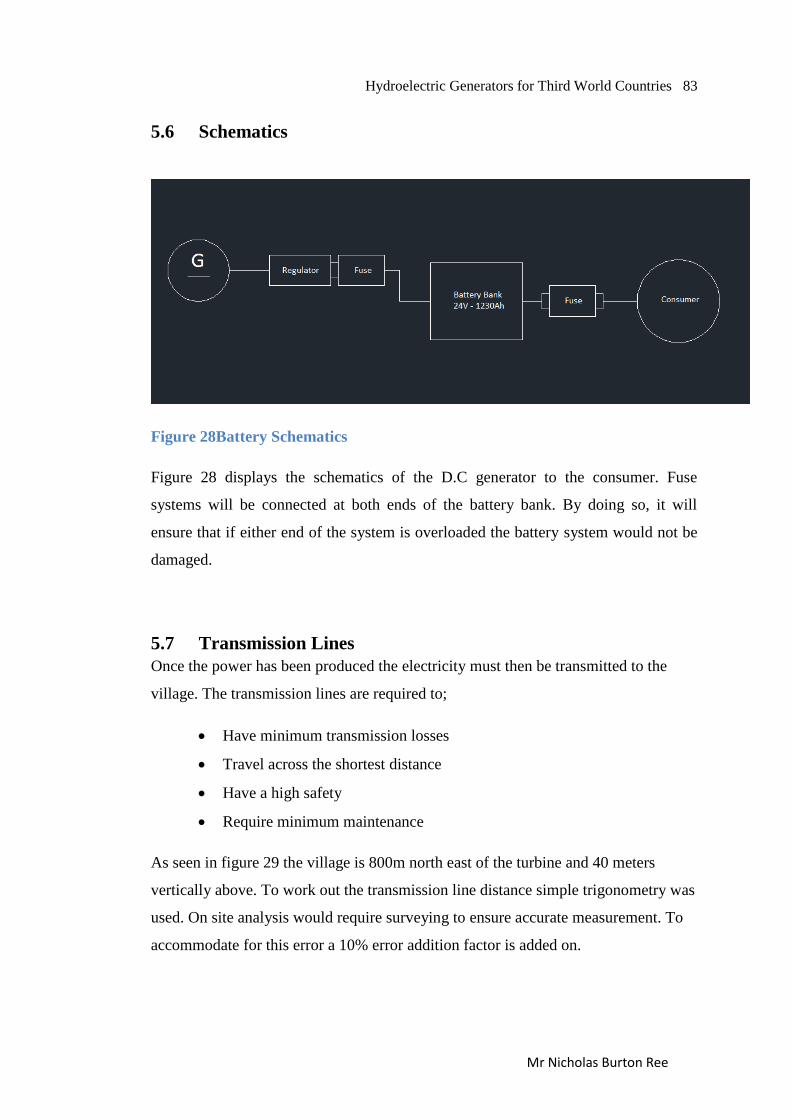
Hydroelectric Generators for Third World Countries 83
Mr Nicholas Burton Ree
5.6 Schematics
Figure 28Battery Schematics
Figure 28 displays the schematics of the D.C generator to the consumer. Fuse
systems will be connected at both ends of the battery bank. By doing so, it will
ensure that if either end of the system is overloaded the battery system would not be
damaged.
5.7 Transmission Lines
Once the power has been produced the electricity must then be transmitted to the
village. The transmission lines are required to;
Have minimum transmission losses
Travel across the shortest distance
Have a high safety
Require minimum maintenance
As seen in figure 29 the village is 800m north east of the turbine and 40 meters
vertically above. To work out the transmission line distance simple trigonometry was
used. On site analysis would require surveying to ensure accurate measurement. To
accommodate for this error a 10% error addition factor is added on.
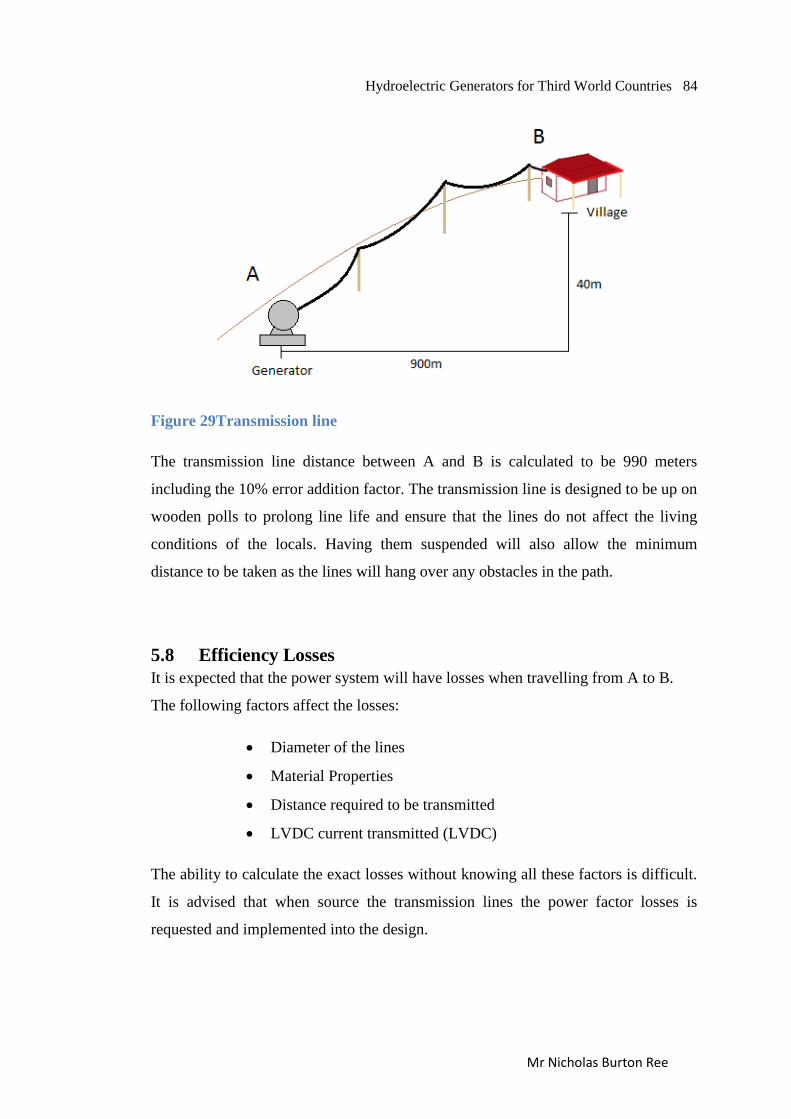
Hydroelectric Generators for Third World Countries 84
Mr Nicholas Burton Ree
Figure 29Transmission line
The transmission line distance between A and B is calculated to be 990 meters
including the 10% error addition factor. The transmission line is designed to be up on
wooden polls to prolong line life and ensure that the lines do not affect the living
conditions of the locals. Having them suspended will also allow the minimum
distance to be taken as the lines will hang over any obstacles in the path.
5.8 Efficiency Losses
It is expected that the power system will have losses when travelling from A to B.
The following factors affect the losses:
Diameter of the lines
Material Properties
Distance required to be transmitted
LVDC current transmitted (LVDC)
The ability to calculate the exact losses without knowing all these factors is difficult.
It is advised that when source the transmission lines the power factor losses is
requested and implemented into the design.
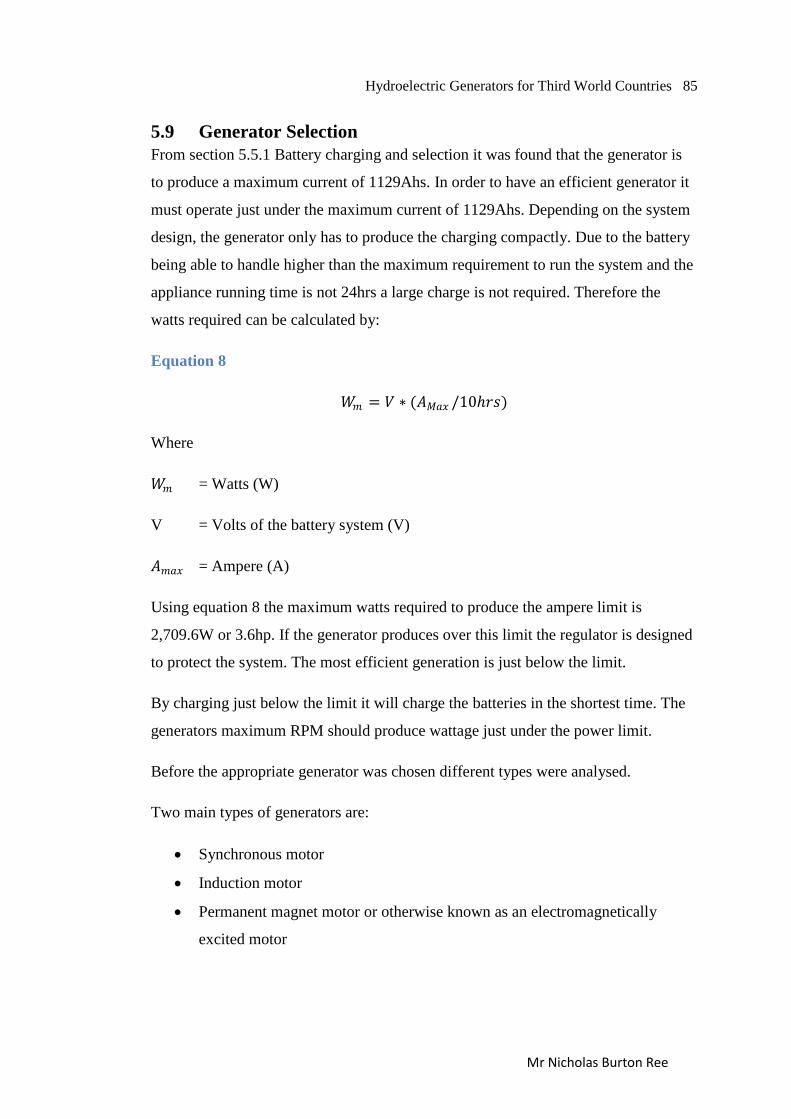
Hydroelectric Generators for Third World Countries 85
Mr Nicholas Burton Ree
5.9 Generator Selection
From section 5.5.1 Battery charging and selection it was found that the generator is
to produce a maximum current of 1129Ahs. In order to have an efficient generator it
must operate just under the maximum current of 1129Ahs. Depending on the system
design, the generator only has to produce the charging compactly. Due to the battery
being able to handle higher than the maximum requirement to run the system and the
appliance running time is not 24hrs a large charge is not required. Therefore the
watts required can be calculated by:
Equation 8
𝑊𝑚 = 𝑉 ∗ (𝐴𝑀𝑎𝑥 /10𝑟𝑠)
Where
𝑊𝑚 = Watts (W)
V = Volts of the battery system (V)
𝐴𝑚𝑎𝑥 = Ampere (A)
Using equation 8 the maximum watts required to produce the ampere limit is
2,709.6W or 3.6hp. If the generator produces over this limit the regulator is designed
to protect the system. The most efficient generation is just below the limit.
By charging just below the limit it will charge the batteries in the shortest time. The
generators maximum RPM should produce wattage just under the power limit.
Before the appropriate generator was chosen different types were analysed.
Two main types of generators are:
Synchronous motor
Induction motor
Permanent magnet motor or otherwise known as an electromagnetically
excited motor
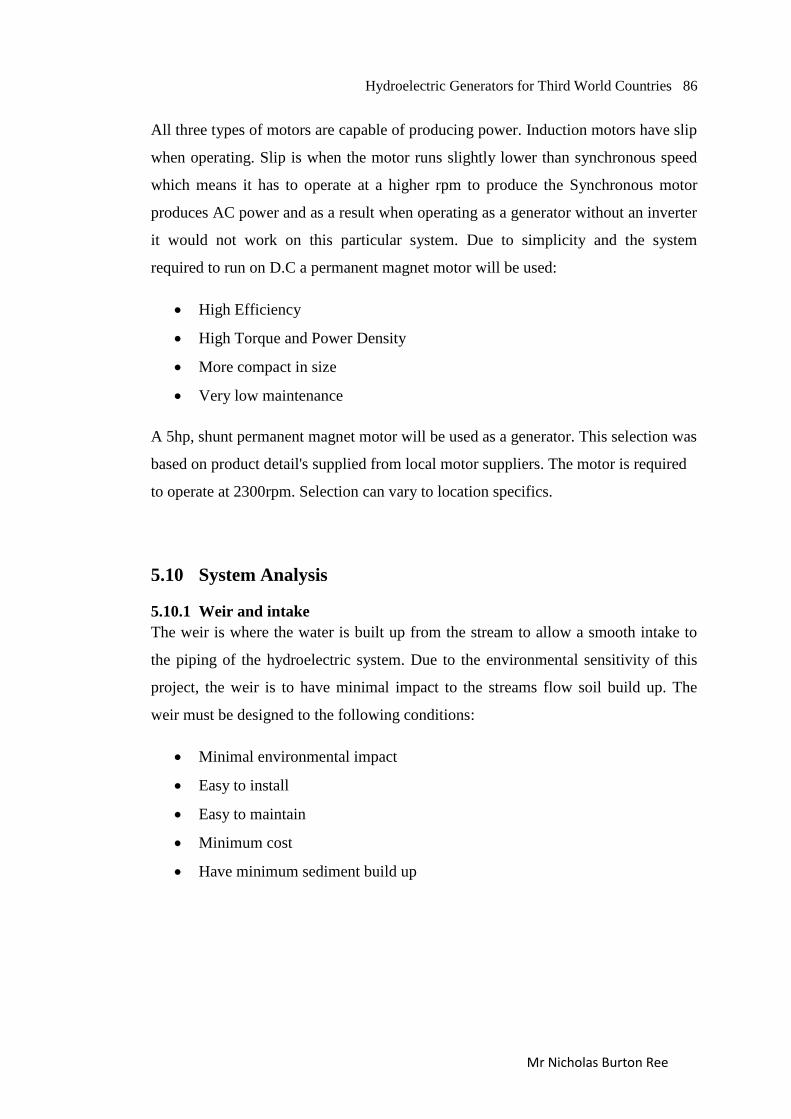
Hydroelectric Generators for Third World Countries 86
Mr Nicholas Burton Ree
All three types of motors are capable of producing power. Induction motors have slip
when operating. Slip is when the motor runs slightly lower than synchronous speed
which means it has to operate at a higher rpm to produce the Synchronous motor
produces AC power and as a result when operating as a generator without an inverter
it would not work on this particular system. Due to simplicity and the system
required to run on D.C a permanent magnet motor will be used:
High Efficiency
High Torque and Power Density
More compact in size
Very low maintenance
A 5hp, shunt permanent magnet motor will be used as a generator. This selection was
based on product detail's supplied from local motor suppliers. The motor is required
to operate at 2300rpm. Selection can vary to location specifics.
5.10 System Analysis
5.10.1 Weir and intake
The weir is where the water is built up from the stream to allow a smooth intake to
the piping of the hydroelectric system. Due to the environmental sensitivity of this
project, the weir is to have minimal impact to the streams flow soil build up. The
weir must be designed to the following conditions:
Minimal environmental impact
Easy to install
Easy to maintain
Minimum cost
Have minimum sediment build up
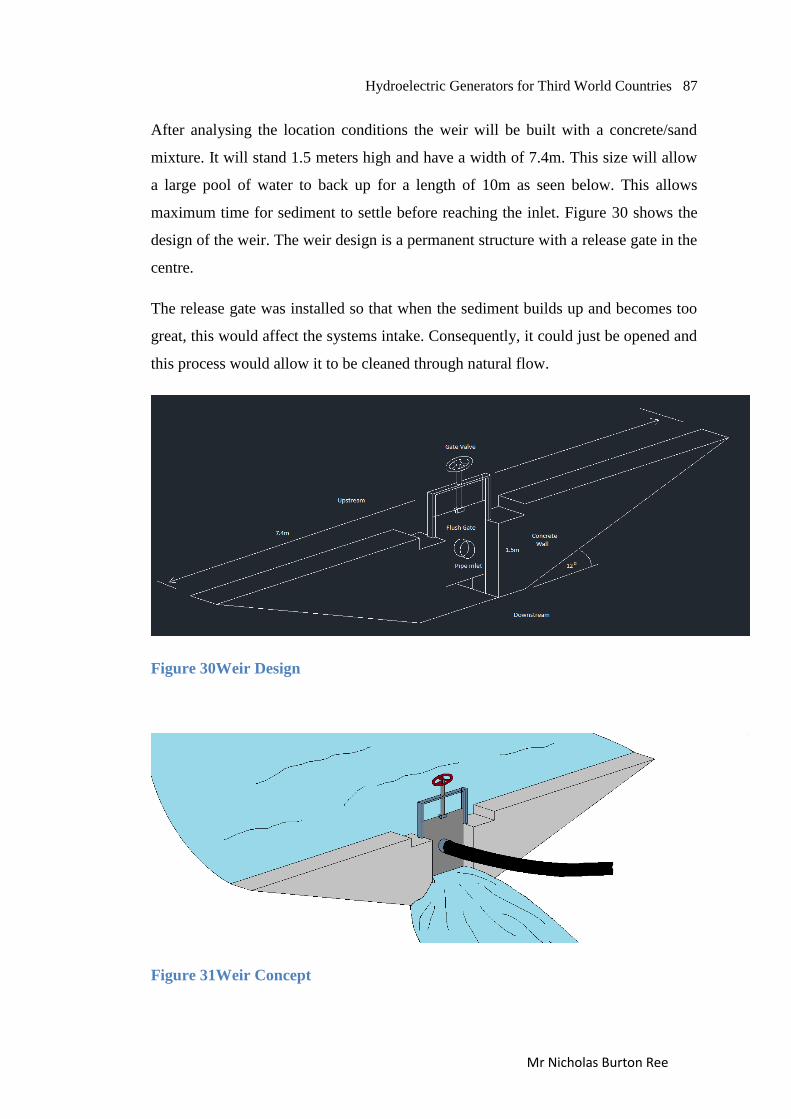
Hydroelectric Generators for Third World Countries 87
Mr Nicholas Burton Ree
After analysing the location conditions the weir will be built with a concrete/sand
mixture. It will stand 1.5 meters high and have a width of 7.4m. This size will allow
a large pool of water to back up for a length of 10m as seen below. This allows
maximum time for sediment to settle before reaching the inlet. Figure 30 shows the
design of the weir. The weir design is a permanent structure with a release gate in the
centre.
The release gate was installed so that when the sediment builds up and becomes too
great, this would affect the systems intake. Consequently, it could just be opened and
this process would allow it to be cleaned through natural flow.
Figure 30Weir Design
Figure 31Weir Concept
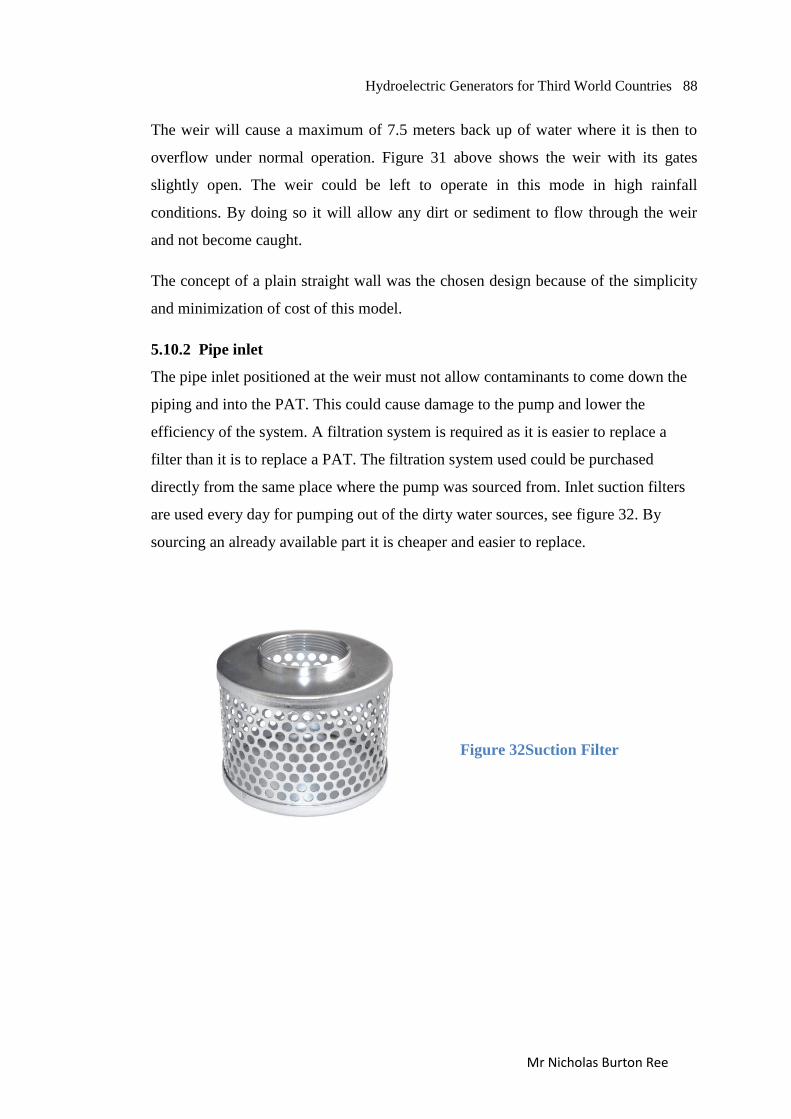
Hydroelectric Generators for Third World Countries 88
Mr Nicholas Burton Ree
The weir will cause a maximum of 7.5 meters back up of water where it is then to
overflow under normal operation. Figure 31 above shows the weir with its gates
slightly open. The weir could be left to operate in this mode in high rainfall
conditions. By doing so it will allow any dirt or sediment to flow through the weir
and not become caught.
The concept of a plain straight wall was the chosen design because of the simplicity
and minimization of cost of this model.
5.10.2 Pipe inlet
The pipe inlet positioned at the weir must not allow contaminants to come down the
piping and into the PAT. This could cause damage to the pump and lower the
efficiency of the system. A filtration system is required as it is easier to replace a
filter than it is to replace a PAT. The filtration system used could be purchased
directly from the same place where the pump was sourced from. Inlet suction filters
are used every day for pumping out of the dirty water sources, see figure 32. By
sourcing an already available part it is cheaper and easier to replace.
Figure 32Suction Filter

Hydroelectric Generators for Third World Countries 89
Mr Nicholas Burton Ree
5.10.3 Piping
The piping is required to transport the volume of water to the inlet of the PAT system
with:
Minimum Turbulence
Minimum Friction resistance
Low maintenance
Low cost
A six inch diameter pipe was chosen as it causes minimum turbulence. The smaller
diameter of the piping to the system, the lower the dynamic pressure will be at the
end. Although, further investigation of diameters would prove to be more cost
effective.
However, as stated in chapter two „the main focus of cost is on the pump as a turbine
compared to a conventional turbine because regardless of what system is chosen the
same piping, weir and pipe inlet will be used‟. The easiest to source detailed
information on, is the pipe diameter and it is also the most common size to find.
5.10.4 Pipe Materials
Before a piping material could be chosen, different types must be analysed. All
prices calculated were on average for a 6 inch diameter.
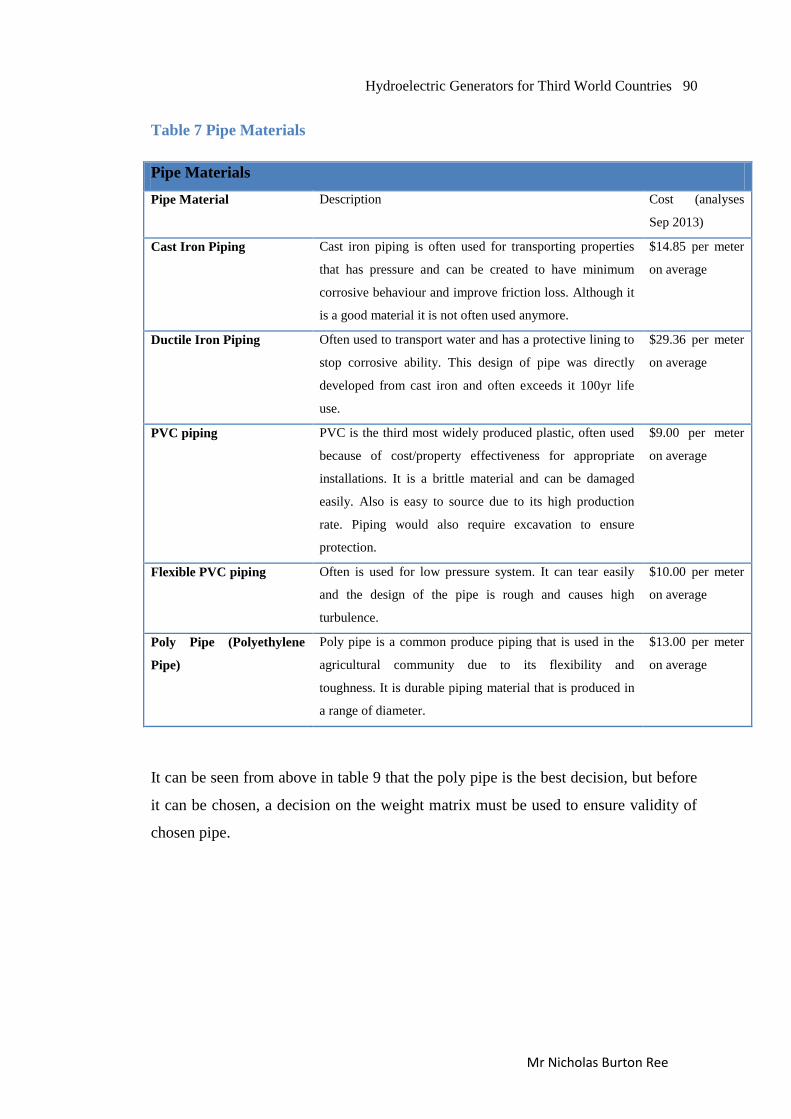
Hydroelectric Generators for Third World Countries 90
Mr Nicholas Burton Ree
Table 7 Pipe Materials
Pipe Materials
Pipe Material Description Cost (analyses
Sep 2013)
Cast Iron Piping Cast iron piping is often used for transporting properties
that has pressure and can be created to have minimum
corrosive behaviour and improve friction loss. Although it
is a good material it is not often used anymore.
$14.85 per meter
on average
Ductile Iron Piping Often used to transport water and has a protective lining to
stop corrosive ability. This design of pipe was directly
developed from cast iron and often exceeds it 100yr life
use.
$29.36 per meter
on average
PVC piping PVC is the third most widely produced plastic, often used
because of cost/property effectiveness for appropriate
installations. It is a brittle material and can be damaged
easily. Also is easy to source due to its high production
rate. Piping would also require excavation to ensure
protection.
$9.00 per meter
on average
Flexible PVC piping Often is used for low pressure system. It can tear easily
and the design of the pipe is rough and causes high
turbulence.
$10.00 per meter
on average
Poly Pipe (Polyethylene
Pipe)
Poly pipe is a common produce piping that is used in the
agricultural community due to its flexibility and
toughness. It is durable piping material that is produced in
a range of diameter.
$13.00 per meter
on average
It can be seen from above in table 9 that the poly pipe is the best decision, but before
it can be chosen, a decision on the weight matrix must be used to ensure validity of
chosen pipe.
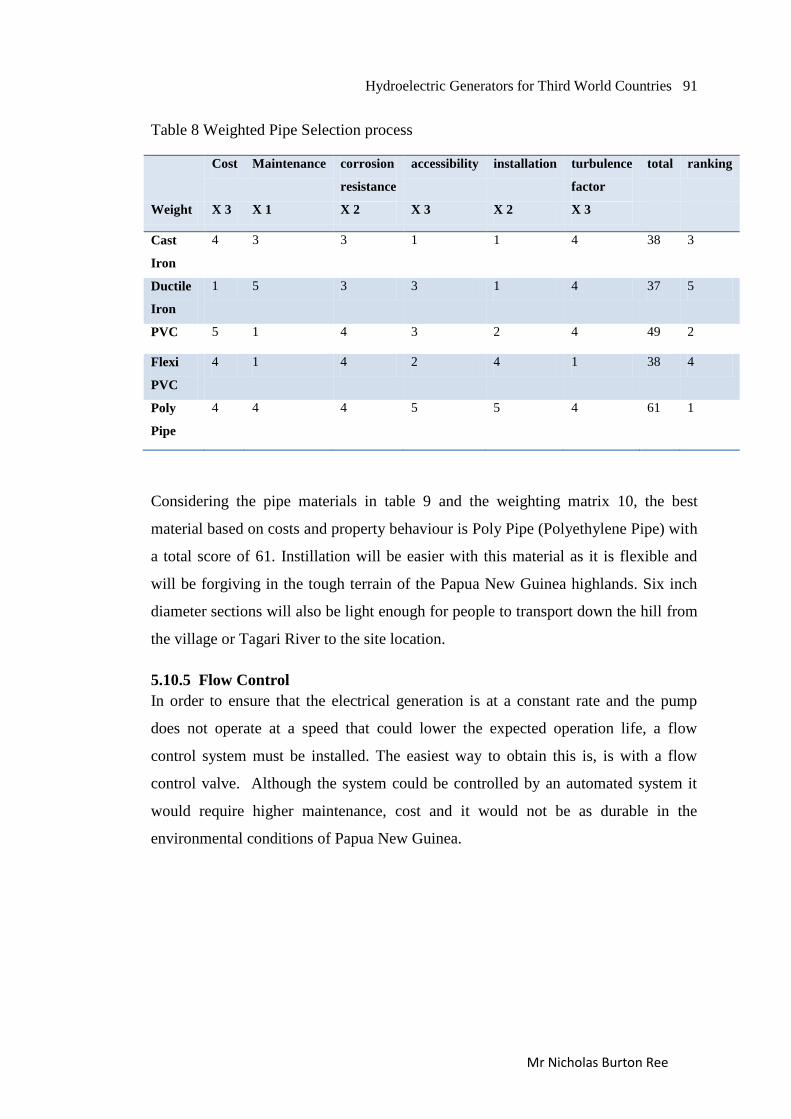
Hydroelectric Generators for Third World Countries 91
Mr Nicholas Burton Ree
Table 8 Weighted Pipe Selection process
Cost Maintenance corrosion
resistance
accessibility installation turbulence
factor
total ranking
Weight X 3 X 1 X 2 X 3 X 2 X 3
Cast
Iron
4 3 3 1 1 4 38 3
Ductile
Iron
1 5 3 3 1 4 37 5
PVC 5 1 4 3 2 4 49 2
Flexi
PVC
4 1 4 2 4 1 38 4
Poly
Pipe
4 4 4 5 5 4 61 1
Considering the pipe materials in table 9 and the weighting matrix 10, the best
material based on costs and property behaviour is Poly Pipe (Polyethylene Pipe) with
a total score of 61. Instillation will be easier with this material as it is flexible and
will be forgiving in the tough terrain of the Papua New Guinea highlands. Six inch
diameter sections will also be light enough for people to transport down the hill from
the village or Tagari River to the site location.
5.10.5 Flow Control
In order to ensure that the electrical generation is at a constant rate and the pump
does not operate at a speed that could lower the expected operation life, a flow
control system must be installed. The easiest way to obtain this is, is with a flow
control valve. Although the system could be controlled by an automated system it
would require higher maintenance, cost and it would not be as durable in the
environmental conditions of Papua New Guinea.
Hydroelectric Generators for Third World Countries 92
Mr Nicholas Burton Ree
The flow control system is required to ensure:
Minimum turbulence is maintained
Flow adjustment must be easy and accurate. (no movement in opening)
Cost effective
Two control valves will be used: Firstly, installed at the weir to allow the inlet to be
closed and turned off in case of maintenance and floods. Secondly, installed just
before the inlet of the pump. From the PAT analysis and piping selection the
diameters are inlet 1 = 6 inch and 2 = 11
4 inch. Flow control could be obtained by the
valve at the weir but it would require a patron to walk to the weir every time an
adjustment is required. In an emergency where immediate control is required this
would prove to an inefficient option.
5.10.5 Flow control valves
Before a particular flow control system could be chosen, the different types were
analysed. K values were sourced from „Friction Losses in pipe fitting‟ found.
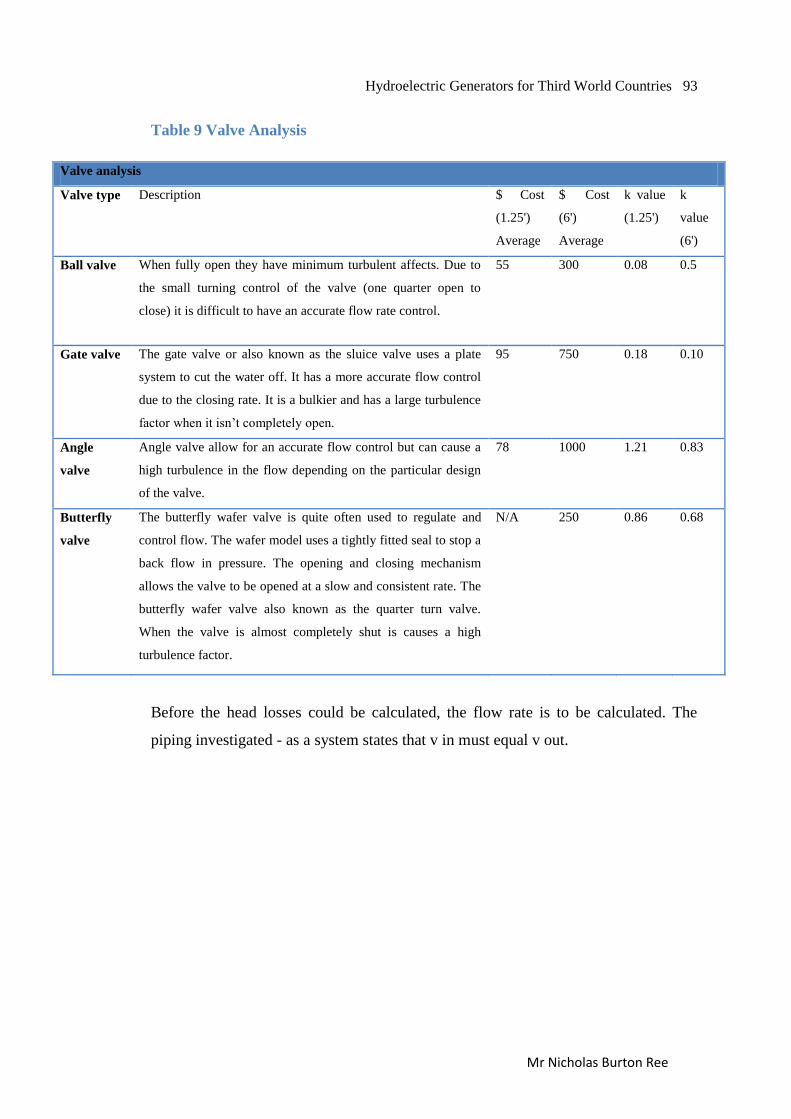
Hydroelectric Generators for Third World Countries 93
Mr Nicholas Burton Ree
Table 9 Valve Analysis
Valve analysis
Valve type Description $ Cost
(1.25')
Average
$ Cost
(6')
Average
k value
(1.25')
k
value
(6')
Ball valve When fully open they have minimum turbulent affects. Due to
the small turning control of the valve (one quarter open to
close) it is difficult to have an accurate flow rate control.
55 300 0.08 0.5
Gate valve The gate valve or also known as the sluice valve uses a plate
system to cut the water off. It has a more accurate flow control
due to the closing rate. It is a bulkier and has a large turbulence
factor when it isn‟t completely open.
95 750 0.18 0.10
Angle
valve
Angle valve allow for an accurate flow control but can cause a
high turbulence in the flow depending on the particular design
of the valve.
78 1000 1.21 0.83
Butterfly
valve
The butterfly wafer valve is quite often used to regulate and
control flow. The wafer model uses a tightly fitted seal to stop a
back flow in pressure. The opening and closing mechanism
allows the valve to be opened at a slow and consistent rate. The
butterfly wafer valve also known as the quarter turn valve.
When the valve is almost completely shut is causes a high
turbulence factor.
N/A 250 0.86 0.68
Before the head losses could be calculated, the flow rate is to be calculated. The
piping investigated - as a system states that v in must equal v out.
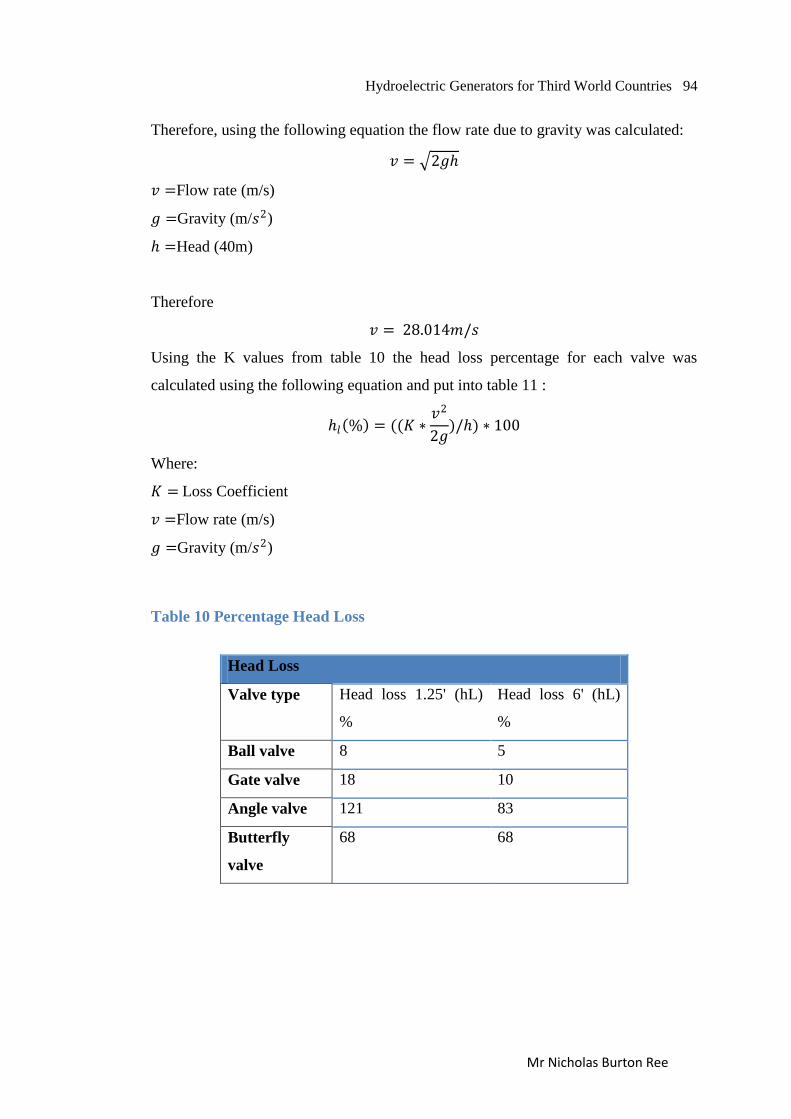
Hydroelectric Generators for Third World Countries 94
Mr Nicholas Burton Ree
Therefore, using the following equation the flow rate due to gravity was calculated:
𝑣 = 2𝑔
𝑣 =Flow rate (m/s)
𝑔 =Gravity (m/𝑠2)
=Head (40m)
Therefore
𝑣 = 28.014𝑚/𝑠
Using the K values from table 10 the head loss percentage for each valve was
calculated using the following equation and put into table 11 :
𝑙 % = ((𝐾 ∗𝑣2
2𝑔)/) ∗ 100
Where:
𝐾 = Loss Coefficient
𝑣 =Flow rate (m/s)
𝑔 =Gravity (m/𝑠2)
Table 10 Percentage Head Loss
Head Loss
Valve type Head loss 1.25' (hL)
%
Head loss 6' (hL)
%
Ball valve 8 5
Gate valve 18 10
Angle valve 121 83
Butterfly
valve
68 68
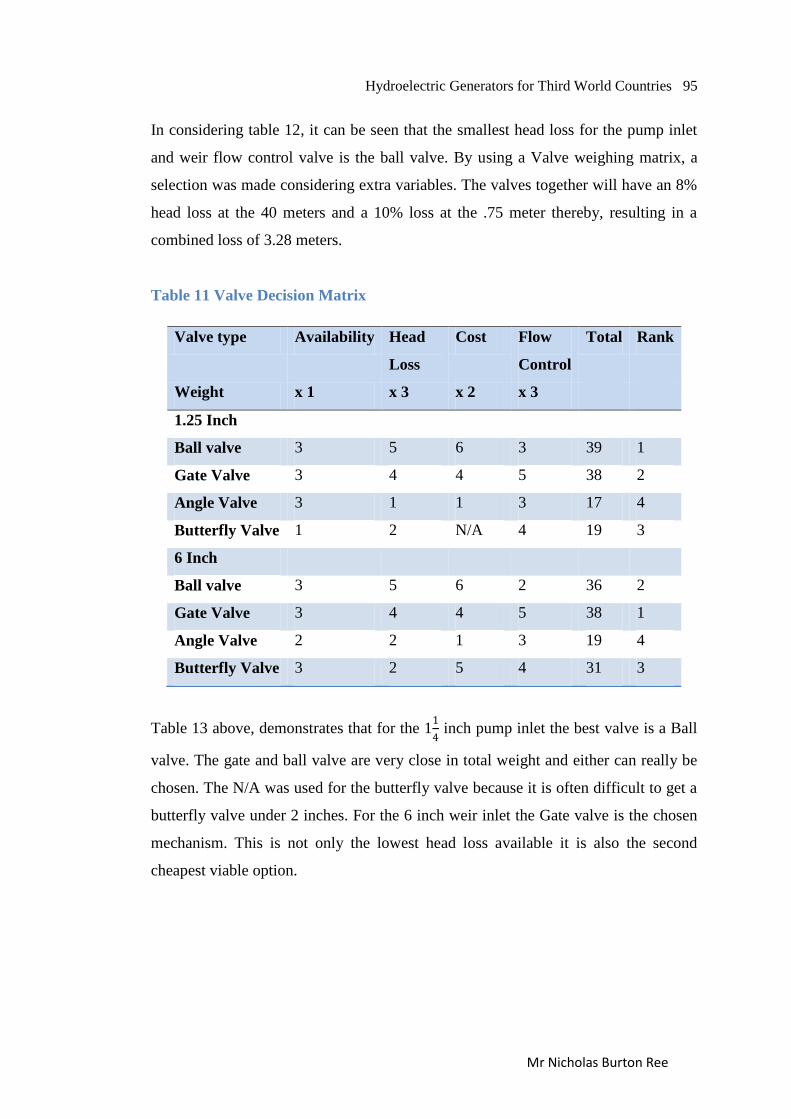
Hydroelectric Generators for Third World Countries 95
Mr Nicholas Burton Ree
In considering table 12, it can be seen that the smallest head loss for the pump inlet
and weir flow control valve is the ball valve. By using a Valve weighing matrix, a
selection was made considering extra variables. The valves together will have an 8%
head loss at the 40 meters and a 10% loss at the .75 meter thereby, resulting in a
combined loss of 3.28 meters.
Table 11 Valve Decision Matrix
Valve type Availability Head
Loss
Cost Flow
Control
Total Rank
Weight x 1 x 3 x 2 x 3
1.25 Inch
Ball valve 3 5 6 3 39 1
Gate Valve 3 4 4 5 38 2
Angle Valve 3 1 1 3 17 4
Butterfly Valve 1 2 N/A 4 19 3
6 Inch
Ball valve 3 5 6 2 36 2
Gate Valve 3 4 4 5 38 1
Angle Valve 2 2 1 3 19 4
Butterfly Valve 3 2 5 4 31 3
Table 13 above, demonstrates that for the 11
4 inch pump inlet the best valve is a Ball
valve. The gate and ball valve are very close in total weight and either can really be
chosen. The N/A was used for the butterfly valve because it is often difficult to get a
butterfly valve under 2 inches. For the 6 inch weir inlet the Gate valve is the chosen
mechanism. This is not only the lowest head loss available it is also the second
cheapest viable option.
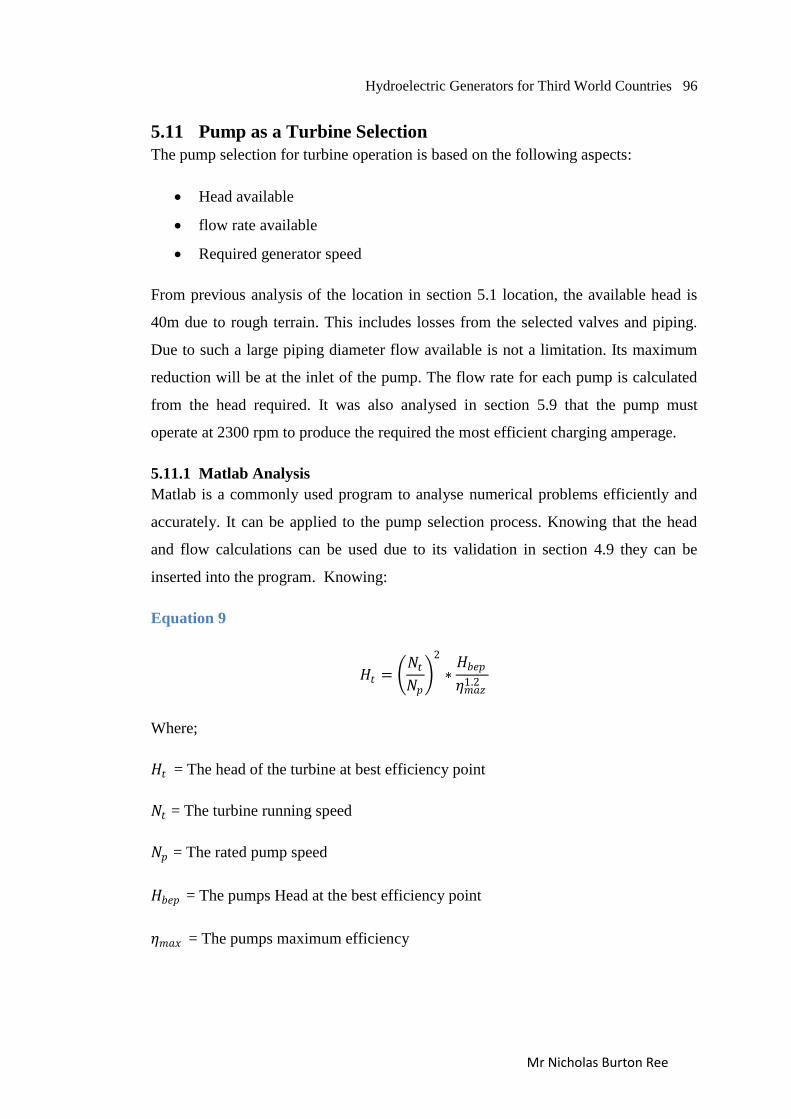
Hydroelectric Generators for Third World Countries 96
Mr Nicholas Burton Ree
5.11 Pump as a Turbine Selection
The pump selection for turbine operation is based on the following aspects:
Head available
flow rate available
Required generator speed
From previous analysis of the location in section 5.1 location, the available head is
40m due to rough terrain. This includes losses from the selected valves and piping.
Due to such a large piping diameter flow available is not a limitation. Its maximum
reduction will be at the inlet of the pump. The flow rate for each pump is calculated
from the head required. It was also analysed in section 5.9 that the pump must
operate at 2300 rpm to produce the required the most efficient charging amperage.
5.11.1 Matlab Analysis
Matlab is a commonly used program to analyse numerical problems efficiently and
accurately. It can be applied to the pump selection process. Knowing that the head
and flow calculations can be used due to its validation in section 4.9 they can be
inserted into the program. Knowing:
Equation 9
𝐻𝑡 = 𝑁𝑡𝑁𝑝
2
∗𝐻𝑏𝑒𝑝
𝜂𝑚𝑎𝑧1.2
Where;
𝐻𝑡 = The head of the turbine at best efficiency point
𝑁𝑡 = The turbine running speed
𝑁𝑝 = The rated pump speed
𝐻𝑏𝑒𝑝 = The pumps Head at the best efficiency point
𝜂𝑚𝑎𝑥 = The pumps maximum efficiency

Hydroelectric Generators for Third World Countries 97
Mr Nicholas Burton Ree
And
Equation 10
𝑄𝑡 =𝑁𝑡𝑁𝑝
∗𝑄𝑏𝑒𝑝
𝜂𝑚𝑎𝑧0.8
Where;
𝑄𝑡 = The flow rate of the turbine at best efficiency point
𝑁𝑡 = The turbine running speed
𝑁𝑝 = The rated pump speed
𝑄𝑏𝑒𝑝 = The pumps flow rate at the best efficiency point
𝜂𝑚𝑎𝑥 = The pumps maximum efficiency
Figure 33 below shows the process of the Matlab programming used. The centrifugal
pump data which is found in appendix B was input into the pump model A
component. Using the program it was analysed against the site requirement
conditions, where it was then output depending if true or false was satisfied with the
site conditions. The resultant output was then given a statement to allow it to be
identified before it was output into the command window.
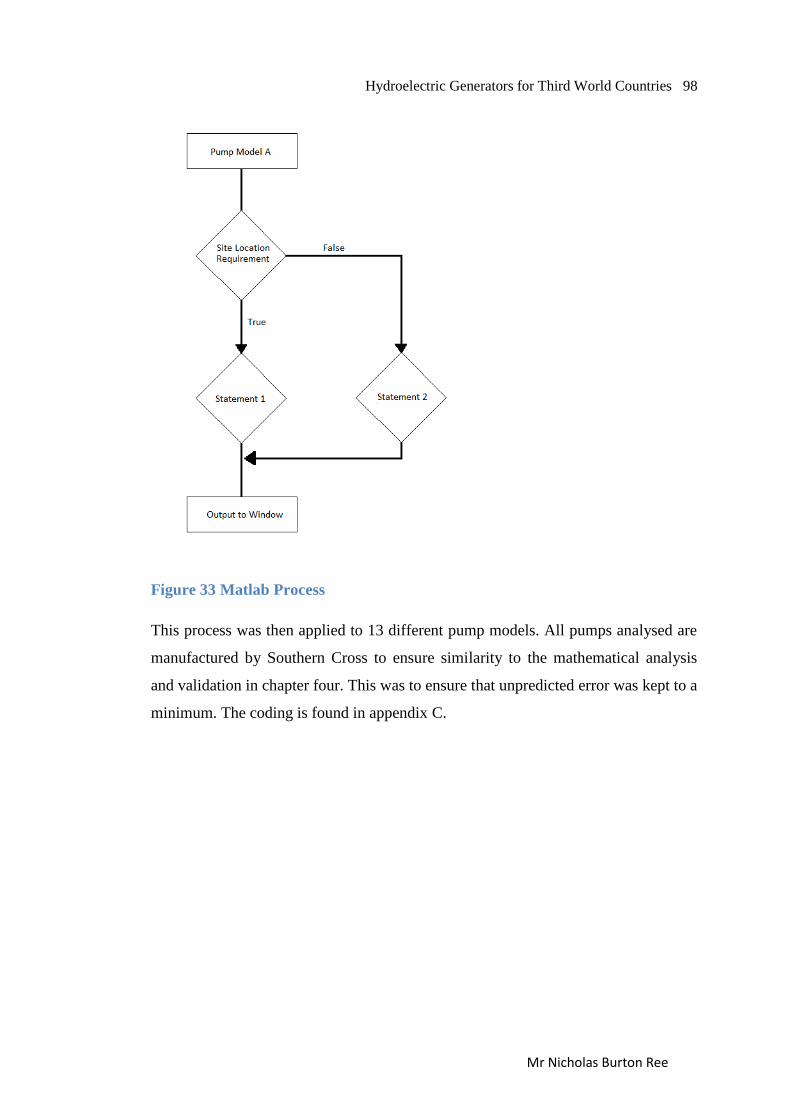
Hydroelectric Generators for Third World Countries 98
Mr Nicholas Burton Ree
Figure 33 Matlab Process
This process was then applied to 13 different pump models. All pumps analysed are
manufactured by Southern Cross to ensure similarity to the mathematical analysis
and validation in chapter four. This was to ensure that unpredicted error was kept to a
minimum. The coding is found in appendix C.
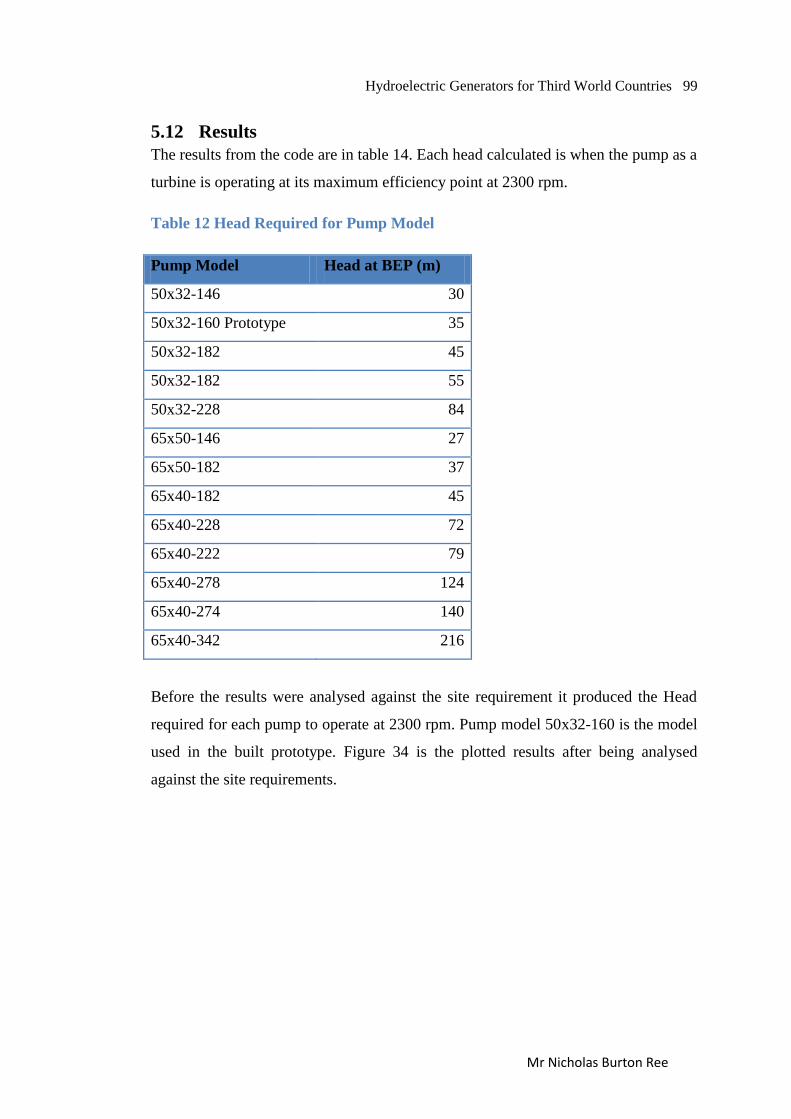
Hydroelectric Generators for Third World Countries 99
Mr Nicholas Burton Ree
5.12 Results
The results from the code are in table 14. Each head calculated is when the pump as a
turbine is operating at its maximum efficiency point at 2300 rpm.
Table 12 Head Required for Pump Model
Pump Model Head at BEP (m)
50x32-146 30
50x32-160 Prototype 35
50x32-182 45
50x32-182 55
50x32-228 84
65x50-146 27
65x50-182 37
65x40-182 45
65x40-228 72
65x40-222 79
65x40-278 124
65x40-274 140
65x40-342 216
Before the results were analysed against the site requirement it produced the Head
required for each pump to operate at 2300 rpm. Pump model 50x32-160 is the model
used in the built prototype. Figure 34 is the plotted results after being analysed
against the site requirements.
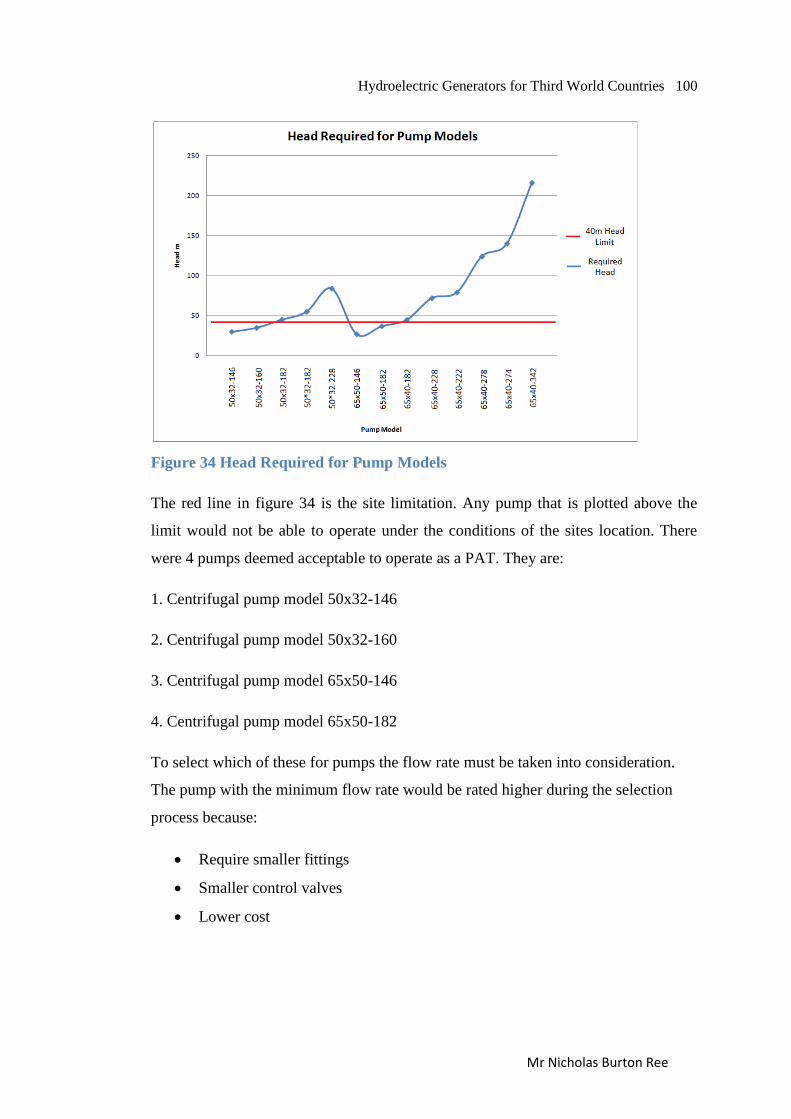
Hydroelectric Generators for Third World Countries 100
Mr Nicholas Burton Ree
Figure 34 Head Required for Pump Models
The red line in figure 34 is the site limitation. Any pump that is plotted above the
limit would not be able to operate under the conditions of the sites location. There
were 4 pumps deemed acceptable to operate as a PAT. They are:
1. Centrifugal pump model 50x32-146
2. Centrifugal pump model 50x32-160
3. Centrifugal pump model 65x50-146
4. Centrifugal pump model 65x50-182
To select which of these for pumps the flow rate must be taken into consideration.
The pump with the minimum flow rate would be rated higher during the selection
process because:
Require smaller fittings
Smaller control valves
Lower cost
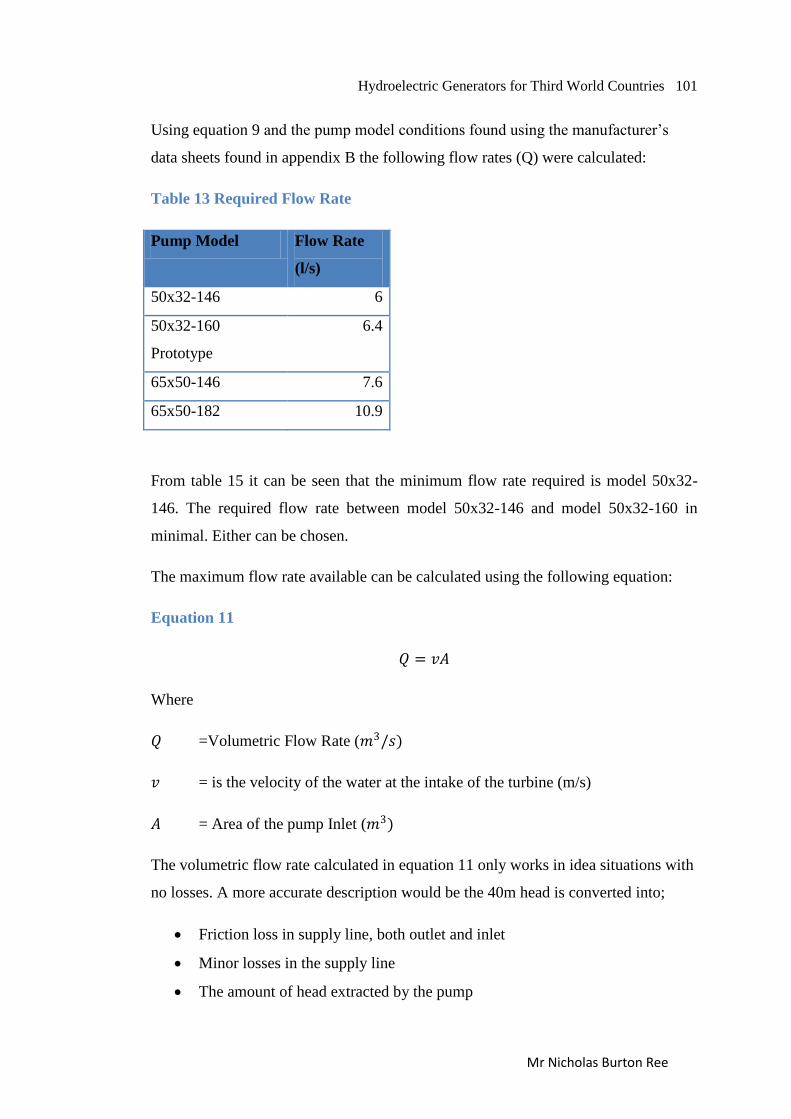
Hydroelectric Generators for Third World Countries 101
Mr Nicholas Burton Ree
Using equation 9 and the pump model conditions found using the manufacturer‟s
data sheets found in appendix B the following flow rates (Q) were calculated:
Table 13 Required Flow Rate
Pump Model Flow Rate
(l/s)
50x32-146 6
50x32-160
Prototype
6.4
65x50-146 7.6
65x50-182 10.9
From table 15 it can be seen that the minimum flow rate required is model 50x32-
146. The required flow rate between model 50x32-146 and model 50x32-160 in
minimal. Either can be chosen.
The maximum flow rate available can be calculated using the following equation:
Equation 11
𝑄 = 𝑣𝐴
Where
𝑄 =Volumetric Flow Rate (𝑚3/𝑠)
𝑣 = is the velocity of the water at the intake of the turbine (m/s)
𝐴 = Area of the pump Inlet (𝑚3)
The volumetric flow rate calculated in equation 11 only works in idea situations with
no losses. A more accurate description would be the 40m head is converted into;
Friction loss in supply line, both outlet and inlet
Minor losses in the supply line
The amount of head extracted by the pump
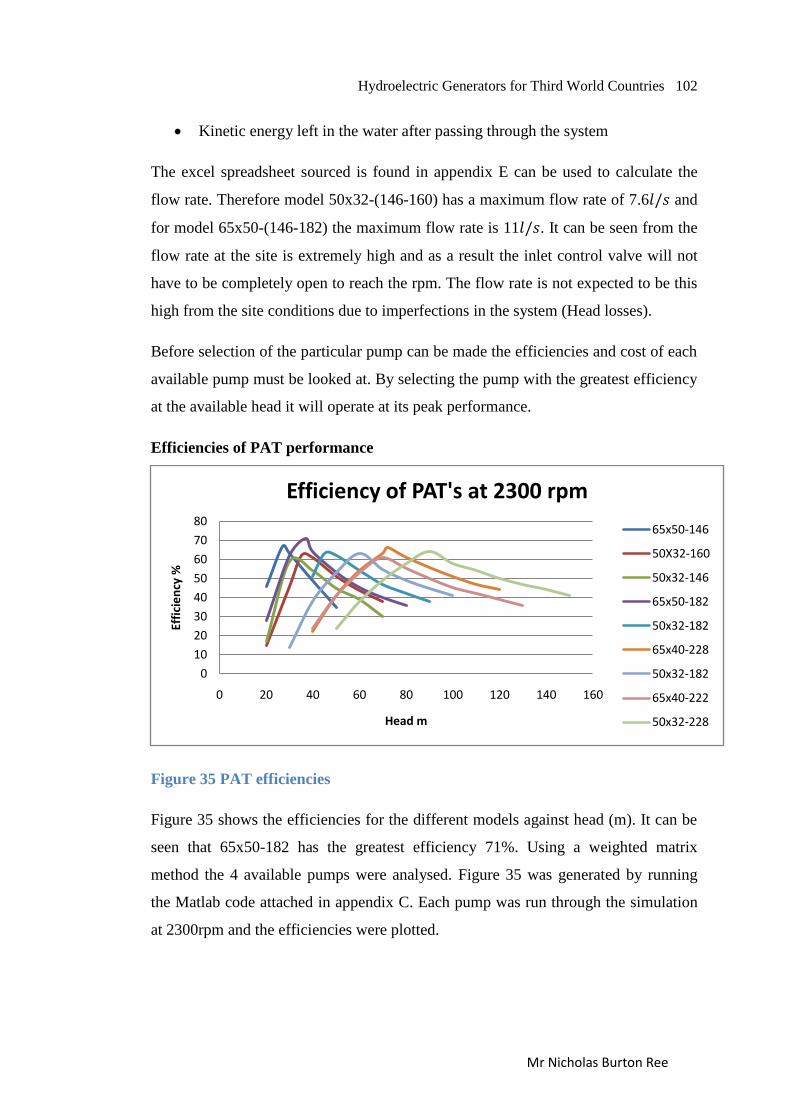
Hydroelectric Generators for Third World Countries 102
Mr Nicholas Burton Ree
Kinetic energy left in the water after passing through the system
The excel spreadsheet sourced is found in appendix E can be used to calculate the
flow rate. Therefore model 50x32-(146-160) has a maximum flow rate of 7.6𝑙/𝑠 and
for model 65x50-(146-182) the maximum flow rate is 11𝑙/𝑠. It can be seen from the
flow rate at the site is extremely high and as a result the inlet control valve will not
have to be completely open to reach the rpm. The flow rate is not expected to be this
high from the site conditions due to imperfections in the system (Head losses).
Before selection of the particular pump can be made the efficiencies and cost of each
available pump must be looked at. By selecting the pump with the greatest efficiency
at the available head it will operate at its peak performance.
Efficiencies of PAT performance
Figure 35 PAT efficiencies
Figure 35 shows the efficiencies for the different models against head (m). It can be
seen that 65x50-182 has the greatest efficiency 71%. Using a weighted matrix
method the 4 available pumps were analysed. Figure 35 was generated by running
the Matlab code attached in appendix C. Each pump was run through the simulation
at 2300rpm and the efficiencies were plotted.
0
10
20
30
40
50
60
70
80
0 20 40 60 80 100 120 140 160
Effi
cie
ncy
%
Head m
Efficiency of PAT's at 2300 rpm
65x50-146
50X32-160
50x32-146
65x50-182
50x32-182
65x40-228
50x32-182
65x40-222
50x32-228
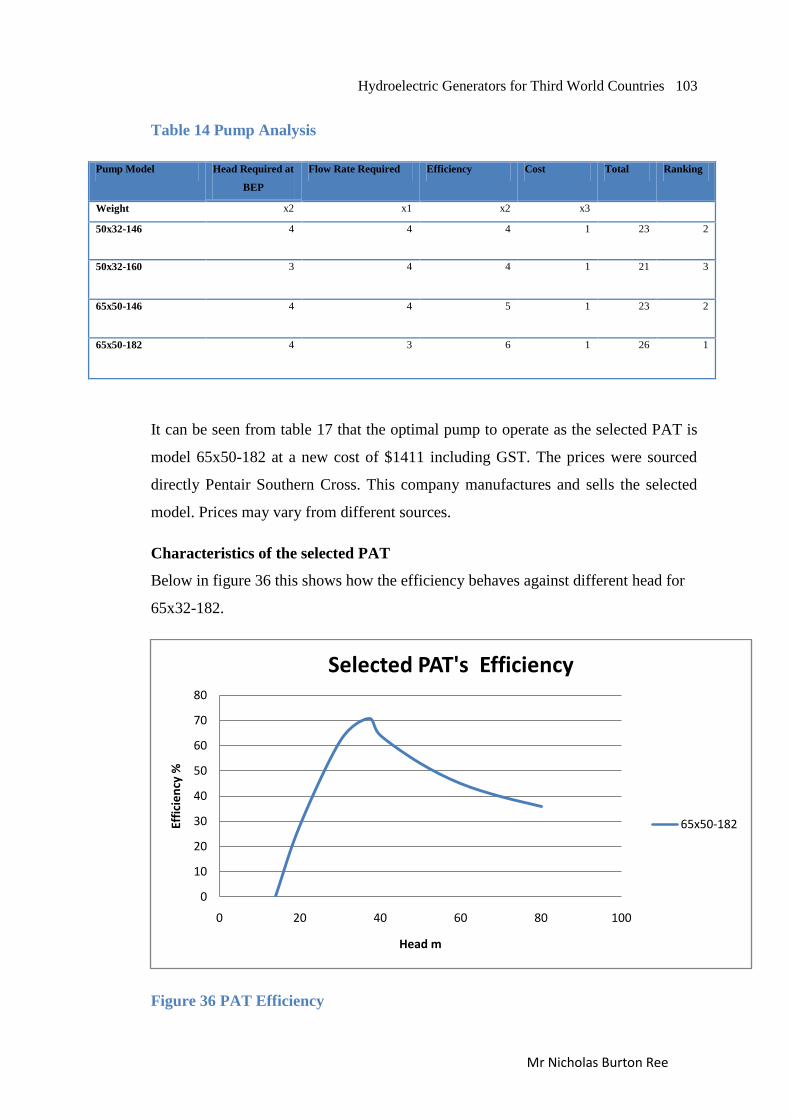
Hydroelectric Generators for Third World Countries 103
Mr Nicholas Burton Ree
Table 14 Pump Analysis
Pump Model Head Required at
BEP
Flow Rate Required Efficiency Cost Total Ranking
Weight x2 x1 x2 x3
50x32-146 4 4 4 1 23 2
50x32-160 3 4 4 1 21 3
65x50-146 4 4 5 1 23 2
65x50-182 4 3 6 1 26 1
It can be seen from table 17 that the optimal pump to operate as the selected PAT is
model 65x50-182 at a new cost of $1411 including GST. The prices were sourced
directly Pentair Southern Cross. This company manufactures and sells the selected
model. Prices may vary from different sources.
Characteristics of the selected PAT
Below in figure 36 this shows how the efficiency behaves against different head for
65x32-182.
Figure 36 PAT Efficiency
0
10
20
30
40
50
60
70
80
0 20 40 60 80 100
Effi
cie
ncy
%
Head m
Selected PAT's Efficiency
65x50-182
Hydroelectric Generators for Third World Countries 104
Mr Nicholas Burton Ree
By rearranging the mathematical relationship (equation 7) it can be seen that the
maximum efficiency reached by the PAT is 71% at 37 meters. It was also found that
if the flow drops below 14.8 meters head the PAT will cease operating. Although the
efficiency does drop after 37 meters it does not mean that the speed of the PAT slows
as the head efficiency decreases. It means that the requirement of head and flow to
increase the speed is even greater per unit of water.
5.12.1 Cost
The cost of using a large pump due to the loss in efficiency compared to an average
turbine is greatly compensated by the large reduction in cost due to the pump mass
production. It was found that the reduction in cost using a PAT instead of
conventional turbines makes then more economical than conventional machines. The
cost for the selected PAT is $1411 including GST. This price was sourced from
Southern Cross pump manufactures located in Australia. It is to be noted that the
costs can vary due to the pumps source and condition. By selecting a new pump less
error is to occur from the theoretical analysis due to its operating condition.
Chapter six will present the conclusions of this study.
Hydroelectric Generators for Third World Countries 105
Mr Nicholas Burton Ree
Chapter 6
6.1 Conclusion and further work
The purpose of this dissertation was to investigate the use of a pump used as a
turbine for a small hydroelectric generation system. The work was also created to
show the reader what aspects are to be analysed in a hydroelectric system for a
specific location. The research and analysis of the project was found to prove that the
PAT‟s use was viable. It was found that a pump would operate at a lower efficiency
than a specifically designed turbine, but economically better due to:
Availability of centrifugal pumps
Ease of installation
Cost efficiency
Reliability
Ease of replacement
Mass Manufacturing
In section 5.12 results, it was found that the maximum efficiency for the selected
pumps was 71% at 37m. Thus, meaning that the pump operates at approximately
15% less than a specifically designed turbine.
By building the prototype and testing it under flow conditions, the PAT showed that
the mathematics based in the literature review where validated and deemed accurate.
The experiment also showed that the further the system operates outside of the
operation range, the more the system becomes inaccurate. It was found by testing the
prototype on a 15m head, that it was operating at its minimum limit, resulting in the
data having a level of error that could be deemed influential. By building the
prototype, it proved that the ease and minimal time was required to produce a
hydroelectric generation system.
Small hydro electric generators are restricted because of the condition that they must
be specifically designed and built to for the chosen location. This is not only costly
but also time consuming, often resulting in the small hydroelectric system being
deemed impractical. From the dissertation it was found that a pump analysed
correctly for the location could prove to be successful.
Hydroelectric Generators for Third World Countries 106
Mr Nicholas Burton Ree
Although pumps are limited to small variations of head and flow available, unlike the
specifically designed turbine, the abundance of the different models manufactured
allowed a broad selection at different best operating points (BEP's).
As a pump as a turbine operation was analysed, it was found that depending on the
conditions of the pump itself and how accurate the pump‟s data sheet was, it greatly
affected the head at its best efficiency point (Hbep). As the larger pump sizes were
analysed, its operation was found to vary from what was expected. It was found that
this occurrence was from inaccurate analysis of the pumps data sheet at higher heads
and flow rates. If the manufacturer produces poor quality data sheets, then error is
expected and results could be deemed as inaccurate.
The analysis of the site location proved to be a process that could be completed
theoretically but it was found due to unknown variables, that it will always be
inaccurate when designing systems. The small hydroelectric plant was designed to
produce more than what the average power draw would be expected. By doing so
this allowed for head and power losses that were under calculated and also allowed
the system to be modified for future expansion. If the variables were known, then
this power production factor analysis could be done much more accurately.
Due to the expected lack of skilled operators in the chosen location, the system also
had to be designed to cater for this occurrence. Therefore, if an incident or incorrect
operation of the plant was to occur, there would not be any injuries and a cease of
power production would be a result from the action. As well, by operating the system
on a low voltage direct current (LVDC) system, the chance of a fatal electrocution
was drastically dropped. The hydroelectric generation system for third world
countries would also operate under low maintenance and low running cost. The use
of a pump also means that operation errors would not be as costly. This was due to
the economical benefits of a pump as a turbine (PAT) and as a result of the
maintenance which was not frequently required as a specifically built system was
applied.
Hydroelectric Generators for Third World Countries 107
Mr Nicholas Burton Ree
The use of a PAT in a small hydroelectric system in third world countries is not only
viable but economically better for smaller systems. It is my conclusion, from the
analysis of the system and research in the literature that it is better to sacrifice the
efficiency of a turbine for the ease and readily available pump.
A small power production at a cheaper price is healthier for countries in immediate
need of a small power production than having no power at all.
6.2 Further Work
6.2.1 PAT performance prediction
It was found in chapter five that the larger the PAT the more inaccurate the
theoretical analysis became. It is predicted that this occurs due to the possible
limitation of the PAT application. Although the prediction of the PAT system was
validated using the centrifugal PAT built prototype shown in figure 20 (p.64) further
testing is required at higher applications.
It is suggested that another prototype would be built where the head could be greatly
varied at an accurate rate. Hence, the limit would then be predicted when a limit of
data tolerance was found. Consequently, by doing so, it would allow the
identification of the threshold when a specifically designed turbine becomes not only
more efficient but more economical. The overall process of a PAT system
application would become more efficient and practical. Pumps as turbine systems are
not the common choice of hydroelectric generation due to the lack of understanding
in the system behaviour of its operation. Further analysis would also allow more
information to be readily available for future hydroelectric generator installations and
the builder would be less hesitant in selecting an economical PAT system.
Hydroelectric Generators for Third World Countries 108
Mr Nicholas Burton Ree
6.2.2 Torque available as a PAT
Although the dissertation does look at the operation of different pump models as
turbine it was noted that research into the behaviour of torque was lightly touched
upon. The relationship of the torque produced by a centrifugal pump under normal
operation needs to be related to PAT operation. Although the torque can be
calculated from the generator, this cannot be done during a site analysis with limited
information. The built prototype (P.6) Figure 20 would be modified with a
dynamometer.
6.2.3 Pump as a Turbine information readily available
As discussed earlier, the greatest limitation of a PAT system is the lack of
information and how to apply the system to a particular location in order to allow
optimal information during selection. By producing more detailed reports and
examples of application such as in chapter five in this dissertation, this concept of
PAT applications would thus seem less complicated and therefore, as a result would
be considered more often as a renewable energy source for third world countries.

Hydroelectric Generators for Third World Countries 109
Mr Nicholas Burton Ree
Appendix A
Project Specification

Hydroelectric Generators for Third World Countries 110
Mr Nicholas Burton Ree
University of Southern Queensland
FACULTY OF ENGINEERING AND SURVEYING
ENG 4111/4112 Research Project
PROJECT SPECIFICATION
FOR: Nicholas Burton-Ree
TOPIC: Hydroelectric Generator for Third World Countries
SUPERVISORS: Les Bowtell and Malcolm Gillies
ENROLMENT: ENG 4111 – S1, D, 2013
ENG 4112 – S2, D, 2013
PROJECT AIM: The aim of this project is to design a cheap and simple electric
generator that can be powered by a small creek or stream and
have the capability to produce enough power to run small
appliances.
SPONSORSHIP: UNIVERSITY OF SOUTHERN QUEENSLAND
PROGRAMME: (Issue A, 13 March 2013)
Research into small scale hydroelectric generators
Set design specifications.
- The Generator will be designed to power a small room with a variety of electrical
appliances such as a hospital room which would be expected to need lighting, refrigeration
system and at least one fan. This would require approximately around 6000kw/hr.
-A power storage system will be investigated.
Hydroelectric Generators for Third World Countries 111
Mr Nicholas Burton Ree
-A control limit will be set to manage the speed at which the hydroelectric generator will
run during operation.
Analyse field data gathered from a creek that would be expected to have similarities in flow
and size rate to my targeted areas. This includes the possibility of floods.
Research into petrol/diesel motor generators and find the requirements for the equipment
to produce an output and look into possible design modifications.
Research and testing into gearing system. Find the correct balance between rotations per
minute and torque.
Create mechanical designs and simulate the operation due to the tested flow rate.
Analyse final design and test if it meet the design speciation's set earlier.
Submit academic dissertation
As Time Permits
Look into the ability of having different generator sizes and different water wheel designs
to use on different sizes of water flow.
Build the designed hydroelectric generator.
AGREED Nicholas Burton-Ree
Date: 27 / 03/ 2013
Malcolm Gillies (supervisor) Les Bowtell (supervisor)
Date: 27 / 03/ 2013 Date: 27 / 03/ 2013
Examiner/Co-examiner:

Hydroelectric Generators for Third World Countries 112
Mr Nicholas Burton Ree
Appendix B
Pump Performance Sheets
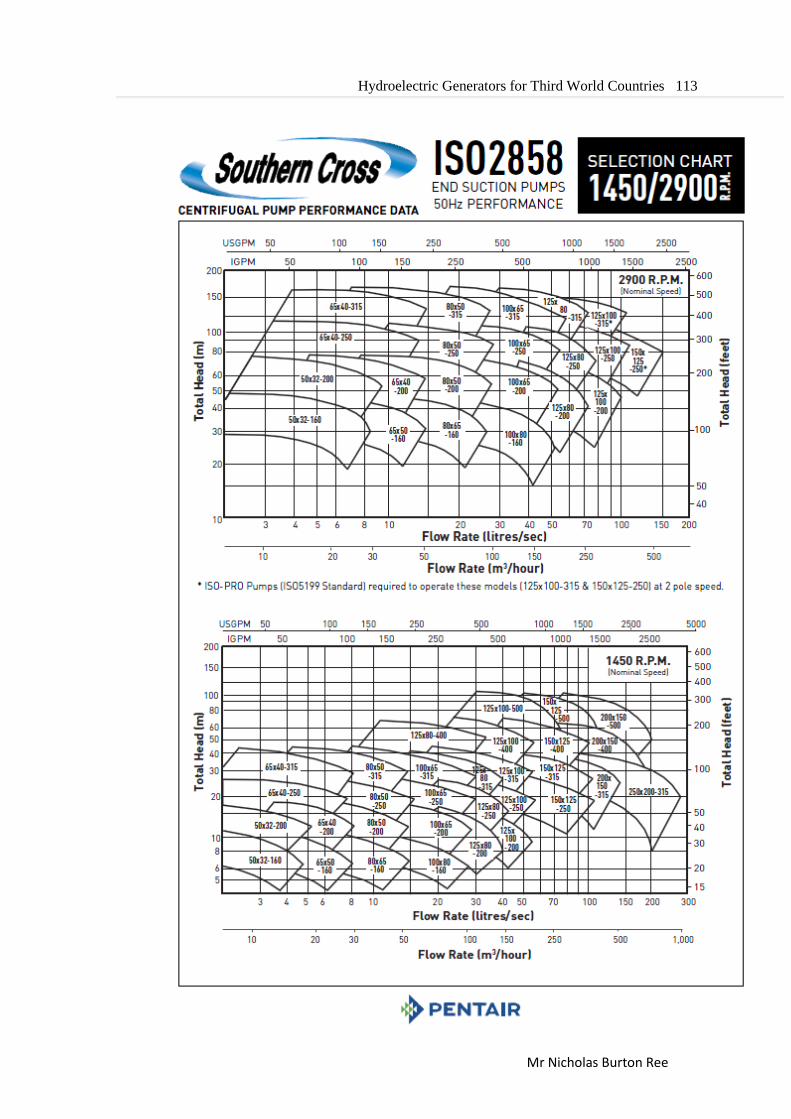
Hydroelectric Generators for Third World Countries 113
Mr Nicholas Burton Ree
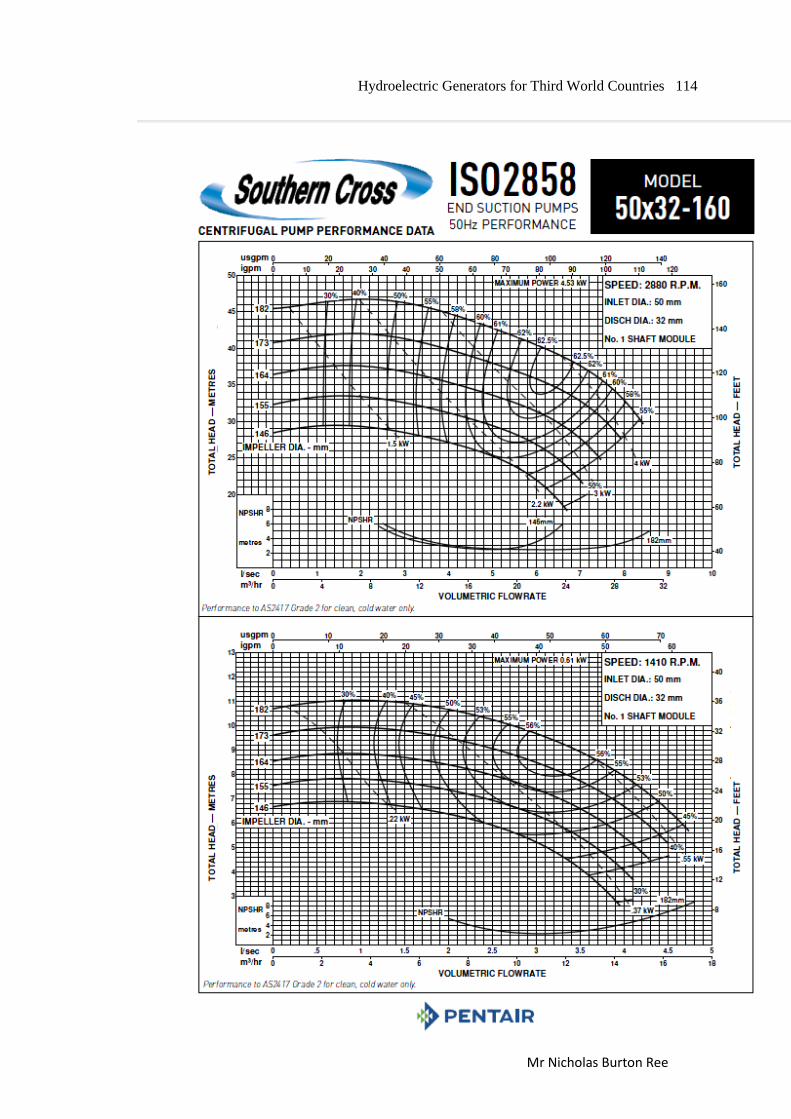
Hydroelectric Generators for Third World Countries 114
Mr Nicholas Burton Ree
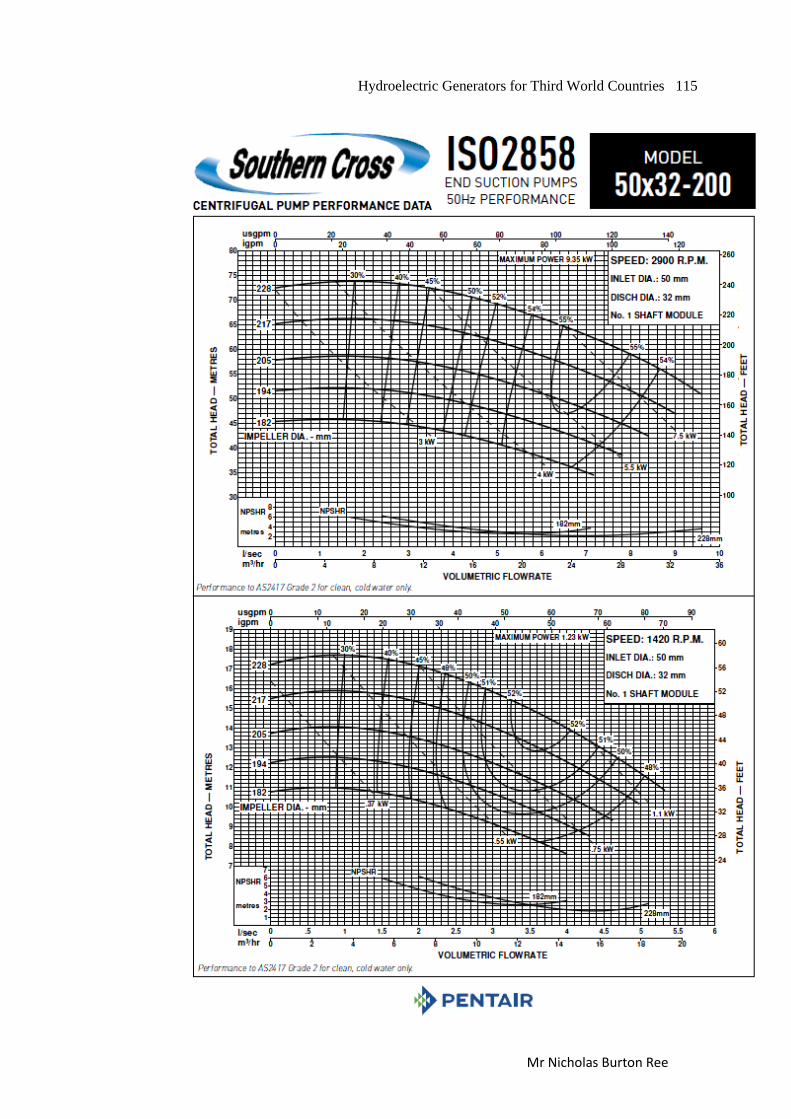
Hydroelectric Generators for Third World Countries 115
Mr Nicholas Burton Ree
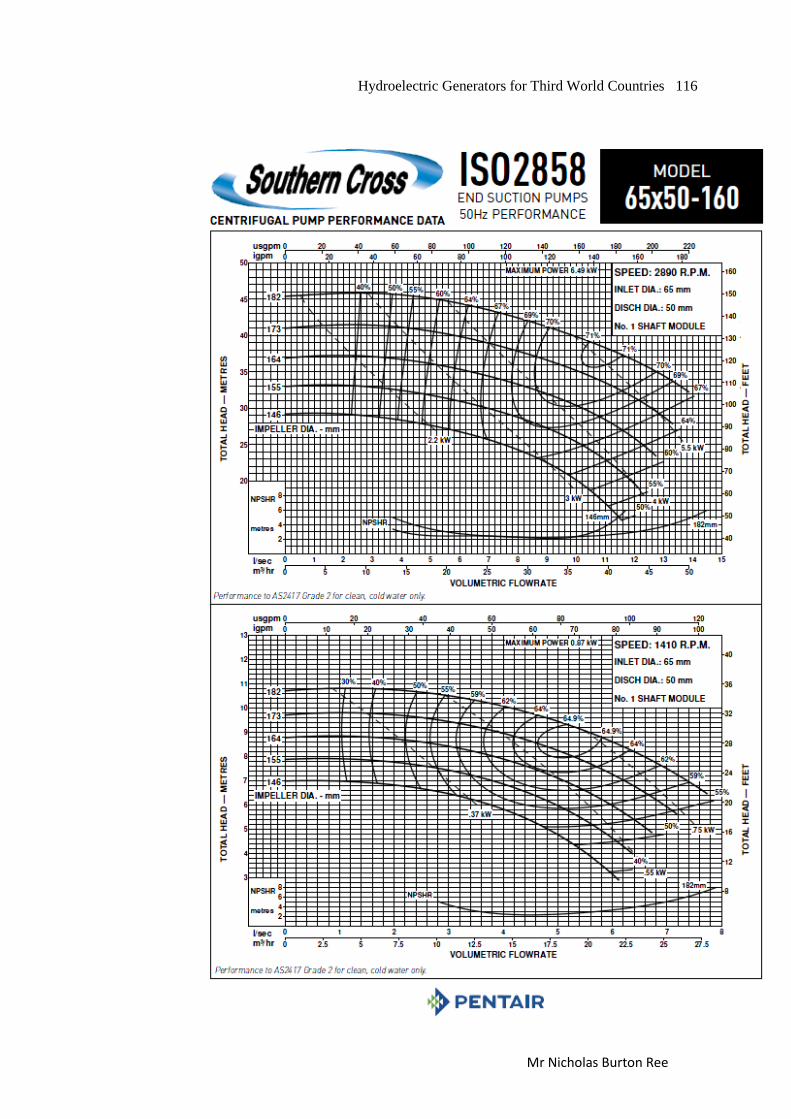
Hydroelectric Generators for Third World Countries 116
Mr Nicholas Burton Ree
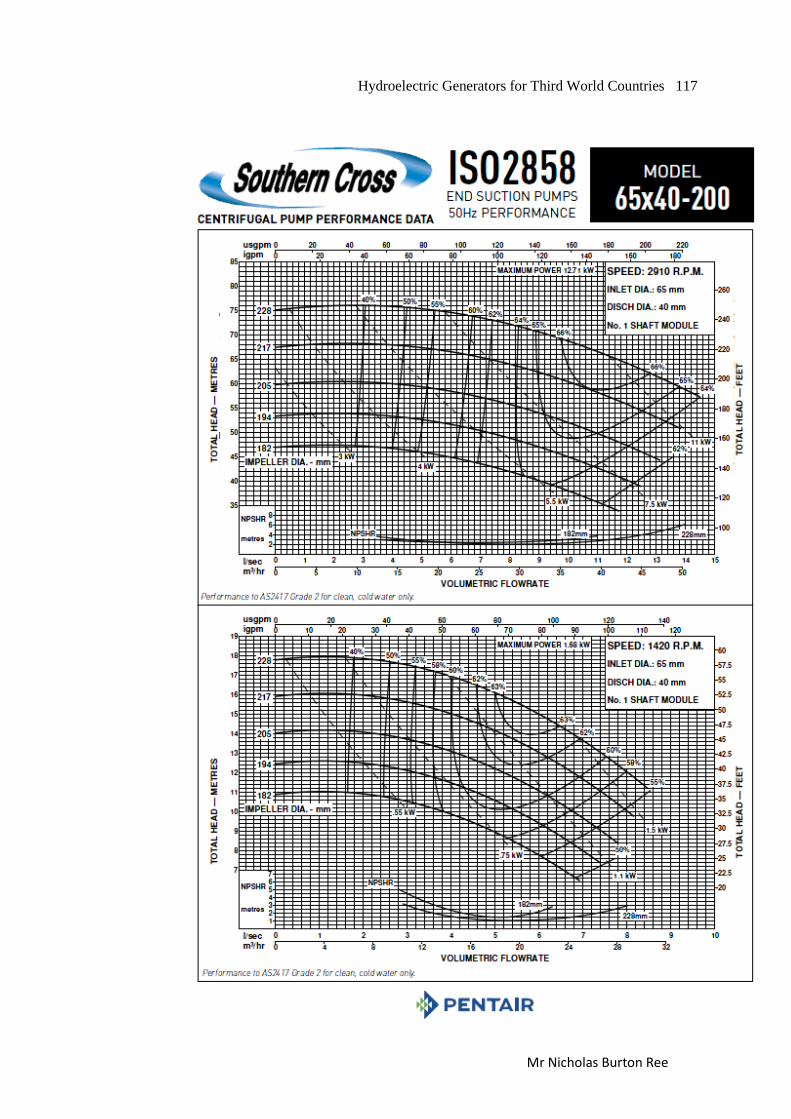
Hydroelectric Generators for Third World Countries 117
Mr Nicholas Burton Ree
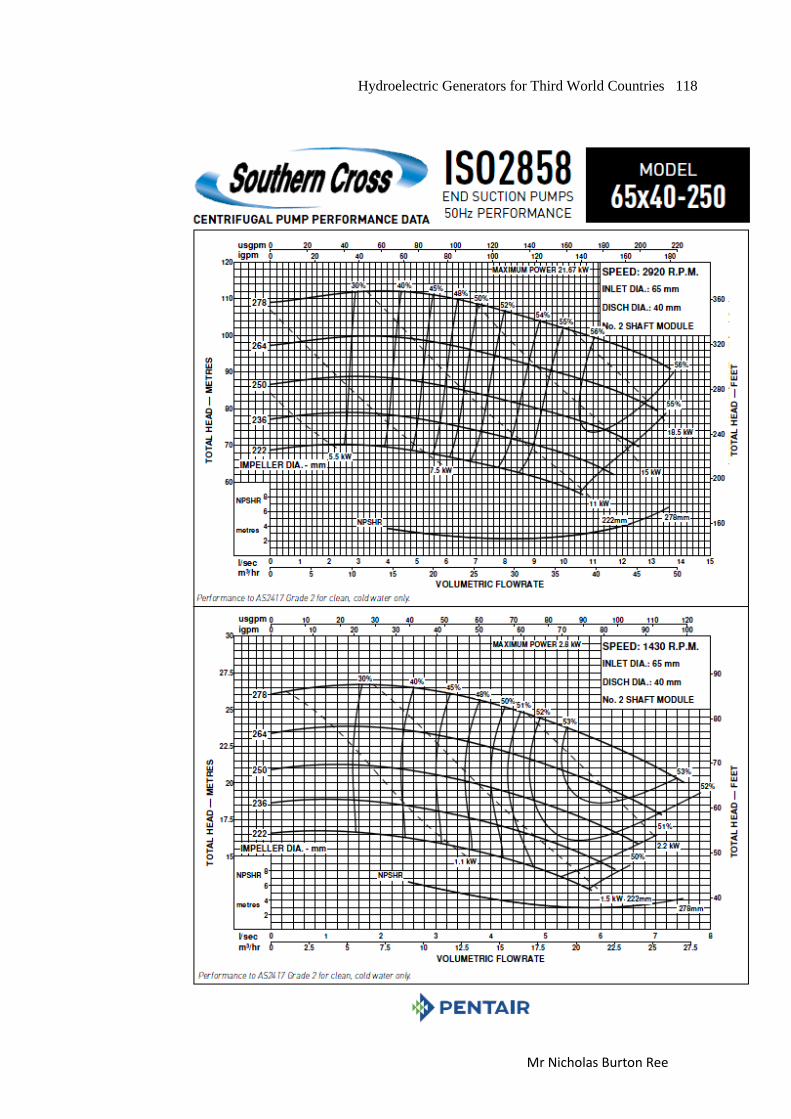
Hydroelectric Generators for Third World Countries 118
Mr Nicholas Burton Ree
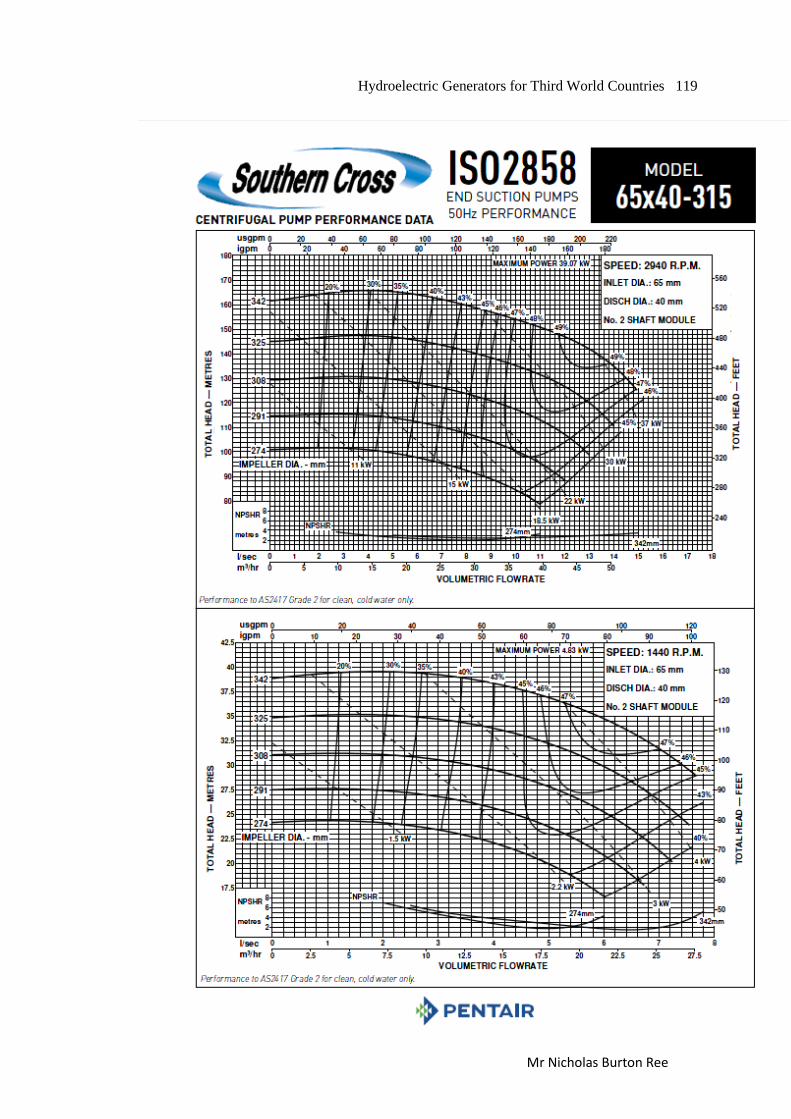
Hydroelectric Generators for Third World Countries 119
Mr Nicholas Burton Ree

Hydroelectric Generators for Third World Countries 120
Mr Nicholas Burton Ree
Appendix C
Matlab Code for Simulations

Hydroelectric Generators for Third World Countries 121
Mr Nicholas Burton Ree
Head Required for each Pump Model at BEP's
%Required Head for different pump models
clear
clc
%Turbine Speed
Nt=2300;
%For Model 50x32-200 Southern Cross Centrifugal
%Pump Speed at BEP
Np=2960;
nth=.73;
Hbep=57;
Ht=((Nt/Np)^2)*(Hbep/(nth^1.2));
ifHt< 40;
disp('Optimal Head (m)');
disp(Ht);
else
%Pump 65*40-342
Np=2940;
nth=.49;
Hbep=150;
Ht=((Nt/Np)^2)*(Hbep/(nth^1.2))
disp('65*40-342 Not within Head Limit');
end
%Pump 65x40-274
Np=2940;
nth=.46;
Hbep=90;
Ht=((Nt/Np)^2)*(Hbep/(nth^1.2))
ifHt< 40;
disp('65x40-274 within limit, Optimal Head (m).');
disp(Ht);
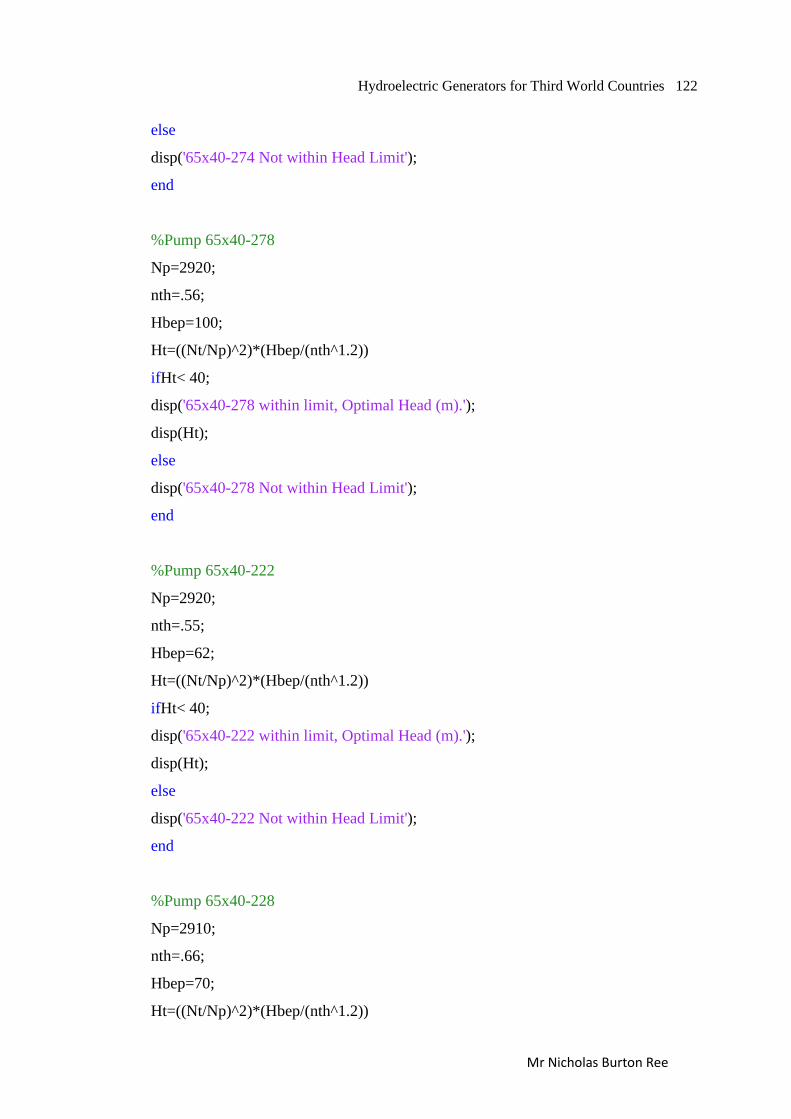
Hydroelectric Generators for Third World Countries 122
Mr Nicholas Burton Ree
else
disp('65x40-274 Not within Head Limit');
end
%Pump 65x40-278
Np=2920;
nth=.56;
Hbep=100;
Ht=((Nt/Np)^2)*(Hbep/(nth^1.2))
ifHt< 40;
disp('65x40-278 within limit, Optimal Head (m).');
disp(Ht);
else
disp('65x40-278 Not within Head Limit');
end
%Pump 65x40-222
Np=2920;
nth=.55;
Hbep=62;
Ht=((Nt/Np)^2)*(Hbep/(nth^1.2))
ifHt< 40;
disp('65x40-222 within limit, Optimal Head (m).');
disp(Ht);
else
disp('65x40-222 Not within Head Limit');
end
%Pump 65x40-228
Np=2910;
nth=.66;
Hbep=70;
Ht=((Nt/Np)^2)*(Hbep/(nth^1.2))
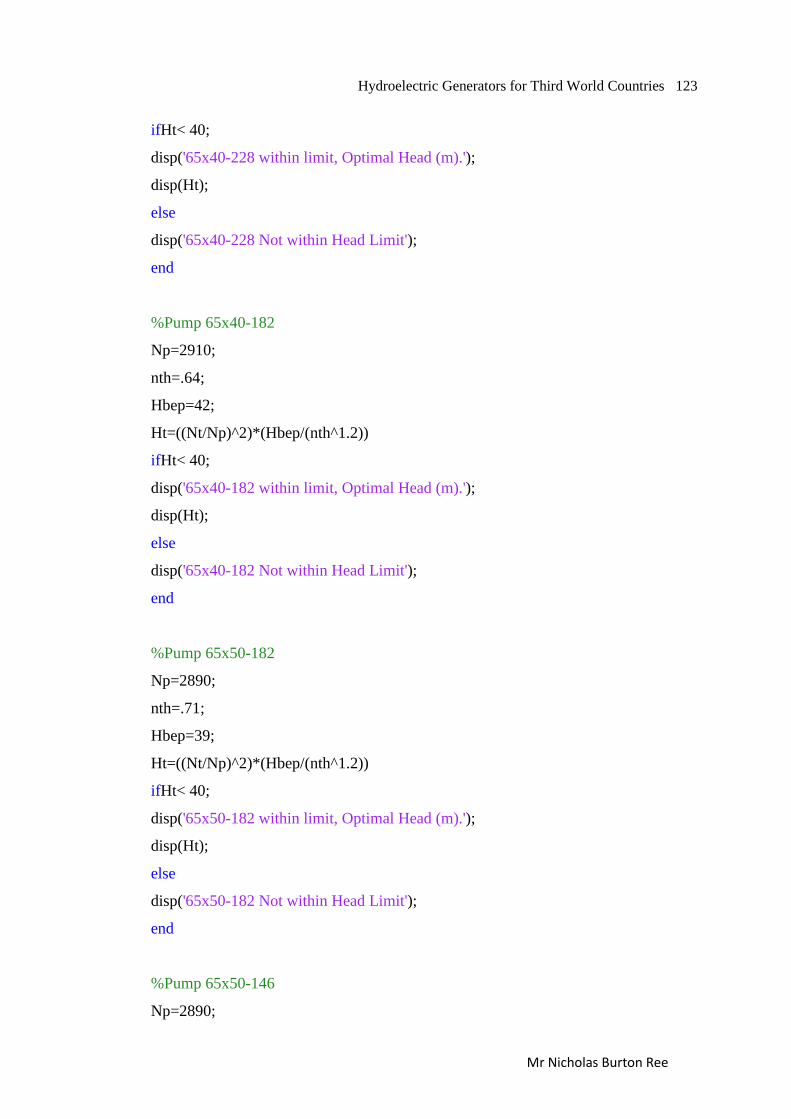
Hydroelectric Generators for Third World Countries 123
Mr Nicholas Burton Ree
ifHt< 40;
disp('65x40-228 within limit, Optimal Head (m).');
disp(Ht);
else
disp('65x40-228 Not within Head Limit');
end
%Pump 65x40-182
Np=2910;
nth=.64;
Hbep=42;
Ht=((Nt/Np)^2)*(Hbep/(nth^1.2))
ifHt< 40;
disp('65x40-182 within limit, Optimal Head (m).');
disp(Ht);
else
disp('65x40-182 Not within Head Limit');
end
%Pump 65x50-182
Np=2890;
nth=.71;
Hbep=39;
Ht=((Nt/Np)^2)*(Hbep/(nth^1.2))
ifHt< 40;
disp('65x50-182 within limit, Optimal Head (m).');
disp(Ht);
else
disp('65x50-182 Not within Head Limit');
end
%Pump 65x50-146
Np=2890;
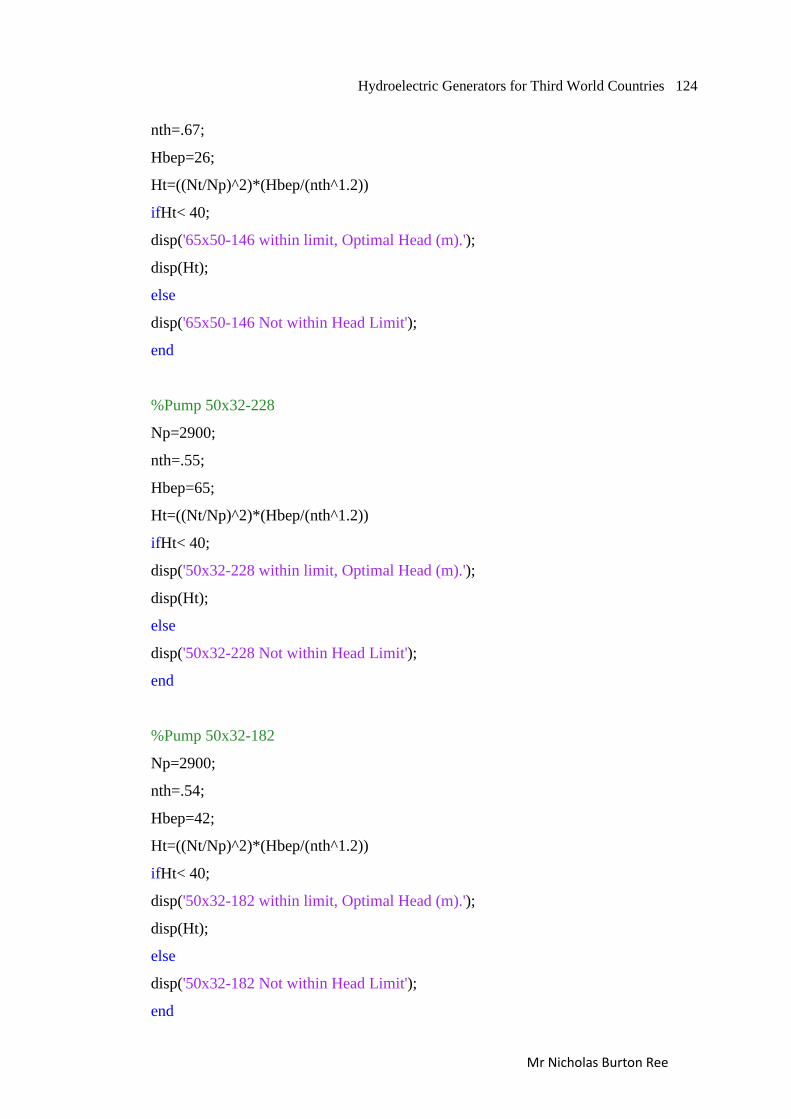
Hydroelectric Generators for Third World Countries 124
Mr Nicholas Burton Ree
nth=.67;
Hbep=26;
Ht=((Nt/Np)^2)*(Hbep/(nth^1.2))
ifHt< 40;
disp('65x50-146 within limit, Optimal Head (m).');
disp(Ht);
else
disp('65x50-146 Not within Head Limit');
end
%Pump 50x32-228
Np=2900;
nth=.55;
Hbep=65;
Ht=((Nt/Np)^2)*(Hbep/(nth^1.2))
ifHt< 40;
disp('50x32-228 within limit, Optimal Head (m).');
disp(Ht);
else
disp('50x32-228 Not within Head Limit');
end
%Pump 50x32-182
Np=2900;
nth=.54;
Hbep=42;
Ht=((Nt/Np)^2)*(Hbep/(nth^1.2))
ifHt< 40;
disp('50x32-182 within limit, Optimal Head (m).');
disp(Ht);
else
disp('50x32-182 Not within Head Limit');
end
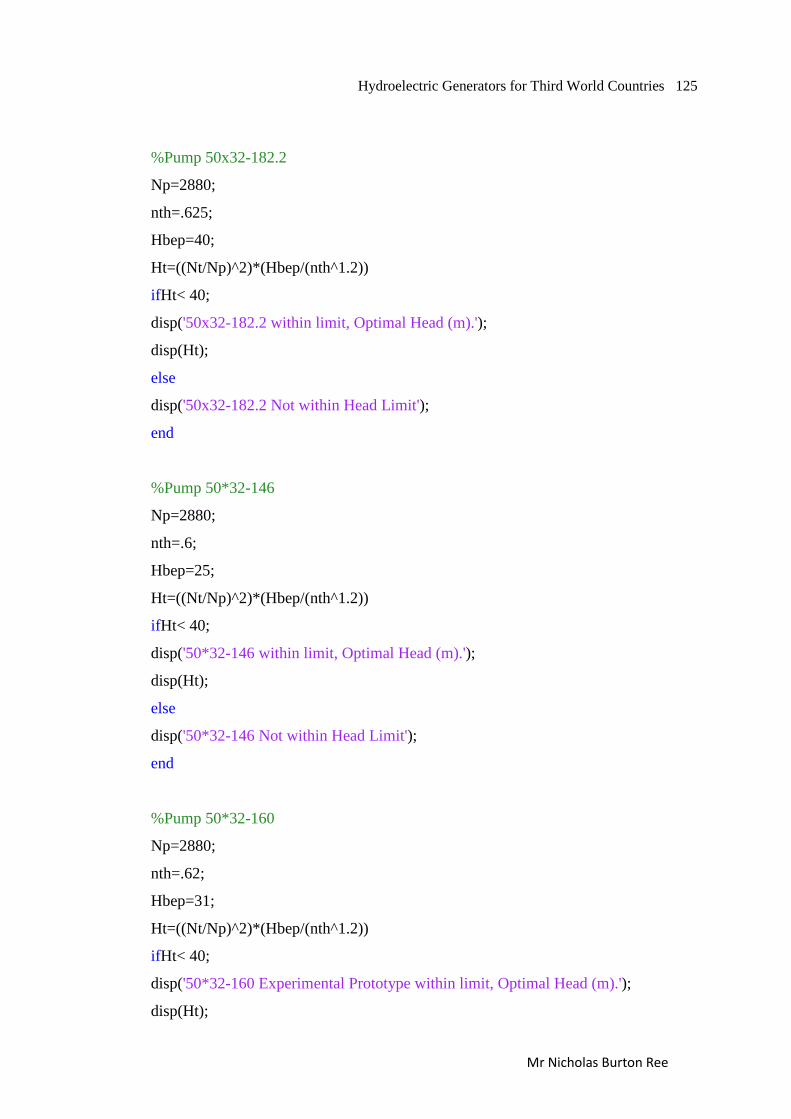
Hydroelectric Generators for Third World Countries 125
Mr Nicholas Burton Ree
%Pump 50x32-182.2
Np=2880;
nth=.625;
Hbep=40;
Ht=((Nt/Np)^2)*(Hbep/(nth^1.2))
ifHt< 40;
disp('50x32-182.2 within limit, Optimal Head (m).');
disp(Ht);
else
disp('50x32-182.2 Not within Head Limit');
end
%Pump 50*32-146
Np=2880;
nth=.6;
Hbep=25;
Ht=((Nt/Np)^2)*(Hbep/(nth^1.2))
ifHt< 40;
disp('50*32-146 within limit, Optimal Head (m).');
disp(Ht);
else
disp('50*32-146 Not within Head Limit');
end
%Pump 50*32-160
Np=2880;
nth=.62;
Hbep=31;
Ht=((Nt/Np)^2)*(Hbep/(nth^1.2))
ifHt< 40;
disp('50*32-160 Experimental Prototype within limit, Optimal Head (m).');
disp(Ht);
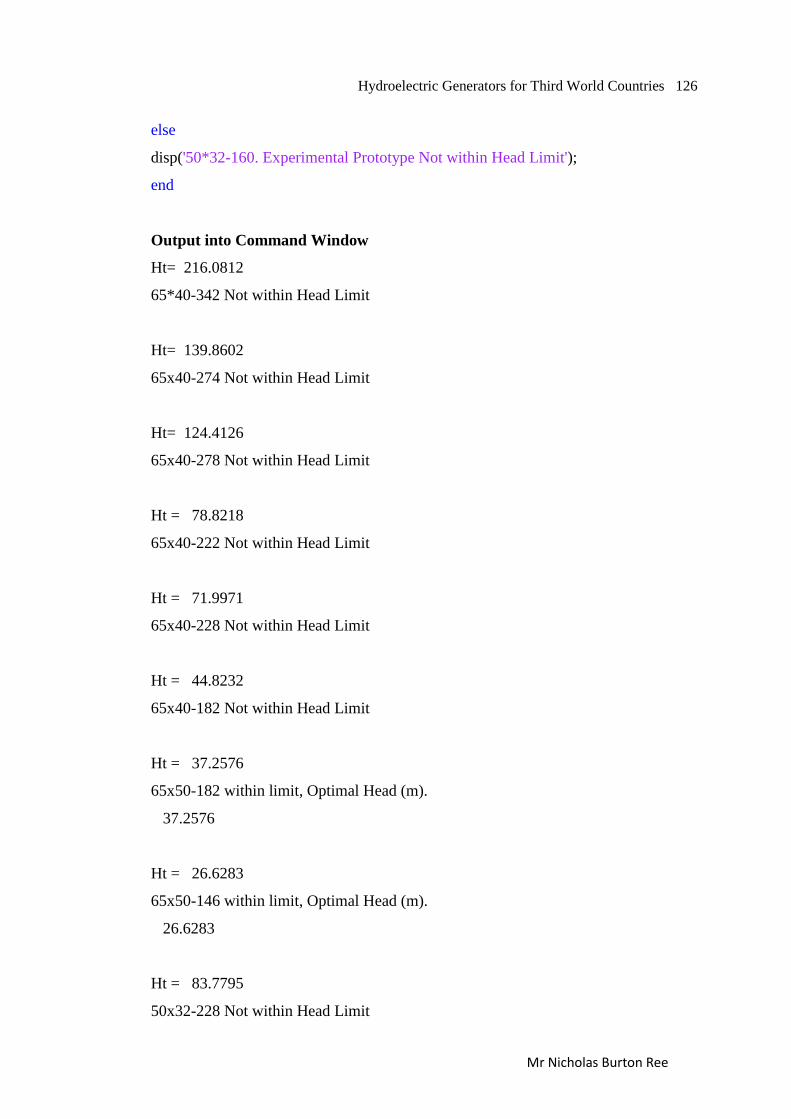
Hydroelectric Generators for Third World Countries 126
Mr Nicholas Burton Ree
else
disp('50*32-160. Experimental Prototype Not within Head Limit');
end
Output into Command Window
Ht= 216.0812
65*40-342 Not within Head Limit
Ht= 139.8602
65x40-274 Not within Head Limit
Ht= 124.4126
65x40-278 Not within Head Limit
Ht = 78.8218
65x40-222 Not within Head Limit
Ht = 71.9971
65x40-228 Not within Head Limit
Ht = 44.8232
65x40-182 Not within Head Limit
Ht = 37.2576
65x50-182 within limit, Optimal Head (m).
37.2576
Ht = 26.6283
65x50-146 within limit, Optimal Head (m).
26.6283
Ht = 83.7795
50x32-228 Not within Head Limit

Hydroelectric Generators for Third World Countries 127
Mr Nicholas Burton Ree
Ht = 55.3397
50x32-182 Not within Head Limit
Ht = 44.8409
50x32-182.2 Not within Head Limit
Ht = 29.4326
50*32-146 within limit, Optimal Head (m).
29.4326
Ht = 35.0883
50*32-160 Experimental Prototype within limit, Optimal Head (m).
35.0883

Hydroelectric Generators for Third World Countries 128
Mr Nicholas Burton Ree
Flow Required at BEP's
%Turbine Speed
Nt=2300;
%For Models of Southern Cross Centrifugal pumps
%Pump Speed at BEP
disp('Operation Conditions as 2300 RPM');
%For model 50x32-146
Np=2880;
nth=.60;
%Flow rate at BEP (L/s)
Qbep=5;
%Qt=flow rate (L/s)
Qt=(Nt/Np)*(Qbep/(nth^0.8));
disp('Flow rate condition For model 50x32-146 (l/s)');
disp(Qt);
%For model 50x32-160
Np=2880;
nth=.62;
%Flow rate at BEP (L/s)
Qbep=5.5;
%Qt=flow rate (L/s)
Qt=(Nt/Np)*(Qbep/(nth^0.8));
disp('Flow rate condition For model 50x32-160 (l/s)');
disp(Qt);
%For model 65x50-146
Np=2890;
nth=.67;
%Flow rate at BEP (L/s)
Qbep=6.9;
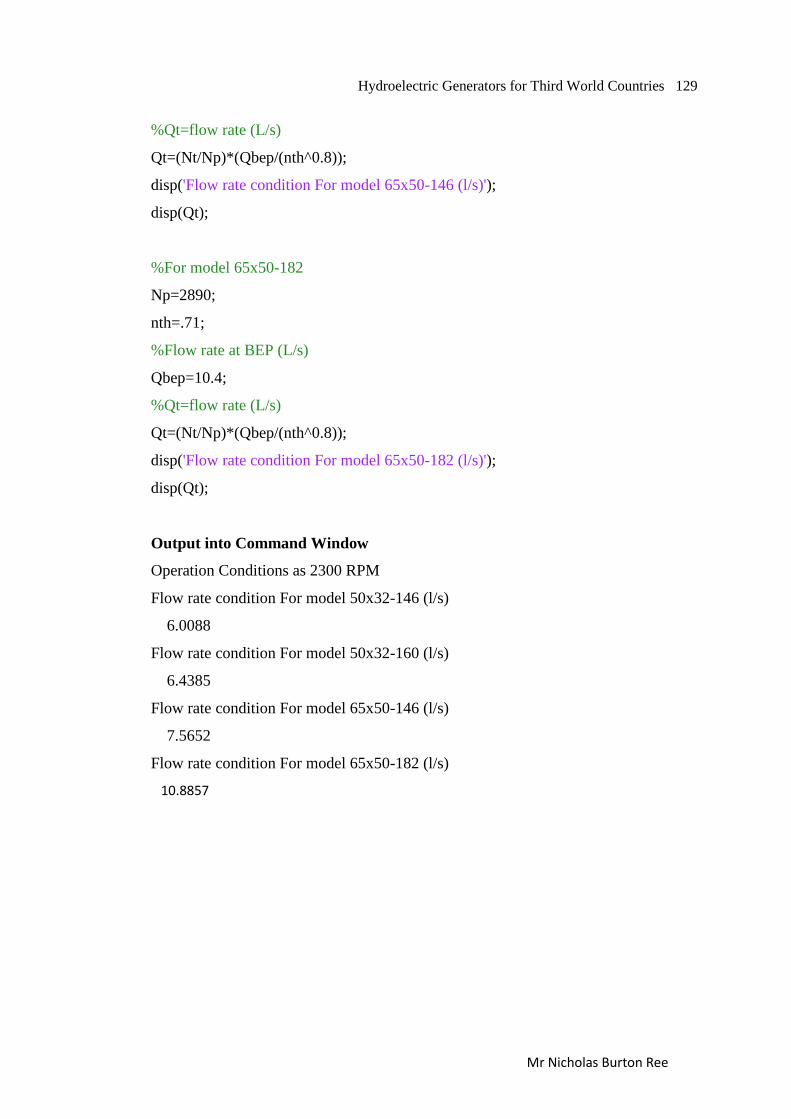
Hydroelectric Generators for Third World Countries 129
Mr Nicholas Burton Ree
%Qt=flow rate (L/s)
Qt=(Nt/Np)*(Qbep/(nth^0.8));
disp('Flow rate condition For model 65x50-146 (l/s)');
disp(Qt);
%For model 65x50-182
Np=2890;
nth=.71;
%Flow rate at BEP (L/s)
Qbep=10.4;
%Qt=flow rate (L/s)
Qt=(Nt/Np)*(Qbep/(nth^0.8));
disp('Flow rate condition For model 65x50-182 (l/s)');
disp(Qt);
Output into Command Window
Operation Conditions as 2300 RPM
Flow rate condition For model 50x32-146 (l/s)
6.0088
Flow rate condition For model 50x32-160 (l/s)
6.4385
Flow rate condition For model 65x50-146 (l/s)
7.5652
Flow rate condition For model 65x50-182 (l/s)
10.8857

Hydroelectric Generators for Third World Countries 130
Mr Nicholas Burton Ree
Appendix D
Risk Assessment

L:\Project\Project\reviewed sections\Final Thesis Print srfgsdrg.docx Page 131 of 158
University of Southern Queensland
Risk Management Plan
http://www.usq.edu.au/hr/healthsafe/safetyproc/whsmanual/whsmanr1.htm
Date:
03/06/2013
Faculty/Dept:
FACULTY OF
ENGINEERING AND
SURVEYING
Assessment completed by:
Nicholas Burton-Ree
Les Bowtell
Malcolm Gillies
Contact No:
0400861173
What is the task?
Testing hydroelectric generator prototype
Location where task is being conducted:
Hydraulic labs - Z block
Why is the task being conducted?
To gather data for the operation of the PAT system
What are the nominal conditions?
Controlled Environment with minimal Hazards
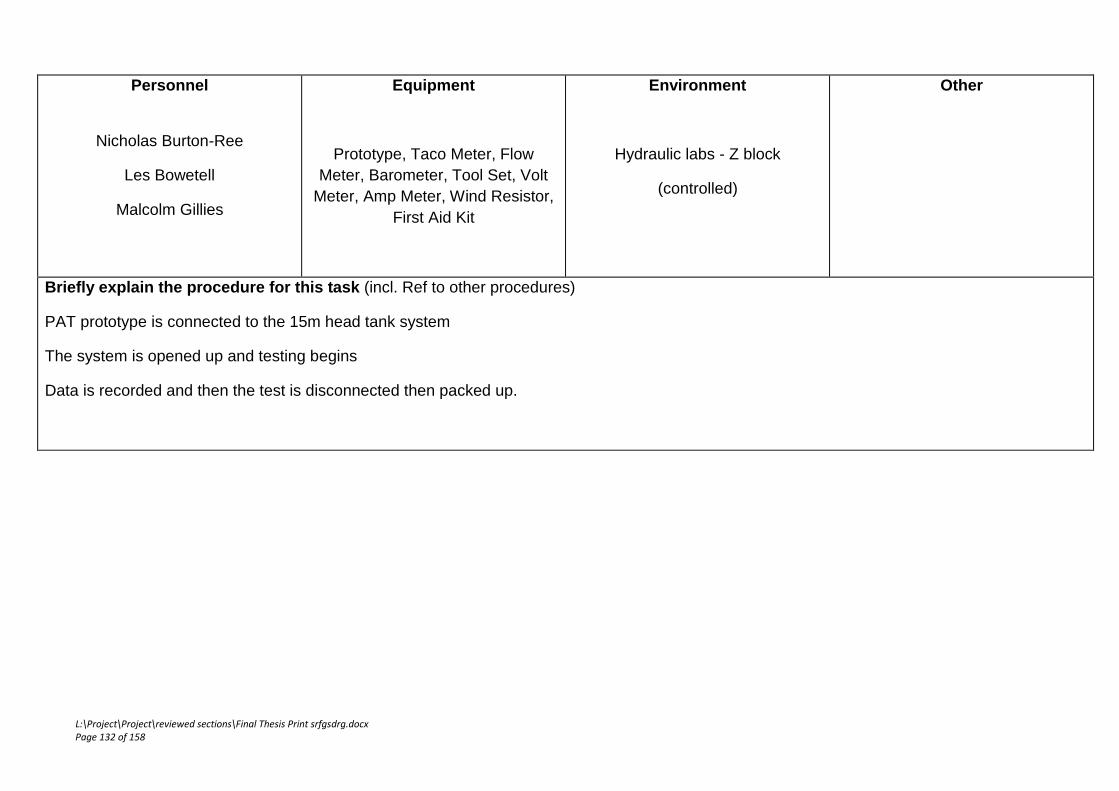
L:\Project\Project\reviewed sections\Final Thesis Print srfgsdrg.docx Page 132 of 158
Personnel
Nicholas Burton-Ree
Les Bowetell
Malcolm Gillies
Equipment
Prototype, Taco Meter, Flow
Meter, Barometer, Tool Set, Volt
Meter, Amp Meter, Wind Resistor,
First Aid Kit
Environment
Hydraulic labs - Z block
(controlled)
Other
Briefly explain the procedure for this task (incl. Ref to other procedures)
PAT prototype is connected to the 15m head tank system
The system is opened up and testing begins
Data is recorded and then the test is disconnected then packed up.
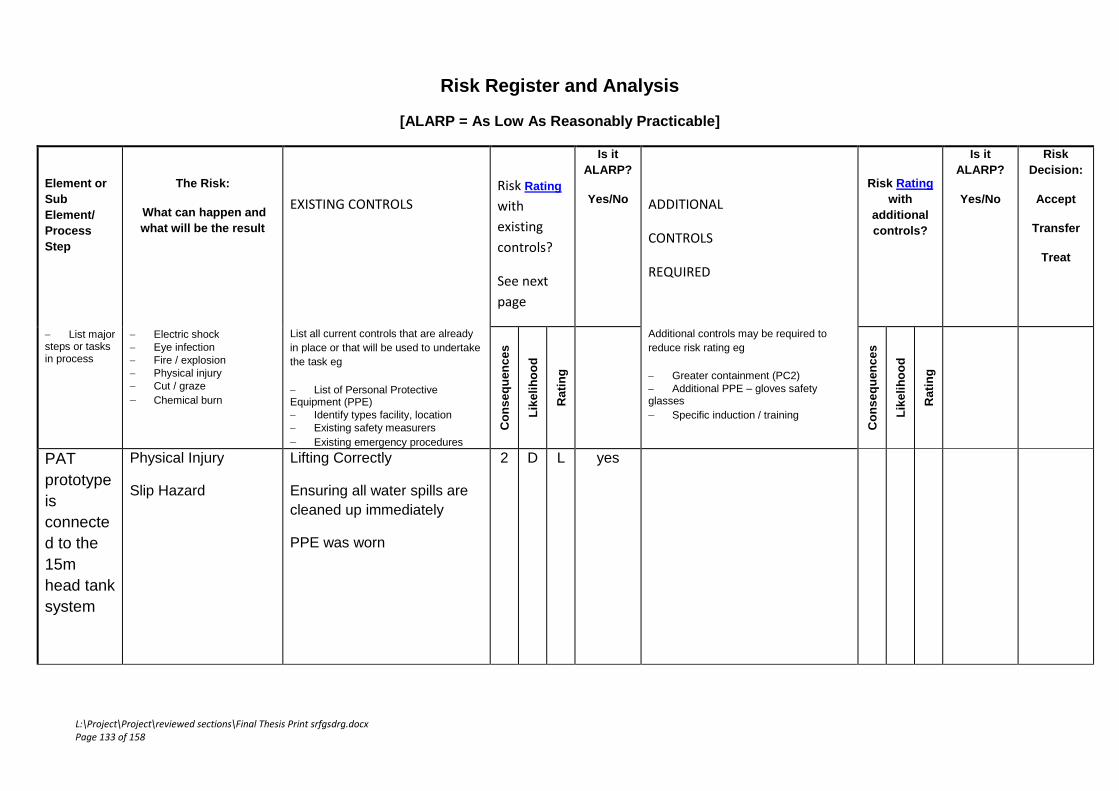
L:\Project\Project\reviewed sections\Final Thesis Print srfgsdrg.docx Page 133 of 158
Risk Register and Analysis
[ALARP = As Low As Reasonably Practicable]
Element or
Sub
Element/
Process
Step
The Risk:
What can happen and
what will be the result
EXISTING CONTROLS
Risk Rating
with
existing
controls?
See next
page
Is it
ALARP?
Yes/No
ADDITIONAL
CONTROLS
REQUIRED
Risk Rating
with
additional
controls?
Is it
ALARP?
Yes/No
Risk
Decision:
Accept
Transfer
Treat
List major steps or tasks in process
Electric shock
Eye infection
Fire / explosion
Physical injury
Cut / graze
Chemical burn
List all current controls that are already
in place or that will be used to undertake
the task eg
List of Personal Protective Equipment (PPE)
Identify types facility, location
Existing safety measurers
Existing emergency procedures
Co
ns
eq
uen
ce
s
Lik
eli
ho
od
Rati
ng
Additional controls may be required to
reduce risk rating eg
Greater containment (PC2)
Additional PPE – gloves safety glasses
Specific induction / training
Co
ns
eq
uen
ce
s
Lik
eli
ho
od
Rati
ng
PAT
prototype
is
connecte
d to the
15m
head tank
system
Physical Injury
Slip Hazard
Lifting Correctly
Ensuring all water spills are
cleaned up immediately
PPE was worn
2 D L yes
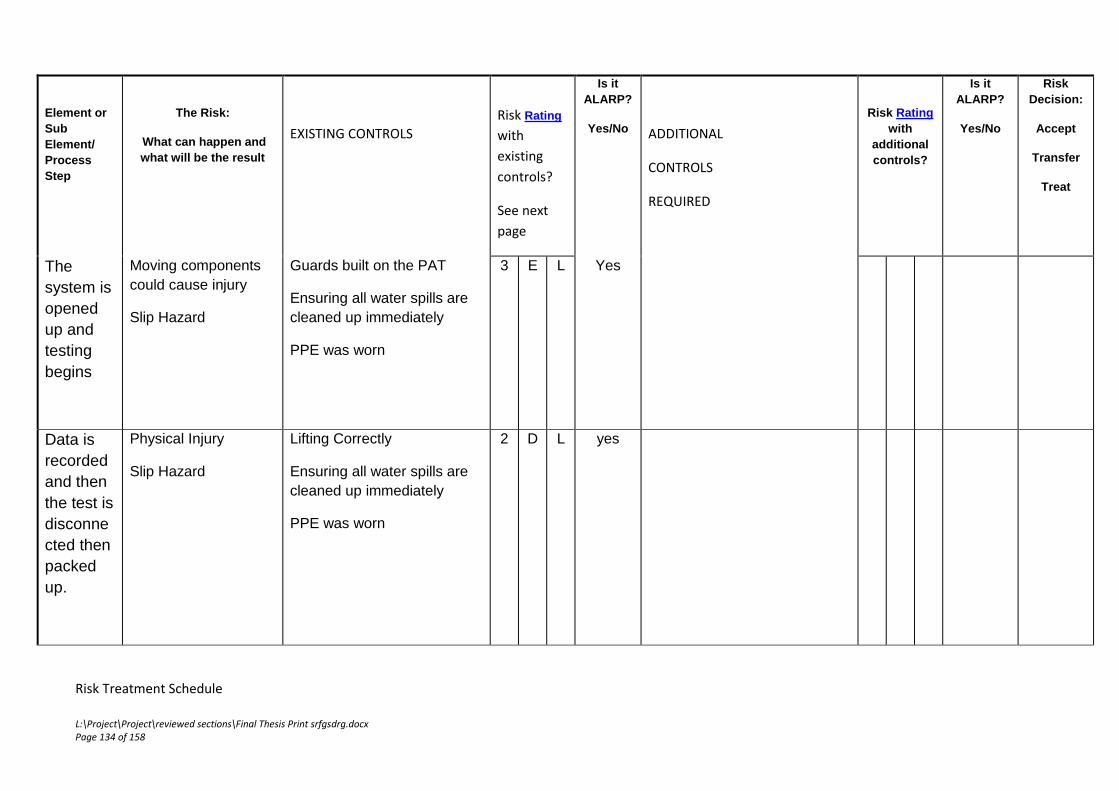
L:\Project\Project\reviewed sections\Final Thesis Print srfgsdrg.docx Page 134 of 158
Element or
Sub
Element/
Process
Step
The Risk:
What can happen and
what will be the result
EXISTING CONTROLS
Risk Rating
with
existing
controls?
See next
page
Is it
ALARP?
Yes/No
ADDITIONAL
CONTROLS
REQUIRED
Risk Rating
with
additional
controls?
Is it
ALARP?
Yes/No
Risk
Decision:
Accept
Transfer
Treat
The
system is
opened
up and
testing
begins
Moving components
could cause injury
Slip Hazard
Guards built on the PAT
Ensuring all water spills are
cleaned up immediately
PPE was worn
3 E L Yes
Data is
recorded
and then
the test is
disconne
cted then
packed
up.
Physical Injury
Slip Hazard
Lifting Correctly
Ensuring all water spills are
cleaned up immediately
PPE was worn
2 D L yes
Risk Treatment Schedule

L:\Project\Project\reviewed sections\Final Thesis Print srfgsdrg.docx Page 135 of 158
Notes
The Testing was supervised by both Ma Les Bowetell and Malcolm Gillies
All conditions during testing were controlled to minimise Hazards
Personnel Protective Equipment was worn (PPE)
The task should not proceed if the risk rating after the controls are implemented is still either HIGH or EXTREME or if any risk is not As Low As Reasonably
Practicable (ALARP).
This Risk Assessment score of Low (L) is only on the condition that all existing and additional controls are in place at the time
of the task being conducted.
Assessment completed by:

L:\Project\Project\reviewed sections\Final Thesis Print srfgsdrg.docx Page 136 of 158
Name: Nicholas Burton-Ree
Position: Student
Date: 03/06/2013
Supervisor or Designated Officer
Name: Les Bowtell
Position: Supervisor
Date:03/06/2013

L:\Project\Project\reviewed sections\Final Thesis Print srfgsdrg.docx Page 137 of 158
Guidance Notes for review of Controls and Risk Management Plan.
When monitoring the effectiveness of control measures, it may be helpful to ask the
following questions:
• Have the chosen control measures been implemented as planned? - Are the chosen control measures in place? - Are the measures being used? - Are the measures being used correctly?
• Are the chosen control measures working? - Have any the changes made to manage exposure to the assessed risks resulted
in what was intended? - Has exposure to the assessed risks been eliminated or adequately reduced?
• Are there any new problems? - Have the implemented control measures introduced any new problems? - Have the implemented control measures resulted in the worsening of any existing
problems? To answer these questions:
• consult with workers, supervisors and health and safety representatives; • measure people’s exposure (e.g. taking noise measurements in the case of isolation
of a noise source); • consult and monitor incident reports; and • review safety committee meeting minutes where possible.
Set a date for the review of the risk management process. When reviewing, check if:
• the process that is currently in place is still valid; • things have changed that could make the operating processes or system
outdated; • technological or other changes have affected the current workplace; and • a different system should be used altogether.
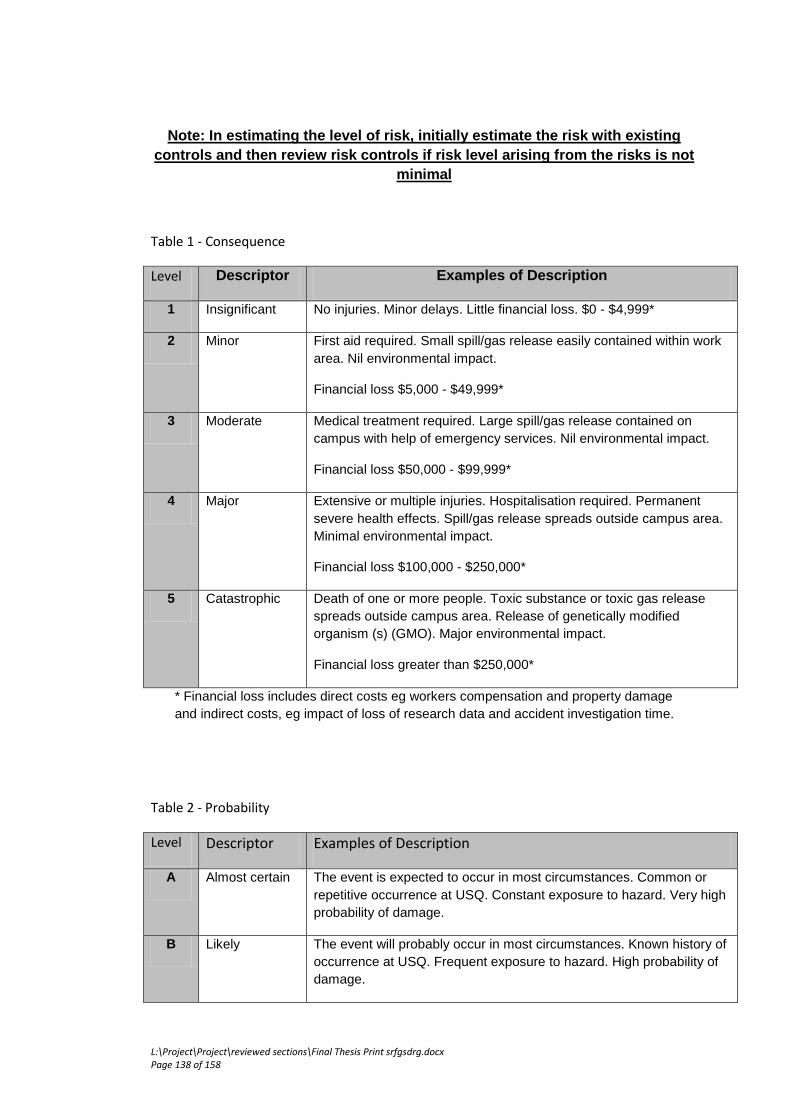
L:\Project\Project\reviewed sections\Final Thesis Print srfgsdrg.docx Page 138 of 158
Note: In estimating the level of risk, initially estimate the risk with existing
controls and then review risk controls if risk level arising from the risks is not
minimal
Table 1 - Consequence
Level Descriptor Examples of Description
1 Insignificant No injuries. Minor delays. Little financial loss. $0 - $4,999*
2 Minor First aid required. Small spill/gas release easily contained within work
area. Nil environmental impact.
Financial loss $5,000 - $49,999*
3 Moderate Medical treatment required. Large spill/gas release contained on
campus with help of emergency services. Nil environmental impact.
Financial loss $50,000 - $99,999*
4 Major Extensive or multiple injuries. Hospitalisation required. Permanent
severe health effects. Spill/gas release spreads outside campus area.
Minimal environmental impact.
Financial loss $100,000 - $250,000*
5 Catastrophic Death of one or more people. Toxic substance or toxic gas release
spreads outside campus area. Release of genetically modified
organism (s) (GMO). Major environmental impact.
Financial loss greater than $250,000*
* Financial loss includes direct costs eg workers compensation and property damage
and indirect costs, eg impact of loss of research data and accident investigation time.
Table 2 - Probability
Level Descriptor Examples of Description
A Almost certain The event is expected to occur in most circumstances. Common or
repetitive occurrence at USQ. Constant exposure to hazard. Very high
probability of damage.
B Likely The event will probably occur in most circumstances. Known history of
occurrence at USQ. Frequent exposure to hazard. High probability of
damage.

L:\Project\Project\reviewed sections\Final Thesis Print srfgsdrg.docx Page 139 of 158
C Possible The event could occur at some time. History of single occurrence at
USQ. Regular or occasional exposure to hazard. Moderate probability
of damage.
D Unlikely The event is not likely to occur. Known occurrence in industry.
Infrequent exposure to hazard. Low probability of damage.
E Rare The event may occur only in exceptional circumstances. No reported
occurrence globally. Rare exposure to hazard. Very low probability of
damage. Requires multiple system failures.
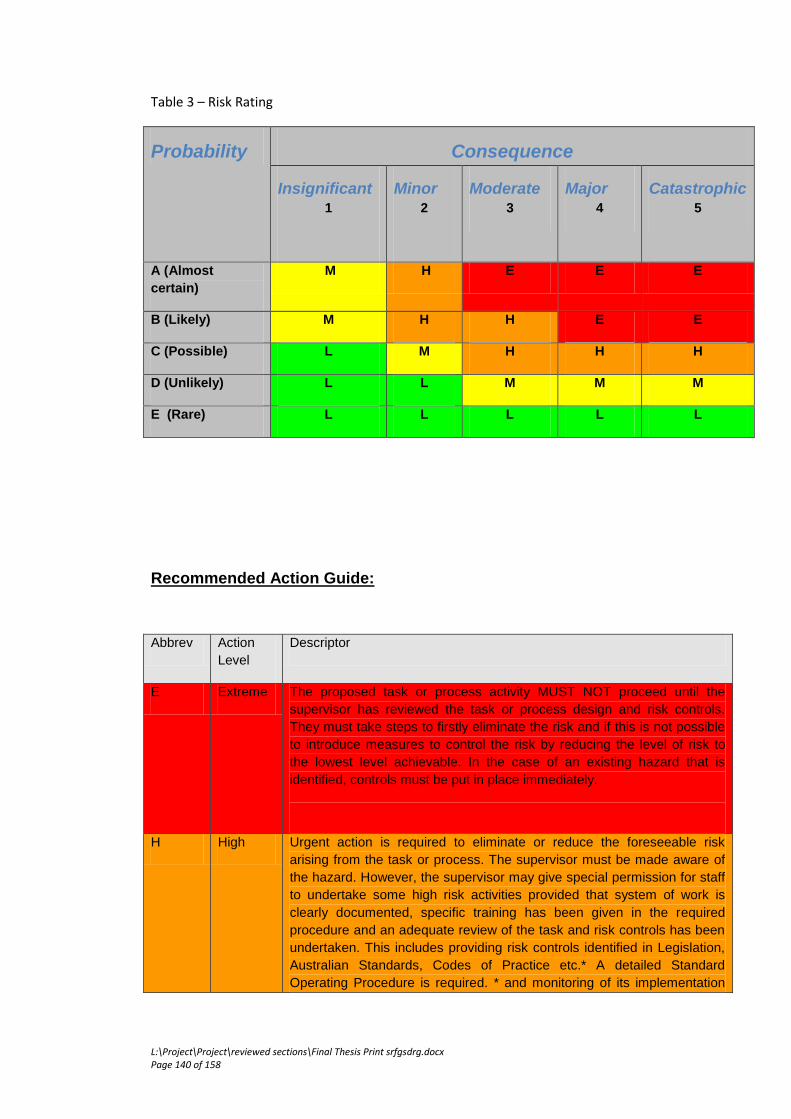
L:\Project\Project\reviewed sections\Final Thesis Print srfgsdrg.docx Page 140 of 158
Table 3 – Risk Rating
Probability Consequence
Insignificant 1
Minor 2
Moderate 3
Major 4
Catastrophic 5
A (Almost
certain)
M H E E E
B (Likely) M H H E E
C (Possible) L M H H H
D (Unlikely) L L M M M
E (Rare) L L L L L
Recommended Action Guide:
Abbrev Action
Level
Descriptor
E Extreme The proposed task or process activity MUST NOT proceed until the
supervisor has reviewed the task or process design and risk controls.
They must take steps to firstly eliminate the risk and if this is not possible
to introduce measures to control the risk by reducing the level of risk to
the lowest level achievable. In the case of an existing hazard that is
identified, controls must be put in place immediately.
H High Urgent action is required to eliminate or reduce the foreseeable risk
arising from the task or process. The supervisor must be made aware of
the hazard. However, the supervisor may give special permission for staff
to undertake some high risk activities provided that system of work is
clearly documented, specific training has been given in the required
procedure and an adequate review of the task and risk controls has been
undertaken. This includes providing risk controls identified in Legislation,
Australian Standards, Codes of Practice etc.* A detailed Standard
Operating Procedure is required. * and monitoring of its implementation

L:\Project\Project\reviewed sections\Final Thesis Print srfgsdrg.docx Page 141 of 158
must occur to check the risk level
M Moderate Action to eliminate or reduce the risk is required within a specified period.
The supervisor should approve all moderate risk task or process
activities. A Standard Operating Procedure or Safe Work Method
statement is required
L Low Manage by routine procedures.
*Note: These regulatory documents identify specific requirements/controls that must be implemented to
reduce the risk of an individual undertaking the task to a level that the regulatory body identifies as
being acceptable.
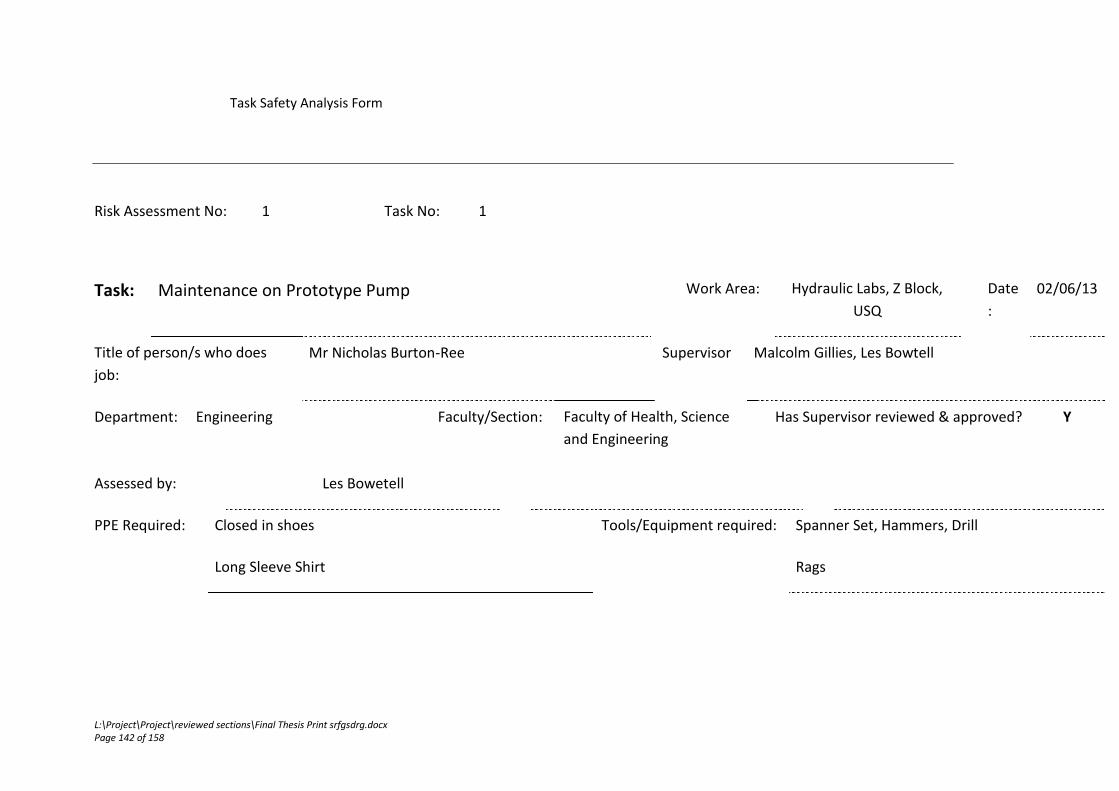
L:\Project\Project\reviewed sections\Final Thesis Print srfgsdrg.docx Page 142 of 158
Task Safety Analysis Form
Risk Assessment No: 1 Task No: 1
Task: Maintenance on Prototype Pump Work Area: Hydraulic Labs, Z Block,
USQ
Date
:
02/06/13
Title of person/s who does
job:
Mr Nicholas Burton-Ree Supervisor Malcolm Gillies, Les Bowtell
Department: Engineering Faculty/Section: Faculty of Health, Science
and Engineering
Has Supervisor reviewed & approved? Y
Assessed by: Les Bowetell
PPE Required: Closed in shoes Tools/Equipment required: Spanner Set, Hammers, Drill
Long Sleeve Shirt Rags
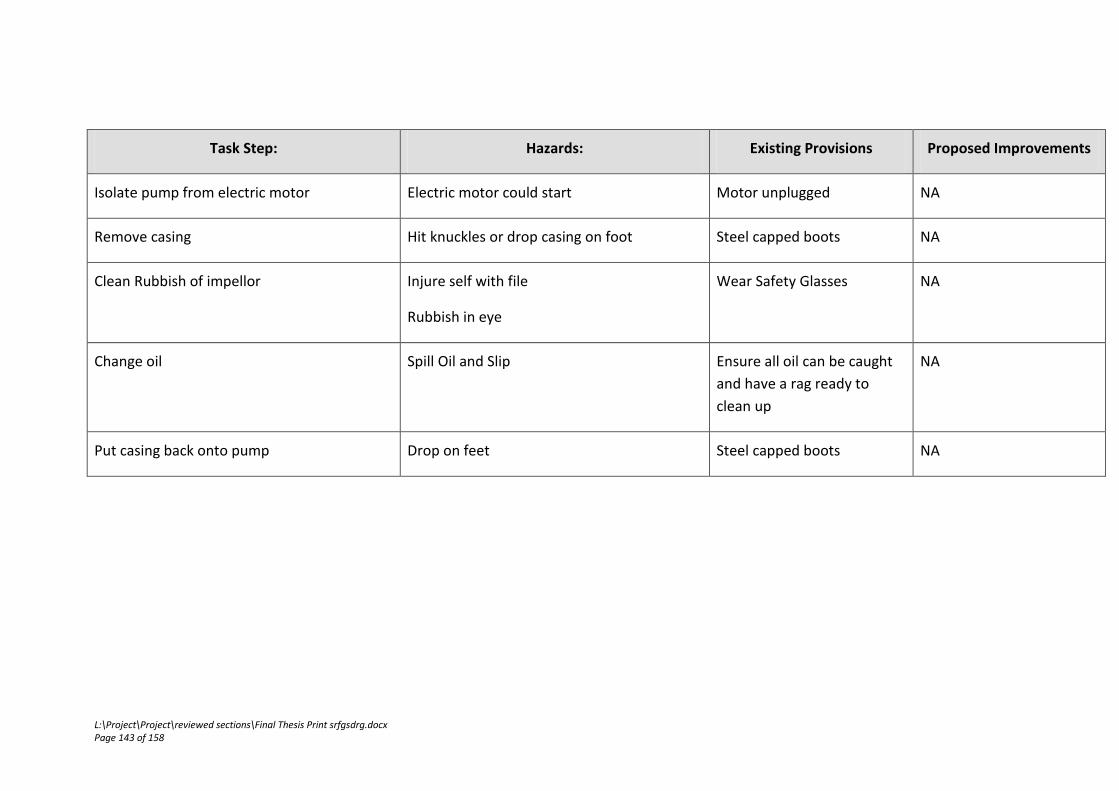
L:\Project\Project\reviewed sections\Final Thesis Print srfgsdrg.docx Page 143 of 158
Task Step: Hazards: Existing Provisions Proposed Improvements
Isolate pump from electric motor Electric motor could start Motor unplugged NA
Remove casing Hit knuckles or drop casing on foot Steel capped boots NA
Clean Rubbish of impellor Injure self with file
Rubbish in eye
Wear Safety Glasses NA
Change oil Spill Oil and Slip Ensure all oil can be caught
and have a rag ready to
clean up
NA
Put casing back onto pump Drop on feet Steel capped boots NA

L:\Project\Project\reviewed sections\Final Thesis Print srfgsdrg.docx Page 144 of 158
Appendix E
Tables
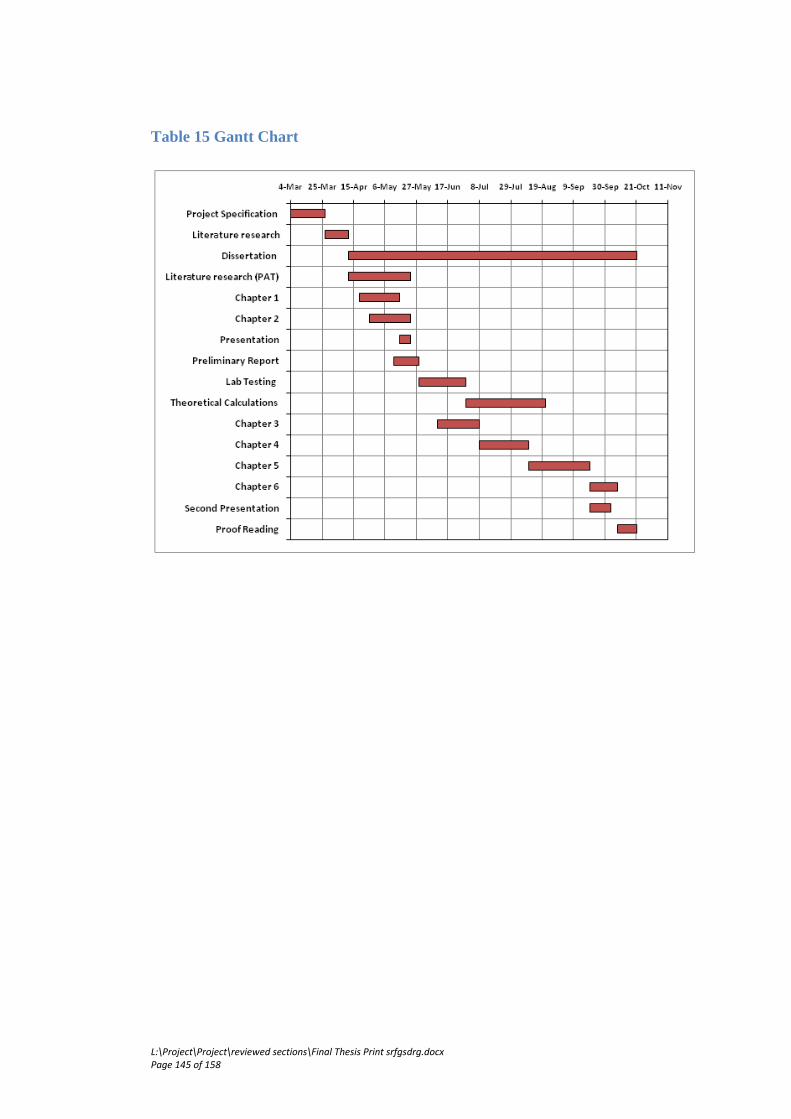
L:\Project\Project\reviewed sections\Final Thesis Print srfgsdrg.docx Page 145 of 158
Table 15 Gantt Chart
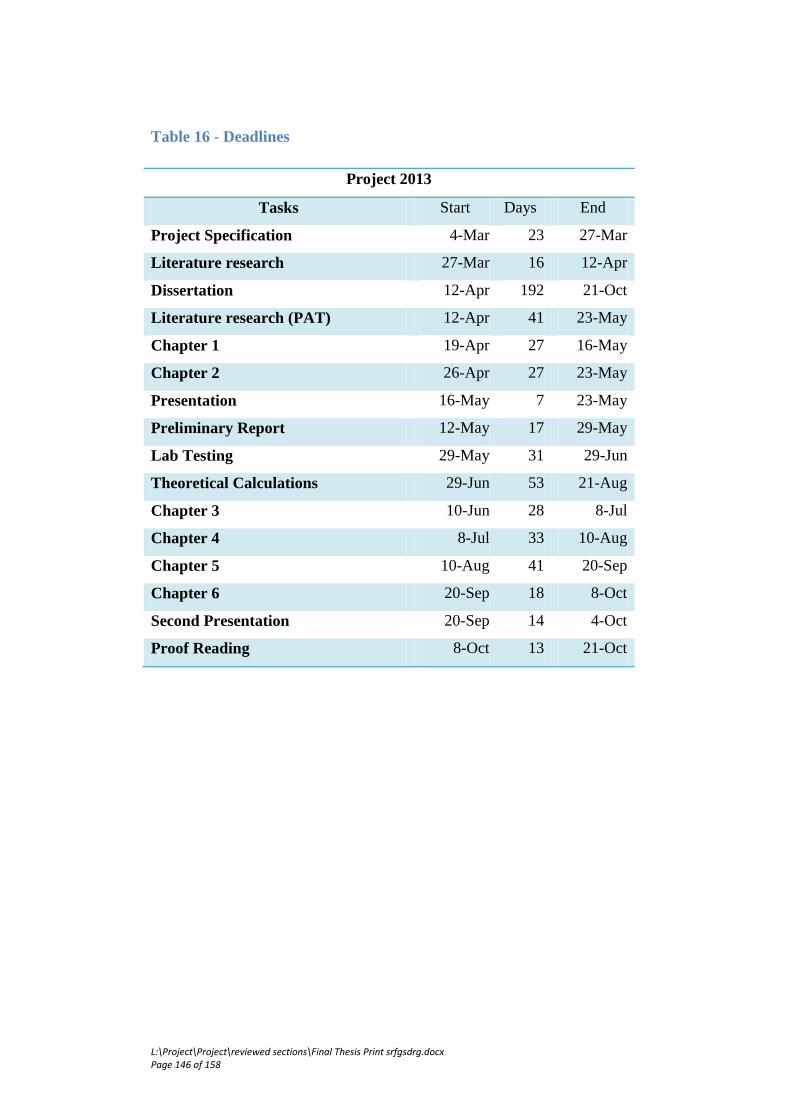
L:\Project\Project\reviewed sections\Final Thesis Print srfgsdrg.docx Page 146 of 158
Table 16 - Deadlines
Project 2013
Tasks Start Days End
Project Specification 4-Mar 23 27-Mar
Literature research 27-Mar 16 12-Apr
Dissertation 12-Apr 192 21-Oct
Literature research (PAT) 12-Apr 41 23-May
Chapter 1 19-Apr 27 16-May
Chapter 2 26-Apr 27 23-May
Presentation 16-May 7 23-May
Preliminary Report 12-May 17 29-May
Lab Testing 29-May 31 29-Jun
Theoretical Calculations 29-Jun 53 21-Aug
Chapter 3 10-Jun 28 8-Jul
Chapter 4 8-Jul 33 10-Aug
Chapter 5 10-Aug 41 20-Sep
Chapter 6 20-Sep 18 8-Oct
Second Presentation 20-Sep 14 4-Oct
Proof Reading 8-Oct 13 21-Oct
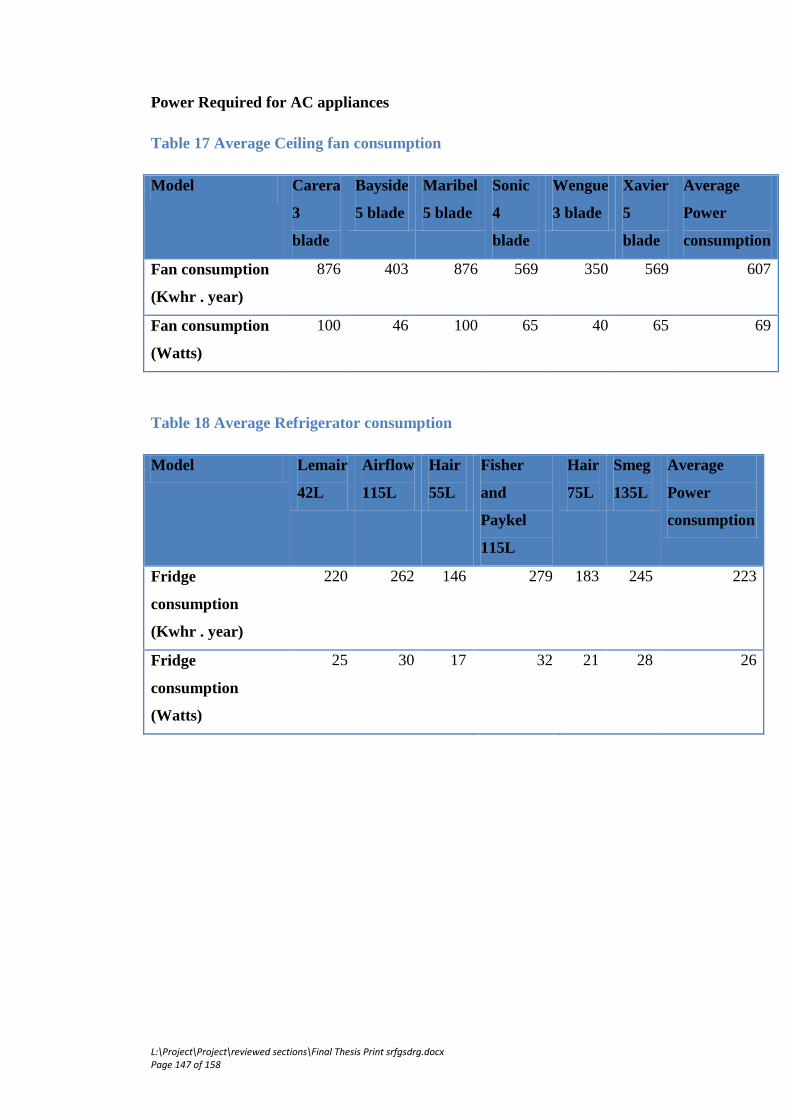
L:\Project\Project\reviewed sections\Final Thesis Print srfgsdrg.docx Page 147 of 158
Power Required for AC appliances
Table 17 Average Ceiling fan consumption
Model Carera
3
blade
Bayside
5 blade
Maribel
5 blade
Sonic
4
blade
Wengue
3 blade
Xavier
5
blade
Average
Power
consumption
Fan consumption
(Kwhr . year)
876 403 876 569 350 569 607
Fan consumption
(Watts)
100 46 100 65 40 65 69
Table 18 Average Refrigerator consumption
Model Lemair
42L
Airflow
115L
Hair
55L
Fisher
and
Paykel
115L
Hair
75L
Smeg
135L
Average
Power
consumption
Fridge
consumption
(Kwhr . year)
220 262 146 279 183 245 223
Fridge
consumption
(Watts)
25 30 17 32 21 28 26
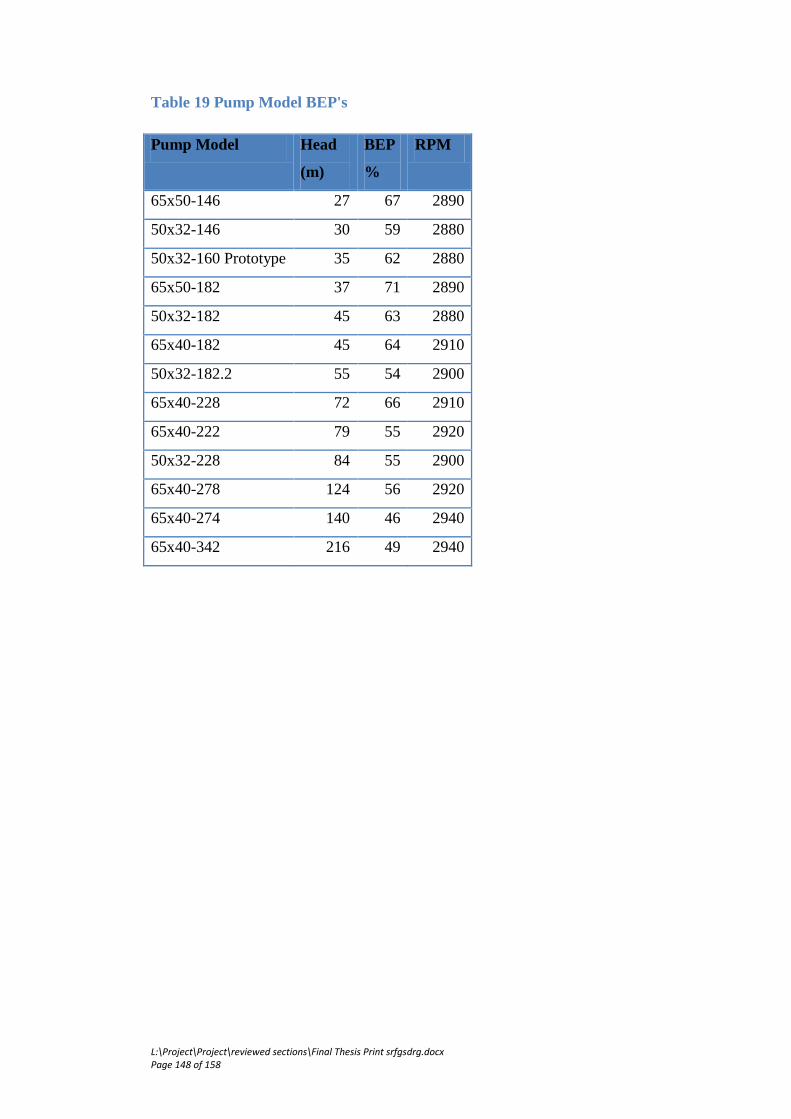
L:\Project\Project\reviewed sections\Final Thesis Print srfgsdrg.docx Page 148 of 158
Table 19 Pump Model BEP's
Pump Model Head
(m)
BEP
%
RPM
65x50-146 27 67 2890
50x32-146 30 59 2880
50x32-160 Prototype 35 62 2880
65x50-182 37 71 2890
50x32-182 45 63 2880
65x40-182 45 64 2910
50x32-182.2 55 54 2900
65x40-228 72 66 2910
65x40-222 79 55 2920
50x32-228 84 55 2900
65x40-278 124 56 2920
65x40-274 140 46 2940
65x40-342 216 49 2940
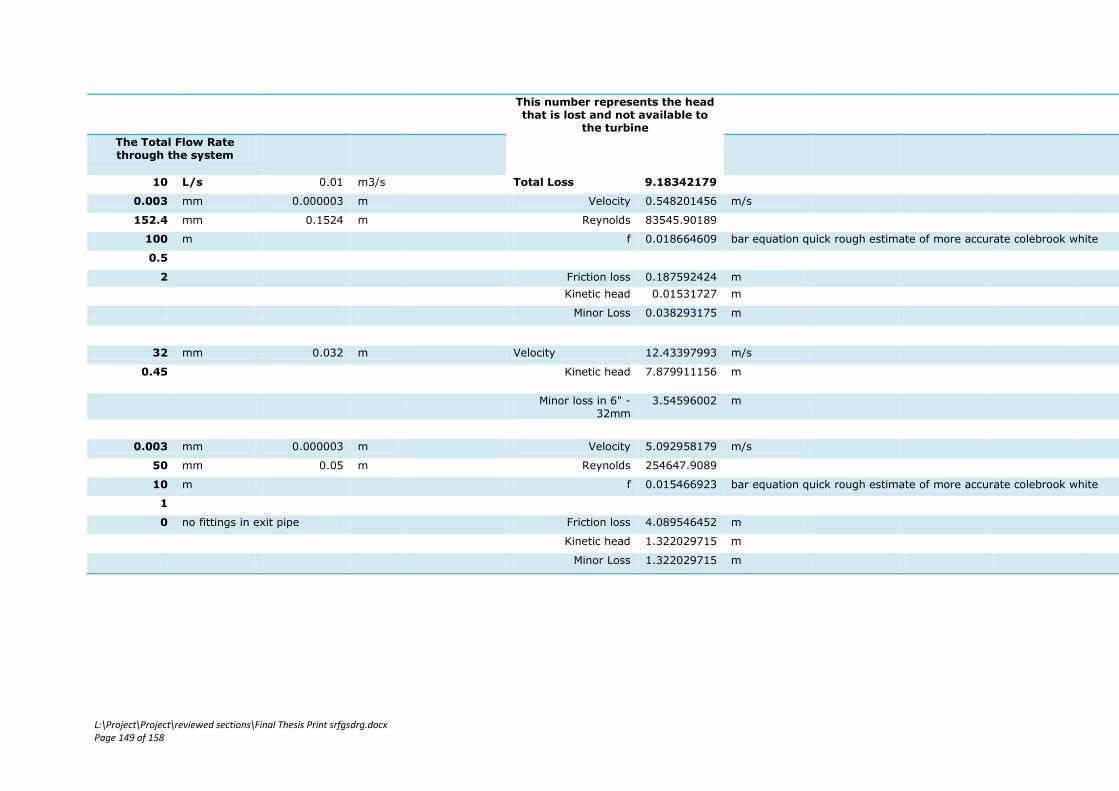
L:\Project\Project\reviewed sections\Final Thesis Print srfgsdrg.docx Page 149 of 158
This number represents the head that is lost and not available to
the turbine
The Total Flow Rate through the system
10 L/s 0.01 m3/s Total Loss 9.18342179
0.003 mm 0.000003 m Velocity 0.548201456 m/s
152.4 mm 0.1524 m Reynolds 83545.90189
100 m f 0.018664609 bar equation quick rough estimate of more accurate colebrook white
0.5
2 Friction loss 0.187592424 m
Kinetic head 0.01531727 m
Minor Loss 0.038293175 m
32 mm 0.032 m Velocity 12.43397993 m/s
0.45 Kinetic head 7.879911156 m
Minor loss in 6" - 32mm
3.54596002 m
0.003 mm 0.000003 m Velocity 5.092958179 m/s
50 mm 0.05 m Reynolds 254647.9089
10 m f 0.015466923 bar equation quick rough estimate of more accurate colebrook white
1
0 no fittings in exit pipe Friction loss 4.089546452 m
Kinetic head 1.322029715 m
Minor Loss 1.322029715 m

L:\Project\Project\reviewed sections\Final Thesis Print srfgsdrg.docx Page 150 of 158
Appendix F
Stormwater Runoff
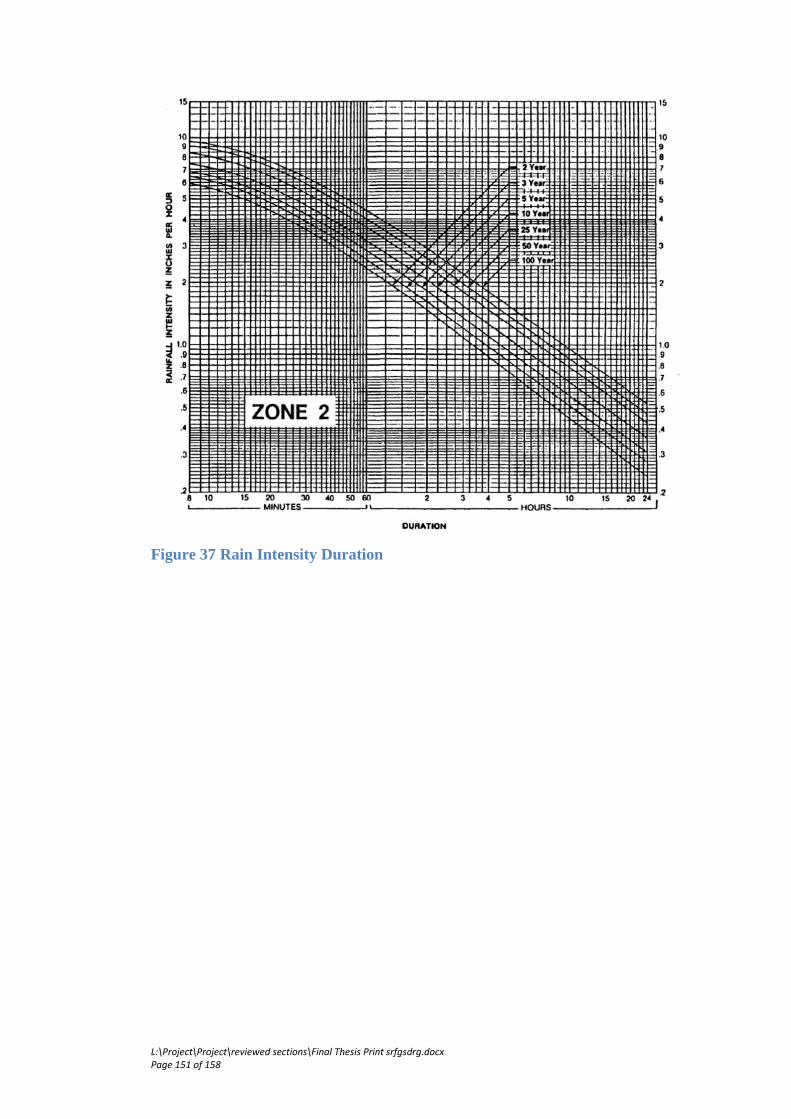
L:\Project\Project\reviewed sections\Final Thesis Print srfgsdrg.docx Page 151 of 158
Figure 37 Rain Intensity Duration
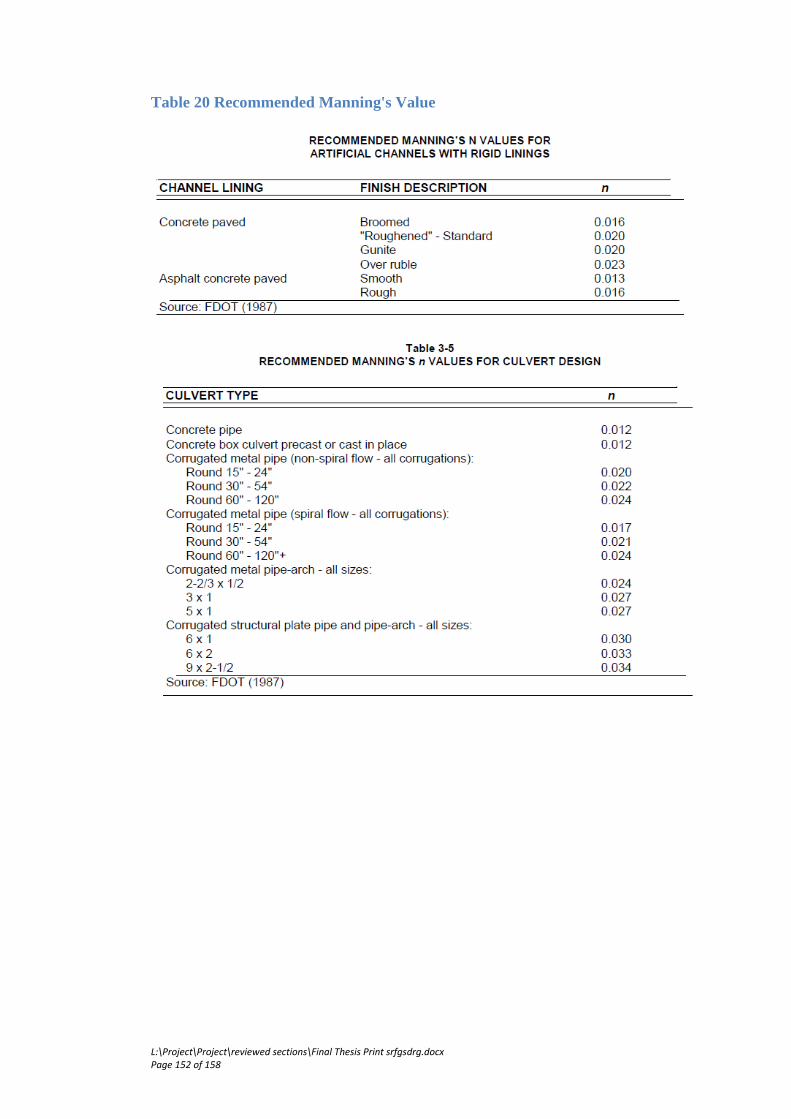
L:\Project\Project\reviewed sections\Final Thesis Print srfgsdrg.docx Page 152 of 158
Table 20 Recommended Manning's Value
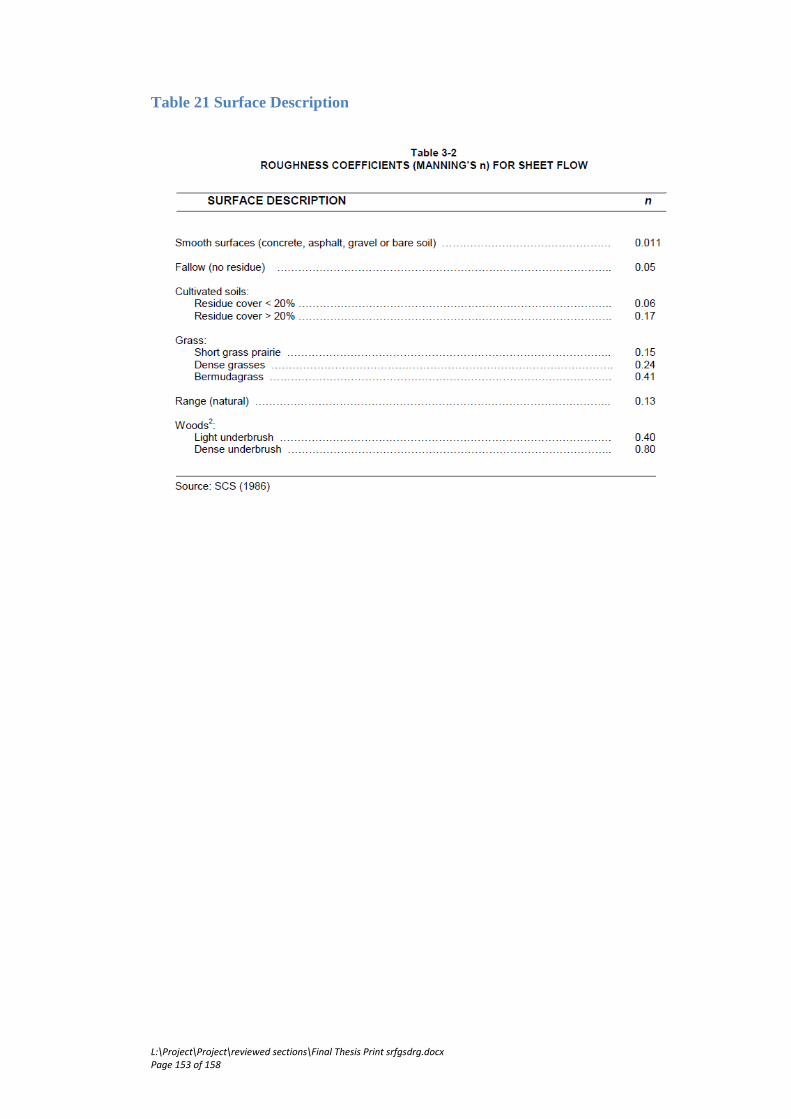
L:\Project\Project\reviewed sections\Final Thesis Print srfgsdrg.docx Page 153 of 158
Table 21 Surface Description
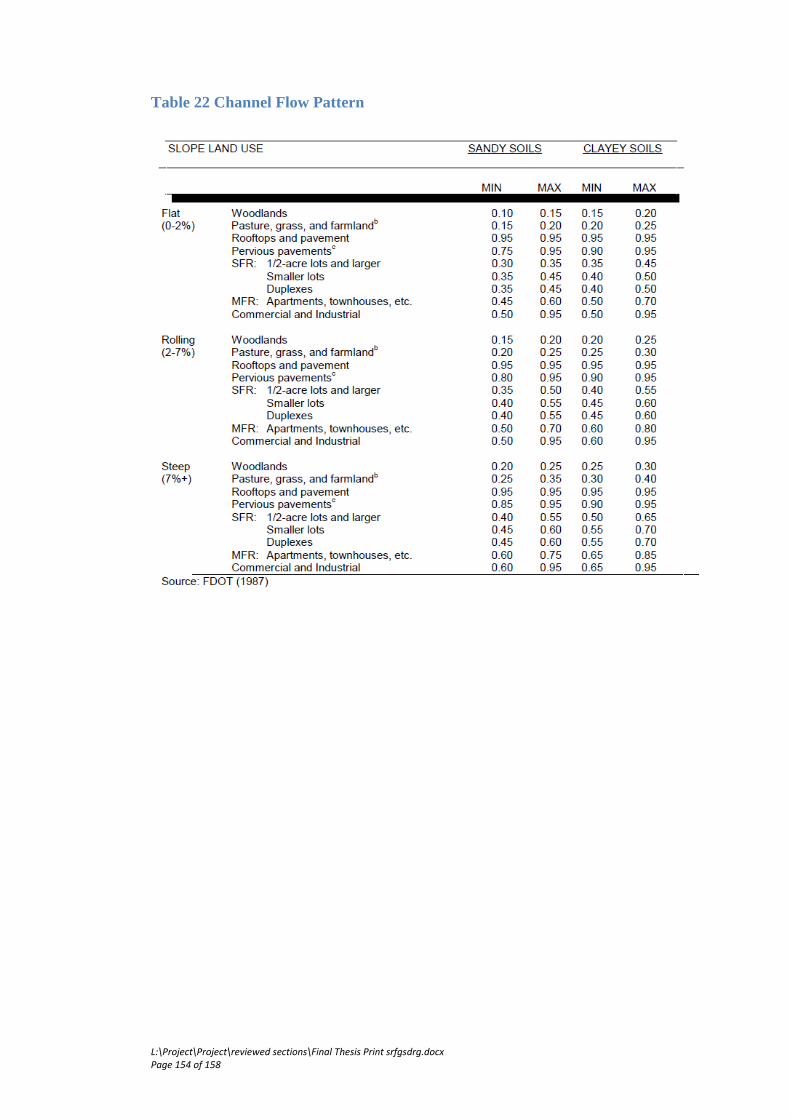
L:\Project\Project\reviewed sections\Final Thesis Print srfgsdrg.docx Page 154 of 158
Table 22 Channel Flow Pattern

L:\Project\Project\reviewed sections\Final Thesis Print srfgsdrg.docx Page 155 of 158
Appendix G
Battery Requirements
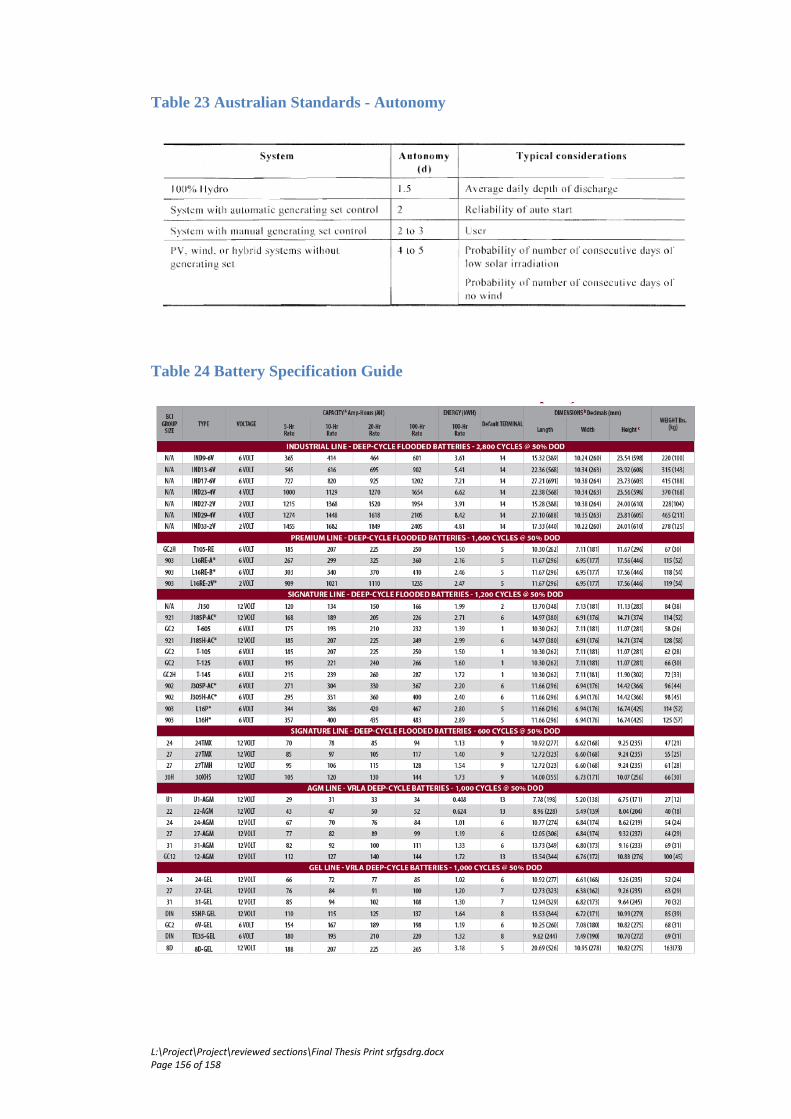
L:\Project\Project\reviewed sections\Final Thesis Print srfgsdrg.docx Page 156 of 158
Table 23 Australian Standards - Autonomy
Table 24 Battery Specification Guide

L:\Project\Project\reviewed sections\Final Thesis Print srfgsdrg.docx Page 157 of 158
References Alexandratos, N. (2005), Countries with Rapid Population Growth and Resource
Constraints: Issues of Food, Agriculture, and Development, Population and
Development Review, Volume 31, Issue 2: 237-258.
Bradshaw, Michael. (2013), Global Energy Dilemmas, Policy Press UK
Fischer, G. and Schrattenholzer, L., (2001), Global bioenergy potentials through
2050, in Biomass and Bioenergy 20, p151-159, Elsevier publishing.
Gaddis, John Lewis. The United States and the End of the Cold
War:Reconsiderations, Implications, Provocations. New York: OxfordUniversity
Press, 1992.
Haass, Richard. The Reluctant Sheriff: The United States After theCold War. New
York: Council of Foreign Relations Press, 1997.
Rogner, Hans-Holger and Anca Popescu: Chapter1, World Energy Assessment,
pp. 31-37, UNDP, 2000
Derakhshan, S. Nourbakhsh,(2007) A, Experimental Study of Charecteristic curves
of centrifugal pumps working as turbines in specific speeds, Experimental Thermal
and Fluid Sciencee, University Of Tehram, Iran
Rawel, S. Hshirsager.J.T, (2007), Numerical Simulation on a Pump Operating in a
Turbine Mode, Cummins Research and Technology, Head, Coporate Research and
Engineering Division, Pune, India.
G and M Poly Irrigation,(2012), G and M Poly Irrigation 2012 Pricelist, Murray
Valley Highway, Cohuna
Australian/New Zealand Standar, (2010), Stand Alone Power Systems. Part 2:
System design, Council of Standards Australia (22nd October 2010)

L:\Project\Project\reviewed sections\Final Thesis Print srfgsdrg.docx Page 158 of 158
Hydroelectricity Fact Sheet,(2012)'An Overview of Hydroelectricity in Australia. p1-
3, viewed 15 July 2013
Patent-based Technology Analysis Report, (2012)' Alternative Energy', World
Intellectual property Organization, viewed 25 June 2013
Poullain. J. (2012), Estimating Storm Water Runoff. p 10-21, 5275 Meadow Estates
Drive Fairfax, VA
Vinidex, System & Solutions,(2010), PE Pipe Systems selection manual, Irrigation
Warehouse Group Pty Ltd <www.polypipe.com.au>
Williams,A. (1995), Pumps As Turbines. A user's Guide, Intermediate Technology
Development Group, Intermediate Technology Publications
Moaveni, S. (2011), Engineering Fundamentals : An Introduction to Engineering,
4th edn, Institute of Technology, Kanpur
James,G.(2007), Modern Engineering Mathematics, 4th edn, Pearson, Edinburgh
Gate, England.
Hamil, L.(2011), Understanding Hydraulics, 3rd edn, Palgrave Macmillan, p.337-
471, Hampshire, England
William, J.P, (2011), Introduction to Matlab for engineers, 3rd edn, McGraw Hill,
New York, USA
ELE1801 N/A Electrical Technology : Study Book, University Of Southern
Queensland, Toowoomba