Embed Size (px)
Citation preview

NOAA Technical Memorandum ERL PMEL-JO
HYDROCAllBONS ASSOCIATED WITH SUSPENDED MATTER. IN THE
GBBElf RIVER, WASHINGTON
S. E. HamiltonJ. D. Cline
Pacific Marine Environmental LaboratorySeattle, WashingtonMay 1981
UlllED STATESDEPARlIIEIT OF COMMERCE
M"I:I" ........s..,NATIONAl. OCEANK: ANDATMOSPHERI: ADMINISTRATION
JlIIIes P. Walsh,Adi1a Administrab
Environmental ResearchlaboratoIies
Joseph o. Fletcher,Idq DiecIIr
--- ---~

NOTICE
The Environmental Research Laboratories do not approve, recommend, norendorse any proprietary product or proprietary material mentioned in thispub1i cation. No reference sha" be made to the Envi ronmenta1 ResearchLaboratories or to this pUblication furnished by the Environmental ResearchLaboratories in any advertising or sales promotion which would indicate orimply that the Environmental Research Laboratories approve, recommend, orendorse any proprietary product or proprietary material mentioned herein,or which has as its purpose an intent to cause directly or indirectly theadvertised product to be used or purchased because of this EnvironmentalResearch Laboratories publication.
ii

CONTENTS
Page
Abstract xi
1.0 INTRODUCTION 11.1 HYDROCARBONS--GENERAL 1
1.1.1 Compositional characteristics of petroleumhydrocarbons 1
1.1.2 Compositional characteristics of recentlysynthesized hydrocarbons 3
1.1.3 Summary of compositional differences betweenrecently synthesized and fossil fuelhydrocarbons 4
1. 2 THE ASSOCIATION OF HYDROCARBONS WITH SUSPENDED MATTER 51.2.1 Laboratory experiments 51.2.2 Environmental studies 6
1.3 RESEARCH OBJECTIVES 7
2.0 STUDY AREA 82.1 GEOGRAPHY 82.2 RIVER DISCHARGE AND SUSPENDED SOLIDS 102.3 CLIMATE 102.4 VEGETATION 122.5 GEOLOGY 122.6 LAND USE IN RIVER BASIN 122.7 DESCRIPTION OF SITES OCCUPIED 142.8 MATERIAL SOURCES 15
3.0 METHODS 183.1 GENERAL STATEMENTS 183.2 FIELD SAMPLING 183.3 FILTRATION PROCEDURES 21
3.3.1 C/N Analysis 213.3.2 Filtration Procedures for
Recovery of Hydrocarbons 213.4 METRO EFFLUENT SAMPLING 223.5 LABORATORY METHODS FOR HYDROCARBON ISOLATION
AND IDENTIFICATION 223.5.1 Extraction 233.5.2 Microgravimetry 253.5.3 Liquid Chromatography 25
A. Silica Gel 25B. Sephadex 26
3.5.4 Gas Chromatography 263.5.5 GC-MS Analysis 30
iii

3.6 ANALYTICAL PRECISION AND SAMPLING VARIABILITY 33
4.0 AREAL DISTRIBUTIONS OF HYDROCARBONS--RESULTS AND DISCUSSION 364.1 JULY 1978 36
4.1.1 Total Extractables and Aliphatics 364.1.2 Unresolved Hydrocarbons 384.1. 3 The Normal Paraffins 384.1.4 Compositional Characteristics 414.1. 5 Unknown Aliphatic Hydrocarbons 434.1. 6 Summary 44
4.2 OCTOBER 1978 454.2.1. Total Extractables and Aliphatics 454.2.2 Unresolved Hydrocarbons 474.2.3 The Normal Paraffins 474.2.4 Compositional Characteristics 514.2.5 Unknown Aliphatic Hydrocarbons 524.2.6 Summary 53
4.3 DECEMBER 1978 534.3.1 Total Extractables and Normal Aliphatics 564.3.2 Unresolved Hydrocarbons 564.3.3 The Normal Paraffins 564.3.4 Compositional Characteristics 614.3.5 Unknown Aliphatic Hydrocarbons 624.3.6 Summary 63
5.0 HYDROCARBON MASS BALANCES 635.1 LOWER GREEN RIVER 63
5.1.1 Water Budget 665.1. 2 Suspended Particulate Budget 665.1. 3 Normal Alkane Mass Balances 66
5.2 UPPER GREEN RIVER 705.3 SUMMARY 71
6.0 SEASONAL VARIATIONS 736.1 NORMAL ALKANE CONCENTRATIONS 736.2 COMPOSITIONAL PARAMETERS 756.3 MASS TRANSPORTS 776.4 SUMMARY 80
7.0 AROMATIC HYDROCARBONS 807.1 GENERAL DISCUSSION 807.2 TOTAL IIAROMATICS II 827.3 INDIVIDUAL COMPONENTS 837.4 SUMMARY 90
8.0 ACKNOWLEDGMENTS 91
Bibliography 93
Appendix A. Auxiliary Data--Study Area and Methods 98Appendix B. Concentration of Suspended Hydrocarbons
in the Green River and Renton Metro Effluent 103
iv
Appendix C. Filtration versus Centrifugation for Retrievalof Suspended Hydrocarbons 109
C.1 General Statements 109C.2 Filter Blanks 109C.3 The Normal Paraffins 111C.4 Compositional Characteristics 112C.S Summary 114
v


TABLES
1. Average monthly temperature and rainfall (1978) for twolocations in the study area. 13
2. Latitudes and longitudes of the stations occupied on theGreen River and the Renton Metro outfall. 16
3. Itinerary of suspended sediment sampling. 16
4. Mean monthly discharge and suspended load of the RentonMetro sewage effluent, 1978. 17
5. Concentrations of the compounds comprising the alkanestandard and the precision of triplicate injections onthe gas chromatograph. 28
6. Concentrations of the compounds comprising the aromaticstandard and the precision of triplicate injections onthe gas chromatograph. 31
7. Determination of analytical reproducibility based ontriplicate analyses of a single homogenized sedimentsample. 34
8. Approximation of sampling variability based on the con-secutive occupations of Station 3 in October 1978. 35
9. Concentrations and compositional parameters of suspendedhydrocarbons retrieved from the Green River by centrifu-gation in July 1978. 37
10. Concentrations and compositional parameters of suspendedhydrocarbons retrieved from the Green River (by centrifugation) and Renton sewage effluent (by filtration) inOctober 1978. 46
11. Concentrations and compositional parameters of suspendedhydrocarbons retrieved from the Green River by centrifu-gation in December 1978. 54
12. Concentrations and compositional parameters of suspendedhydrocarbons retrieved from Renton sewage effluent byfiltration in December 1978. 55
13. Results of the hydrocarbon mass balance calculations forthe lower Green River, October and December 1978. 67
14. Results of the dilution model for the upper Green River,October and December 1978. 72
vii

15. Seasonal summary of selected data and compositionalparameters for Stations It 2(B)t and 3 on the GreenRiver t 1978. 76
16. Seasonal comparison of selected hydrocarbon transportsat Stations It 2(B)t and 3 on the Green River t 1978. 78
17. Concentrations of the total "aromatic" hydrocarbonfractions extracted from suspended matter collectedfrom the Green River and Renton Metro effluent in 1978. 83
18. Approximate concentrations of the aromatics and fattyacid esters extracted from suspended solids retrievedfrom the Green River and Renton Metro effluent in 1978. 87
A-I Mean monthly discharge of the Green River (1978) at twoUSGS stations. 99
A-2 Concentrations of suspended solids (1978) at three Metrostations on the Green River. 100
A-3 Analytical precision of the C-H-N analysis. 101
A-4 Sampling precision of the C-H-N method. 102
B-1 Concentrations of a"lkanes associated with suspendedmatter in centrifuge and filter samples retrieved fromthe Green River in July 1978. 104
B-2 Concentrations of alkanes associated with suspendedmatter retrieved by centrifugation from the Green Riverin October 1978. 105
B-3 Concentrations of alkanes associated with suspendedmatter retrieved by filtration from the Green Riverin October 1978. 106
B-4 Concentrations of alkanes associated with suspendedmatter in centrifuge and filter samples retrieved fromthe Green River in December 1978. 107
B-5 Concentrations of a"lkanes associated with suspended solidsretrieved by filtration from Renton Metro effluent. 108
C-1 Comparison of compositional parameters derived for suspended hydrocarbons retrieved by centrifugation andfiltration t 1978. 115
viii

FIGURES
1. Locations of the sampling stations and Renton Metrosewage outfall on the Green-Duwamish River system. 9
2. Mean monthly discharge (1978) of the Green River attwo USGS stations. 11
3. Concentration of suspended solids (1978) in the Green River. 11
4. Flow diagram of the procedures employed to isolate andidentify hydrocarbons associated with suspended solidsin the Green River. 24
5. Gas chromatogram of the aliphatic standard. 29
6.. Gas chromatogram of the aromatic standard. 32
7. Gas chromatograms of the aliphatic hydrocarbon fractionsextracted from Green River suspended matter. Samples wereretrieved by centrifugation in July 1978. 39
8. Concentrations of the normal paraffins associated withGreen River suspended matter in July 1978. 40
9. Gas chromatograms of the aliphatic hydrocarbon fractionsextracted from Green River suspended matter. Samples wereretrieved by centrifugation in October 1978. 48
10. Top: Concentration of the normal paraffins associatedwith suspended solids in Renton sewage effluent. Thesample was retrieved by filtration of an effluent composite taken October 19-20, 1978.
Bottom: Gas chromatogram of the aliphatic hydrocarbonfraction extracted from the sample identified above. 49
11. Concentrations of the normal paraffins associated withGreen River suspended matter in October 1978. 50
12. Gas chromatograms of the aliphatic hydrocarbon fractionsextracted from Green River suspended matter. Sampleswere retrieved by centrifugation in December 1978. 57
13. Gas chromatograms of aliphatic hydrocarbon fractionsextracted from suspended solids retrieved by filtrationfrom Renton effluent composites in December 1978. 58
ix

14. Concentrations of the normal paraffins associated withGreen River suspended matter in December 1978. 59
15. Concentrations of the normal paraffins associated withsuspended solids retrieved from Renton sewage effluentcomposites in December 1978. 60
16. Tidal heights at Elliott Bay and the schedule of suspendedmatter sampling on the Green River in July 1978. 65
17. Summary figure displaying concentrations of the normalparaffins associated with Green River suspended matterin 1978. 74
18. Gas chromatogram of the lIaromatic" fraction associatedwith suspended solids in the Renton Metro effluent. 84
19. Gas chromatogram of the "aromaticll fraction extracted fromsuspended sediment retrieved at Station 3 in October 1978. 85
20. Gas chromatogram of the lIaromaticll fraction extracted fromsuspended sediment retrieved at Station 3 in December 1978. 86
C-1. Tidal heights at Elliott Bay and the schedule of suspendedmatter sampling on the Green River in October and December1978. 113
ILLUSTRATIONS
1. Suspended matter recovery system: centrifuge, intakemanifold, and prefilters.
x
19
HYDROCARBONS ASSOCIATED WITH SUSPENDED MATTER IN THE
GREEN RIVER t WASHINGTON
By
Susan E. Hamiltonand
Joel D. Cline
Abstract
In 1978 a systematic study of suspended hydrocarbons in theGreen-Duwamish River was undertaken. The goal of the study was todefine the suspended hydrocarbon composition both seasonally and spatially. Emphasis was placed on hydrocarbon budgets of the river and thesignificance of the Renton Secondary Treatment Plant.
Concentrations of total aliphatics t total lIaromaticsll (which werecontaminated with fatty-acid esters)t and the unresolved complex mixtureincrease downriver. The upper river above Auburn t Washington t is dominated by odd-carbon paraffins contributed by aquatic and terrestrialplants. Concentrations of the even-carbon n-alkanes t pristane t andphytane increase downriver as plant wax hydrocarbons decrease in abundance. Compositional changes in suspended hydrocarbons within the upperriver are attributed to highway runoff.
Stations encompassing the sewage outfall show influence of wastewater discharge. CPI indices approach unitYt demonstrating relativeincreases in the even-carbon paraffins. The most distinctive seasonalfeature is the paucity of the algal alkanes (CIS and C17) in December.
A budget of suspended hydrocarbons was calculated for the lowerri ver based on ana lyses of ri veri ne suspended matter obtai ned by centrifugation and effluent-suspended solids recovered by filtration.Results indicate a preferential loss of the heavy hydrocarbons below thesewage outfall. The deficits may by the result of (1) flocculation ordesorpt i on of suspended hydrocarbons in the effl uent as waste watermixes with river water and/or (2) an overestimation of suspended hydrocarbons in the effluent caused by retention of a lipid fraction on theglass fiber filters that is not recovered by the centrifuge. Results ofa bUdget in the upper river suggest that sediments gained by resuspension t erosion t or runoff are diluting the suspended hydrocarbons characteristic of plant waxes.
GC-MS ana lyses of the II aromati cll fractions confi rm the presence ofretene t benz(e)pyrene t perylene t benz(gthti)perylenet chrysene t andfluoranthene in concentrations ranging from 0.08 to 2.2 ~g/g dry weightof riverine suspended matter. Concentrations of perylene and benz(gthti)perylene in the effluent are approximately 40 ~g/g. Esters ofthe even-carbon fatty acids typical of waste water and higher plants arealso found in these samples.
xi


1.0 INTRODUCTION
1.1. HYDROCARBONS--GENERALHydrocarbons (C12-C35) are minor but ubiquitous components of water,
sediment, and the biosphere. Many are not readily metabolized, and theirlow reactivity insures persistence in aqueous environments for longperi ods of time. Farri ngton and Meyer (1975) di scuss the pri ncipa1routes by which hydrocarbons enter the marine environment. Biosynthesisof hydrocarbons by marine and land organisms and the subsequent releaseof these compounds during metabolism and decomposition contribute 1-10 x199 kg/yr. Injection of fossil hydrocarbons geochemically from'submarineand land oil seeps accounts for 0.1-10 x 109 kg/yr. Natural pyrolysisfrom forest fires releases approximately 6 x 10⁹ kg/yr, although the relative proportions of wet and dry deposition are undetermined. Diagenesisof organic matter in soil and sediment comprises a minor geochemicalsource. Anthropogenic contributions, arising from fossil fuel burningand accidental spills, are responsible for another 1-10 x 109 kg/yr.
Fossil fuel comsumption, municipal waste disposal, and industrialeffl uent are i ncreas i ng the fl ux of petroleum hydrocarbons into theaquatic environment. Studies of acute and chronic injections of petroleum hydrocarbons have generated an abundance of literature on distributions of these compounds in the water column (Keizer et al., 1977; Levy,1972), sediments (Blumer and Sass, 1972), biota (Blumer et al., 1970 aand b; Cowell, 1969), and the atmosphere (Lao et a1., 1973; Lunde andBjorseth, 1977). In reciprocal fashion, many investigations have beenprompted by the need to distinguish anthropogenic hydrocarbons from thoseproduced naturally by forest fires (Smith et al., 1973), by sedimentarydiagenesis (Blumer and Snyder, 1965), and by recent biosynthesis (Clarkand Blumer, 1967; Eglinton and Hamilton, 1963).
1.1.1 Compositional Characteristics of Petroleum HydrocarbonsPetro1eum hydrocarbons cover a mol ecul ar-wei ght range from 16 to
over 20,000. Norma1 alkanes from C1 to C60 are present ina ratio of

odd- to even-carbon chain lengths of approximate unity (Blumer et a1.,1972; Farrington and Meyer, 1975). Homologous series of isoprenoidalkanes between C12 and C22 , most notably pri stane (CI9) and phytane(C20), are also found in petroleum (Clark and Brown, 1977).
Substituted and unsubstituted cycl ic compounds are present and arethought to comprise, in part, the baseline IIhump ll referred to as theunreso1ved complex mi xture (UCM) in gas chromatograms of crude oil s(Blumer et a1., 1970b). Dewaxing of petroleum preferentially removesthe n-alkanes superimposed upon this hump (Clark and Brown, 1977).Microbial degradation of crude oil in water and sediment shows a similaralteration and a concentration of the UCM (Clark and Brown, 1977).
Although olefins are rarely present in crude oils, they are formedduring certain refining processes (cracking) and may occur at levels upto 30% in gasoline (Clark and Brown, 1977).
Petroleum contains a complex mixture of aromatic hydrocarbons, someof which are listed below (Clark and Brown, 1977):
Representative Compounds Number of Ringsbenzenes 1napthalenes, biphenyls 2phenanthrenes, anthracenes 3pyrenes, benzanthracenes, chrysenes 4perylenes, benzopyrenes 5
Naphthenoaromatics such as indan and tetralin comprise the higherboiling point fraction of crude oils (Clark and Brown, 1977). Polynuclear aromatic hydrocarbons (PAH) in ancient rocks and petroleum areformed from organic precursors at low temperatures over geological timespans. Compositional characteristics of such effects include extensivealkylation, clustered rings, and 5-membered naphthenic rings of intermediate strain (Blumer, 1976). Youngblood and Blumer (1975) have determined that the parent aromatic compounds in kerogen-rich shales andcrude oil have an average of 3 or 4 alkyl carbons associated with them.The extent of alkylation in No. 2 fuel oil is somewhat reduced with an
2

average of 1 to 2 carbon atoms. In contrast, aromatics in car exhaust
show little alkylation (Clark and Brown, 1977). Wet and dry deposition
and subsequent surface runoff ultimately transport these compounds intoaquatic environments.
1.1.2 Compositional Characteristics of Recently Synthesized Hydrocarbons
Generally, biogenic hydrocarbons are characterized by a narrow mol
ecular-weight range in which a single component often exceeds all others
in concentration (Blumer et al., 1972). Eglinton and Hamilton (1963)summarize compositional trends found in plant waxes, a major terrestrialsOt:lrce of aquatic hydrocarbons. The n-a1kanes of these waxes fall between C25 and C35 with the predominant paraffin being C21, C29 , C31 , or
C33. Odd-carbon alkanes are more abundant than even-carbon alkanes bygreater than an order of magnitude. A wi de vari ety of gymnosperms andferns analyzed for hydrocarbons yield C29 , C31 , or C33 as the major
paraffin (Wakeham, 1976). Principal alkanes of marsh grasses are theodd-carbon compounds between C21 and C29 (Burns and Teal, 1971).
Clark and Blumer (1967) found large concentrations of C15 and C17 in
both red and brown algae. Some species contained al kanes with an oddnumber of carbon atoms while others exhibited an even-carbon preference.Green algae showed largest toncentrations of C17. Most algal paraffins
displayed a minimum around C19-C21 and showed a secondary maximum near
C27-C30 . A mixed culture of zoo- and phytoplankton contained predominantly C17 and pristane.
A1kenes are much more abundant in aquatic organi sms than in crudeoil. Copepods and some fish contain mono-, di-, and tri-olefins, and
often sizable concentrations of heniecosahexaene (Straight-chained, 6double bonds), (Youngblood et al., 1971; Blumer et al., 1970a).
Isoprenoid alkanes and alkenes, over a narrow molecular-weightrange (C19-C20) are present in many marine organisms (Clark and Blumer,
1967). Pristane (C19) is abundant in copepods where it is formed fromingested phytol and stored as a nonmetabolized buoyancy agent. Aszooplankton are consumed, pristane accumulates in the fatty tissuesof higher food chain members (Blumer et al., 1964), and is eventually
3

deposited in sediments. Phytane (C20) has been found in bacteria (Han
and Calvi n, 1969) and is generally present in trace amounts in modern,
uncontami nated sediments (81 umer and Snyder, 1965; Gi ger, 1974). It is
found in relatively larger amounts in ancient sediments (Meinschein,
1969), where it appears to be a diagenetic product of chlorophyll con
versions (Blumer and Snyder, 1965). In that both pristane and phytane
are present in both organisms and fossil fuels, they are equivocal indi
cators of petroleum. However, thei r concentrations re1ati ve to other
hydrocarbon concentrations and parameters are useful source i ndi cators
in specific environments.
Polynuclear aromatic hydrocarbons are produced naturally by forest
and prairie fires. This high-temperature pyrolysis produces arenes with
little alkylation. Blumer and Youngblood (1975) found a relatively
uniform distribution of unalkylated aromatics in various depositional
environments, suggesting atmospheric transport. Analyses of atmospheric
particulate organic matter from remote regions verified the presence of
PAH up to chrysene and benzanthracene in addi t i on to alkanes and i so
prenoids (National Academy of Sciences, 1978). Pyrolytic processes,
however, are not solely responsible for the wide variety of PAH ubiqui
tous to the marine environment. The suggestion that some of these com
pounds may be synthesized by organisms is still hotly debated (Clark and
Brown, 1977). A mixed culture of anaerobic bacteria from Charles River
sediments showed a bioaccumulation of polycyclic aromatic hydrocarbons,
but no biosynthesis (Hase and Hites, 1976). The authors remain skep
t i ca1 that areal bi osynthes is has ever been measured. Bl anks must be
monitored with great care when dealing with organisms that are accum
ulating PAH as well as possibly synthesizing them. Less than one per
cent of the total hydrocarbons in mari ne organi sms are aromatics, and
this may be an overestimate, because the organisms analyzed have not been
reliably free of contamination (Clark and Brown, 1977).
1.1.3 Summary of Compositional Differences Between Recently Synthesized
and Fossil Fuel Hydrocarbons
In light of the preceding discussion, diagnostic differences be
tween thermogenic hydrocarbons and those resulting from biosynthesis can
4

be summarized. Petroleum contains a hydrocarbon mixture of greater
complexity than is produced by living organisms. Many homologous series
are present in fossil fuel and of these, adjacent-membered paraffins aretypically found in equal concentrations. An unresolved complex mixture.. hump" often characteri zes gas chromatograms of samp1es contami nated
with petroleum.
In compari son, bi ogeni c n-a1kanes have an odd-carbon predomi nancewith one paraffin usually more abundant than all others. Petroleum
contai ns a wi de range of i soprenoi ds whi 1e organi sms are characteri zedby 19- and 20-carbon homologs. Olefins are absent in crude oils, but
may occur to some extent in refined products and are abundant in aquaticorgani sms. Alkyl ated aromatics and naphthenoaromati cs characteri zefossil fuel; una"lkylated arenes spanning a narrower. molecular-weightrange are produced duri ng hi gh-temperature pyro lys is. Low concentrations of aromatics with little alkylation, which may be caused by contam
ination, are found in marine organisms.
1.2 THE ASSOCIATION OF HYDROCARBONS WITH SUSPENDED MATTERThe myriad of studies concerning hydrocarbon distributions in
pri st i ne and contami nated envi ronments is exhaustive. These works wi 11be referred to where they are deemed pertinent. Studies elucidating therole of suspended particulates in the accommodation and dispersal of
hydrocarbons are of particular interest here.
1.2.1 Laboratory ExperimentsInteract ions between hydrocarbons and suspended soli ds have been
explored in a number of laboratory simulations. Poirier and Theil(1941) eva1uated the adsorptive behavi or of several natural materi a1s(shales, silt, humus, etc.) towards crude oil. Kaolin accommodated thegreatest amount of oil (-2.2 g oil/g sed). More oil was associated with
fine-grained material than with coarser particulates. In a similarstudy, Huang and Elliott (1977) demonstrated that mineral phases (most
of which are negatively charged) accommodate similarly charged oildroplets. Apparently, the adsorption or agglutination interactions are
stronger than the electrostatic repulsive forces. In an attempt tofurther elucidate the sorption phenomenon, Baker et al. (1978) ini-
5
t i ated a 1aboratory investi gat i on of the amount of oi 1 that coul d be
accommodated by riverine suspended solids. They reported decreasing
oil/sediment sorptivity with increasing temperatures and showed that
river sediment can assimilate up to its own weight in oil. Loadings of
Prudhoe Bay crude oil on Skagit Ri ver sediments ranged from 0.07 mg
oil/mg sed to 0.96 mg/mg as the amount of oil added was increased from 9
to 133 mg. Loading capacities of Fraser River sediments varied incon
sistently (0.07 to 0.17 mg oil/mg sed) with amounts of oil added (18 to
89 mg).
Meyer and Quinn (1973) reported that hydrocarbon solubility affects
uptake and retention of hydrocarbons by sediments. Smaller amounts of
eicosane t hexadecane. anthracene. and phenanthrene were associated with
sediment particles as temperature increased. Bentonite showed the
greatest affinity for oil (51.%). followed by kaolinite (28%). illite
(12%). and finally montmorillonite (3%). In addition. removal of or
ganic matter associated with marine sediments increased the hydrocarbon
loading capacity by an average factor of 2.2. The humic fraction of the
organi c matter appeared to be respons i b1e for the reduction in uptake.
perhaps by occupying sorption sites or by binding particulates and
reducing their effective surface area.
Meyers and Oas (1978) demonstrated that the amount of n-a1kane
associated with smectite increased with carbon chain length from C18(0.74 IJg/mg; 38% uptake) to C28 (1.41 jJg/mg; 70% uptake). probably
because of decreasing solubilities. Relatively greater concentrations
of the isoalkane analogs were removed. Uptake of the aromatics durene
(0%). acenaphthene (0%). and pyrene (19%) were low. whi 1e anthracene
showed an adsorption at 46%.
1.2.2 Environmental Studies
Most studies concerning hydrocarbon transport and removal by sus
pended solids in aqueous environments have dealt with estuaries. specif
i ca11 y those contami nated by sewage treatment plant effl uents. It has
been estimated that up to 5% of the hydrocarbons enteri ng the ocean
annua lly are a result of domestic waste-water effl uent (Van Vl eet and
Qui nn. 1977). Farri ngton and Qui nn (1973) reported total hydrocarbon
6

concentrations of up to 16.2 mg/l for discharges from three waste-water
plants located on the Providence River and Narragansett Bay. Although
compositional parameters and concentrations of individual compounds were
not reported. features of the effl uent hydrocarbon chromatograms were
similar to those of Wilmington crude and No. 2 fuel oils. Possible
sources of these petroleum hydrocarbons include highway runoff. atmos
pheric fallout. and casual disposal of lubricating oils. The concentra
tion and composition of effluent hydrocarbons ruled out thermally ox
idized cooking fats as a likely source.
Schultz and Quinn (1977) reported that hydrocarbon-to-suspended
matter ratios decreased as they sampled from the Providence River (34.8
mg/g) in Narragansett Bay (1.5 mg/g). Gas chromatographic analyses on
packed columns indicated the presence of both pristane and phytane. an
odd/even n-a"lkane ratio of unity. and a high percentage of unresolved
hydrocarbons. supporting the authors I argument for petroleum sources in
the river (e.g .• the Field Point Sewage Plant. small oil spills. and
shipping activity).
Van Vleet and Quinn (1977) determined the average total hydrocarbon
concentration in the Field Point Treatment Plant effluent to be 2.80 mg/l
of which 95% was in the form of suspended solids. Values for total
suspended hydrocarbons decreased rapidly with distance from the outfall
indicating rapid particulate deposition. dilution. and/or desorption.
Hydrocarbon composition was attributed to petroleum sources although
individual compound concentrations and compositional parameters were not
reported. On the basis of effluent hydrocarbon concentrations and daily
effl uent volumes di scharged. it is estimated that sewage coul d account
for 42 to 84% of the suspended hydrocarbons in the Providence River. The
authors contend that if total hydrocarbon concentration in waste water
(2.80mg/l) is extrapolated to sewage discharge nationwide (3 x 10¹⁰
l/yr). then thi s source of hydrocarbons to coastal waters (31 x 106
kg/yr) is as important as amounts entering by direct spills (51 x 106
kg/yr).
1.3 RESEARCH OBJECTIVES
It is evident that there is a paucity of literature concerning the
importance of suspended matter in the transport of petroleum hydrocar-
7

bons and other environmentally harmful materials. Even more obvious isthe lack of specific compound concentrations and compositional parameters of hydrocarbons on suspended sediment in both pristine and contaminated areas. This is largely a result of the incomplete resolution ofindividual compounds on packed columns previously used. In addition,the continuing need to clarify ambiguous differences between biogenicand anthropogeni c hydrocarbons in systems where the two sources arepresent is of paramount importance. The purpose of this study is toexpand our knowledge of individual compound concentrations, compositional parameters and other diagnostic features by examining the suiteof hydrocarbons accommodated by suspended matter in the Green Ri ver.The Green River was chosen for study because it is a tractable environmental system: it is small in size, drains an area of low populationdensity, and is impinged upon by only one large point source of contamination, the Renton Metro sewage outfall. Sampl"ing strategy was designed to measure seasonal and spatial variabilities in hydrocarbonconcentrations and to isolate the II signature ll of the sewage outfall.
2.0 STUDY AREA
2.1 GEOGRAPHYThe combined Green-Duwamish River system, located in King County,
Washington, stretches from the western slopes of the Cascade Mountainsto Ell i ott Bay in Puget Sound. The source of the Green Ri ver 1ies inforested valleys near Stampede Pass. The river flows westward for 64ki lometers through forest, then northwest through farm and pasturel andfor 35 kilometers. At river kilometer 19 near Tukwila, the Green Riveris joined by the Black River forming the Duwamish River, which meandersnorthwest for the remaining 19 kilometers through a heavily industrialized region to Elliott Bay. (Figure 1 shows the river from its mouth toapproximately river kilometer 58 southeast of Auburn.) A total of 488square kilometers of terrain is drained by the Green-Duwamish River.(Stevens et al., 1975)
The Howard Hanson Reservoir at river kilometer 103 provides waterstorage for flood control in the winter. Stored flood water is usually
8

...
"
-I-~
PUGETSOUND
-+-+-I~::f"1?~ RentonSewageOutfall
N
1.: :.,· .·..·.. ...
, ...o 2 3 4
km
Figure 1. Locations of the sampling stations and the Renton Metrosewage outfall on the Green-Duwamish River system.
9

dissipated soon after a flood in order to have maximum holding capacity
available for a subsequent flood (USGS, 1978). In late spring, however,runoff from snow me 1tis stored for augmentation of ri ver di schargeduring periods of low flow in late summer. The reservoir also servesintermittently as a quiescent environment for the settling of suspendedsolids since the Tacoma water supply is withdrawn 5 km downstream (CH2MHi 11, Inc., 1974).
2.2 RIVER DISCHARGE
River discharge is high during late fall and winter, responding toseasona1 rains. Snow melt wi 11 extend thi s runoff into June, afterwhich flow rapidly decreases to a minimum in August. This flow regimeis evident in Figure 2 compiled from mean monthly discharges during1978 (Table A-I). The United States Geological Survey (USGS) maintainseight monitoring stations along the Green-Duwamish River, two of whichclosely correspond to sites occupied in this study. The average annualdischarge at the station near Auburn at river kilometer 52 is nearly38.8 m3/sec. The gauging station near Tukwila at river kilometer 20records an annual average of 43.9 m3/sec. (USGS, 1978). Ti dal i nfl uences perturb flow during periods of low discharge up to river kilometer21 and possibly beyond.
Suspended solids are monitored intermittently by the Municipalityof Metropolitan Seattle (1978a). All available 1978 data for stationA319 near Auburn and station 311 near Tukwila are shown in Figure 3(Table A-2).
2.3 CLIMATEThe Green-Duwamish River lies within the west coast marine climate,
typified by moderate temperatures and a definite rainy season. July isusually the driest month and December, the wettest. Most of the rainfall occurs from October through March. Located close to lower reachesof the study area is a United States Weather Bureau (Seattle-TacomaAirport). which records an average of 98.91 centimeters of rain peryear. Upper slopes of the watershed receive 254 cm/yr or more (Stevens,
et al., 1975).Average winter temperatures are in the thirties and forties (FO),
(~O- SOC) . Summert i me temperatures average between the fift i es and low
10

-oQ)(J)
"",
E-w<.!)
0::~IU(f)
o
60.0
40.0
20.0
-",E"C'-
(f)o-....JoenowozwCl.(f):J(f)
Figure 2. Mean monthly discharge (1978) of the Green River atTukwila. river kilometer 20.0 (dotted line). and near Auburn.river kilometer 51.5 (solid line). (USGS. 1978).
80.0
60.0
40.0
20.0
TIME (MONTH)
Figure 3. Profile of the suspended solids concentration in theGreen River. 1978. Each point represents an average of valuesobtained at three Metro monitoring stations: A319 (correspond; ng to Stat; on 1). 311 (correspondi ng to Station 2B).and 3106 (near Station 3).
11

eighties (F°), ("'10-27°C), (Stevens et al., 1975). Table 1 lists the1978 average monthly temperature and rainfall for two locations closeto the study area.
2.4 VEGETATION
Dougl as fi r predomi nates in the upper reaches of the study areawith western hemlock, western red cedar, and some hardwoods existing on
poorly drained soils. Bigleaf maple, red alder, and willow are found atlower elevations. Black cottonwood inhabit bottom lands.
Gound cover is usually composed of shrubs, small trees, andgrasses. The dri er 1owl ands are characteri zed by grasses wi th occasional stands of Douglas fir and Oregon white oak. Freshwater marshesare covered with cattails and rushes (CH2MHill, Inc., 1974).
2.5 GEOLOGYThe Green-Duwamish River valley was formed as the Vashon Glacier
receded 12,000 to 14,000 years ago, leaving layers of gravel, sand, andcl ay (CH2MHi 11, Inc., 1974).
Soils in the lower valley are composed of the Puget Series which isalluvial and contains a high proportion of silt. The uplands are characterized by glacial soils of the Everett Series (Stevens et al., 1975).More specifically, the riverbed between Auburn and Kent is gravel compacted with silt. Below Kent the river bottom is predominantly silt andrubble (Municipality of Metropolitan Seattle Water Quality Division,1978) .
2.6 LAND USE IN RIVER BASINBelow river kilometer 8, the lowlands drained by the Duwamish River
are used for heavy industry, while the hills above the river valley areoccupied by residential and commercial sites. Shipping activities areextensive thro~ghout this portion of the river, which is dredged to facilitate navigation. Residential and commercial developments and vacantland predominate along the remainder of the Duwamish River to Tukwila.
12

Table 1. Average monthly temperature and rainfall for two locations near the study area, 1978. (U.S. Environmental Data Service, 1978).
Kent Seattle-Tacoma WSO AP47°24 I N, 122°15 1W 47°27 1 N 122°18 1W,
Temperature Rainfall Temperature RainfallMonth °e of cm in °e of cm in
January 6.5 43.7 14.40 5.67 6.9 44.4 10.92 4.30
February 7.5 45.5 9.12 3.59 7.8 46.0 9.12 3.59
...... March 8.8 47.9 7.09 2.79 9.2 48.6 6.17 2.43w
Apri 1 No Data 9.9 49.9 10.64 4.19
May 12.7 54.9 4.98 1. 96 12.5 54.5 4.55 1. 79
June 17.5 63.5 3.23 1.27 17.9 . 64.3 1. 91 0.75
July 18.8 65.8 3.86 1. 52 18.8 65.8 3.56 1.40
August 18.3 64.9 3.30 1. 30 18.6 65.5 3.02 1.19
September 14.7 58.4 14.61 5.75 14.9 58.8 15.11 5.95
October 11. 7 53.0 2.16 0.85 12.4 54.3 2.49 0.98
November No Data 5.1 41. 2 15.37 6.05
December 2.4 36.3 4.72 1.86 3.1 37.5 3.48 1. 37

The following data indicate land use in the lower Green River basin
between Tukwila and Auburn in 1970:
Uses % land areaResidential 11.5Commercial 3.6Industrial 1.9Streets 15.3Open space 33.5Agricultural (cultivated) 2.3Agricultural (pasturage) 3.0Forest 27.5Inland water 1.5
(Municipality of Metropolitan Seattle Water Quality Division, 1978.)
In addition, the river and its tributaries from Kent to river kilometer104 provide excellent grounds for spawning and rearing fish. One of
Washington's largest hatcheries is located on Big Soos Creek, a tributary entering the mainstream near river kilometer 54.
2.7 DESCRIPTION OF SITES OCCUPIEDThe three stations occupied in this study depict three different
riverine environments and correspond closely to Metro and USGS stations
at which discharge, suspended solids, and other parameters of interest
are monitored. Station 1 (Figure 1) is located near the junction of theGreen Valley Highway and Auburn-Black Diamond Road--the first exit heading southeast from Auburn on Highway 18. This corresponds approximately
to river kilometer 54 just upstream of the confluence with Big SoosCreek. This station represents a relatively pristine environment removed from known urban discharges and dominated by evergreen forest and
ground vegetation.Station 2 was originally located at the bridge on Interurban Avenue
at the junction of Highway 1 and West Valley Road, a half kilometer up
stream of the Renton Sewage Outfall. However, during the July 1978 occupation of this station, it was noted that the river slacked and flowedupstream as a result of tidal pumping, possibly contaminating thissample with sewage effluent. For the rema-ining two field excursions,
this station (now designated 2B) was moved up the river approximately 5
kilometers to the bridge at 180th near its junction with West ValleyHighway. Direction of flow remained constant at this point during subsequent samplings. This middle station serves as a monitor below the
14

urban contributions of Auburn and Kent t yet -immediately above the outfall such that the effect of the sewage effluent may be isolated.
Station 3 is located a half kilometer below the outfall at thebridge crossing into Fort Dent Park.
Latitudes and longitudes of all stations occupied are listed inTable 2. The sampling itinerary is presented in Table 3.
2.8 MATERIAL SOURCESThe Renton Metro Sewage Pl ant di scharged an average of 38 ITlgd
(1.44 x 10⁵ m3/day) of effluent into the Green River in 1978 (Table 4).The suspended soli ds concentration of thi s effl uent (Table 4) rangedfrom 7.9 mg/l in January to 23.0 mg/l in November with a mean monthlyaverage of 12.5 mg/l (Municipality of Metropolitan Seattle, 1978b). Thefacility receives waste water from both residential and industrialsources. As much as 25% of the enteri ng waste water may be i ndustri a1
in ori gi n (Archer, 1975). The i nfl uent is passed through a seri es ofgrit and settling tanks for removal of the large t suspended solids. Theliquid is removed from the top of these tanks and proceeds to secondarytreatment. At this point an activated sluqge (a culture of micro-organisms) is added to the liquid to reduce organic matter. The bacteria areallowed to settle before the purified water is finally treated withchlorine gas and discharged. The quantity of chlorine which the RentonMetro plant can expell into the Green River is strictly regulated.Therefore t the effluent is dechlorinated (with S02) before final discharge. The Renton facil ity removes approximately 94% to 97% of theorganic material in the influent (Archer t 1975).
The Green-Duwamish River has been the subject of many enviro~mental
impact studies (Stevens et al., 1975; CH2MHill Inc., 1974; Municipalityof Metropolitan Seattle Water Quality Division t 1978). Over the pastfew years most of the independent point sources of untreated waste havebeen routed to the Renton Metro Treatment Facility, the most recent being the Seattle Kent Highlands Landfill on October 4, 1978 (Mr. RichardFinger t Renton Sewage Treatment Plant, personal communication). AboveStation 1 the Game Department Steel head Hatchery and Fisheries Department Salmon Hatchery have permits to discard wastes in the Green River.
15

Table 2. Latitudes and longitudes of stations on the Green River and the Renton Metro Sewage Outfall.
Station Latitude Longitude
1 470 17 1 45" N 1220 10 1 30" W2 470 27' 57" N 1220 14 1 50" W28 470 26' 30" N 1220 14 1 43" WOutfall 470 28 1 06" N 1220 14 1 37" W3 470 28' 05" N 1220 14' 52" W
Table 3. Itinerary of suspended sediment sampling.
Station 1 Station 2(8) Station 3 Station 3R.....0'\ -
July July 18-19 July 19-20 July 201015 - 0600 0930 - 0430 0700 - 2200
October October 17-18 October 18-19 October 19-20 October 201145 - 0630 1045 - 0615 0945 - 0330 0430 - 2145
(Metro) - - October 19-200730 - 0730
December December 21-22 December 20-21 December 18-19 December 19-201345 - 1200 1015 - 0845 1915 - 1145 1300 - 0700
(Metro) December 21-22 December 20-21 December 18-201300 -.1100 1000 - 0800 1800 - 0600
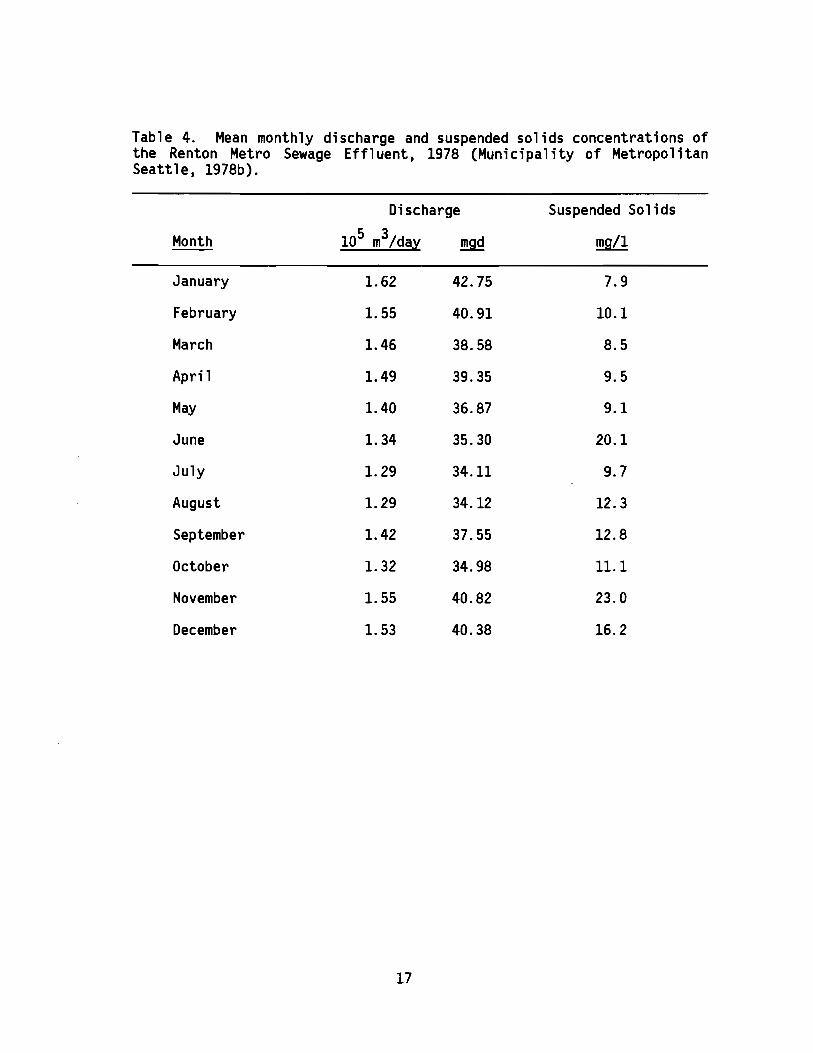
Table 4. Mean monthly discharge and suspended solids concentrations ofthe Renton Metro Sewage Effluent, 1978 (Municipality of MetropolitanSeattle, 1978b).
Discharge Suspended Solids
Month 105 m3/day mgd mgl1
January 1.62 42.75 7.9
February 1. 55 40.91 10.1
March 1.46 38.58 8.5
April 1.49 39.35 9.5
May 1.40 36.87 9.1
June 1. 34 35.30 20.1
July 1. 29 34.11 9.7
August 1. 29 34.12 12.3
September 1.42 37.55 12.8
October 1. 32 34.98 11.1
November 1. 55 40.82 23.0
December 1. 53 40.38 16.2
17

3.0 METHODS
3.1 GENERAL STATEMENTSExtreme precautions were taken while working with these environmen
tally low concentrations of hydrocarbons to decrease the risk of contami nat ion. A11 solvents used were of nanograde qual i ty. Gas chromatographi c traces determ'j ned on reduced volumes of a11 solvents showedacceptab ly low 1eve1s of contami nants wi th the exception of methanolwhich was redistilled prior to use. Glassware, collection vessels, andstainless-steel hardware were washed in a strong dishwashing detergent,rinsed amply with deionized, f'iltered water, and oven dried and soltventrinsed before use. A Cahn Model 4700 Electrobalance was used for weighing filters, standards, and extract aliquots. A Sartorius Model 3716top-loading balance was used for thimble and sediments weighings.
3.2 FIELD SAMPLINGThe mobile field unit consisted of a covered truck 7 or 8 meters in
1ength and a sma11 trai 1er. The former housed the centrifuge, intakemanifold, filtering apparatus, ice chest, and lab bench while the lattercontained a 6-KW diesel generator and its fuel supply. The trailor waslocated at least 35 meters downwind from the truck to minimize contamination from exhaust gases.
Each station was occupi ed for 18 hours, duri ng which river waterwas retrieved with a Peabody Barnes submersible water pump locatedmidchannel and middepth. Water was directed through an intake manifoldand prefil tered through two nylon screens, the sma11 est bei ng 100 microns in mesh size. Flow rates and accumulated volume were monitoredwith a flow meter, flow controller, and pressure gauge. Illustration 1shows the centrifuge, manifold, and flow monitoring system. To reducecontami nat ion the pump, hose, manifold, and tubi ng were fl ushed wi thambient water at each station for 30 minutes before the centrifuge wasengaged.
Approximately every 4 hours, water was diverted at the manifoldthrough Selas® silver filters, and Gelman® glass fiber filters for C/Nanalyses and suspended hydrocarbon analyses, respectively.
Sediment was recovered continuously with a Sorvall Model SS-3 highspeed centrifuge. Sedimentation was accomplished at approximately
18

CentrifugeIntake
Illustration 1. Suspended matter recovery system. Suspended solidsare pumped to the intake manifold and passed through a twostage prefilter (dia ~. 100 ~m). Flow rate and accumulatedvolume through the centrifuge are monitored electronically.The centrifuge is shown mounted in gimbals for use at sea.
19

30,000 gravitational units (15,000 RPM) with supernatant being exhaustedat the rate of 400-500 ml/min.
In October 1980, two years after the conclusion of this study, thecentrifuge efficiency was tested at Station 3. Known volumes of centrifuge influent and effluent were filtered through 47-mm 0.4~m Nuclepore@filters. Centrifuge efficiencies and tidal variations are recordedbelow:
October 29-30, 1980
Ti des* Centrifuge Efficiency
TimeI5!6202403251104
Height (m)1. 982.740.123.51
Timernm21000100050009001300
%--gg
7963927568
x =78± 11* (U.S. Dept. of Commerce, 1980)
River flow at Station 3 is influenced considerably by tidal pumping inElliott Bay. Over a 24-hour period, efficiencies varied from 63% to92%. Highest efficiencies occurred close to periods of low tide. Atthis time, river flow is swiftest and larger particulates (more readilyrecovered by the centrifuge than fine particulates) are probably "insuspension. At high tide river flow is reduced and often stagnant.Larger particles settle out and smaller particulates (possibly too buoyant to be recovered effectively by the centrifuge) comprise the bulk ofthe suspended load. At Station 3 the average recovery of particlesgreater than O. 4 ~m was 78% ± 11%. Thi s represents the most vari ab1eenvironment of the three stations since it is below the outfall (a concentrated source of particulates and poss"ibly colloidal organics) andreadily affected by tidal pumping.
Suspended matter was collected in eight 50-ml stainless-steeltubes. At the termination of sampling, excess water was decanted fromeach tube and the sediment was scraped into a sample jar and placed inan ice chest. During the July sampling, only regular ice was employed,keeping samples cool but not frozen. Dry ice was used during the Oc-
20

tober and December field trips and samples were frozen shortly afterbeing recovered.
3.3 FILTRATION PROCEDURES
3.3.1 C/N Analysis
Prior to sampling, the 0.45 ~m Se1as8 silver filters, 25 mm indi ameter, were combusted ina muff1 e furnace at 400°C for 4 hours,cooled in a dessicator, weighed, and stored in polystyrene petri dishes.In the field a glass filtration system and vacuum pump were employed forthe collection of C/N samples. Known volumes of water were also vacuumfiltered through preweighed Nuc1epore8 filters (47 mm in diameter, 0.4~m pore size) to determine the mass of suspended material retained bythe silver filters.
Upon return to the laboratory, the silver filters were dessicated,weighed, and analyzed by the micro·Dumas combustion method (Sharp, 1974)using a Hew1ett·Packard model 185B C-H-N analyzer. Total carbon andni trogen were cal cu1 ated based on combustion of known wei ghts of NBSacetanilide standard. Table A-3 shows the analytical precision of themethod based On standards run with each set of samples. This precision,based on the ratio of one standard deviation to the mean for all weightslisted, was 12% for nitrogen and 9% for carbon.
Rep1i cate fi lters were not taken in thi s study. However, rep1icates were filtered during a cruise in Cook Inlet, AK, and analyzed bythe same technique and identical C-H-N analyzer. The average samplingpreC1Slon was 20% for carbon and 15% for nitrogen (Gary Massoth,Oceanographer, NOAA/PMEL, personal communication; see Table A-4).
3.3.2 Filtration Procedures for Recovery of HydrocarbonsGe1man® glass fiber filters, 47 mm, type A-E (1.0 ~m nominal pore
size with liquids) were prepared by Soxhlet extraction for 48 hours in a65% methylene chloride/35% methanol solution with a solvent change after24 hours. Filters were subsequently oven dried and stored in cleanedglass jars. In the field during the July sampling these filters wereenclosed in solvent-rinsed plastic holders. Suspended matter was recovered by pressure filtration (14-20 psi) directly from the manifold.Filtered water was collected in a graduated cylinder for volume measure-
21

ment. In October and Deceml:>er t ,water was vacuum filtered in an all
gl ass system. The volume of water fi 1tered t together wi th the TSM
concentration (determi ned from centri fuge data) t was used to cal cul ate
the amount of sediment cpllected on each filter. Filters were stored
frozen in glass petri dishes pending analyses by the methods described
in the laboratory methods section below.
3.4 METRO fFFLUENT SAMPLING
Metro sewage effl uent samples were taken concurrently wi th the
October and December field excursions. One-gallon t glass reagent
bottlest formerly containing nanograde methylene chloride t were deliv
ered to the Renton Metro Sewage Treatment Plant. In October t 4 g mer
curic chloride and 2 g sodium azide were added to the sample to retard
bacteri a1 growth. The four December samp1es each contained approx
imately 1.5 g . mercuric chloride. Each Metro effluent sample totaled
about 3200 ml and was comprised of 200- to 300-ml al iquots of treated
effl uent wi thdrawn every 2 hours. These samples were vacuum fil tered
through 4 ,to 8 Gelman® glass fiber filters which were then frozen. The
filtrate in 600-ml aliquots was poured into a one-liter glass separatory
funnel and extracted with two 60-ml and one 30-ml portions of methylene
chloride. A total of 150 ~l of recovery standard containing 5.93 ng/~l
1 t3 t5 tri-isopropyl benzene and 5.64 ng/~l n-decylcyclohexane was added
to each sample during the extraction. The extracts were stored in one
liter t glass-stoppered bottles in the ice chest.
The suspended soli d concentrations of the METRO effl uent samples
used in later budget calculations (chapter 5) are measured daily by
METRO. Reeve Angel glass fiber filters (type 934 A-H t 2.1 cm in diam
eter t .75 IJm to 1.25 J.fm nominal pore size) are combusted at 5500 Ctcooledtand weighed. Each filter is placed in a Gooch crucible and a
known vo1ume of eftl uent is passed through it. The fi 1ter is then
dried t reweighed t and the suspended particulate concentration is calcu
lated from the weight change and the volume filtered.
3.5 LABORATORY METHODS FOR HYDROCARBON ISOLATION AND IDENTIFICATION
The extraction of hydrocarbons from a sediment matrix has long been
a subject of controversy with methods running the entire spectrum from
sonication and tumbling to the more traditional Soxhlet extraction.
22

Rohrback and Reed (1975), in their comparison of various methodologies,found that Soxhlet extraction released the greatest amount of lipidmateri al, thus thi s method was used in thi s study. The remai ni ng procedures for sample clean-up, separation, and analysis follow thosedeve loped by the Northwest and Alaska Fi sheri es Center (Macleod et a1. ,
1976) with some minor changes. The flow diagram shown in Figure 4outlines the extraction, separation, and concentration proceduresadopted.
3.5.1 ExtractionWhatman@ cellulose thimbles- (25 x 80 nun) were used to contain the
sediment in the Soxhlet ext~actors. The ~ntire Soxhlet apparatus withthimbles was preextracted by cycling them for 48 hours in approximately80 ml of a 65% methylene chloride/35% methanol mixture. Thimbles werethen oven dried and weighed, and the thawed sediment was transferredinto them. Fresh solvent and 150 ~l of recovery standard were added tothe boi 1i ng fl as ks before Soxh1et extraction resumed. After 24 hoursthe sediment was agitated with a stainless-steel spatula, and freshsolvent was placed in the boiling flask. Extracti,on continued foranother 24 hours before thimbles were oven dried and weighed for thecalculation of sediment dry weight.
The relative efficiency of this method was demonstrated by extracting one sedim~nt sample for an additional 24 hours with fresh solvent. Approximately 97% of the extractable hydrocarbons were recoveredin the original 48-hour period.
Solvent extracts were combined in a 250-ml separatory funnel towhich 100 ml of distilled, deionized, filtered water was added to remove methanol. The two-phase system was agitated for 2 to 3 minutes andallowed to separate before the organic layer was drained and the waterwas back-extracted twice with 20 ml each of methylene chloride. Theorganic layer was returned to the separatory funnel and the entire procedure repeated. If the sample still appeared to contain water, anhydrous sodium sulfate, preextracted with methylene chloride, was addedto the flask overnight. Such samples were then either carefully decanted or fi 1tered through a gl ass-woo1 plug before proceedi ng to theconcentration step.
23

(total extractables)
SAMPLE
SOXHLET EXTRACTION
(48 hrs; 65% CH2C1 2/35% CH30H)~
ELIMINATION OF METHANOL
(distilled water wash)~
CONCENTRATION ~ MICROGRAVIMETRY
(heat)~
CLEAN-UP COLUMN CHROMATOGRAPHY
(CH2C1 2 on silica gel)~
SEPARATION COLUMN CHROMATOGRAPHY
(petroleum ether, CH2C1 2 on silica gel)
SATURATED HYDROCARBONS~
CONCENTRATION ~ MICROGRAVIMETRY
(heat, N2)~
GAS CHROMATOGRAPHY~
(glass capillary, SP-2100)
UNSATURATED HYDROCARBONS~
CONCENTRATION ~ MICROGRAVIMETRY
(heat, N2)~
GAS CHROMATOGRAPHY~
(glass capillary, SE-54)
Figure 4. Flow diagram of procedures employed to isolate and identifyhydrocarbons associated with suspended solids.
24

The extracts, in round-bottomed fl asks, were fitted with Snyder@
distillation columns, placed in a hot water bath, and reduced to approx
imately 15 ml. Extracts were then transferred to 25-ml Kuderna-Danish
concentrator tubes (Kontes@) and reduced ina tube heater to 1-2 m1.
Samples were transferred to 5-ml volumetric flasks and brought to
volume for microgravimetry.
3.5.2 Microgravimetry·
Aliquots varying between 20 ~1 and 90 ~l were transferred to pre
wei ghed a1umi num pans wi th Hami 1ton syri n~es. Vari at ions in vo 1umes
used depended upon whether the more concentrated extracts of sediment or
-the 1ess concentrated extracts from fi lter$ were bei ng wei ghed. These
al i quots were allowed to evaporate for 10 to 15 mi nutes, previ ous ly
determi ned to be the interval necessary to evaporate the sol vent and
attain a nearly constant weight. Triplicates of each sample showed an
average relative standard deviation of 7.6%.
3.5.3 Liquid Chromatography
A. Silica Gel
The total organic extract was eluted through a clean-up column
designed to remove residual water and interfering pigments. Twenty
mi1.1iliters of silica gel, 100- to 200-mesh size was combined with 25 ml
of methylene chloride. The $lurry was swirled and permitted to degas
for 5 minutes before quickly being transferred to a liquid chromato
graphic column. When the settling front was one centimeter high, the
stopcock was opened, del ivering solvent at 1 to 2 drops per second.
Tappi ng the column ai ded the settling process. Solvent-washed sand
(1. 7 g) was added to the top of the column and two 25-ml rinses of
methylene chloride were eluted before the sample was chromatographed.
Two 25-ml and one 10-ml aliquots were used to elute the $ample. The
eluate was reduced to 1-2 ml as previously described. Two milliliters
of hexane were added, and the solvent was concentrated again to approx
imately 1 ml in preparation for separation chromatography.
Columns were poured as before but with 15 ml of silica gel and 4.5
grams of activated copper on top of the sand to remove elemental sulfur
and reduced sulfur compounds. The copper was washed with hydrochloric
25

ad d and ri nsed fi rst wi th acetone, then with petroleum ether. Thecolumn was flushed with 50 ml of methylene chloride followed by 40 ml ofpetroleum ether.
The samp1e was app1i ed to the column and eluted wi th 15 m1 ofpetroleum ether, 5 ml of 20% methylene chloride in petroleum ether, andfinally 23 ml of methylene chloride. The saturates eluted within thefirst 18-ml fraction and the unsaturates were contained in the second25-n1l cut. These were reduced to 1-ml volumes, transferred to 2-mlvials and "blown down" with purified N2 to approximately 100 1J1. Onehundred microliters of GC internal standard, hexamethylbenzene (5 ng/lJl)in iso-octane was added, and the sample was again reduced to approximately 100 1J1 before the final capping and refrigeration, pending gaschromatographic analysis.
Solvent blanks were run concurrently with each set of Soxhletextractions. These blanks were corrected for recovery efficiency andsubtracted from sediment samples. Corrected blanks comprised an averageof 4% of the individual n-alkanes in the centrifuge sediment sample.Filter blanks are discussed in appendix C.
B. Sephadex@ ChromatographyLarge quantities of hydrocarbons suspected to be nonaromatics were
i nterferi ng with GC i dentifi cati on of aromati c compounds. For thi sreason, a few samples were chromatographed on Sephadex@. Techni quesemp 1oyed follow those of Prahl and Carpenter (1979). Samples weretransferred to the top of a Sephadex@ LH-20 column (20 g, 2.1 cm i.d.)and eluted with 50% benzene in methanoL The i niti a1 20 ml was di scarded, then a second fraction (35 ml) containing the unsaturates and afinal cut (45 nIl) containing aromatics were collected. Samples wereconcentrated by rotary evaporation, trans ferred to small vi a1sandreduced further by evaporation under N2. Fifty mi cro1iters of the GCinternal standard, hexamethy"lbenzene (5 ng/lJl) in iso-octane, wereadded to each of these samples before they were reduced again under N2.
3.5.4 Gas ChromatographySaturate hydrocarbons were analyzed by a Hewlett Packard model
5730A gas chromatograph interfaced to a Hewlett Packard model 3385integrator. Component separation was accompli shed by split1ess i nj ec-
26

tion on an SP-2100 WCOT glass capillary column, 30 m x 0.25 mm i.d. (J &WScientific, Inc.) equipped with a flame ionization detector. Temperature was programmed from 70°C to 270°C at 4°C/min after an initial 4minute hold. Approximately 2 ~l of each sample (in iso-octane) wasinjected manually.
A standard (Table 5) containing 25 aliphatic compounds in iso-octane solvent was injected daily or more often when conditions appeared'unstable. A chromatogram of this standard (Alk-25) is presented inFigure -5. Concentrations in samples were calculated using responsefactors determi ned from the compos i te standard. These were correctedfor differences in detector behavior and injection technique by the useof internal standard, hexamethylbenzene. The following equation used bythe microprocessor shows the computation:
Mass (X)sa
where:
=Area
Area
( ) Mass XX sa Area X std
Mass ISrO(ISTO)sa Area 15TO
std
X Mass (ISTO)sa X O.F.
X= compound of interestsa =samplestd = standardISTO = internal standardO.F. = dilution factor, incorporating recovery and sediment weight
Table 5 also reports the precision of the gas chromatographic analysis calculated from triplicate injections (on different dates) of thealiphatic standard. Relative standard deviations range from 5.2% to8.1%.
The chromatographic II hump , II referred to as the unresolved complexmixture (UCM) in saturate samples, is defined here as the area enclosedby the baseline and a tangential skim at the base of each peak from C14to C32. The UCM area was measured by di vi di ng the "hump" into 20slices, digitizing the baseline and tangential heights at each point,and applying Simpson1s rule, (Hornbeck, 1975). A response factor relati ng the Si mpson IS rul e area to the integrator area was determi ned byapplying the digitization method to well-shaped standard peaks of known
27

Table 5. Compounds comprlslng the alkane standards concentrations ofthese components s and the precision of three nonconsecutive injectionson the gas chromatograph.
Mean Response(a/x) x 100. Concentration Factor a
Component (ng/lJ1) [10-3 (ng/area)] (%)
C12 dodecane 5.36 1. 062 .086 8.1
C13 tridecane 5.30 0.990 .076 7.6
C14 tetradecane 5.66 1.009 .080 7.9hexamethylbenzene (HMB) 5.00 1. 019 .083 8.1C15 pentadecane 5.38 1.007 .072 7.1C16 hexadecane 5.42 1. 017 .068 6.7
n-decyl cyclohexane (DCH) 5.64 0.947 .064 6.8
C17 heptadecane 5.44 0.981 .065 6.6pristane 5.38 1.010 .066 6.6
C18 octadecane 5.36 0.929 .061 6.6
phytane 5.38 0.976 .061 6.3
C19 nonadecane 5.44 1. 006 .059 5.8
C20 eicosane 5.04 0.985 .054 5.5
C21 heneicosane 5.03 0.977 .053 5.4
C22 docosane 5.00 0.978 .051 5.2
C23 tricosane 5.02 0.966 .053 5.5
C24 tetracosane 5.01 0.993 .053 5.4
C25 pentacosane 5.13 1.017 .056 5.6
C26 hexacosane 5.01 1.041 .060 5.8
C27 heptacosane 5.02 1. 057 .062 5.9
C28 octacosane 8.02 1. 073 .070 6.5
C30 triacontane 5.03 1.148 .075 6.5
C31 hentriacontane 5.21 1.446 .087 5.9
C32 dotriacontane 5.39 1.347 .093 6.9
28

28
2
L
In
DCH 18III 17p IPh 19
21 22 23 24
14 1516 r I
20
26
I 13IHMB ' I
I
I I I
12I
I
25I
3027I
31I 3
• I~J.-Il II ...........-IlIi~l III Il
r'--
N\.0
Figure 5. Gas chromatogram of the aliphatic standard. Compounds and their concentrationsare listed in Table 3-1. Chromatographic conditions are given in section 3.5.4.

areas. The weight of hydrocarbons comprlslng the UCM was calculatedusing an average response factor (weight/area) from standards of n-alkanes covering the UCM range.
The unsaturate fractions (in iso-octane) were injected (splitless)into a Hewlett Packard 5840A gas chromatograph equipped with an SE-54WCaT glass capillary column, 30 m x 0.25 mm i.d. (J & WScientific,Inc.). A standard containing 21 aromatic compounds in iso-octane wasused for identification and quantification (Table 6). A chromatogram ofthis standard is presented in Figure 6. Again, the analytical precisionof the instrument is reported with standard deviations relative to themean ranging from 2.2% to 7.4% (Table 6).
Compound concentrations were corrected for evaporative and otherlosses using a combination of recovery standards spiked in each sample(n-decylcyclahexane in the aliphatic fraction; tri-isopropy"lbenzene inthe aromatic fraction) and an alkane recovery curve determi ned in thefollowing manner. A representative sediment sample and the same sediment spi ked wi th the al kane standard (C11-C32 ' pri stane, phytane) wereconcurrently carried through the extraction procedure. Recoveries weredetermined by difference, and steadily increased from 40% to 90% for thecompounds C13 through phytane, and averaged 90-95% for compounds C19C32 . A1kane recovery effici enci es were app1i ed to aromati c compoundswith similar boiling points.
3.5.5 GC-MS AnalysisIdentity verifications and additional data on individual compounds
were obtained by electron impact GC-MS analyses of selected samples. AnHP 5992 GC-MS system equipped with an SP-2100 glass capillary column forsaturate fractions and an SE-54 glass capillary column for the unsaturate fractions was used.
Three aromatic samples were selected for GC-MS analysis at theInstitute of Geophysics and Planetary Physics at UCLA. The samples wererun on a Finnigan model 4000 GC-MS in the electron impact mode. Theinstrument was equipped with an INCaS Data system and an aV-IOl WCaTglass capillary column (30 m).
30
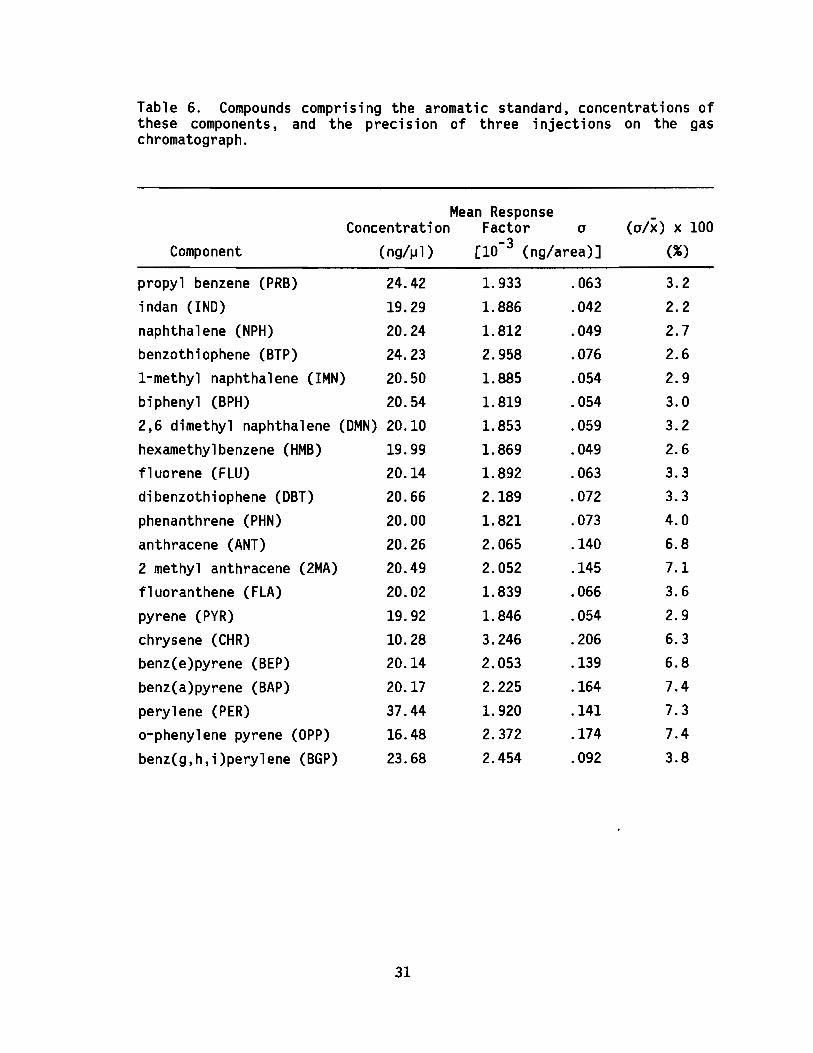
Table 6. Compounds comprising the aromatic standard, concentrations ofthese components, and the precision of three injections on the gaschromatograph.
Mean Response(a/x) x 100Concentration Factor a
Component (ng/~l ) -3 (%)[10 (ng/area)]
propyl benzene (PRB) 24.42 1. 933 .063 3.2
indan (IND) 19.29 1.886 .042 2.2
naphthalene (NPH) 20.24 1.812 .049 2.7benzothiophene (BTP) 24.23 2.958 .076 2.6
I-methyl naphthalene (IMN) 20.50 1.885 .054 2.9biphenyl (BPH) 20.54 1.819 .054 3.02,6 dimethyl naphthalene (DMN) 20.10 1.853 .059 3.2
hexamethylbenzene (HMB) 19.99 1.869 .049 2.6
fl uorene (FLU) 20.14 1.892 .063 3.3
dibenzothiophene (DBT) 20.66 2.189 .072 3.3
phenanthrene (PHN) 20.00 1.821 .073 4.0
anthracene (ANT) 20.26 2.065 .140 6.8
2 methyl anthracene (2MA) 20.49 2.052 .145 7.1
fluoranthene (FLA) 20.02 1.839 .066 3.6
pyrene (PYR) 19.92 1.846 .054 2.9
chrysene (CHR) 10.28 3.246 .206 6.3
benz(e)pyrene (BEP) 20.14 2.053 .139 6.8
benz(a)pyrene (BAP) 20.17 2.225 .164 7.4
perylene (PER) 37.44 1. 920 .141 7.3
o-phenylene pyrene (OPP) 16.48 2.372 .174 7.4
benz(g,h,i)perylene (BGP) 23.68 2.454 .092 3.8
31

al 0a: z~
:r~
zz IZm~ ~~ ~
mCI zD::W
L
~
c>al
I:x:I II I ~
<[Ie..
...JI I
~I~ u..~
:::l
I~
II)
...J m Z<[u..
C <[~
I N
~
~~I
CDa
~
~
0D::I
i0
I
I
I1
I
I
t il 1'--',.lll .J..Il I.. I~ Il1.1\ I IlJ. .l l
nI!
III
i
Iii
I
WN
Figure 6. Gas chromatogram of the aromatic standard. Compounds and their concentrationsare listed in Table 3-2. Chromatographic conditions are described in section 3.5.4

3.6 ANALYTICAL PRECISION AND SAMPLING VARIABILITY
In December, Station 3 was occupied for 36 hours to recover enough
sediment for triplicate analyses. The sediment was homogenized and
divided into 3 aliquots for analyses. The aliphatic-hydrocarbon concen
trat ions determi ned in these rep1i cates, thei r means, standard devi a
t ions, and percent devi at ions from the mean are reported in Table 7.
The mean relative standard deviation for all compounds was 9%; the range
extends from 19% (C16) to 2% (C22 and C32). The low-molecular-weight
hydrocarbons (C13 to C20) showed significantly greater variabilities
(a/x =13%) than the heavy hydrocarbons (C21 to C33 ; a/x =7%), presum
ably due to their higher volatility.
Station 3 was occupied for two consecutive 18-hour periods in Octo
ber. Although these duplicates actually represent river variability,
they are the closest measure of sampling variability determined in this
study. The dup 1i cate values, thei r means, and the ratios of thei r
differences to their means are listed in Table 8. The difference be
tween the values obtained at Stations 3 and 3R divided by their mean
averaged 24% for all the aliphatics. The variability of the volatiles
(C13 to C20 ; Ii/x = 33%) is markedly higher than that of the heavier
components (C21 to C32 ; Ii/x = 16%). Hydrocarbons contai ni ng an even
number of carbon atoms between C22 and C32 exhibited a significantly
greater average variability (25%) than the odd-carbon compounds within
the same range (7%). This is in part a result of the lower concentra
tions of the even-carbon compounds from C22 to C32 . In addition, Sta
tion 3 is below the outfall which appears to be a major source of the
heavy, even-carbon alkanes (chapter 4). Daily variation in the quantity
and characteristics of the effluent is probably reflected in the larger
deviations of the even-carbon compounds. The heavy, odd paraffins are
far more abundant than the even-carbon alkanes, and the major sources of
these odd-carbon compounds, terr~strialp1ant waxes, are encountered
before the outfall is reached. For this reason the heavy, odd hydro
carbons do not fluctuate as greatly relative to the even-carbon com
pounds. The sampling variability listed in Table 8 represents an upper
limit since Station 3, immediately below the outfall, is the most vari
able site among the stations selected for study.
33
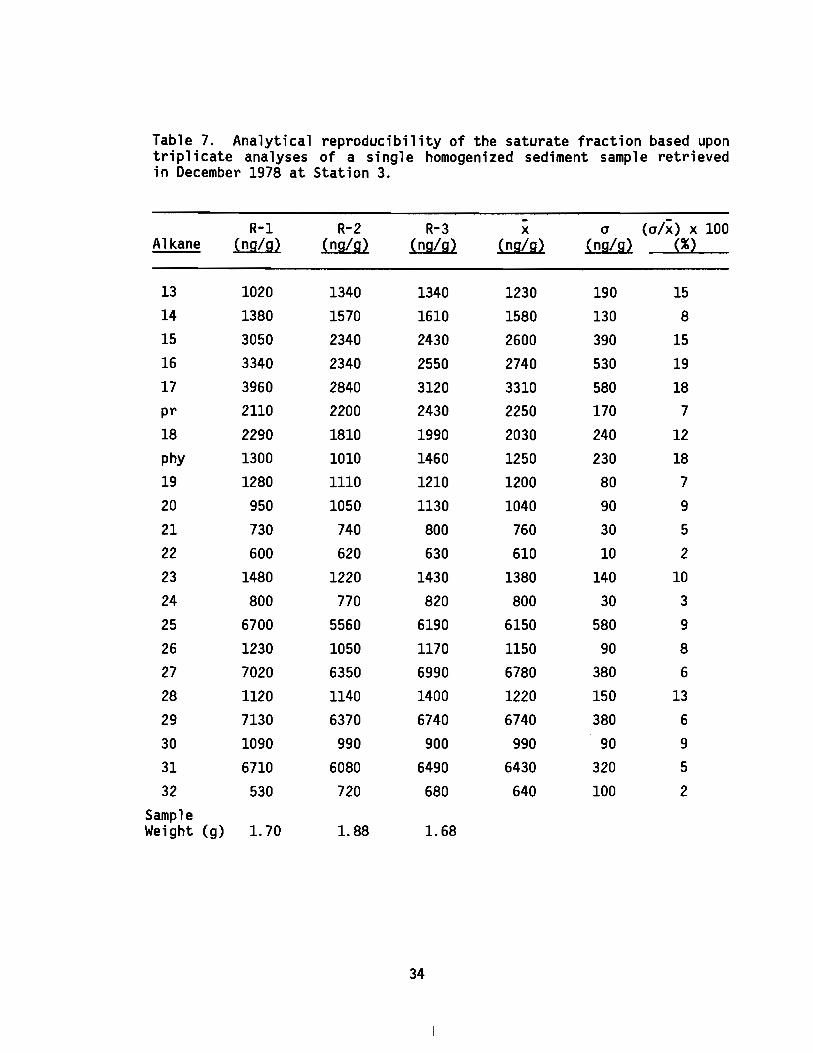
Table 7. Analytical reproducibility of the saturate fraction based upontriplicate analyses of a single homogenized sediment sample retrievedin December 1978 at Station 3.
- (a/x) x 100R-1 R-2 R-3 x aAlkane (ng/g) (ng/g) (ng/g) (ng/g) (ng/g) (%)
13 1020 1340 1340 1230 190 1514 1380 1570 1610 1580 130 815 3050 2340 2430 2600 390 1516 3340 2340 2550 2740 530 1917 3960 2840 3120 3310 580 18pr 2110 2200 2430 2250 170 7
18 2290 1810 1990 2030 240 12phy 1300 1010 1460 1250 230 1819 1280 1110 1210 1200 80 720 950 1050 1130 1040 90 9
21 730 740 800 760 30 5
22 600 620 630 610 10 2
23 1480 1220 1430 1380 140 10
24 800 770 820 800 30 3
25 6700 5560 6190 6150 580 9
26 1230 1050 1170 1150 90 827 7020 6350 6990 6780 380 6
28 1120 1140 1400 1220 150 13
29 7130 6370 6740 6740 380 6
30 1090 990 900 990 90 9
31 6710 6080 6490 6430 320 5
32 530 720 680 640 100 2SampleWeight (g) 1. 70 1.88 1. 68
34
--l

Table 8. Approximation of suspended hydrocarbon sampling variabilitybased upon two consecutive occupations of Station 3 in October 1978.
- (Wx) x 100R-1 R-2 x l:t.Alkanes (ng/g) (ng/g) (ng/g) (ng/g) ill
13 3240 5420 4330 2180 50
14 4660 6860 5760 2200 38
15 14230 19200 16710 4970 3016 3710 5620 4670 1910 41
17 10280 12450 11360 2170 19pr 2890 3540 3210 650 2018 1480 2710 2090 1230 59phy 2300 2180 2240 110 5
19 1340 . 2050 1700 720 4220 1410 1860 1640 460 2821 1280 1150 1220 130 11
22 960 1300 1130 340 30
23 1690 1570 1630 130 8
24 1010 1060 1040 50 5
25 3320 3290 3300 30 126 1390 1790 1590 400 25
27 5420 5610 5510 190 3
28 1350 1930 1640 580 34
29 5490 6120 5800 630 11
30 1170 1720 1440 550 38
31 3440 3610 3530 170 5
32 940 1090 1010 160 15
35

4.0 AREAL DISTRIBUTION OF HYDROCARBONS. RESULTS. AND DISCUSSION
4.1 JULY 1978
Concentrations and compositional parameters of suspended hydrocarbons retrieved at the three stations occupied in July are summarized in
Table 9. Concentrations of total suspended matter (TSM) were determinedby dividing the centrifuge sample weight by the volume of water centrifuged. TSM and total particulate 'organic carbon (TPC) were negatively
correlated, spacially. Station 1 showed the lowest TSM value (2.6 mg/l)and the hi ghest carbon content (8.4%). whereas Stations 2 and 3 exhibited higher suspended loads. averaging 4.6 mg/l and lower carbonvalues, averaging 6.0%.
4.1.1 Total Extractables and AliphaticsTotal solvent extractables ranged from 8.4 mg/g dry sediment at
Station 1 to 28.6 mg/g at Station 3. These values fall within the range
reported by Schul tz and Qui nn (1977) for Narragansett Bay suspendedmatter (1.5 to 34.8 mg/g at the most pristine and contaminated stations,respectively).
Abundance of hydrocarbons in the alkane fraction vari ed between
0.25 mg/g at Station 1 and 1.09 mg/g at Station 3. These values arehigher than those reported for surface sediment in the Gulf of Mexico(0.1-7.5 ~g/g; Gearing et al., 1976), the Northwest Atlantic slope and
shelf (37 ~g/g; Farrington and Tripp, 1977), Narragansett Bay (173 ~g/g;
Wade and Quinn, 1979). and Puget Sound (4-350 ~g/g; Barrick et al.,1980). Values measured in this study are within concentrations deter
mined in sediment from the New York Bight, an area highly contaminatedby petrol eum hydrocarbons (25-1800 ~g/g; Farri ngton and Tripp, 1977).
Total aliphatic concentrations in surface sediments of LakeWashington, a local, freshwater environment near Seattle, varied from
0.28 to 1.70 mg/g. Stations located near the Cedar and Sammamish Riversin the lake showed the lowest concentrations ranging from 0.28 to 0.55mg/g (Wakeham, 1976).
36
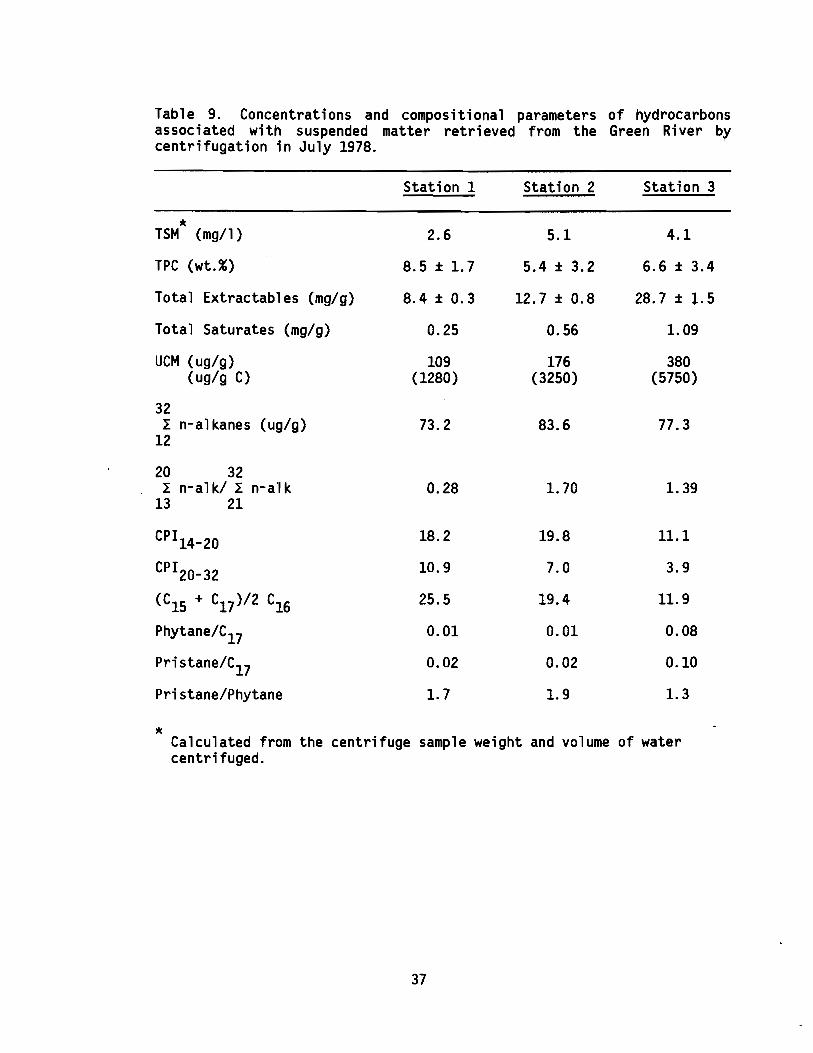
Table 9. Concentrations and compositional parameters of hydrocarbonsassociated with suspended matter retrieved from the Green River b¥centrifugation in July 1978.
lieTSM (mg/l)
TPC (wt.%)
Total Extractables (mg/g)
Total Saturates (mg/g)
UCM (ug/g)(ug/g C)
32In-alkanes (ug/g)
12
20 32I n-alkl I n-alk
13 21
CPI14- 20
CPI20- 32(C15 + C17 )/2 C16Phytane/C17Pristane/C17Pristane/Phytane
Station 1
2.6
8.5 ± 1. 7
8.4 ± 0.3
0.25
109(1280)
73.2
0.28
18.2
10.9
25.5
0.01
0.02
1.7
Station 2
5.1
5.4 ± 3.2
12.7 ± 0.8
0.56
176(3250)
83.6
1. 70
19.8
7.0
19.4
0.01
0.02
1.9
Station 3
4.1
6.6 ± 3.4
28.7 ± l.5
1. 09
380(5750)
77.3
1. 39
11.1
3.9
11. 9
0.08
0.10
1.3
Calculated from the centrifuge sample weight and volume of watercentrifuged.
37

4.1.2 Unresolved Hydrocarbons
The unresolved complex mixture (UCM) , containing cycloalkanes,
naphthenoaromatics, and other unresolved compounds was estimated in each
sample. Typical chromatograms of the saturate hydrocarbon fractions at
Stations I, 2, and 3 are presented in Figure 7. The UCM is unimodal
and reaches a maximum at C2r Concentrations increase from 109 I-Ig/g(1280 I-Ig/g carbon (C)) at Station 1 to 380 I-Ig/g (5750 I-Ig/g C)at Station 3. Despite the differences in concentrations, the UCM com
prises 39% of the total gravimetric saturates at Station I, 30% at
Station 2, and 34% at Station 3. Values at Stations 2 and 3 are on theorder of those measured in post-1955-dated sediments of Puget Sound
(3700 I-Ig/g organic carbon (OC)) by Barrick et al., 1980.
4.1.3 The Normal Paraffins32
The sums of the n-alkane concentrations ( I n-alkanes) are relatively13
uniform for the three July stations, averaging 78.0 I-Ig/g (1190 I-Ig/g C).34
The mean value for Puget Sound surface sediments (I n-alkanes) is much14
lower, 260 I-Ig/g OC (Barrick et al., 1980), as is the average Lake Wash-
ington concentration, 9.27 I-Ig/g (Wakeham, 1976).
The distributions of the individual n-alkanes are presented in
Figure 8. Concentrations are tabulated in Table C-l. Station 1
displays the classical llfingerprints ll of biogenic hydrocarbons. Heptadecane and pentadecane, products of plankton and algae, domi nate thelow-molecular-weight fraction (CI3-C20) at concentrations of 1.3 and
13.1 I-Ig/g, respectively. A concentration minimum between C18 and C22 isfollowed by a preferential increase in the heavy, odd-carbon compounds,
C23 throl-l9h C31 , reaching a maximum at C27 (15.5 I-Ig/g). This highmolecular-weight suite is indicative of terrestrial plant waxes.
Station 2 exhibits a striking increase in CIS (7.8 I-Ig/g) and Cl7(41.0 I-Ig/g) compared to values at Station 1. The concentration of C16is greater by a factor of 4. The heavy, odd-carbon compounds again peak
at C27 (7.6 I-Ig/g) in a pattern similar to that of Station 1. Concentrations, however, are significantly lower.
The pattern of volatile and high-molecular-weight, odd-carbon com-
38

STATION 1IATTENUATION 2') ..
'I' II 'I
I
"
STATION 2tATTEHl,.:ATIOH 2'1
Ulo ...n"h,. I.
..
STATION 3'ATTENUATION 2' l
,ra r. ••
'"...
..
kL·· 150 ---190- -----230------ 270 (HOl.O'NGI
TEMPERATURE (oC)
Figure 7. Gas chromatograms of the aliphatic hydrocarbon fractionsextracted from Green River suspended matter. Samples wereretrieved by centrifugation in July 1978. Chromatographic conditions are given 1n section 3.5.4.
39

SUSPENDED MATTER EXTRACTS(JULY 178 )
20 STATION I
323 STATION 3n
410 STATION 2n
15 17 19 21
15 17 19 21 23 25 27 29 31
.---..-- .---
.---.---
rL n ~ - I-- f-.
o 13
o 13
10
10
10
20
20
zoI«0::IZWUZouwz«~~«--.J«~0::oZ
o 13 15 17 19 21
CARBON NUMBER
Fi gure 8. Concentrations of the normal paraffi ns associ ated withsuspended matter in the Green River. Samples were retrievedby centrifugation in July 1978.
40

pounds at Station 3 is nearly identical to that at Station 2 althoughthe even-carbon alkanes have increased in re1at i ve importance at thelatter station.
4.1.4 Compositional CharacteristicsDiagnostic parameters, reflecting source differences, are summarized
in Table 9. The first of these parameters ;s the ratio of the volatile20 32
hydrocarbons to the heavier constituents ( L n-alk/ L n-alk). This13 21
ratio is lowest at Station 1 (0.28) and highest at Station 2 (1.70). The
value at Station 1 falls within the general range for vascular plants, 0to 0.5 (Gearing et al., 1976) and corresponds to the mean value foundfor Puget Sound sediments, 0.27 (Barrick et al., 1980). The increase inC15 and C17 , and the simultaneous decrease in the heavy, plant waxhydrocarbons account for the higher ratios at Stations 2 and 3. Thesevalues are well below the range for plankton and nonvascular plants(Gearing et al., 1976).
The carbon preference index (CPI) is a weighted ratio of odd- toeven-carbon n-alkanes over a specified molecular-weight range, Theindex is usually calculated over two fractions, the volatiles, C14through C20 (equation 4-1), and the heavy hydrocarbons, C20 through C32(equation 4-2) (Clark and Finley, 1973).
19 19L [odd] L [odd]
CPI14- 20 = 1/2 15 + 1520 18L [even] L [even]
16 14
31 31L [odd] L [odd]
CPI 20- 32 = 1/2 21 + 2132 30L [even] L [even]
22 20
(4-1)
(4-2)
Stations 1 and 2 show similar high values for the low-molecular-weightratio (""19). Between Stations 2 and 3 the CPI14- 20 drops sharply,refl ect i ng the re1ative increase in the concentrations of the evencarbon compounds: C14 , C16 , C18, The simultaneous decrease in C15 and
41

C17 concentrations from Stations 1 to 3 may be the result of reducedaquatic plant production and/or dilution. Crude oils and their refinedproducts, demonstrate CPI14- 20 values of approximate unity, with n-alkane concentration maxima between C14 and C17 (Clark and Brown, 1977).The injection of refined products through the Renton outfall or diffuselocal sources may account for the relative increases in the even-carboncompounds at Station 3. Wakeham (1976) reports a CPI14-20 of 1.10 forthe West Point Sewage Effluent.
The CPI20-32 varies from 10.9 at Station 1 to 3.9 at Station 3.Va1ues between 4 and 10 usually i ndi cate vascul ar 1and plant alkanes(Clark and Blumer, 1967). Station 1 shows a pronounced dominance of theodd-carbon, plant wax compounds, reflecting a forested drainage basin.The decrease in this ratio downriver corresponds to the increase in concentrations of heavy, even-carbon compounds and a decrease in the terrestri alp1ant wax components. Rati 0 values of about 1 are typi ca1 ofpetroleum and bacteria. Wakeham (1976) reports a value of 1.08 for theWest Point effluent. The lower value at Station 3 may be the result ofmaterial introduced by the Renton effluent, although the ratio 3.9 stillfalls at the lower end of the range for land plant sources. Numbers inthis study can be compared with the CPI 20-34 values for the Skagit andSnohomish River delta sediments, which are 5.3 and 3.9, respectively(Barrick et al., 1980).
The ratio (CIS + C17)/2 C16 compares the predominant aquatic plantconsti tuents to hexadecane, a compound abundant in crude oil and itsrefined products, but not generated in significant amounts biologically.This parameter drops stepwise from 25.5 at Station 1 to 11.9 at Station3 as the concentration of C16 increases. Despi te the decrease in thi sratio, the lowest value is much higher than the Puget Sound mean of 1.7(Barrick et al., 1980) and the average Port Angeles value, 1.35 forsediments thought to be contaminated by fuel oil seepage (Macleod, etal., 1976).
The phytane/C17 ratio is another compositional indicator of hydrocarbon sources in the env ironment. Phytane is abundant in and entsediments where it is produced by diagenetic altering of chlorophyll(the splitting of the phytol chain). It is absent from most aquaticorganisms and found in only trace amounts in uncontaminated sediments.
42

Phytane is a constituent of crude oils, their refined products, and some
bacteri a. The domi nant source of C17 is aquatic organi sms. Thus,
increases in the ratio of these two compounds (phytane/C17) in a given
environment may reveal injections of hydrocarbons derived from a petrogenic source. Concentrations of phytane increase from Station 1 to
Station 3 (0.18 to 2.51 ~g/g). The phytanel C17 ratio remains the sameat Stations 1 and 2 (0.01), but is significantly higher at Station 3(0.08). These rat.ios are well below the Puget Sound mean of 0.39
(Barrick et al., 1980) and the Lake Washington surface sediment value of
0.20 (Wakeham, 1976).
Pri stane is present in petroleum, but in uncontami nated mari neenvironments, it is thought to be produced by organisms from the phytol
chain of chlorophyll. Pristane/C17 ratios show an increase only betweenStation 2 (0.02) and Station 3 (0.10), with the highest value a factor of20 below the average Puget Sound ratio (Barrick et al., 1980).
Pristane/phytane ratios fall between 1.25 (Station 2) and 1.94(Station 3). These values are comparable to ranges reported by Gearing
et al., (1976) for the Gulf of Mexico (0.77-2.81) and by Keizer et al. J
(1978) for the Scotian Shelf (1.03-:1,0.21), but lower than the Puget
Sound mean of 6.8 (Barrick et al., 1980).
KovatsIndex Concentration (~g/g)
(SP-2100) Station 2 Station 3
ProbableProbable Degree ofCarbon # Unsaturation
4.1.5 Unknown Aliphatic HydrocarbonsIt is evi dent from the chromatograms of the ali phati c fractions
(Figure 7) that there are a number of dominant unidentified peaks (XA,XB, 23A, 25A, 27A). GC and GC-MS analyses revealed the following in
formation.Mass of
Compound MajorLabe1 Ion
XA 238 17 1 1671 4.92 7.00
XB 278 20 2 1836 6.24 3.50
23A 322 23 1 2294 17.20 11. 30
25A 350 25 1 2491 6.21 4.05
27A 378 27 1 2693 15.00 12.00
43

The three compounds 23A, 25A, and 27A are thought to comprise ahomo 1ogous seri es of mono-o1efi ns. A plot of KI versus carbon numberfor these unknowns is linear and parallel to a similar plot for the corresponding n-alkanes. Upon hydrogenation (procedure follows Barrick etal., 1980), these unknowns shifted to their corresponding saturate homologs. Wakeham (1976) reported a C27 olefin in Lake Washington sedimentswhich is also found in plankton indigenous to the lake. Giger et al.,(1980) have noted the presence of mono-olefins from C21 through C27 insediments of the Greifensee, Switzerland. The odd-carbon alkenes predominated, and their concentrations were similar to those of the saturated homologs.
Alkenes are known to be biologically abundant (Blumer et al.,1970b). Moreover 23A, 25A, and 27A are not present in the October andDecember suspended sediment samples, suggesting a biological origin.They may be the result of a July bloom near the outfall, a known sourceof nutrients.
Barrick et al., (1980) have tentatively identified a compoundpresent in Puget Sound sediment samples as phytadiene (MW 278) at KISP-2100 1879. The unknown, XB (MW 278) also has 2 degrees of unsaturation, but a KI SP-2100 of 1836. Hydrogenation of the samples showed ashift in the retention time of XB to that of phytane. In addition, XAshifted to heptadecane.
4.1. 6 Summary
TSM and TPC were negatively correlated as one proceeded downriver,i ndi cati ng a di 1uti on of the hi gh TPC materi a1 measured at Station 1.Highest concentrations of total extractables (28.6 mg/g) and aliphatics(1.09 mg/g) were measured at Station 3. The UCH concentration was threetimes higher at Station 3 than at Station 1, although the unresolvedmi xture compri sed an average of 34% ± 5% of the saturate fractionsmeasured at all stations. Heptadecane and pentadecane, the algal andplanktonic indicators, dominated the low-molecular-weight fraction ateach station. Concentrations of vol ati 1e compounds increased betweenStations 1 and 2 although the internal ratios (CPI14- 20 , (CIS + C17 )1
2C16) remained similar. From Stations 2 to 3 the concentrations of thevolatile odd-carbon compounds decreased as concentrations of the even-
44

carbon compounds increased. This was reflected in the decrease in the
CPI14- 20 between these two stations. The plant wax constituents dom
inated the heavy hydrocarbons at each station. Concentrations of these
odd-carbon compounds at Stations 2 and 3 were less than half the values
measured at Station 1. The CPI 20- 32 steadily decreased downriver i n
dicating that proportionally greater concentrations of the heavy, even
carbon._ paraffins were being added. Generally the odd-to-even bias,
distinctive at Station 1, was gradually attenuated with distance down
river, especially between Stations 2 and 3. Pristane and phytane both
increased wi th respect to C17 over the same di stance. Surface runoff
and sewage effluent containing fuel oil (CPI values of approximately
unity) are likely sources of these compositional changes. Microbial
activity indigenous to the river and/or the secondary treatment process
could also be a contributing factor.
4.2 OCTOBER 1978
Results obtained for the stations occupied in October and the Metro
effluent filter sample are presented in Table 10. Suspended matter
concentrations (determined from the centrifuge sample) increased pro
gressively from 1.4 mg/l at Station 1 to 2.6 mg/l at Station 3R. The
outfall injected an average concentration of 8.3 mg/l during the occupa
tion of Stations 3 and 3R. Triplicate particulate carbon measurements
at Station 1 ranged from 9% to an anomalous 83%. Excluding the extreme
result, the average of the remaining two values was 12%. Carbon concen
trations were highest at Stations 3 and 3R; (fPC = 19.4%).
4.2.1 Total Extractables and Aliphatics
Total solvent extractables varied from 7.1 mg/g at Station 2B to
53.1 mg/g at Station 3R. Values at Stations 3 and 3R are greater than
those measured by Schul tz and Qui nn (1977) at thei r most contami nated
station in Narragansett Bay (34.8 mg/g). The October Metro effluent
concentration of extractables was 337 mg/g (2.8 mg/l). This value is
consonent with the average total suspended hydrocarbon value determined
by Van Vleet and Quinn (1977) in Fields Point effluent, 2.7 mg/l.
Total al iphatic hydrocarbon abundance varied from 0.10 mg/g at
Station 1 to 2.5 mg/g at Station 3R; the outfall injected a concentra-
45

Table 10. Concentrations and compositional parameters of hydrocarbonsassociated with suspended matter retrieved from the Green River (bycentrifugation) and the Renton Metro effluent (by filtration) in October 1978.
Station 1 Station 28 Effluent Station 3 Station 3R
* **TSM (mg/l) 1.4 2.2 8.3 2.4 2.6
TPC (wt.%) 12.0 9. 3±1. 2 N.D. 17.5 21. 3
Total Extractables 8.2±0.5 7.1±1. 0 337±6 41. 6±0. 4 53.1±0.8(mg/g)
Total Saturates 0.10 0.30 8.69 1.49 2.47(mg/g)
UCM (~g/g) 51.8 116 3480 620 702
32I n-al kanes 79.3 59.0 973 67.8 86.4
13 (~g/g)
20 32I n-alk/ I n-alk 0.35 0.82 0.26 1.47 1.86
13 21
CPI14- 20 11.1 2.6 2.3 3.3 2.8
CPI 2O- 32 7.5 8.0 1.1 2.9 2.3
(CIS + C17)/2 C16 12.0 2.2 3.0 3.3 2.8
Phy/C17 0.02 0.06 0.33 0.22 0.18
Pr/C17 0.04 0.17 0.42 0.28 0.28
Pr/Phy 2.2 2.9 1.3 1.3 1.6
Calculated from centrifuge sediment weight and volume of watercentrifuged.
** Average for sampling period (Municipality of Metropolitan Seattle,1978b) .
46

tion of 8.7 mg/g. These values are all higher than those reported for
sedi ments in Narragansett Bay (Wade and Qui nn, 1979) and Puget Sound(Barrick et al., 1980). Concentrations of al iphatic hydrocarbons at
Stat ions 3 and 3R are greater than those measured in lake Washi ngton
sediments (Wakeham, 1976) and in the surficial sediments of the New York
Bight (Farrington and Tripp, 1977).
4.2.2 Unresolved Hydrocarbons
The unresolved complex mixture reaches a maximum near C27 (Figs. 9
and 10). Values vary from 51.8 ~g/g (430 ~g/g C) at Station 1 to 3480
~g/g near the outfall, with intermediate values, averaging 660 ~g/g
(3420 ~g/g C), below the outfall. The UCM comprises approximately 50%of the total saturate fraction at Station 1, 40% of the effluent, and anaverage of 35% below the outfall. In Puget Sound sediments (post 1875),
the UCM accounted for an average of about 70% of the total ali phati chydrocarbon (Barrick et al., 1976).
4.2.3 The Normal Paraffins
The sum of the n-alkanes is lowest at Station 2, 59 ~g/g (634 ~g/g
C) and highest in the effluent, 973 ~g/g. Concentrations at Stations
1, 3, and 3R are intermediate: 79 ~g/g (658 ~g/g C), 69 ~g/g (394 ~g/g
C), and 86 ~g/g (404 ~g/g C), respectively. These values are allgreater than the average for Puget Sound surface sediments, 260 ~g/g OC
(Barrick et al., 1980), lake Washington sediments, 9.27 ~g/g (Wakeham,
1976), and the range reported for intertidal sediments in Port AngelesHarbor, 1.3 to 10.9 ~g/g (Macleod et al., 1976).
Figure 11 presents the distributions of individual n-alkanes at
each station. Concentrations are listed in Table C-2. As in July,Station 1 reflects aquatic and terrestrial plant hydrocarbon sources.Pentadecane and heptadecane dominate the volatile fraction with concen
trations of 2.7 ~g/g and 14.5 ~g/g, respectively. The heavy, odd-carboncompound abundances, C23 to C31 form a smooth normal distribution,
reaching a maximum concentration of 16.7 ~g/g at C27 . Concentrations ofthe heavy,. even-carbon compounds, C24-C32 , are relatively constant,
varying between 0.8 and 1.9 ~g/g.
Station 2 shows a dramatic increase in C13 , C14 , and C16. The concentration of pentadecane has increased to 6.0 ~g/g, while that of hep-
47

5TATION IiAlTEHUAflON 2')
~-_·------r----·
70 110
'0
"I
U .IF .lit1
,
.. t,·"n '"hr··l ..
." 0" '. I. II I Uti I.. .1 ••;........ - .....".... ... f'h/\., .._-_.. -- ._-----,
270 IHDLDING)
STATtON 28tAT f[HlJATIar. 2'1
'.I
'I'I
.. I
"I!
·w':" 1" .. /-! I
'I .. ',' ~~t'... ~J,i'A. '}Jl1J '~' so~'.~, . ---,..- .. -, ..-----.-~--_.- '---1 ~- .. _ .._.~--...,
70 110 '')1' '90 ~30 270 'HOlDING'
5TATION 3IATTfHuATIOH 2"
...
--,-----,- --------',_ .. _-_. - ,._,. - -- , -_.110 I~O 190 230 270 IIQ,.OING)
TEMPERATURE (OC)
Figure 9. Gas chromatograms of the aliphatic hydrocarbon fractionsextracted from Green River suspended matter. Samples wereretrieved by centrifugation in October 1978. Chromatographicconditions are given in section 3.5.4
48

METRO EFFLUENT SUSPENDED SOLIDS(OCTOBER '78)
CARBON NUMBER
OCTOBER '78(ATTENUATION 2')
27 29 31
Z9Z8
Z7 30
HIolB
l!l11 Z3
Z4
Z631
32
r70
I110
ZO
I i
150 190TEMPERATURE (DC)
I
230I
270
Fi gure 10. Top: Concentrations of the normal paraffi ns associ atedwith suspended solids in Renton Metro sewage effluent. Thissample was retrieved by filtration of an effluent compositetaken October 19-20, 1978 (0730-0730 hrs). Bottom: Gas Chromatogram of the aliphatic hydrocarbon fraction extracted fromthe sample identified above. Chromatographic conditions aregiven in section 3.5.4.
49

SUSPENDED MATTER EXTRACTS(OCTOBER 178)
20 STATION I
10
~ o 13 15 17 19 210'1~
Z 10 STATION 280I- 5<I0:::I- 17 19 21ZWUZ 20 STATION 30UWZ<I 10~-.J<I-.J
o 13<I 15 17~0:::0Z 20 STATION 3R
10
CARBON NUMBER
Figure 11. Concentrations of the normal paraffins associated withGreen River suspended matter. Samples were recovered by centrifugation in October 1978.
50

tadecane has decreased to 8.9 I-Ig/g. The heavy, odd-carbon compounds
attain a maximum at C27 with a concentration of 8.0 I-Ig/g, half the valuemeasured at Station 1.
Duplicate samples taken at Station 3 display the similar high
concentrations of C13 , C14 , and C16 exhibited at Station 2. There
is a reversal in dominance between CIS (CIS =16.7 I-Ig/g) and C17 (C17 =11.4 I-Ig/g). The concentration minimum at C19-C22 has increased rela
tively as have the concentrations of heavy, even-carbon compounds, C24-
C32 · The odd-carbon suite shows highest concentrations at C27 (C27 =5.5
I-Ig/g) and C29 (C29 = 5.8 I-Ig/g).
Figure 10 (top) presents a bar diagram of n-alkanes distributionassociated with suspended solids in the October Metro Composite Sample(Oct. 19-20, 1978). Pentadecane and heptadecane dominate the low-molec
ul ar-wei ght compounds. Concentrations increase stepwi se from C18 (14I-Ig/g) to a maximum at C29 (105 I-Ig/g) with nearly equal amounts of oddand even-carbon compounds present.
4.2.4 Compositional Characteristics
Compositional parameters for the October data are summarized in20 32
Table 10. The L n-alkl L n-alk ratio is increasing from 0.35 at Sta-B 21
tion 1 to 1.9 at Station 3R. The Renton outfall is contributing materialwith the lowest value (0.26). The ratios determined in the effluent andat Station 1 fall within the 0 to 0.5 range characteristic of vascularland plants (Gearing et al., 1976). The downstream increase in this
ratio reflects both an increase in the volatile compound concentrationsand a decrease in the major heavy hydrocarbons.
The carbon preference indices, CPI14- 20 , decrease dramaticallybetween Station 1 (11.1) and Station 2 (2.6) responding to the largeincreases in C14 and C16. Thi s preci pitous change may refl ect thecontributions of surface runoff contaminated with fossil fuel hydrocarbons (CPI14- 20 ~1.0). The outfall is injecting volatile compounds
(CPI14- 20 = 2.3) in a proportion similar to that observed at Station 2B.
Values remain low below the outfall (CPI14- 20 ~ 3.0).The carbon preference indices of the heavy compounds, CPI 20- 32 , at
Stations 1 and 2B are similar (7.5 and 8.0) and fall within the range
51

117238
Mass of ProbableMajor Probable Degree of
Ion Carbon # UnsaturationHydrocarbon
vascular land plants (Clark and Blumer, 1967). The outfall injects an
n-alkane mixture with a CPI 20- 32 near unity, comparable to the primary
discharge from the West Point treatment facility (Wakeham, 1976). The
ratios at Stations 3 and 3R are intermediate (CPI 20- 32 =2.6), presumably reflecting a dilution of the effluent hydrocarbons with ambienthydrocarbons.
The ratio (CIS + C17 )/2 C16 decreases between Station 1 (12.0) andStation 2B (2.2) reflecting the increase in C16. The effluent and Stations 3 and 3R show values from 2.8 to 3.3. The trend of this ratio issimilar to that of the CPI14- 20 , emphasizing that the changes in thecomposition of the low-molecular-weight compounds are not caused by effects of the Metro effluent (i.e., the ratio changes between Station 1and 26, upstream of the treatment plant).
The phytane/C17 ratio increases from 0.02 at Station 1 to 0.22below the outfall. The outfall is injecting material with the highestratio, 0.33. Pristane/C
17follows a similar trend, lowest at Station 1
(0.04), highest at the outfall (0.42), and intermediate below the outfall (0.28). Although concentrations of C17 vary considerably, concentrations of pristane increase monotonically downstream. The variabilityin C17 and the trends in pristane and phytane indicate that the sourceof these latter two compounds is different from that of C17 , usuallyproduced by aquatic organisms. Pristane/phytane ratios do not varygreatly. Values above the outfall average 2.5 while the mean below theoutfall is 1.4-. Again, the consistency in this ratio suggests similarsources of pristane and phytane, the major one being the outfall.
4.2.5 Unknown Aliphatic HydrocarbonsFigures 9 and 10 show chromatograms of the al iphatic samples ex
tracted from suspended matter collected at Stations 1, 2, 3, and fromthe effluent. A number of unidentified peaks are evident. Of the fivedescribed in the July results, only XA was apparent in a significantamount. Thi s compound was present in the Renton Metro effl uent, andgreater concentrations were measured below the outfall than above it:
Concentrationsat Stations
KI (~g/g)
SP-2100 1 2_ Outfall 3_~
1673 1.93 1.02 9.6 5.66 3.94
52

4.2.6 Summary
The highest concentrations of total extractables and aliphatic
hydrocarbons were measured in the effl uent. Riveri ne suspended matter
at Stations 3 and 3R below the outfall exhibited the next largest con
centrations of the extractables and aliphatics. The UCM comprised a
greater proportion of the total saturates at Station 1 (50%) than below
the outfall (35%) despite the elevated concentration measured in theeffluent.
Pentadecane and heptadecane dominated the volatile fraction of all
samples although the concentrations of C13 , C14 , and C16 at Stations 2B,
3, and 3R were considerably greater relative to their aquatic algal
counterparts. Thisis refl ected 1n the dramat f c decrease in CPI14- 20and (C15 + C17 )/2 C16 values between Stations 1 and 2B (before theoutfall was reached). The abrupt changes in these parameters and theconcurrent increase in pristane and phytane may be a result of microbial
activity in the river or diffuse sources of petroleum products, such asthose contained in surface runoff. A cruise up the Green River in
February 1980 located 49 pipes between Stations 1 and 2B of which 29 areknown to transport hi ghway runoff. Fuel oil s contai n hi gh concentrations of C14 through C17 with concentrations of individual hydrocarbonsdecreasing as molecular weight increases. Wakeham (1976) reported thefollowing average storm water and bridge runoff values (water and par
ticulates combined): CPI14- 20 ~ 1.22, CPI 20- 36 ~ 1.28, Pr/C17 ~ 0.87.
The heavy hydrocarbons at Stations 1 and 2B reflect regimes dominated by vascular land plants. An abrupt decrease in CPI 20- 32 valuesbetween Stations 2B and 3 implicates the outfall as a source of heavy,
even-carbon compounds.
4.3 DECEMBER 1978
The results of the December ri ver samples and the effl uent sus
pended solid samples obtained concurrently are presented in Tables 11and 12. Station 3 hydrocarbon va1ues represent averages of tri p1i cate
analyses. Suspended matter concentrations in the river increased step
wise from 3.2 mg/l at Station 1 to 6.9 mg/l at Station 3. The outfallcontributed an average of 14.2 mg/l of suspended solids over the 4-daysampling period. TCP was highest (15.4%) at Station 1. Low values were
53

Table 11. Concentrations and compositional parameters of hydrocarbonsassociated with suspended matter retrieved from the Green River bycentrifugation in December 1978.
lieTSM (mg/l)
TPC (wt.%)
Total Extractables (mg/g)
Total Saturates (mg/g)
UCM (~g/g)
32I n-alkanes (~g/g)
12
20 32I n-alkl I n-alk
13 21
CPI14- 20
CPI20- 32
(CIS + C17 )/2 C16Phytane/C17Pristane/C17Pristane/Phytane
Station 1
3.2
15.4
5.9 ± 0.1
0.63
237
71. 3
0.08
2.5
14.3
2.3
0.46
0.50
1.1
Station 28
5.1
3.1 ± 0.5
5.4 ± 0.1
0.41
122
43.3
0.27
1.6
10.2
1.2
0.40
0.60
1.5
Station 3
6.9
3.6 ± 2.0
17.4 ± 0.5
0.74 ± .16
323 ± 52
52.4
0.56
1.0
5.0
1.1
0.38
0.68
1.8
Calculated from centrifuge sediment weight and volume of watercentrifuged.
54

Table 12. Concentrations and compositional parameters of hydrocarbonassoci ated wi th suspended soli ds retri eved from Renton Metro effl uentvia filtration in December 1978.
Sample 1 Sample 2 Sample 3 Mean
TSM (mg/l) 17.3* 12.7* 12.8* 14.2 ± 2.6
Total Extractables (mg/g) 376 439 375 397 ± 37
Total Saturates (mg/g) 10.8 13.2 8.2 10.7 ± 2.5
UCM (l-Ig/g) 3430 4690 3420 3850 ± 730
32I n-al kanes (l-Ig/g) 507 690 224 474 ± 234
13
20 32I n-alkl I n-alk 0.30 0.21 0.59 0.37 ± 0.20
13 21
CPI14- 20 1.1 1.1 1.0 1.1 ± 0.1
CPI 2O- 32 1.1 2.0 1.2 1.4 ± 0.5
(C15 + C17 )/2 C16 1.5 1.3 1.3 1.4 ± 0.1
Phytane/C17 1.0 1.6 1.6 1.4 ± 0.4
Pristane/Cn 1.1 1.9 1.8 1.6 ± 0.4
Pristane/Phytane 1.2 1.2 1.2 1.2 ± 0.00
Average for each sampling period (Municipality of Metropolitan Seattle,1978b) .
55

measured at Stations 2B and 3 (3.1% and 3.6%, respectively).that most of the suspended matter increase is caused by thematerial low in carbon.
It appearsaddition of
4.3.1 Total Extractables and Aliphatics
Total extractables were low (5-6 ~g/g) at Stations 1 and 2B, whereas total lipids at Station 3 were much higher, averaging 17.4 mg/g. Thehigh value at Station 3 may reflect the average outfall contribution of397 mg/g. Total saturated hydrocarbon concentrations varied from 0.63mg/g far above the outfall to 0.74 mg/g below the outfall with a minimumof 0.41 mg/g at Station 2B. The average contribution of total saturatesby the Renton Secondary Treatment plant was 10.7 mg/g.
4.3.2 Unresolved HydrocarbonsThe unreso1ved comp1ex mi xture extends from C14 to beyond C32 '
reaching a maximum at approximately C27 (Figures 12 and 13). Theconcentration of the UCM was highest at the outfall, averaging 3850 ~g/g
and lowest at Station 2B (122 ~g/g; 3990 ~g/g C). The highest rivervalue was at Station 3 below the outfall (323 ~g/g; 8950 ~g/g C), andStation 1 exhibited an intermediate value of 237 ~g/g (1540 ~g/g C).These values bracket those found in recent Puget Sound surface sediments' (3700 ~g/g OC; Barrick et al., 1980). The UCM comprised 38% ofthe total gravimetric al iphatics at Station 1, 30% at Station 2B, and44% at Station 3.
4.3.3 The Normal ParaffinsThe sum of the n-alkanes varies from 71.3 ~g/g at Station 1 to 43.3
~g/g at Station 2B. Normal paraffins averaged 474 ~g/g in the Metroeffluent decreasing to a value at Station 3 (52.4 ~g/g) similar to thosemeasured upstream. Bar graphs illustrating the distribution of the individual alkanes in the river samples and Metro composite samples arepresented in Figures 14 and 15. The most notable feature is the paucity of low-molecular-weight compounds usually associated with aquaticplants (C15 and C17) at all three stations. Station 1 shows a slightodd-carbon dominance among the low level of volatile hydrocarbons, and aprogress i ve increase in the heavy, odd-carbon compounds C23-C31 ' con-
56

STATION IIAI TENU'lION 2')
.. ljj~ ---~ ---+. I
70 110 150
STATION 26(ATTENUATION 2'\
STATiON 3tATTENU.uIO~ 2"
'....
TEMPERATURE (DC)
Figure 12. Gas chromatograms of the aliphatic hydrocarbon fractions extracted from Green River suspended matter. Sampleswere retrieved by centrifugation in December 1978. Chromatographic conditions are given in section 3.5.4.
57

SAMPLE I(ATTENUATIOfll 2 fo }
-" ..
...---- -,--- ----r--- -_._..,---- ..-, - ------,---------,70 110 150 190 230 270 IHOlOING)
SAMPLE 2(ATTENUATION 2'1
'I ,.
~J- ,,' ~. ·""""'W] 1i .
" .. ~~_'J 'J...~~--
--. -1- ..-------,
270 IHOLDINGI
SAMPLE 3(ATTENUATION ~'I
70---'10 230---270 IHOLD'NGI
TEMPERATURE (oe)
Figure 13. Gas chromatograms of aliphatic hydrocarbon fractionsextracted from suspended sol ids retrieved by filtration fromconsecutive Renton effluent composites: Sample 1-- December18-20, 1978 (1800-0600 hours). Sample 2--December 20-21, 1978,(l000-0800 hours). Sample 3--December 21-22. 1978 (1300-1100hours). Chromatographic conditions are described in section3.5.4.
58

SUSPENDED MATTER EXTRACTS(DECEMBER 178 )
20 STATION I
27 29 31
STATION 3
o 13 15 17 19
o 13 15 17 19 21 23 25 27 29 31
10
10
101 ~AT'ON 28
O~ JJJlJJ1l13 15 17 19 21 23 25 27 29 31
zo\«0::::\ZWUZouwz«~~
«-J«20::::oZ
CARBON NUMBER
Figure 14. Concentrations of the normal paraffins associated withsuspended matter in the Green River. Samples were obtained bycentrifugation in December 1978.
59

METRO EFFLUENT SUSPENDED SOLIDS(DECEMBER 178)
--50 SAMPLE I
~CJ'I::::J 0 13 15. 17 19
50Lurr::E 3r11~
o 13 15 17 19 2\ 23 25 27 29 31
zoI«0::IZWUZoUWz«Y:-I<!-I«20::oZ
150
100
50
SAMPLE 2
25 27 29 31
CARBON NUMBER
Figure 15. Concentrations of the normal paraffins associated withsuspended solids retrieved from Renton Metro sewage effluent.Samples were retrieved by filtration of effluent compositesobtained on the consecutive dates given in Figure 13.
60

tributed by plant waxes. The highest concentration was reached at C31(18.6 I-Ig/g). Station 2B exhibits a slight increase in the C15-C18volatiles (Cn = 2.3 I-Ig/g) , and a decrease in the plant wax constitu
ents. Heptacosane shows the highest concentration, 8.3 I-Ig/g. Below the
outfall (Station 3), the concentration of the low-molecular-weight
hydrocarbons is slightly greater (e.g., C17 =3.3 I-Ig/g). The concentra
tions of the heavy, odd-carbon compounds C25 , C27 , C29 , and C31 are allsimilar, averaging 6.5 I-Ig/g. The heavy, even-carbon compounds increasedrelative to Station 2B values.
The variation in the aliphatic profiles of the three sewage effluent
samples is extreme (Table C-5). In Sample 1, the alkanes fall into twonatural divisions: C13 to C23 compounds shows similar concentrationsaveraging 14 I-Ig/g and the C25 to C32 hydrocarbons exhibit consistent
concentrations, averaging 44 I-Ig/g. There is no dominant compound in theprofile and the odd-to-even compound~ are equally balanced. The volatile fraction of Sample 2 shows little variation with compound concen
trations averaging 15 I-Ig/g (C13 to C23). Concentrations of the heaviercompounds increased dramatically with a striking odd dominance of C27 ,C29 , and C31. The highest concentration was exhibited by C27 (112
I-Ig/g). Sample 3 displayed similar low levels of all compounds C13 toC32 averaging 11 I-Ig/g.
4.3.4 Compositional Characteristics
Compositional parameters for river and Metro samples are summarized20 32
in Tables 11 and 12. The ratio I n-alk/ I n-alk varies from 0.08 at13 21
Station 1 to 0.56 at Station 3. Station 2B and average effluent valuesare intermediate, 0.27 and 0.37, respectively. All values fall within
the range reported for hydrocarbon of vascular plants, 0 to 0.5 (Gearinget al., 1976).
The CPI 14- 20 values decrease from 2.5 at Station 1 to 1.0 below theoutfall. Effluent values fluctuate slightly around unity and appear to
be reflected in the low value observed at Station 3. The decrease in
the CPI 14- 20 from Station 1 to the intermediate value at Station 2B mayreflect an input of petroleum products from surface runoff.
61

The CPI 20- 32 values decrease from 14.3 at Station 1 to 5.0 atStation 3. The decrease in this ratio as one proceeds downriver par
allels the relative decrease in the odd-carbon t plant wax constituents.
The index change between Stations 2B and 3 also refl ects a re 1ati ve
increase in heavy t even-carbon compounds. The outfa11 is injecting
suspended hydrocarbons with an average CPI 20- 32 of 1.5 ± 0.5.
The (C15-C17)/2C16 ratio shows little variability.· Values varybetween 2.3 at Station 1 and 1.1 at Station 3t reflecting the lack ofvolatile hydrocarbon (C15 and C17) produced biologically. These ratios
are similar to the Puget Sound meant 1.7 (Barrick et al. t 1980) and the
average for Port Angeles Harbor sediments t 1.35 (Macleod et al. t 1976).
The phytane/C17 ratios decrease slightly as one proceeds downstreamwith values averaging 0.41. Pristane/C17 ratios increase slightly from
Station 1 to 3 (Pr.7C17 = 0.59)t while the outfall injects material ofa higher ratio (Pr/C17 = 1.6 ± 0.4). Pristane/phytane ratios range
from 1.1 at Station 1 to 1.8 at Station 3. The outfall average of 1.2is intermediate.
4.3.5 Unknown Aliphatic Hydrocarbons
The unknown compounds identified as XA and XB in July and Octoberaliphatic fractions were also found in December samples. Data obtainedby GC and GC-MS analyses are given below.
Mass of Probable ConcentrationsCompound Major Probable Degree of KI at Stations (I-Ig/g)
label Ion Carbon # Unsaturation SP-2100 1 2B 3
XA 238 17 1 1671 0.28 0.14 0.29XB 278 20 2 1836 2.49 1.13 N.D.
Concentrations of XA in December were an order of magnitude lower than
concentrations measured in July and October. This seasonal decrease mayimply a biological source of this compound. Concentrations of XB at
Stations 1 and 2B were lower in December than in July. Unknown XB was
not detected (N.D.) at Station 3 in December.
62

4.3.6 Summary
TSM increased with distance downriver as TPC decreased, confirming
the negative correlation found in July. The highest riverine concentrations of extractable lipids and total saturates were measured at Station
3. The outfall effluent contributed concentrations 15 to 20 times
higher than these values. The UCM was also highest in the effluent andan order of magnitude lower at Station 3. Station 2B exhibited minima
in all of the extensive parameters (except TSM) listed in Table 11. The
December river samples were characterized by low concentrations of C15and C17 , reflecting the lack of biological activity in the winter.Plant wax constituents continued to dominate the heavy-molecular-weightfraction at all stations although concentrations were greatly reducedwith distance downriver. Both carbon preference indices decreased fromStat ions 1 to 3 refl ecti ng the re 1at i ve increase in even-carbon compounds. Waste water contributions to heavy, odd-carbon compounds were
superimposed upon the much higher concentrations of these compounds delivered by terrestri alp1ant matter (measured at Stations 1 and 2B).The changes between Stations 1 and 2B may be attributed to surface runoff resulting from December rainfall. In the lower Green River, the hydrocarbon signature is significantly influenced by the sewage outfall.
5.0 HYDROCARBON MASS BALANCE
Compositional differences notwithstanding, it is evident that the
concentrations of the n-alkanes vary greatly with distance down theri ver. Concentrations of the vol atil e and heavy, even-carbon compoundshave increased from Stations 1 to 3 while the heavy, odd-carbon paraffins have simultaneously decreased. To identify and quantify diffuse
sources along the river, a mass balance of hydrocarbons was constructed.River fluxes were calculated at each station from a knowledge of hydro
carbon concentrations, the magni tude of the suspended load, and ri verdischarge. Imbalance between stations implies sources or sinks.
5.1 LOWER GREEN RIVERQuantitative data are available for one source, the Renton outfall,
in addition to the end members , Stations 2B and 3. For each hydrocar-
63

bon, the transport measured at Station 3 should equal the sum of three
terms.: the transport measured at Station 2B, the input resu1 t i ng from
the outfall, and the amount contributed by diffuse sources between these
stations. Biological oxidation of the hydrocarbons is ignored because
of the relatively short distances involved. It is also assumed provis
ionally that preferential flocculation has not occurred, that is, hydrocarbons have not been removed by sett1i ng to the bottom. Later in
the discussion these assumptions will be examined more closely.
The transport of each component at Station 3 is gi ven by the expression below.
T3 = T2B + TO + TO (5-1)The sUbscripts indicate Stations 3, 2B, Renton outfall, and other dif
fuse sources or sinks between Stations 2B and 3. Rearranging equation(1), we obtain the magnitude of the diffuse source.
TO =T3 - T2B - TO (5-1a)The hydrocarbons are presumed to be associ ated with suspended sol ids
(i.e., expressed as mass hydrocarbon/mass suspended solids), and thusboth the suspended particulate concentrations (mass suspended sediment/volume of water) and the discharge (volume of water/time) are incorpo
rated in the conservation of mass equation.
TO =C3P303 - C2BP2B02B - CoPOOo (5-2)
where: C3C2BCO = hydrocarbon concentrations (ug/g)
P3P2B PO =suspended particulate concentrations (g/m3)
0302BOO =discharge (m3/sec)
and subscripts 3, 2B, 0 refer to Stations 3, 2B, and theeffluent outfall, respectively.
In July the centrifuge sample at Station 2 was believed to be contami nated with sewage eff1 uent from the outfall located only 0.5 km
downstream. Flood tide caused one observed ri ver reversal and anothersimilar episode likely occurred (Figure 16). Moreover, Metro effluent
was not analyzed for suspended hydrocarbons in July. For these reasonsthe hydrocarbon budget will be calculated only for October and Decemberdata.
64
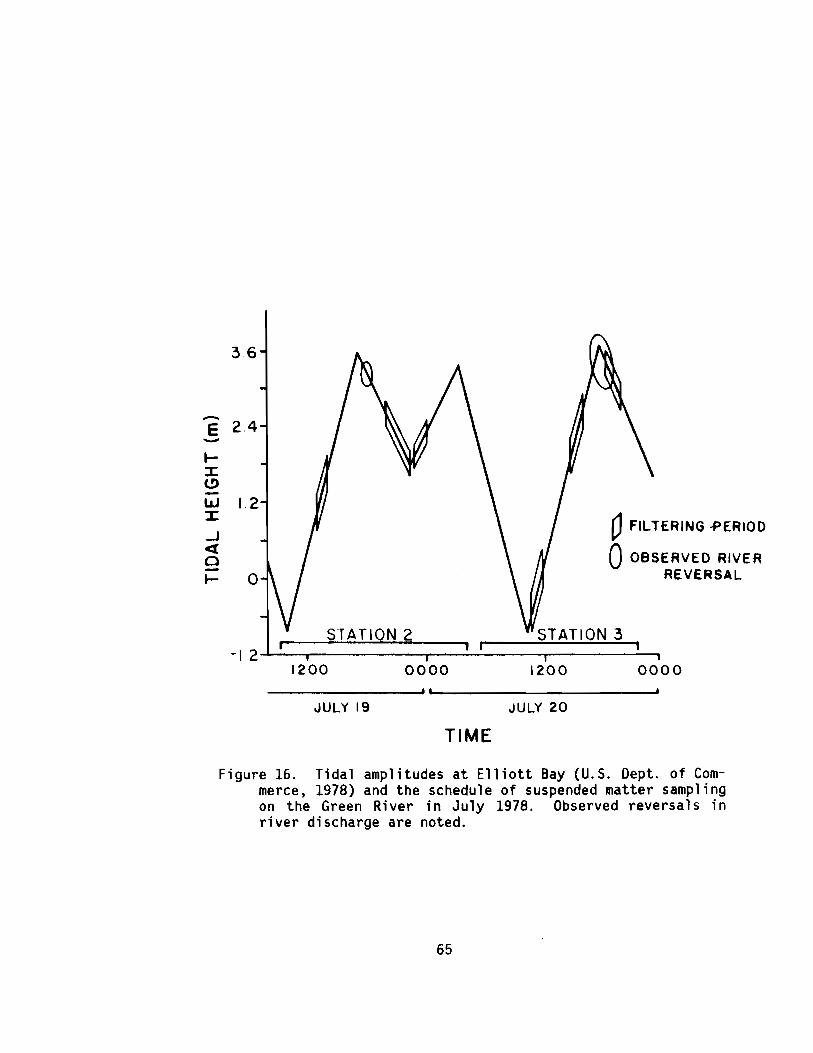
STATION 3STATION 2
36
-E 24-t-:t:(!)-w 12:t: oFILTERING .pERIOD-Jc:{ oOBSERVED RIVER0-..... 0 REVERSAL
-12..L--.......------....---~----,.....----~-
1200 0000 1200 0000- ---', Ll -1
JULY 19 JULY 20
TIME
Figure 16. Tidal amplitudes at Elliott Bay (U.S. Dept. of Commerce. 1978) and the schedule of suspended matter samplingon the Green River in July 1978. Observed reversals inriver discharge are noted.
65

5.1.1 Water Budget
Discharges are known near Stations 1 and 2B (Table A-I) and at the
outfall (Municipality of Metropolitan Seattle, 1978b), but not at Sta
tion 3. The latter can be approximated. however. by adding the outfall
discharge to the river discharge near Station 2B. Discharge values used
in the budget are reported in Table 13. In October the outfall compri sed 12% of the total ri ver di scharge at Station 3. By December.seasonal rainfall had increased river discharge threefold such that the
outfall contributed only 4% of the river volume at Station 3.
5.1.2 Suspended Particulate Budget
Applying the conservation of mass equation (5-2) to both water andsuspended particulate concentrations. the surplus transport of suspended
matter between Stations 2B and 3 was calculated. Riverine suspendedmatter concentrations determined from centrifuge sample weight and vol
ume of water centrifuged. and the effl uent concentrat ions reported by
Metro were substituted for P2B • P3• and PO. Data are listed in Table13. The outfall contributed 41% of the suspended particulate transportmeasured at Station 3 in October and 9% in December. A suspended matter
deficit of 6.5 g/sec was calculated from October concentrations. That
is. the outfa 11 contri buted 196% toward the net TSM increase betweenStations 2B and 3. In contrast. December data showed a suspended matter
surplus of 56.1 g/sec from sources other than the outfall. During this
peri od. the outfall contri buted 32% of the net TSM increase betweenStations 2B and 3. Possible sources of the surplus include riverbank
erosion. resuspension of bottom sediments. and surface runoff. resultingfrom autumn rains. A survey of river outfalls in February 1980 located
14 pi pes between these two stations. of whi ch at 1east fi ve transport
street runoff.
5.1.3 Normal Alkane Mass BalancesThe budgets of the aliphatic hydrocarbons and the UCM are calcula
ted by substituting known TSM concentrations. water discharges, and the
UCM and hydrocarbon concentrations listed in Tables 10, 11, 12, B-2.B-4. and B-5 into equation (5-2). Hydrocarbon and UCM concentrations inSamples 1 and 2 of the December effluent were averaged for the calcula-
66

Table 13. Results of the hydrocarbon mass balance calculations for thelower Green River, October and Oecember 1978. Transports resulting fromthe outfall and diffuse sources are also compared to the transportsmeasured at Station 3 (see T IT and T IT). Oischarges and suspendedparticulate concentrations ueed 3in theOcaiculations are reported here.The hydrocarbon concentrations are given in Tables B-2, B-4, and B-5.UCM concentrations are reported in Tables 10, 11, and 12.
October
03 = 13.7 m3/sec
00 = 1. 6 m3/sec
O2 =12.1 m3/sec_ 3P3 - 2.5 g/m
Po = 8.8 g/m3
P2B = 2.2 g/m3
Oecember
03 = 40.8 m3/sec
00
= 1. 7 m3/sec
O2 = 39.1 m3/sec
3P3
= 6.9 g/m
Po = 15.3 g/m3_ 3
P2B - 5.1 g/m
TO TO/T3 TO/T3 TO TO/T3 TO/T3Hydrocarbon (Hg/sec) (lJg/sec)
15 -403 1.4 0.7 -67 0.7 0.1
16 -154 1.4 1.0 +139 0.4 0.2
17 -437 1.5 1.1 +102 0.4 0.1
Pr -184 2.3 1.7 -199 0.9 0.3
Phy -135 2.6 1.8 -298 1.3 0.9
25 -552 4.6 4.9 -826 0.7 0.5
26 -725 14.0 13.3 -983 3.7 3.0
27 -1040 5.4 5.5 -1850 1.1 1.0
28 -1080 20.1 19.3 -1060 3.8 3.1
29 -1460 7.4 7.3 -1380 0.9 0.7
30 -1370 28.2 27.6 -696 3.0 2.5
31 -1870 15.2 15.5 -1210 0.9 0.7
32 -1410 41. 3 40.5 -527 3.5 2.9
UCM -29400 2.2 1.3 -39000 1.2 0.4
67

tion of the December budget because these samples together represent theperiod during which suspended sediment was retrieved at Stations 28 and3. The results of the budget calculations are summarized in Table 13.
In October all i ndi vi dua1 paraffi n transports decreased betweenStations 28 and 3 when corrected for the contribution from the outfall.Deficits for individual components ranged from -135 to -1870 ug/sec.There appears to have been a preferential loss of the heavier alkanes.
The ratio of the outfall's contribution to the transports measuredat Stat ion 3 (TOIT3; Tab1e 5-1) ranged from 1. 4 to 4·1. 3. The Rentonoutfall is apparently a greater relative source of the heavy, evencarbon compounds, C26-C32 (Tal T3: 14.0 to 41.3) than the plant wax compounds (TO/T3: 4.6 to 15.2) measured at Station 3.
A comparison of the apparent hydrocarbon deficits (sinks) and thetransports below the outfall are also reported in Table 13 (see TO/T3).The similarity between the two ratios, TO/T3 and TO/T3 in October isstriking. The calculated loss of heavy hydrocarbons between Stations 28and 3 appears to be related to the theoretical effluent contributions ofthese compounds.
The UCM also shows a transport deficit in October. The ratio ofthe UCM deficit to the transport measured at Station 3 (TO/T3) is similar to the ratios calculated for the low-molecular-weight alkanes.
The disparities noted in the hydrocarbon transports have a numberof plausible explanations. The composite effluent samples analyzedrepresent the effl uent before the fi na1 dech1ori nat i on step in thesecondary treatment process. After dechlorination, microbial and otherbiological activities are free to resume as the waste water is transported through a pipe 0.5 km in length to the outfall. Modifications ofthe hydrocarbons within such a short time period seem unlikely. Similarly, the possibility of heavy alkane reduction by biological processeswithin the river environment between the outfall and Station 3 (another0.5 km) seems equally improbable.
Desorption is not likely a dominant process since it is the heavycompounds that are being preferentially lost. The heavy hydrocarbonsare more hydrophobi c than the vol ati 1e compounds, and they thereforeshould bind more tenaciously with the particulate phase. If desorption
68

were occurring, a preferential loss of the low-molecular-weight com
pounds woul d be expected. The UCM transports appear to behave ina
manner similar to the low-molecular-weight compounds. However, the
individual compounds comprising the UCM have not been identified. With
out knowledge of the chemical properties of these constituents, an ade
quate explanation of the UCM results is improbable.
The heavy hydrocarbon deficit between Stations 28 and 3 may also belargely the result of an exaggerated estimation of the suspended hydro
carbon concentrations present in the effluent, an artifact of the filtering procedure. The Gelman® filters, coated with the effluent's
complex suspended solid matrix, may act as scavenging mats, retaining
colloidal or even dissolved hydrocarbons on their surfaces. Despitetheir frequent use in the study of suspended hydrocarbons, glass fiber
filters have proved inadequate for separating dissolved and particulatephases in a number of studies. A significant amount of what has beencalled POC (or a portion of the TPC in this case) is actually dissolvedorganic carbon (DOC) adsorbed on the glass fiber mesh (Menzel, 1966;Loder, 1971).
Feely (1975) reported that 23% of the POC he measured was actually
DOC. Glass fiber filters consist of thick layers of glass fibers withlarge surface areas that may retain particles much smaller than thenominal pore size of the filters (Sheldon, 1973). The filters mayreta in effl uent part i cul ates that are too bouyant to be recovered ef
ficiently by the centrifuge.In order to determine whether the amounts of suspended matter re
covered from METRO effluent by the centrifuge and by filter were signif
icantly different, a grab sample of METRO effluent was obtained inDecember 1980. The sample was stirred continuously while aliquots werepassed through preweighed Nuclepore® membrane filters, Gelman® glass
fiber filters, and the continuous flow centrifuge (operating at 15,000RPM and 400-500 ml/min). Portions of the centrifuge effluent were alsofiltered through preweighed Gelman® and Nuclepore® filters. Gravi
metrically, the centrifuge retained 94% ± 2% of the suspended material
recovered by the glass fiber filters and 87% ± 17% of the material re
covered by membrane filters. In a similar experiment the centrifuge andGelman® filter samples of METRO effluent particulates were extracted for
hydrocarbons. This single comparison showed that the individual con-
69

centrations of the n-a1kanes in the fi 1ter samples were an average of1. 4 times greater than concentrations in the centri fuge samp1e. Thedeficits of most compounds, especially of the heavy hydrocarbons, remainsignificant even if a correction for this bias is applied to the budget.
The loss of hydrocarbons between Stations 28 and 3 is most likelythe result of flocculation and subsequent precipitation of organicmatter as the complex effluent matrix mixes with river water. The lesssoluble, heavy hydrocarbons would be deposited in a solid phase morereadily than the volatile compounds, thus explaining the greater defi ci ts of the heavi er (C25-C32) hydrocarbons reported here. El evatedconcentrations of these alkanes in a sample of bottom sediments near theoutfall'may confirm the occurrence of such a precipitation process.
The imbalances in the budget calculated for the December paraffinsrange from +121 J,Jg/sec to -1860 J,Jg/sec (Table 13). The low-molecular-weight compounds show surpluses or relatively small deficits whilethe heavy alkanes, C26-C32 , show marked depletions.
Suspended hydrocarbons in the effluent contributed relatively lessto the budget in December than in October, primarily because of increased ri ver flow. Re1ati ve to the transports observed at Station 3, theoutfall material was enriched in the even-carbon compounds, C26 throughC32 . Surplus transports and small deficit transports of low-molecularweight compounds, and the lower proportion of these compounds apparentlycontributed by the outfall, suggest that surface runoff from diffusesources was important. The heavy a"/kane fraction was again preferentially lost from the suspended material.
5.2 UPPER GREEN RIVERThe effects of di 1ut i on may reveal addi tiona1 reasons for the
biased hydrocarbon transports that are observed. The dilution model isapp1i ed to the data collected at Stat ions 1 and 28, since maj or poi ntsources of sediment and hydrocarbons between these stations are unknown.The simple hydrocarbon transport equation (5-3) describes the upper portion of the river.
(5-3)
To determine whether dilution is important, the aliphatic hydrocarboncontribution from eroded or resuspended sediments between Stations 1 and
70

(5-4)
28 is assumed negligible. With this assumption, equation (5-3) reducesto equation (5-4).
C :: C1P1D128 .,..;;:;....;;:-~P28D28Using hydrocarbon and UCM concentrations measured at Station 1 (Tables8-2, 8-4, 10, and 11), expected concentrations at Station 28 can becalculated and compared to observed values. Results of this calculationare shown in Table 14. In October the calculated values of the heavyparaffins (C25-C32) and C17 were in reasonable agreement with theirmeasured concentrations. The UCM imbalance was similar to thevalues calculated for the low-molecular-weight compounds excluding C17.These observations suggest that surface runoff was an important contributor to the low-molecular-weight fraction. The near balance of heptadecane implies that this paraffin is of a different origin (algal orplanktonic). Ratios in gross excess of 100% (C28 and C32 values) areevidence of a "sink" not yet accounted for.
In December, the situation was somewhat different. The calculatedvalues for the UCM, C29 , C31 , and C32 were near their calculated concentrations. Apparently the river sediments eroded during periods ofhigher runoff contain appreciable amounts of the remaining hydrocarbons.The dilution hypothesis applies more aptly to the October data than tothe December concentrations.
5.3 SUMMARY
In the lower Green River the transport of suspended particulates inOctober were conserved. In December the outfall contributed only 32% ofthe gain in suspended matter transport between Stations 28 and 3, indicating that resuspension of bottom sediments and erosion of the riverbank contributed significantly to the increased suspended load. Calculations of the hydrocarbon transports showed deficits for all alkanesand the UCM in October and for most of the paraffi ns in December.During both sampling periods the outfall theoretically contributed moretoward the transports of the heavy, even-carbon compounds than towardthe plant wax constituents measured at Station 3.
71

Table 14. A comparison of measured and calculated hydrocarbon concentrationsat Station 2B in October and December (1978), assumi ng that only di 1ut ionwith pristine suspended material is occurring in the upper Green River.
October01 = 11.02 m3/sec
D2B = 12.52 m3/sec
PI = 3.0 g/m3
P2B = 5.4 g/m3
December01 =32.31 m3/secD2B =36.82 m3/sec
_ 3PI - 5.4 g/m
P2B = 11. 5 g/m3
Station 2B
CalculatedConcentrations
Hydrocarbons (~g/g)
CalculatedMeasured
(%)
Station 2B
CalculatedConcentrations
(~g/g)
CalculatedMeasured
(%)
15 1. 33 22 0.36 2416 0.35 11 0.21 14
17 7.11 80 0.61 27Pr 0.28 18 0.31 23
Phy 0.13 24 0.28 31
25 6.42 118 4.31 65
26 0.70 99 0.35 56
27 8.23 103 5.62 68
28 0.92 177 0.32 56
29 5.29 79 6.52 86
30 0.73 83 0.38 58
31 3.64 60 7.63 113
32 0.60 207 0.30 86
UCM 25.38 22 97.17 80
72

The calculated hydrocarbon deficits are not likely the result of
biological modification 'occurring within the outfall pipe or river. The
apparent loss of hydrocarbons may be attributable to an overestimate of
the suspended hydrocarbons in the effluent, a result of filtration.
Glass fiber filters are known to adsorb dissolved organics and to retain
particles smaller than their nominal mesh size. Results of a single
experiment showed that concentrations of n-alkanes extracted from filter
samples of a bulk METRO effluent sample were an average of 1.4 times
greater than concentrations in the centrifuge sample. However, the
deficits of most compounds (especially the heavier hydrocarbons) remain
significant despite an incorporation of this factor into the budget
calculation. Flocculation and subsequent deposition of organic matter
as the effluent mixes with the river water would provide a sink for
these compounds.
Dilution appeared ~o playa substantial role in controlling the
concentrations of heavy paraffins between Stations 1 and 28 in October.
Effects of'dilution appeared somewhat less pronounced in December indi
cat i ng that the sediments eroded duri ng thi s peri od of hi gh di scharge
contained concentrations of hydrocarbohs comparable to the ambient
levels measured at Station 1. The volatile fraction and the UCM were
insignificantly affected by dilution (except C17 in October). Surface
runoff was probably the major source of the low-molecular-weight com
pounds and the UCM.
6.0 SEASONAL VARIATIONS
6.1 NORMAL ALKANE CONCENTRATIONS
Figure, 17 summarizes the seasonal and spatial hydrocarbon distri
butions for all centrifuge sediment samples. December samples at all
three stations displayed minimal concentrations of those hydrocarbons
produced by aquatic organisms, namely C15 and C17 . The decrease in
light and the concomitant hiatus in biological activity during winter
are responsible for the loss of these compounds. Station 2 exhibited
the precipitous decrease in C17 between the July and October samplings
73

20-
10
STATION I
JULY
I I I I I I I
13 23 32
STATION 241'
STATION 3
zo~<.{0::~ZWUZou
20
10
20
10
OCTOBER
13
DECEMBER
I I I I I13 23
I
32
32 13 32~13 23 32
CARBON NUMBER
Figur~ 17. Summary figure displaying concentrations of the normalparaffi ns associated with Green Ri ver suspended matter in1978.
74

while Station 3 showed a reversal in the C17-C15 dominance over the sameperiod, possibly reflecting relative changes in the dominant populationsproviding these compounds. Both of these stations displayed increasedconcentrat ions of C13 , C14 , and C16 from summer to falL Bri dge andhighway runoff would be ali kely source of these low-molecular-weightcompounds; however, October received less precipitation than any othermonth in 1978 (Table 1). These changes could also be the result ofmicrobial activity. The concentrations of all low-molecular-weight compounds decreased from October to December, accompanyi ng increases insuspended loads.
The heavy hydrocarbons were consistently dominated by the plant waxconstituents during the three sampling periods. Stations 2 and 3 showedlittle seasonal change in concentrations of these compounds. Station 1in December was an exception to this generalization, displaying a stepwise increase in the heavy, odd-carbon paraffins to a maximum at C31 instead of the normal distribution centered about C27 that characterizedJuly and October samples. This may be a reflection of seasonal differences in plant waxes available for scavenge by runoff.
6.2 COMPOSITIONAL PARAMETERSAncillary information and diagnostic parameters are summarized in
Tab1e 15 for a seasonal compari son. TSM concentrations at the threestations showed minima in October (again, repercussions of the lowrainfall) and maxima in December. Total particulate carbon increasedfrom summer to fall at all three stations. The autumn to winter trends,however, showed differences. TPC increased to a maximum at Station 1 inDecember while it showed minima downstream at Stations 2B and 3 simultaneous ly. The increased suspended loads at Stations 2B and 3 had aproportionately lower carbon content, presumably because of dilutionwith sediments eroded from the river bank and/or resuspended by turbulence. The threefold increase in river discharge between October andDecember was 1i ke ly respons i b1e for the hi gher concentrations of suspended matter.
Concentrations of total extractables were consistently low inDecember, another consequence of dilution with suspended matter of lowerhydrocarbon concentrations. At Stations 1 and 2B, concentrations of
75

Table 15. A seasonal summary of selected data and compositional parameters for suspended matter obtained at Stations 1, 2(B), and 3 on theGreen River, 1978.
STATION 1
JULY OCTOBER DECEMBER
TSM (mg/l) 2.6 1.4 3.2TPC (wt.%) 8.5 12.0 15.4Total Extractables (mg/g) 8.4 8.2 5.9Total Saturates (mg/g) 0.25 0.10 0.63CPI 14- 20 18.2 11.1 2.5CPI 2O-32 10.9 7.5 14.3
STATION 2(B)
TSM (mg/l) 5.1 2.2 5.1TPC (wt.%) 5.4 9.3 3.1Total Extractables (mg/g) 12.7 7.1 5.4Total Saturates (mg/g) 0.56 0.30 0.41CPI14- 20 19.8 2.6 1.6CPI 2O- 32 7.0 8.0 10.2
STATION 3
TSM (mg/l) 4.1 2.5 6.9TPC (wt.%) 6.6 19.4 3.6Total Extractables (mg/g) 28.7 47.4 17.4Total Saturates (mg/g) 1.1 2.0 0.7CPI14- 20 11.1 3.0 1.0CPI 2O- 32 3.9 2.6 5.0
76

total extractab1es were highest in July. Station 3 exhibited a maximumin October, possibly becaus~ ~utfa11 effluent particulates comprised thegreatest proportion of the total riverine suspended matter during thisperiod. (Note that this was not reflected in maximum concentrations ofindividual alkanes.) Gravimetric determinations of the saturate fractions were lowest in October at Stations 1 and 2B, yet highest atStation 3 during this period. Ag.in the contribution of the outfall tothe river in October may be responsible f9r the high values at Station3. The negative correlation of individual alkanes with total saturatesat Station 3 might indicate that tile outfall is a more significantsource of the uni dent i fi ed or unresolved cQmpol'lents in the II saturate"fraction than of the individual n-a1kanes themselves.
The decrease in CPI14- 20 values from summer to winter at all stations reflected the decline of the algal production of C15 and C17. TheCPI 20-32 values were highest in December indicating a winter dominanceof the plant wax ensemble. Low values of this parameter were calculatedfrom the October results at Stations 1 and 3. All stations exhibitedincreasing concentrations of pristane and phytane relative to C17 fromsummer to winter, suggesting that these isoprenoids had a common sourcenot associated with aquatic biological production.
6.3 MASS TRANSPORTSIn order to evaluate seasonal changes in hydrocarbon quantities,
variations in river discharge and suspended matter concentrations mustbe taken into account. Table 16 is a summary of selected a1 iphatichydrocarbon transports.
Nearly all the high-mo1ecu1ar-weight compounds measured at Stations1, 2B, and 3 displayed transports in December that were an order ofmagnitude greater than values obtained at any other period. Only Julytransports of heptadecane were consistently greater than the Decembervalues, a consequence of summer algal growth. The higher winter valuesare again caused by increased river discharge and greater concentrationsof suspended solids injected via runoff, riverbank erosion, and resuspension of bottom sediments. Heavier winter rainfall filtering throughmats of decaying vegetation may have contributed significant quantitiesof hydrocarbons.
77

Table 16. A seasonal comparison of selected hydrocarbon transports atStations 1, 2(B) ,and 3 on the Green River, 1978.
STATION 1 JULY OCTOBER DECEMBERDischarge (m3/sec) 10.3 11. 0 32.0TSM (g/m3 ) 2.6 1.4 3.2
C15 (lJg/sec) 34~6i ' 41. 9 86.0C16 7.5 11.1 53.2C17 351 223 153C25 217 202 1080
C26 33'.5 22.0 88.1C27 416 259 1400C28 35.1 28.8 78.8
C29 368 166 1630, C
30 20.9' 22.8 95.2
C31 313 114 1900
C3222.2 ' 18.8 74.8
" ,
STATION 2(B)
Discharge (m3/sec) 11.8 12.4 37.3
TSM (g/m3) 5.1 ' 2.2 5.1
C15 (j.Jg/sec) 468 163 291
C16 75.8 90.6 293
C17 2470 242 432
C25 283 148 1260
C26 49.9 19.4 118
C27 457 219 1580
C28. 32.5 14.2 108
C29 363 183 1450
C30 34.3 24.0 124
C31 304 166 1280
C32 69.8 7.9 66.6
78

Table 16 (Continued)
STATION 3 JULY OCTOBER DECEMBER
Discharge (m3/sec) 13.3 13.4 42.0
TSM (g/m3 ) 4.1 2.5 6.9
C15 (lJg/sec) 380 559 753
C16 90.0 156 794
C17 1760 382 959
C25 327 111 1780
C26 101 53.3 333
C27 383 185 1960
C28 66.0 54.9 354
C29 314 194 1950
C30 83.4 48.4 287
C31 221 118 1860
C32 33.8 34.0 185
79
The October data pose a unique case for interpretation. Transports
of C27 , C29 , and C31 at Station 1 were lowest in October. Stations 2B
and 3 also exhibited reduced transports in the fall for most hydrocar
bons, between C25 and C32 . These results reflect the anomalous weather
conditions experienced in October 1978. The rainfall (Table 1) in
October was comparable to the low values measured in June. River discharges in July and October were similar (Table A-I) and the suspended
load measured in October was less than that of July (Table A-2). A
combination of these factors is responsible for the low transportsobserved at all stations in October.
6.4 SUMMARY
Some seasonal trends are shared by all stations. TSM concentrations are highest in December at all three stations. This correspondedto reduced concentrations of POC at Stations 2 and 3 (suggesting erosion
of sediments downstream) and a POC maximum at Station 1. Most stationsshowed greatest concentrations of C15 and C17 in July and then dramaticdropoffs in these aquatic biological hydrocarbons by December. Conse
quently CPI14- 20 values are highest in July. The CPI 20- 32 results atall stations are greatest in December when plant wax constituents were
abundant. Although the lowest concentrations of hydrocarbons wereobta i ned in December, the transports of all n-a1kanes except Cn were
highest in winter. Transports of a number of compounds within the range
from C18 to C32 were lowest in October. Low rainfall and subsequent lowriver discharge and TSM concentrations were probably responsible forthese observations.
7.0 AROMATIC HYDROCARBONS
7.1 GENERAL DISCUSSIONAs a part of the systematic survey of suspended hydrocarbons in the
Green-Duwamish River system, aromatic hydrocarbons were extracted and
separated from the paraffins as described in section 3.5. The chromatograms were exceedingly complex, showing major components eluting atregular retention indices. Because it was unlikely that these compounds
80
were polynuclear aromatic hydrocarbons (PAH), the extracts obtained in
October were further chromatographed on a column of Sephadex®. Whereas
the complexity of the subsequent chromatograms was reduced, large com
ponent interference pers i sted and pos i t i ve i dent ifi cat i on of some PAH
remained ambiguous. In a final effort to determine whether any PAH were
present, three samples were selected for detailed GC-MS analysis at the
Institute of Geophysics and Planetary Physics at UCLA. The samples were
Metro effl uent fil ters, December Sample #2; October suspended matter,Station 3, Sephadex@ cut; and December suspended matter, Station 3,first triplicate.
Initially the samples were scanned for the usual petroleum aromatics by parent ion. This gave no quantitative information but verified
the presence of the following compounds, most of them in trace amounts:
p-, m-, o-xylenestrimethyl benzenesindannaphthalenemethyl naphthalenes~etramethylbenzene
~iphenyl
acenaphthenefluorenecadalenephenanthrenebenz (k) fluoranthenebenz (e) pyrenebenz (a) pyrene
methyl phenanthrenesdimethyl phenanthrenesfluoranthenepyreneretenedibenzothiophenesmethyldibenzothiophenesbenz (g, h, i) fluoranthenebenz (a) anthracenechrysenebinaphthylperyleneananthrenebenz (g, h, i) perylenecoronene
Many of these aromatic compounds appeared to be eluting near the large
peaks, although not as visible shoulders on the GC traces. The actual
mass spectra of the major peaks compri sing each of the three sampleswere obtained next. Compounds were i dentifi ed by compari son wi th spec
tra in the EPA/NIH Mass Spectral Data Base (Heller and Milne, 1978).The predomi nant compounds were unambi guous ly methyl esters of even
carbon fatty acids (FAME). Fatty acids of higher plants and animalsexhibit an even-carbon preference for carbon chains between 14 and 22
atoms long. Chain lengths of 16 and 18 carbon atoms predominate
(Lehninger, 1975).In the December sediment and Metro sample, two heavier compounds
were tentatively identified as esters: 9-hexadecenoic acid, tetradecyl
81

ester (HATE); and 9-hexadecenoic acid, hexadecyl ester (HAHE). Four
other compounds were identified as possible esters: dodecanoic acid,
tetradecyl ester (DATE); tetradecanoi c aci d, tetradecyl ester (TATE);
tetradecanoic acid, hexadecyl ester (TAHE); and oleic acid, hexadecyl
ester (OATE). For each of these compounds, the abundance of the major
ion indicated in the data base was far greater than the abundance shownby the UCLA spectra. Nonetheless, these peaks have been assigned theabbreviations given above (Figures 18, 20, Table 18). Many of the
unidentified major peaks in the three samples display spectral charac
teristics similar to these heavier compounds. Note that these heavylI es ters ll show an even-carbon preference for acids between 12 and 18
carbon atoms long.
The extraction technique employed here did not include saponification or methylation, thus, the recovery of the fatty acids was probablyfar from complete. Partial methylation of naturally occurring fattyac i ds apparently occurred inadvertently duri ng the Soxh1et® extractionwith methanol and methylene chloride. These compounds should have been
partitioned during the separatory silica gel chromatography.
7.2 TOTAL IIAROMATICS II
The concentrations of the lIaromaticll fractions, which include a
partial recovery of the fatty acids as methyl esters, are reported inTable 17. Analogous data for October are not available because these
extracts were chromatographed on Sephadex® prior to gravimetry.Total lIaromaticsll increased in July 1978, from 0.29 mg/g at
Station 1 to 2.34 mg/g at Station 3. Values in December fell within thesame range, however, the lowest concentration was measured at Station 28(0.40 mg/g). The highest concentration in December was measured atStation 3 (x =1.85 mg/g).
Concentrat ions of the total II aromat i cll fractions in the Metro
effluent sample should be viewed cautiously since recoveries were lowerthan usual. Values ranged from 30 mg/g to 60 mg/g, or approximately
10-100 times greater than those concentrations associated with riverine
suspended matter.
82

Table 17. Concentrations of the total Ilaromaticll hydrocarbon fractionsextracted from suspended matter collected from the Green River and Renton Metro effluent in 1978.
Station 1
Station 2(B)
Station 3
Metro Effluent
July(mg/g)
0.29
0.45
2.34
October(mg/g)
28.2
December(mg/g)
0.69
0.40
1. 592.12
35.542.961. 8
7.3 INDIVIDUAL COMPONENTSFigures 18, 19, and 20 show the chromatographic traces of the three
samples sent to UCLA for GC-MS analysis. Major esters are identifiedas well as a few of the aromatic compounds common to crude oil andrefined products. Brackets denote the approximate elution temperaturesof the aromatics, some of which are coeluting with esters and other compounds.
In the hope that some knowledge may be gleaned from these samples,Table 18 lists the major compounds and their approximate concentrations.Some petroleumlike aromatics are included although they may be coelutingwith other unidentified compounds. They nonetheless provide a roughestimate of the concentrations found on suspended matter in the GreenRiver. The esters have been quantified roughly by adopting the responsefactor of the PAH in the aromatic standard (Table 6) which has a retention index closest to the ester of interest.
83

IJ.~~
U
METRO FILTERS
SAMPLE 2DECEMBER 1978
..c:..~
~
'"
\l
N:)
'"~
N..,U-..,
J:<IJ:
~
:3
..,J:<I....
..,
....<I....
.. ..c: c:
t t0. 0.
~ 2~ Nc: c:.. '"&J ..,
..~
0;'0,I
'";"0~
:c0."-'::;;
<-w"'::;;0<~~
~ N- ~"'~
~1'';. ::::. t~- - -~ ,- ~
l~
u
0'"N..,
J:
::;;..
...c:..1:c:"c:..~
0.
!D
~
(Xl~
TEMPERATURE ~
Figure 18. Gas chromatogram of the lIaromaticli fraction associated with suspended solidsin the Renton Metro effluent, Sample #2, December 1978. Compound abbreviations aredefined in Section 7.3.

• ~"CO"lCQ.lr-IQ.lCe·,...Q.I .,... Its....::::JOl
I I"CQ.IQ.I"CIn
Q.I"Cs....Q.IIO-cC InQ.I-cC.cIn ::::J::::JoInc.
eeoous....It-It-
o-cQ.I III~cU 010.,...s....~~IOx.,...Q.I >
Q.IC s....o~.,...~
~<U10s....
It-CX),...._ O"l-u r-I
~s....10 Q.Ie~00s....~10 U= 0
c~.,...
~M
It- c00
e~1010s....~0lV)o M~~ .~IO"""
E"C g~ Q.I.,...u>~
Q.I uIll''''' Q.IIObV)~Q.Ic
s.....,...
.,...L&-
W0::=>I-<10::W0....2wr-
<lU<lIAlar\<luaJAd (U) waq [aUaJAd(a)Zu~.~q~__~
aua:>olljluO·aUaJljlUOualjd
xwo«r0.WVI
Uz~O«-~t;0«crcr«u.
OJ-"ן
m q~
20:::o LiJ-rn~·o<1fI--u(f)O
85
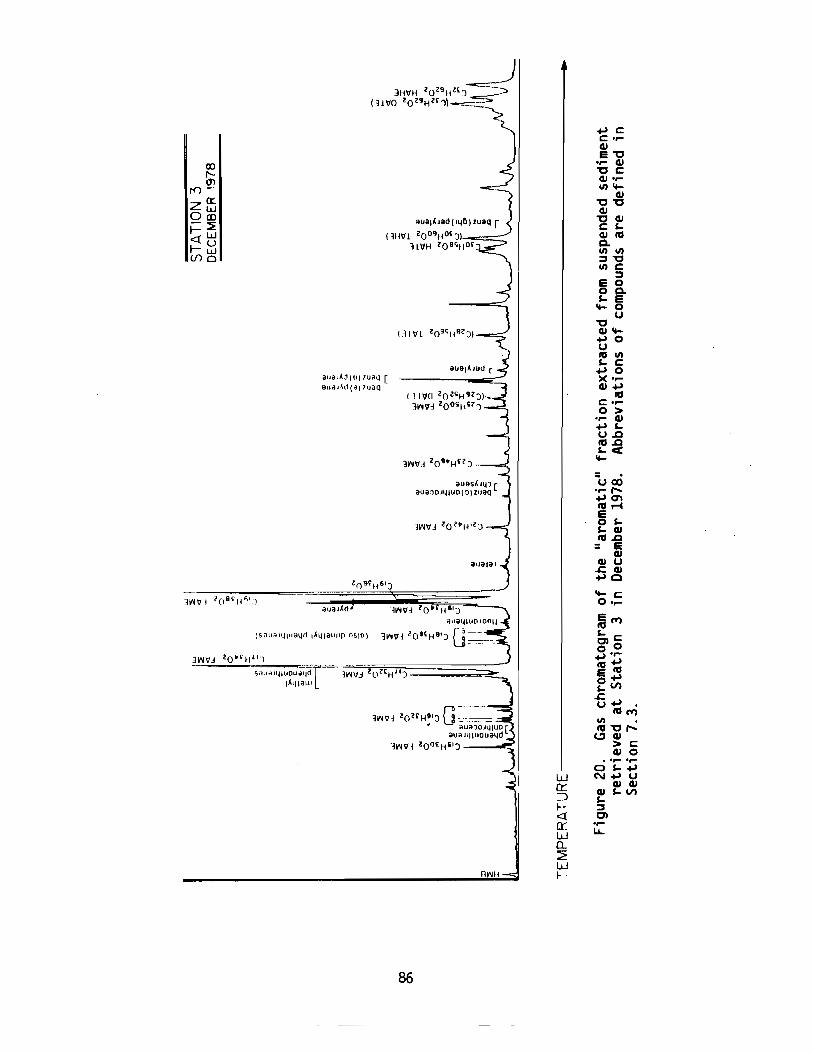
CDt-C1l
to-ZCl:O~-~r- W<{Ur-w(/)0
aua ,Ad Itll'lJaQ [QHdJ~d(')}1UaQ
86
11V'l1i
W0::::J1-<{0::W0...~WI-
~CC'r-41e"O
'r- 41"OC41'r1I)'t-
41"0"041"041CS41 CUQ.11)11)
:::J"OII)C
:::J
8 0
t~u
"041't~oUCUll)S- C~oX'r41~
CUC'r-0>
'r- 41~sU~CU~s-<'t-
1Jo:i'r- ,...~ enCUr-i8 s-S-41CU~= e4141 U
.&:.41~Q
't-cO'r-
raMS- Cg'0~'r-
CU~e CUO~s-V)
.&:.U~ •
CUMII) •CU"O,...~41
> C410. -,... -,..
OS-~C\I~U
414141S-v)S-:::Jen
'r-~

Table 18. Approximate concentrations of the aromatics and fatty-acidesters extracted from suspended sol ids retrieved from the Green Riverand Renton Metro effluent, 1978.
Effluent Filters October DecemberDecember Statioi 3 Station 3Sample #2 Sephadex Cut Triplicate 1(~g/g) (~g/g) (~g/g)
C13H2602 FAME 1. 68
fluorene 0.02
C14H2802 FAME (a) 0.42
C14H2802 FAME (b) 0.12
cada1ene 0.16
C15H3002 FAME 4.34 1. 37
C16H3202 FAME (a) 0.73 0.41
C16H3202 FAME (b) 0.50 0.43
C16H3202 FAME (c) 0.56 0.76
C17H3202 FAME (a) 70.0 7.52 4.27
methyl phenanthrene
C17H3202 FAME (b) 0.49
C17H3402 FAME 6.29 28.1
C18H3602 FAME (a) 0.36
C18H3602 FAME (b) 0.50
C18H3602 FAME (c) 0.83
f1uoranthene 0.15
C19H3402 FAME 1. 61
87
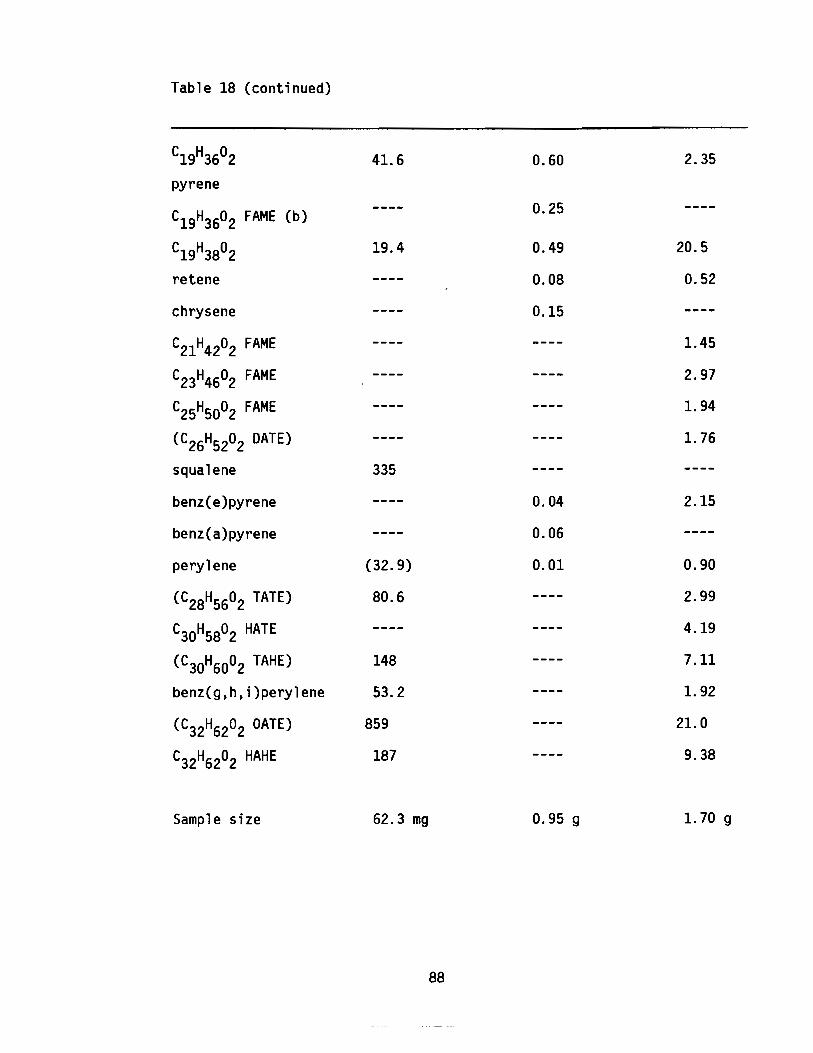
Table 18 (continued)
C19H3602 41.6 0.60 2.35
pyrene
C19H3602 FAME (b)0.25
C19H3802 19.4 0.49 20.5
retene 0.08 0.52
chrysene 0.15
C21H4202 FAME 1.45
C23H4602 FAME 2.97
C25H5002 FAME 1. 94
(C26H5202 DATE) 1. 76
squalene 335
benz(e)pyrene 0.04 2.15
benz(a)pyrene 0.06
perylene (32.9) 0.01 0.90
(C28H5602 TATE) 80.6 2.99
C30H5802 HATE 4.19
(C30H6002 TAHE) 148 7.11
benz(g,h,i)perylene 53.2 1. 92
(C32H6202 OATE) 859 21.°C32H6202 HAHE 187 9.38
Sample size 62.3 mg
88
0.95 9 1.70 9

The Metro effluent filter, Sample #2, gave the highest aromatic and
fatty-acid concentrations of the three samples. The GC-MS scan indi
cated a "trace" of pery1ene; the value, 33 1-1 gig , may be an overestimate.
A relatively small amount of benz (g, h, i) pery1ene, 53 I-Ig/g, is also
reported. The methyl esters of only three fatty aci ds predomi nated:
hexadecenoic acid (16:1), octadecenoic or.o1eic acid (18:1), and octa
decanoic acid (18:U). The major fatty acids in waste water are usually
16:0, 18:0, and 18:1 (Farrington and Quinn, 1973, and references there
in). Sources of these fatty acids include fecal matter and kitchen
wastes (animal fats and vegetable oils). Concentrations of 16:0 in
waste waters analyzed by Farrington and Quinn (1973) varied from 0.26
mg/1 to 12.8 mg/1. Approximately 3.6 liters of effluent were filtered
to obtain the soli ds for Sample #2 in December. Concentrations of the
three fatty-acid methyl esters in this sample ranged from 0.3 I-Ig/1 to
1.2 I-Ig/1; three orders of magnitude less than the values reported for
16:0 by Farrington and Quinn (1973). The methylation of fatty acids was
obviously far from complete. Squalene, an isoprenoid of 30 carbon atoms
and the precursor of sterols, was a domi nant compound in the Renton
Metro effluent. The heavier esters were approximately ten times more
abundant than the methyl esters. Di ethyl phthalate, a compound used in
the manufacture of plastics, was a contaminant found in both the sample
and the filter blank.
Although concentrations are given for the October sample at Station
3, the fatty acids were only partially recovered from the Sephadex@
column. Note that fatty-acid methyl esters beyond C19 have been elimi
nated and none of the heavy esters (TATE, etc.), present in the other
samples, are evident here. The dominant fatty-acid methyl esters (Table
18) were 14: 0 (4.34 I-Ig/g) , 16: 1 (7.52 I-Ig/g) , and 16: 0 (6.29 I-Ig/g).
Concentrations of a few aromatics are tentatively reported. F1uoran
thene and cada1ene (1, 6-dimethyl-4-isopropyl naphthalene) are present
at concentrations of ~ 150 ng/g. Quantities of benz(a)pyrene and pery
1ene (both known to be present, but identified here by retention time
only) were approximately 60 ng/g and 10 ng/g, respectively. Benz(e)
pyrene and chrysene were identified by their mass spectra. Calculated
concentrations were 40 ng/g and 150 ng/g, respectively.
89

The aromatic portion of the December sediment sample recovered at
Station 3 is the most complex of the samples. Benz(a)pyrene is coelut
ing with a large unknown compound. The concentration of benz(e)pyrene'
is reported (2.15 ~g/g) although the spectrum of the peak was not avail
ab1e for verifi cation. Peryl ene and benz (g, h, i) peryl ene are re
ported at concentrations of 0.90 JJg/g. Retene (7-isopropyl-l-methyl
phenanthrene) was also present (0.52 ~g/g). The methyl esters of two
fatty acids, 16:0 (28.1 ~g/g) and 18:0 (20.5 ~g/g), were dominant com
pounds as was OATE (21.0 ~g/g).
7.4 SUMMARY
The aromatic fraction extracted from suspended matter samples wascomplicated by the presence of fatty-acid esters. GC-MS identified manyof these compounds unambiguously and confirmed the presence of petroleumaromatics from xylene through coronene. Gravimetric determinations of
the total "aromatics" (which included the fatty-acid esters) varied from0.3 mg/g to 2.3 mg/g in river samples with the highest concentrationsmeasured at Station 3. Concentrations of total "aromatics" associated
with Renton sewage effluent ranged from 28 to 62 mg/g.Quantities of individual fatty acids were approximated using PAH
response factors. The major methyl ated fatty aci ds in the effl uent
sample were 16:1, 18:1, and 18:0. Fatty acids from 14:0 to 18:0 were
present in the October and December sediment samples at Station 3.Heavy compounds tentatively identified as tetradecyl and hexadecylesters of the even-carbon fatty acids (C12 - C18) were also major com
pounds in the December effl uent and sediment. The compound 1abell edoleic acid, tetradecyl ester (OATE) was most abundant.
The aromatic hydrocarbons retene, benz(e)pyrene, perylene, and benz
(g, h, i) perylene were present in concentrations from 0.5 to 2.2 ~g/g
in the December sample and concentrations 1ess than O. 08 ~g/g in Oc
tober. Concentrations of perylene and benz (g, h, i) perylene in theeffluent sample were approximately 40 ~g/g. Chrysene and fluoranthene
were present in greatest amounts in the October sample (~0.15 ~g/g).
90

ACKNOWLEDGMENTS
We would like to thank our many cohorts of the GeochemistryGroup at NOAA/PMEL for their cheerful assistance. Tim Bates, CharlesKatz, and Joyce Quan aided in all aspects of this research. AnthonyYoung and Tim Bates were of invaluable assistance in the field.
Mr. Richard Finger of the Renton Metro Sewage Treatment Plantgenerous ly supp1ied effl uent samples and answered our many questionsregarding the secondary treatment facility.
We also thank Sue Larsen for her patience and fortitude in typingthis manuscript, and Gini May for drafting figures.
91


BIBLIOGRAPHYArcher, S. L. (1975). Characterization of the effluent from a metropol
itan Seattle wastewater treatment facility. M.S. thesis, Dept. ofForestry, Univ. of Washington, Seattle, 111 pp.
Baker, E. T., J. D. Cline, R.A. Feely, and J. Quan (1978). Seasonaldistribution, trajectory studies, and sorption characteristics ofsuspended part i cul ate matter in the northern Puget Sound regi on.National Oceanic .and Atmospheric Administration, Pacific MarineEnvironmental Laboratory. Interagency Energy/Environment R&DProgram Report No. EPA-600/7-78-126, 140 pp.
Barrick, R. C., J. I. Hedges, and M. L. Peterson (1980). Hydrocarbongeochemistry of the Puget Sound region, 1. Sedimentary acyclichydrocarbons. Geochim. Cosmochim. Acta (in press).
Blumer, M:(1976). Polycyclic aromatic compounds in nature. Sci. Amer.234, 35-45.
Blumer, M., P. C. Blokker, E. B. Cowell, and D. F. Duckworth (1972).. Petroleum. In: ,A Guide to Marine Pollution, (G. Goldberg, ed. L
pp. '19-40. Gordon and Breach, NY.
Blumer, M., .M. M. Mullin, and R. R. L. Guillard (l970a). A polyunsaturated hydrocarbon (3, 6, 9, 12, 15, 18 heneicosahexaene) in themarine food web. Mar. Biol. £' 226-235.
Blumer, M., M. M. Mullin, and D. W. Thomas (1964). Pristane in themarine environment. Helgal.Wiss. Meeresuntern 10, 187-201.
Blumer, M. and J. Sass (1972). Indigenous and petroleum derived hydrocarbons in a polluted sediment. Mar. Pollut. Bull. ~, 92-94.
Blumer, M., G. Souza, and J. Sass (1970b). Hydrocarbon pollution ofedible shellfish by an oil spill. Mar. Biol. ~, 195-202.
Blumer, M. and W. D. Snyder (1965). Isoprenoid hydrocarbons in recentsediments: presence of pristane and probable absence of phytaneScience 150, 1588-1589.
Blumer, M. and W. W. Youngblood (1975). Polycyclic aromatic hydrocarbons in soils and recent marine sediments. Science 188, 53-55.
Burns, K. A. and J. M. Teal (1971). Hydrocarbon incorporation into thesalt marsh ecosystem from the West Falmouth oil spill. Woods HoleOceanographic Tech. Rep. No. 71-69, Woods Hole Oceanographic Institute, MA, 14 pp.
CH2M Hill, Inc. (1974). Environmental management for the metropolitanarea; Part I water resources, (report sponsored by the municipality of metropolitan Seattle (Metro) through its River Basin Coordinating Committee (RIBCO», 172 pp.
93

Clark, R. C. and M. Blumer (1967). Distribution of n-paraffins inmarine organisms and sediment. Limno1. Oceanogr. 12 79-87.
Clark, R. C~ and D. W. Brown (1977). Petroleum: properties and analysesin biotic and abiotic systems. In: Effects of Petroleum on Arcticand Subarctic Marine Environments and Organisms, Vol. 1, (D.Ma1ins, ed.) pp. 1-89. Academic Press, NY.
Clark, R. C. and J. S. Finley (1974). Analytical techniques for isolating and quantifying petroleum paraffin hydrocarbons in marineorganisms. In: Proceedings. of the 1973 Joint Conference on Prevention and Control of bit Spills, pp. 161-172. API/EPA/USCG, March13-15, Washington, D.C.
Cowell, E. B.(1969). Effects of oil pollution on salt marsh communities in Pembrokeshire and Cornwall. J. Appl. Ecol. ~, 133-142.
Eg1inton, G. and R. J. Hamilton (1963). The distribution of alkanes.In: Chemical Plant Taxonomy, (T. Swain, ed.), pp .. 187-196. Academic Press, NY.
Farrington, J. W. and P. A. Meyer (1975). Hydrocarbons in the marineenvironment. In: Environmental Chemistry, . Vol. 1 (G. Eg1inton,ed.), pp. 109-136. The Chemical Society, London.
Farrington, J. W. and J. S. Quinn (1973).fatty aci ds in wastewater eff1 uents.45, 704-712.
Petroleum hydrocarbons andJ. Water Pol L IContro1 Fed.
Farrington, J. W. and B. W. Tripp (1977). Hydrocarbons in western NorthAtlantic surface sediments. Geochim. Cosmochim. Acta 41, 16271641.
Feely, R. A. (1975). Major element composition of the particulate matter in the near-bottom nephe10id layer of the Gulf of Mexico. Mar.Chem. ~, 121-156. ---
Gearing, P., J. N. Gearing, T. F. Lytle, and J. S. Lytle (1976). Hydrocarbons in 60 northeast Gulf of Mexico shelf sediments: a pre1 iminary survey. Geochim. Cosmochim. Acta 40, 1005-1017.
Giger, W., M. Reinhard, C. Schaffner, and W. Stumm (1974). Petroleumder; ved and i ndi genous hydrocarbons in recent sedi ments of Lakelug, Switzerland. Environ. Sci. Techno1. ~, 454-455.
Giger, W., C. Schaffner, and S. G. Wakeham (1980). Aliphatic and olefinic hydrocarbons in recent sediments of Greifensee, Switzerland.Geochim. Cosmochim. Acta 44, 119-129.
Han, J. and M. Calvin (1969). Hydrocarbon distribution of algae andbacteria, and· microbiological activity in sediments. Proc. Nat1.Acad. Sci. 64, 436-443.
94

Hase, A. and R. A. Hites (1976). On the orlgln of polycyclic aromatichydrocarbons in recent sediments: biosynthesis by anaerobic bacteria. Geochim. Cosmochim. Acta 40, 1141-1143.
Heller, S. R. and G. W. A. Milne (1978). EPA/NIH Mass Spectral DataBase. NSRDS-NBS 63, DOC. 4 vols.
Hornbeck, R. W. (1975). Numerical Methods. Quantum Publishers, Inc.,NY. 310 pp.
Huang, C. P. and H. A. Elliott (1977). The stability of emulsifiedcrude oils as affected by suspended particles. In: Fate andEffects of Petroleum Hydrocarbons in Marine Organisms and Ecosystems (D. A. Wolfe, ed.), pp. 413-420, Pergamon Press, NY.
Keizer, P. D., J. Dale, and D. C. Gordon Jr. (1978). Hydrocarbons insurficial sediments from the Scotian Shelf. Geochim. Cosmochim.Acta 42, 165-172.
Keizer, P. D., D. C. Gordon Jr., and J. Dale (1977). Hydrocarbons ineastern Canadi an mari ne waters determi ned by fl uorescence spectroscopy and gas-liqUid chromatography. J. Fish. Res. Board Canada34, 347-353.
lao, R. C., R. S. Thomas, H. Oja, and l. Dubois (1973). Application ofa gas chromatograph-mass spectrometer data processor combi nat ionto the analysis of PAH content of airborne pollutants. Anal. Chem.45, 908-915.
lehninger, A. l. (1975). Biochemistry, 2nd ed., Worth Publishers, Inc.,NY. 1104 pp.
levy, E. M. (1972). Evi dence for the recovery of the waters off theeast coast of Nova Scotia from the effects of a major oi 1 spi 11.Water, Air, Soil Pollut. 1, 144-148.
loder, T. C. (1971). Distribution of dissolved and particulate organiccarbon in Alaskan Polar, Sub-polar and Estuarine Waters. Ph.D.thesis, Univ. of Alaska, Fairbanks.
lunde, G., and A. Bjorseth (1977). Polycyclic aromatic hydrocarbons inlong-range transported aerosols. Nature 268, 518-519.
Macleod, W. D., D. W. Brown, R. G. Jenkins, l. S. Ramos, and V. D. Henry(1976). A pilot study on the design of a petroleum hydrocarbonbaseline investigation for the northern Puget Sound and the Straitof Juan de Fuca. NOAA Tech. Memo. ERl-MESA-8 National AnalyticalFacility, NMFS, NOAA, U.S. Dept. of Commerce, Seattle, WA, 53 pp.
95
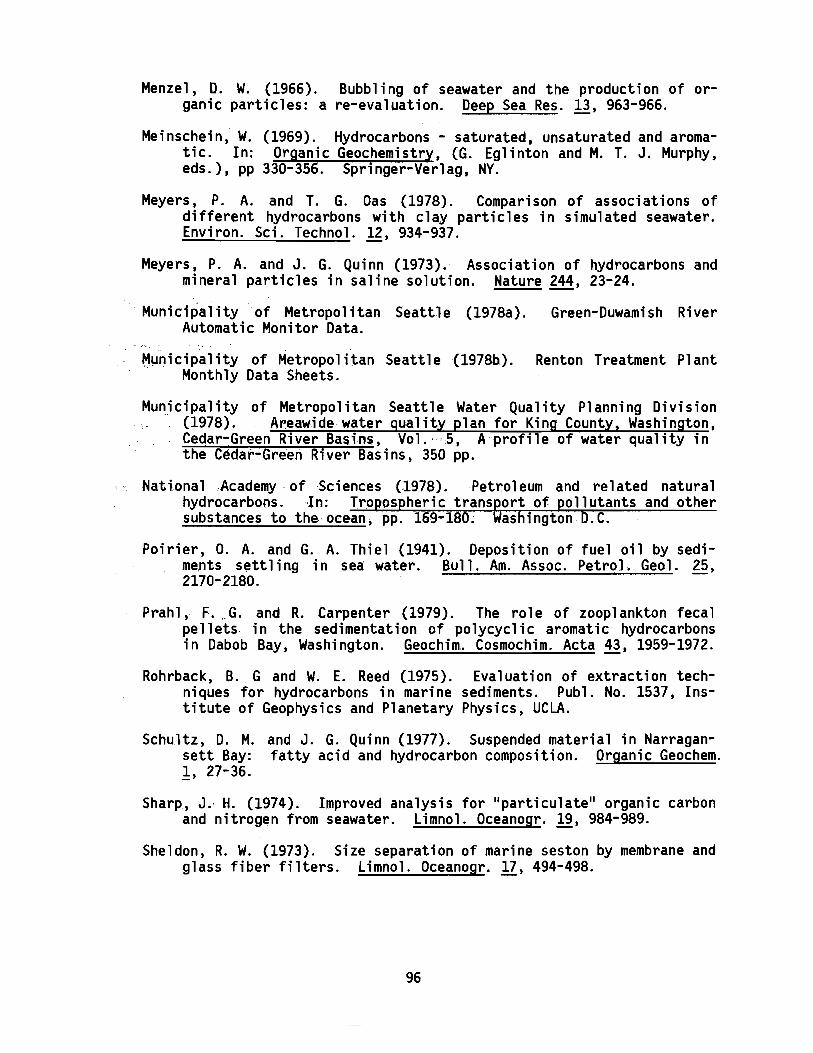
Menzel, D. W. (1966). Bubbling of seawater and the production of organic particles: are-evaluation. Deep Sea Res. 13, 963-966.
Meinschein, W. (1969). Hydrocarbons - saturated, unsaturated and aromatic. In: Organic Geochemistry, (G. Eg1inton and M. T. J. Murphy,eds.), pp 330-356. Springer-Verlag, NY.
Meyers, P. A. and T. G. Oas (1978). Comparison of associations ofdifferent hydrocarbons with clay particles in simulated seawater.Environ. Sci. Techno1. 12, 934-937.
Meyers, P. A. and J. G. Quinn (1973). Association of hydrocarbons andmineral particles in saline solution. Nature 244, 23-24.
Munic1pa1ityof Metropolitan Seattle (1978a). Green-Duwamish RiverAutomatic Monitor Data.
~~nicipa1ity of Metropolitan Seattle (1978b). Renton Treatment PlantMonthly Data Sheets.
Municipality of Metropolitan Seattle Water Quality Planning Division. ,- (1978). A~eawjde water quality plan for King County, Washington,
. Cedar-Green River Basins, Vol. "'5, A profile of water quality inthe Cedar-Green River Basins, 350 pp.
,. National ,Academy, of Sciences (1978). ,Petroleum and related naturalhydrocarbons. I n: Tropospheric transport of pollutants and othersubstances to the-ocean, pp. 169-180; Washington.D.C.
Poirier, O. A. and G. A. Thiel (1941). Deposition of fuel oil by sediments settling in sea ~ater. Bull. Am. Assoc. Petrol. Geol. 25,2170-2180.
Prahl, F. ,G. and R. Carpenter (1979). The role of zooplankton fecalpellets in the sedimentation of polycyclic aromatic hydrocarbonsin Dabob Bay, Washi ngton. Geochim. Cosmochim. Acta 43, 1959-1972.
Rohrback, B.. G and W. E. Reed (1975). Evaluation of extraction technique.s for hydrocarbons in marine sediments. Pub1. No. 1537, Institute of Geophysics and Planetary Physics, UCLA.
Schultz, D. M. and J. G. Quinn (1977). Suspended material in Narragansett Bay: fatty acid and hydrocarbon composition. Organic Geochem.1, 27-36.
Sharp, J.' H. (1974). Improved analysis for "particu1ate ll organic carbonand nitrogen from seawater. Limno1. Oceanogr. 19, 984-989.
Sheldon, R. W. (1973). Size separation of marine seston by membrane andglass fiber filters. Limno1. Oceanogr. 17, 494-498.
96

Smith, D. M., J. J. Griffin, and E. D. Goldberg (1973). Elemental carbon in marine sediments: a baseline for burning. Nature 241, 268270.
Stevens, Thompson, and Runyan Inc.; Human Resources Planning Institute;and Hurlbut, Kersich and McCullough, Inc.. (1975). Puget SoundRe iona1· Assessment Stud for the National Commission on WaterQuality, 2 vo1s., (contract no. WQ5AC058 .
U.S. Dept. of Commerce (1978. and 1980). Tidal Current Tables, PacificCoast of North America and Asia. NOAA/NOS.
u.S. Environmental Data Service (1978). Climatological Data Washington.
U. S. Geological Survey (1978). Water Resources Data for Washington,Vol. 1 (Western Washington).
Van Vleet, E. S. and J. G. Quinn (1977). Input and fate of petroleumhydrocarbons entering the Providence River and upper NarragansettBay from wastewater effluents. Environ. Sci. Technol. 11, 10861092.
Wade, T. L. and J. G. Quinn (1979). Geochemical distribution of hydrocarbons in sediments from mid-Narragansett Bay, Rhode Island. Organic Geochem. 1, 157-167.
Wakeham, S. G. (1976). Geochemistry of hydrocarbons in Lake Washington.Ph.D. diss., Dept. of Chemistry, Univ. of Washington, Seattle.
Youngblood, W. W. and M. Blumer (1975). Polycyclic aromatic hydrocarbons in the envi ronment: homologous seri es in soi 1s and recentmarine sediments. Geochim. Cosmochim. Acta 39, 1303-1314.
Youngblood, W. W., M. Blumer, R. L. Gui11ard, and F. Fiore (1971). Saturated and unsaturated hydrocarbons in marine benthic algae. Mar.Bio1. ~, 190-201.
97

APPENDIX A
This appendix contains data to further describe the Green River andthe precision of the C-H-N method.
Tables A-I and A-2 present discharge and suspended solid concentrations for the Green River in 1978. Tables A-3 and A-4 present analytical and sampling precisions of the C-H-N method.
98

Table A-I. Mean monthly discharge at two stations on the Green River,1978 (USGS, 1978 and USGS, personal communication). See Figure 2 fora graphic presentation of this data.
Near Auburn At TukwilaKi lometer 51. 5 Kilometer 20.0
Month m3/sec m3/sec--January 34.1 44.4
February 31. 9 39.0
March 31. 4 35.2
Apri 1 35.1 38.8
May 26.6 28.9
June 19.1 21. 3
July 11.4 13.2
August 8.7 10.0
September 15.5 18.7
October 12.7 14.2
November 34.8 35.4
December 54.5 58.6
99

Table A-2. Concentrations of suspended solids in the Green River atMetro Stations A319, 311, and 3106 (Municipality of Metropolitan Seattle,1978a) corresponding approximately to Stations 1,28, and 3, respec;"tively, occupied in this study. Concentrations are in mg/l.
Date Station A319 Station 311 Station 3106
01/10/78 38.5 41. 001/24/78 10.4 14.4 14.402/22/78 3.2 8.2 10.003/14/78 4.0 3.7 3.003/28/78 94.0 81. 004/11/78 5.0 6.6 6.804/25/78 2.0 2.7 2.005/09/78 5.0 6.5 5.0
OS/22/78 3.2 2.4 2.8
06/13/78 5.5 3.5 6.5
06/27/78 2.6 4.8 8.4
07/11/78 5.1 4.0 4.3
07/25/78 4.5 7.0 5.9
08/08/78 3.7 3.2 4.8
08/23/78 3.0 4.8 7.5
09/13/78 9.5 13.0
09/27/78 8.5 7.3 10.7
10/10/78 4.0 5.0 4.5
10/23/78 4.0 6.2
11/07/78 15.3 18.0 19.3
11/21/78 7.6 9.0 9.0
12/06/78 39.0 48.0 49.0
12/20/78 7.5 7.8
100

Table A-3. Analytical precision of the micro-Dumas method for determining TPC and TPN. Chromatographic response factors are based on combusti on of known amounts of NBS acetani li de standard contai ni ng 10.36% Nand 71.09% C by weight.
Nitrogen CarbonWeight of Nitrogen in Carbon in Response Response
Date of Standard Standard Standard Factor FactorStandards (J,Jg) (J,Jg) (J,Jg) [104(mg/area)]
July '78 33 3.4 23.4 1. 60 5.1673 7.6 51. 9 1. 67 5.41
126 13.0 89.6 1. 58 5.23163 16.9 115.9 1. 63 5.49200 20.7 142.2 1. 51 5.27276 28.6 196.2 1. 34 4.76567 58.7 403.1 1. 57 5.56
Mean = 1.56 ± 0.11 5.27 ± 0.27
October 178 117 12.1 83.2 1. 30 4.14132 13.7 93.8 1. 33 4.14272 28.2 193.4 1. 29 4.15282 29.2 200.5 1. 38 4.40290 30.0 206.2 1. 33 4.27
Mean = 1.32 ± 0.03 4.22 ± 0.11
December 178 44 4.6 31. 3 1. 99 5.7563 6.5 44.8 1. 74 5.9867 6.9 47.6 1.12 3.8078 8.1 55.5 1.14 3.7886 8.9 61.1 1.13 3.81
148 15.3 105.0 1. 26 4.36149 15.4 106.0 1.13 3.98255 26.4 181.0 1.13 4.08
Mean = 1.33 ± 0.34 4.45 ± 0.90
Average relative standard deviations 12%
101

Table A-4. Precision of replicate C-H-N analyses of suspended sedimentfrom lower Cook Inlet. Alaska. employing the same method and instrumentused in this study (Gary Massoth. Oceanographer. NOAA/PMEL. personalcommunication).
Carbon NitrogenSediment No. of X a alx X a alX
Station/Cast Type Replicates (lJg/l ) (%) (lJg/ l ) (%)
CB 9/4 highly 5 253 34 14 27 2 9inorganic
(l%C)
CB 9/16 highly 5 188 29 15 19 1 9inorganic
(l%C)
CB 7/20 organic 6 278 2 1 52 2 3(10%C)
CB 7/27 organic 4 229 59 26 45 8 19(10%C)
CB III i ntermedi ate 6 137 45 33 10 2 16(3%C)
CB 1/3 intermediate 6 82 24 30 8 2 21(3%C)
Mean relative standard deviation: 20 15
102

APPENDIX B
Concentrations of alkanes associ ated wi th suspended matter re
trieved from the Green River and Renton Metro sewage effluent, 1978, are
presented in this appendix. Concentrations are based on dry weight of
sediment. Table B-1 shows paraffin concentrations based on suspended
sediment recovered in July by both centrifugation and glass fiber fil
ters. Hydrocarbon concentrations for centri fuge and fi 1ter samples
obtained in October are presented in Tables B-2 and B-3. Table B-4
compares centrifuge and filter results for December samples. Al kane
concentrations associated with suspended solids (obtained by filtration)
in the Renton Metro effluent composites are shown in Table B-5.
103

Table 8-1. Concentrations of alkanes associated with suspended matterin centri fuge and fi 1ter samples retrieved from the Green River inJuly 1978.
Centrifuge Samples Filter Samples
Station 1 Station 2 Station 3 Station 2 Station 3Hydrocarbon (ng/g) (ng/g) (ng/g) (ng/g) (ng/g)
13 40 120 570 1110 1410
14 70 340 850 1290 123015 1290 7780 6960 6050 1030
16 280 1260 1650 1900 3120
17 13100 41000 32300 32100 43170
Pr 320 950 3120 1750 6170
18 410 840 1120 1090 2410
Phy 180 490 2510 570 3740
19 600 840 750 660 2270
20 210 490 770 504 1850
21 630 980 900 1140 2340
22 330 550 620 560 1600
23 2360 2370 1990 2340 4180
24 600 560 790 370 1570
25 8120 4700 5990 4400 10200
26 1250 830 1850 470 2310
27 15540 7600 7030 6740 9460
28 1310 540 1210 70 3070
29 13730 6030 5750 5250 9430
30 780 570 1530 290 1430
31 11670 5050 4060 6780 7580
32 830 1160 620 1410 1670
104
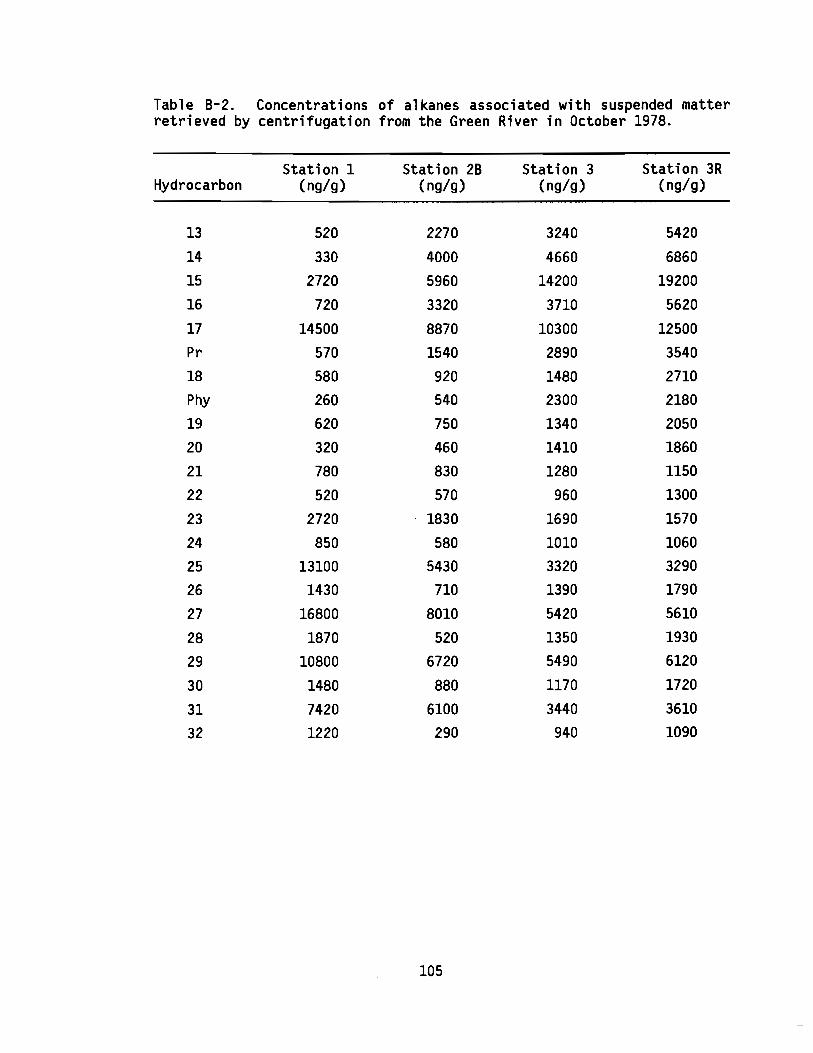
Table B-2. Concentrations of alkanes associated with suspended matterretrieved by centrifugation from the Green River in October 1978.
Station 1 Station 2B Station 3 Station 3RHydrocarbon (ng/g) (ng/g) (ng/g) (ng/g)
13 520 2270 3240 5420
14 330 4000 4660 6860
15 2720 5960 14200 19200
16 720 3320 3710 5620
17 14500 8870 10300 12500
Pr 570 1540 2890 3540
18 580 920 1480 2710Phy 260 540 2300 218019 620 750 1340 2050
20 320 460 1410 1860
21 780 830 1280 1150
22 520 570 960 1300
23 2720 1830 1690 1570
24 850 580 1010 1060
25 13100 5430 3320 3290
26 1430 710 1390 1790
27 16800 8010 5420 5610
28 1870 520 1350 1930
29 10800 6720 5490 6120
30 1480 880 1170 1720
31 7420 6100 3440 3610
32 1220 290 940 1090
105

Table B-3. Concentrations of alkanes associated with suspended matterretrieved by filtration from the Green River in October 1978. Concen-trations of the compounds where N.D. (not detected) appears were belowthe limits of detection when corrected for blanks.
Station 1 Station 2B Station 3 Station 3RHydrocarbon (ng/g) (ng/g) (ng/g) (ng/g)
13 1000 3280 2050 558014 4570 4700 5080 1271015 3250 6980 22730 3325016 790 4240 5310 1617017 14390 8450 20790 31880Pr 1060 1710 6450 1745018 670 2110 3440 13510
Phy 80 780 4450 1034019 N.D. 690 3010 1150020 60 1180 3030 12250
21 N.D. 1080 2600 10340
22 N.D. 1910 2490 10540
23 2090 2770 3120 7950
24 N.D. 150 1530 5530
25 11930 7080 16120 12880
26 N.D. 70 2390 7540
27 16580 11500 10650 19380
28 N.D. N.D. N.D. 2630
29 9470 9620 12400 19960
30 N.D. N.D. 410 2680
31 5440 8840 10280 15660
32 N.D. N.D. 3010 6910
106

Table 8-4. Concentrations of alkanes associated with suspended matterin centrifuge and filter samples retrieved from the Green River in De-cember 1978. Concentrations of the compounds where N.D. (not detected)appears were below the limits of detection when corrected for blanks.
Centrifuge Samples Filter Samples
Station 1 Station 28 Station 3* Station 28 Station 3Hydrocarbon (ng/g) (ng/g) (ng/g) (ng/g) (ng/g)
13 190 390 1230 N.D. 91014 200 710 1520 40 187015 870 1530 2600 1190 310016 520 1540 2740 1210 216017 1490 2270 3310 2350 2570Pr 750 1370 2250 1630 194018 540 1020 2030 1520 1800Phy 690 910 1250 650 1010
19 1190 1280 1200 580 430
20 520 450 1040 1100 1030
21 830 510 760 1360 1370
22 500 320 610 160 20
23 1820 1320 1380 250 3000
24 620 480 800 980 1660
25 10500 6630 6150 1250 11570
26 860 620 1150 1070 1870
27 13700 8290 6780 17270 15700
28 770 570 1220 N.D. N.D.
29 15900 7610 6740 16400 16730
30 930 650 990 N.D. 410
31 18600 6740 6430 15660 16900
32 730 350 640 400 1060
*Mean values of triplicates
107

Table B-5. Concentrations of al kanes associated with suspended solidsrecovered via filtration from Renton Metro effluent.
OCTOBER DECEMBER
1 2 310/19-20/78 12/18-20/78 12/20-21/78 12/21-22/780730-0730 1800-0600 1000-0800 1300-1100
Hydrocarbon (.,.g/g) (.,.g/g) (.,.g/g) (.,.g/g)
13 17 13 15 10
14 23 17 15 12
15 58 19 19 14
16 16 12 13 10
17 42 15 14 11
Pr 18 17 26 20
18 14 13 16 13
Phy 14 14 22 17
19 15 11 14 8
20 16 16 15 8
21 18 9 12 6
22 22 12 11 7
23 23 17 21 7
24 30 32 24 8
25 37 48 47 10
26 54 50 41 13
27 72 50 112 15
28 80 47 52 16
29 105 44 91 21
30 99 29 36 13
31 130 34 95 18
32 102 19 30 8
VolumeFiltered (1) 3.43 3.61 3.17 3.15
Effluent 5.5.Concentrations
(mg/l) 8.31 17.25 12.73 12.75
108

APPENDIX CFILTRATION VERSUS CENTRIFUGATION FOR RETRIEVAL OF
SUSPENDED HYDROCARBONS
C.1 GENERAL STATEMENTSMost studies of interactions between lipids and suspended solids
have employed glass fiber filters for the recovery of suspended matter(Van Vleet and Quinn, 1977; Schultz and Quinn, 1977). This study is thefirst to engage a continuous-flow centrifuge in addition to glass fiberfi 1ters for the recovery of suspended hydrocarbons. By compari ng theresults obtained from these two methods, the variability and the relative bias inherent in each procedure might be determined.
Samp1es taken duri ng the fo 11 ow- up fi e1d tripin October 1980showed that Gelman fi 1ters recovered 80% of the suspended matter retained by a 0.4~m Nuclepore@ filter at Station 1 (Oct. 27, 1980 at 1420)and 56% at Station 3 (Oct. 30, 1980 at 0900). Centrifuge influent andeffluent were also passed through glass fiber filters at the latterstation. Results showed the centrifuge to be 90% efficient at recovering material retained by a 47 mm Gelman type A-E filter with a nominalmesh size of 0.4~m. The efficiency of the Gelman filter varies greatly.Discharge at Station 1 is relatively constant, but at Station 3 tidalpumpi ng perturbs ri ver flow. Concentrati on of the suspended load andthe size of the particulates fluctuate with these changes in discharge.In addition, any fluctuation in quantity and/or size of particulates expelled in METRO effluent affects recovery efficiency at Station 3.
C.2 FILTER BLANKSContamination is perhaps the most difficult problem to contend with
when us i ng gl ass fi ber fi 1ters for the collection of suspended hydrocarbons. A description of the methods used to clean the filters, andthe magnitudes of the filter blanks are reported in this section.Filters used in July were combusted for 4 hours in a muffle furnace at400°C. In the field these filters were enclosed in plastic holders
109

(hexane-washed) and suspended material was collected by pressure filtration (14-20 psi) directly from the manifold. Filters for the Octoberand December samplings were cleaned by Soxhlet extraction for 72 hoursin 65% CH2C1 2/35% CH30H with a solvent change every 24 hours. Althougha filter blank was not run concurrently with the October samples, acombination of the October solvent blank values (unusually high) and theaverages of the July, December, and Metro filter blanks were applied tothe October data. Suspended matter was collected by vacuum filtrationthrough a glass system during the October and December field excursions.
The average re1ati ve contri butions of the n-a1kanes in the fil terblanks to these compounds in filter samples for each station and seasonare given below. The table includes average percentages for all the n-
alkanes (Total; C13-C32), the odd-carbon compounds (Odds), and the even
carbon compounds (Evens).
TOTA( 0DliS MNS(%) (%) (%)
July Station 2 40 23 58Station 3 33 22 45
Station 1 92 42 142October Station 28 58 33 83
Station 3 41 27 56Station 3R 21 16 27
December Station 28 62 39 85Station 3 52 33 70
Contamination from the filters comprised an average of 21% to 92%of each of the n-al kane components. Blanks contributed the greatestproportions of the samples taken at Station 1 for all three seasons.Values decreased monatonically with distance down river. This systematic bias in the contributions of blanks from Stations 1 to 3 reflectsthe increased amounts of normal alkanes recovered by filtration. Due to
110
the overwhelming predominance of the algal hydrocarbons (CIS and C17)
and the plant wax constituents (odd hydrocarbons, C25-C31), the blank
contr'ibuted an average of only 42% (Station 1, October) to 16% (Station
3R, October) of the odd-carbon compounds in each sample. The average
value for the even-carbon compounds ranged from 142% (Station 1,
October) to 27% (Station 3R, October). The filter blank itself showed
little odd- or even-hydrocarbon preference, but was enriched in the n
alkanes, C25 through C31.
A significant error is associated with a small value that is ob
tained by subtracting two large numbers of questionable certainty. In
addition, the filter results are based on relatively small amounts of
suspended matter. The average mass of suspended sol ids retrieved by
three or four filters was 0.076 g, versus an average centrifuge sample
size of 1.58 g. Alkane concentrations and intrinsic parameters for both
fi.l ter and centri fuge samples are compared in the fo 11 owi ng sections for
major disparities.
C.3 THE NORMAL PARAFFINS
Tables 8-1 through 8-4 list the concentrations of the individual
n-alkanes determined from both filter and centrifuge suspended sediment
samples. Concentrations of n-alkanes did not follow a definitive trend
favoring either filter or centrifuge samples. At Station 2 in July,
filter and centrifuge concentrations were comparable, while filter
concentrations at Station 3 were generally greater than the centrifuge
quantiti es. I n October, the centrifuge paraffi n concentrations at Sta
tions 1 and 28 were similar to the the filter concentrations. Filter
concentrations at Station 3 and 3R were at least two times greater than
centrifuge quantities. Similar concentrations of volatile components
were found at Stations 28 and 3 in December. Fi 1ter samp1es exhi bi ted
twice the concentrations of the plant wax hydrocarbons that were meas
ured in the centrifuge samples.
A variety of factors may be responsible for the observed filter to
centrifuge disparities. The river is highly variable in time and space,
111

especially the lower river. The relative contributions of surfacerunoff and outfall discharge change constantly. In addition, tidalexcursions caused anomalies at Station 3, and perhaps more subtle changeat Station 2B. Figure C-1 shows the tidal cycle superimposed over thesampling itinerary at Stations 2B and 3 for October and December.(Figure 13 is a similar illustration for July.) Samples collected bycontinuous centrifugation integrate these variations over the samplingperi od whereas fi 1ter samples only represent instantaneous concentrat ions. Representati on of average ri ver condi t ions by poi nt samples intime is equivocal and should be tested.
C.4 COMPOSITIONAL CHARACTERISTICS
Table C-1 compares three parameters calculated from centrifuge andfilter samples collected concurrently. In most cases the CPI14- 20results obtained from centrifuge samples are higher than those obtainedfrom filters. The disparity is greatest in July at both stations and inOctober at Station 1. Comparing concentrations of individual n-alkanesin these samples, it is apparent that the filters have retained relatively greater amounts of C14 and C16. Possibly, the odd- and evencarbon compounds of the volatile and heavy fractions arise from different sources; they may be associated with particles of different sizes ordensities. In July, for instance, the volatile even-carbon compoundsmay be associated with a lighter, colloidal or dissolved phase that isreadi ly scavenged by the fi 1ters, but not the centrifuge. Such ali ghtcolloidal phase would clog filters faster than a heavier particulatephase, further skewing results.
The CPI 20- 32 values on the other hand, are generally higher for thefilter samples than for the centrifuge sediment. This bias is mainly aresult of the near negligible concentrations of heavy even alkanes inthe filter samples after the blank had been subtracted. Again, perhapsthe plant wax constituents were associated with finer particulates moreeasily retained by the filter mesh.
31 32The I odd/ I even ratios in July (and less dramatically at Station
13 143R in October) were significantly higher for the centrifuge sediments
112

36
STATION 2Br----::..:....:...:...:....:.~-=-=:..-----.
STATION 3R----, ,----STATION 3o
12-
12
24
24
0STATION 2B STATION 3R .II I
E 1200 0 1200 0 1200IL- II
..- OCTOBER IB OCTOBER 19 OCTOBER 20:t:(!)
w oFILTERING PERIOD:t:..J oOBSERVED RIVER REV~RSAL<{0..- 36
o 1200 0 1200 0__-----'I ,-I ........11'--- ---', ,-I _
DECEMBER 19 DECEMBER 20
Figure C-1. Tidal amplitudes at Elliott Bay (U.S. Dept. of Commerce.1978) and the schedules of suspended matter samp1i ng on theGreen River in October and December 1978. Observed reversalsin river discharge are noted.
113

than for the filter samples. When coupled with the higher CPI14-20values and the lower CPI 20- 32 results derived for the July centrifugesediment, it is evident that the odd-carbon preference resides predominantly in the volatile fraction of these summer samples. At all otherstations the odd/even ratios for the filters were greater than thoseobtai ned from the centri fuge sediment. Thi s may be a refl ecti on ofseasonal variations in particulate size and simultaneously, a seasonalchange in the hydrocarbons associated with these particulates. However,in light of the variabilities calculated for the duplicate samples obtained in October (averaging 25% for the individual alkanes but rangingfrom 2% to 59%), the differences noted here may not be significant.
C.5 SUMMARYFilter blanks comprised an overall average of 50% of each individ
ual n-alkane measured in the filter samples. The blanks contributed anaverage of 29% of the odd-carbon compounds and 71% of the even alkanesreflecting the greater abundance of algal and plant wax constituentsmeasured at most sites. In all cases, alkanes associated with thefilter blanks contributed relatively less toward hydrocarbon quantitiesas one proceeded downri ver due to the increased suspended hydrocarbonconcentrations.
Concentrations of the individual n-alkanes determined from thefilter samples were usually greater than or equal to the concentrationsmeasured in the centrifuge samples. Discrepancies are attributed tovariations in surface runoff, outfall discharge, and tidal pumping, eachof which varies on a scale of less than a day. Changes in the factorsmentioned above influence the size and densities of the particles available for scavenging by each method. Samples collected by centrifugationrepresent a time-averaged condition, whereas filtration representsinstantaneous concentrations.
Generally the CPI14- 20 results were higher for the centrifugesamples than for filters, reflecting the preferential retrieval of C14and C16 by the filters. The CPI 20- 32 values, however, were usuallygreater for the filter samples than for the centrifuge sediment. Thesma11 concentrations of the heavy even alkanes in the fi 1ter samp1eswere swamped by the magnitude of the filter blanks, producing (in part)
114

Table C-1. A comparison of compositional parameters derived for suspended hydrocarbons retrieved by centrifugation and filtration. The standard deviations are based on triplicateana lyses of the homogeni zed centri fuge sample collected atStation 3 in December 1978.
31 32CPI14- 20 CPI 2O- 32 I odd/ I even
13 14
JULY
Station 2Centrifuge 19.8 ± 0.7 7.0 ± 0.4 10.7 ± 0.2Fil ter 10.1 8.6 8.4
Station 3Centrifuge 11.1 ± 0.4 3.9 ± 0.2 6.0 ± 0.1Fil ter 7.9 3.7 5.0
OCTOBER
Station 1Centrifuge 11.1 ± 0.4 7.5 ± 0.4 7.5 ± 0.2Filter 7.3 (808) 10.5
Station 2BCentrifuge 2.6 ± 0.1 8.0 ± 0.4 3.8 ± 0.1Filter 1.8 15.8 4.2
Station 3Centrifuge 3.3 ± 0.1 2.9 ± 0.2 2.8 ± 0.1Fil ter 3.7 5.6 3.9
Station 3RCentrifuge 2.8 ± 0.1 2.3 ± 0.1 2.3 ± 0.1Fil ter 1.8 2.3 1.9
DECEMBER
Station 2BCentrifuge 1.6 ± 0.1 10.2 ± 0.6 5.5 ± 0.1Fil ter 1.3 17.9 8.7
Station 3Centrifuge 0.99 ± 0.03 5.0 ± 0.3 2.3 ± 0.1Filter 1.1 6.6 6.1
115

the bias in this ratio.31
The I
13
32
odd/ I
14
even ratios are higher for cen-
trifuge sediments in the summer. The differences in alkane concentrations t and subsequentlYt the calculated parameters t may not be significant considering the ambiguity in sampling variability.
In light of the problems associated with filtration for organicanalyses t namely:
1) the POC versus DOC debate (Section 5.1.3)2) the instantaneous versus integrated sample argument3) the magnitude of the filter blanks (50% of sample)4) the small sample size associated with filters t
the centrifuge appears to be a more acceptable method for retrieval ofsuspended hydrocarbons.
116